Article

Experimental and DEM Investigation of Shear Behaviors of a Loess and Rough Concrete Interface

1
School of Civil Engineering, Xi’an University of Architecture and Technology, Xi’an 710055, China
2
Shaanxi Key Laboratory of Geotechnical and Underground Space Engineering, Xi’an University of Architecture and Technology, Xi’an 710055, China
*
Author to whom correspondence should be addressed.
Buildings 2025, 15(17), 3178; https://doi.org/10.3390/buildings15173178
Submission received: 21 July 2025 / Revised: 31 August 2025 / Accepted: 31 August 2025 / Published: 4 September 2025
(This article belongs to the Special Issue Advances in Building Foundation Engineering)

Abstract

A series of shear interface experiments on a type of loess and rough concrete interface under conditions of different initial water contents (16%, 21%, and 26%), dry densities (1.30 g/cm3, 1.52 g/cm3, 1.70 g/cm3) and normal stresses (50 kPa, 100 kPa, 200 kPa) were conducted to further understand shear deformation and strength characteristics of a loess and rough concrete interface combined with loess deformation monitoring method of gypsum powder line method. A discrete element method (DEM) model was then established, calibrated against the experimentally obtained shear stress–displacement curves, and run to investigate the shear deformation, contact force chain and fabric evolution processes at the microscopic level. The results show the following: (1) The shear deformation and strength behaviors of the loess and rough concrete interface were significantly impacted by the initial moisture content, dry density and normal stress. (2) The shear deformation of the loess increased with the increase in initial moisture content, and decreased with dry density and normal stress. (3) The shear strength of the loess and rough concrete interface increased with the increase in dry density and normal stress, and decreased with the increase in initial moisture content. (4) The evolution of the shear deformation, contact force chain and fabric of the loess-concrete rough interface were explored and analyzed from a microstructural perspective. This study contributes insights critical to construction of the pile-loess systems in Chinese Loess Plateau regions.

1. Introduction

As the “Belt and Road Initiatives” progresses, more and more infrastructures are being designed and constructed in northwest China. Loess is widely distributed in this region [1,2,3,4], and is a key issue impacting the safety of such infrastructures. The loess-pile systems are the typical engineering structure used during the construction of infrastructures [5,6]. For example, concrete piles are used during the construction both of high-speed railway for upper-loading bearing and of tall buildings over 100 m high for strengthening the loess foundation. The mechanical behavior of the loess-pile contact interface shows a key role in both the bearing capacity of concrete piles and the settlement control. Rather than being a simple geometric boundary, this interface constitutes a composite zone formed by the pile surface and the adjacent loess soil, where complex shear deformation and frictional resistance develop. As illustrated in Figure 1, the interface consists of two essential parts, the pile concrete surface and the loess around the pile, together forming the interaction zone that governs stress transfer and deformation. The key issue in ensuring the safety of the concrete pile-loess systems is to understand shear characteristics (i.e., shear deformation and strength) and mechanisms of the loess-concrete interfaces [7], as they directly influence the load-bearing capacity and long-duration stability of the concrete pile-loess system and upper engineering structure. Many engineering problems (such as large uneven deformation and incline) are in fact attributed to inaccurate misunderstanding of the shear behaviors and mechanisms of the pile concrete and loess interfaces, which warrants their in-depth study.
Many tests, such as the direct shear tests, were conducted to evaluate influence of internal factors (material composition [8], water content [9], stress state [10], and surface roughness [11,12,13]) and external factors (loading rate [6], freezing-thawing cycle [14] and cyclic loading [15,16]) on fundamental interface properties (shear strength [17] and internal friction angle [18]). Previous works have verified that the shear deformation did not only occur at the soil interface but also in the adjacent soil within a certain range. For example, it was found that the soil displacement occurred at the contact surface and within the shear band near the interface [19,20]. It should be noted that thickness of shear zone was directly impacted by average particle size. Experimental work showed that material properties and contact conditions significantly impacted the interface shear behaviors. Apart from experimental approaches, a large number of numerical methods including finite element [21,22,23] and discrete element methods [24,25,26,27,28] were proposed to numerically investigate the shear behaviors and characteristics of the soil-pile systems.
Based on the above research, some progress on the shear characteristics of the soil-concrete interfaces has been made [29,30,31,32]. However, it should be noted that these works mainly focused on other types of soils (i.e., sand, frozen soil and clay), and that work on loess-concrete interface, especially on loess-concrete rough interface, is limited. Loess deposits are characterized by water sensitivity and the presence of macropore structures, both of which strongly affect their mechanical response [33]. Changes in moisture content [34] and dry density [35] further modify shear characteristics of the loess and pile concrete interface by altering its resistance to shearing, deformation response, and load transfer performance. Despite these insights, a clear understanding of how loess-specific micromechanical properties influence interface shear deformation and strength remains lacking. In particular, little attention has been paid to directly linking laboratory observations with particle-scale mechanisms through numerical modeling. Due to the special sediment conditions of this sediment type, the loess exhibits clear bonding and structural properties, which are significantly different from those of sand or clay. Existing work on shear behaviors of interfaces between other soil types and concrete therefore cannot provide direct guidance on the design, construction and maintenance of loess-pile systems in Chinese Plateau Regions. Additionally, regarding the limit work on interface shear tests of loess and concrete, the shear deformations of loess samples were generally be ignored due the fact that traditional shear tests of interface were often carried out in a sealed box [20]. Thus, investigating the shear characteristics (shear deformation and strength) and mechanisms of the loess-concrete interfaces under different conditions with help of visualization techniques and methods is critical. Addressing this gap is essential not only to advancing our fundamental understanding of the subject but also for to improving engineering practices, as a reliable characterization of loess–concrete interfaces would directly guide the construction and long-duration safety assessment of pile foundations on China Loess Plateau regions.
This study thus carried out the shear experiments under conditions of different initial water contents (16%, 21%, and 26%), dry densities (1.30 g/cm3, 1.52 g/cm3, and 1.70 g/cm3) and normal stresses (50 kPa, 100 kPa, and 200 kPa) in combination with the gypsum powder line method were conducted to determine the shear behaviors (deformation and strength) of a loess-concrete rough interface. Based on the experimental results, the discrete element model was then established, calibrated and run to numerically investigate the evolution process of shear deformation, contact force chain and fabric of loess-concrete rough interface, thus further exploring the microscopic mechanisms. The combined experimental–numerical approach enables both macroscopic validation and microscopic analysis, and thus providing a sound scientific basis to geotechnical design. This study is of importance for the design, construction and maintenance of pile-supported infrastructure in Chinese Loess Plateau regions.

2. Shear Tests of Loess-Concrete Interfaces

2.1. Experimental Apparatus

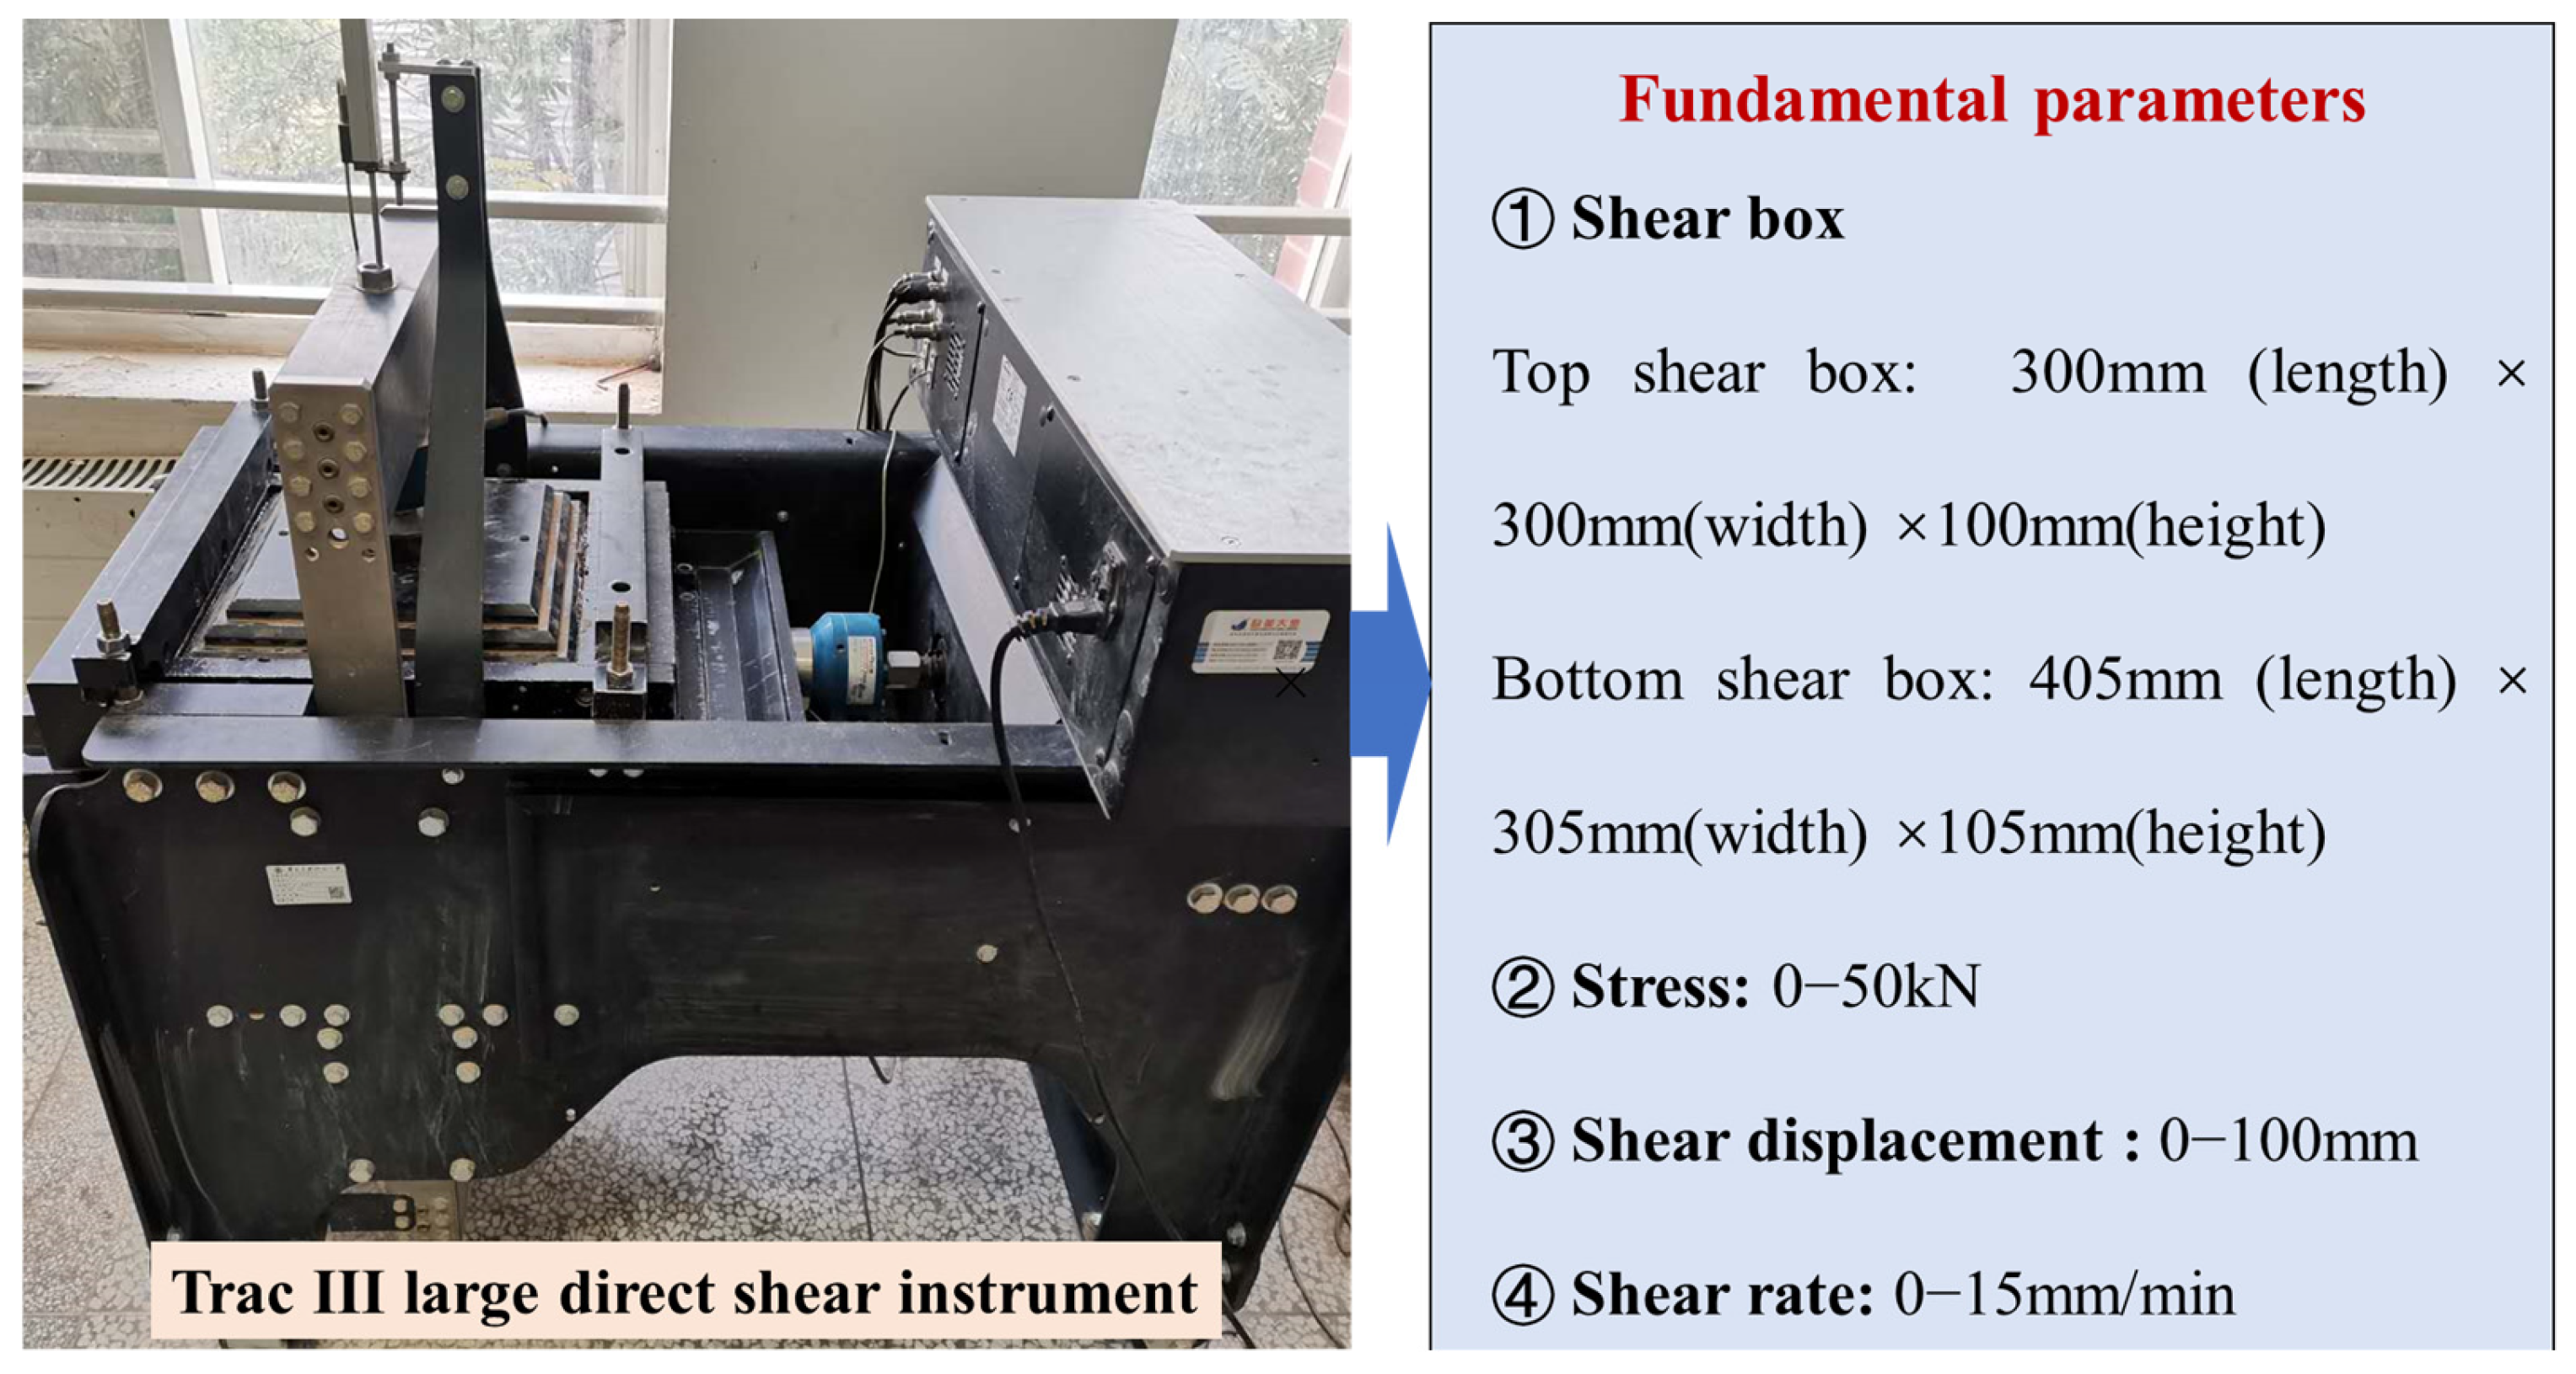
Figure 2 shows an image and the basic parameters of Trac III large direct shear instrument, produced by Geocomp company in U.S., adopted to carried out shear tests on a loess-concrete rough interfaces with a certain level of roughness. This large direct shear apparatus presents integrated sampling, loading and monitoring systems were included in this large direct shear apparatus. The sampling system comprises a top shear box whose length, width and height were 300 mm, 300 mm and 100 mm respectively, and a bottom shear box where the length, width and height were 405 mm, 300 mm, 100 mm respectively. In the loading system, normal stress ranging from 0 to 50 kN is applied by a vertical motor; the shear displacement and rate for this type of shear apparatus range from 0 to 1000 mm and from 0 to 15 mm/min respectively. Vertical and horizontal sensors are respectively used to record normal stress and shear displacement, respectively and the data are transferred and stored into a computer.

2.2. Experimental Materials

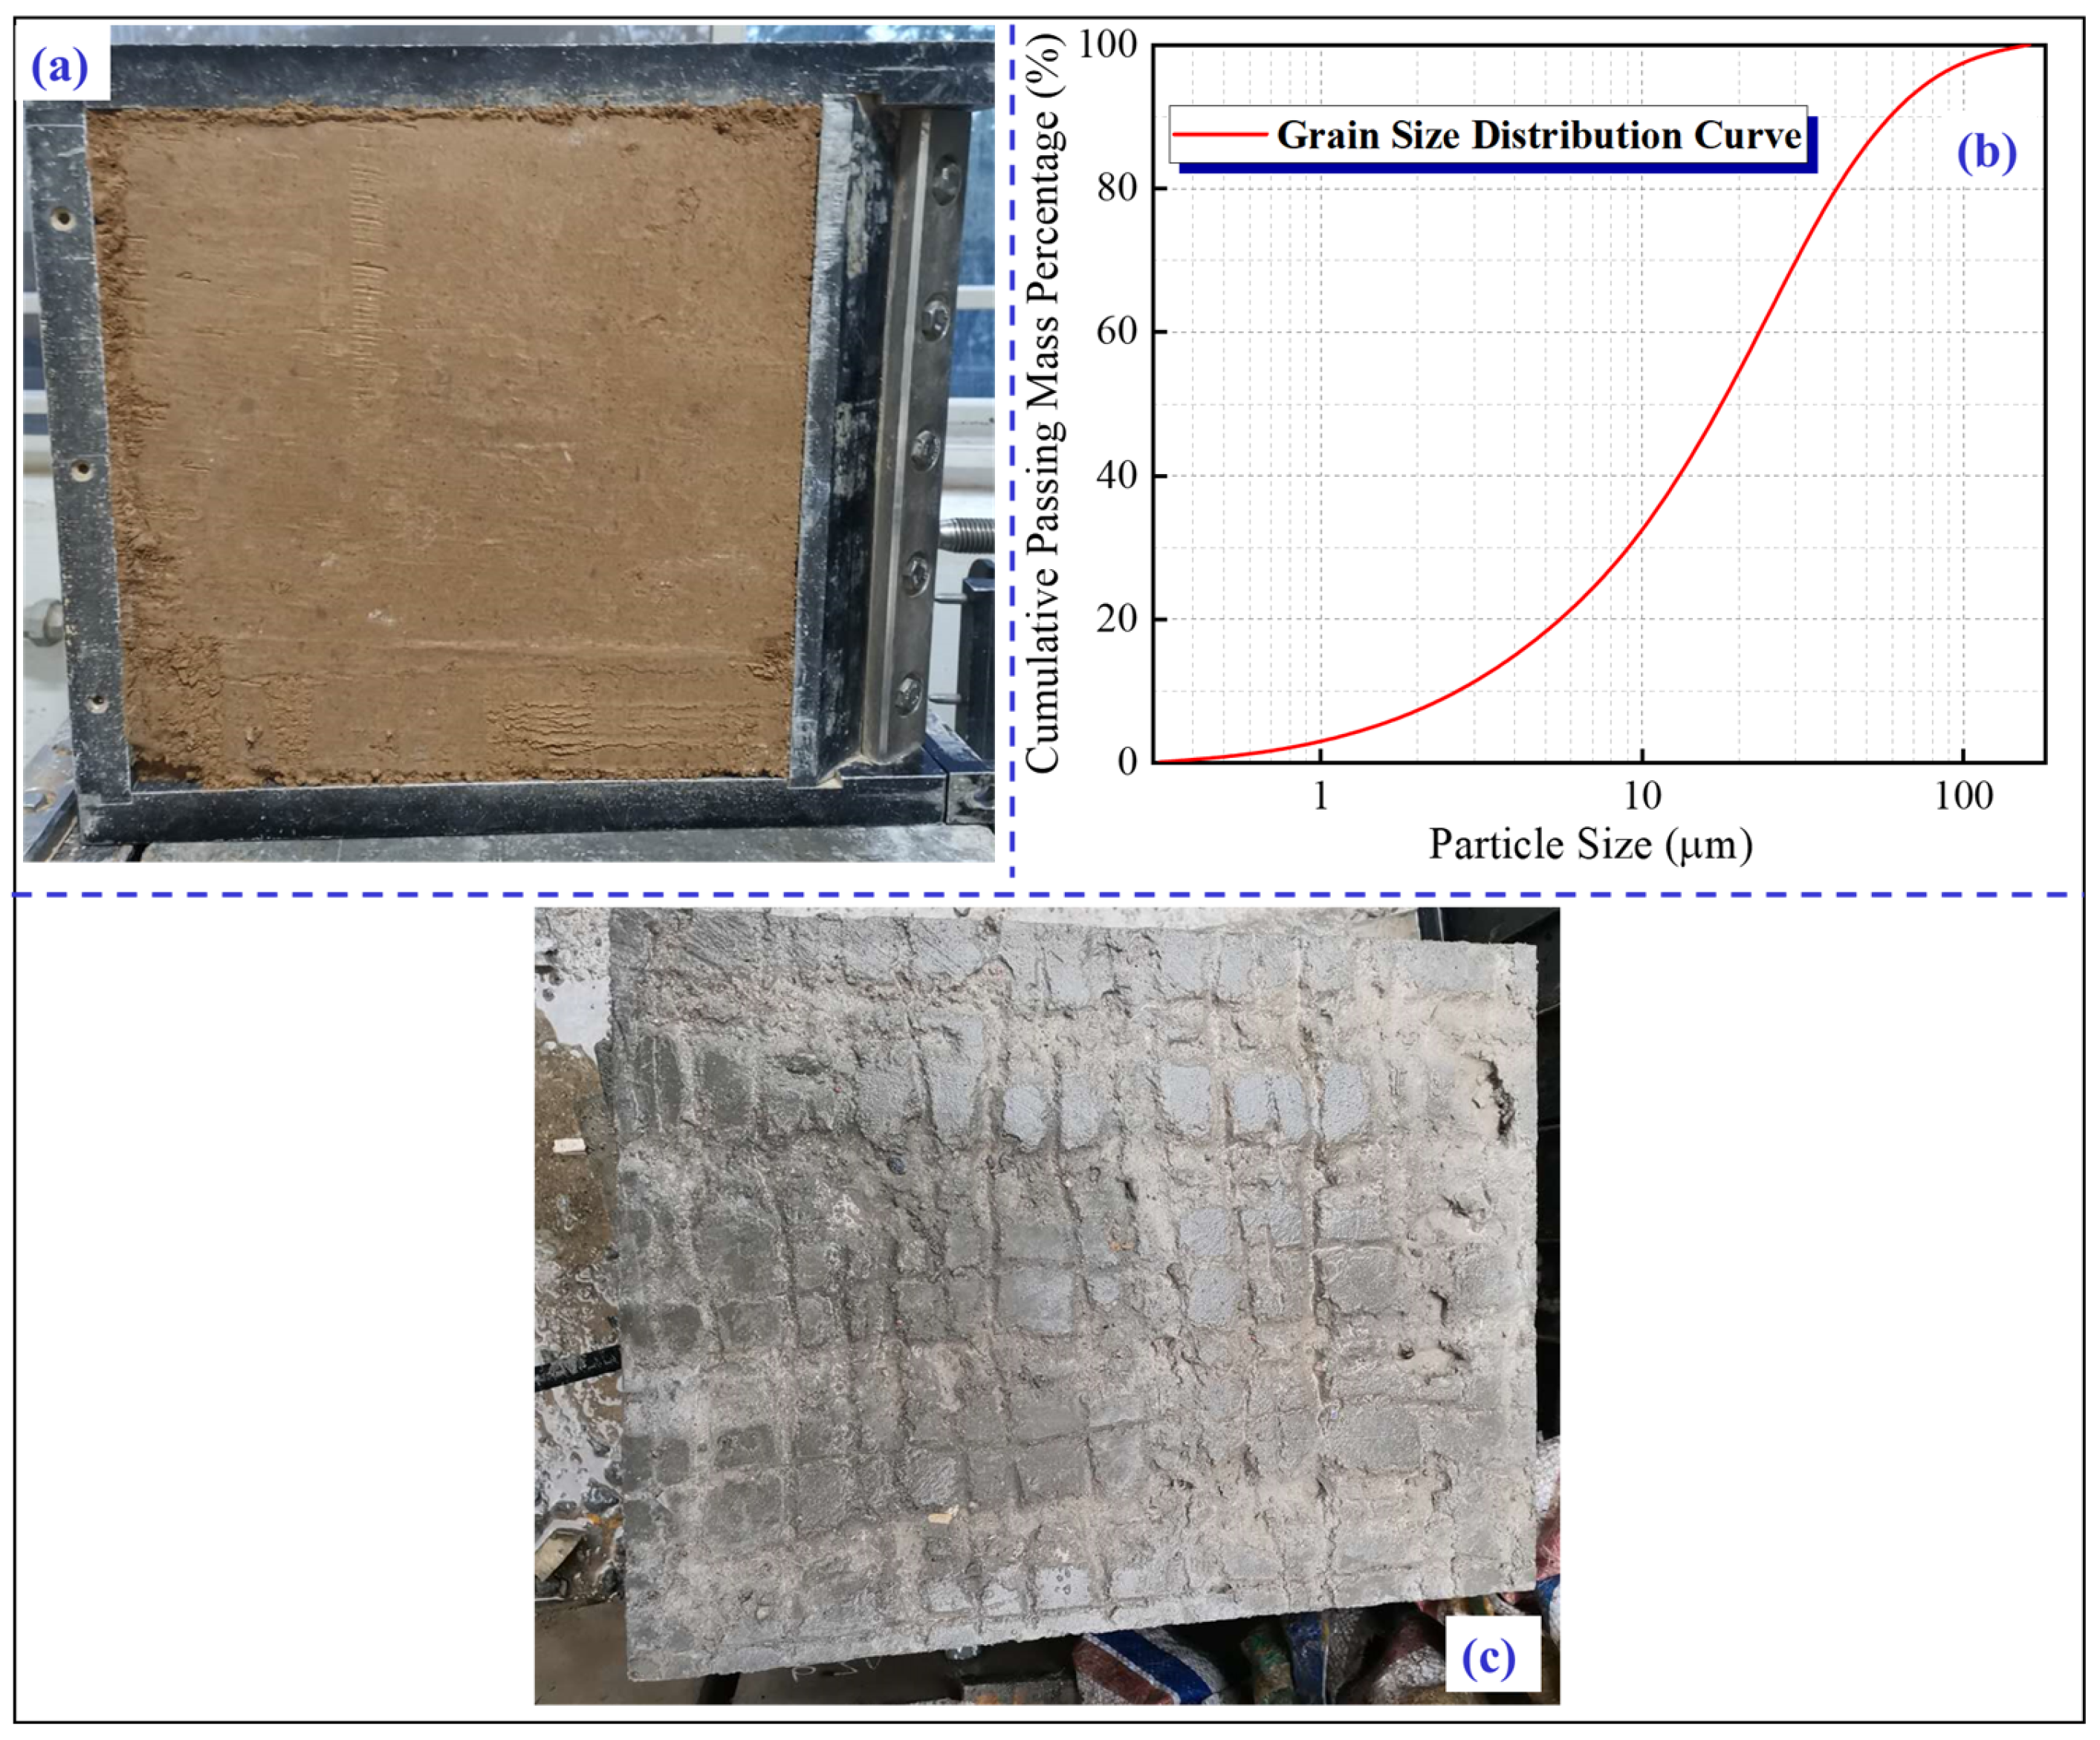
Two types of materials, i.e., remolded loess and C40 concrete (Figure 3a, were used in this interface shear experiment. The liquid limit of the remolded loess was 17.0%, while the plastic limit of the remolded loess was 29.0%. Figure 3b illustrates its particle size distribution curve. The C40 concretes were made based on the fabrication standard of concrete, and its length, width and height were 400 mm, 300 mm and 100 mm respectively (Figure 3c).
During the curing stage, the top surface of the concrete sample was grooved to roughen in order to simulate the rough concrete surfaces found in engineering practices. In the next step, the remolded loess with a thickness of 80 mm was applied on the top concrete surface to demonstrate the working condition of the loess-concrete interface contacts. It should be noted that in this study, only one level of concrete interface roughness was considered to investigate. The shear behaviors of this type of loess and rough concrete interfaces under different conditions were studied in detail. The shear behaviors of loess-concrete interfaces with different roughness levels will be studied in future work.

2.3. Experimental Methods

Each rough-surface C40 concrete sample was first placed into the bottom shear box. Then, the remolded loess was compacted in three layers and placed into the top shear box to obtain an experimental loess sample with a controlled dry density and moisture content. And the loess samples used in test were sealed properly and preserved in a sun-shielded setting for 24 h to ensure that the water distributed uniformly. After fixing the remolded loess and concrete, normal stress was imposed on this loess-concrete system. The shear experiment on this loess and rough concrete interface was finally performed under the condition of a 0.08 mm/min displacement rate. Table 1 shows the scheme of three groups of interface shear tests performed on the loess and rough concretes. The stress and moisture conditions were selected based on field investigation. Group 1 tests were conducted to study the effects of the external factor (normal stress) on the shear behaviors of loess and rough concrete interface, while Groups 2–3 tests were conducted to study the influences of internal factors (dry density and moisture content) on the shear behaviors of loess and rough concrete interfaces.
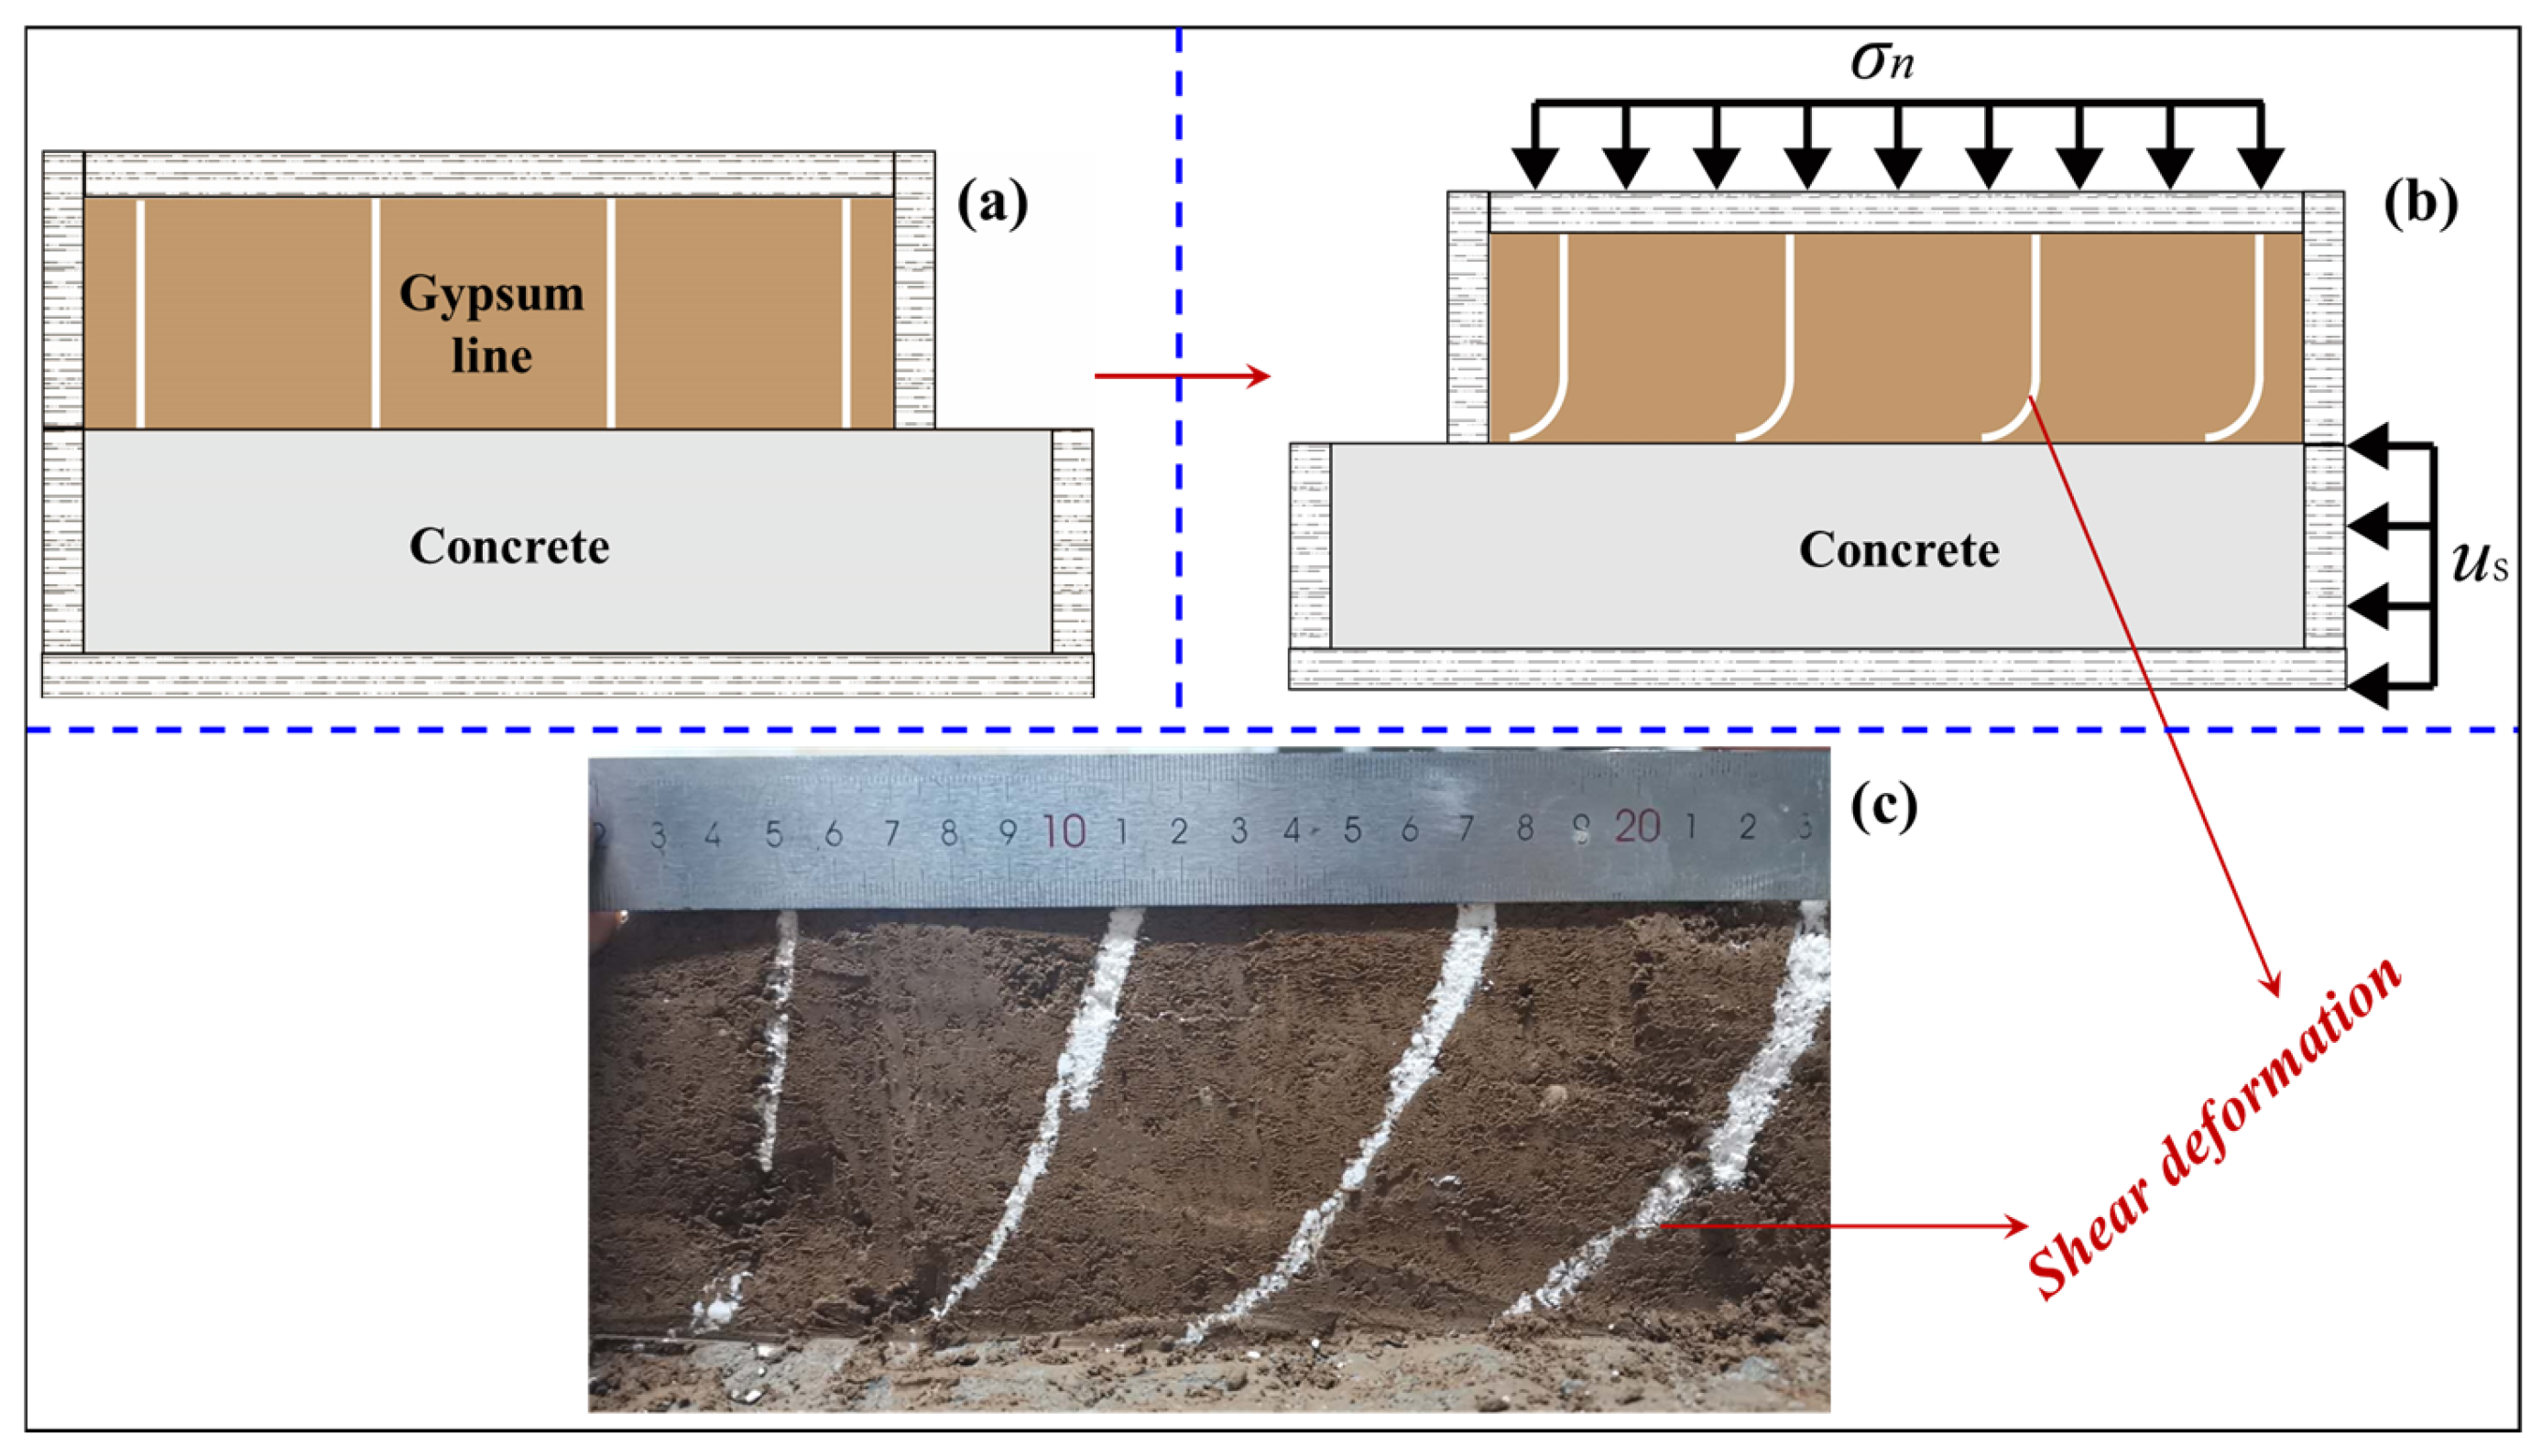
For visualization of shear deformation of loess in the loess and rough concrete interface, gypsum powder lines were vertically inserted in the loess samples at intervals of 60 mm as follows (see Figure 4): after fabrication of loess samples, four small cylindrical holes 5 mm in diameter and 100 mm in height were made with a special hollow steel pipe; then, gypsum powder was placed into the cylindrical holes and compacted slightly. The shear deformation of the loess under study were not affected by the gypsum powder lines because: (1) the diameters of these four gypsum powder lines were only 5 mm; (2) gypsum powder with a size range of 10–40 μm was comparable in size to loess.
During the interface shear test, the boundary constraint effect can significantly influence the deformations of loess, and this is indicated by the gypsum lines. Ideally, the deformation of loess leftwards will be lower than that rightwards. Additionally, the variation in initial water content in loess will significantly change the matric suction, thereby impacting the shear strength parameter of the loess and rough concrete interface.

2.4. Experimental Results

The shear behaviors of loess and rough concrete interfaces under different conditions of different normal stresses, dry densities and initial water contents were determined with the shear tests on the loess-concrete rough interfaces. The shear characteristics in fact mainly include the shear deformation and strength characteristics, which are presented and analyzed in below.

2.4.1. Shear Deformation Characteristics

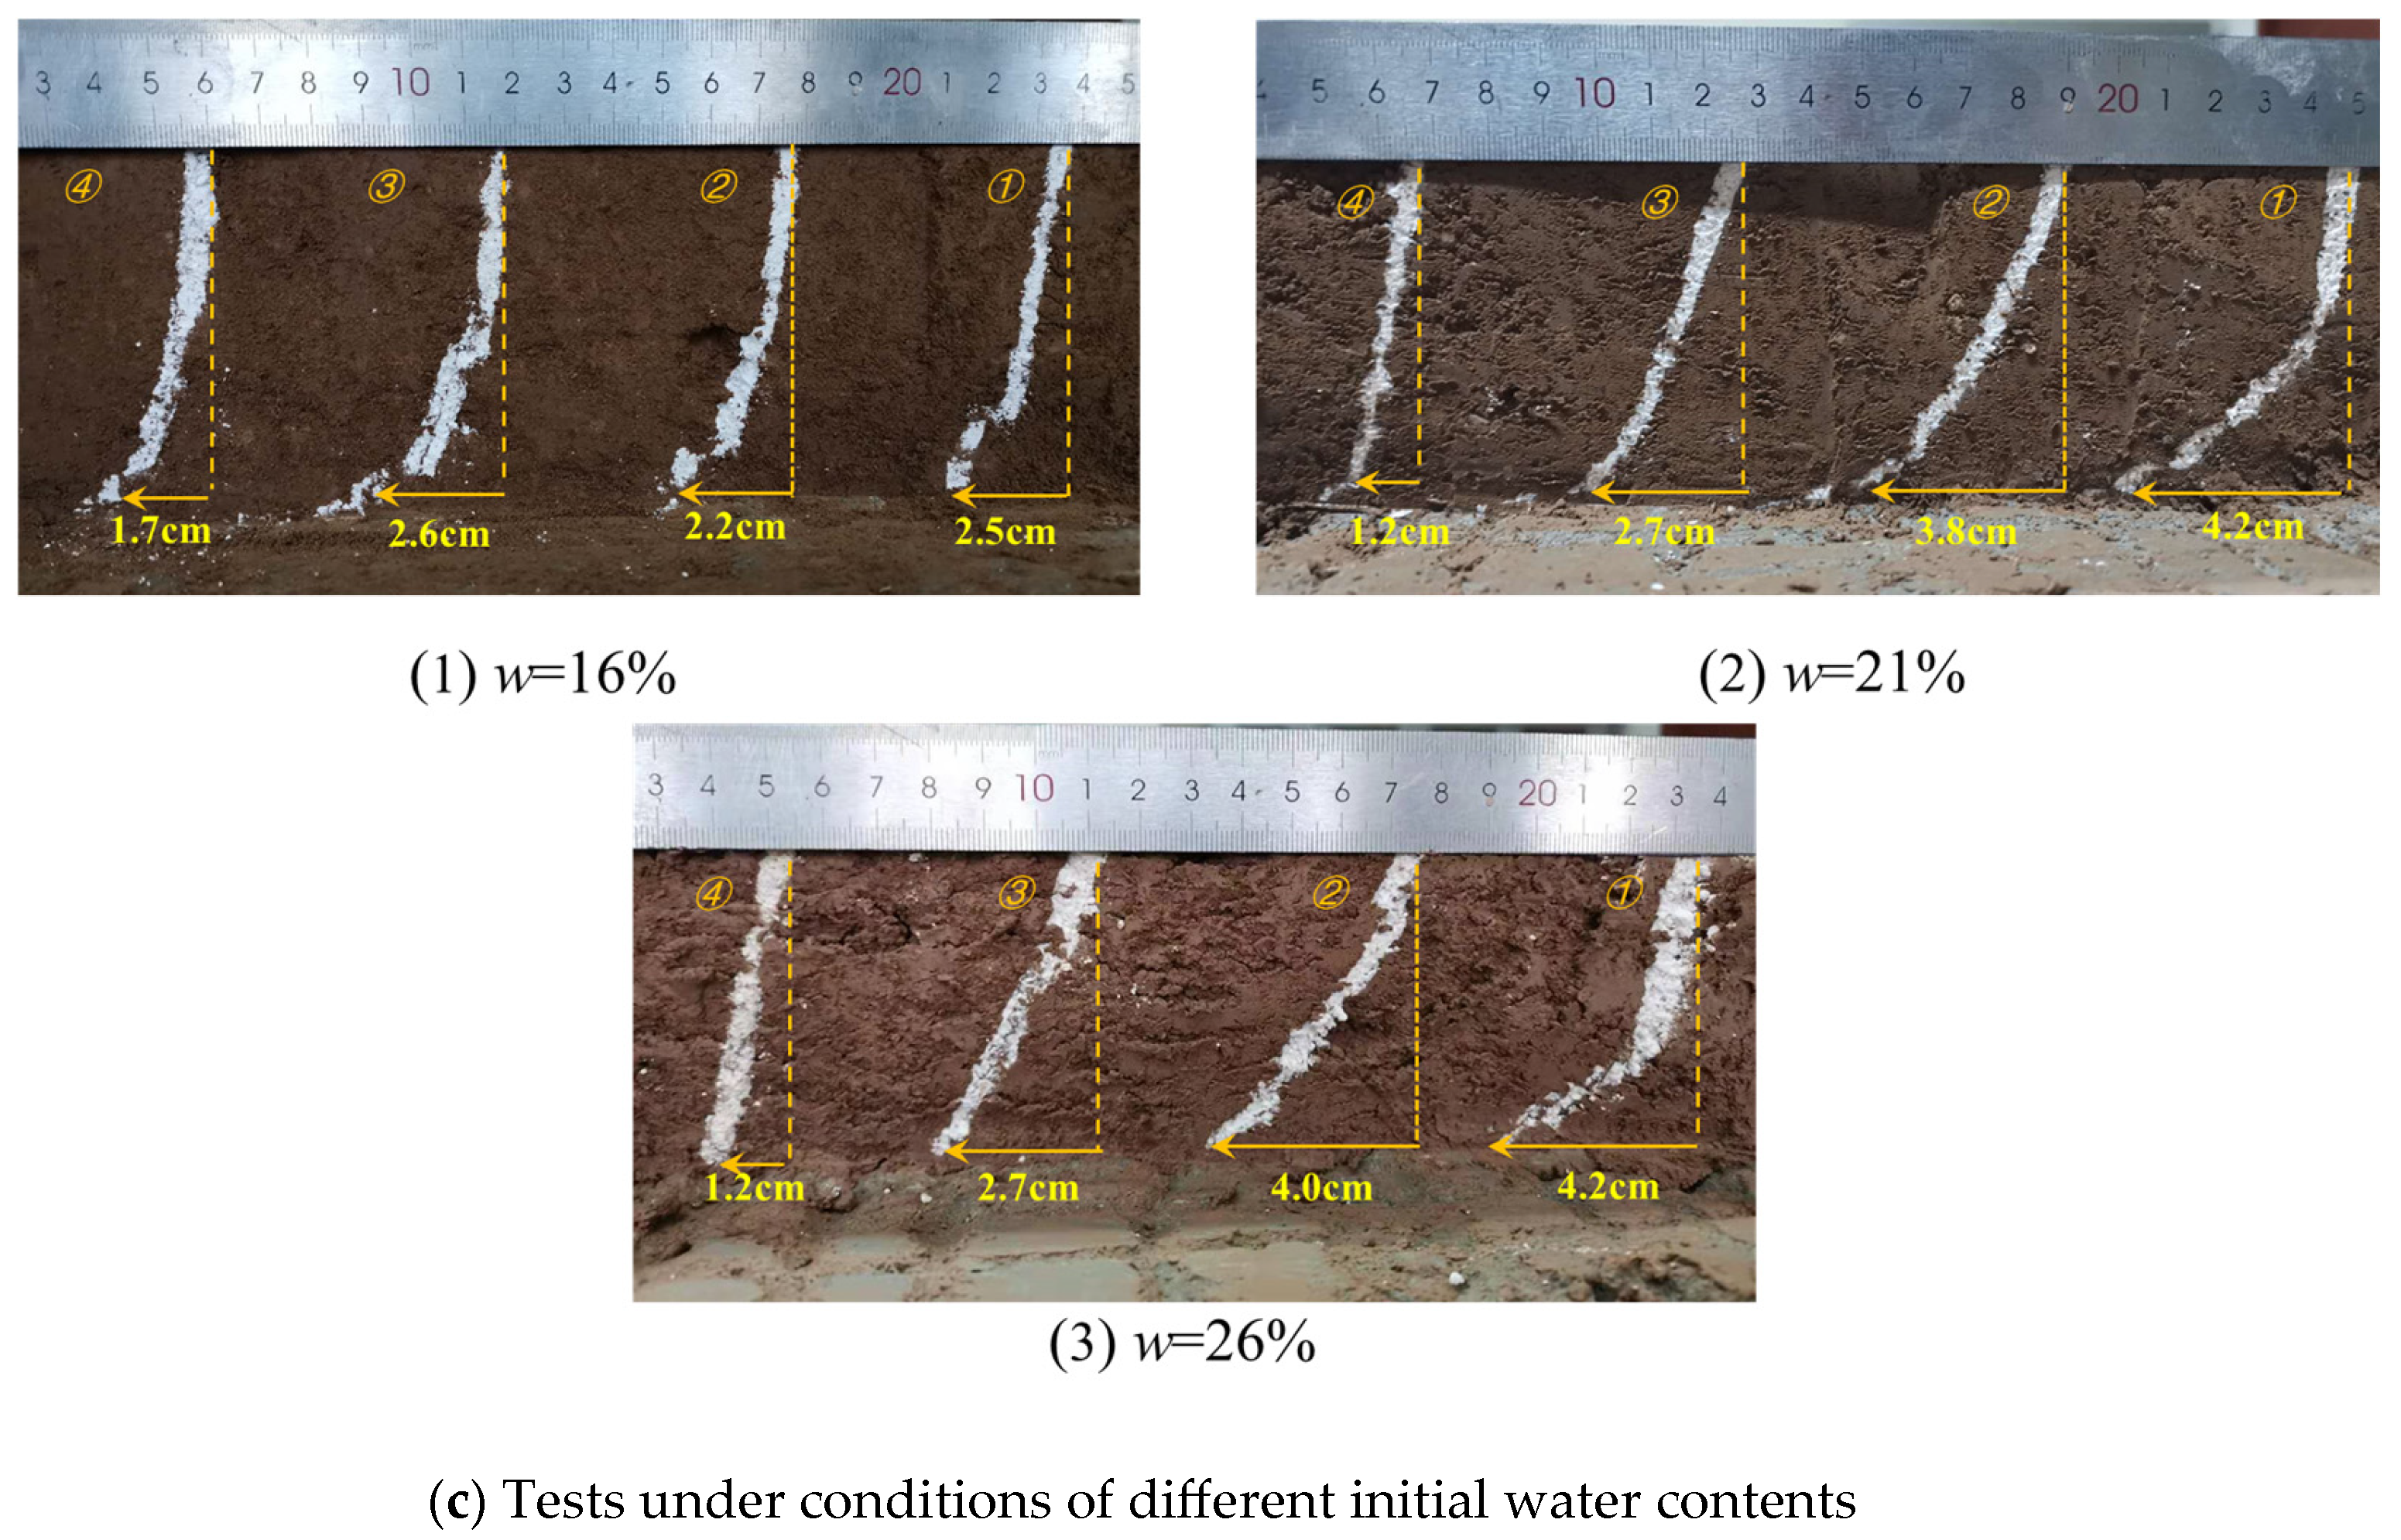
The loess samples were cut along the center after the shear tests, allowing for the clear visualization of their deformation and of the effect of normal stress, dry density and initial water content on the characteristics of shear deformation, as shown in Figure 5. The deformation of loess during interface shear tests were clearly indicated by the white gypsum powder lines embed in the loess. The inclination of white gypsum powder lines had verified that the loess during the interface shear tests deformed by underlying concrete. For a given normal stress level, the maximum deformation of the gypsum powder lines decreased from left to right. This is mainly due to that the part of soil one the left being subject to boundary constraints. As the shear process progressed, the loess on the left became increasingly denser, therefore, its deformation was significantly reduced. It should be noted that from top to bottom, the inclination degrees of the white gypsum lines gradually decreased. This indicated that the loess near loess and rough concrete interface was significantly influenced by the movement of the underlying concrete. With an increase in the distance to loess-concrete rough interface, the influences of concrete movement on the deformation of loess was gradually reduced. The maximum deformation of the loess occurred at the loess and rough concrete interface. The reason for this phenomenon lay in the gradual stress reduction from the loess at the interface to the loess at the top.
It is found that the shear deformation of the loess and rough concrete interface was impacted by normal stress, dry density, and initial water content. With increasing normal stress, maximum value of horizontal displacement of the gypsum markers decreased (6.0 cm, 4.8 cm, and 4.3 cm for the normal stresses from 50 to 200 kPa). This trend was attributed to the densification of loess under higher confining stress, which enhances particle interlocking and makes it more difficult for shear stresses at the interface to cause large soil displacements. Similarly, increasing dry density reduced the deformation of the interface (6.4 cm, 5.0 cm, and 4.6 cm for dry densities from 1.30 g/cm3 to 1.70 g/cm3, respectively), as denser packing leads to tighter particle contact and higher resistance to shear-induced movement. In contrast, the effect of initial water content exhibited a non-monotonic pattern. The maximum horizontal displacement of the fourth gypsum line increased from 2.5 cm to 4.2 cm as water content rose from 16% to 21%, but remained nearly constant when the water content further increased to 26%. At relatively low moisture levels, adding water reduces matric suction and provides lubrication between soil particles, thereby facilitating particle sliding and deformation under shear loading. However, once the soil reaches a near-saturated state, additional water no longer significantly alters interparticle contacts, leading to a stabilization of deformation magnitude (Figure 5c).

2.4.2. Shear Strength Characteristics

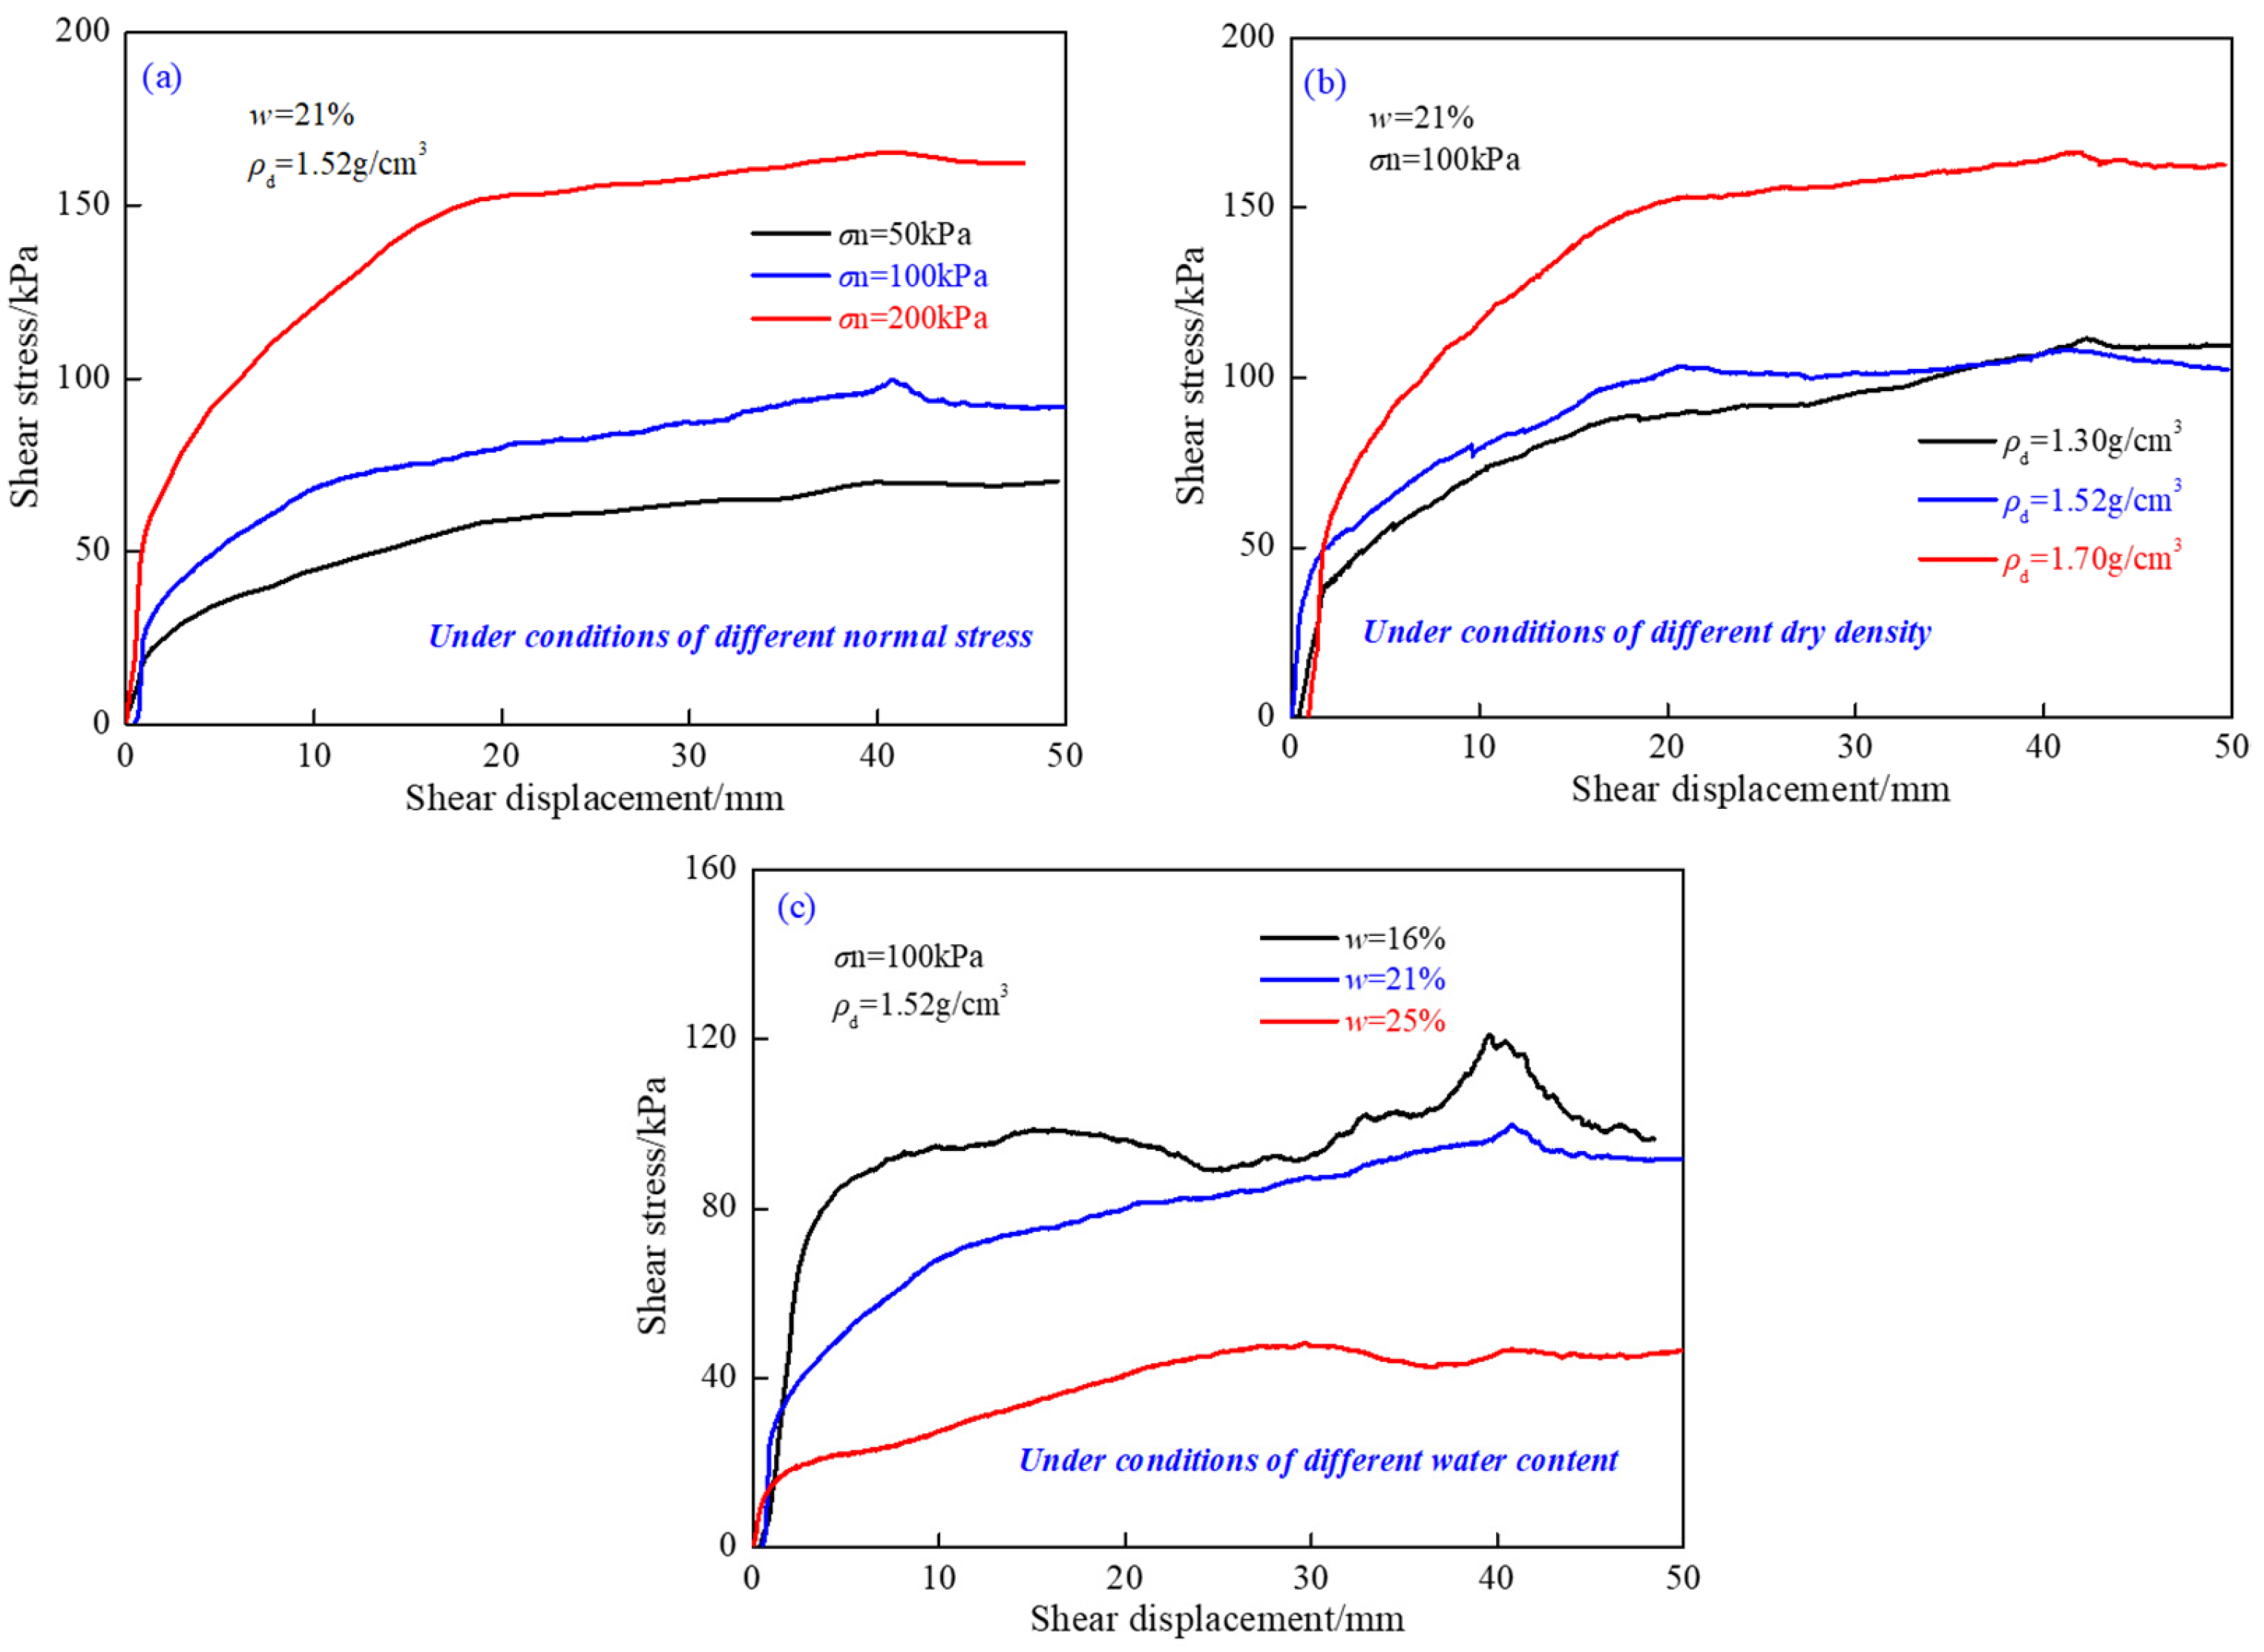
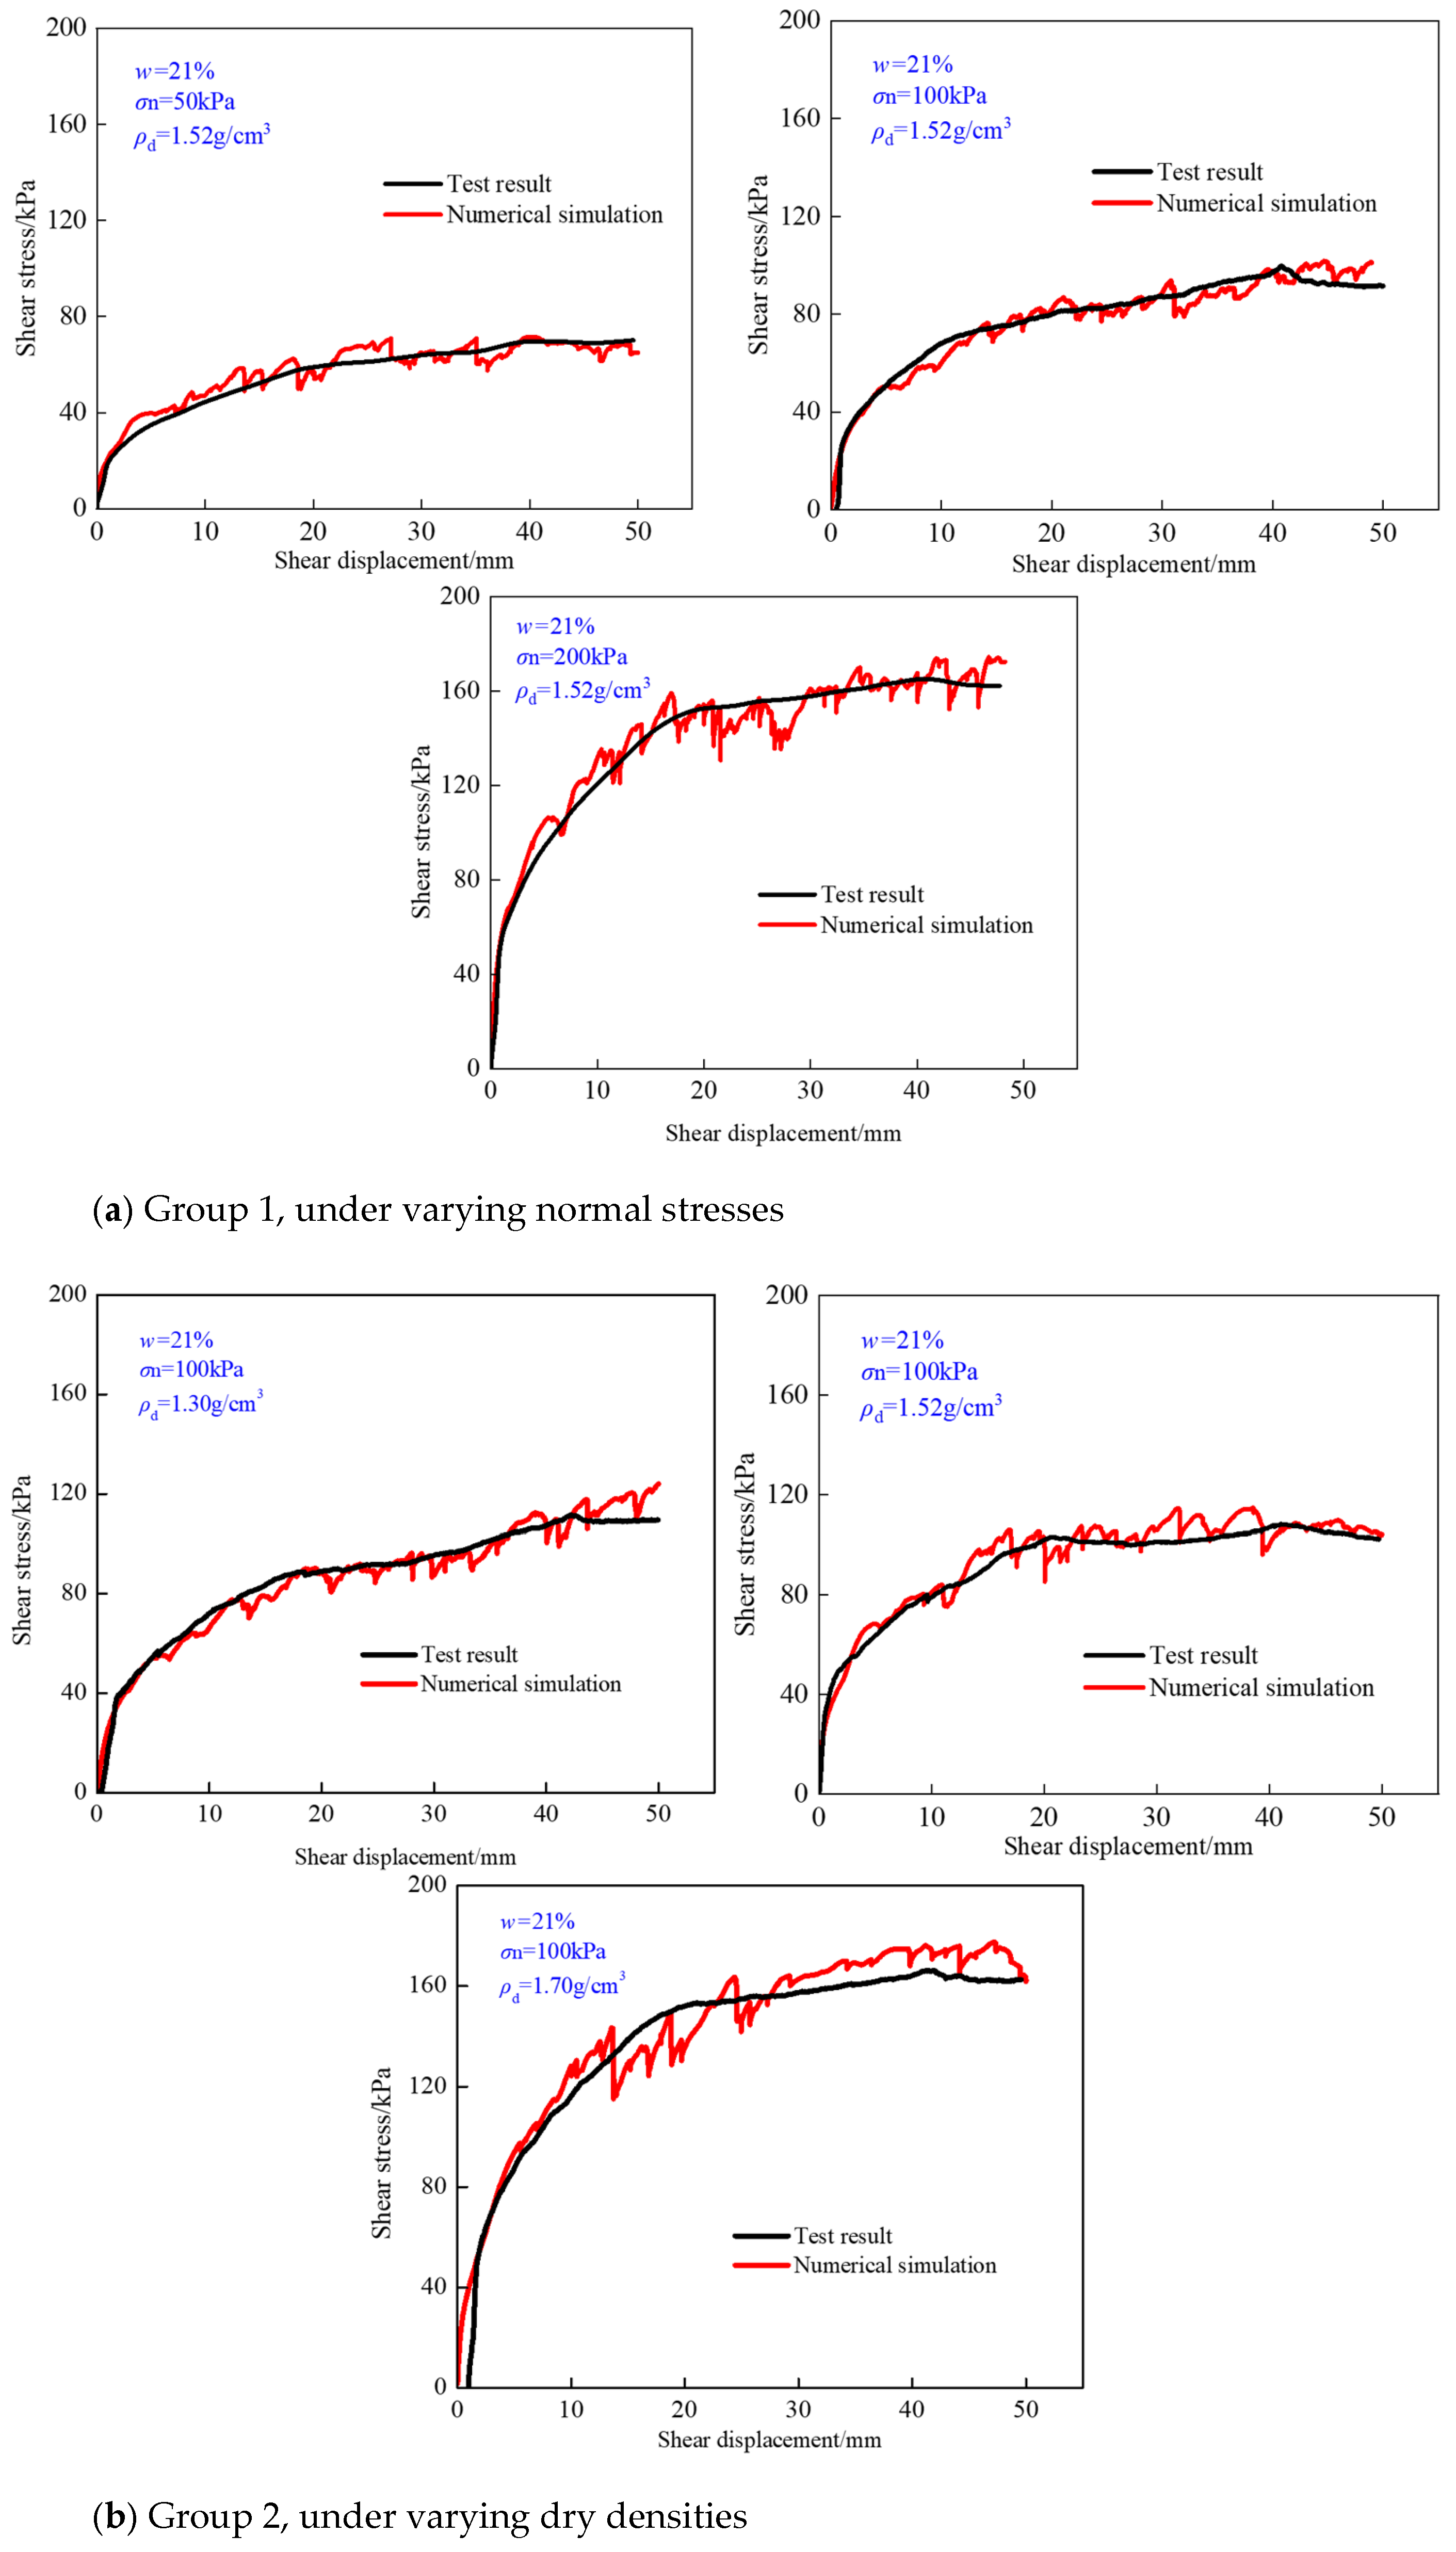
Figure 6 shows shear stress-displacement curves of the loess and rough concrete interfaces under different conditions. These curves generally include two stages, i.e., a growth and a stable stage. In growth stage, with the increase in shear displacement, the shear stress of the loess-concrete interface increased rapidly at first and then slowly. In stable stage, the shear stress fundamentally remained a constant with the increase in shear displacement. The shear stress in the first stage was attributed to the interface cohesive force of the loess and concrete, while in the second stage, the shear stress was attributed to their interface frictional force of the loess and rough concrete.
The shear strength of loess and rough concrete interface was significantly impacted by normal stress, dry densities and initial water content. From Figure 6, the shear strength of loess-concrete rough interface increased with normal stress and dry density, while decreased with increasing initial water content. The reason behind this trend lies was that higher normal stress enhances particle interlocking and frictional resistance at the interface, while greater dry density leads to tighter packing of loess particles, thereby restricting deformation and increasing shear strength. Conversely, elevated water content weakens the interparticle bonding and reduces matric suction, which facilitates particle sliding and leads to lower interface strength. Furthermore, the two-stage development of the shear stress–displacement curve reflects the transition from bond-dominated to friction-dominated mechanisms, which is of practical importance for engineering design. In pile–loess systems, the initial stage corresponds to the mobilization of bonding strength at early loading, whereas the stable stage reflects the long-term frictional resistance that governs service performance. Recognizing this transition helps in predicting load transfer mechanisms and settlement behavior in pile-supported infrastructure in loess regions. Combined with Figure 6a, the interface shear strength parameter, i.e., the cohesion and interface friction angle of loess and rough concrete interface were 37.51 kPa and 32.42° respectively under moisture content of 21.0% and dry density of 1.52 g/cm3.

3. DEM Simulation for Interface Shear Test

3.1. DEM Model Establishment

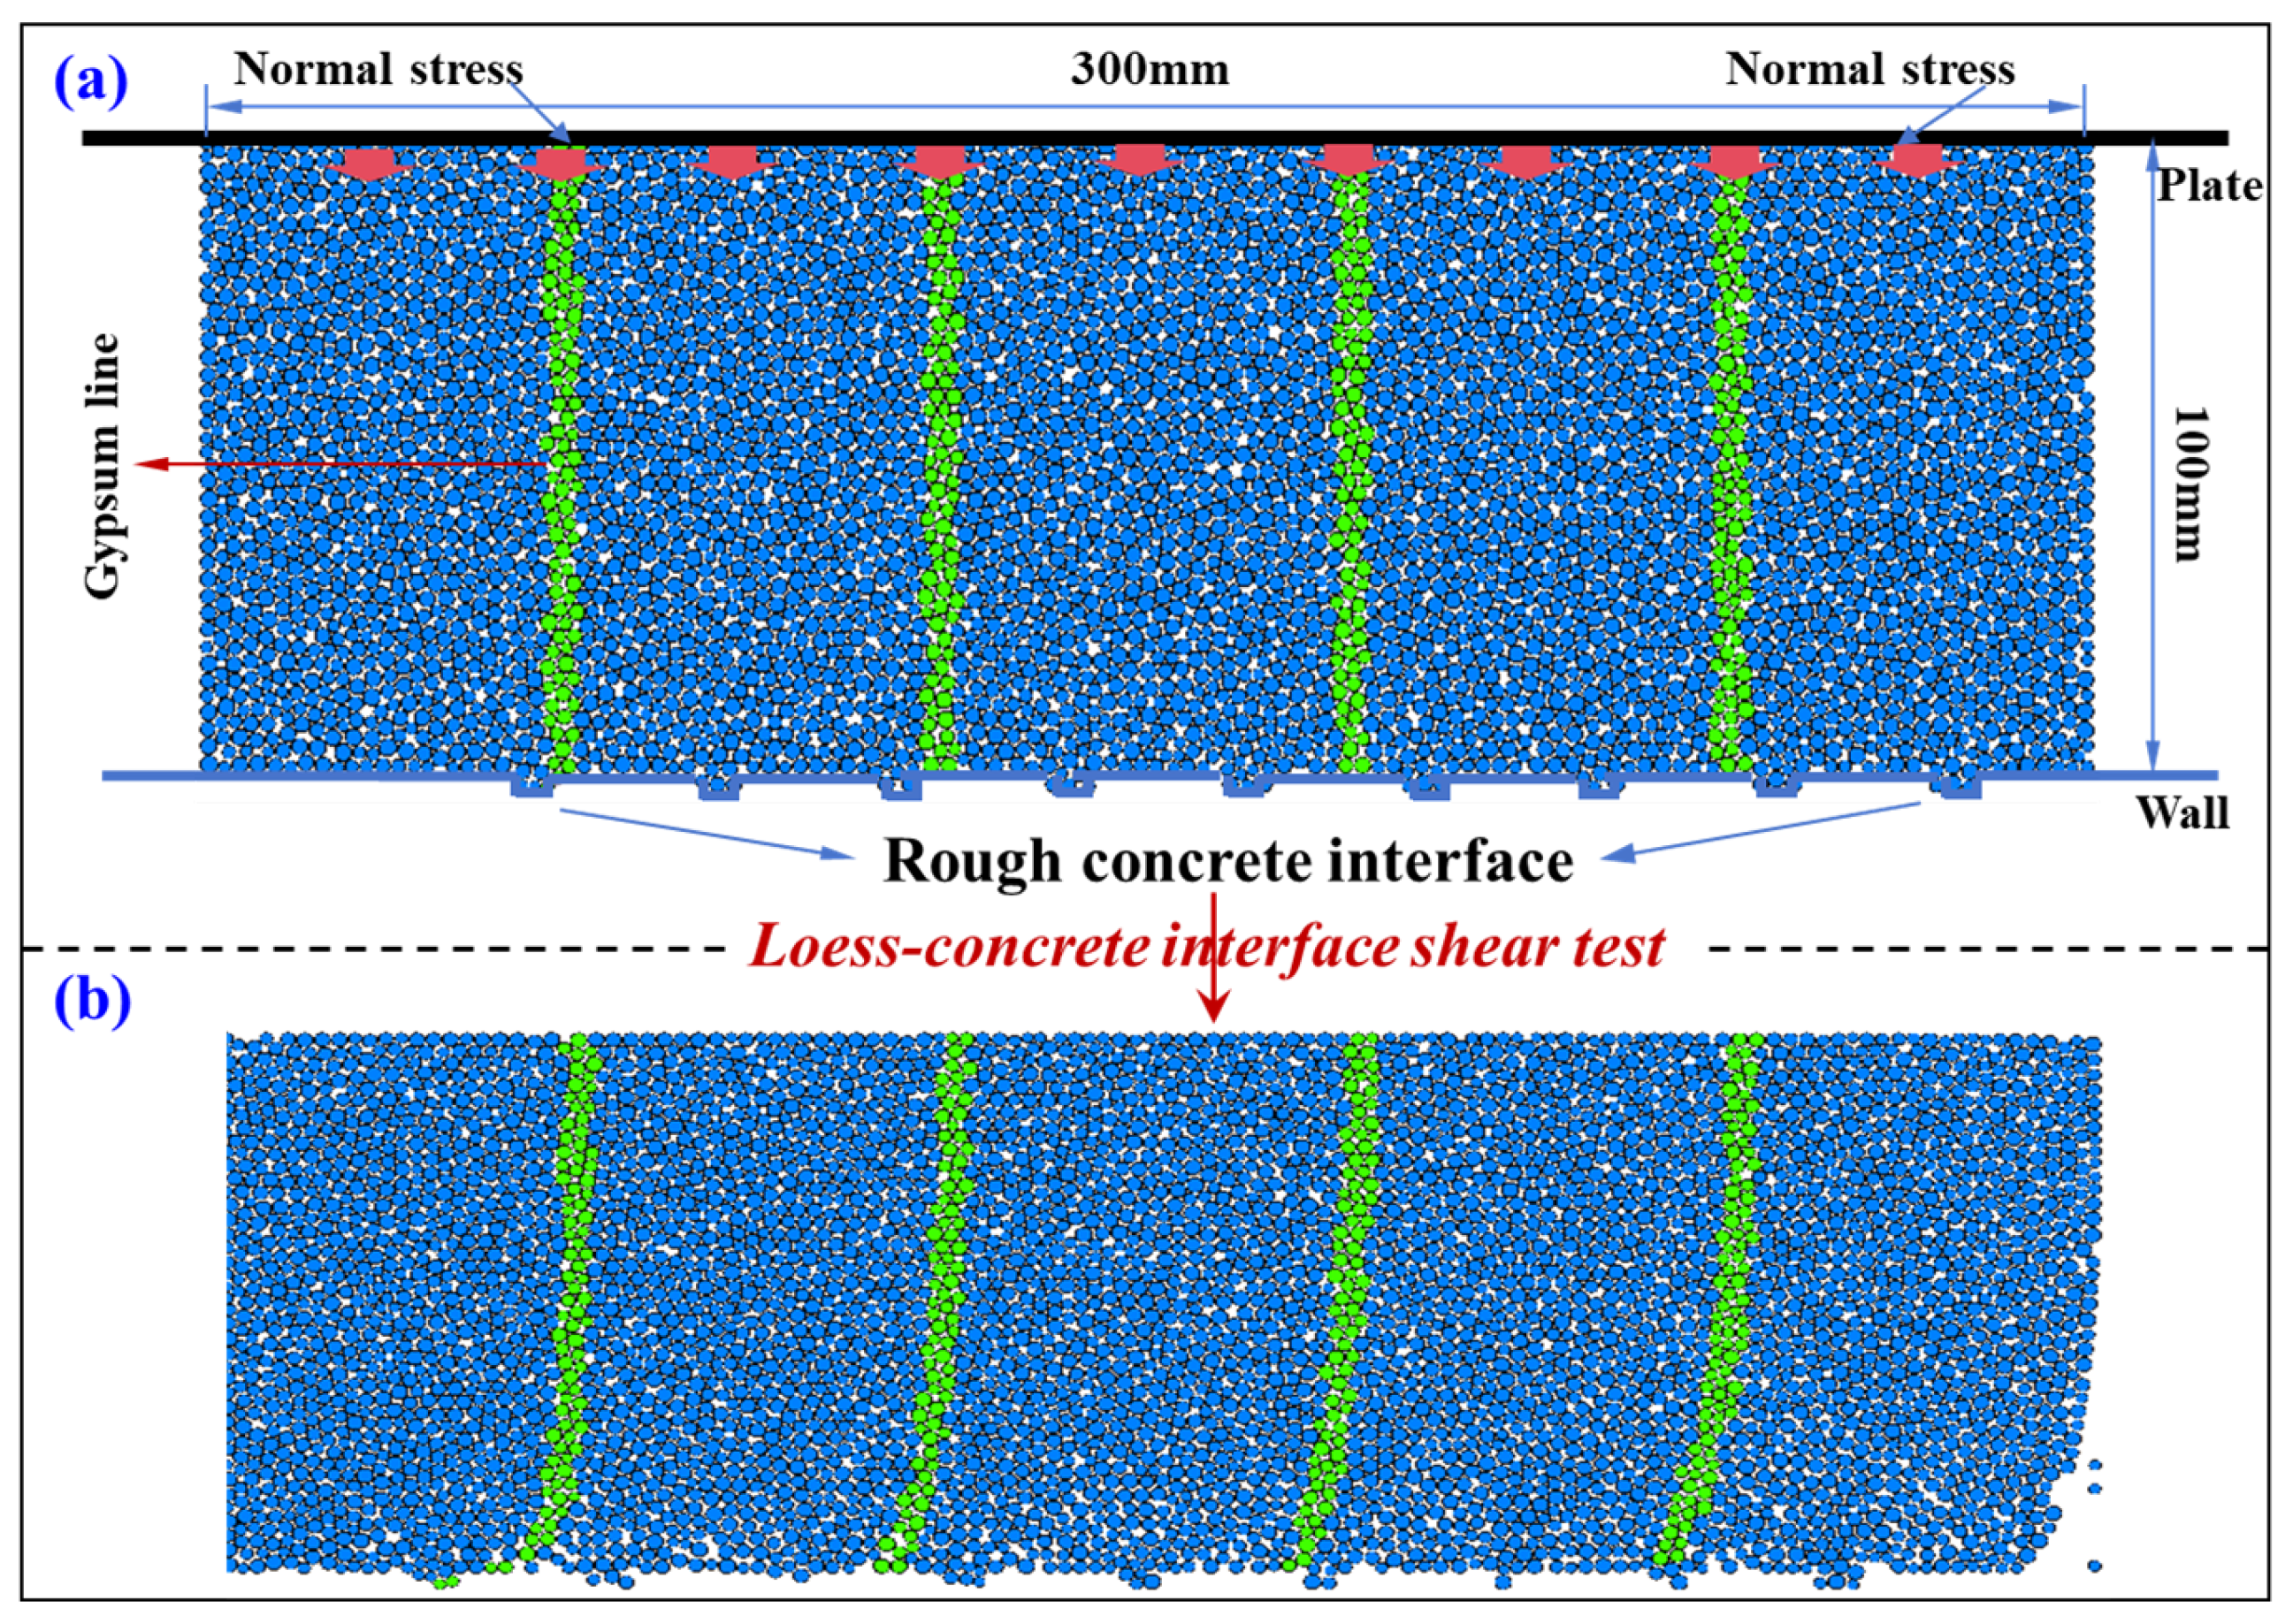
To further investigate the evolution of the shear deformation, contact force chain and fabric of the loess-concrete rough interface during the shear tests, the discrete element method (DEM), an important tool in microstructure evolution analysis [36,37,38], was used to conduct the simulation of interface shear test, so as to explore the micro-mechanics for the shear deformation and strength variation from a microstructural view point. Figure 7 shows the DEM model of a loess and rough concrete interface and representative image of its deformation resulting from the interface shear experiment. To numerically conduct shear test of the loess and rough concrete interface, two walls were established in the DEM model. Vertical normal stress was imposed on the upper wall by means of a servo-controlled mechanism. A wall in the bottom with several grooves was used to replicate the loess-concrete rough concrete interface. During the DEM simulation, the bottom wall with serval grooves horizontally move with rate of 0.8 mm/min to simulate the shearing process.
For the DEM model, the contact relationship of particles in loess sample was represented by a parallel bond model, with normal and tangential stiffness coefficients (kn and ks) and a friction coefficient (μ) calibrated through preliminary tests. Particle density and damping parameters were assigned according to the physical properties of the loess. The bonding of loess was considered, while the particle breakage was not considered. The consideration of the loess bonding by the parameters of emod, pb-coh and pb-ten. The interface roughness was simulated by embedding grooves with an average depth of 5 mm in the bottom wall, making it consistent with the surface roughness of the concrete specimens used in the laboratory tests. The applied normal stresses (50, 100, and 200 kPa) and shear displacement rate (0.8 mm/min) were also set to match the experimental conditions, thereby ensuring comparability between the simulations and laboratory results.
It should be noted that in the DEM simulation, the spherical particles were adopted to simplify the difficulty of DEM simulation. However, the loess showed distinct structural characteristics. The spherical particles cannot accurately simulate its mechanical and deformation characteristics. In future work, it will be necessary to use a clump unit in DEM modeling to better reflect the structured nature of loess.

3.2. DEM Model Calibration

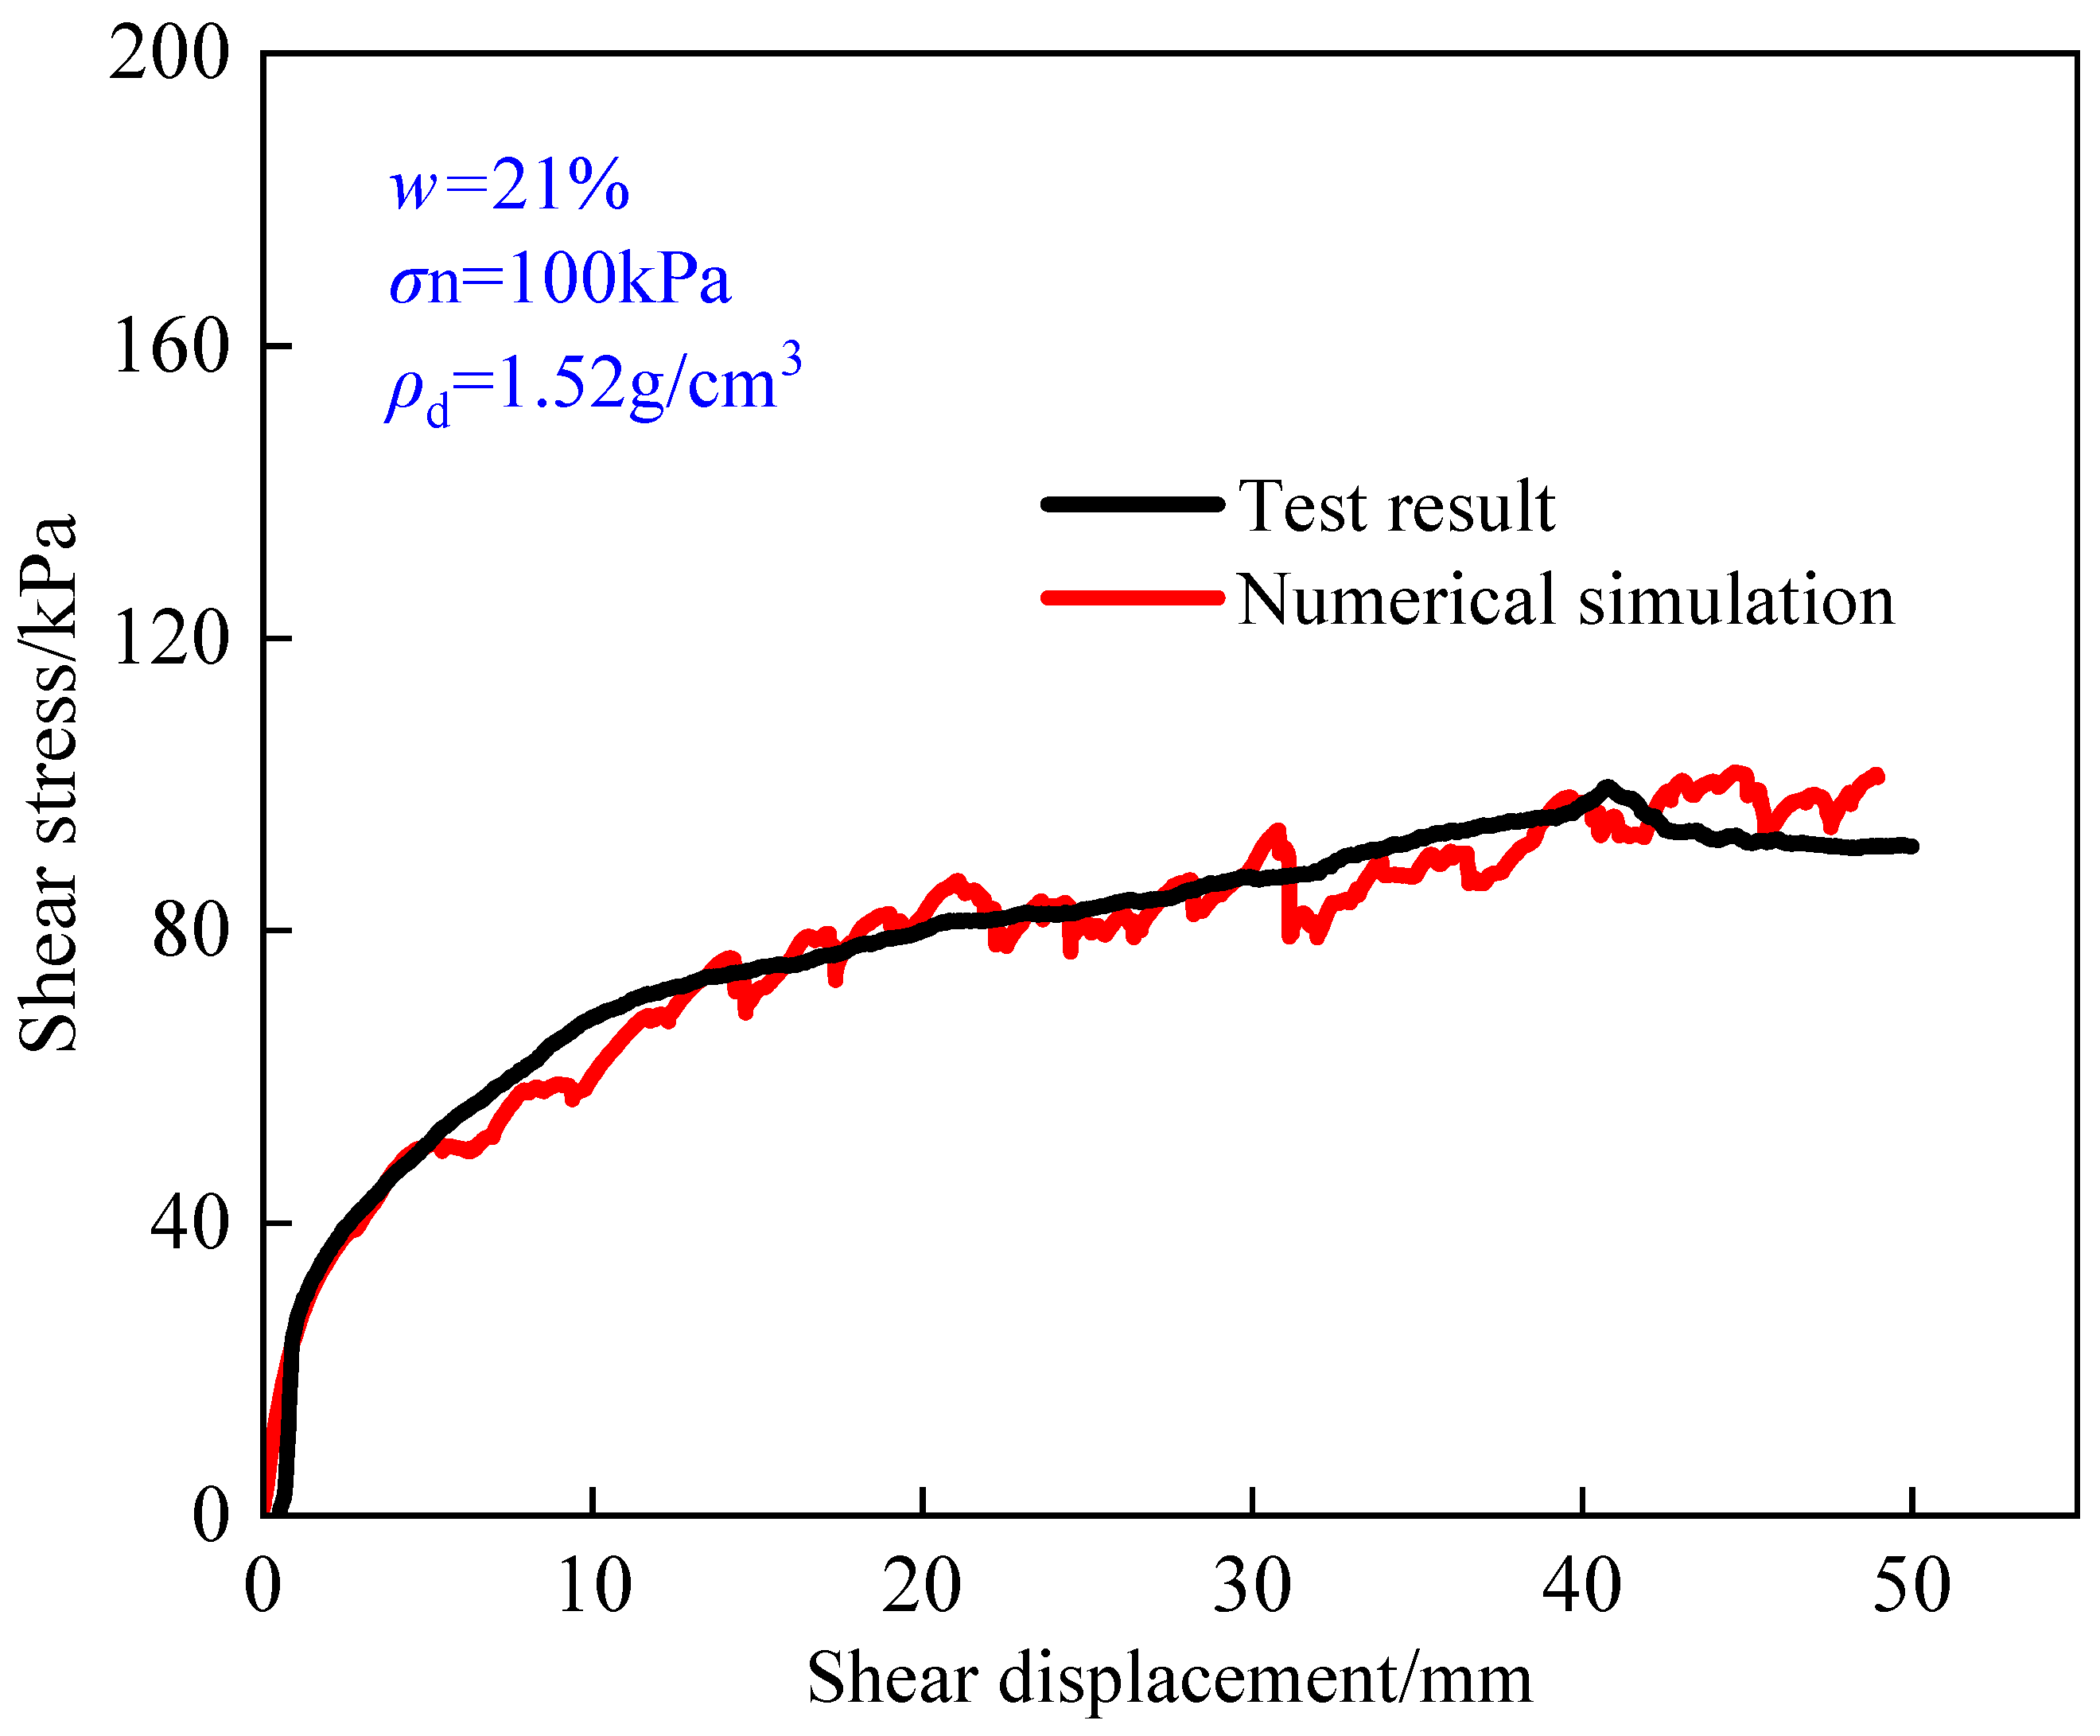
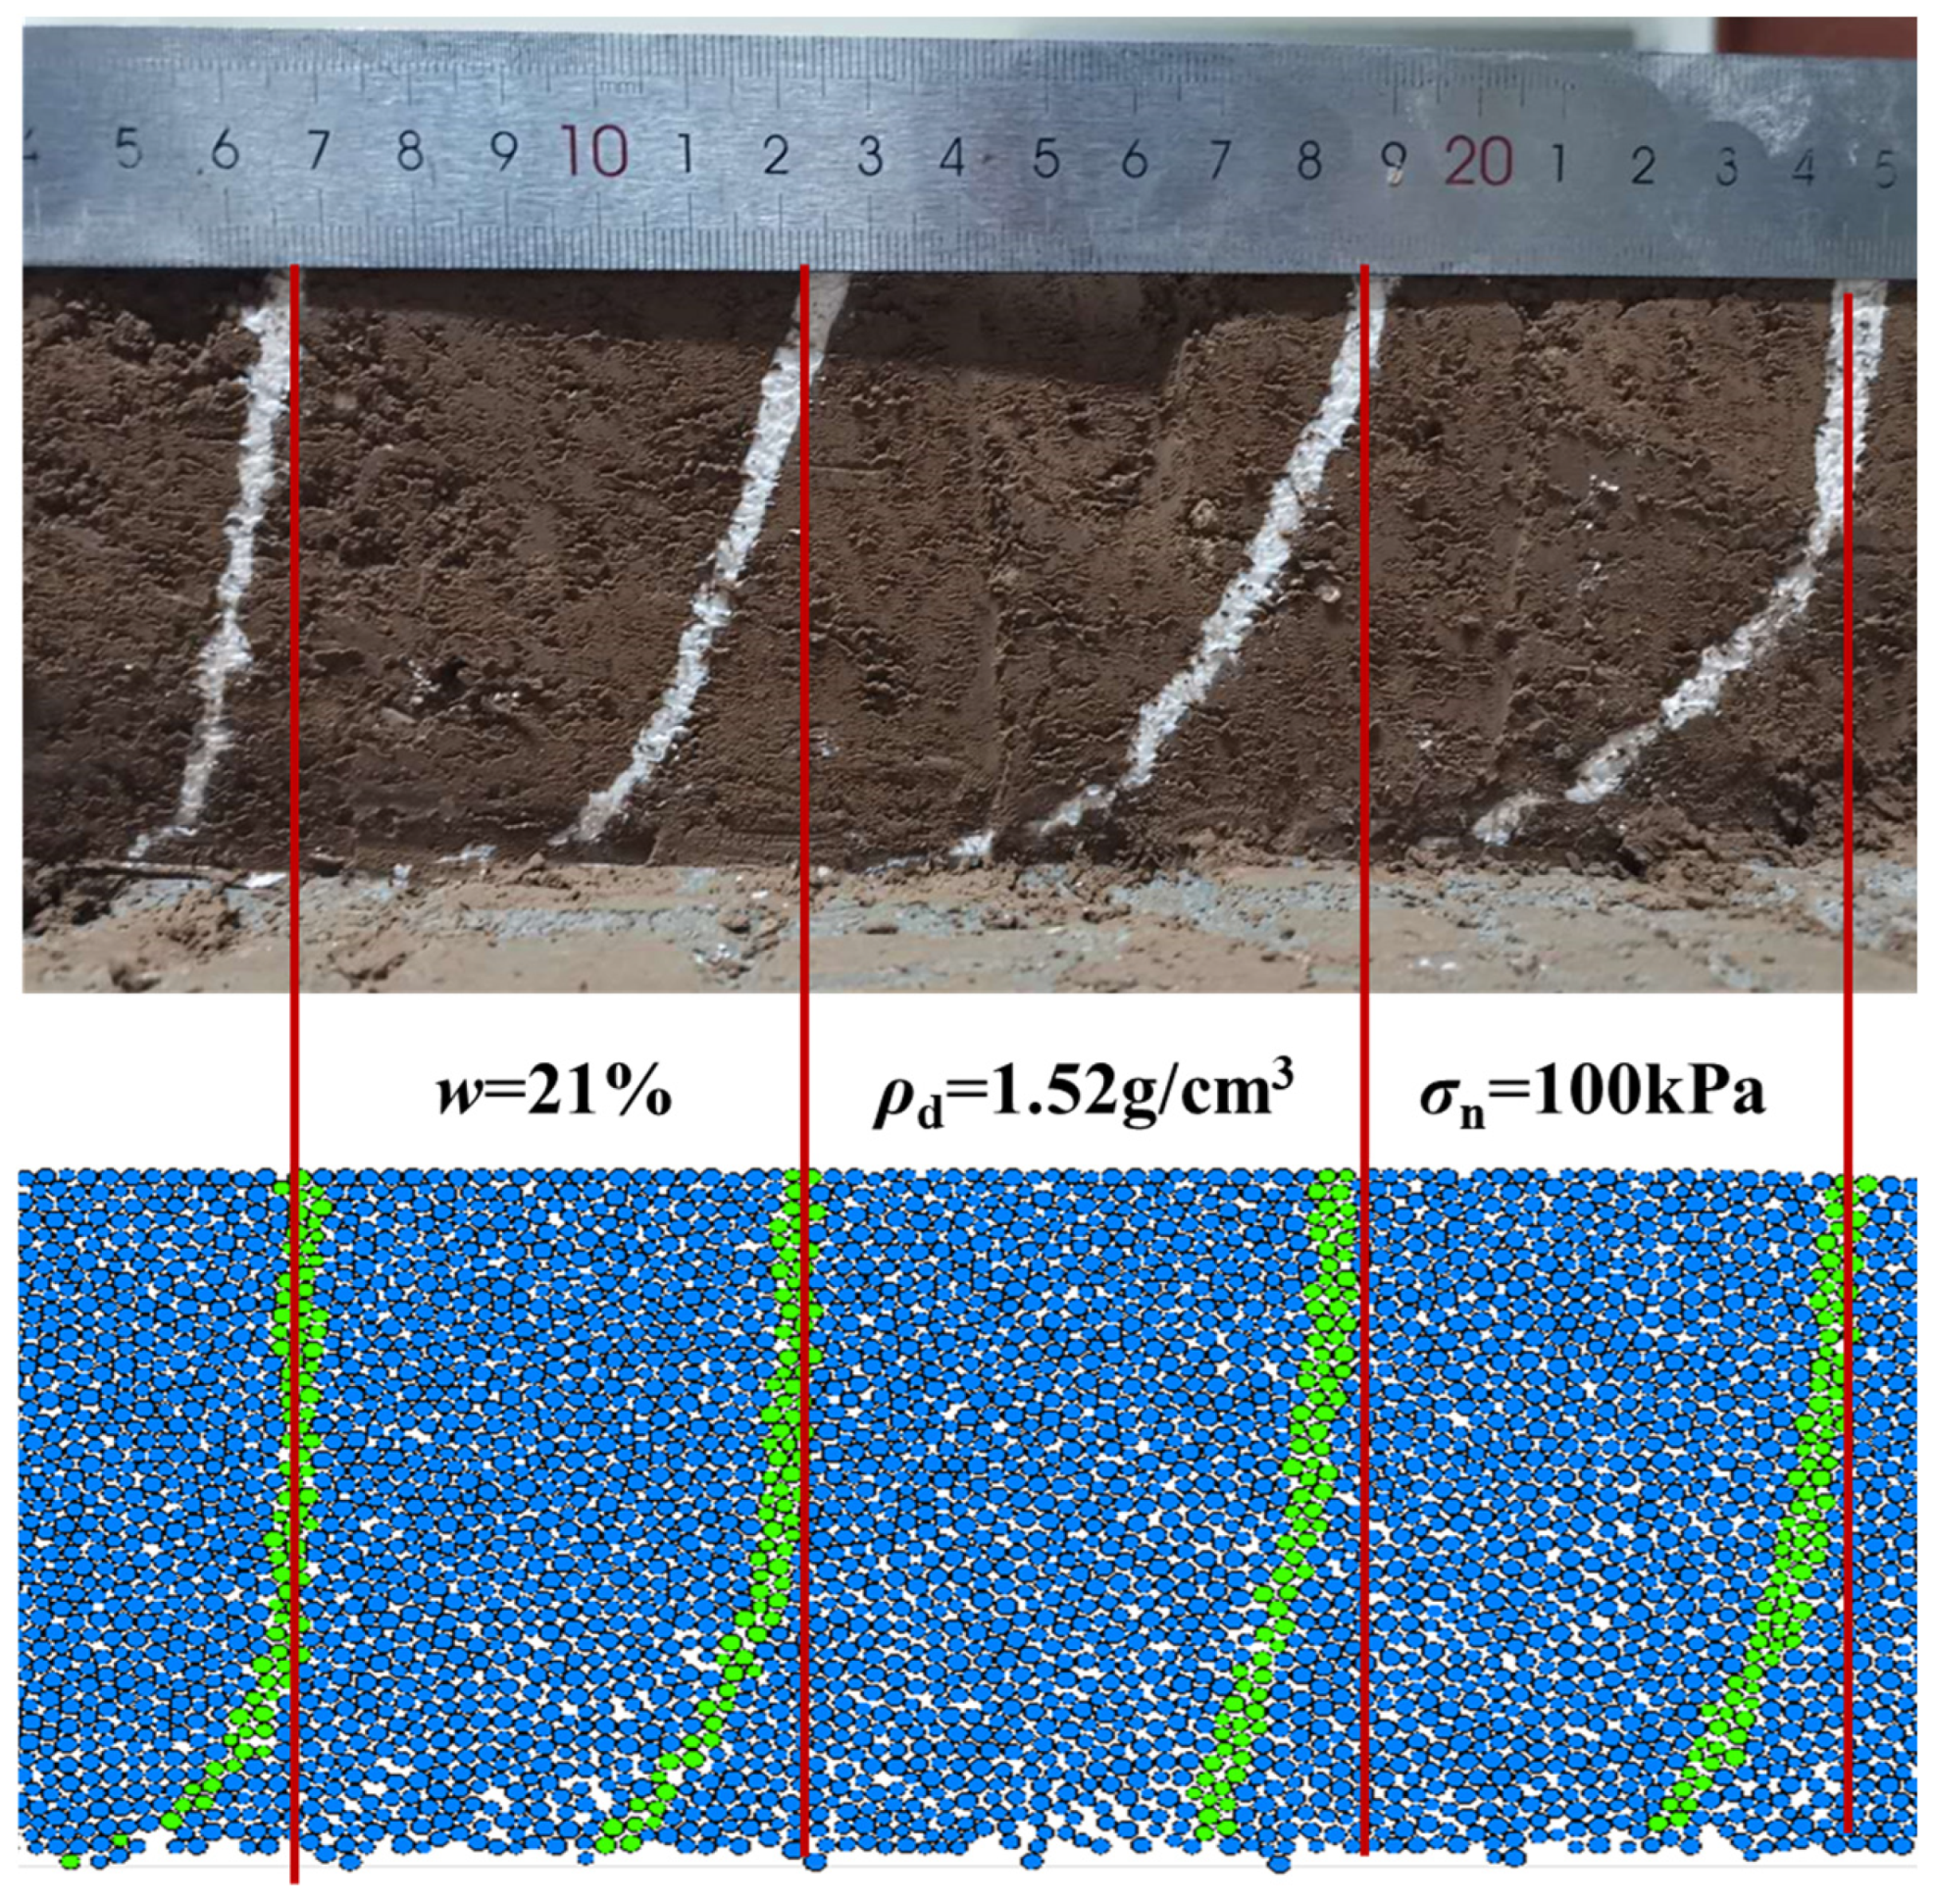
The mechanical and deformation parameters of the DEM model are critical to determine the accuracy of simulation. It was therefore necessary to calibrate these parameters to ensure that simulated results can successfully match the experimental results. The basic physical, mechanical and deformational parameters were calibrated based on the interface shear result under conditions of dry density of 1.52 g/cm3, normal stress of 100 kPa and initial water content of 21%. The microparameters of the DEM model were calibrated by comparing the shear stress-displacement obtained from simulation and measurement. By using parameters in Table 2, the simulated shear stress-displacement curve achieved a successful match with the one obtained from measurement (Figure 8). Besides, by using the parameters in Table 2, the simulated shear deformation also successfully matched with the shear deformation monitored by using the white gypsum lines, as shown in Figure 9.
Therefore, the parameters in Table 2 were the basic parameters in DEM simulations. According to the specific conditions in Table 2, the parameters were further calibrated with the same method as above.

3.3. DEM Simulation Results

3.3.1. Numerical Results Verification

Comparing experimental and numerical results is vital, as it allows us to determine the effectiveness and accuracy of the DEM model for shear test on loess-concrete rough interface. Indeed, only the simulated results successfully match the experimental results, the evolution of shear deformation, particle displacement, contact force chain and fabric of loess-concrete interface were reliable to explore the shear deformation and strength variation mechanism from a microstructure point. The results in this section mainly focus on comparing the shear stress-displacement curves obtained from DEM numerical simulation and indoor experiments to verify correctness of the DEM model.
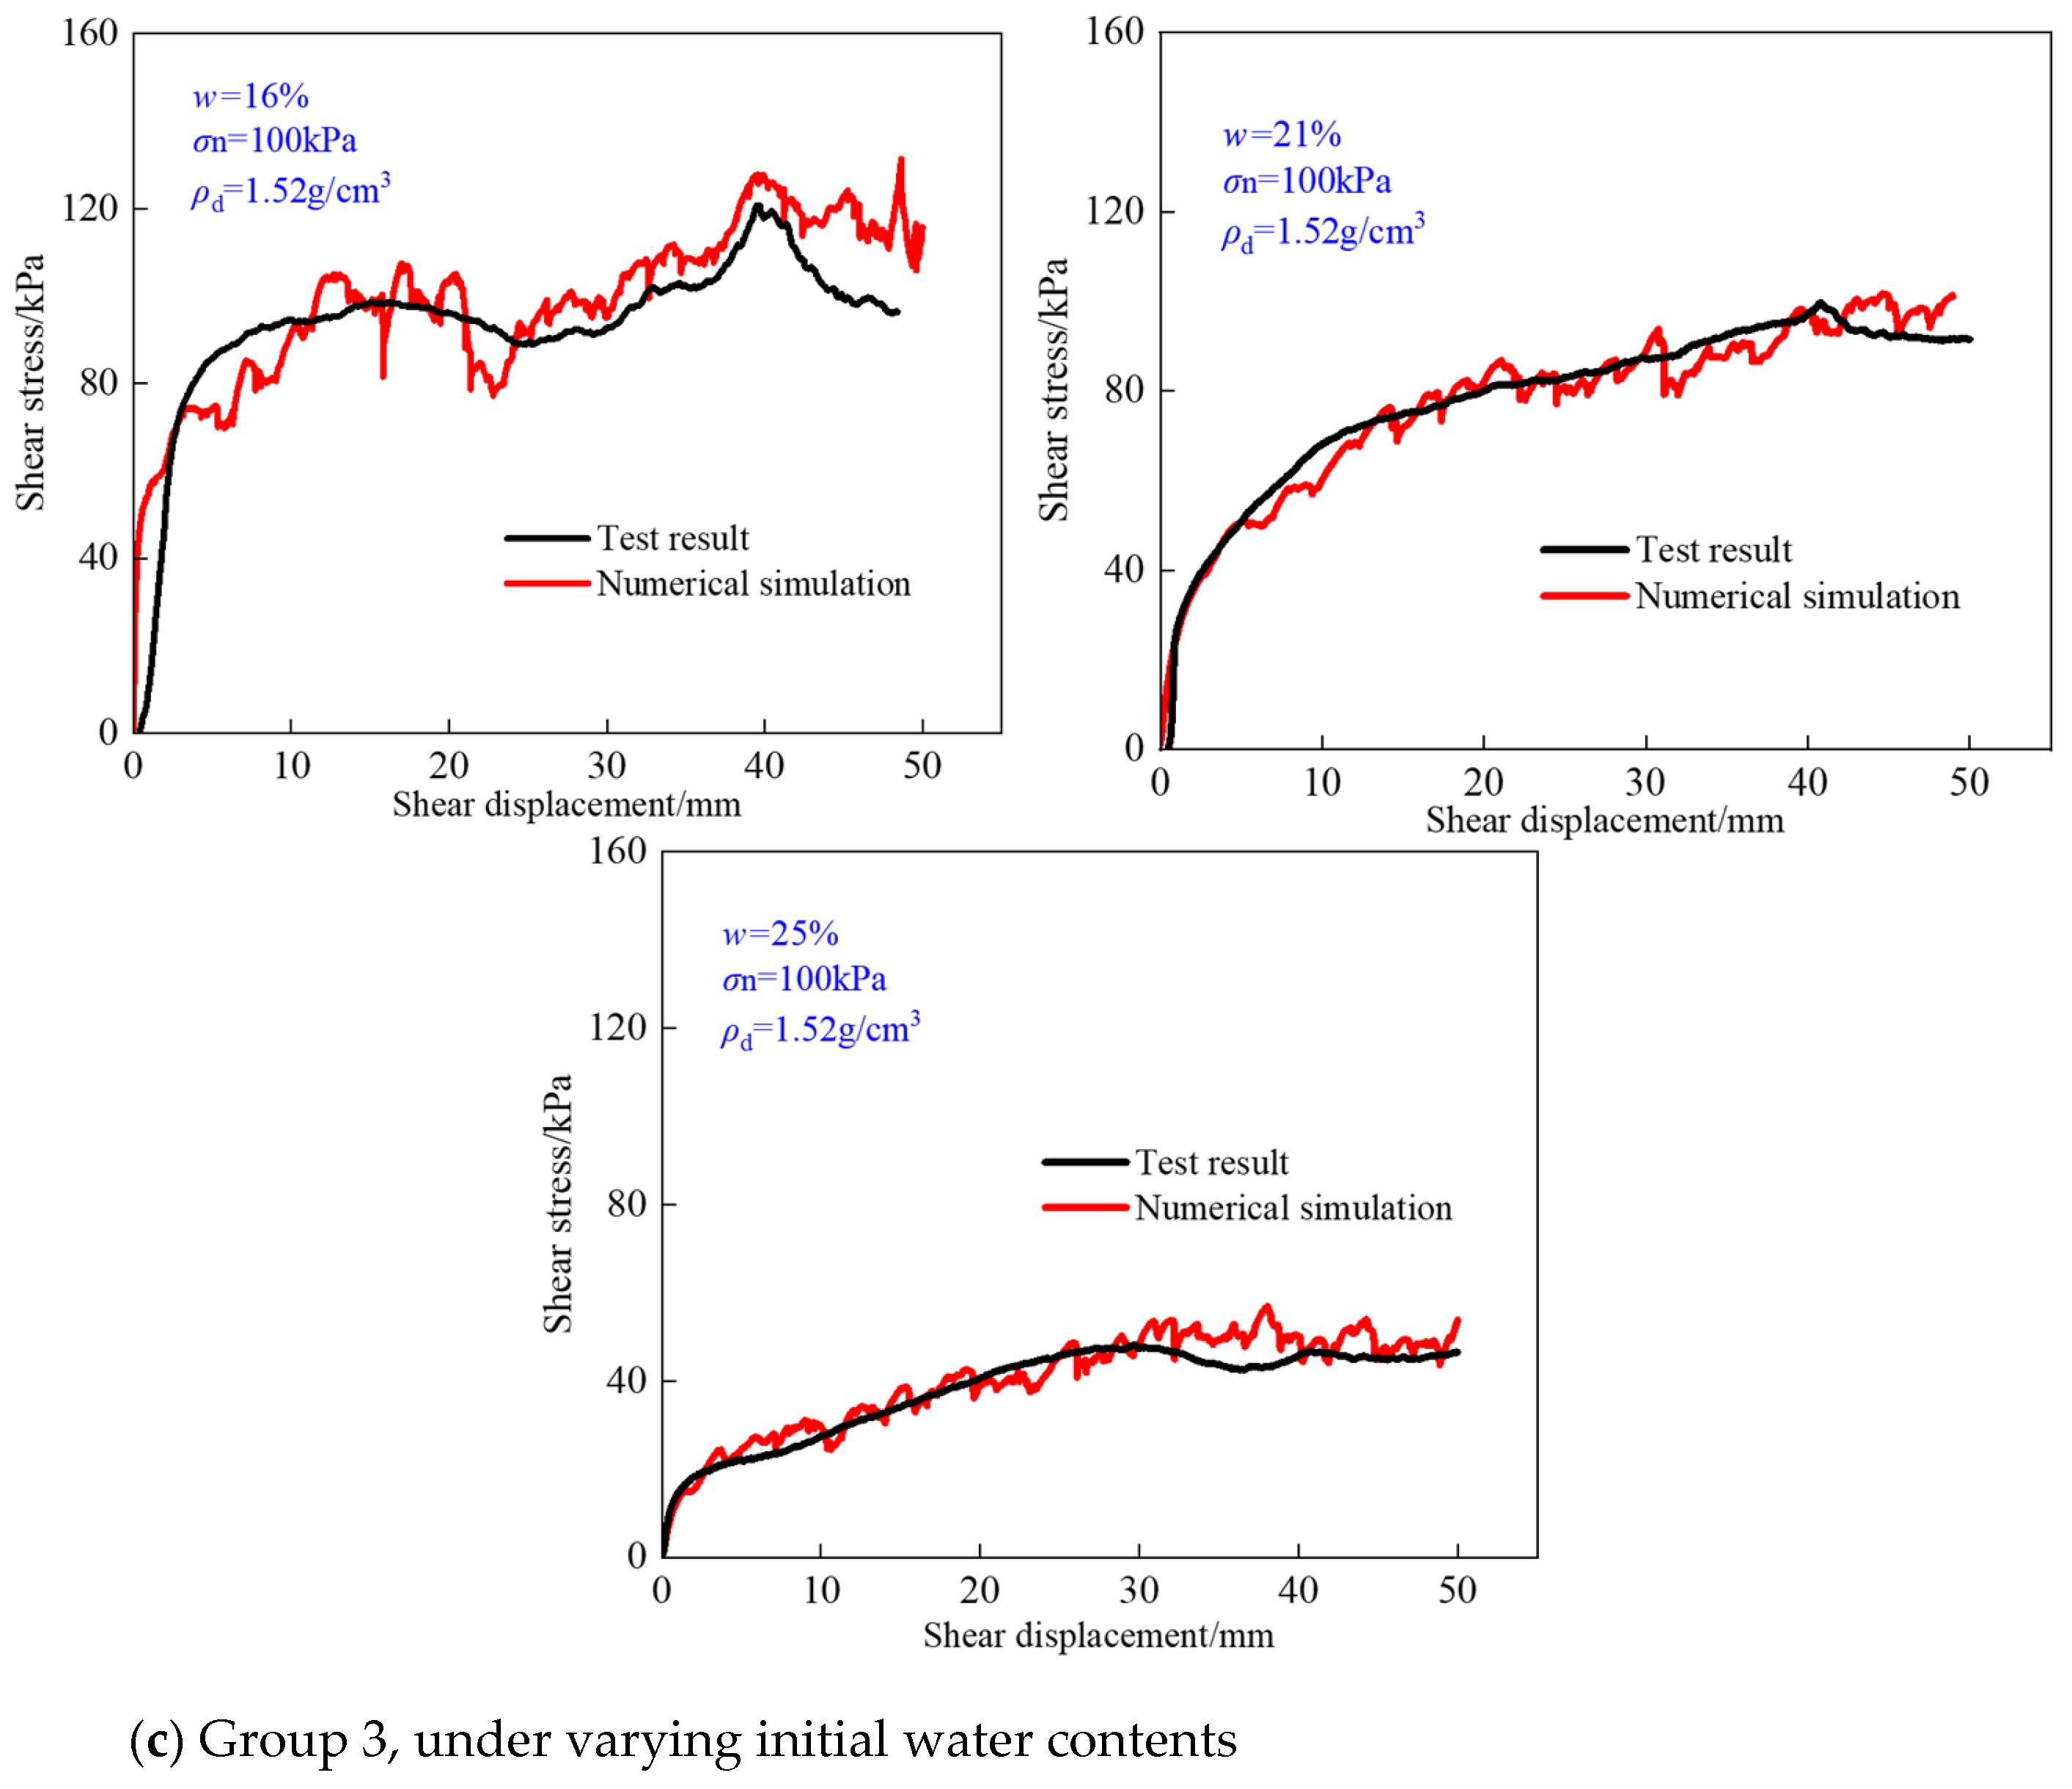
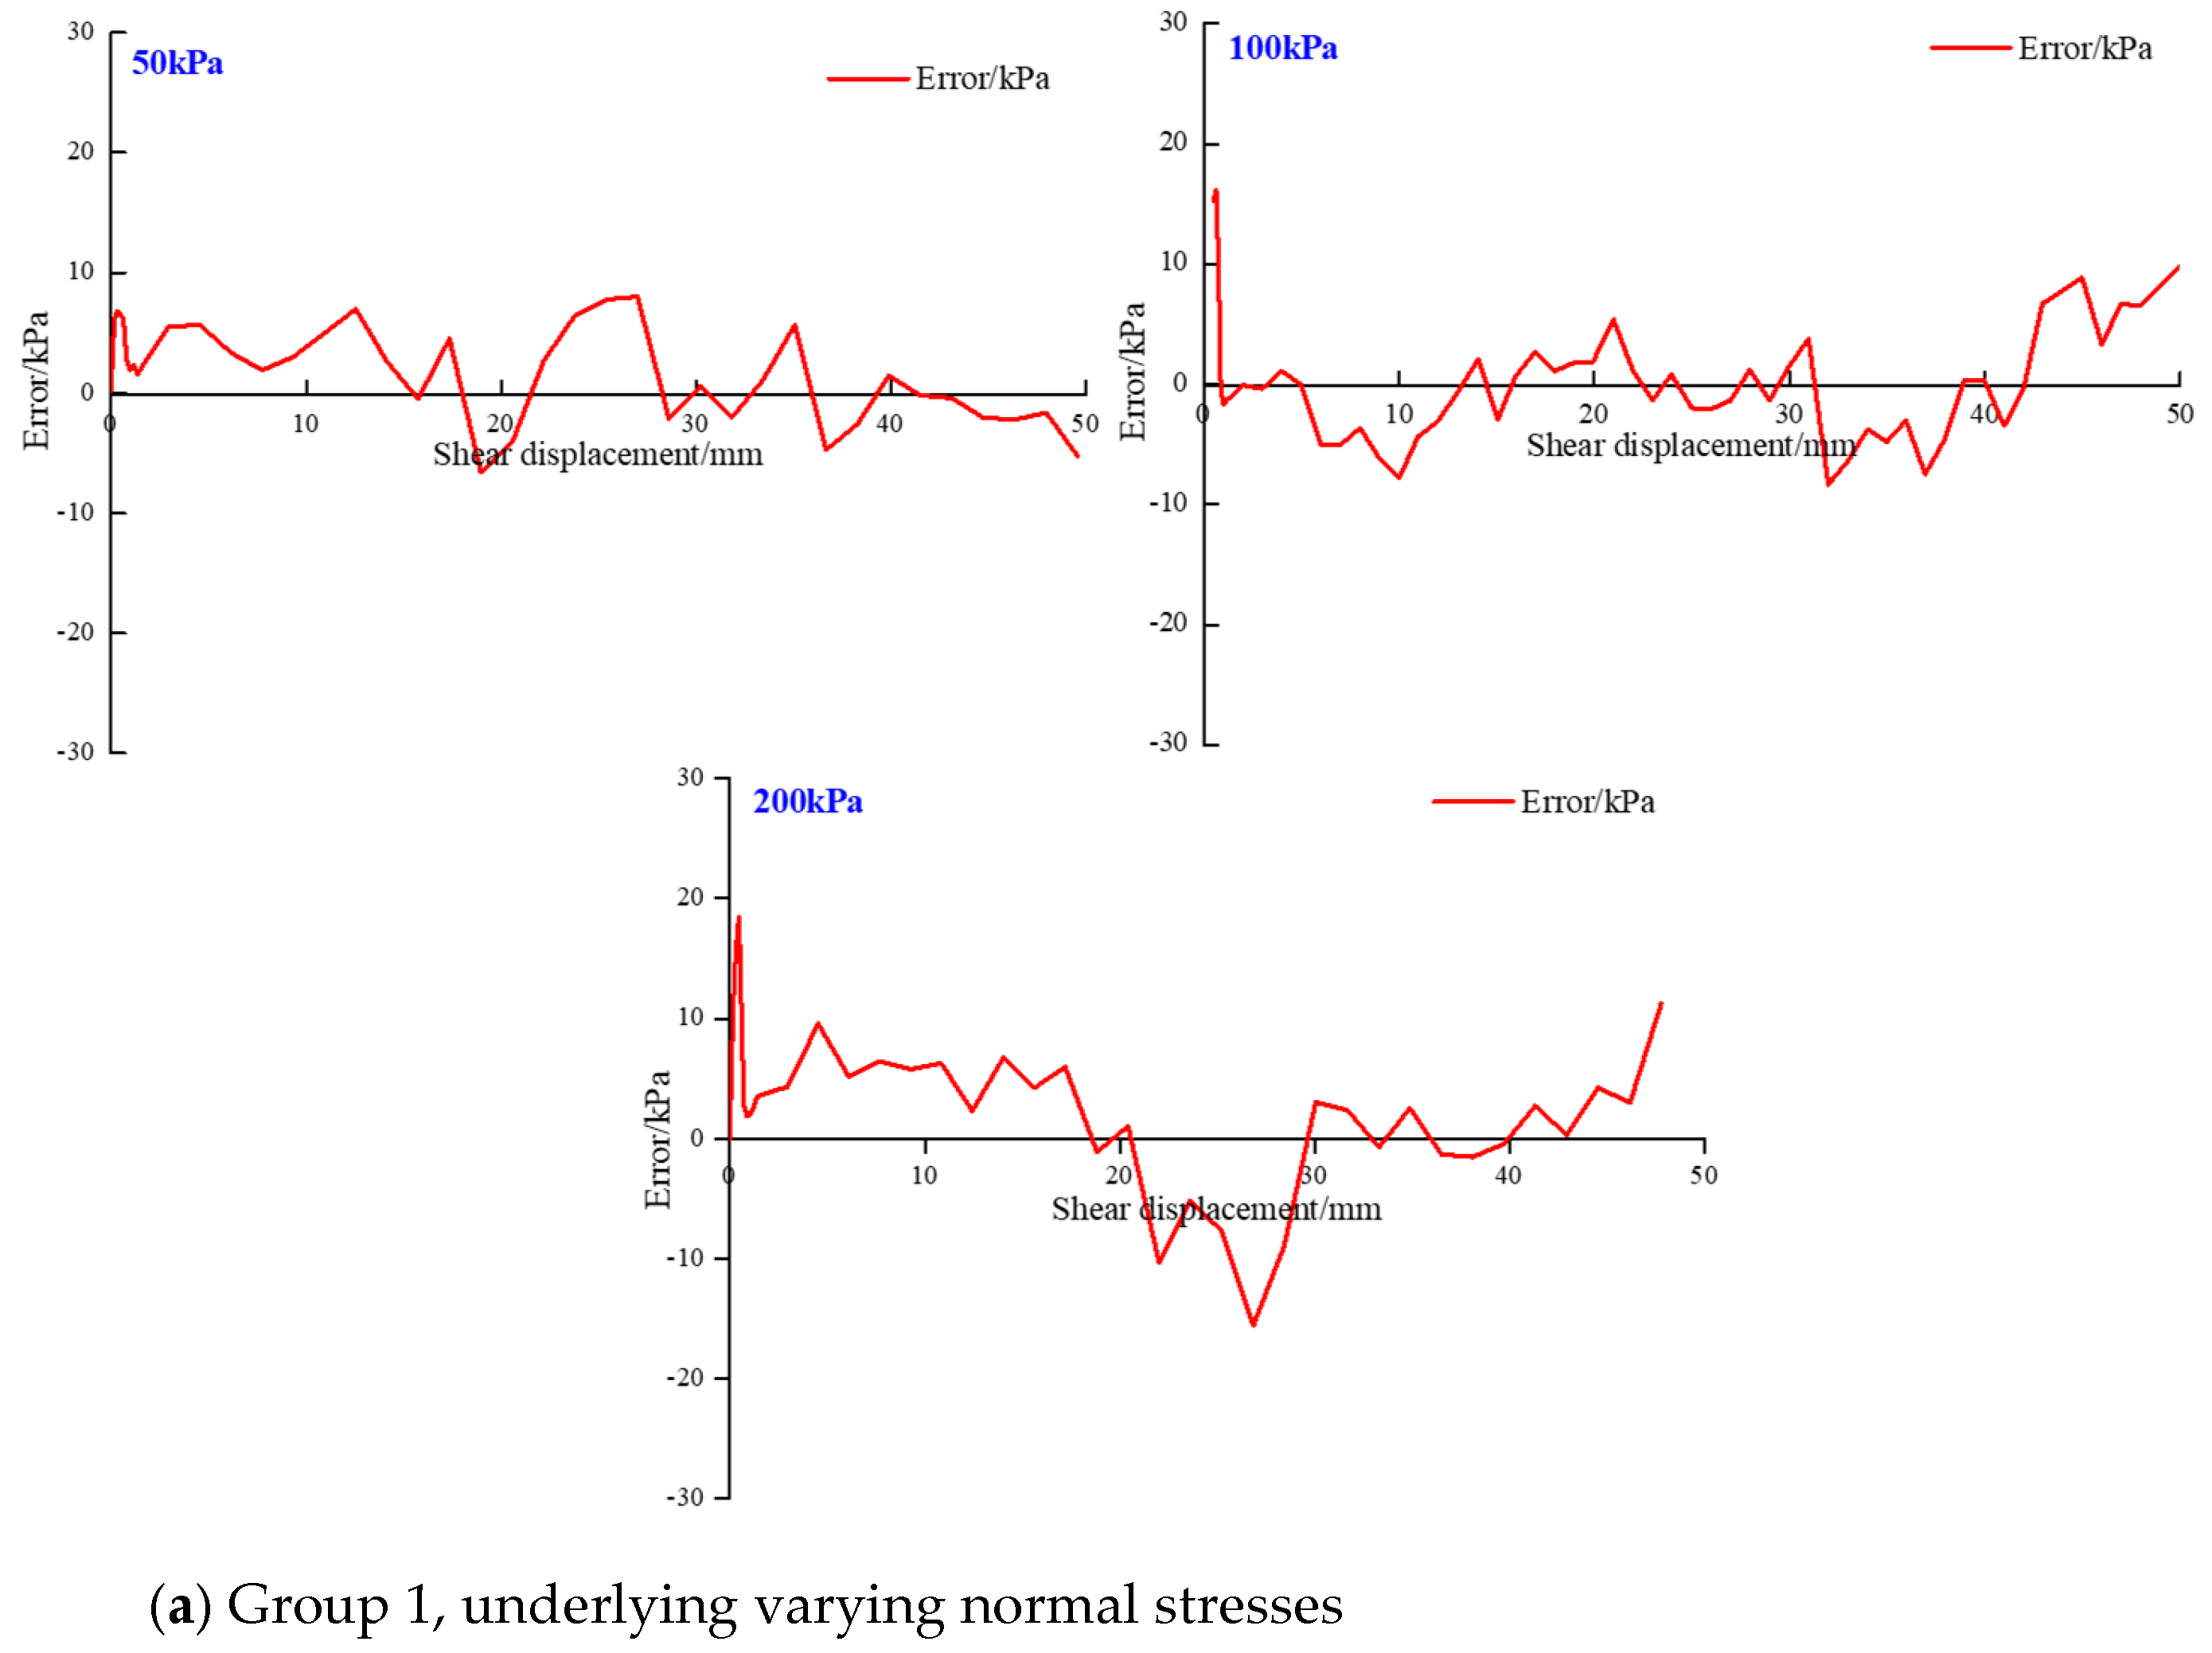
Comparisons on the shear stress-displacement curves obtained from simulation and measurement were shown in Figure 10. Besides, to further quantitatively validate the simulated results, error curves of the simulated and measured shear stress are shown in Figure 11. The error is difference between the simulated shear stress and the measured value. As illustrated in these figures, the simulated shear stress–displacement curves exhibit a generally good consistency with the ones from measurements, particularly in the early stage of loading. At early stage, when shear displacement was relatively small, the simulated shear stress was almost identical to the measured values, and no obvious fluctuations were observed, thereby confirming the validity of the DEM model in capturing the initial stiffness and strength development. However, when the shear displacement further increased, the shear stress suffers an obvious fluctuation. Such fluctuations are attributed to the rough interface configuration in the DEM model, where the loess particles and grooves undergo continuous rearrangement. In laboratory tests, the loess inside the grooves was gradually compressed and smoothed against the concrete surface, resulting in a smoother experimental curve. In contrast, in DEM simulations, particle rearrangement and contact updating led to stress oscillations. Similar observations have been reported in previous DEM-based interface studies [24,39], which corroborates that the stress fluctuations obtained in the present model are a typical outcome of the particle-scale representation.
Importantly, despite these fluctuations, the simulated curves remained close to the experimental envelope, showing that the DEM simulation was effectively capable of reproducing both trend and magnitude of interface shear behavior. Figure 11 shows that the errors of the simulated and measured shear stress generally are small, and mostly are in the range of 10 kPa. This agreement validates the DEM model reliability in capturing shear characteristics of the loess and rough concrete interface. Furthermore, the validation against experimental curves ensures that subsequent analyses of shear deformation patterns, particle displacement fields, contact force chains, and fabric evolution are credible and scientifically supported. Using the DEM model after calibration, evolutions of the shear deformation, displacement of particle, contact force chain, and fabric of the loess–concrete interface are further analyzed and discussed.

3.3.2. Simulated Deformation Evolutions of Loess Samples

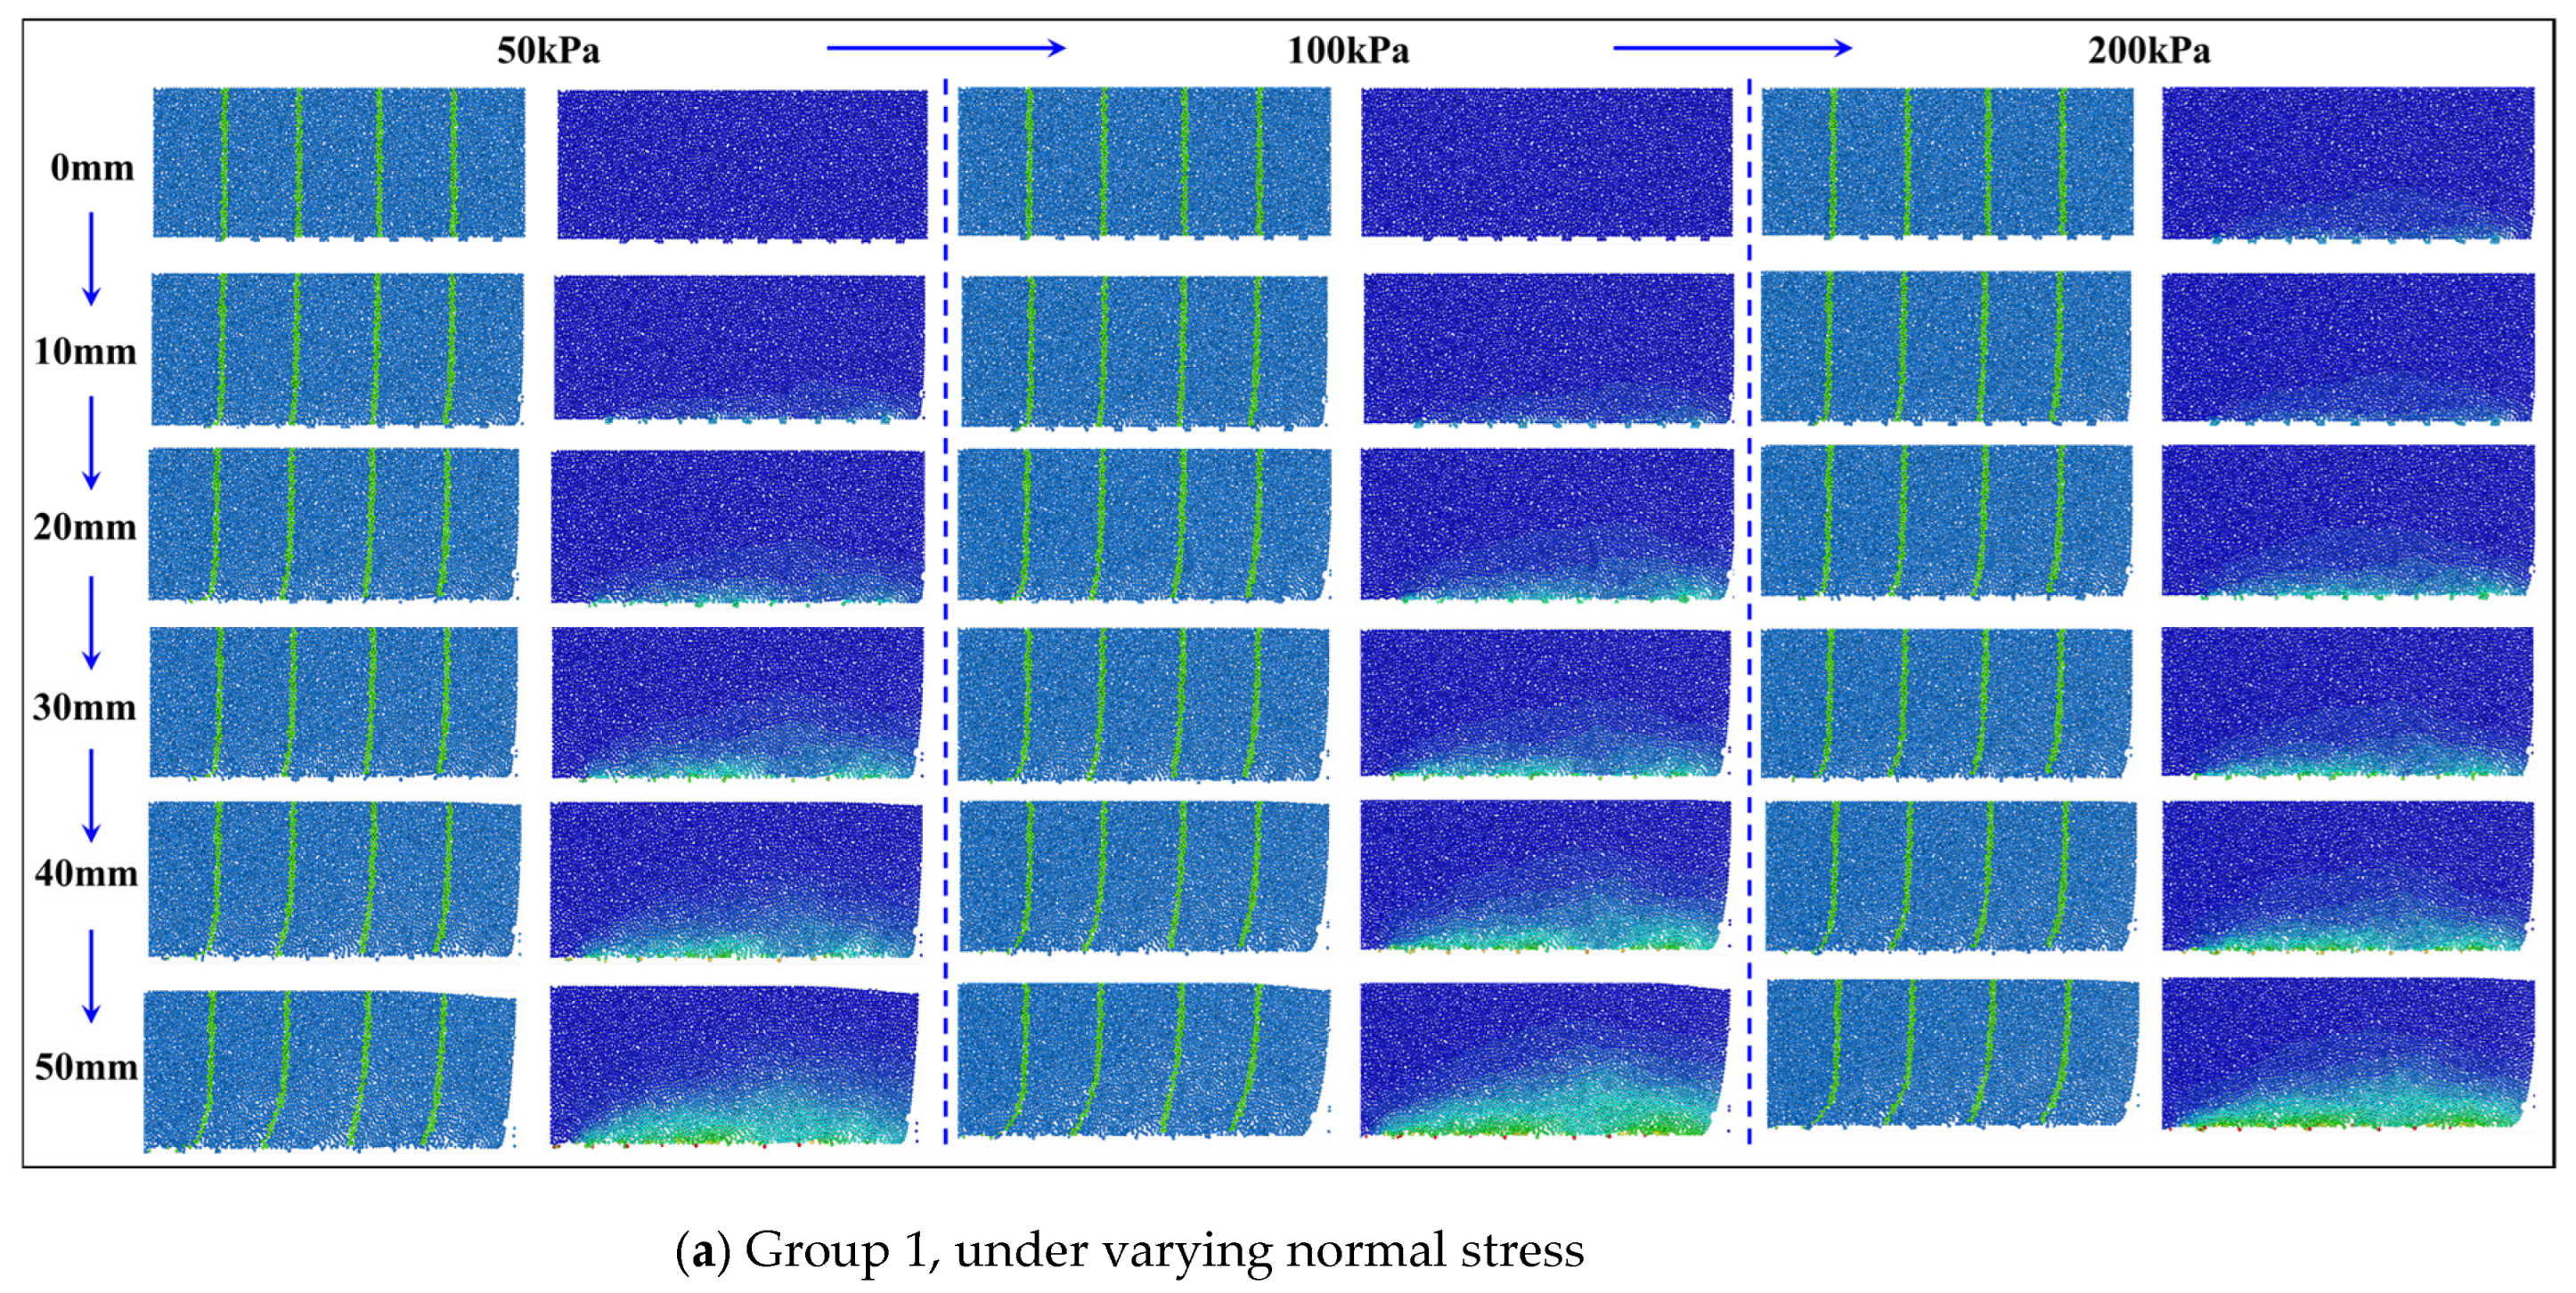
Figure 12 illustrated evolution of the shear deformation with particle displacement of the loess-concrete rough interfaces, which were recorded at every 10 mm. In general, from Figure 12a–c, it can be found that with an increase in shear displacement, deformation of the gypsum line began at the bottom, gradually extended to the upper part of the gypsum lines, and finally stopped at the middle point of the gypsum lines. Taking the first and fourth gypsum lines from left to right as examples, we can find that the fourth gypsum line deformed at the preliminary stage of this shear experiment (i.e., when shear displacement was small), while the first gypsum line deformed at the middle to late stage of the shear test (i.e., when shear displacement was big). Time that the first gypsum line deformed was significantly later than the time that the fourth gypsum line deformed. Together, Figure 12a–c, showed that the time of gypsum line deformation increased from right to left. The gypsum lines did not deform simultaneously due to the boundary constraints effect. The final particle displacement distribution aligns well with the results of existing studies, thereby providing additional confirmation of the reliability and validity of our simulation results [28]. Regarding the particle displacement, as the shear displacement increased, more and more particles were influenced by the particle movement, and occur a displacement. The height of ball with displacement was the maximum height of the gypsum line deformation. The particle displacement also shows the influenced extent by the rough loess-concrete interface. As shear displacement increased, particle displacement was not confined to the interface but progressively propagated into the soil mass. The vertical extent of particle displacement corresponded to the maximum height of the deformed gypsum line, while the intensity of displacement was highest near the loess–concrete interface and decayed with increasing distance from the interface. This gradient indicates that the rough interface exerts a localized yet significant influence on particle kinematics, shaping the shear band development.
Additionally, as shown in Figure 12, the maximum horizontal deformation decreased with the increase in normal stress and dry densities, while it increased with the increase in initial moisture content. The trend was similar with the one measured by interface shear tests. The loess particle displacement cannot be observed by the experiments; however, it can be investigated by DEM simulation. It is evident that particle displacement was maximum near the loess and rough concrete interface, and gradually decreased with the increased in the distance from the rough interface. This also indicated that part of the loess can significantly influenced by the loess and rough concrete interface.

3.3.3. Contact Force Chain Evolutions of Loess Sample

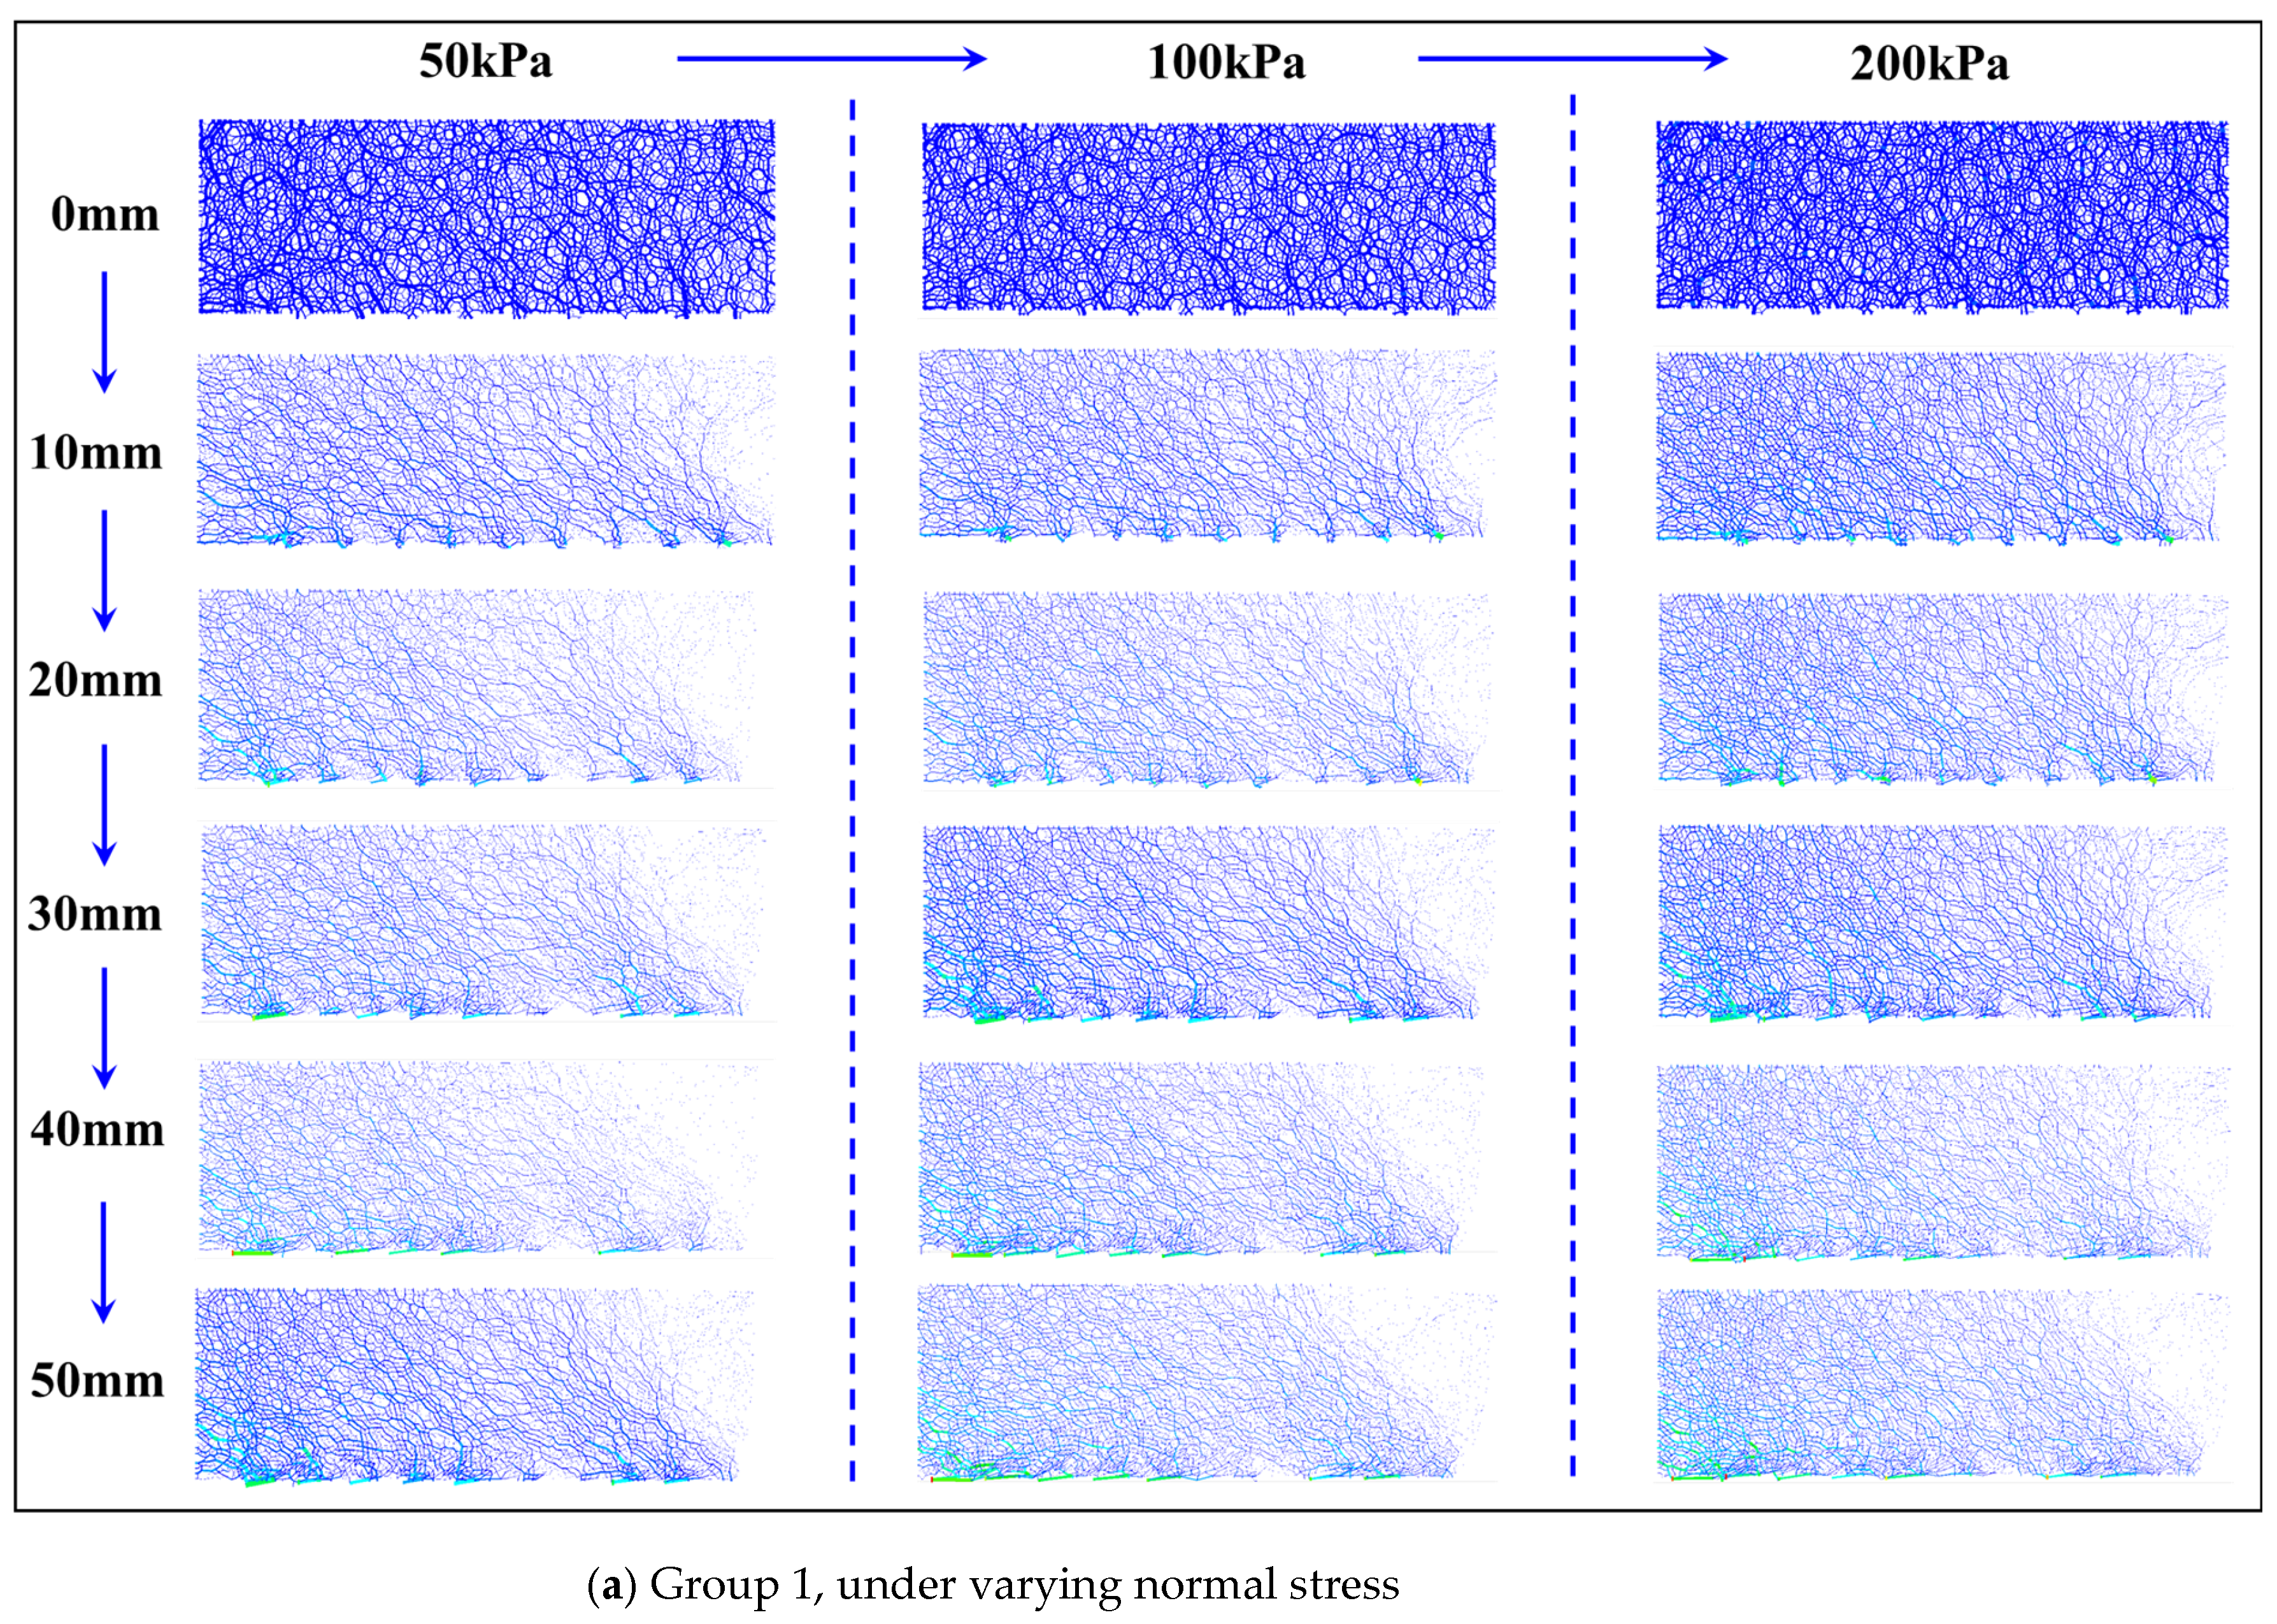
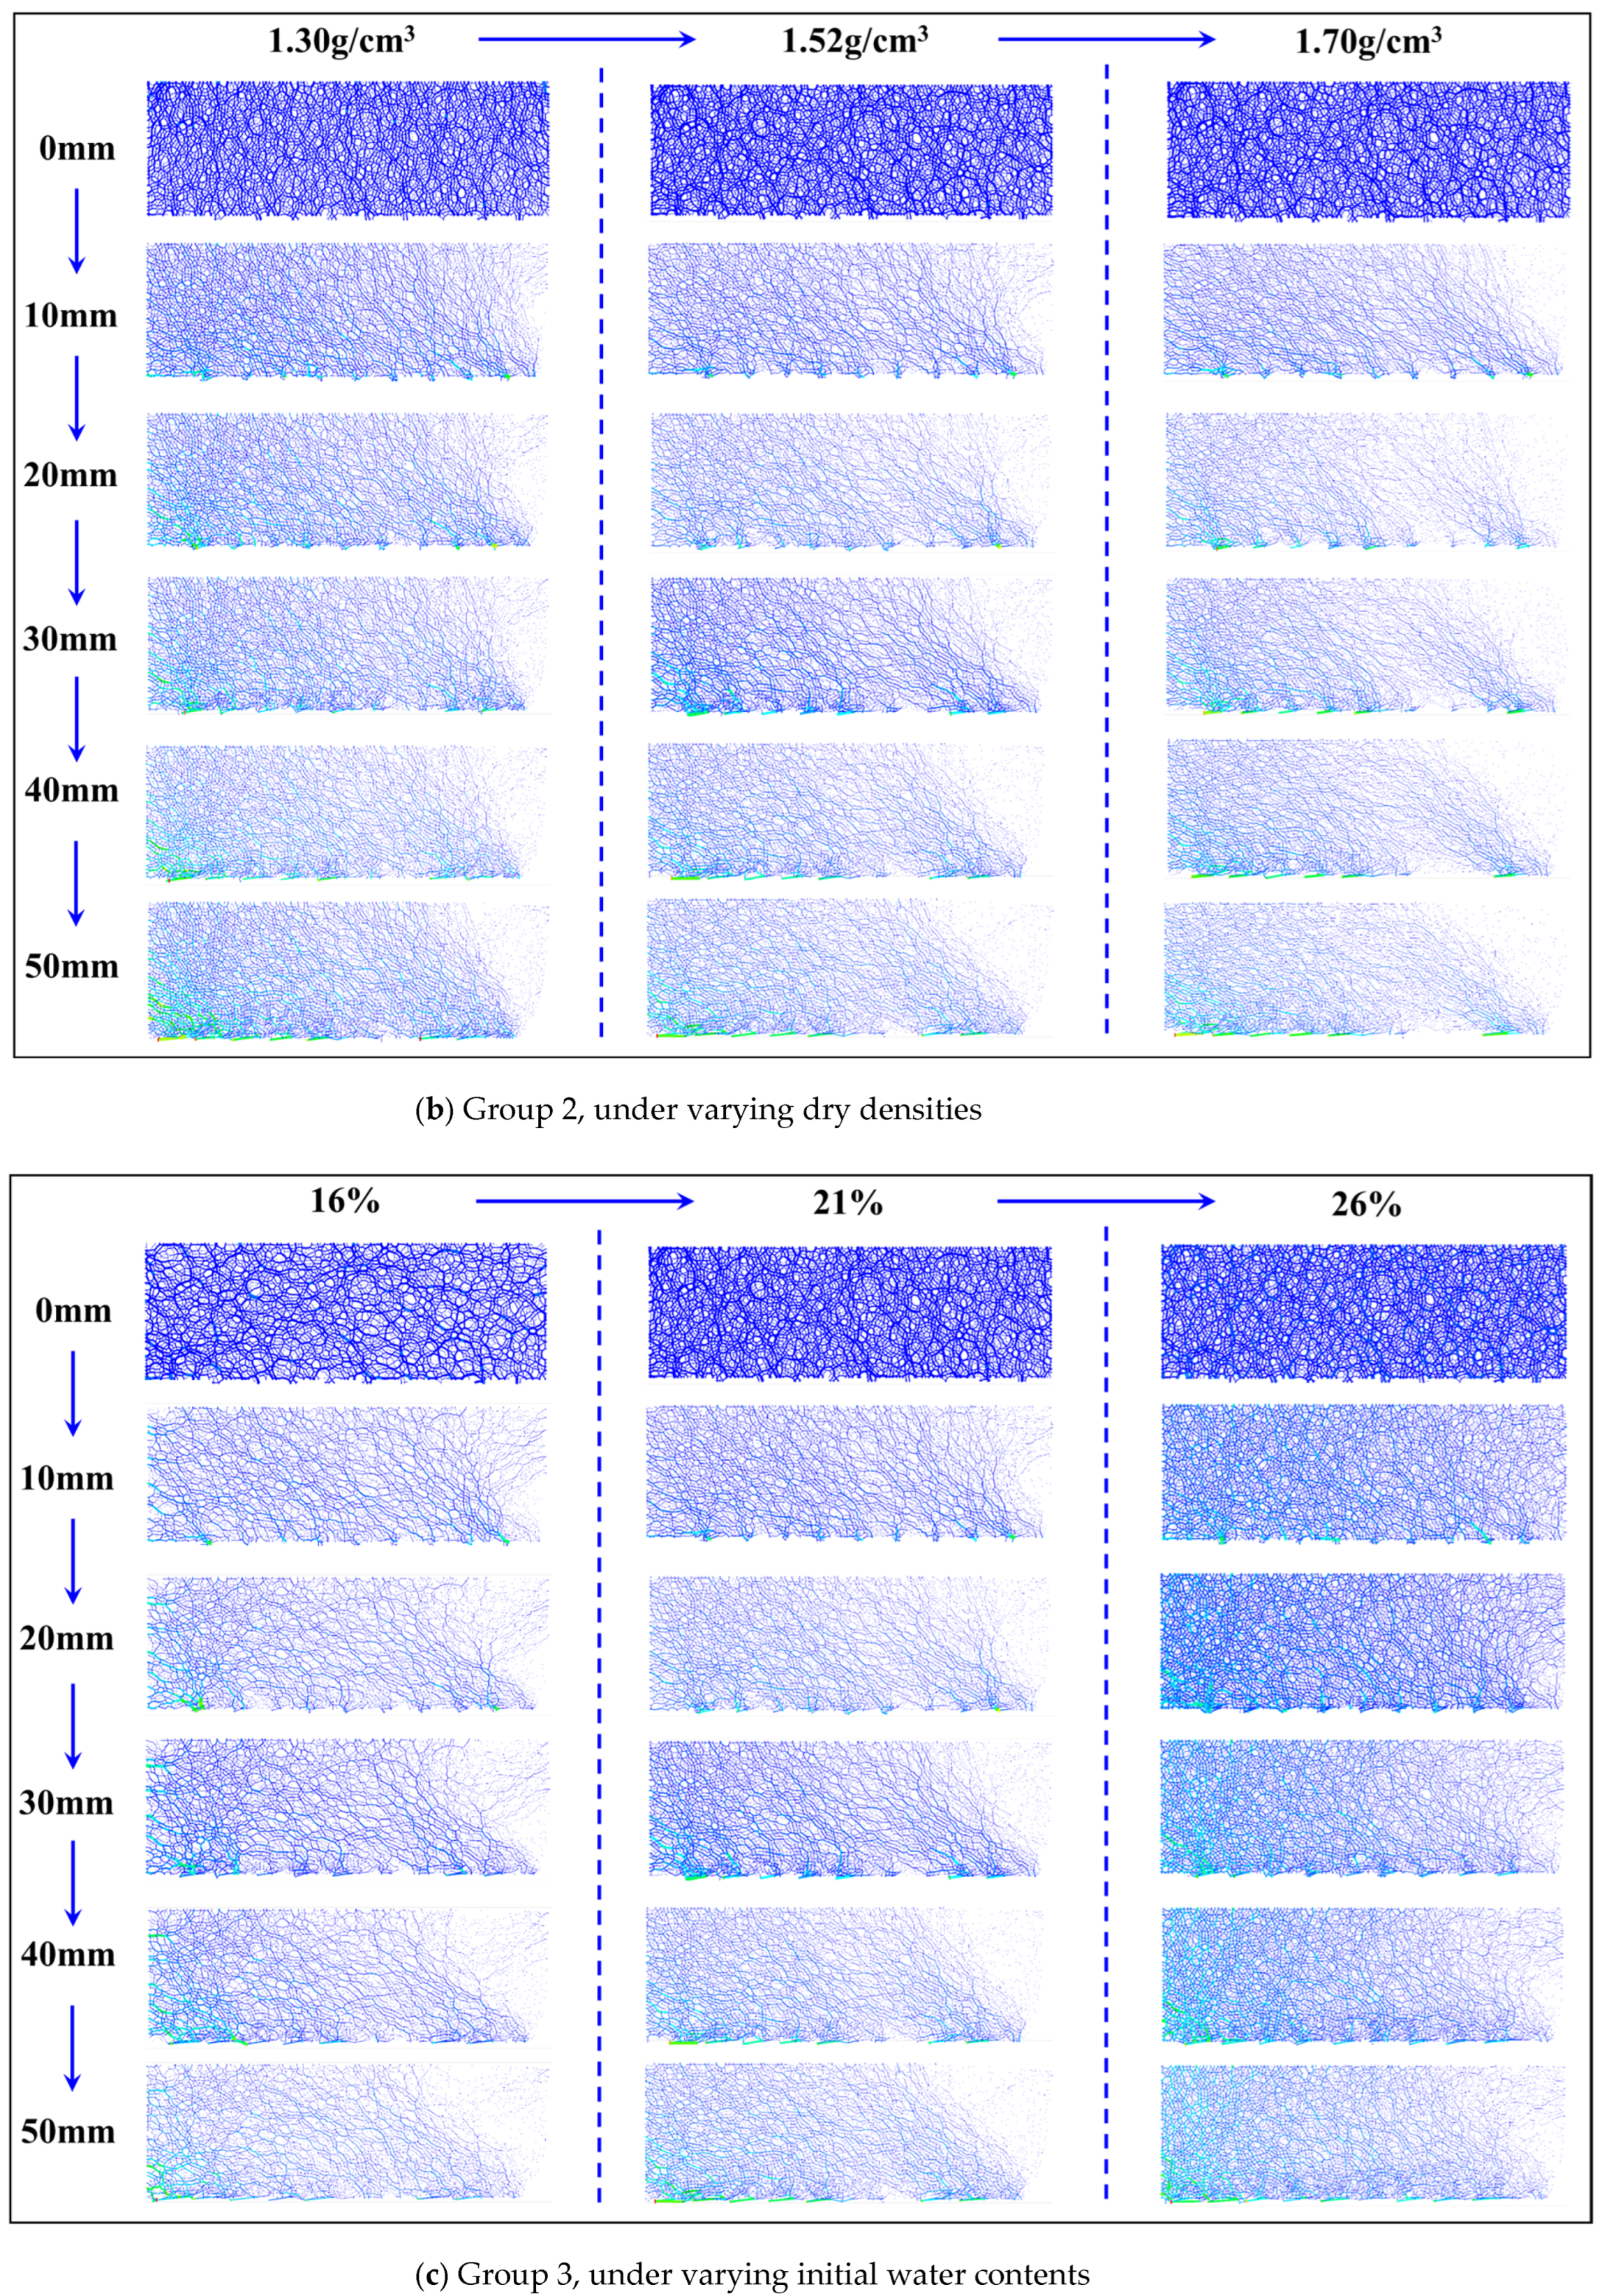
The process of force transfer among interconnected force chains is crucial for understanding the evolution of internal stress in loess particle from a microscopic perspective. Earlier research has indicated that dense arrangement of soil particles leads to their contact with neighboring particles, thereby creating a number of interlinked pathways for the transfer of external loads. These interlinked force chains create a continuous network within the particle system, which in turn promotes efficient stress transmission and mechanical coordination within the soil matrix. DEM simulation visualizes the interparticle contact forces depicted as solid lines, where the lines’ thickness is proportional to the magnitude of the forces. Such lines connect particles in a sequential manner, giving rise to what are commonly called force chains.
Figure 13 illustrates evolution of contact force chain of the loess and rough concrete interfaces. In general, before loading, the force chains are mainly vertically oriented, which is caused by vertical compaction resulting from the applied normal stress. This compaction promotes the formation of a strong anisotropic contact network aligned with the loading direction, and this network bears the majority of internal stress in early stage. With an increase in the shear displacement, the force chains that are vertical at beginning gradually incline as result of the relative sliding and rotation between particles. This restructuring process gives rise to new force chains arranged in an oblique manner. The directional arrangement of the contact force network gradually rotates toward shear-oriented direction and eventually stabilizes at approximately 45°, which corresponds to principal stress-oriented direction under conditions dominated by shear forces. From an engineering perspective, the force chain analysis provides microscopic evidence that increasing normal stress enhances the continuity and robustness of the contact network, thereby improving shear strength. Conversely, higher water content disrupts the integrity of force chains, reducing the efficiency of stress transfer and weakening the interface resistance.

3.3.4. Fabric of Loess Sample

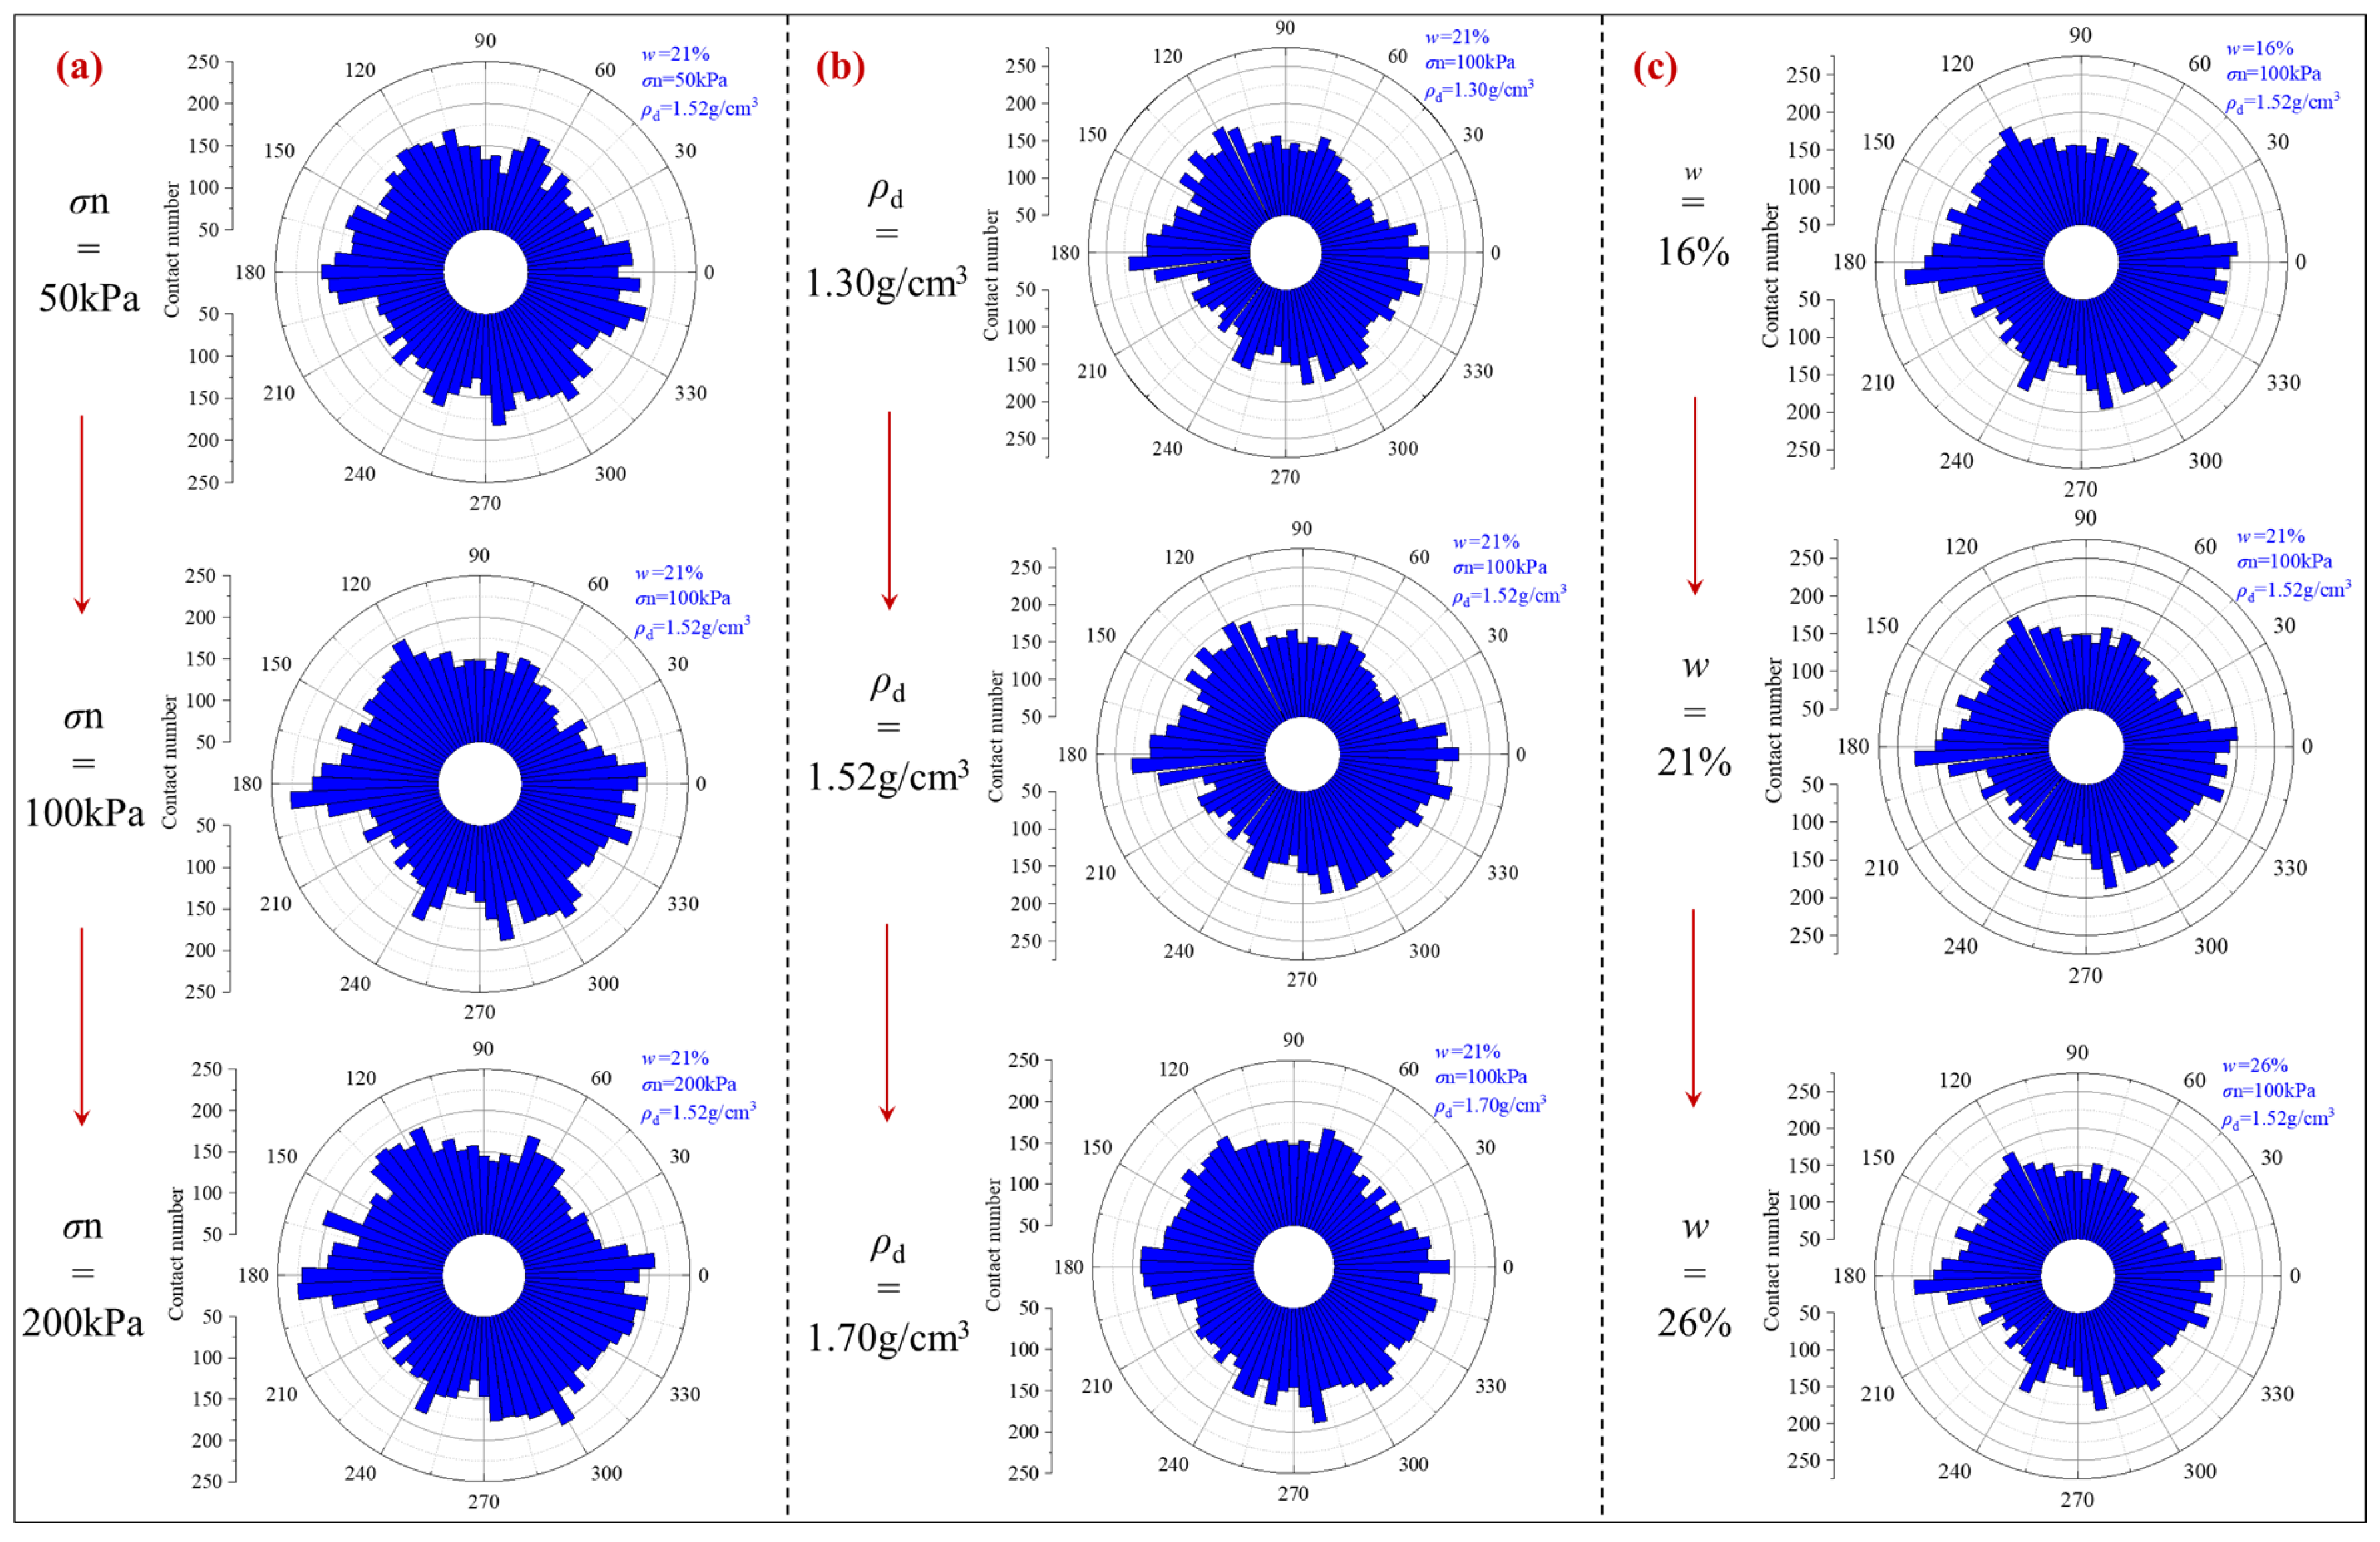
Fabric can serve to characterize the spatial distribution of particles and microscopic changes in contact orientations. The anisotropy of loess at the microscopic scale was studied through DEM simulation. Figure 14 shows the distribution of fabric under conditions of various normal stress, dry densities and initial moisture contents. Before the initiation of shearing, the distribution shape of contact forces among soil particles was about circular, and the soil particle displayed isotropic properties. After the completion of shearing, its shape transformed from a circular form to an elliptical one, and the interparticle contact forces exhibited an obvious main direction. Along direction of the long axis, the main direction was consistent with the direction of the aforementioned strong chains. When the displacement remained constant, the contact force showed an increasing trend with the increase of normal stress. Under high normal stress, the loess sample became compressed, leading to an increase in the number of interparticle contacts. As a result, the contact force increased, and the fabric diagram expanded outward.
In addition, increasing dry density promoted denser particle packing, which strengthened directional anisotropy and facilitated the development of a clearer dominant orientation in the fabric. Conversely, higher initial water content weakened interparticle bonding and reduced fabric anisotropy, as the lubrication effect of water diminished the efficiency of contact force transfer. These trends are consistent with the macroscopic shear strength results, where higher dry density and normal stress enhanced interface strength, while increased water content led to weakening.
From a micro-mechanical perspective, the transition of the fabric diagram from circular to elliptical indicates the gradual establishment of force chain dominance and the formation of shear bands, providing a microscopic explanation for the observed stress–displacement behavior. From an engineering standpoint, fabric analysis highlights that maintaining adequate compaction and controlling moisture content are critical for ensuring the stability of loess–concrete interfaces in pile-supported structures.

4. Conclusions

Based on the experimental and DEM simulation investigation of the shear behavior of the loess and rough concrete interfaces, some preliminary findings are drawn as follows.
(1)
The maximum shear deformation of the loess increased with the increase in initial moisture content, and decreased with the increase in dry density and normal stress;
(2)
The shear strength of loess-concrete rough interface increased with the increase in dry density and normal stress, and decreased with the increase in initial moisture content;
(3)
The DEM model can be capable of simulating the shear behaviors of interface shear test on loess and rough concretes.
(4)
The evolution of the shear deformation, contact force chain and fabric of the loess-concrete rough interface were explored by DEM simulation from micro-structural perspective.
It should be noted that this study presents some key limitations, which will be our priority to address in future work: (1) The loess adopted was remolded loess and cannot accurately reflect the undisturbed loess in the engineering practice; (2) The DEM simulation of the loess and rough concrete interface was simplified, and the deformation and destruction of loess particles were not considered. In the future, it will necessary to perform shear tests on the pile concrete-loess system in the field so as to accurately reflect the detailed conditions found in engineering practice in the Loess Plateau. Additionally, it is necessary to propose a new model incorporating bounding/crushable in the DEM simulation to advance the micromechanical modeling.
For practical application, the results suggest that higher dry density and normal stress conditions enhance the shear strength of loess and rough concrete interface, while excessive water content reduces it. Therefore, end users are recommended to ensure adequate compaction of loess foundations, control water content during construction, and consider interface roughness optimization when designing pile–supported infrastructure in loess regions. The interface strength parameters obtained can guide the design and construction of the pile-loess systems in the Chinese Loess Plateau.

Author Contributions

Conceptualization, T.W. and L.Z.; methodology, Z.Y. and J.W.; software, Z.Y.; validation, T.W., L.Z. and Z.Y.; formal analysis, L.Z. and Z.Y.; investigation, Z.Y.; resources, T.W.; data curation, J.W.; writing—original draft preparation, Z.Y.; writing—review and editing, L.Z.; visualization, Z.Y.; supervision, T.W. and L.Z.; project administration, L.Z.; funding acquisition, Z.Y. All authors have read and agreed to the published version of the manuscript.

Funding

This research was funded by Natural Science Basic Research Program of Shaanxi (2024JC-YBQN-0497), the Youth Innovation Team of Shaanxi Universities (2023–2026), and Shaanxi Postdoctoral Fund Project (2023BSHEDDZZ271).

Data Availability Statement

The data presented in this study are available on request from the corresponding author.

Conflicts of Interest

The authors declare no conflict of interest.

References

  1. Tian, L.E.; Li, H.W.; Feng, Y.Z.; Huang, L.K.; Yang, J.; Ma, F.Y.; Fan, C.Q. Study on natural grounding of helical anchor foundations for ±800 kV overhead transmission lines in self-weight collapsible loess, China. Electr. Power Syst. Res. 2025, 248, 111886. [Google Scholar]
  2. Li, L.; Zhang, D.H.; Zhang, M.; Gu, X.Q.; Xu, L.F. Load transfer model of pile-unsaturated loess interface considering hydro-mechanical coupling effects. Rock Soil Mech. 2025, 46, 1343–1355. [Google Scholar]
  3. Wang, Z.Q.; Xin, L.L.; Ye, S.H.; Wu, J.; Ye, W.A.; Li, J.B. Study on negative friction of pile foundation in homogeneous layered soil in collapsible loess area. Sci. Rep. 2025, 15, 6540. [Google Scholar] [CrossRef] [PubMed]
  4. Ma, T.Z.; Guo, B.W.; Wang, Z.Z.; Liu, Z.P. Settlement Analysis of Single Piles Incorporating Effective Pile Length and Interface Behavior. Geotech. Geol. Eng. 2025, 43, 316. [Google Scholar] [CrossRef]
  5. Bolisetti, C.; Whittaker, A.S. Numerical investigations of structure-soil-structure interaction in buildings. Eng. Struct. 2020, 215, 110709. [Google Scholar] [CrossRef]
  6. Liu, X.X.; Huang, H.; Liu, X.; Wang, L.; Liu, Q.H.; Liu, Y.H. A calculation method for uneven collapsible deformation of soil between compaction piles in loess area. Bull. Eng. Geol. Environ. 2025, 84, 387. [Google Scholar] [CrossRef]
  7. Lin, C.; Wang, G.; Guan, C.; Feng, D.; Zhang, F. Experimental study on the shear characteristics of different pile-soil interfaces and the influencing factors. Cold Reg. Sci. Technol. 2023, 206, 103739. [Google Scholar] [CrossRef]
  8. Yin, K.; Fauchille, A.-L.; Vasilescu, R.; Dano, C.; Kotronis, P.; Sciarra, G. Influence of clay fraction on the shear behavior of an interface between sand-clay mixture and concrete. Geomech. Energy Environ. 2024, 38, 100543. [Google Scholar] [CrossRef]
  9. Li, M.; Li, Y.; Islam, M.R. Effects of water content and interface roughness on the shear strength of silt–cement mortar interface. Soils Found. 2021, 61, 1615–1629. [Google Scholar] [CrossRef]
  10. Sun, Y.; Sumelka, W.; He, S.; Gao, Y. Enhanced Fractional Model for Soil–Structure Interface Considering 3D Stress State and Fabric Effect. J. Eng. Mech. 2022, 148, 4022054. [Google Scholar] [CrossRef]
  11. Fang, R.; Wang, B.; Pan, J.; Liu, J.; Wang, Z.; Wang, Q.; Ling, X. Effect of concrete surface roughness on shear strength of frozen soil–concrete interface based on 3D printing technology. Constr. Build. Mater. 2023, 366, 130158. [Google Scholar] [CrossRef]
  12. Li, H.; Fu, S.; Zhu, D.; Li, G.; Shen, S. Experimental study on the effects of triangular groove inclination angles on the mechanical behavior of sand–concrete interfaces. J. Mater. Res. Technol. 2023, 24, 159–172. [Google Scholar] [CrossRef]
  13. Liu, S.; Zhang, Q.; Ma, B.; Li, Z.; Yin, W.; Lou, Q. Study on surface roughness effect on shear behavior of concrete-soil interface. Eng. Fail. Anal. 2023, 145, 107050. [Google Scholar] [CrossRef]
  14. He, P.; Mu, Y.; Yang, Z.; Ma, W.; Dong, J.; Huang, Y. Freeze-thaw cycling impact on the shear behavior of frozen soil-concrete interface. Cold Reg. Sci. Technol. 2020, 173, 103024. [Google Scholar] [CrossRef]
  15. Zhang, P.; Fei, K.; Dai, D. Modeling of granular soil-structure interface under monotonic and cyclic loading with the nonlinear approach. Comput. Geotech. 2023, 159, 105480. [Google Scholar] [CrossRef]
  16. Xiong, B.; Liu, J.X.; Bayat, M.; Feng, W.Q.; Fang, Y.F.; Mousavi, Z. Comparison study of silty clay-gravel mixture-geotextile interface without and with polyurethane foam adhesive injection. Case Stud. Constr. Mater. 2025, 22, e04791. [Google Scholar] [CrossRef]
  17. Cui, H.; Xiao, Y.; Shu, S.Z.; He, X.; Liu, H.L. A constitutive model incorporating particle breakage for gravelly soil-structure interface under cyclic loading. Sci. China Technol. Sci. 2022, 65, 2846–2855. [Google Scholar] [CrossRef]
  18. Stoltz, G.; Nicaise, S.; Veylon, G.; Poulain, D. Determination of geomembrane—Protective geotextile friction angle: An insight into the shear rate effect. Geotext. Geomembr. 2020, 48, 176–189. [Google Scholar] [CrossRef]
  19. Mohammad, H.; Abbas, S. DEM-aided study of Coulomb and Roscoe theories for shear band inclination. Acta Geotech. 2022, 17, 3357–3375. [Google Scholar] [CrossRef]
  20. Pan, J.; Wang, B.; Wang, Q.; Ling, X.; Fang, R.; Liu, J.; Wang, Z. Thickness of the shear band of silty clay–concrete interface based on the particle image velocimetry technique. Constr. Build. Mater. 2023, 388, 131712. [Google Scholar] [CrossRef]
  21. Pang, L.; Jiang, C.; Zhang, C. An analytical method for predicting the soil-structure interaction of axially loaded piles in sands incorporating the two-surface plasticity model. Eng. Struct. 2023, 295, 116841. [Google Scholar] [CrossRef]
  22. Ranjbar, A.; Hassani, H.; Shahriar, K.; Shahrabi, M.J.A. Thermo-hydro-mechanical modeling of fault discontinuities using zero-thickness interface element. J. Rock Mech. Geotech. Eng. 2020, 12, 74–88. [Google Scholar] [CrossRef]
  23. Yang, J.; Yin, Z.Y. Soil-structure interface modeling with the nonlinear incremental approach. Int. J. Numer. Anal. Methods Geomech. 2021, 45, 1381–1404. [Google Scholar] [CrossRef]
  24. Su, D.; Wu, D.; Fan, M.; Zhang, R.; Chen, J.; Xiong, H.; Chen, X. DEM investigation into the coupling effects of particle asphericity and interface roughness on shear behaviour of soil-structure interface. Particuology 2025, 97, 39–57. [Google Scholar] [CrossRef]
  25. Yang, X.; Xu, Z.; Chai, J.; Qin, Y.; Cao, J. Numerical investigation of the seepage mechanism and characteristics of soil-structure interface by CFD-DEM coupling method. Comput. Geotech. 2023, 159, 105430. [Google Scholar] [CrossRef]
  26. Wang, P.; Yin, Z.Y.; Zhou, W.H.; Chen, W. Micro-mechanical analysis of soil–structure interface behavior under constant normal stiffness condition with DEM. Acta Geotech. 2022, 17, 2711–2733. [Google Scholar] [CrossRef]
  27. Wang, P.; Yin, Z.-Y. Effect of particle breakage on the behavior of soil-structure interface under constant normal stiffness condition with DEM. Comput. Geotech. 2022, 147, 104766. [Google Scholar] [CrossRef]
  28. Wan, X.; Zhou, H.; Zhou, F.; Zhu, J.; Shahab, K.M. Mesoscopic shear evolution characteristics of frozen soil-concrete interface. Cold Reg. Sci. Technol. 2025, 229, 104342. [Google Scholar] [CrossRef]
  29. Ji, Y.K.; Zhou, G.Q.; Vandeginste, V.; Zhou, Y. Thermal-hydraulic-mechanical coupling behavior and frost heave mitigation in freezing soil. Bull. Eng. Geol. Environ. 2021, 80, 2701–2713. [Google Scholar] [CrossRef]
  30. Yin, K.; Fauchille, A.L.; Filippo, E.; Kotronis, P.; Sciarra, G. A review of sand–clay mixture and soil–structure interface direct shear test. Geotechnics 2021, 1, 260–306. [Google Scholar] [CrossRef]
  31. Xiao, S.; Zhang, Y.; Yang, Y.; Gao, Y.; Song, Z. An elastoplastic model for unsaturated soil-structure interfaces considering different initial states, boundary conditions and suctions. Comput. Geotech. 2024, 167, 106123. [Google Scholar] [CrossRef]
  32. Gao, J.; Yang, Y.; Bian, X.; Zhu, G. Study on dynamic shear properties of sulfate saline soil- geotextile interface with different salt content. Soil Dyn. Earthq. Eng. 2024, 183, 108807. [Google Scholar] [CrossRef]
  33. Ghiasi, V.; Eskandari., S. Comparing a single pile’s axial bearing capacity using numerical modeling and analytical techniques. Results Eng. 2023, 17, 100893. [Google Scholar] [CrossRef]
  34. Wen, M.J.; Xu, J.M.; Xiong, H.R. Thermo-hydro-mechanical dynamic response of a cylindrical lined tunnel in a poroelastic medium with fractional thermoelastic theory. Soil Dyn. Earthq. Eng. 2020, 130, 105960. [Google Scholar] [CrossRef]
  35. Guo, H.; Lu, Y.Y.; Li, W.Y.; Dang, F.; Wang, Y.; Luo, X.Q. Dry-shrinkage of sandy clay improved by ecological fibers based on experiment and DEM simulation. Results Eng. 2025, 27, 106058. [Google Scholar] [CrossRef]
  36. Cui, X.; Li, X.; Du, Y.; Bao, Z.; Zhang, X.; Hao, J.; Hu, Y. Macro-micro numerical analysis of granular materials considering principal stress rotation based on DEM simulation of dynamic hollow cylinder test. Constr. Build. Mater. 2024, 412, 134818. [Google Scholar] [CrossRef]
  37. You, Z.; Zhang, M.; Liu, F.; Ma, Y. Numerical investigation of the tensile strength of loess using discrete element method. Eng. Fract. Mech. 2021, 247, 107610. [Google Scholar] [CrossRef]
  38. Feng, S.J.; Chen, J.N.; Chen, H.X.; Liu, X.; Zhao, T.; Zhou, A. Analysis of sand-woven geotextile interface shear behavior using discrete element method (DEM). Can. Geotech. J. 2020, 57, 433–447. [Google Scholar] [CrossRef]
  39. Nitka, M.; Grabowski, A. Shear band evolution phenomena in direct shear test modelled with DEM. Powder Technol. 2021, 391, 369–384. [Google Scholar] [CrossRef]
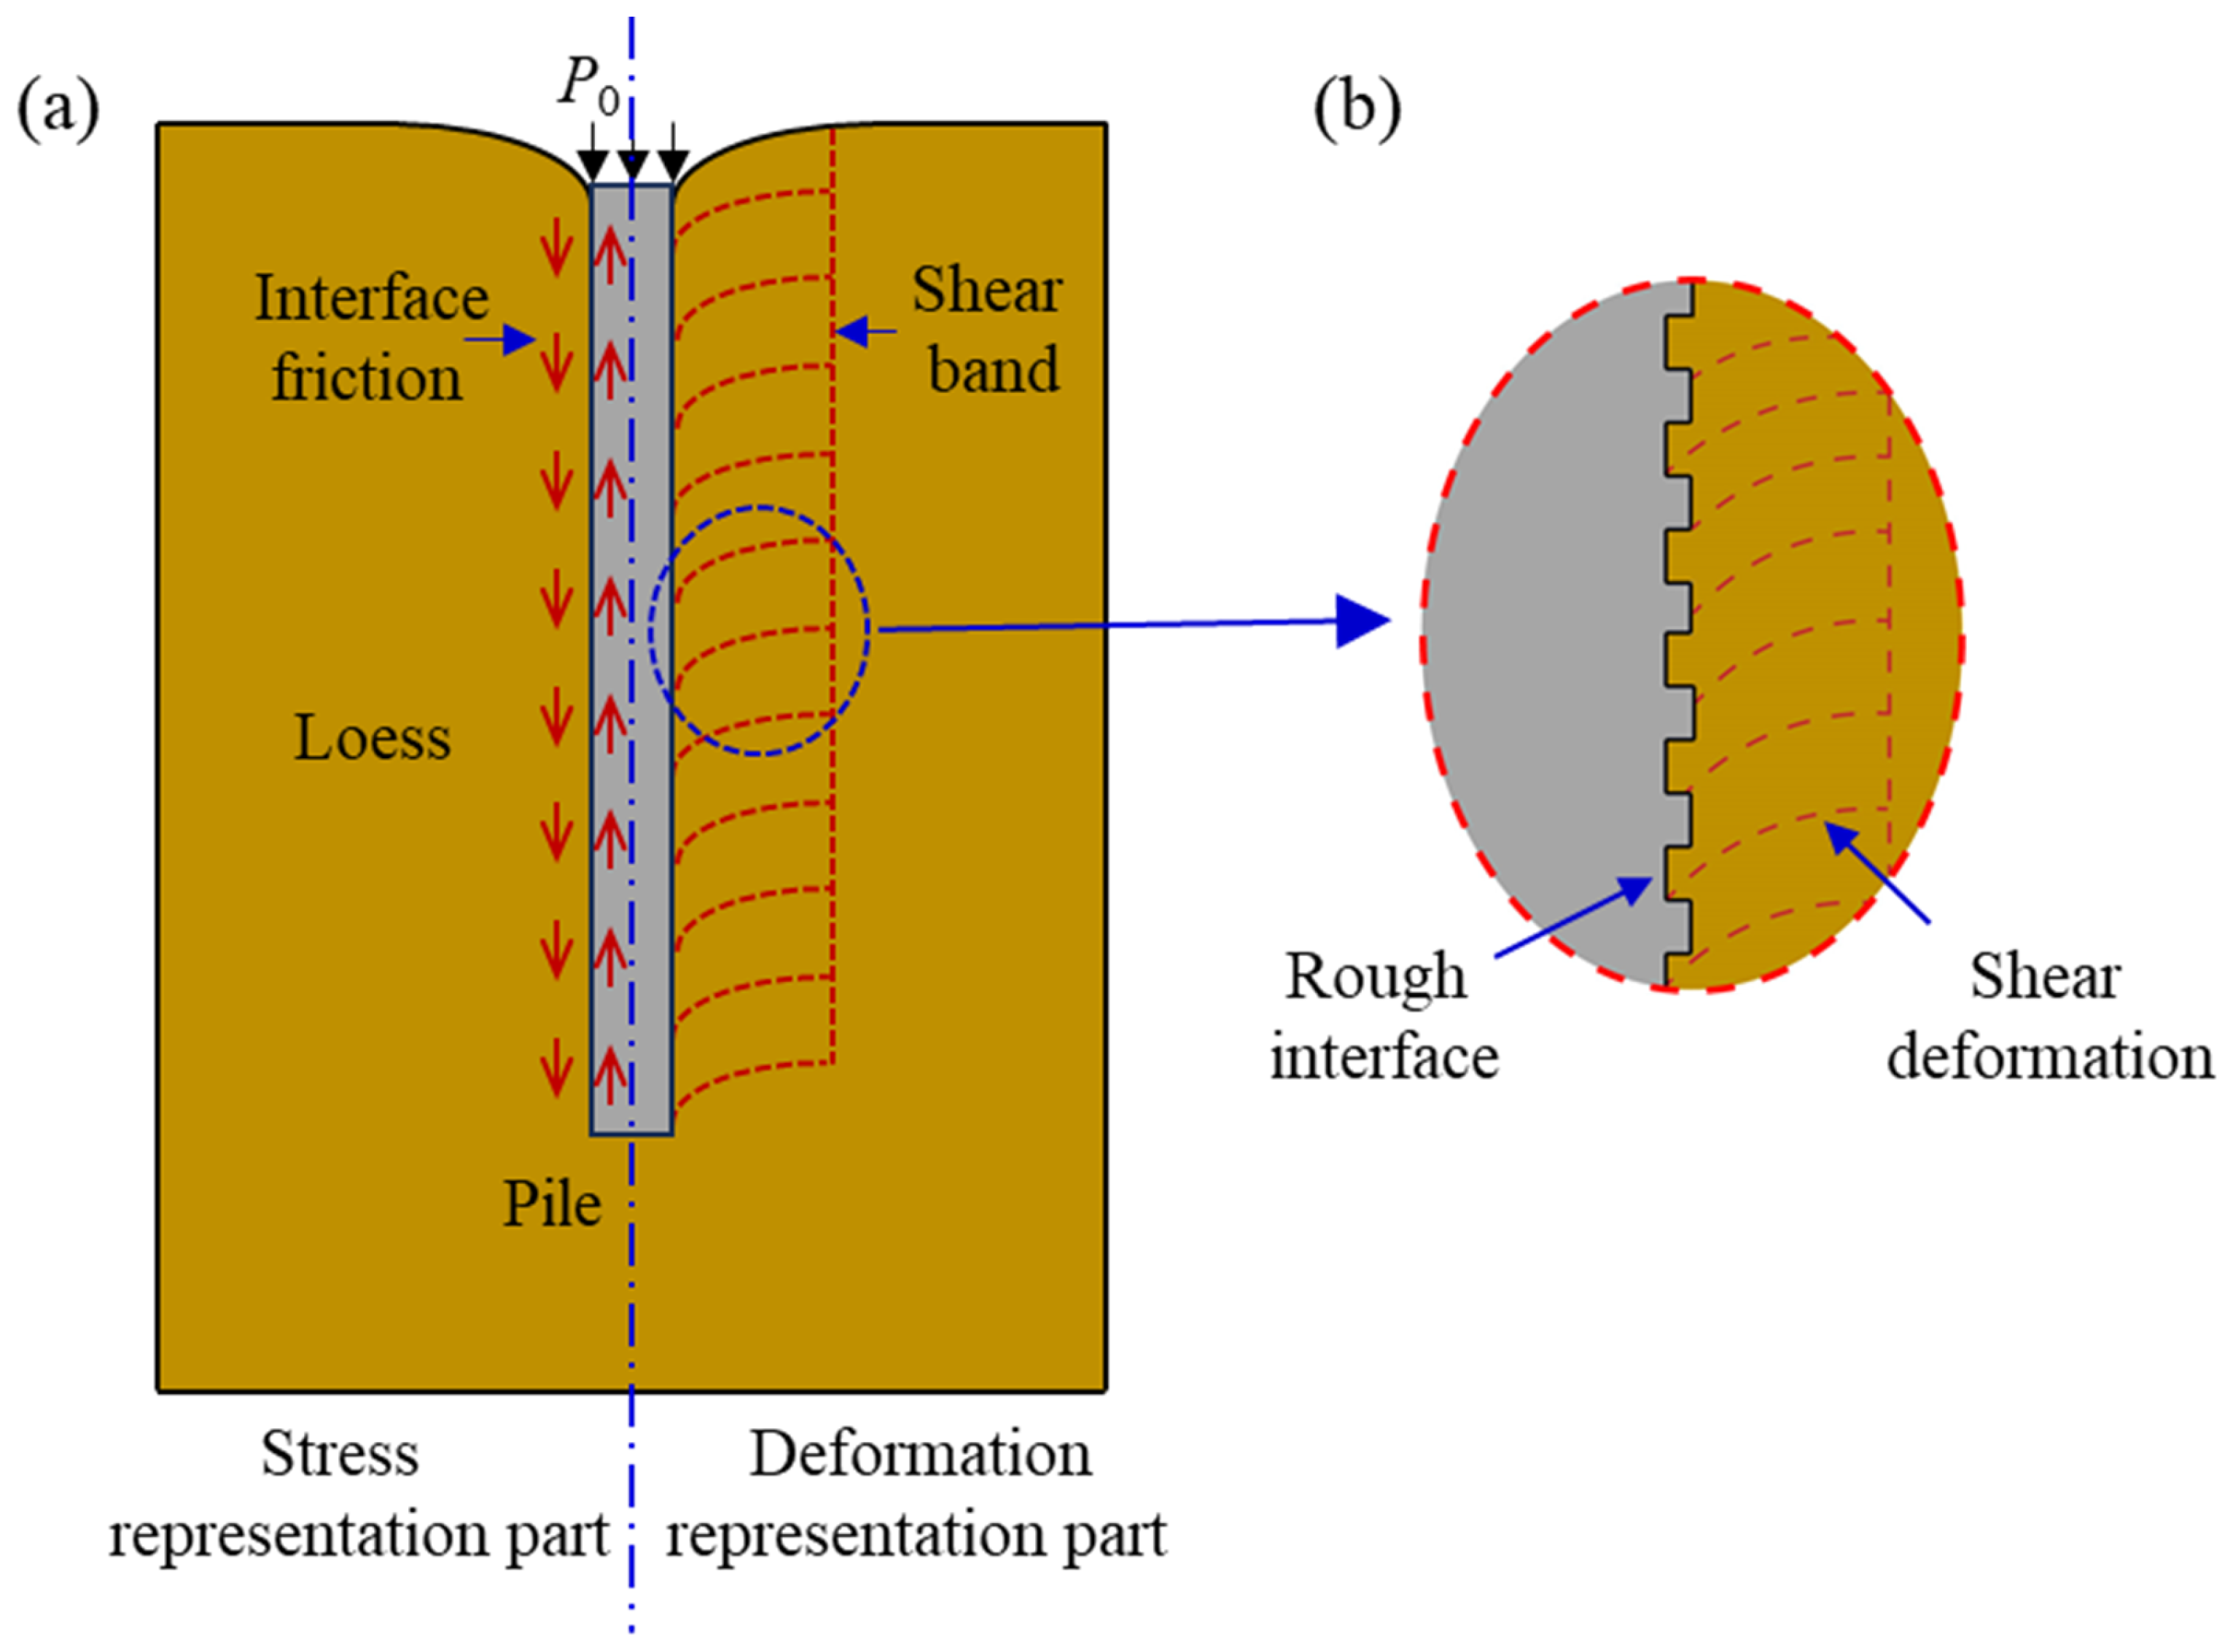
Figure 1. Concrete pile-loess system: (a) pile-loess bearing deformation; (b) concrete pile-loess system.
Buildings 15 03178 g001
Figure 2. Image and fundamental parameters of Trac III large direct shear instrument.
Buildings 15 03178 g002
Figure 3. Images of the remolded loess and C40 concrete used in the test: (a) remolded loess; (b) grain size distribution curve (c) concrete sample with rough interface.
Buildings 15 03178 g003
Figure 4. Schematic diagram and images of loess deformation monitoring with gypsum powders: (a) location of gypsum line; (b) schematic of gypsum line deformation; (c) representative image of gypsum line after experiment.
Buildings 15 03178 g004
Figure 5. Deformation characteristics at loess and rough concrete interfaces under conditions of different (a) normal stress, (b) dry densities, and (c) initial water contents.
Buildings 15 03178 g005aBuildings 15 03178 g005b
Figure 6. Shear stress-displacement curves of the loess and rough concrete interfaces under conditions of different (a) normal stresses, (b) dry densities and (c) initial water contents.
Buildings 15 03178 g006
Figure 7. DEM model of a loess and rough concrete interface and representative image of its deformation resulting from the interface shear experiment: (a) DEM model; (b) representative image.
Buildings 15 03178 g007
Figure 8. Comparing the measured shear stress-displacement curve with simulated one.
Buildings 15 03178 g008
Figure 9. Comparison of the measured and simulated shear deformation of the loess after shear test on loess-concrete rough interface.
Buildings 15 03178 g009
Figure 10. Comparisons on the shear stress-displacement curves obtained from simulation and measurement.
Buildings 15 03178 g010aBuildings 15 03178 g010b
Figure 11. Error curve of the simulated and measured shear stress.
Buildings 15 03178 g011aBuildings 15 03178 g011b
Figure 12. Evolution of shear deformation and particle displacement of loess-concrete rough interface.
Buildings 15 03178 g012aBuildings 15 03178 g012b
Figure 13. Evolution of contact force chain of the loess-concrete interfaces.
Buildings 15 03178 g013aBuildings 15 03178 g013b
Figure 14. Distribution of Fabric under the conditions of different normal stresses (a), dry densities (b) and initial water contents (c).
Buildings 15 03178 g014
Table 1. Scheme of three groups of interface shear tests on loess and rough concretes.
Group 1Moisture content (%)Dry density (g/cm3)Normal stress (kPa)
21.01.5250
100
200
Group 2Moisture content (%)Normal stress (kPa)Dry density (g/cm3)
211001.30
1.52
1.70
Group 3Dry density (g/cm3)Normal stress (kPa)Moisture content (%)
1.5210016
21
26
Table 2. Main parameters of DEM simulation for rough loess-concrete interface.
Parameters for Loess Particles
emodpb_deform emodpb_cohpb_tenpb_fafric
2.5 × 10⁷ N/m3 × 105 N/m1 × 108 N/m1 × 108 N/m15°0.22
Parameters for rough loess-concrete interface
KsKnemodfric
1 × 10⁷ N/m1 × 107 N/m1 × 107 N/m0.25
Disclaimer/Publisher’s Note: The statements, opinions and data contained in all publications are solely those of the individual author(s) and contributor(s) and not of MDPI and/or the editor(s). MDPI and/or the editor(s) disclaim responsibility for any injury to people or property resulting from any ideas, methods, instructions or products referred to in the content.