The following subsections present the experimental data in a logical progression: material composition and index properties establish baseline classification; hydromechanical tests quantify compaction, volumetric change, and hydraulic behavior; strength and bearing tests define structural capacity; finally, the efficacy of 3.5% cement treatment is compared against untreated performance. Discussion focuses on parameters governing subgrade design.
3.1. Composition and Classification
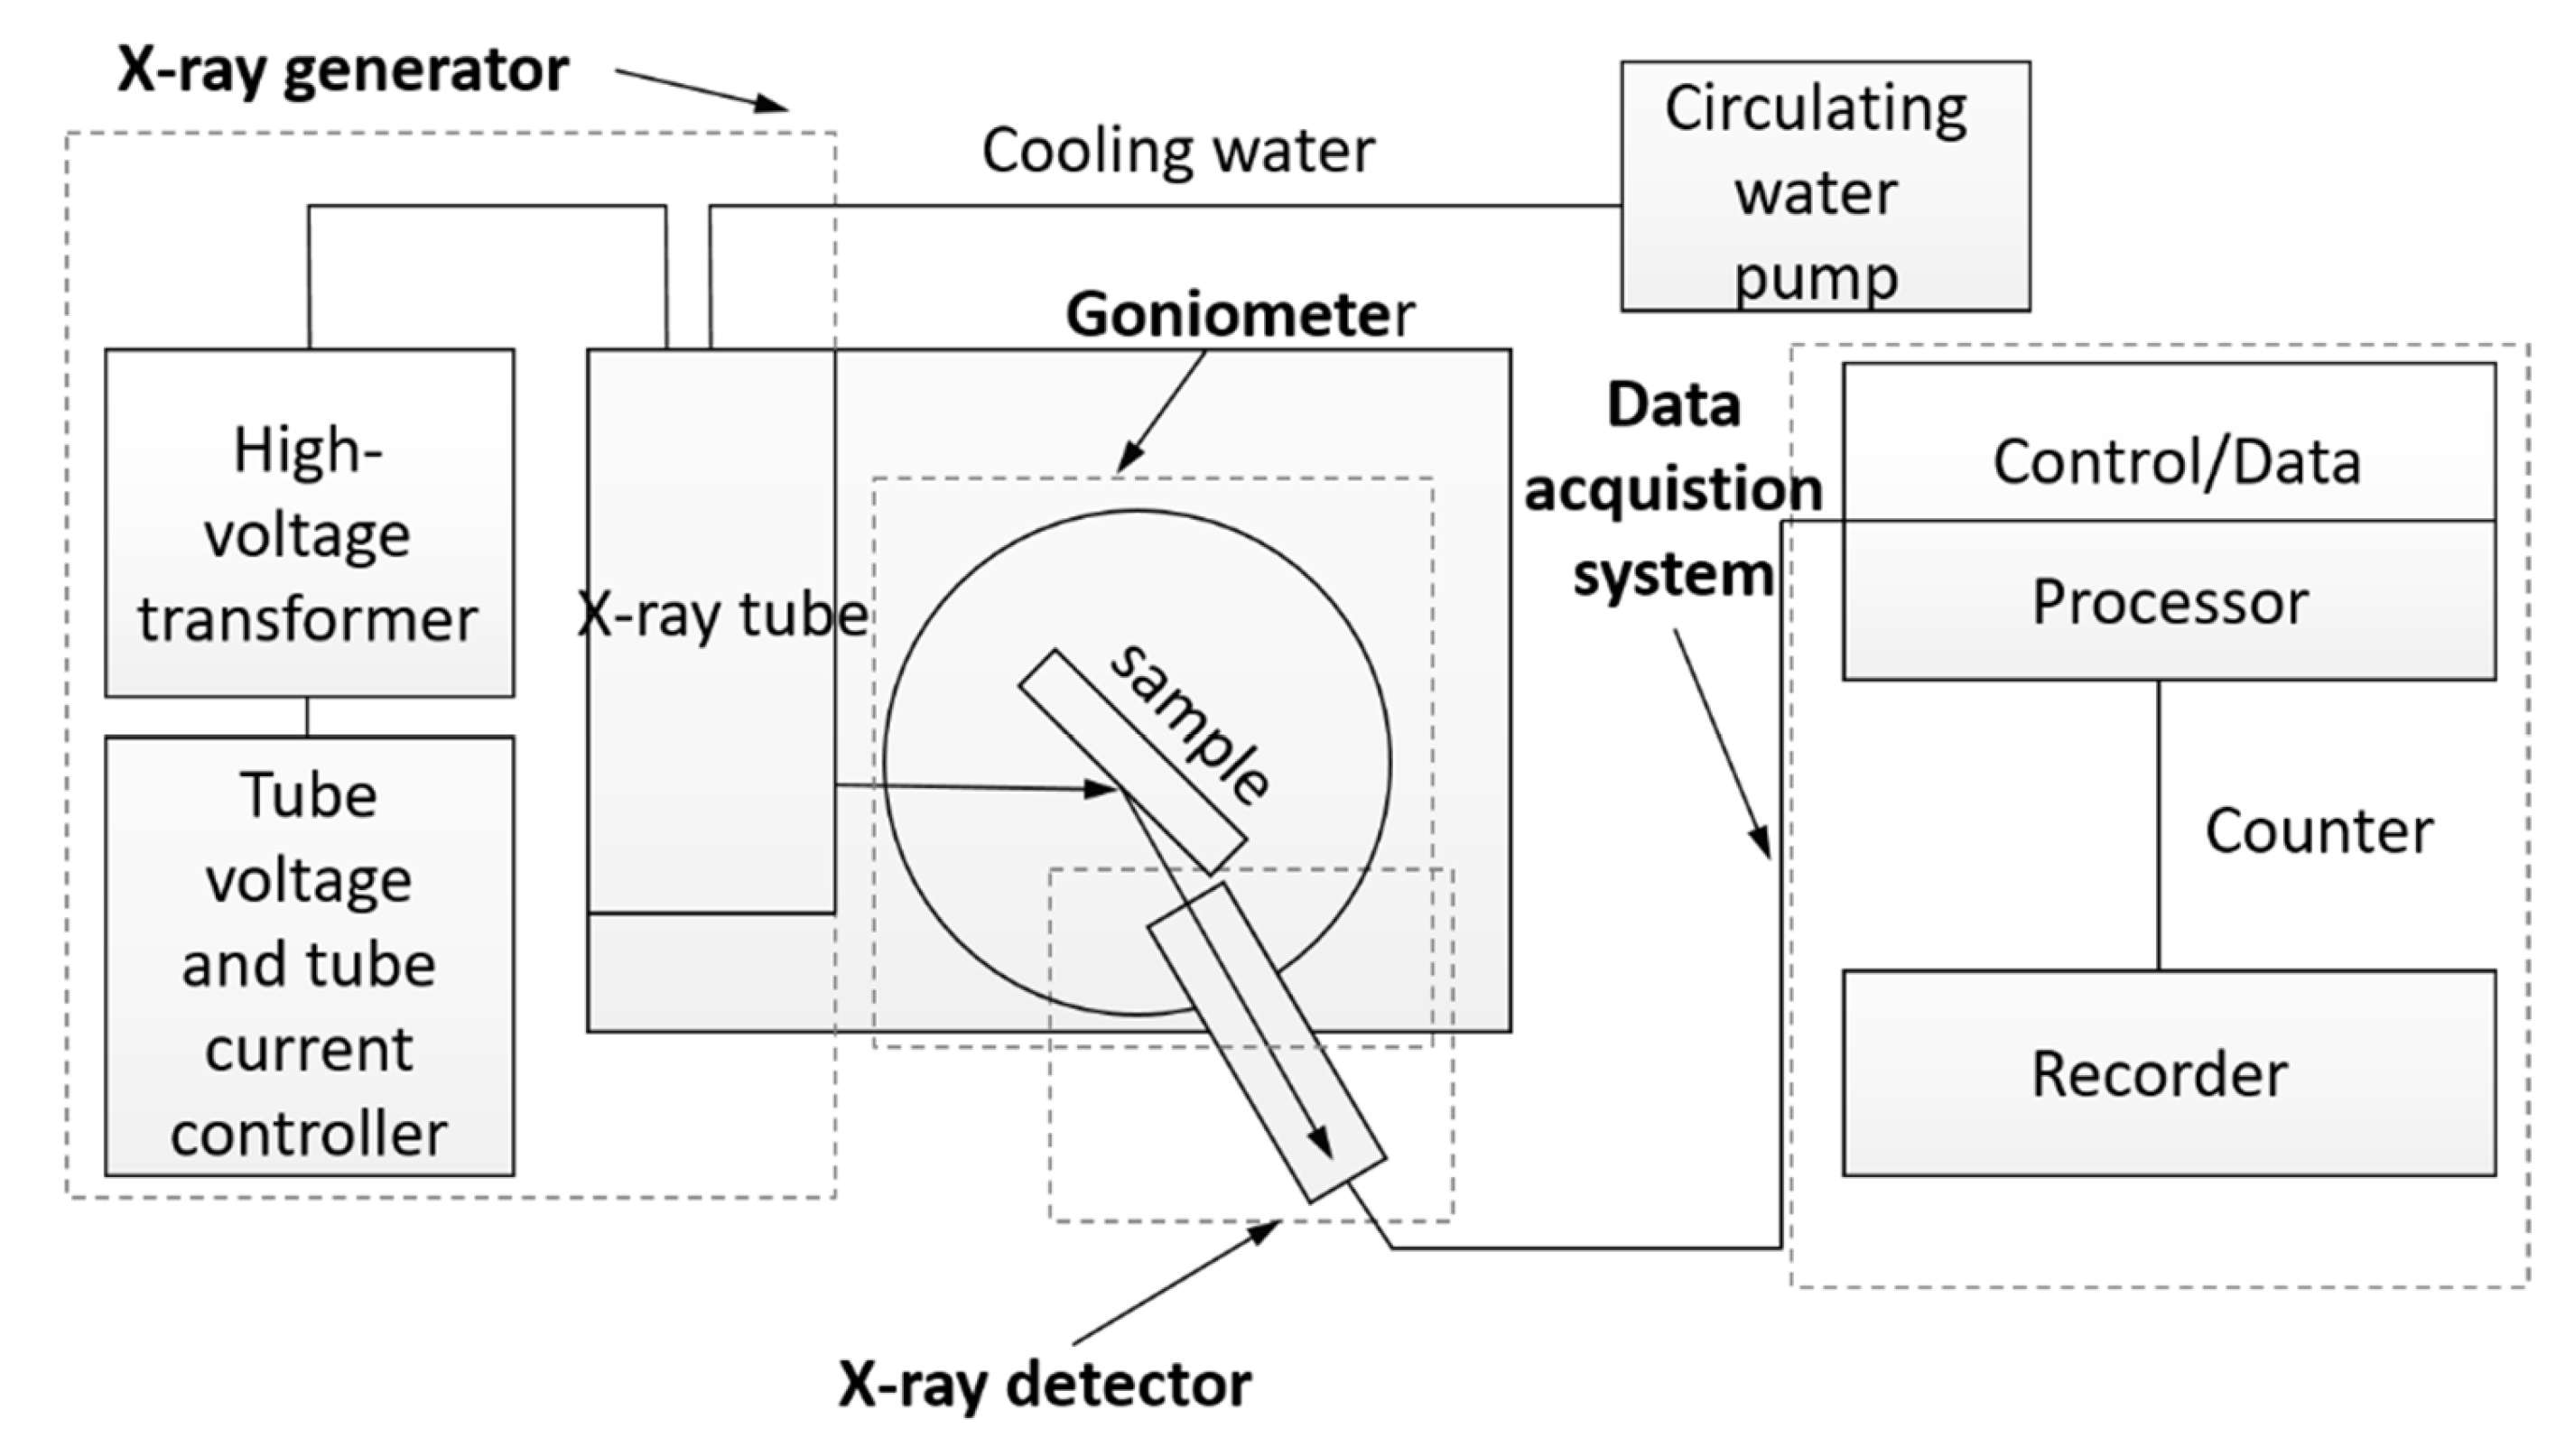
Mineralogical and chemical composition: The XRD analysis revealed that the strongly weathered soft rock fill is composed primarily of hard, non-clay minerals, with very little expansive clay content. The identified mineral constituents and their approximate weight percentages are summarized in
Table 1. The soil is dominated by quartz, which is a stable, non-reactive mineral conferring hardness to particles. The next major component is phengite, a type of iron-rich mica with a stable platy structure; this mineral is common in low-grade metamorphic rocks like phyllite. A moderate amount of K-feldspar is present, likely from the original rock’s mineralogy. Only a small proportion consists of clay minerals, specifically kaolinite and chlorite. Montmorillonite, the swelling clay responsible for high expansion in soils, was not detected in the samples. The remaining few percent is attributed to amorphous or unidentifiable matter.
The XRF chemical analysis was in agreement with the above mineralogical findings. The major oxides in the soil were silica (SiO2), alumina (Al2O3), potassium oxide (K2O), and iron oxides, corresponding to the presence of quartz, mica, and feldspar—and their abundance is consistent with the overall mineral composition.
Index properties and soil classification: Based on the laboratory tests, the fully weathered soft rock can be classified as a high liquid limit silty clay. The liquid limit (LL) was determined to be approximately 46.5%, and the plastic limit (PL) approximately 29.2%, giving a plasticity index (PI) of ≈ 17.3. According to the Unified Soil Classification System (USCS), this PI and LL would likely place the soil in the CH or MH category (borderline of clay or silt of high plasticity); given the low clay mineral content, it is more appropriate to regard it as an MH (high-plasticity silt) or a clayey silt. According to the test results in
Table 1, based on the classification standard of a 10 mm liquid limit specified in the code,
, which is between 10 and 17 mm, and
exceeds the 40% threshold. Therefore, the fully weathered soft rock fill material is classified as a high liquid limit silty clay and belongs to Group D fill, which requires modification before use.
The particle size distribution curve indicated that the material is overwhelmingly fine-grained, as shown in
Figure 6. Approximately 84.8% by weight of the soil is passing the 0.075 mm sieve (thus classified as fines).
Breaking this down further, the majority of the soil, ≈81.9%, falls into the silt-sized range (0.005 mm to 0.075 mm). The true clay-sized fraction (particles < 0.005 mm in diameter) is only approximately 2.9%. Virtually no colloidal clay (<0.002 mm) was present. On the coarse side, approximately 14.3% of the material is in the sand-sized range (0.075 mm to 5 mm), and gravel (>5 mm) content is negligible (<1%). The high silt content and poor gradation further confirm that this type of material must be improved before it can be used in practical engineering applications.
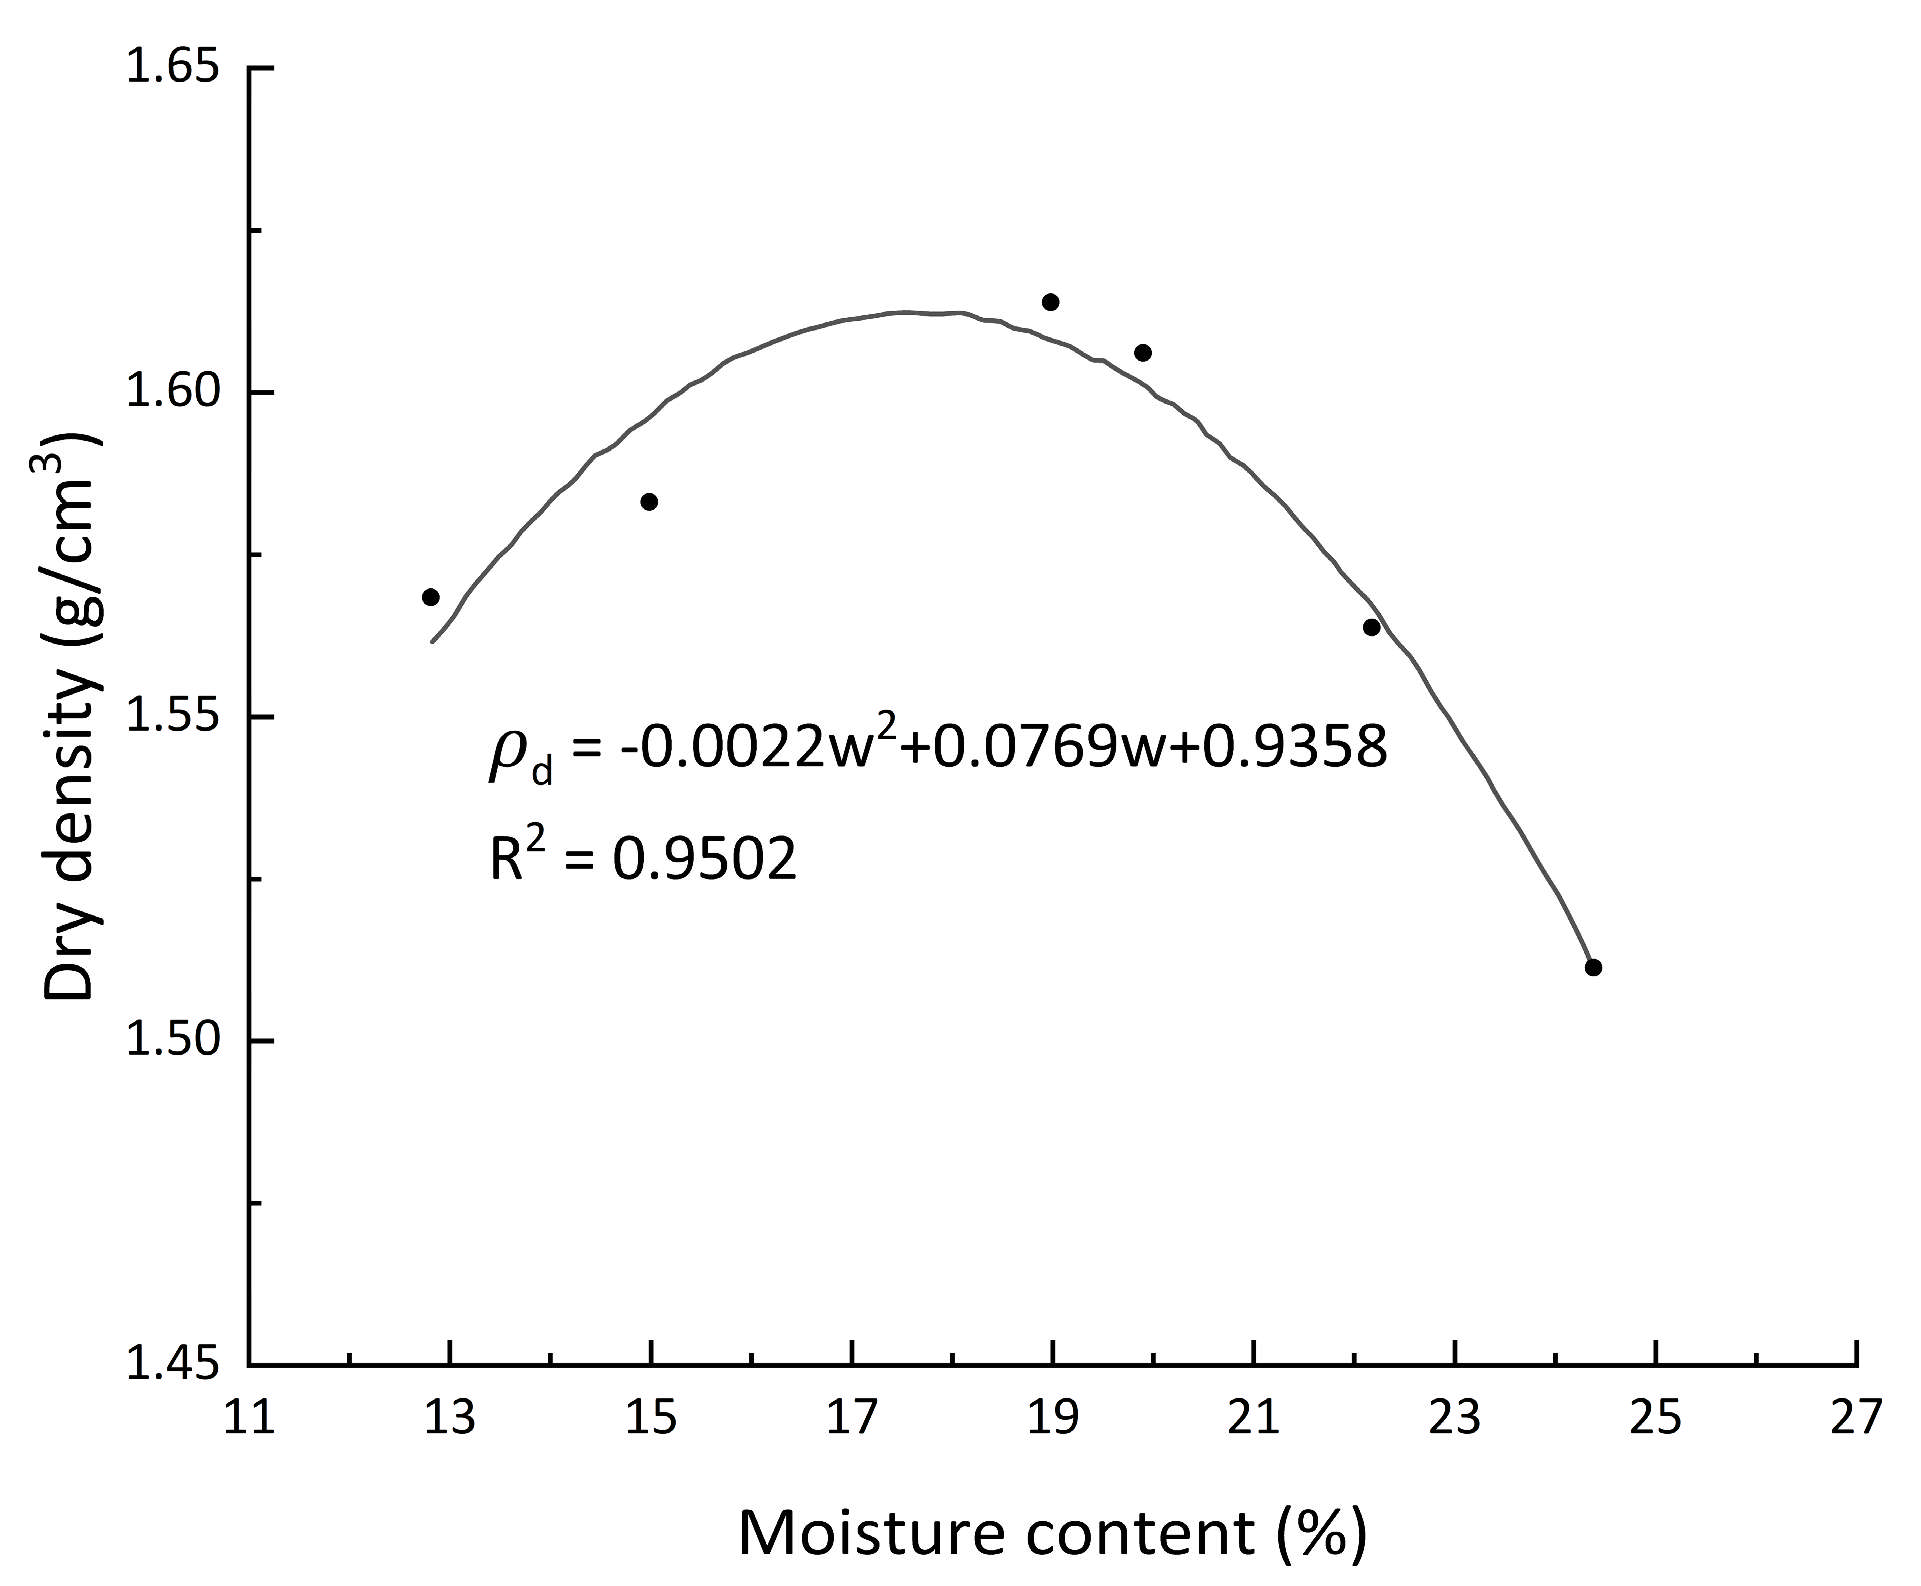
Based on the compaction energy and the maximum particle size of the fill material, the Z2 heavy compaction method for railway engineering was adopted. A quadratic polynomial was used to fit the test data, and the optimum moisture content was determined to be approximately 17.5%, with a corresponding maximum dry density of 1.61 g/cm
3, as shown in
Figure 7. Because the best-fit curve is quadratic, the optimum moisture content corresponds to the local extremum, where the first derivative of the polynomial equals zero.
Swelling and shrinkage: According to the specifications in TB 10077-2001 [
41] and GB 50112-2013 [
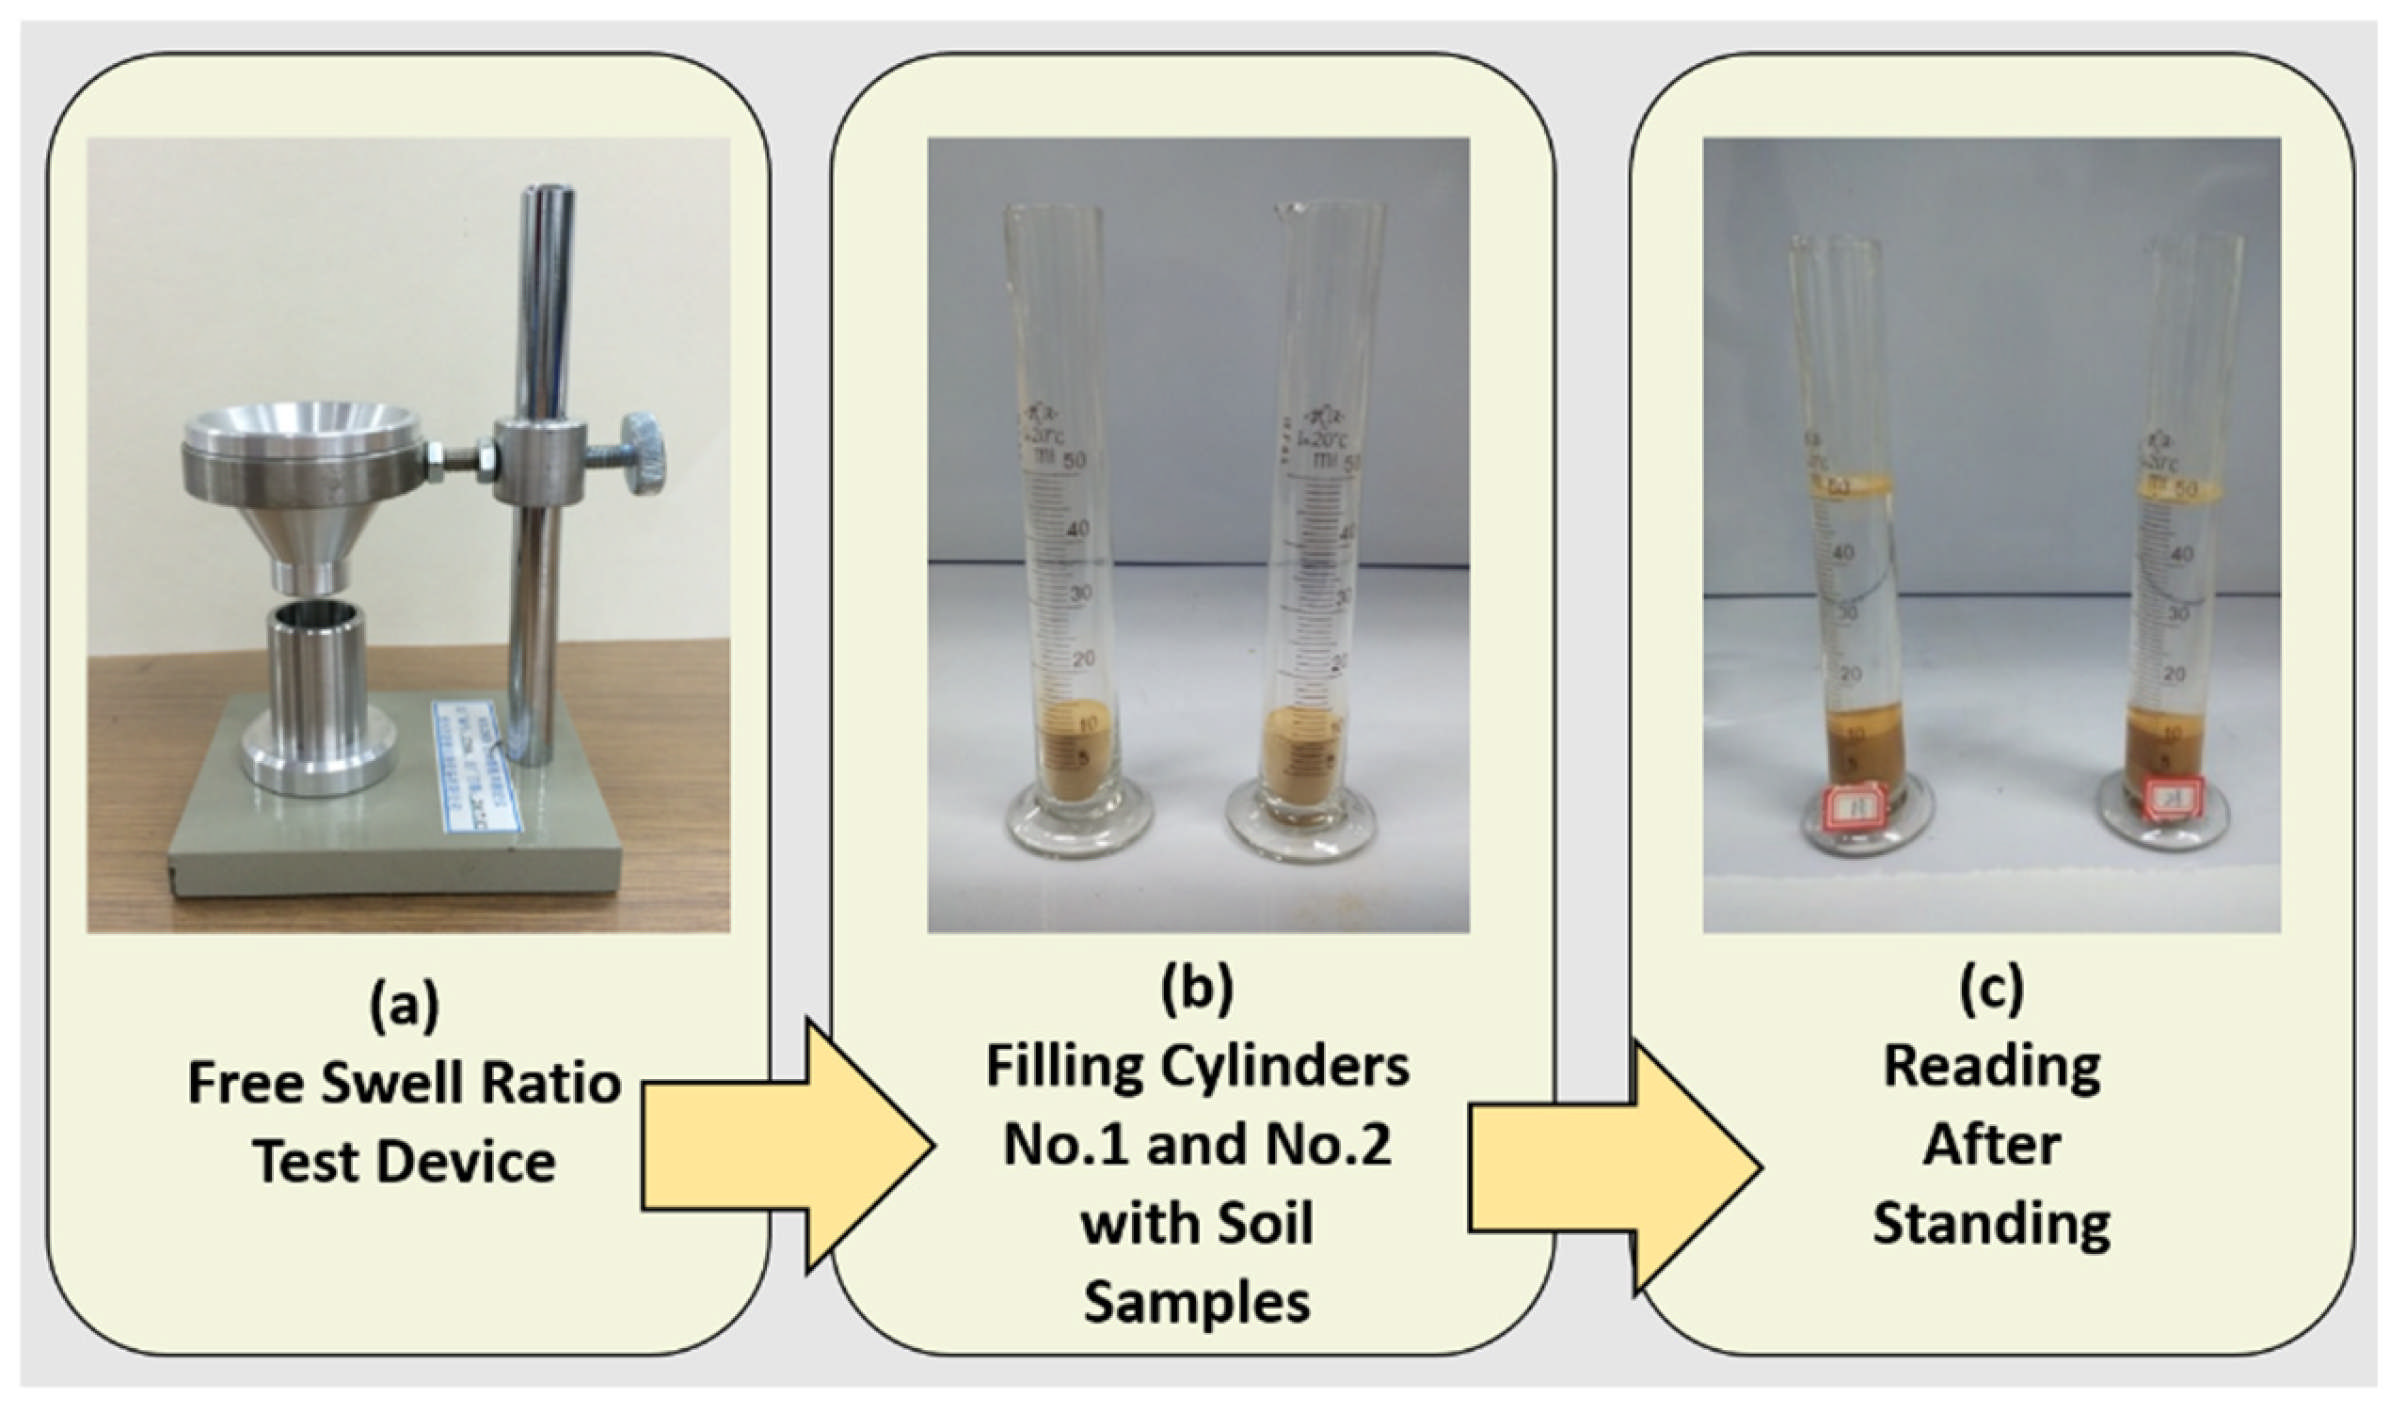
42], expansive soil is identified based on three indicators: free swell ratio, montmorillonite content, and cation exchange capacity. If any two of these indicators meet the specified thresholds, the soil should be classified as expansive. Test results showed that the free swell ratio of the fully weathered soft rock sample was 10% using Equation (1), which is below the threshold of 40%. Meanwhile, mineralogical analysis revealed no montmorillonite, indicating the fill is not expansive soil.
where
is the free swell ratio (%), rounded to one decimal place;
is the stabilized volume of the specimen after immersion (mL), and
is the initial volume of the specimen (mL).
Swell tests were conducted under an optimum moisture content of 17.5% and target compaction degrees of 90%, 95%, and 100%. The specimen’s expansion ratio is calculated using Equation (2).
where
(%) is the unloaded expansion ratio at time t, rounded to 0.1%;
and
are the dial gauge readings at time t and at the start of the test (mm), respectively;
is the initial specimen height (mm).
As shown in
Figure 8, with increasing compaction, the swell increased from 2.197 mm to 2.944 mm, and the swell ratio rose from 11.0% to 14.7%. The swelling process can be divided into three stages: rapid linear expansion (0–90 min), slow convex increase (90–390 min), and a final stable stage. The first stage accounted for approximately 69–84% of total swell, the second stage for 16–26%, and the third stage for only 0.1–4.8%. These results indicate that swelling mainly occurs in the first two stages, and higher compaction results in faster and more concentrated early-stage expansion. Nevertheless, these swell percentages are still considered low in the context of expansive soil behavior.
The swell ratio under various pressures is calculated using Equation (3).
Here, (mm) represents the compressive deformation of the apparatus under pressure P.
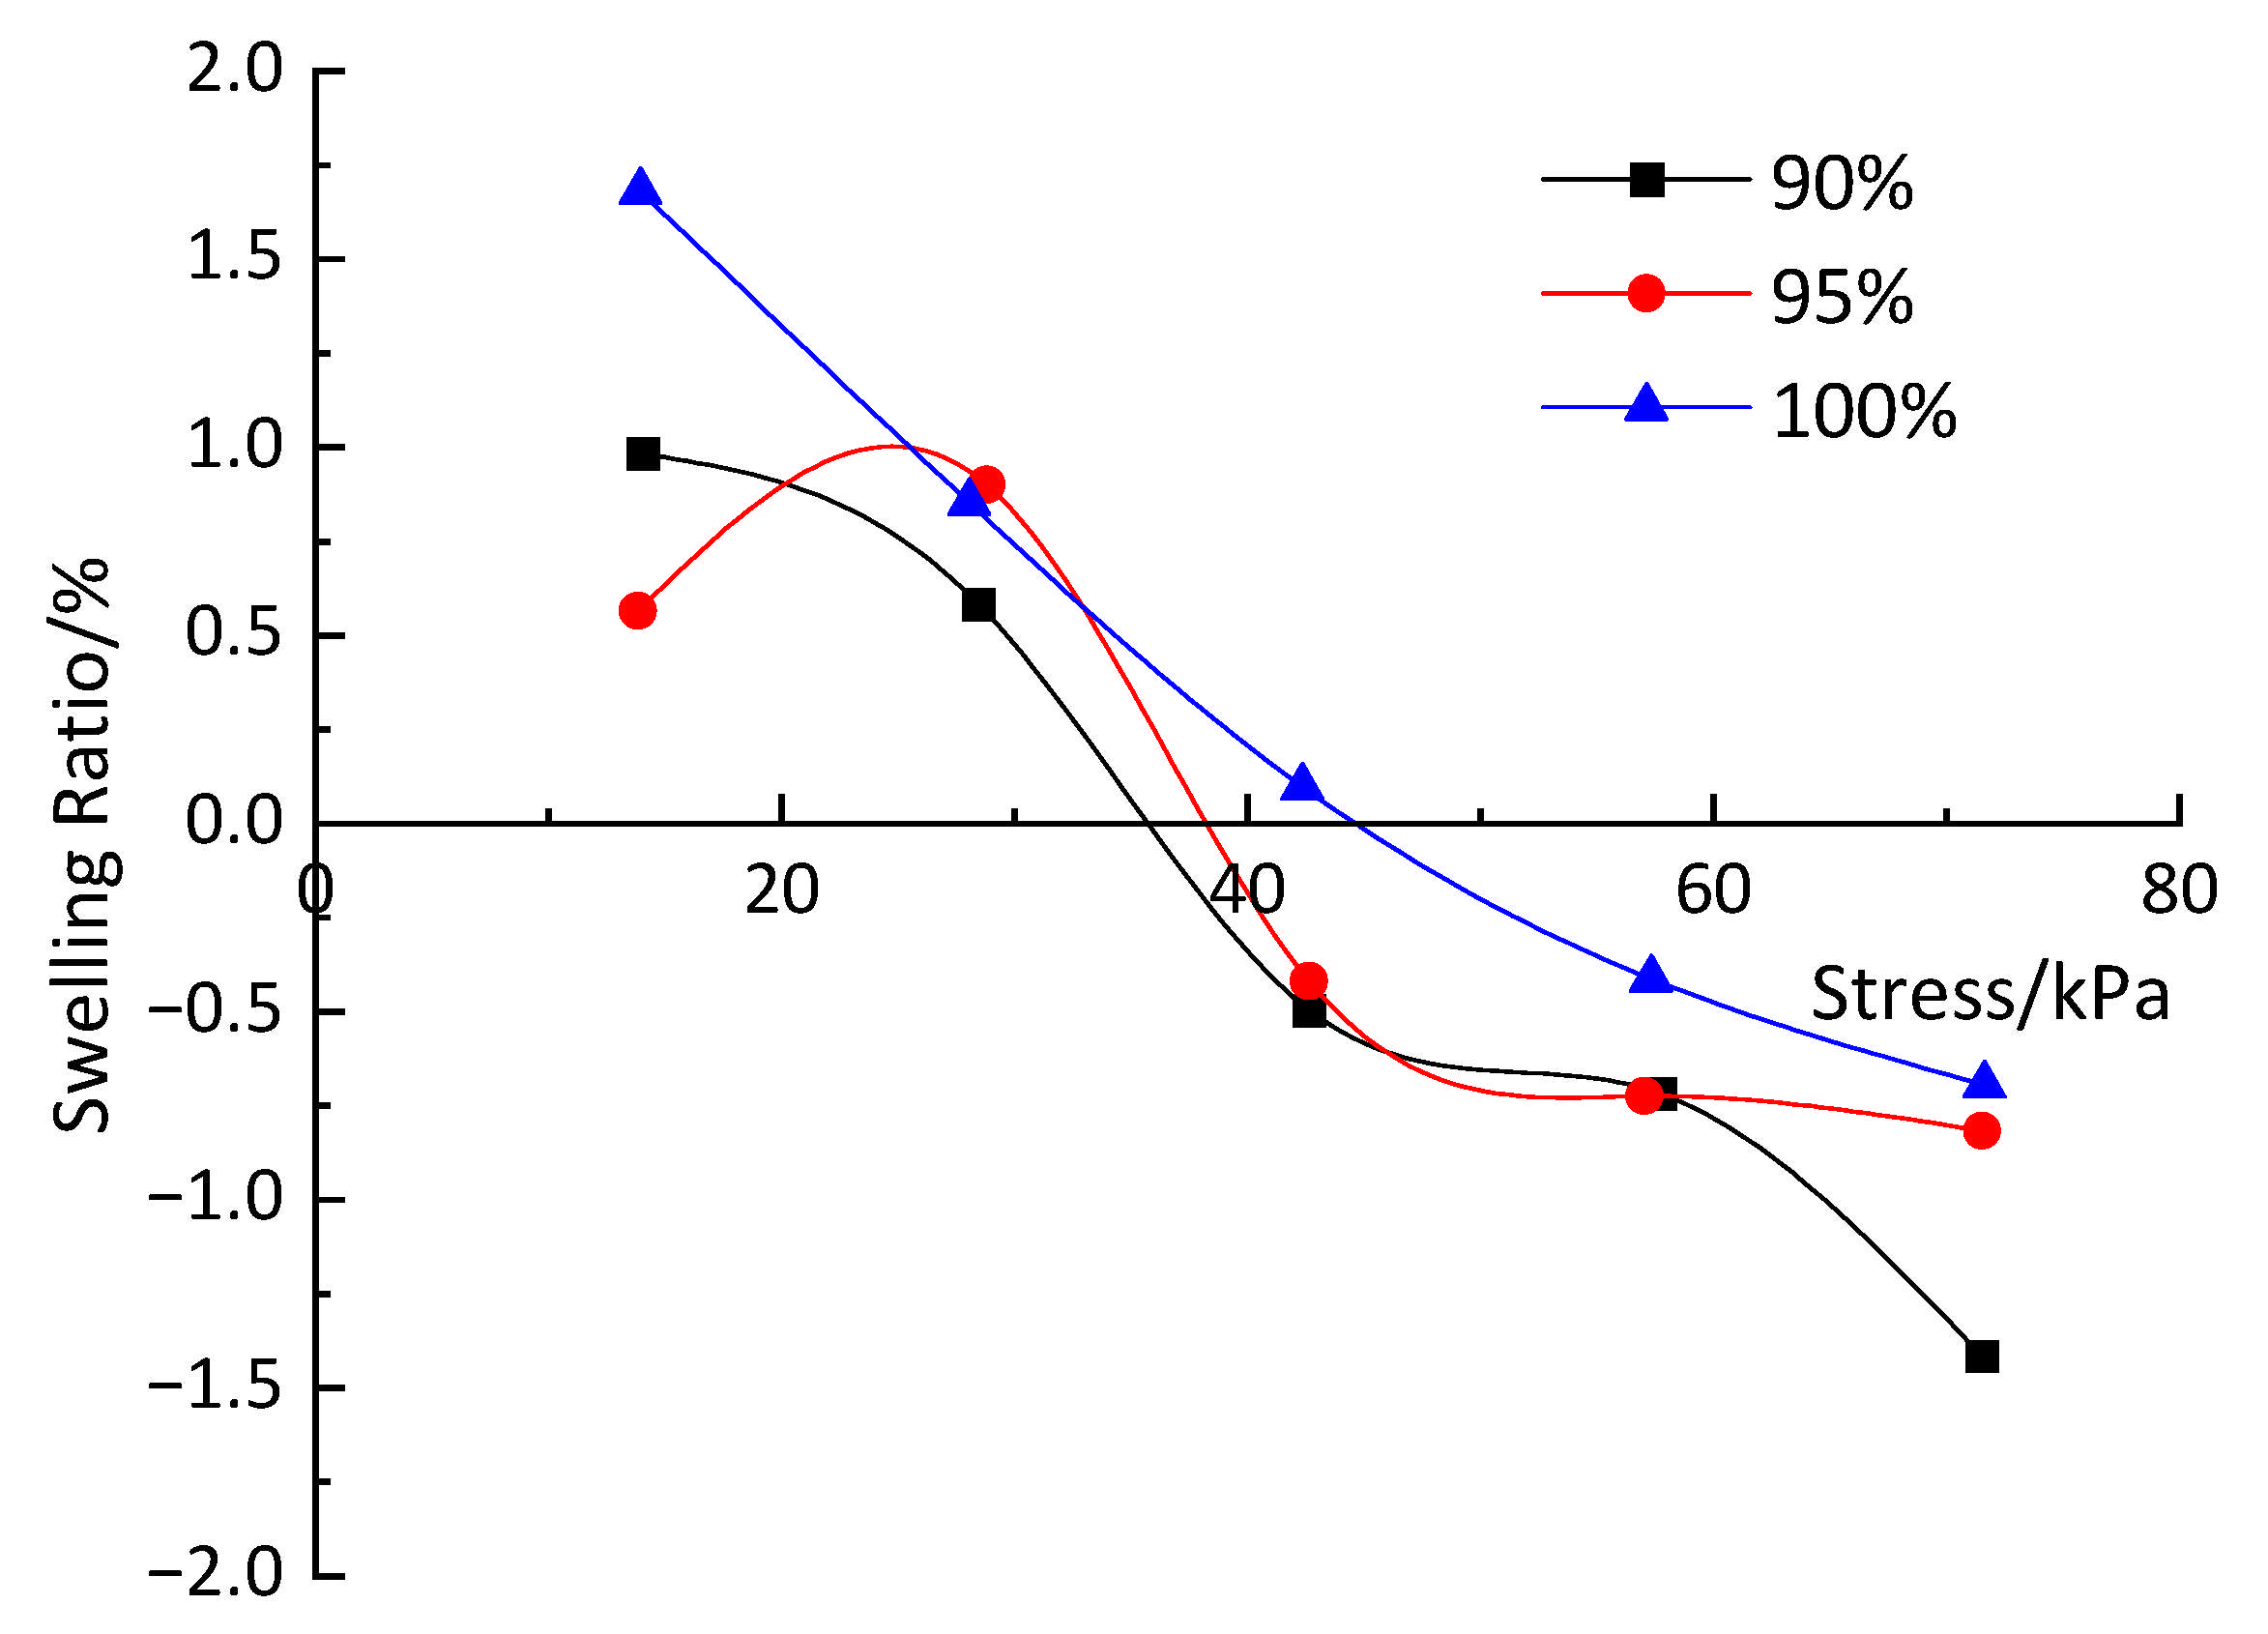
The swell ratio decreased nonlinearly with increasing applied pressure for all compaction levels; however, the red curve shows a partial deviation from this trend at low pressures, as depicted in
Figure 9. The 100% compacted specimen exhibited the steepest initial decline between 0 and 20 kPa, indicating greater resistance to early-stage swelling. As pressure exceeded 40 kPa, the swell ratios of all specimens converged, with final values ranging between approximately −0.5% and −1.5%, suggesting that volumetric changes were effectively constrained. The corresponding swell pressures—31 kPa, 34 kPa, and 39 kPa for compaction levels of 90%, 95%, and 100%, respectively—remain low enough that they are not expected to pose structural concerns for subgrade use in heavy-haul railway foundations.
In terms of shrinkage, the material likewise showed small changes. The vertical shrinkage coefficient
is calculated using Equation (4). The linear shrinkage coefficient
(Equation (5)) was measured for samples at various compactions.
where
denotes the vertical shrinkage coefficient,
is the difference in linear shrinkage between two points in the first-stage shrinkage curve (%), and
is the corresponding difference in water content (%).
Figure 10 illustrates the relationship between linear shrinkage strain and water content for two test groups at varying compaction levels. Shrinkage generally decreased linearly with increasing moisture content across all groups. At 90% compaction, the average shrinkage coefficient was approximately 0.046; it increased to 0.070 at 95%, and to 0.095 at 100%, confirming that higher compaction exacerbates drying-induced shrinkage. Regression equations (displayed on each plot) suggest consistent shrinkage trends across both groups. The test followed BS 1377-2:1990 using linear shrinkage troughs, dried at 40 °C.
Considering both the swelling and shrinkage characteristics, the tested fill material cannot be classified as expansive soil. It exhibits good volumetric stability and is unlikely to undergo significant swelling or excessive shrinkage in practical engineering applications.
3.2. Effect of Treatment on Soil Properties
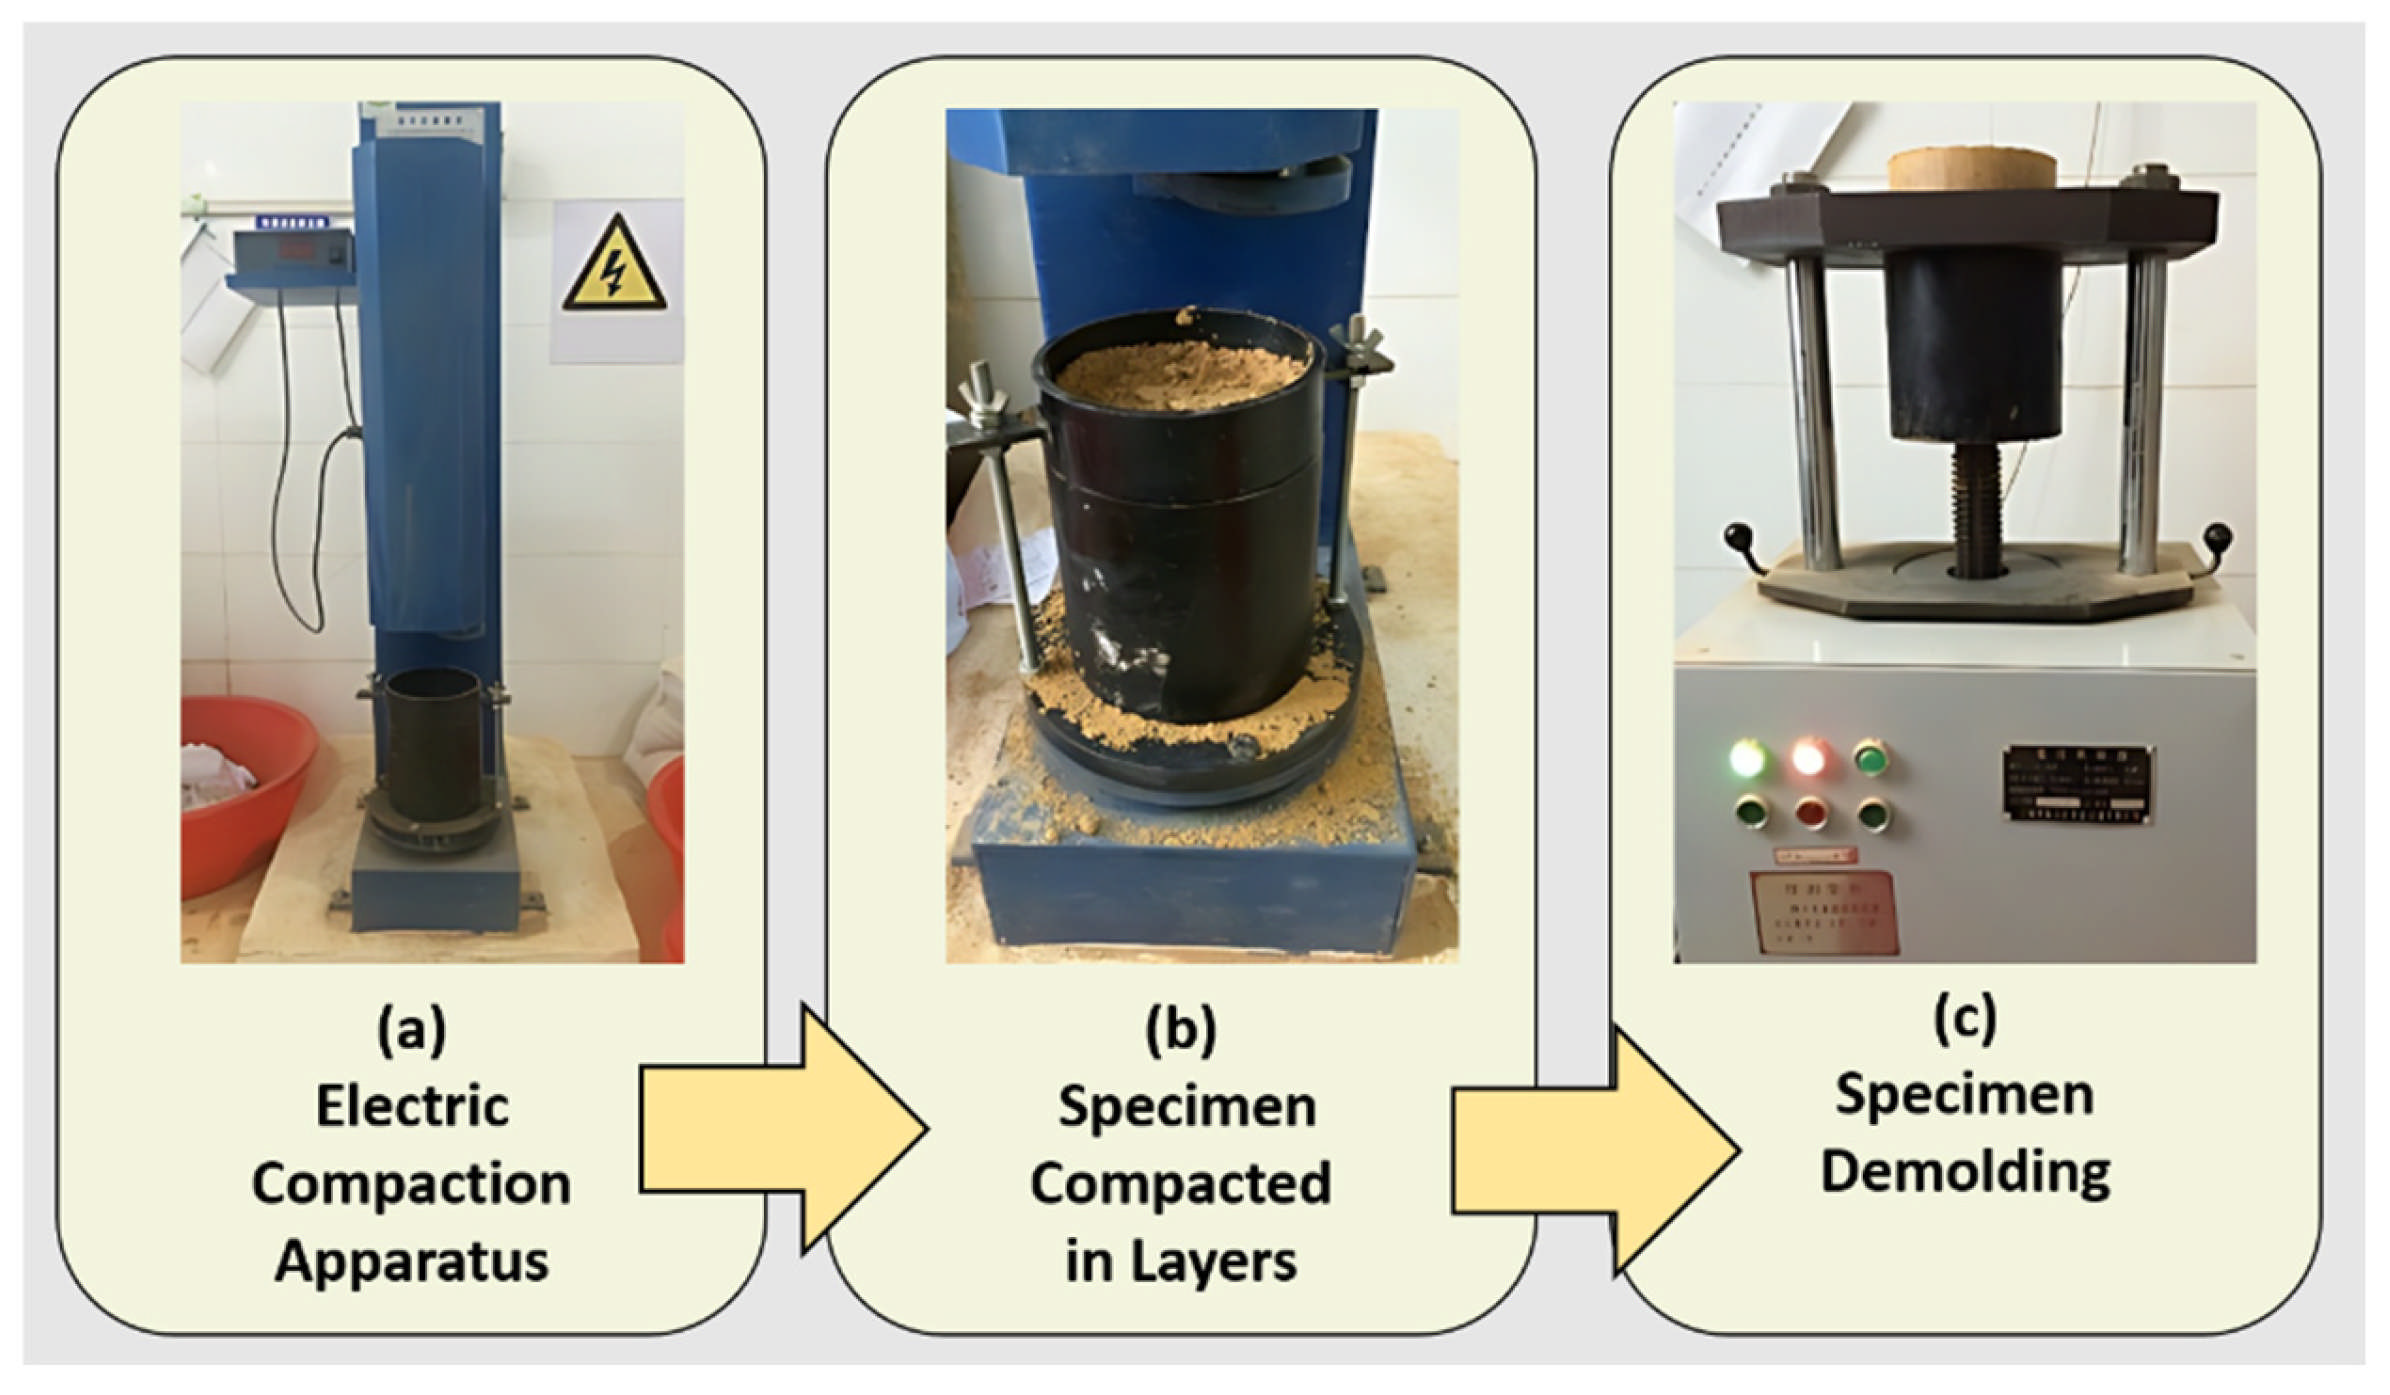
UCS: Before conducting the unconfined compressive strength (UCS) tests, for tests requiring specific moisture contents or densities (e.g., compaction and strength tests), samples were prepared to target the optimum moisture content (OMC) and maximum dry density (MDD) derived from the Standard Proctor test. The results are summarized in
Table 2.
For cement-stabilized soil, as shown in
Table 3, UCS increases with cement content under constant compaction and curing age, with each 1% increase in cement resulting in an approximate 20% strength gain. At a fixed cement content and curing age, higher compaction leads to increased UCS. Likewise, UCS rises with curing age under constant cement content and compaction. Strength growth trends are consistent across curing periods, with 7-day strength reaching 70–80% of the 28-day value, indicating rapid early-stage cement-soil reactions and significant early strength development.
Railway industry standards specify strict compaction quality requirements for cement-stabilized soil used as fill in various subgrade structural layers. When using stabilized soil for subgrade fill below the formation level, a target compaction coefficient of 0.90 and a 7-day UCS of 250 kPa are recommended. Laboratory results showed that a cement content of 3.0% was sufficient to meet the design requirements (TB 10102-2010). However, considering potential construction losses and the need for a safety margin in the field, an additional 0.5% cement is recommended. Thus, a cement content of 3.5% is proposed as the optimal dosage for on-site subgrade construction using cement-stabilized fill.
Permeability: Since the fully weathered soft rock fill is classified as silty clay, the permeability of both untreated and cement-treated samples was measured using the falling head method (ASTM D5084-24 [
43]). The permeability coefficient
was defined by Equation (6):
where
is the standpipe cross-sectional area [cm
2];
A is the specimen cross-sectional area [cm
2];
is the specimen height [cm];
and
are the initial and final time [s];
and
are the corresponding hydraulic heads [cm].
As shown in
Figure 11, the permeability coefficient of the untreated fill decreased markedly as the degree of compaction increased, particularly up to 92%. Beyond this threshold, the decline in permeability became more gradual, suggesting diminishing returns in densification efforts. For cement-stabilized samples (3.5% cement, cured 7 and 28 days), a similar downward trend was observed, albeit with slightly higher values than untreated soil at comparable densities. This suggests that the cement dosage did not significantly reduce void connectivity, possibly due to incomplete pore filling at low cement content.
In contrast, the permeability coefficient of cement-treated soil also decreased with increasing compaction, without a distinct inflection point. The variation trends were generally consistent across different curing ages. Interestingly, the
kT value for soil treated with 3.5% cement was slightly higher than that of the untreated fill. This behavior can be attributed to the relatively low cement dosage, which enhances particle bonding without fully occupying the pore structure. As a result, partial void continuity is preserved, allowing water to pass through preferential channels. From a design perspective, this indicates that stabilized phyllite retains adequate drainage capacity while achieving significant strength gains. However, long-term monitoring is advisable to confirm that durability and permeability remain stable under cyclic loading. Previous studies [
14,
44] have indicated that a higher cement content (typically 10% or more) is required to achieve a substantial reduction in permeability.
Compressibility and consolidation: The one-dimensional consolidation tests investigated the compressive behavior of fully weathered soft rock fill under various conditions. Results demonstrate that compaction degree and moisture state are key factors governing compressibility, as shown in
Table 4.
The compressibility of the specimens is closely related to compaction and moisture conditions. With increasing compaction, the standard compression coefficient
decreases while the modulus
increases, indicating reduced compressibility. For fully weathered soft rock at optimum moisture, increasing compaction from 90% to 95% reduces
from 0.28 to 0.18, still above 0.1, classifying it as moderately compressible. After vacuum saturation,
increases and
drops significantly, showing high water sensitivity. Cement treatment markedly improves performance: at 92% compaction and optimum moisture,
drops to 0.07 (0.08 after saturation), indicating low compressibility. Meanwhile,
increases from 7.2 MPa and 4.2 MPa to 26.6 MPa and 21.9 MPa, 3.69 and 5.21 times higher, respectively. This demonstrates significantly enhanced compressive behavior and water stability after cement stabilization [
45].
Early-age strength likely derives from a micro-aggregate cementation mechanism in which C–S–H gels form thin coatings on silt-size quartz, bridging contacts without fully occluding pore throats. Similar observations have been reported for low-dosage cemented loess [
44] and silty clays [
46].
3.3. Shear Strength and CBRs
Shear strength of untreated soil: As shown in
Table 5; shear strength parameters were obtained from direct shear (left values) and consolidated undrained triaxial tests (right values). The shear strength parameters obtained from consolidated quick direct shear and triaxial tests for the untreated soft rock fill indicate a material of moderate strength that is strongly influenced by density but only mildly affected by saturation. Generally, the triaxial tests yielded slightly higher cohesion values than the direct shear, while friction angles were in a similar range. Regardless, the friction angles from both methods were consistently in the low-to-mid 30 s and increased with density, confirming a robust frictional component typical of silts.
The cohesion and internal friction angle of fully weathered soft rock increase with compaction. Due to the lubricating effect of water, saturated specimens show lower shear strength than those at optimum moisture content. After cement treatment, cohesion increases by approximately 2~3 times under the same compaction, while the friction angle shows minimal change. Although both parameters decrease slightly after vacuum saturation, they remain higher than those of untreated specimens, indicating improved strength. With curing time, shear strength increases modestly; by 7 days, over 90% of the 28-day strength is achieved, suggesting rapid early strength development.
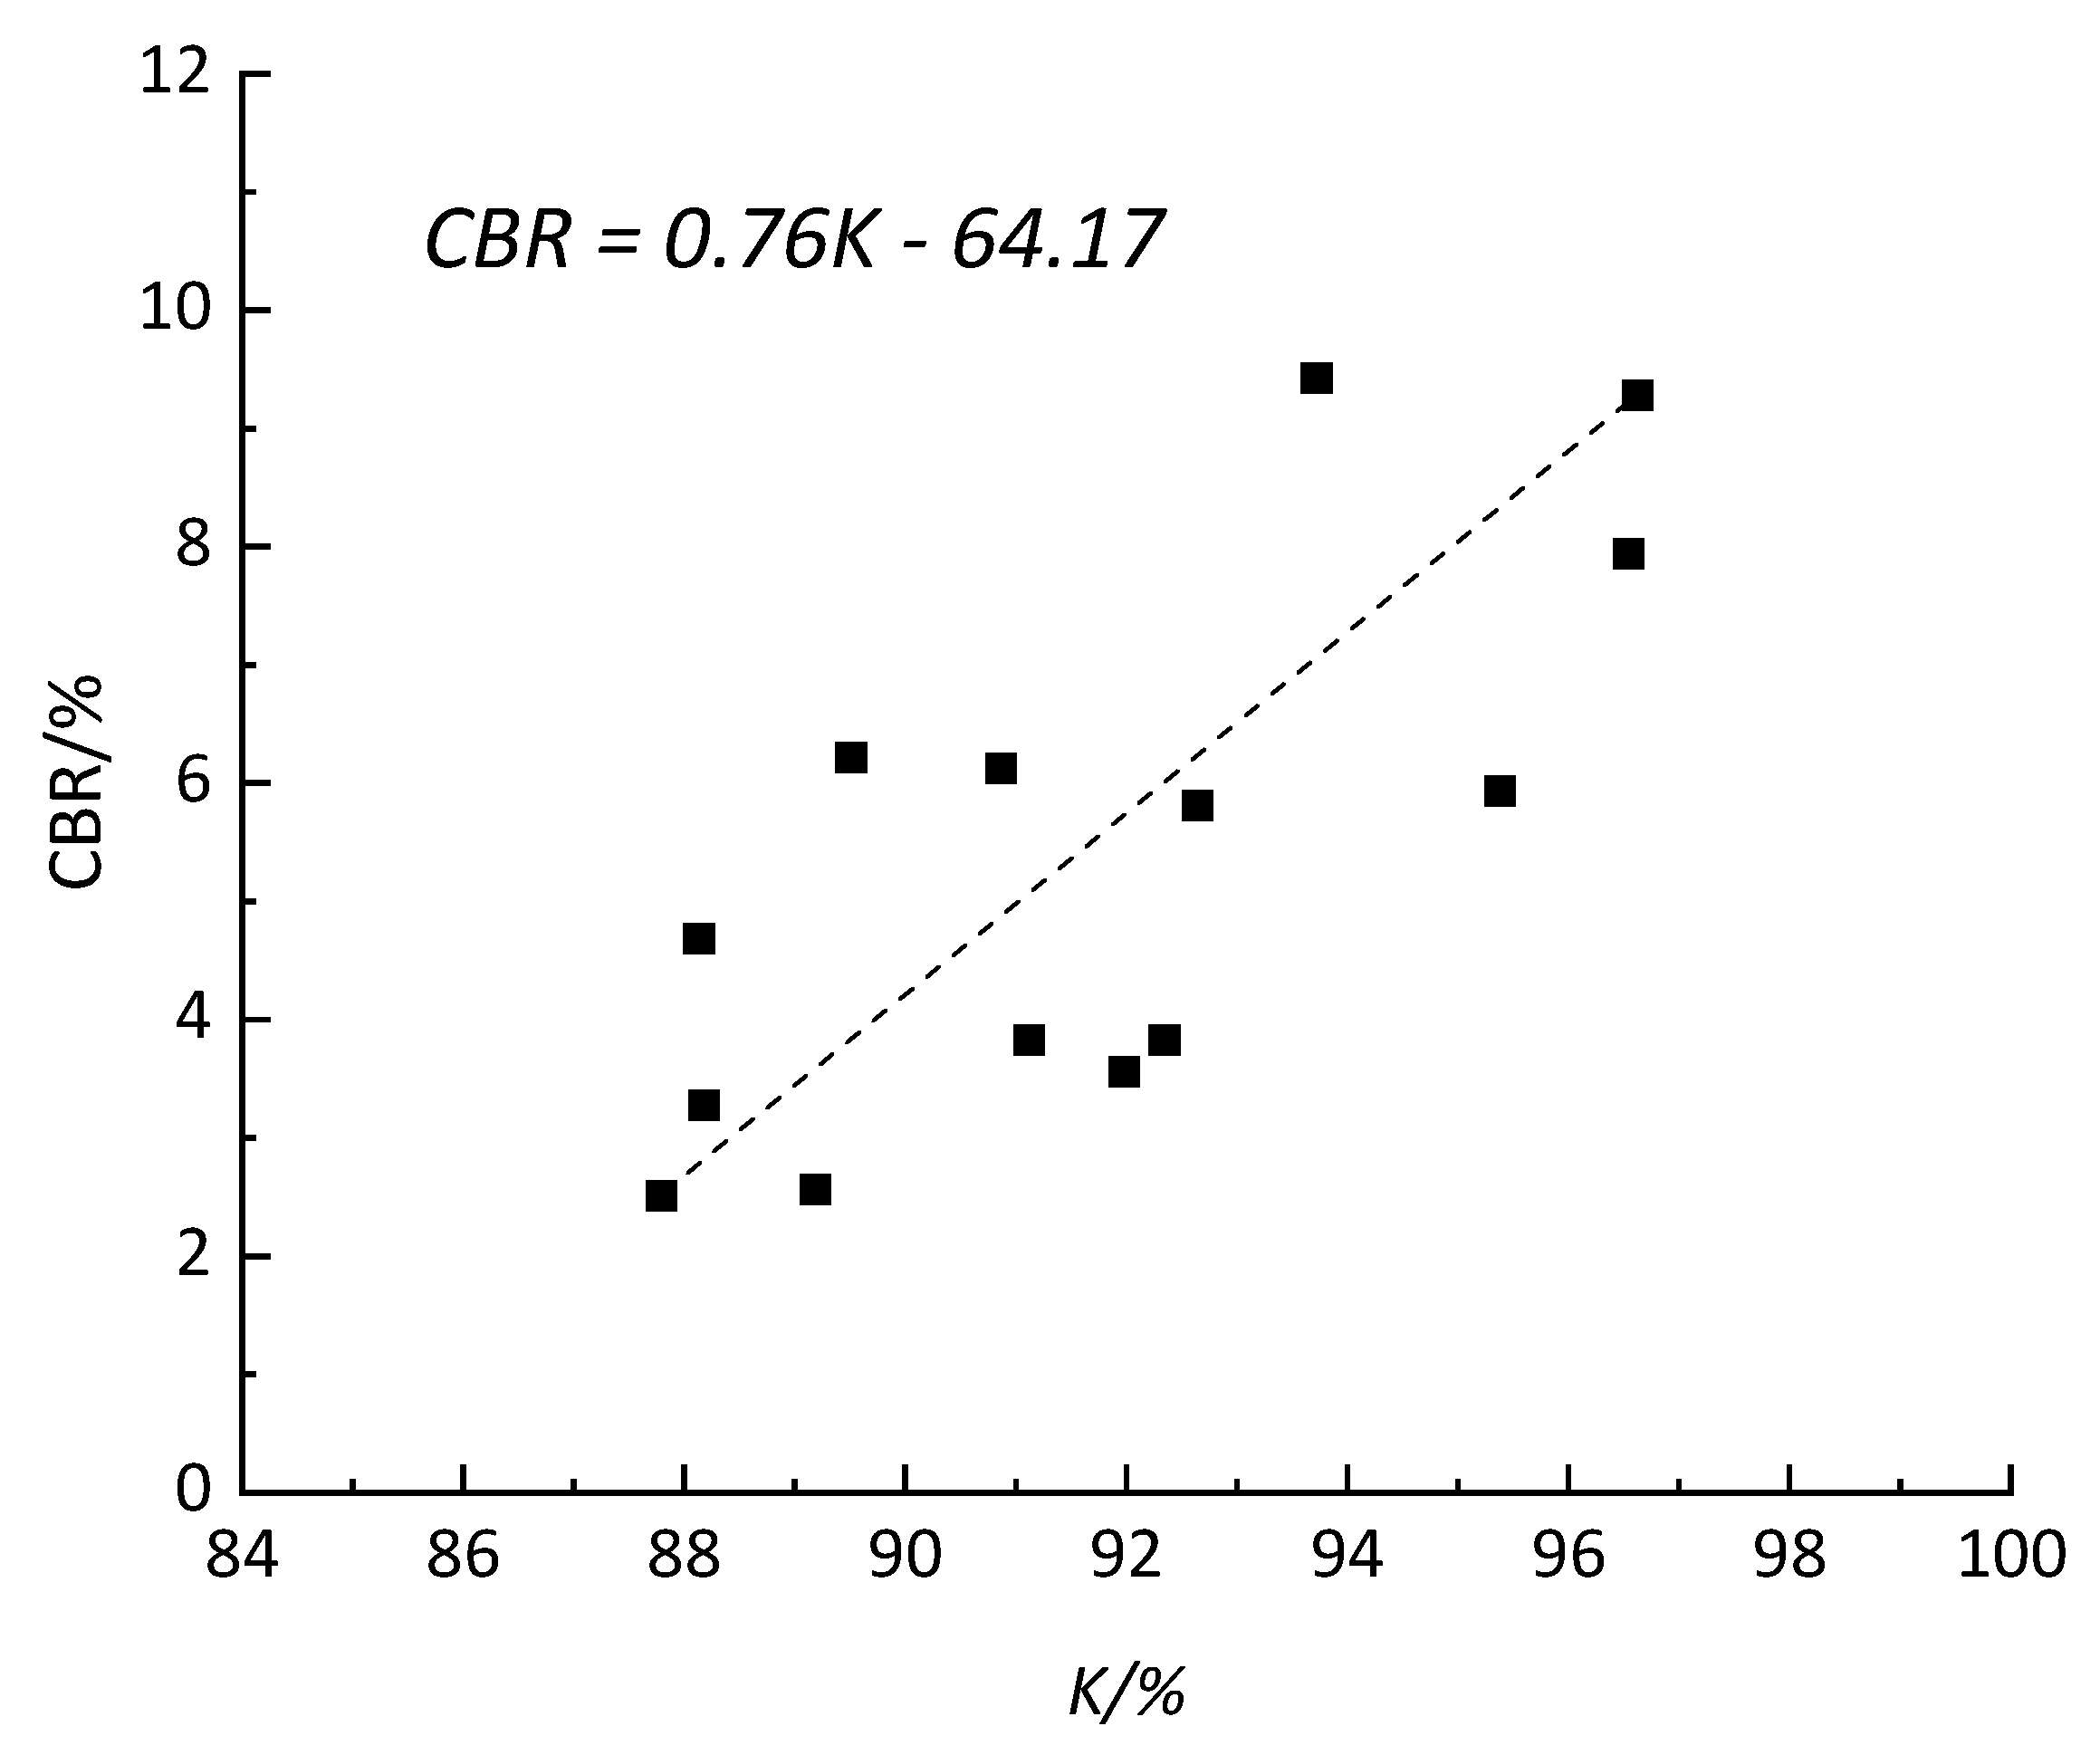
California Bearing Ratio (CBR). Under soaked conditions, the untreated phyllite yielded CBR values of 4.1%, 5.3%, and 7.8% at target compaction coefficients of 0.90, 0.92 and 0.98, respectively. Adding 3.5% cement raised the CBR to ≈59% after 7 d and ≈83% after 28 d at 100% laboratory compaction, representing an eight- to ten-fold increase over the untreated material. Extrapolation of the regression in
Figure 10 predicts a soaked CBR of ≈8.8% at 96% field compaction, thereby meeting the 8% design threshold (ASTM D1883-21) for lower subgrade layers even without chemical stabilization, whereas main-subgrade use clearly requires cement treatment.
Figure 12 presents the correlation between California Bearing Ratio (CBR) and compaction degree for untreated, fully weathered soft rock. A statistically significant positive trend (R
2 ≈ 0.72,
p < 0.01) was observed, indicating improved load-bearing capacity with increasing density. At 96% compaction, the projected soaked CBR was ≈8.8%, surpassing the 8% design threshold (ASTM D1883-21) for subgrade use in high-class roads. These results suggest that, with adequate compaction control, the untreated soft rock may be feasible for sub-subgrade applications even without chemical treatment.
As compaction increased, the CBR value of the untreated fill rose from 4.1% to 7.8%. With the addition of 3.5% cement, the stabilized samples showed a significant improvement, with CBR values roughly 8–10 times higher than those of the untreated material. The CBR value also increased with curing time; for instance, the 28-day value was approximately 40% higher than that at 7 days.
