Article

Seasonal Effects of Window-to-Wall Ratio and Glazing Combinations on Office Building Performance in Qingdao

1
Faculty of Environmental Engineering, The University of Kitakyushu, Fukuoka 808-0135, Japan
2
Innovation Institute for Sustainable Maritime Architecture Research and Technology, Qingdao University of Technology, Qingdao 266061, China
3
College of Architecture and Urban Planning, Qingdao University of Technology, Qingdao 266033, China
4
School of Economics and Management, Qingdao University of Science and Technology, Qingdao 266061, China
*
Author to whom correspondence should be addressed.
Buildings 2025, 15(17), 3156; https://doi.org/10.3390/buildings15173156
Submission received: 16 August 2025 / Revised: 28 August 2025 / Accepted: 1 September 2025 / Published: 2 September 2025
(This article belongs to the Section Building Energy, Physics, Environment, and Systems)

Abstract

This study examines how the combined design of the window-to-wall ratio (WWR) and glazing type affects thermal comfort and energy use in Qingdao, China, which has a temperate monsoon climate. A prototypical four-story office was modeled using TRNSYS 18, and three representative weeks—January, July, and October—were simulated to capture seasonal responses. Results show marked inter-floor and seasonal differences. In terms of thermal comfort, the combination of 30% WWR with double-glazed windows achieved the best performance in July, with 51.14% of daytime hours maintaining |PMV| ≤ 0.5. While a higher WWR can enhance daytime comfort during winter, it may lead to discomfort in transitional seasons. Regarding energy performance, double glazing consistently reduced energy consumption across all three seasons, with a reduction of 366–500 kWh in total building load during January compared to single glazing. In July and October, energy demand decreased as WWR decreased. However, when WWR varied drastically across floors, the building’s overall energy efficiency deteriorated significantly. In conclusion, adopting a moderate WWR (30%) in combination with high-performance double glazing is an effective strategy to improve year-round thermal comfort and energy efficiency, while minimizing abrupt vertical variations in WWR. The findings are most applicable to mid-rise office buildings in temperate monsoon climates such as Qingdao.

1. Introduction

As energy efficiency in buildings becomes an increasingly critical concern, improving energy efficiency and optimizing the thermal performance of envelope systems have become essential goals in sustainable building design [1]. The building envelope plays a pivotal role in regulating heat transfer between the interior and exterior, thereby affecting indoor thermal comfort and energy usage. Among the envelope parameters, the window-to-wall ratio (WWR)—defined as the proportion of window area to exterior wall area—is a key indicator that affects various thermal performance aspects, including daylighting, ventilation, solar heat gain, and heat loss [2,3]. In addition, the type of glazing used plays a decisive role in determining the insulation and solar control capabilities of the envelope system, making it a central factor in optimizing both thermal comfort and energy performance.
Numerous studies have demonstrated that increasing the WWR typically leads to unfavorable thermal responses and elevated energy consumption in buildings [4,5]. Amaral et al. [6] reported that in Coimbra, Portugal (Mediterranean temperate climate), increasing the WWR from 0% to 90% led to a 70.00–80.00% increase in cooling energy demand and an overall rise in annual energy consumption of 6.00–181.00%. Similarly, Kim et al. [7] found that in Korea (temperate monsoon climate), raising the WWR from 20% to 80% resulted in approximately a 60% increase in cooling energy use. The primary reason for this phenomenon is that buildings with higher WWRs receive more solar radiation, which makes them more prone to overheating in summer, thereby requiring additional cooling loads to maintain comfort [8]. Goia et al. [8] further indicated that in a temperate continental climate, winter heating loads increase substantially with larger WWRs, especially on north-, east-, and west-facing façades, where the lack of solar gain exacerbates energy demand. Only on south-facing façades can a moderate increase in WWR provide some benefits from solar heat gains in winter. Nevertheless, when considering annual performance, the optimal WWR is generally concentrated within the range of 30–45% [9]. In China, several scholars have conducted studies in Qingdao, a representative city with a temperate monsoon climate [10,11]. Chen et al. [12] observed that when the WWR increased from 0.5 to 0.9, cooling energy demand rose significantly, while heating demand decreased. This suggests that larger south-facing windows can utilize solar heat gains during winter, thereby offsetting part of the heating load and limiting the overall negative impact of high WWR on annual energy consumption. However, during summer and transitional seasons, the cooling burden remained considerable, indicating that excessively high WWRs are still unfavorable for year-round energy efficiency [13]. Li et al. [14] highlighted that for buildings in Qingdao, the south-facing WWR is the most critical design parameter and should be maintained within the range of 0.35–0.40; east- and west-facing façades should be kept at around 0.30 with effective shading measures, while the north-facing WWR has relatively limited influence but should also be avoided from being excessively large. Hu et al. [15] emphasized that Qingdao is classified as a temperate monsoon climate and designated as part of the cold region under the Chinese building energy efficiency standard, where cold winters and warm summers make WWR optimization particularly important, with the optimal range typically around 30–40%. Yue et al. [16] further demonstrated that under summer conditions in Qingdao, adopting an excessively high WWR in public buildings can significantly increase cooling loads (by 14.3–30.6%), whereas double glazing, compared with single glazing, can moderately improve indoor thermal conditions. Overall, these studies indicate that in Qingdao—where both heating and cooling loads are significant due to its climate—excessively high WWRs are detrimental to year-round energy efficiency. Maintaining WWR within the range of 30–40%, combined with high-performance glazing and effective shading strategies, can balance winter solar heat gains while simultaneously reducing cooling demand during summer and transitional seasons.
However, in recent years, several scholars have also suggested that a high WWR may offer certain advantages under specific climatic conditions or within particular building functional spaces. Ashrafian et al. [17] found that in temperate climates, buildings with WWRs of 40–50% demonstrated better thermal comfort than those with WWRs of 20–30%. Guo et al. [18] highlighted that a higher WWR facilitates better heat exchange with the cooler night air, thereby promoting passive cooling. Xie et al. [19] reported that in warm regions, buildings with WWRs above 70% exhibited indoor temperature reductions of 5–10 °C under certain conditions, offering improved natural ventilation and cooling potential. Ochoa et al. [20] also highlighted the positive impact of high WWR on indoor visual comfort, particularly in office buildings. These findings suggest that high WWR should not be universally regarded as an unfavorable design feature. Its impact on energy use and comfort depends on a combination of factors, including climate zone, glazing performance, floor level, building height, and window distribution strategies. Nevertheless, its implications for buildings in temperate monsoon climate regions remain insufficiently investigated and warrant further exploration.
Although a substantial body of research has explored the effects of WWR on building performance, several limitations remain in the current literature. Most existing studies have focused on uniform WWR settings or single glazing types, and typically assess either annual energy use or thermal conditions on typical days. There is a lack of investigation into the coupling effects of varying WWR distribution strategies and glazing configurations across different seasonal scenarios. Moreover, few studies have examined the impact of vertically graduated WWR designs (e.g., smaller WWR on lower floors and larger WWR on upper floors), which could significantly influence external surface heat gains, indoor temperature stratification, and spatial variation in energy demand. This vertical differentiation holds considerable value for both academic research and practical applications.
To address these limitations, this study employs a 4-story office building model to investigate the combined effects of WWR distribution strategies and glazing types on thermal comfort and energy performance. 10 combinations of WWR and window types were designed and simulated using the TRNSYS software. Simulations were conducted for three representative seasonal weeks (January, July, and October; 10th–17th) to evaluate indoor temperature, thermal comfort, and building energy loads. The selection of these three periods was based on their representativeness: January corresponds to the heating season, July to the cooling season, and October to the transitional season, thereby covering the major operational conditions throughout the year. In addition, the meteorological conditions during these weeks were relatively stable and exhibited complete cycles, while also aligning with the monitoring periods of the field measurements, which facilitated the comparison and validation between simulated and measured data. By adopting a seasonally dynamic simulation approach, the study quantitatively compares the performance of different WWR–glazing combinations across building floors. Furthermore, it explores how the vertical distribution of WWR (e.g., uniform, increasing, decreasing) affects the building’s overall thermal balance and energy performance.

2. Materials and Methods

2.1. Building Model

This study focuses on a typical office building located in Qingdao to analyze indoor temperature variations under different WWR and glazing types. The thermal comfort and energy performance were evaluated using TRNSYS, a building energy simulation software. A three-dimensional building model was constructed in TRNSYS, allowing the simulation of hourly indoor temperature throughout the designated period, thereby providing a reference for energy-efficient design and indoor thermal environment optimization. The building has a total length of 52.7 m, a width of 18.5 m, and a total height of 14.7 m, with four stories in total (see Figure 1). The first floor has a floor-to-floor height of 3.9 m, while the remaining floors are 3.6 m high. All perimeter walls are external and in direct contact with the outdoor environment. Windows are installed on all four façades—east, south, west, and north.
Qingdao (120.4° E; 36.1° N) is located in a hot summer and cold winter climate zone [21]. Meteorological inputs for the simulations were sourced from Meteonorm. In this study, one representative week was selected for January, July, and October, corresponding to the heating, cooling, and transitional seasons, respectively. The selection criteria included stable meteorological conditions, the ability to capture the typical operating state of each season, and consistency with the periods of field measurements. As the main aim of this study is to analyze the relative differences among various WWR–glazing combinations, simulations over representative periods are sufficient to reveal the main patterns. The corresponding temperature variations during these periods are shown in Figure 2.

2.2. Envelope Parameters of the Model

According to the GB 50176-2016 [22], this study adopted envelope thermal performance parameters that comply with the national standard in the TRNSYS simulation environment (see Table 1). For window types, two commonly used options from the TRNSYS default library were selected: single glazing (Single 102) and double glazing (Double 14011) (see Table 2).
A total of 10 combinations of WWR and glazing type were established. The glazing types were categorized into single and double glazing, with five WWR distribution strategies defined under each glazing condition:
Single-glazing schemes: C1: Uniform WWR of 30% on all floors. C2: WWR increases significantly from bottom to top: 10%, 30%, 50%, and 70%. C3: WWR increases slightly from bottom to top: 20%, 30%, 40%, and 50%. C4: WWR decreases significantly from bottom to top: 70%, 50%, 30%, and 10%. C5: WWR decreases slightly from bottom to top: 50%, 40%, 30%, and 20%.
Double-glazing schemes: C6: Uniform WWR of 30% on all floors. C7: WWR increases significantly from bottom to top: 10%, 30%, 50%, and 70%. C8: WWR increases slightly from bottom to top: 20%, 30%, 40%, and 50%. C9: WWR decreases significantly from bottom to top: 70%, 50%, 30%, and 10%. C10: WWR decreases slightly from bottom to top: 50%, 40%, 30%, and 20%.

2.3. Internal Load Settings for Energy Consumption Simulation

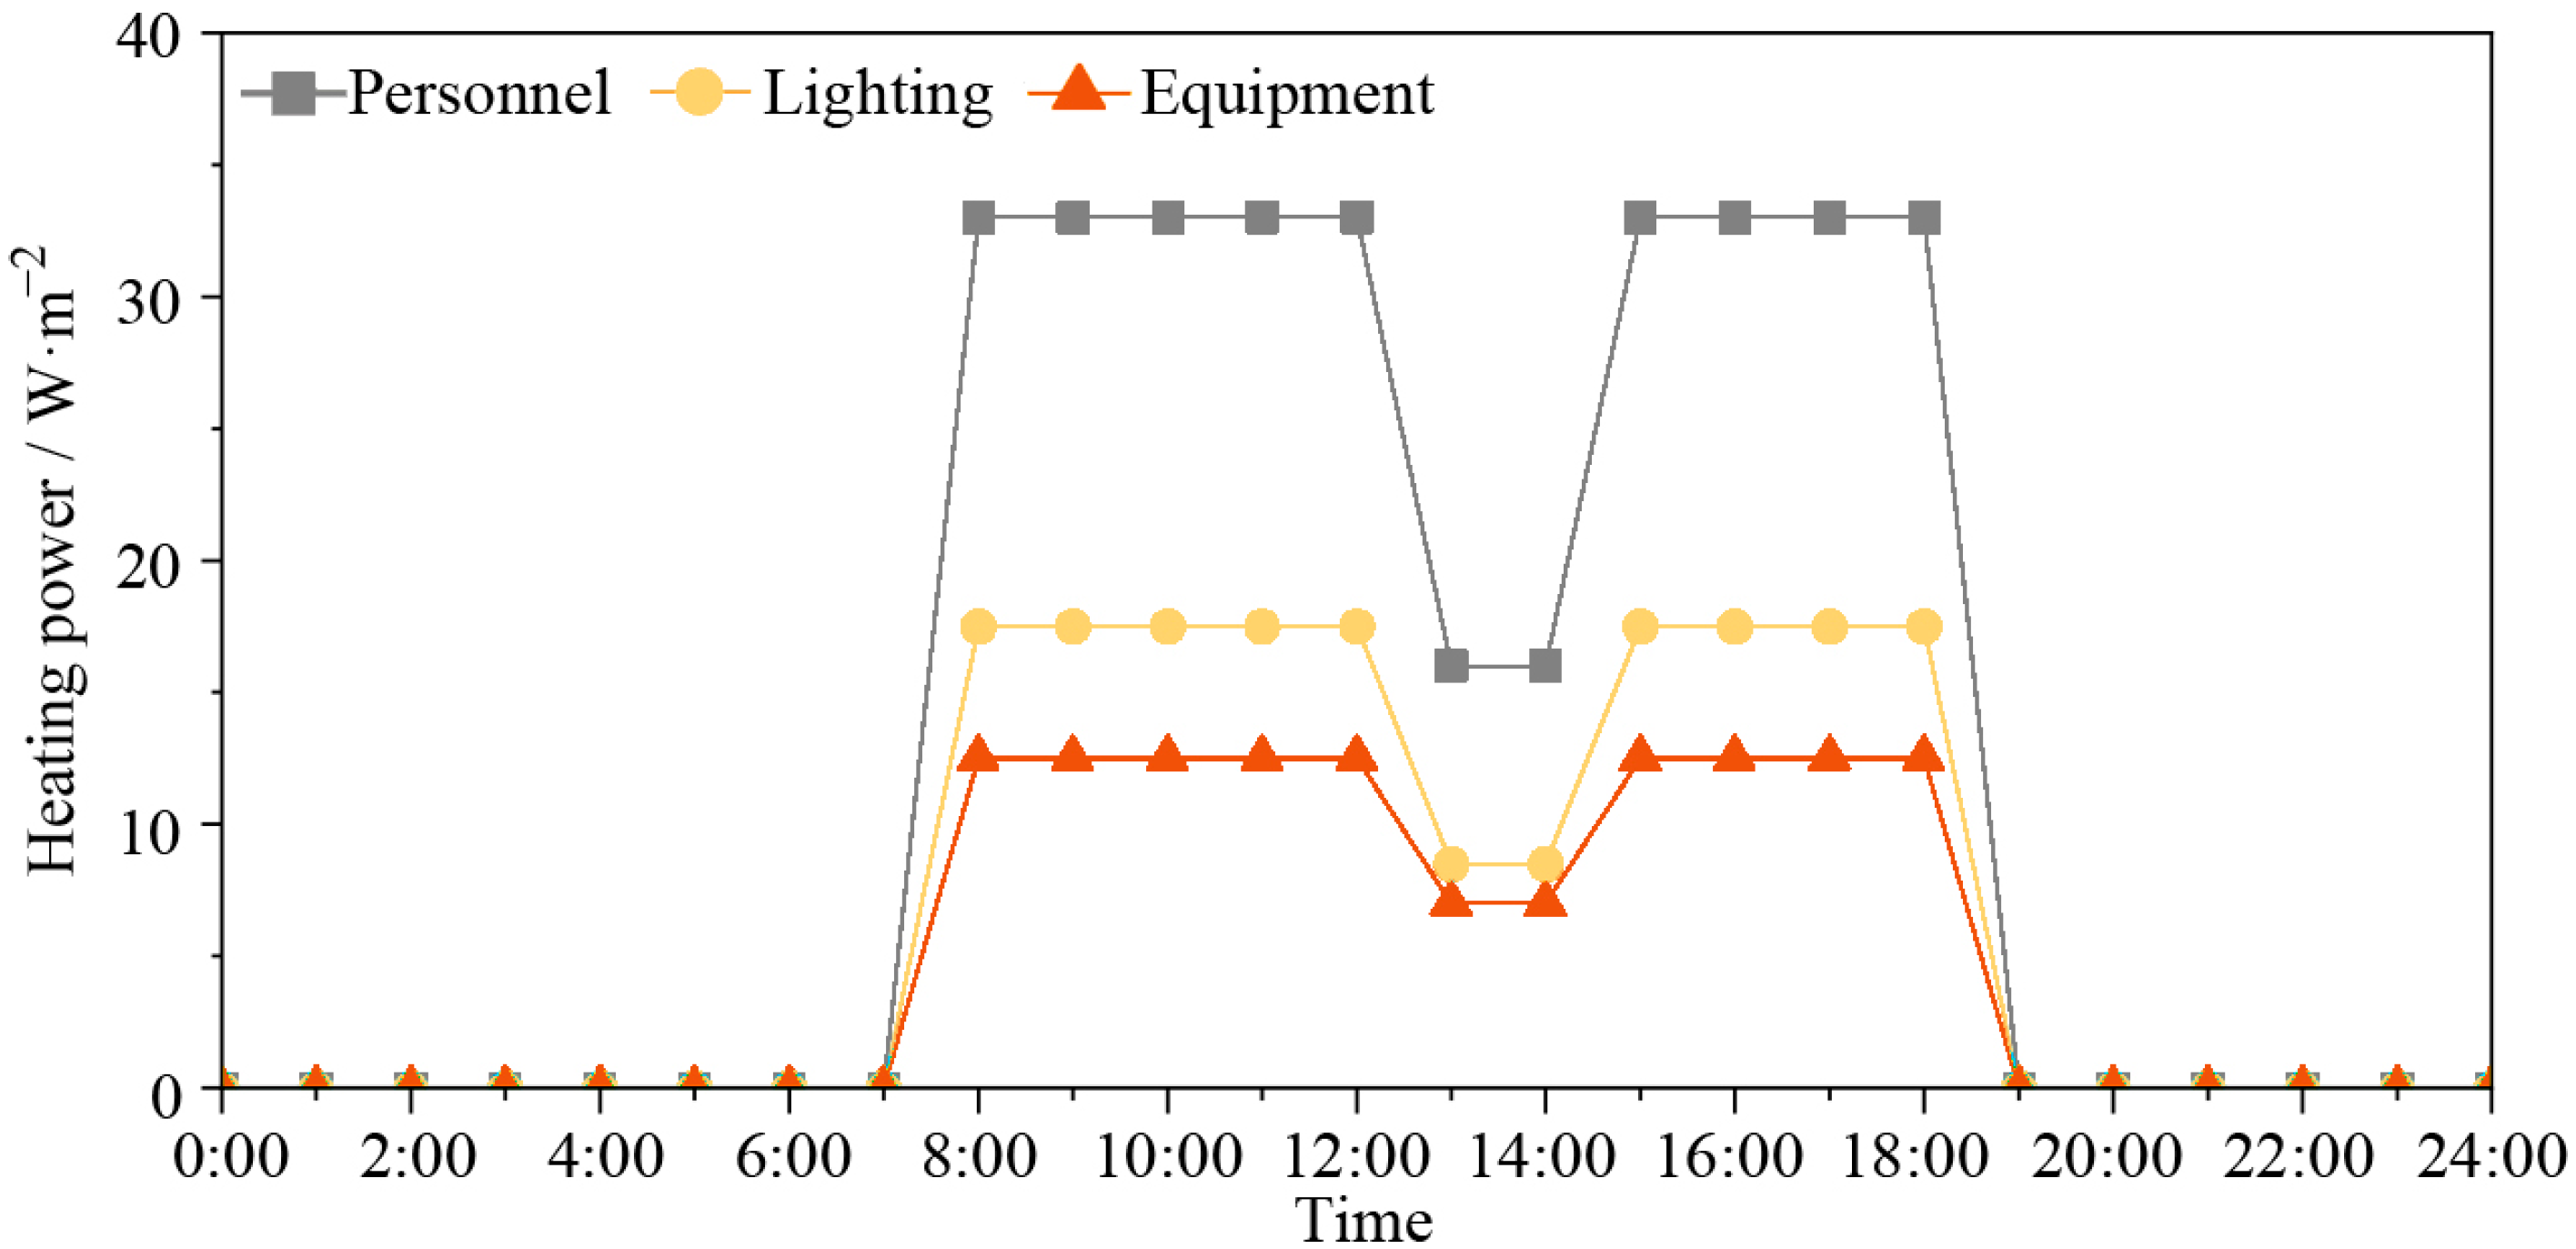
In accordance with the GB 50189-2015 [23], the energy simulation incorporated internal loads arising from people, lighting systems, and office equipment. The occupant density was set at 0.25 persons/m2 based on the standard recommendation, and the building operation schedule was defined as 8:00 to 18:00 daily, reflecting typical office usage patterns. Among internal loads, lighting represents a major contributor to energy consumption. Its power density is regulated by national standards and is typically treated as a constant load in simulation. Although daylighting may reduce lighting demand under actual conditions, variations in occupant behavior and lighting control strategies introduce substantial uncertainty. Therefore, for simulation consistency and safety, a fixed lighting power density was applied based on standard values, regardless of WWR-induced daylight availability. Similarly, internal gains from office equipment were also set according to GB 50189-2015. The detailed heat gain values from occupants, lighting, and equipment are illustrated in Figure 3, and were uniformly applied across all simulation scenarios to ensure consistency and comparability of thermal environment assessments.

2.4. Evaluation Metrics

In addition to temperature and energy consumption, this study assessed the influence of different WWR and glazing types on indoor thermal comfort. Referring to previous studies, the occupied hours of the office building were set from 9:00 to 18:00 to reflect typical usage patterns [19]. The Predictive Mean Vote (PMV) model proposed by Fanger provides a comprehensive framework for quantitatively evaluating thermal comfort by integrating multiple influencing factors, including environmental parameters (air temperature, relative humidity, air velocity, and mean radiant temperature), metabolic rate, and clothing insulation [2].
According to the ASHRAE standards [24], a thermal environment is considered comfortable when the PMV value is within ±0.5, i.e., |PMV| ≤ 0.5, indicating that most occupants feel thermally satisfied [24]. A range of 0.5 < |PMV| ≤ 1.0 represents slight thermal discomfort that remains within a generally acceptable level, and is thus referred to as the tolerable thermal comfort zone [25]. Based on this classification, the proportion of time falling into three PMV intervals—|PMV| ≤ 0.5, 0.5 < |PMV| ≤ 1.0, and |PMV| > 1.0—was used to compare the thermal comfort performance across simulation conditions.
To verify the validity of the simulation results, the simulated indoor temperature and energy consumption were compared with actual measured data [26]. The case study building is a 4F office located in the Liandong U Valley Xiazhuang Innovation Park in Chengyang District, Qingdao. The building is oriented along the north–south axis, with no external obstructions, and represents a typical office building in a temperate climate region. The TRNSYS model was developed based on this building, and a room with single glazing and a WWR of 30% was selected for validation. All performance indices satisfied the error thresholds recommended by ASHRAE Guideline 14 (see Table 3) [27].

3. Results

3.1. Indoor Temperature

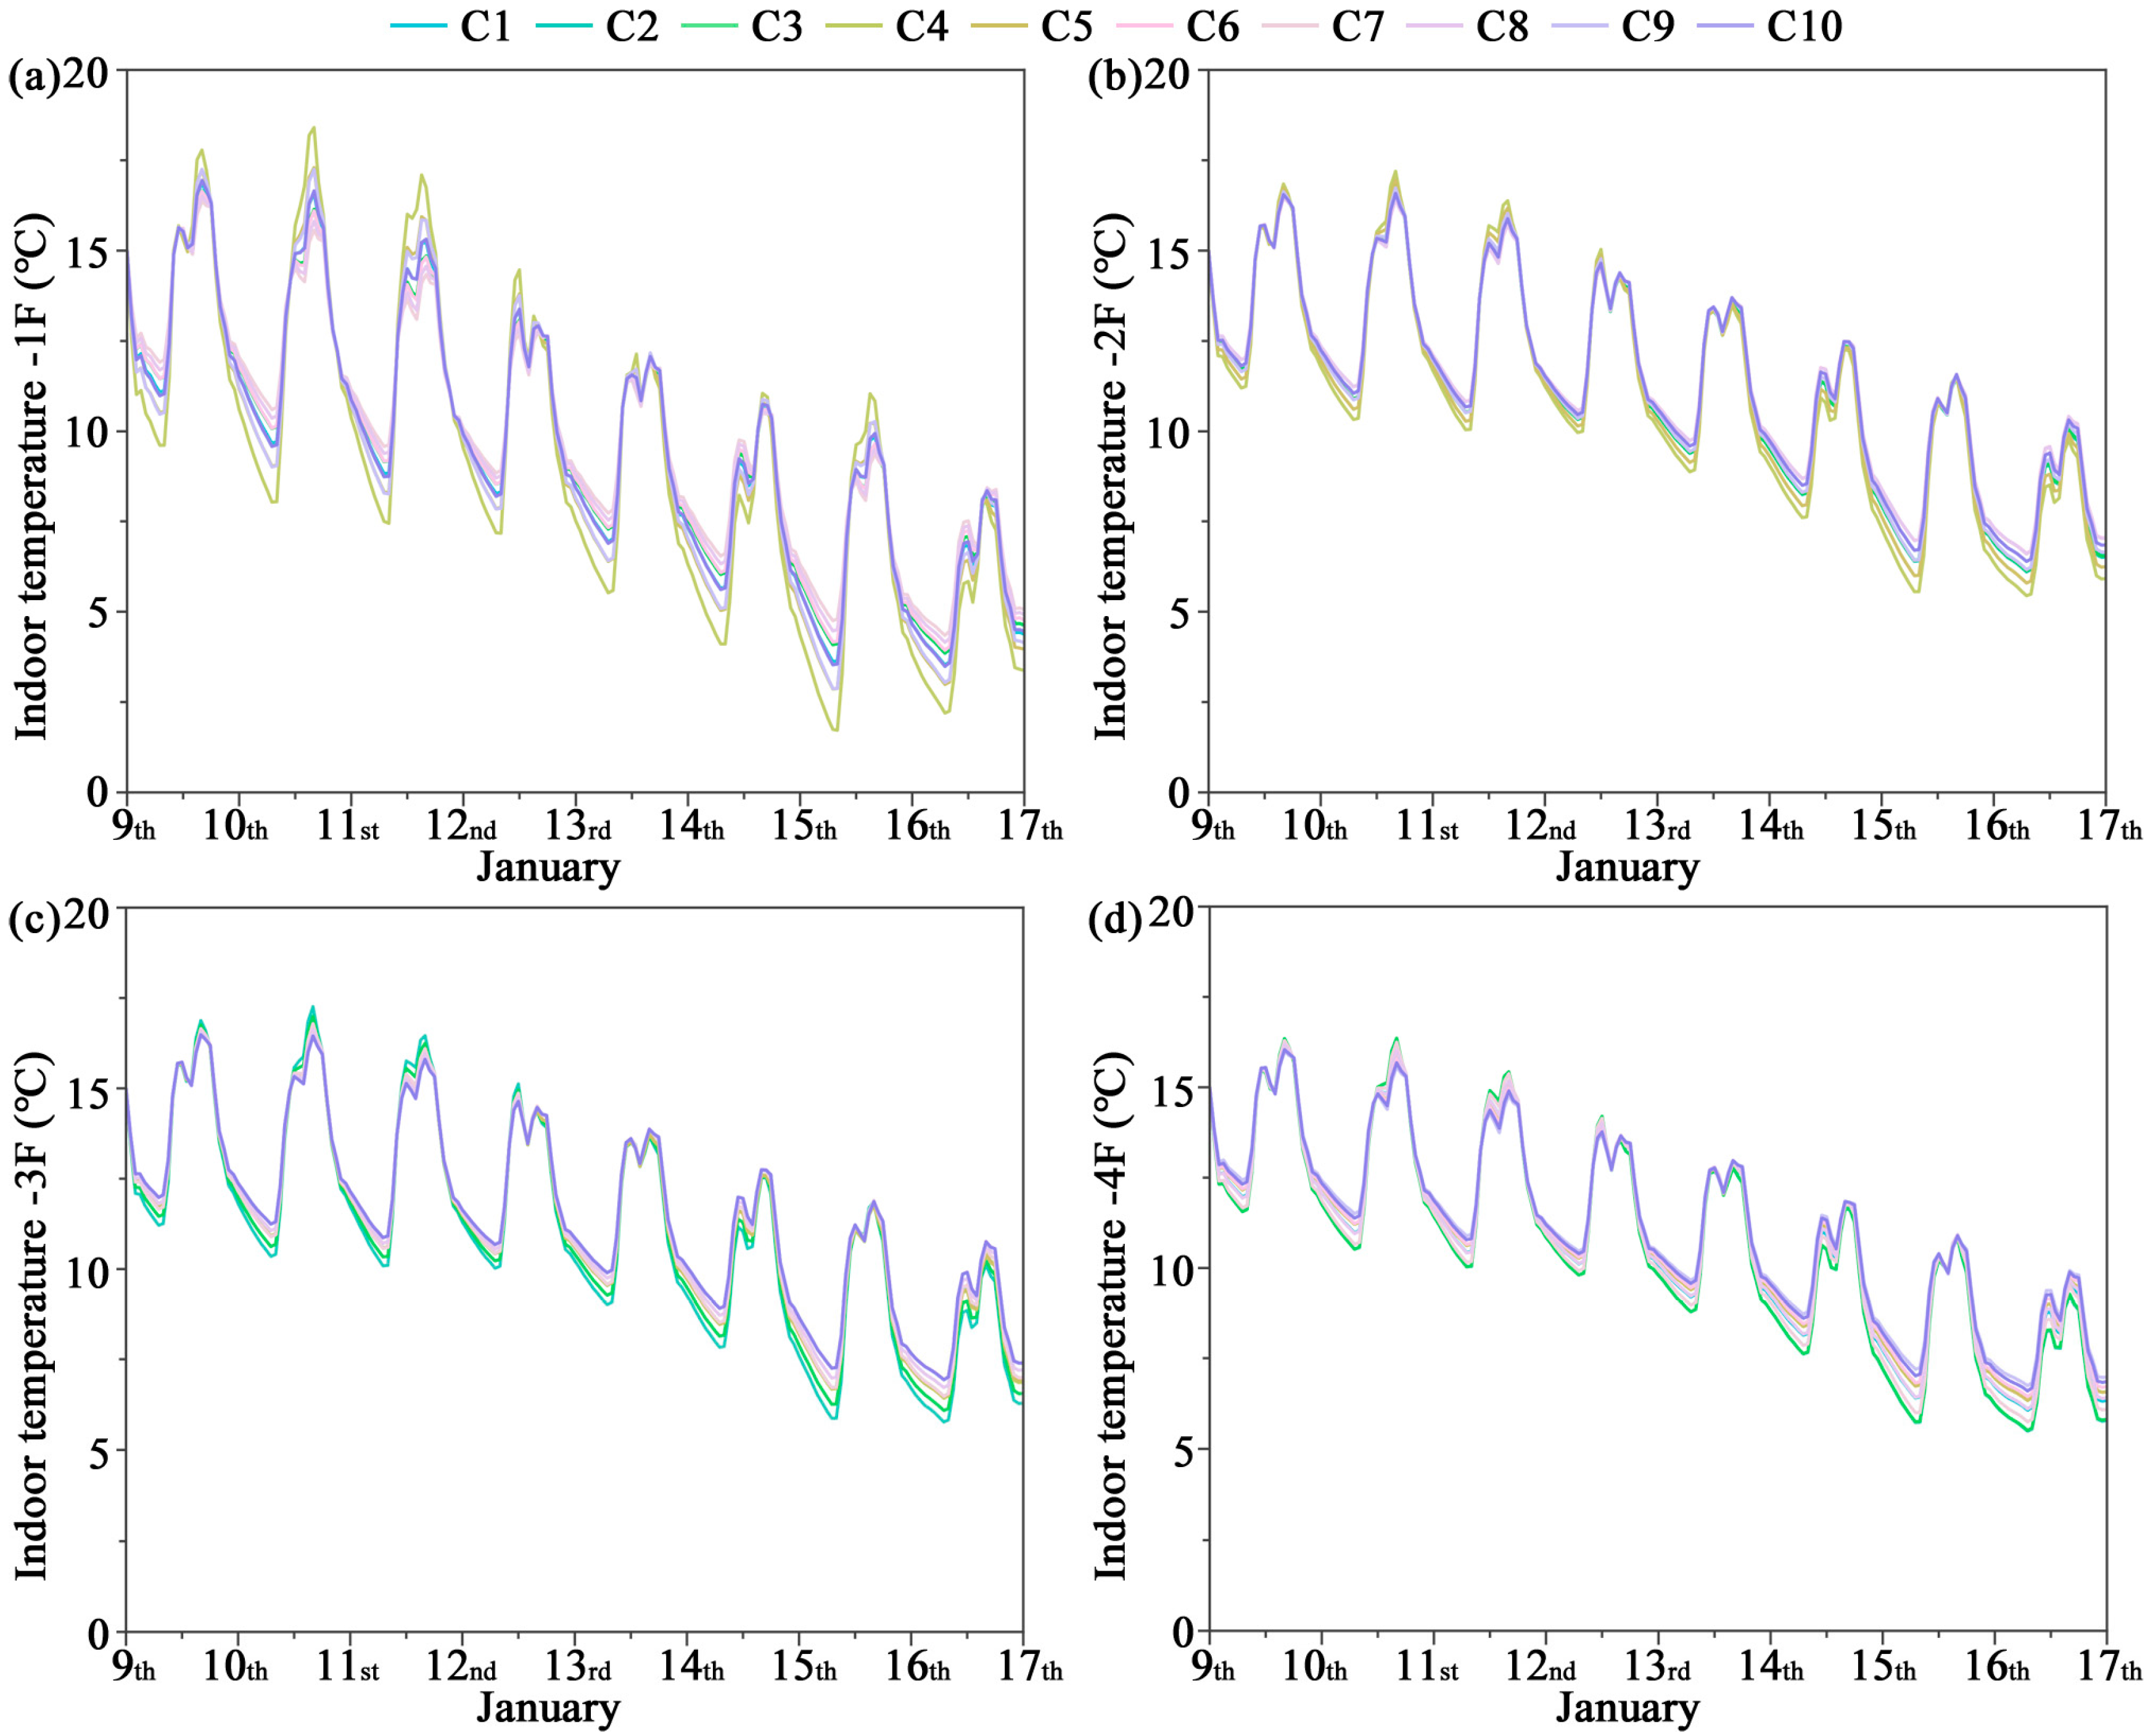
In January, the temperature curves for the 2nd to 4th floors were nearly identical (see Figure 4), daytime temperatures peaked between 9.93 °C and 16.88 °C, while nighttime lows varied from 5.49 °C to 11.24 °C. In contrast, the 1st floor exhibited consistently lower temperatures and greater fluctuation amplitudes, with a diurnal temperature difference ranging from 4.09 °C to 10.36 °C. Notably, a sharp drop in temperature was observed during nighttime and early morning hours. Across all simulation scenarios, double glazing demonstrated a stronger thermal buffering capacity, resulting in significantly reduced indoor temperature fluctuations compared to the corresponding single-glazing cases. These findings indicate that the 1st floor is more susceptible to diurnal fluctuations in outdoor temperature, and that the application of double glazing effectively improves overall thermal stability.
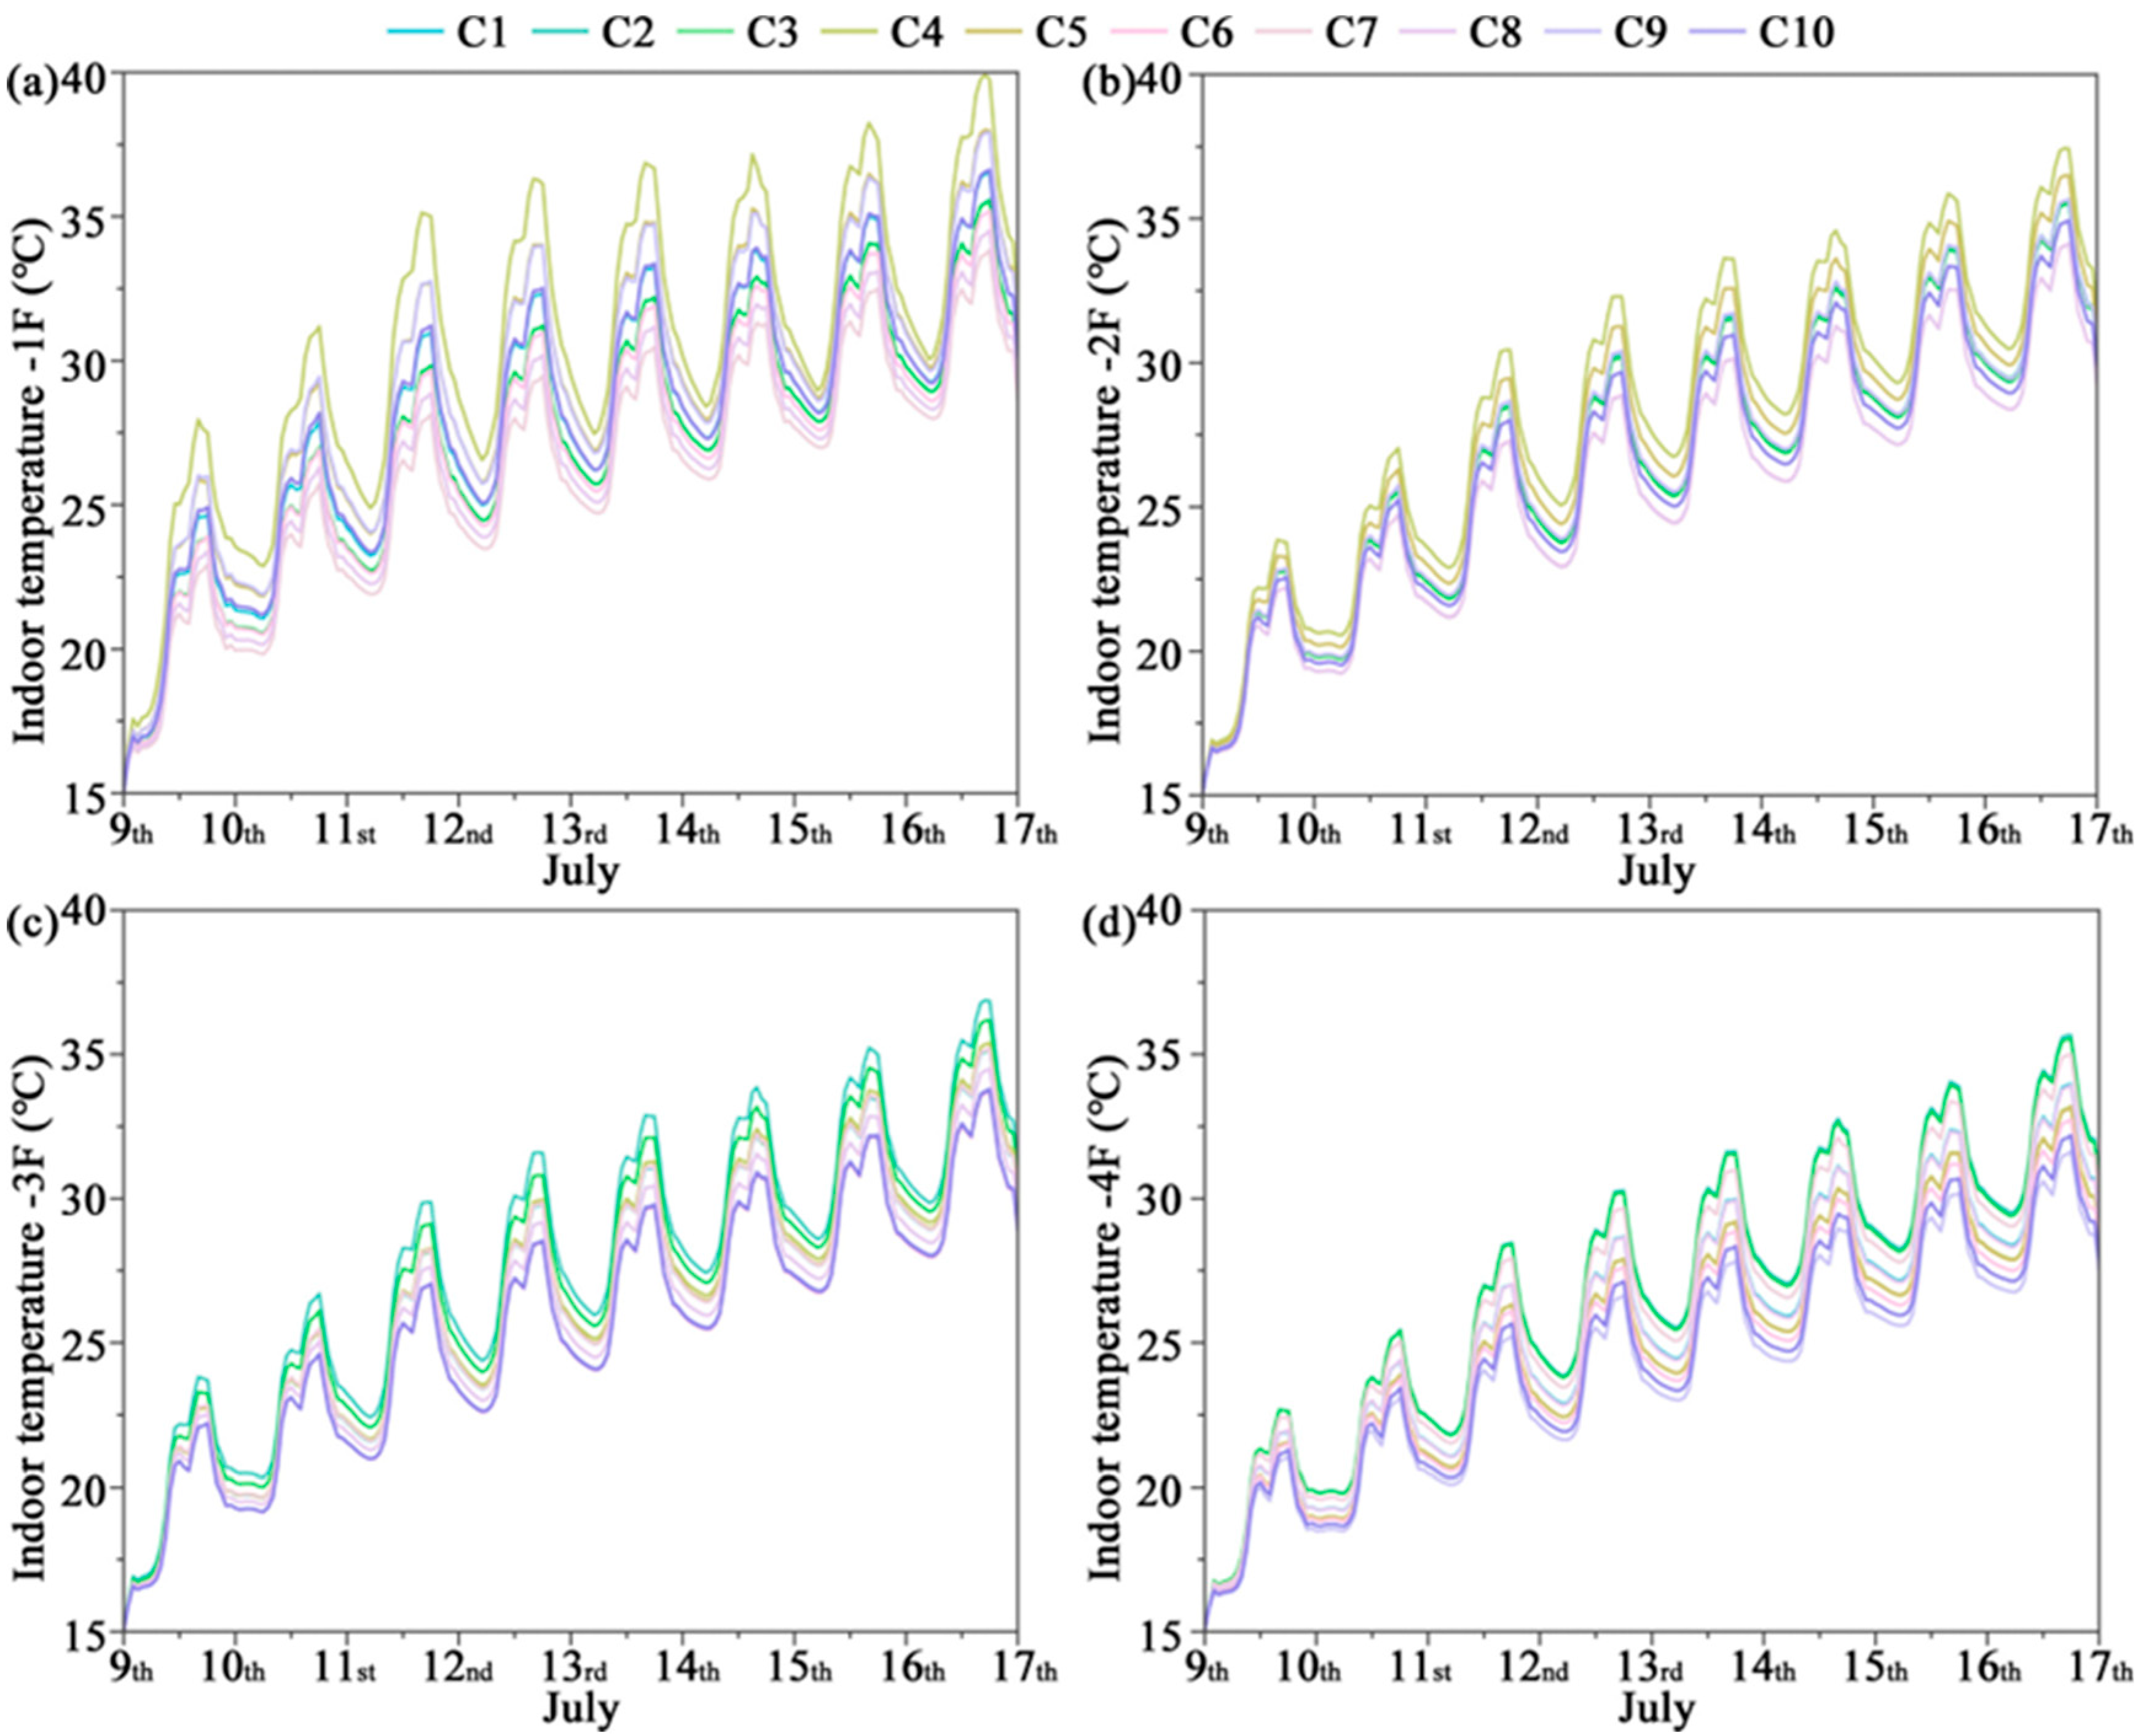
Under non-air-conditioned conditions in July, the temperature curves of the 2nd to 4th floors showed high consistency across all combinations of WWR and glazing types (see Figure 5). The daytime peak temperature reached approximately 36.07 °C, while the nighttime low dropped to around 15.79 °C. This substantial diurnal temperature variation indicates that, without air conditioning, indoor thermal environments are highly dependent on outdoor climatic conditions—particularly under scenarios combining single glazing with high WWR, where daytime temperature rise was especially pronounced. These results highlight the critical importance of controlling solar heat gains during summer. The use of lower WWR designs and high-performance glazing materials can effectively reduce indoor heat accumulation and enhance thermal comfort.
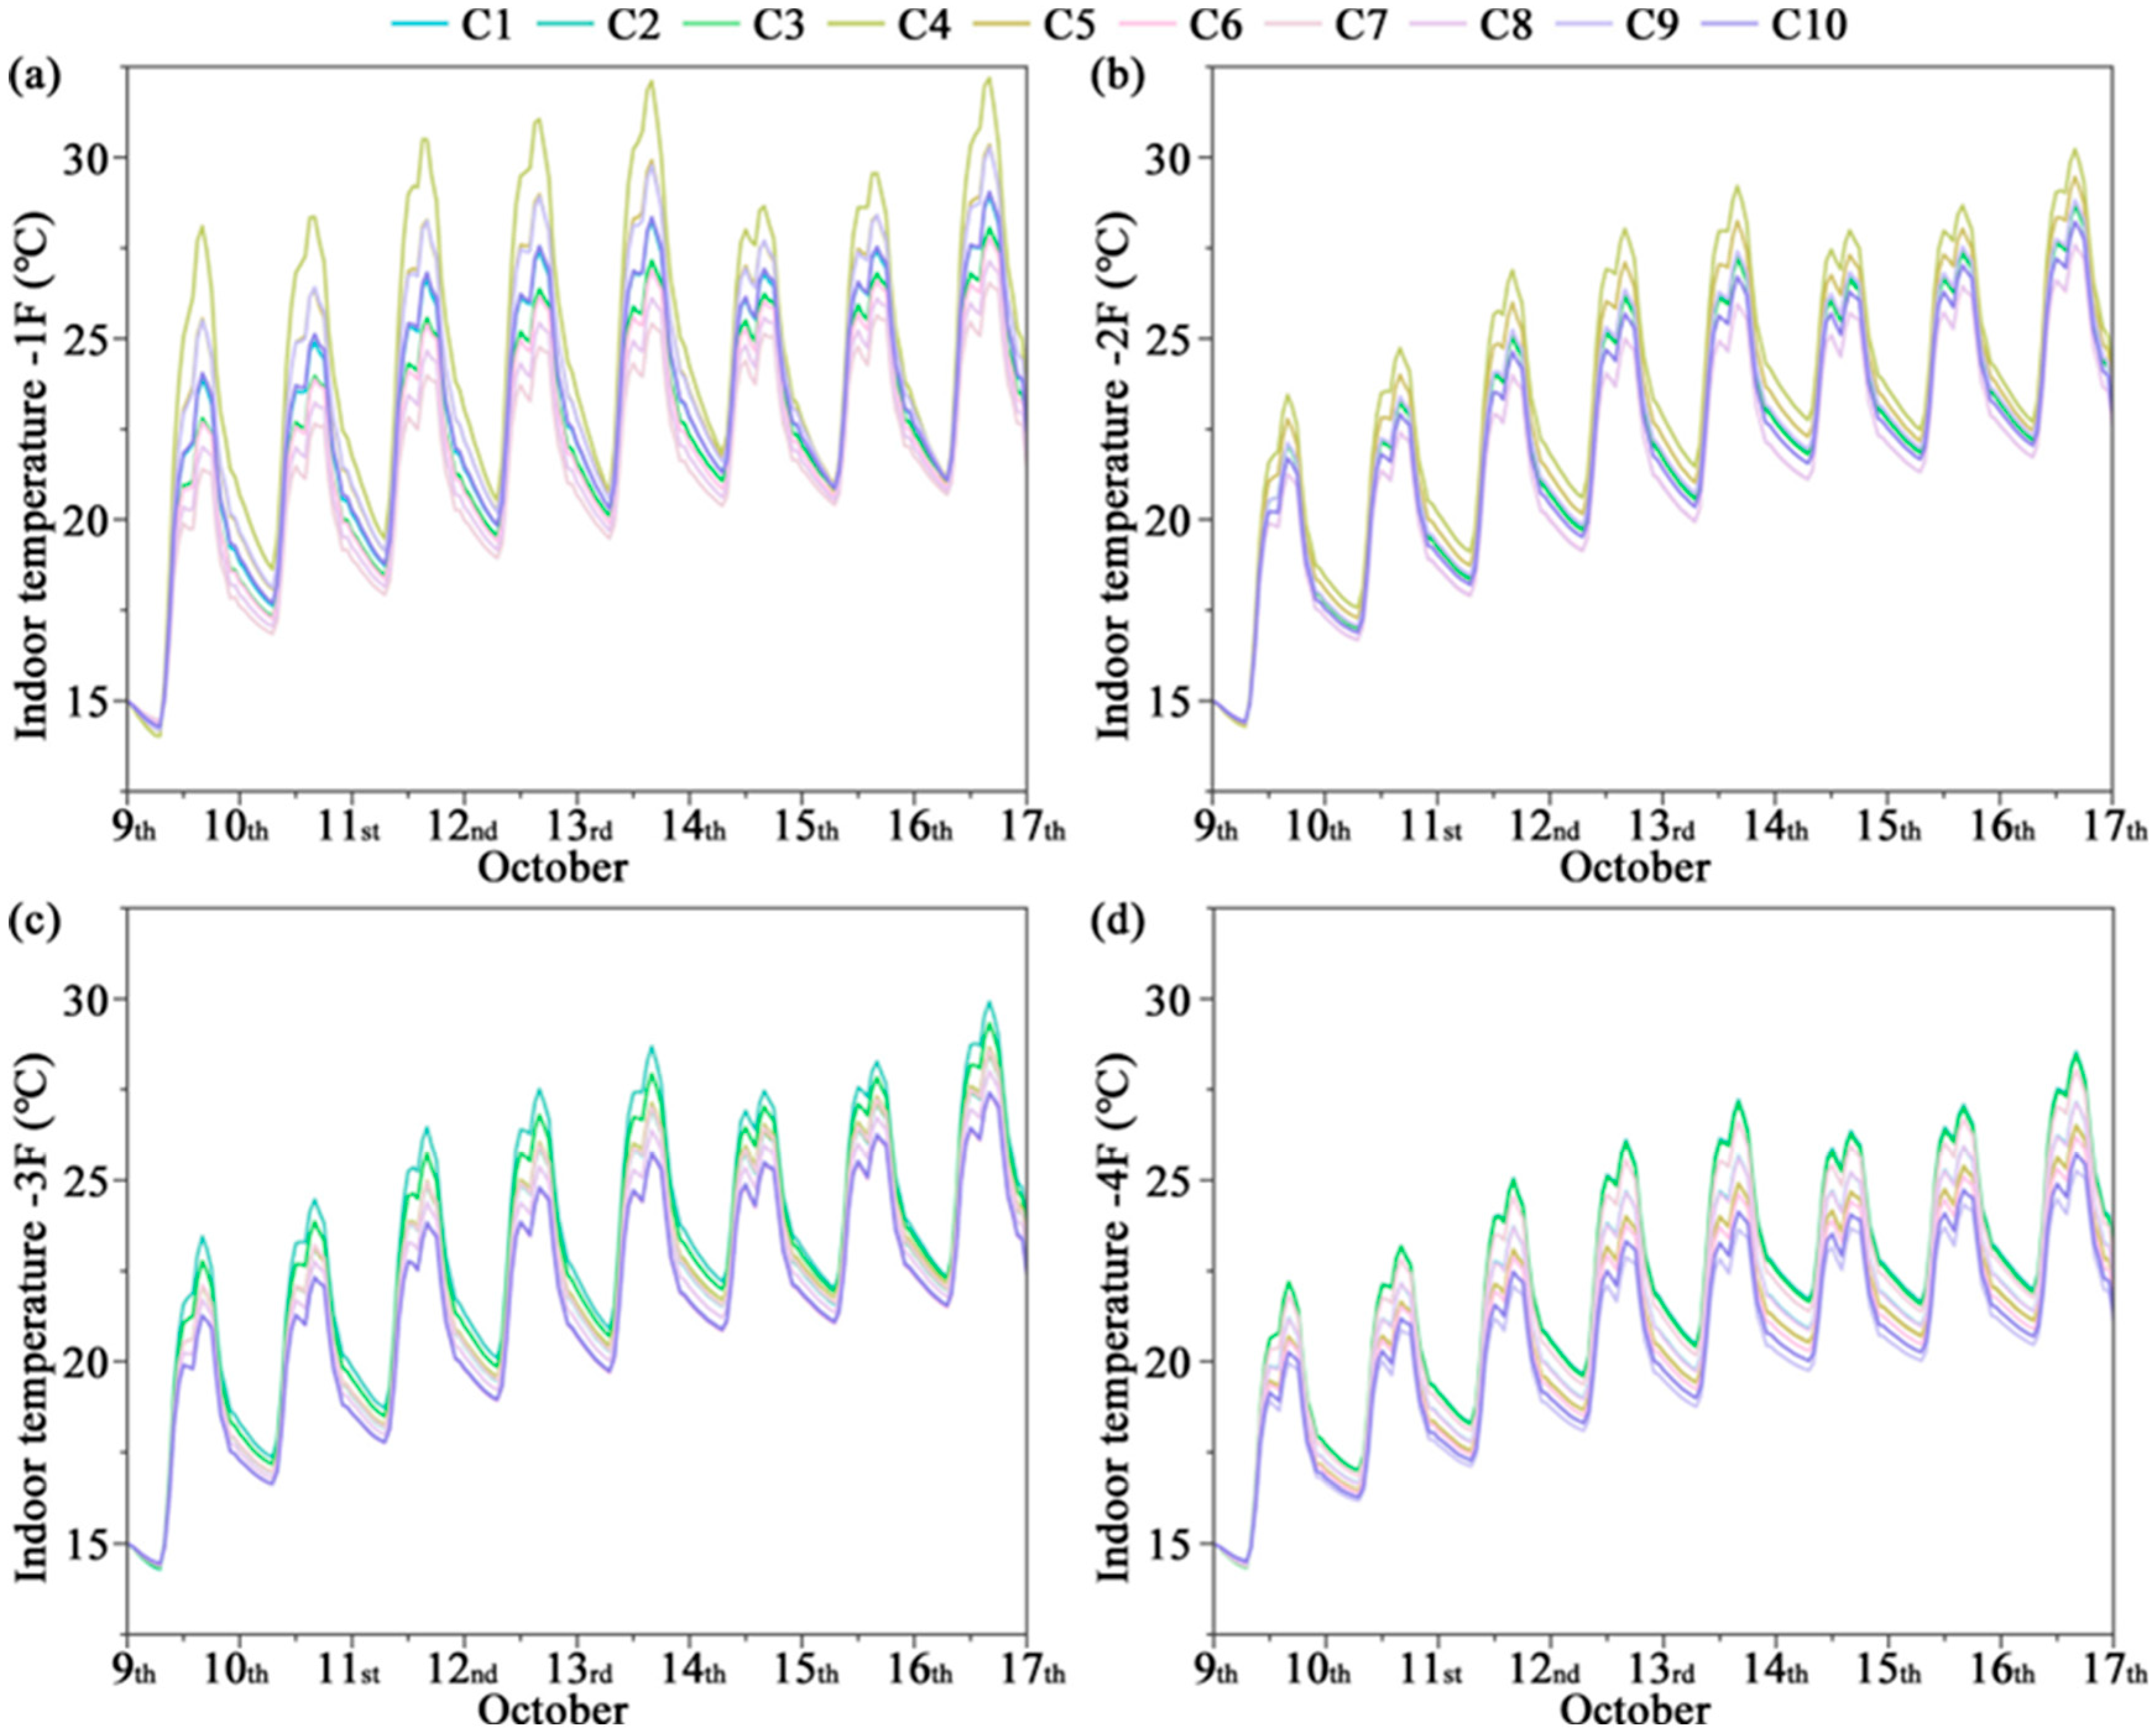
Under non-air-conditioned conditions in October, the indoor temperature variation decreased with increasing floor height (see Figure 6). The maximum temperature on the first floor reached 32.20 °C, and slight overheating was observed when the WWR was 70%. The fourth floor exhibited the lowest average temperature (20.93 °C), with daytime temperatures fluctuating between 14.86 °C and 28.54 °C. Under the same WWR conditions, the use of double glazing reduced the daytime indoor temperature fluctuation by 0.22–1.09 °C compared to single glazing. Overall, double glazing proved to be more effective in enhancing the thermal stability of the middle and upper floors during the transitional season.

3.2. PMV

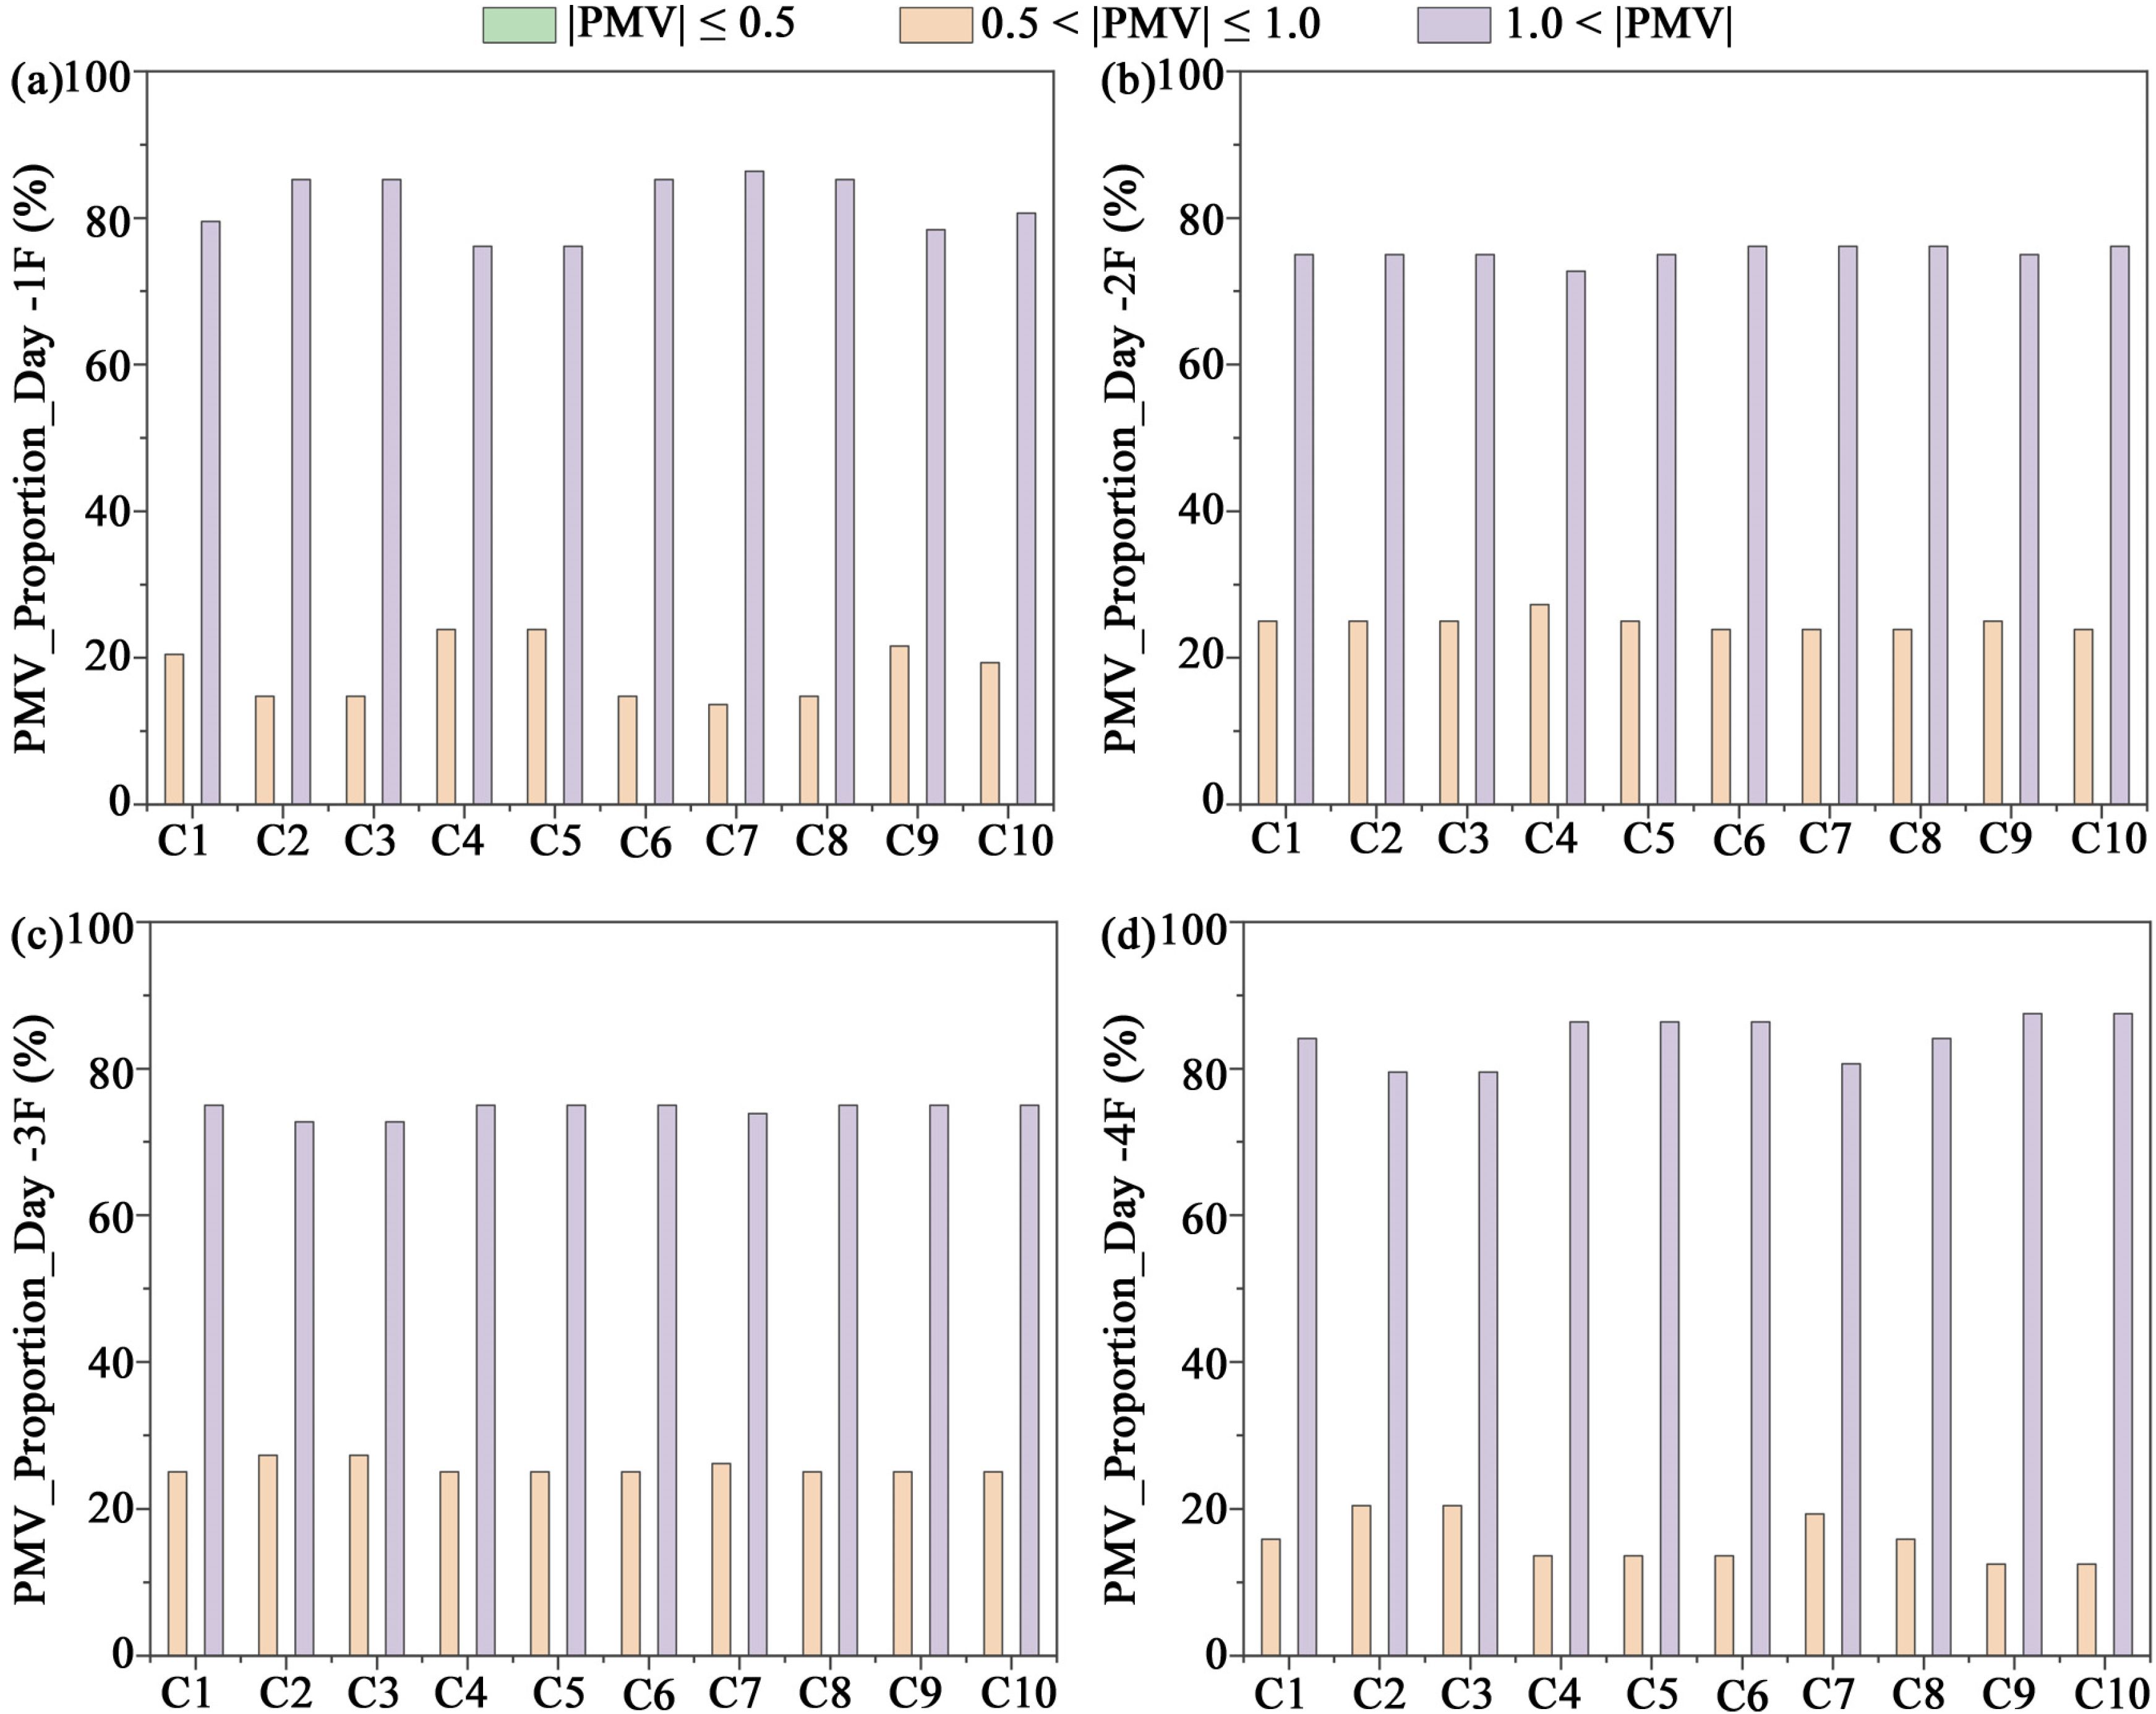
In January, no time periods met the criterion of |PMV| < 0.5 (see Figure 7). Under decreasing WWR conditions, the first floor exhibited a higher proportion of time with 0.5 < |PMV| ≤ 1.0. Compared to double glazing, single glazing maintained thermal comfort conditions for a longer duration. Specifically, scenarios C4 and C5 both showed 23.86% of time within the 0.5 < |PMV| ≤ 1.0 range. On the second floor, the 0.5 < |PMV| ≤ 1.0 proportion was higher when WWR was 50% than when it was 30%; C4 was 2.27% higher than C1–C3 and C5, while C9 was 1.14% higher than C6–C8 and C10. On the third and fourth floors, higher WWRs also corresponded to increased proportions of 0.5 < |PMV| ≤ 1.0. Overall, higher WWRs provided greater potential for daytime thermal comfort in winter.
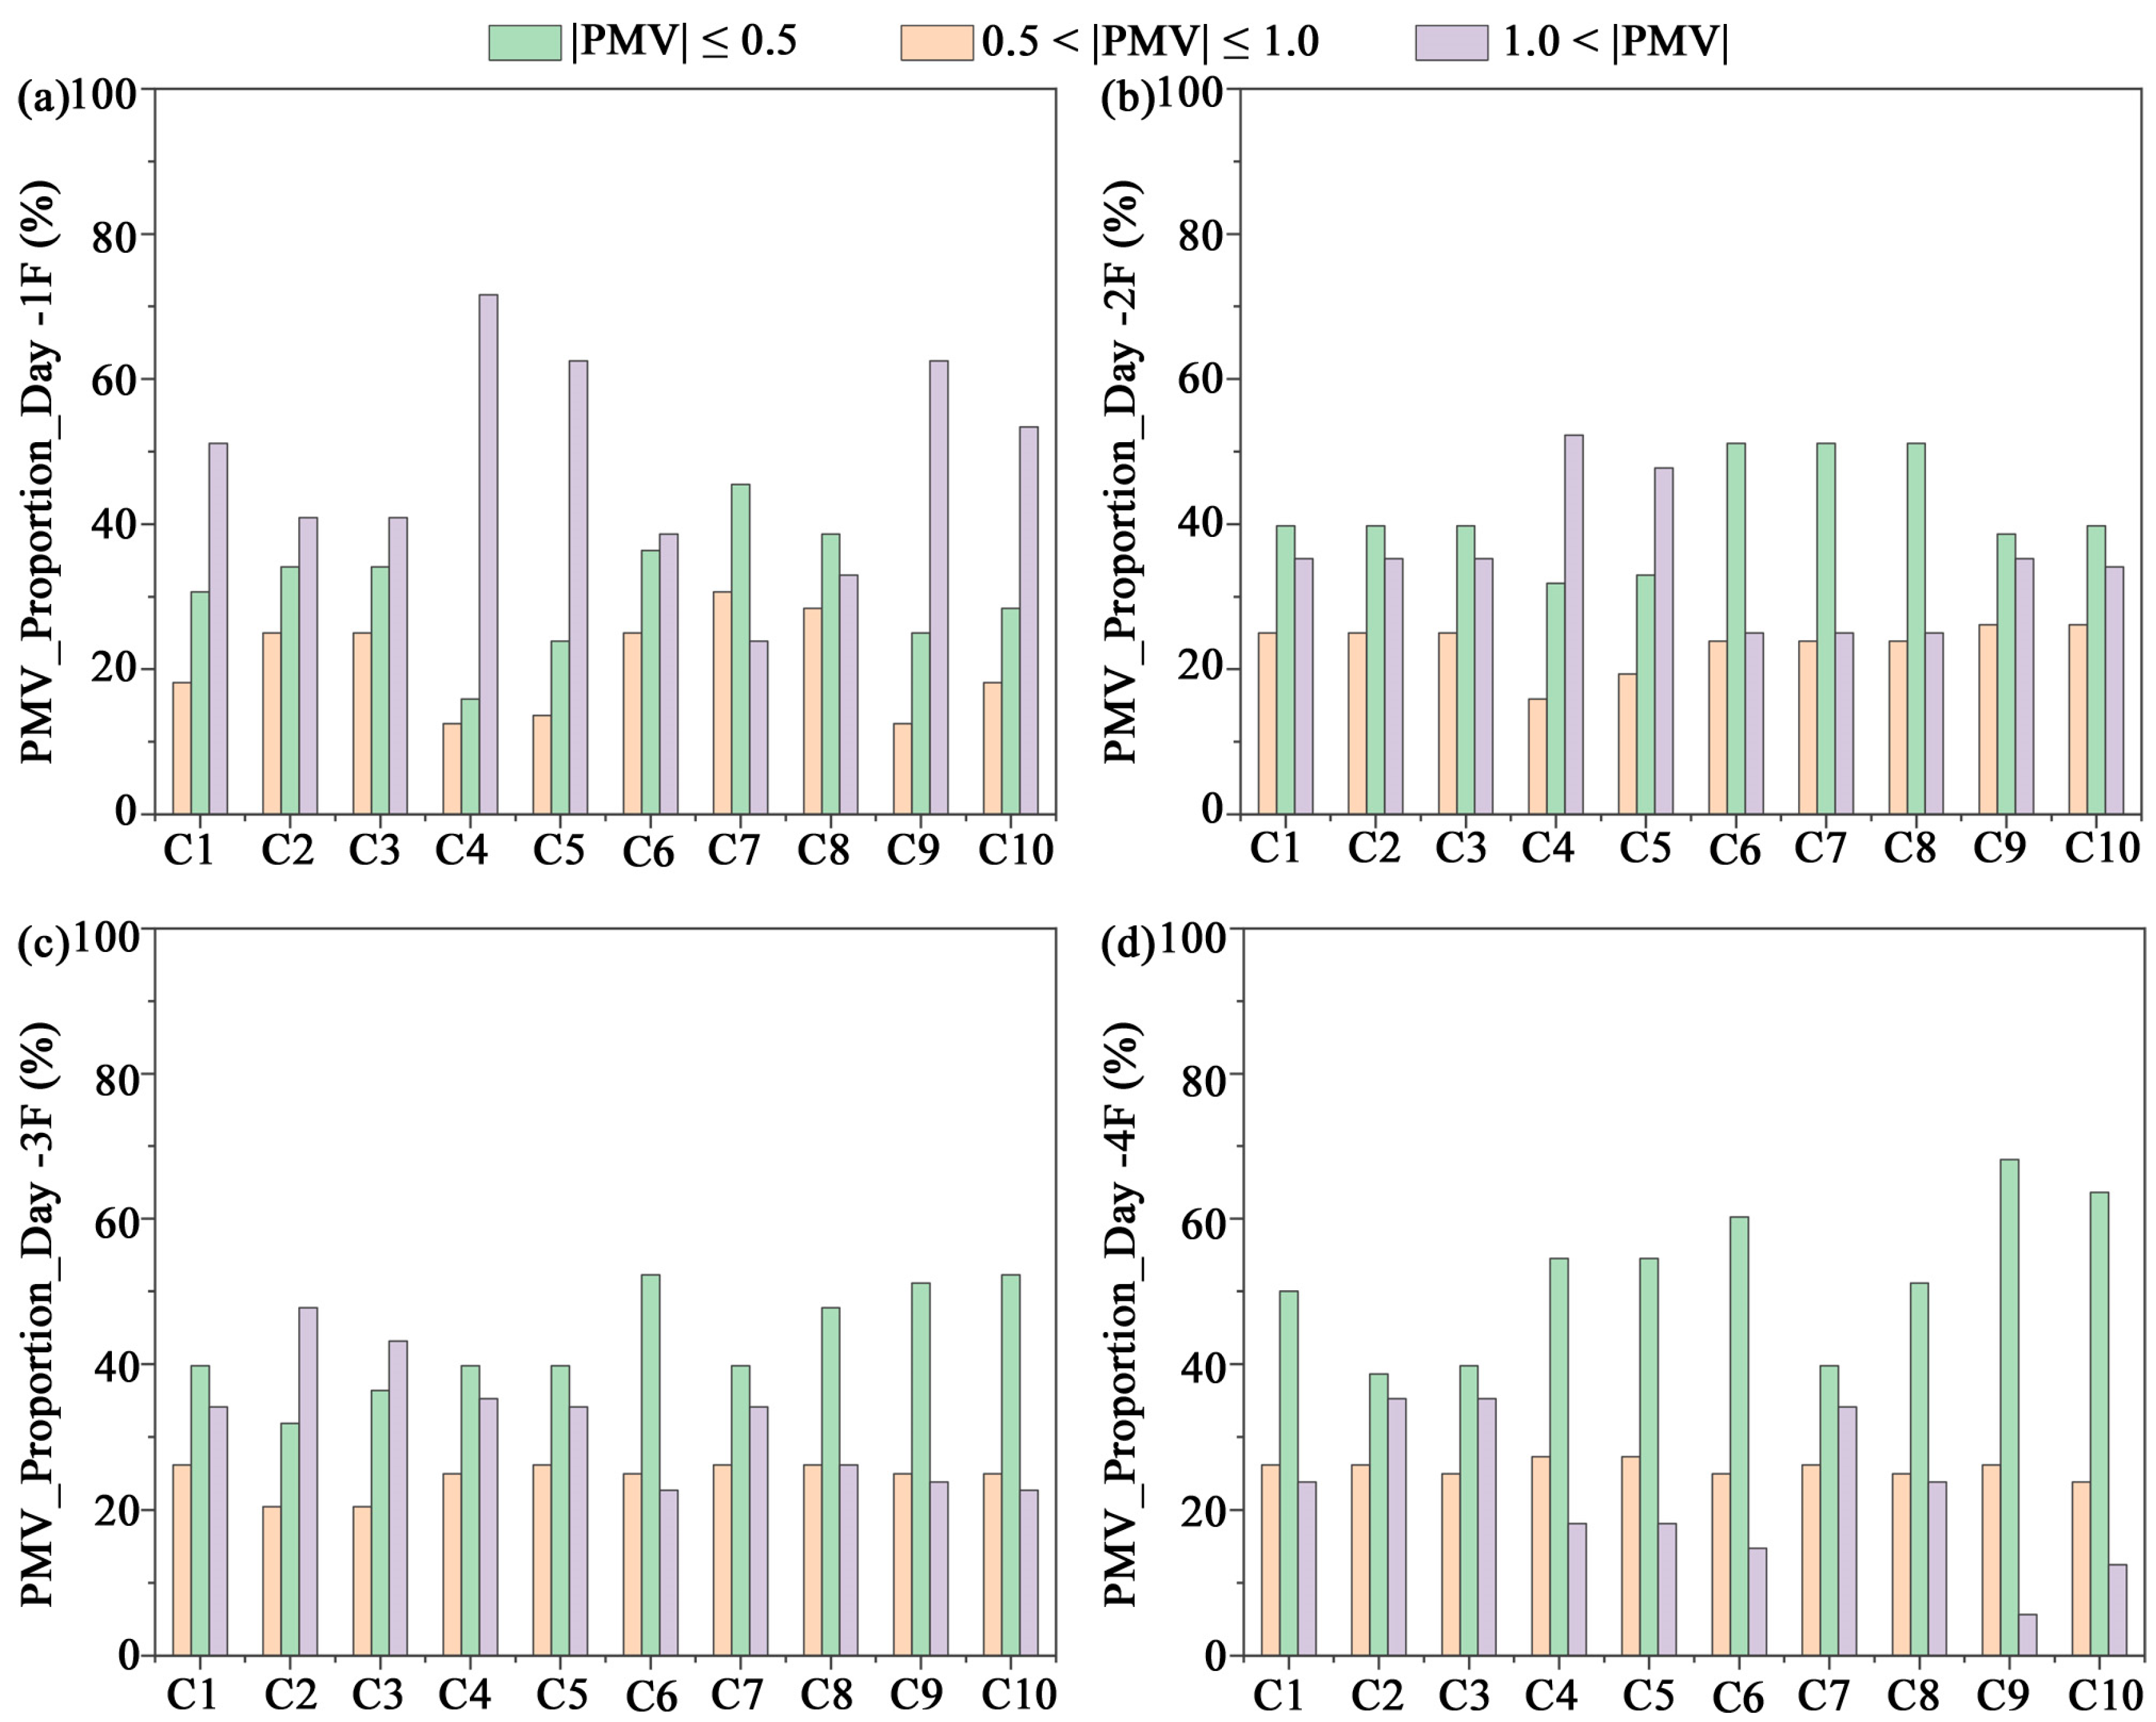
In July, lower WWRs resulted in a higher proportion of time with |PMV| ≤ 0.5 (see Figure 8). On the first floor, when WWR was 10% or 20%, the proportion of |PMV| ≤ 0.5 was relatively high. Specifically, under single glazing, the proportion was 34.09%, while under double glazing, the values reached 45.45% and 38.64%, respectively. On the second floor, for the same WWR values, double glazing consistently provided a higher proportion of |PMV| ≤ 0.5 compared to single glazing. Notably, when WWR was 30%, the highest thermal comfort was observed, with 51.14% of the time falling within |PMV| ≤ 0.5. On the third and fourth floors, single glazing combined with high WWRs resulted in a notably lower proportion of thermally comfortable hours. Overall, in the summer climate of Qingdao, a low WWR combined with double glazing is more effective in achieving a comfortable indoor thermal environment.
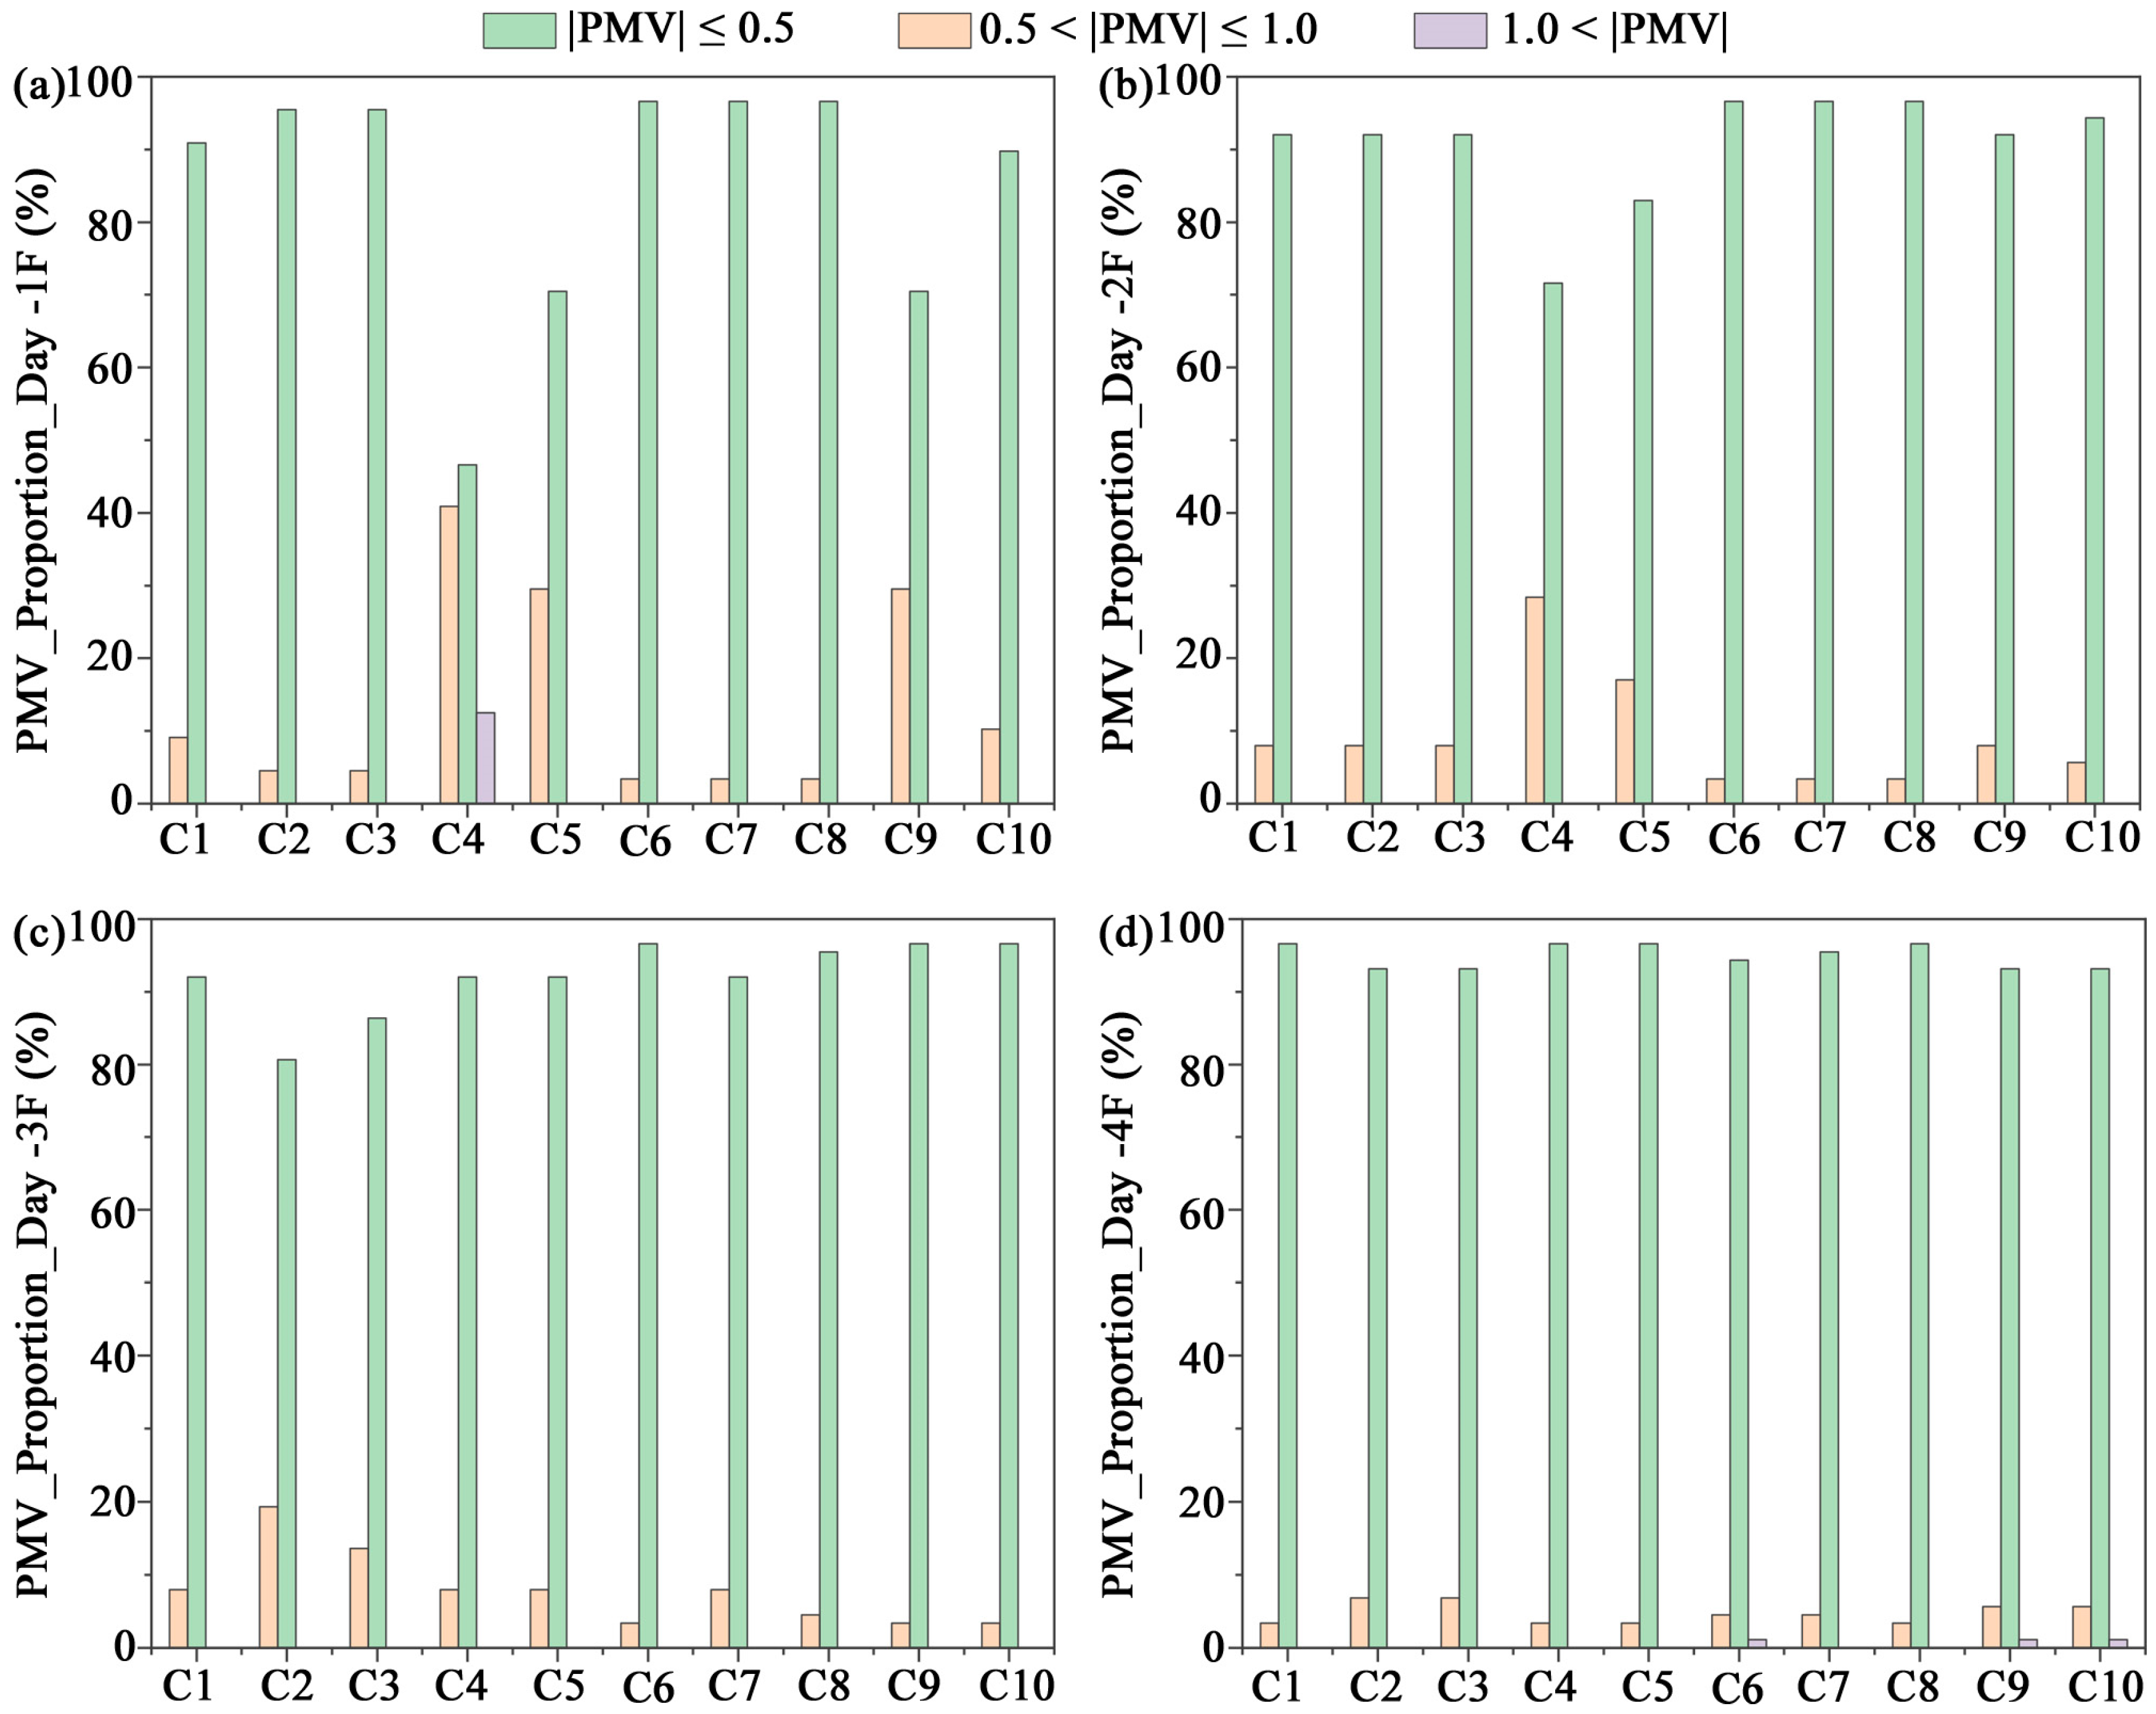
In October, thermal comfort across all floors generally met the criterion of |PMV| ≤ 0.5 (see Figure 9). However, when WWR was excessively high, 12.50% of the time on the first floor exceeded |PMV| > 1.0. Additionally, under conditions C6, C9, and C10, the fourth floor also exhibited 1.14% of hours with |PMV| > 1.0. The proportion of time with |PMV| ≤ 0.5 was slightly higher for double glazing compared to single glazing. These findings suggest that in transitional seasons, maintaining a moderate WWR and prioritizing the use of double-glazed windows are beneficial for sustaining indoor thermal comfort.

3.3. Energy Consumption

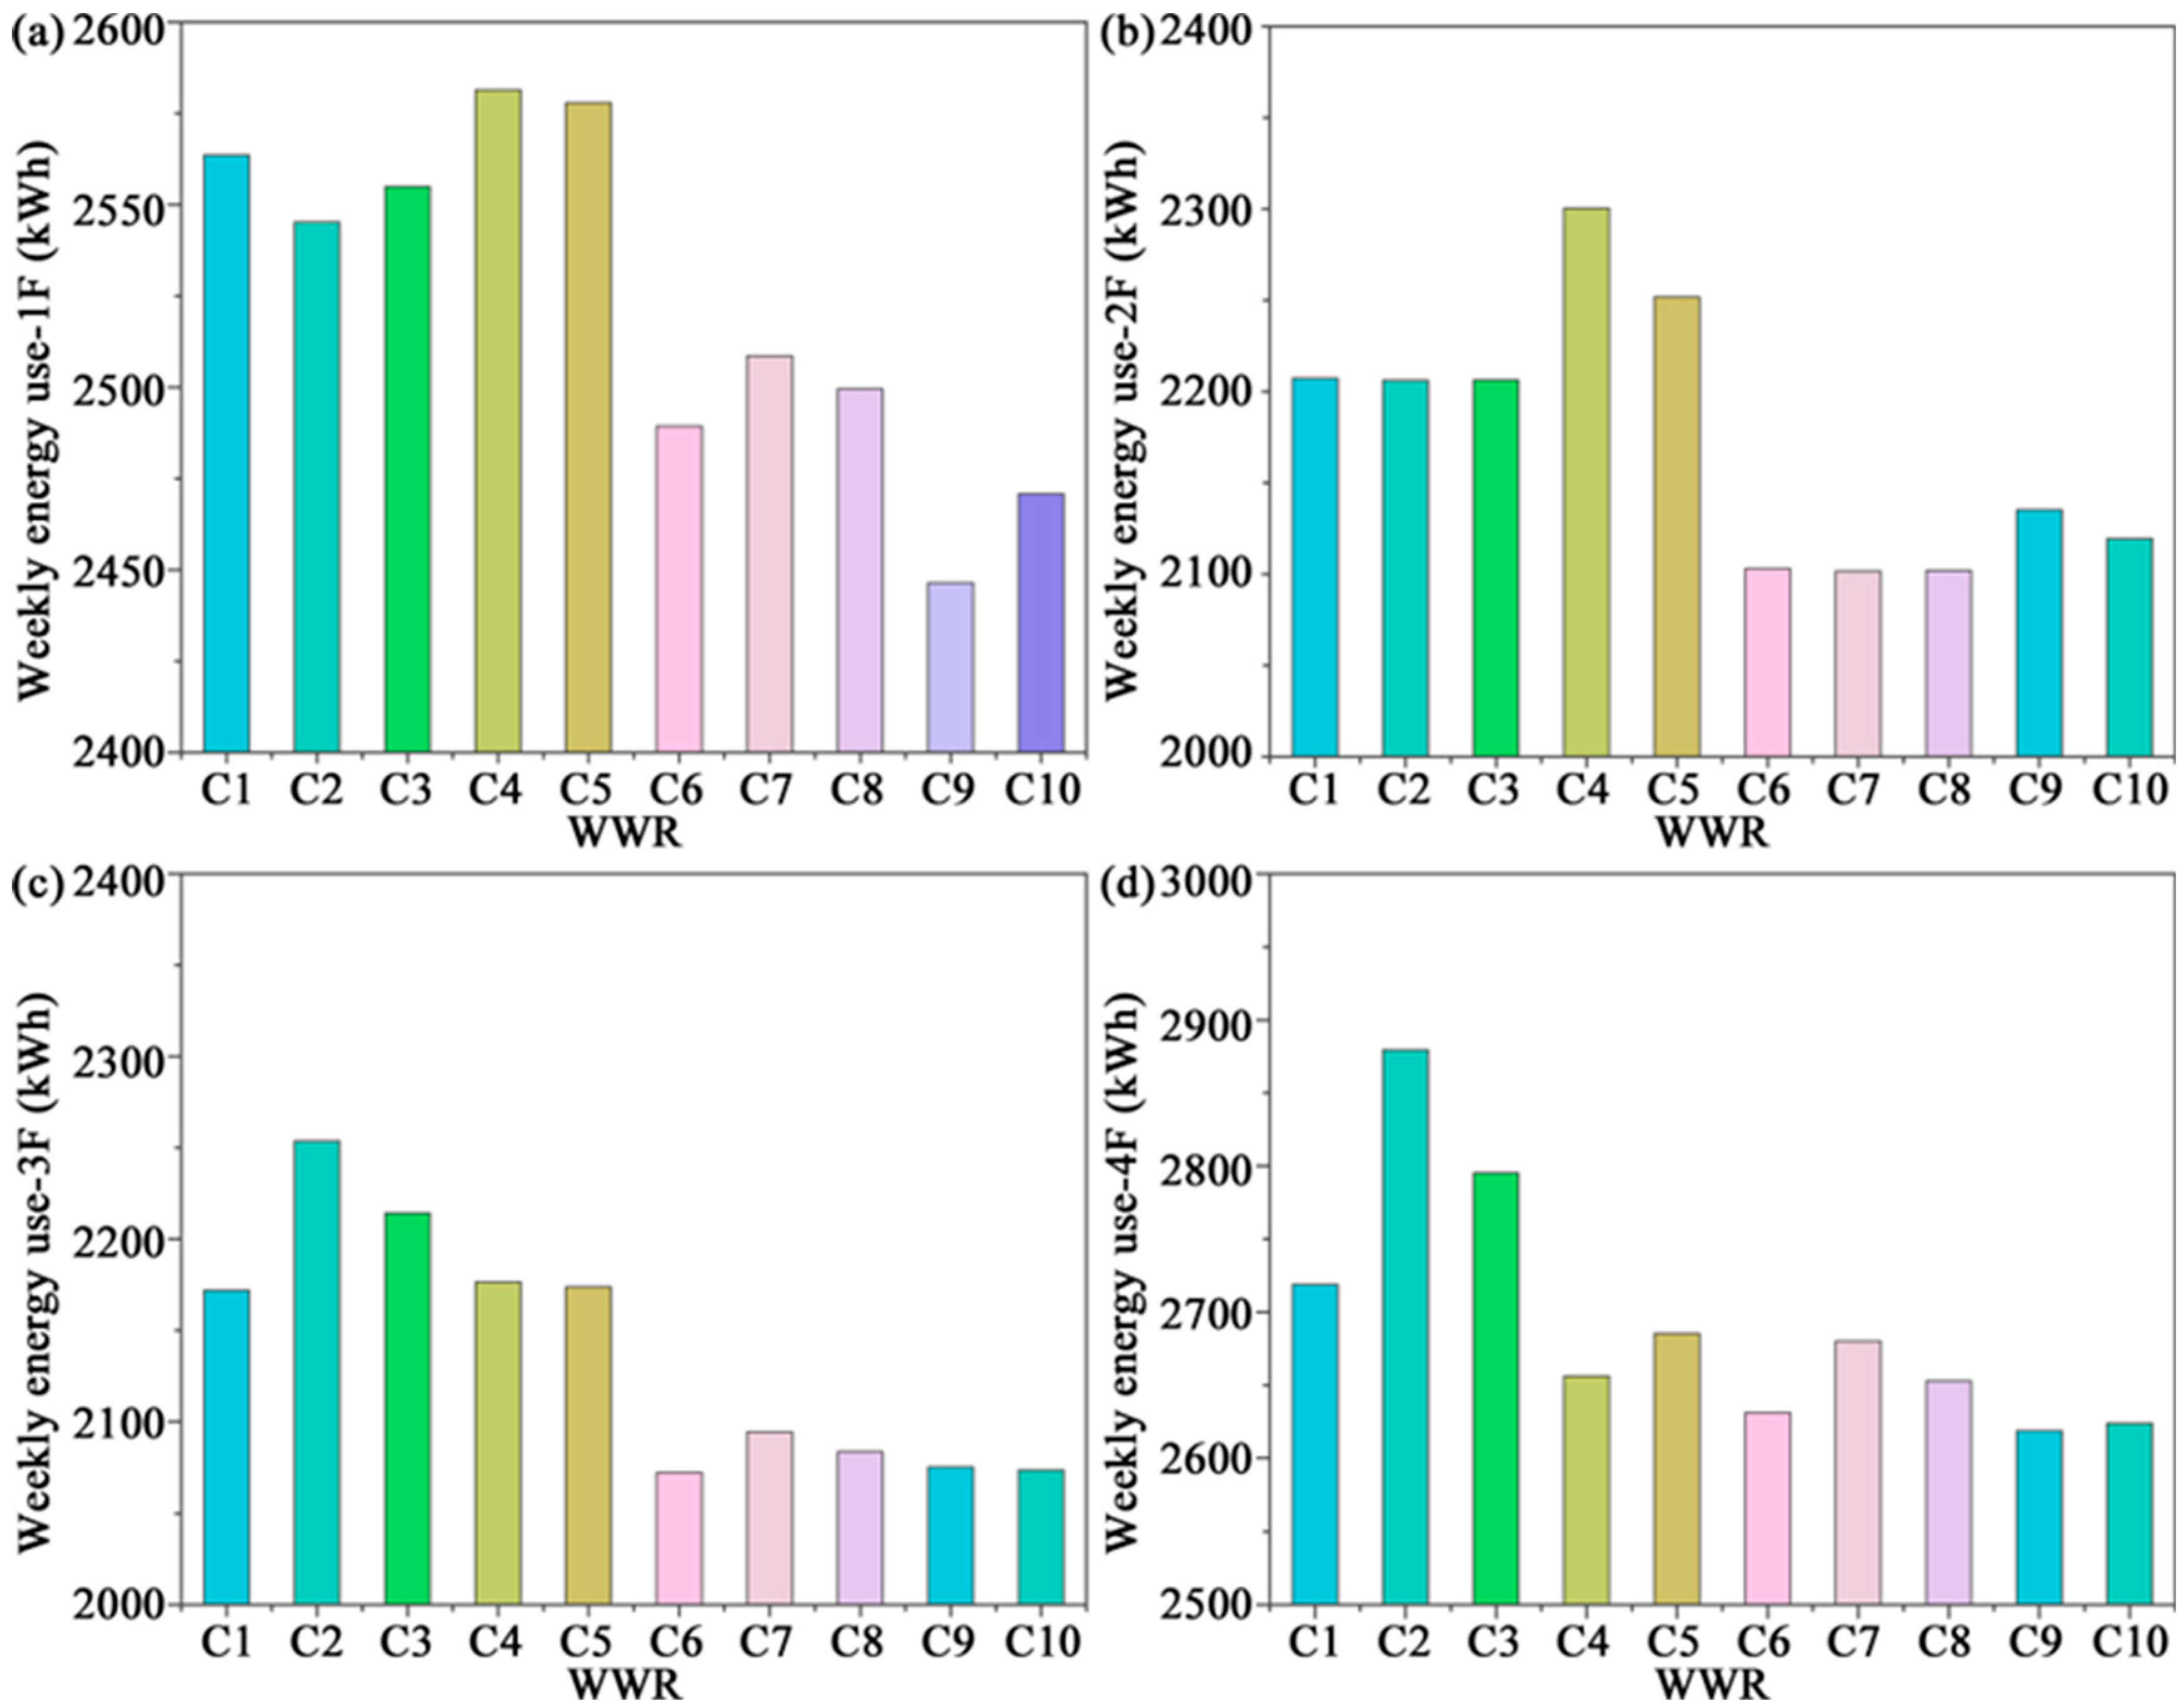
In January, for all floors, the energy consumption associated with single glazing was consistently higher than that of double glazing (see Figure 10 and Table A1, Table A2, Table A3 and Table A4). The energy use on the ground floor (1F) and the top floor (4F) was greater than that of the intermediate floors (2F and 3F). On 1F, scenarios C4 and C5 exhibited relatively high energy consumption, at 2581.42 kWh and 2577.99 kWh, respectively, while scenario C9 had the lowest energy use at 2446.46 kWh. On 2F, the lowest energy consumption was observed when WWR was 30%. Unlike 1F and 2F, on 3F, energy consumption in C2 and C3 exceeded that of C4 and C5; similarly, C7 and C8 exceeded C9 and C10. This pattern became more pronounced on 4F, where a lower WWR (e.g., 10%) resulted in significantly reduced energy demand. Specifically, scenario C4 consumed 29.22–223.53 kWh less energy than C1–C3 and C5, while C9 consumed 5.15–61.43 kWh less than C6–C8 and C10.
In January, the total energy load of the entire building was consistently lower when double glazing was used compared to single glazing (see Figure 11). Under the same WWR conditions, the use of double glazing resulted in a reduction of 366.30 to 499.98 kWh in energy consumption. The lowest overall energy consumption was observed in scenario C9, at 9275.52 kWh. As shown in Figure 11b, the energy-saving advantage of double glazing became increasingly pronounced over time.
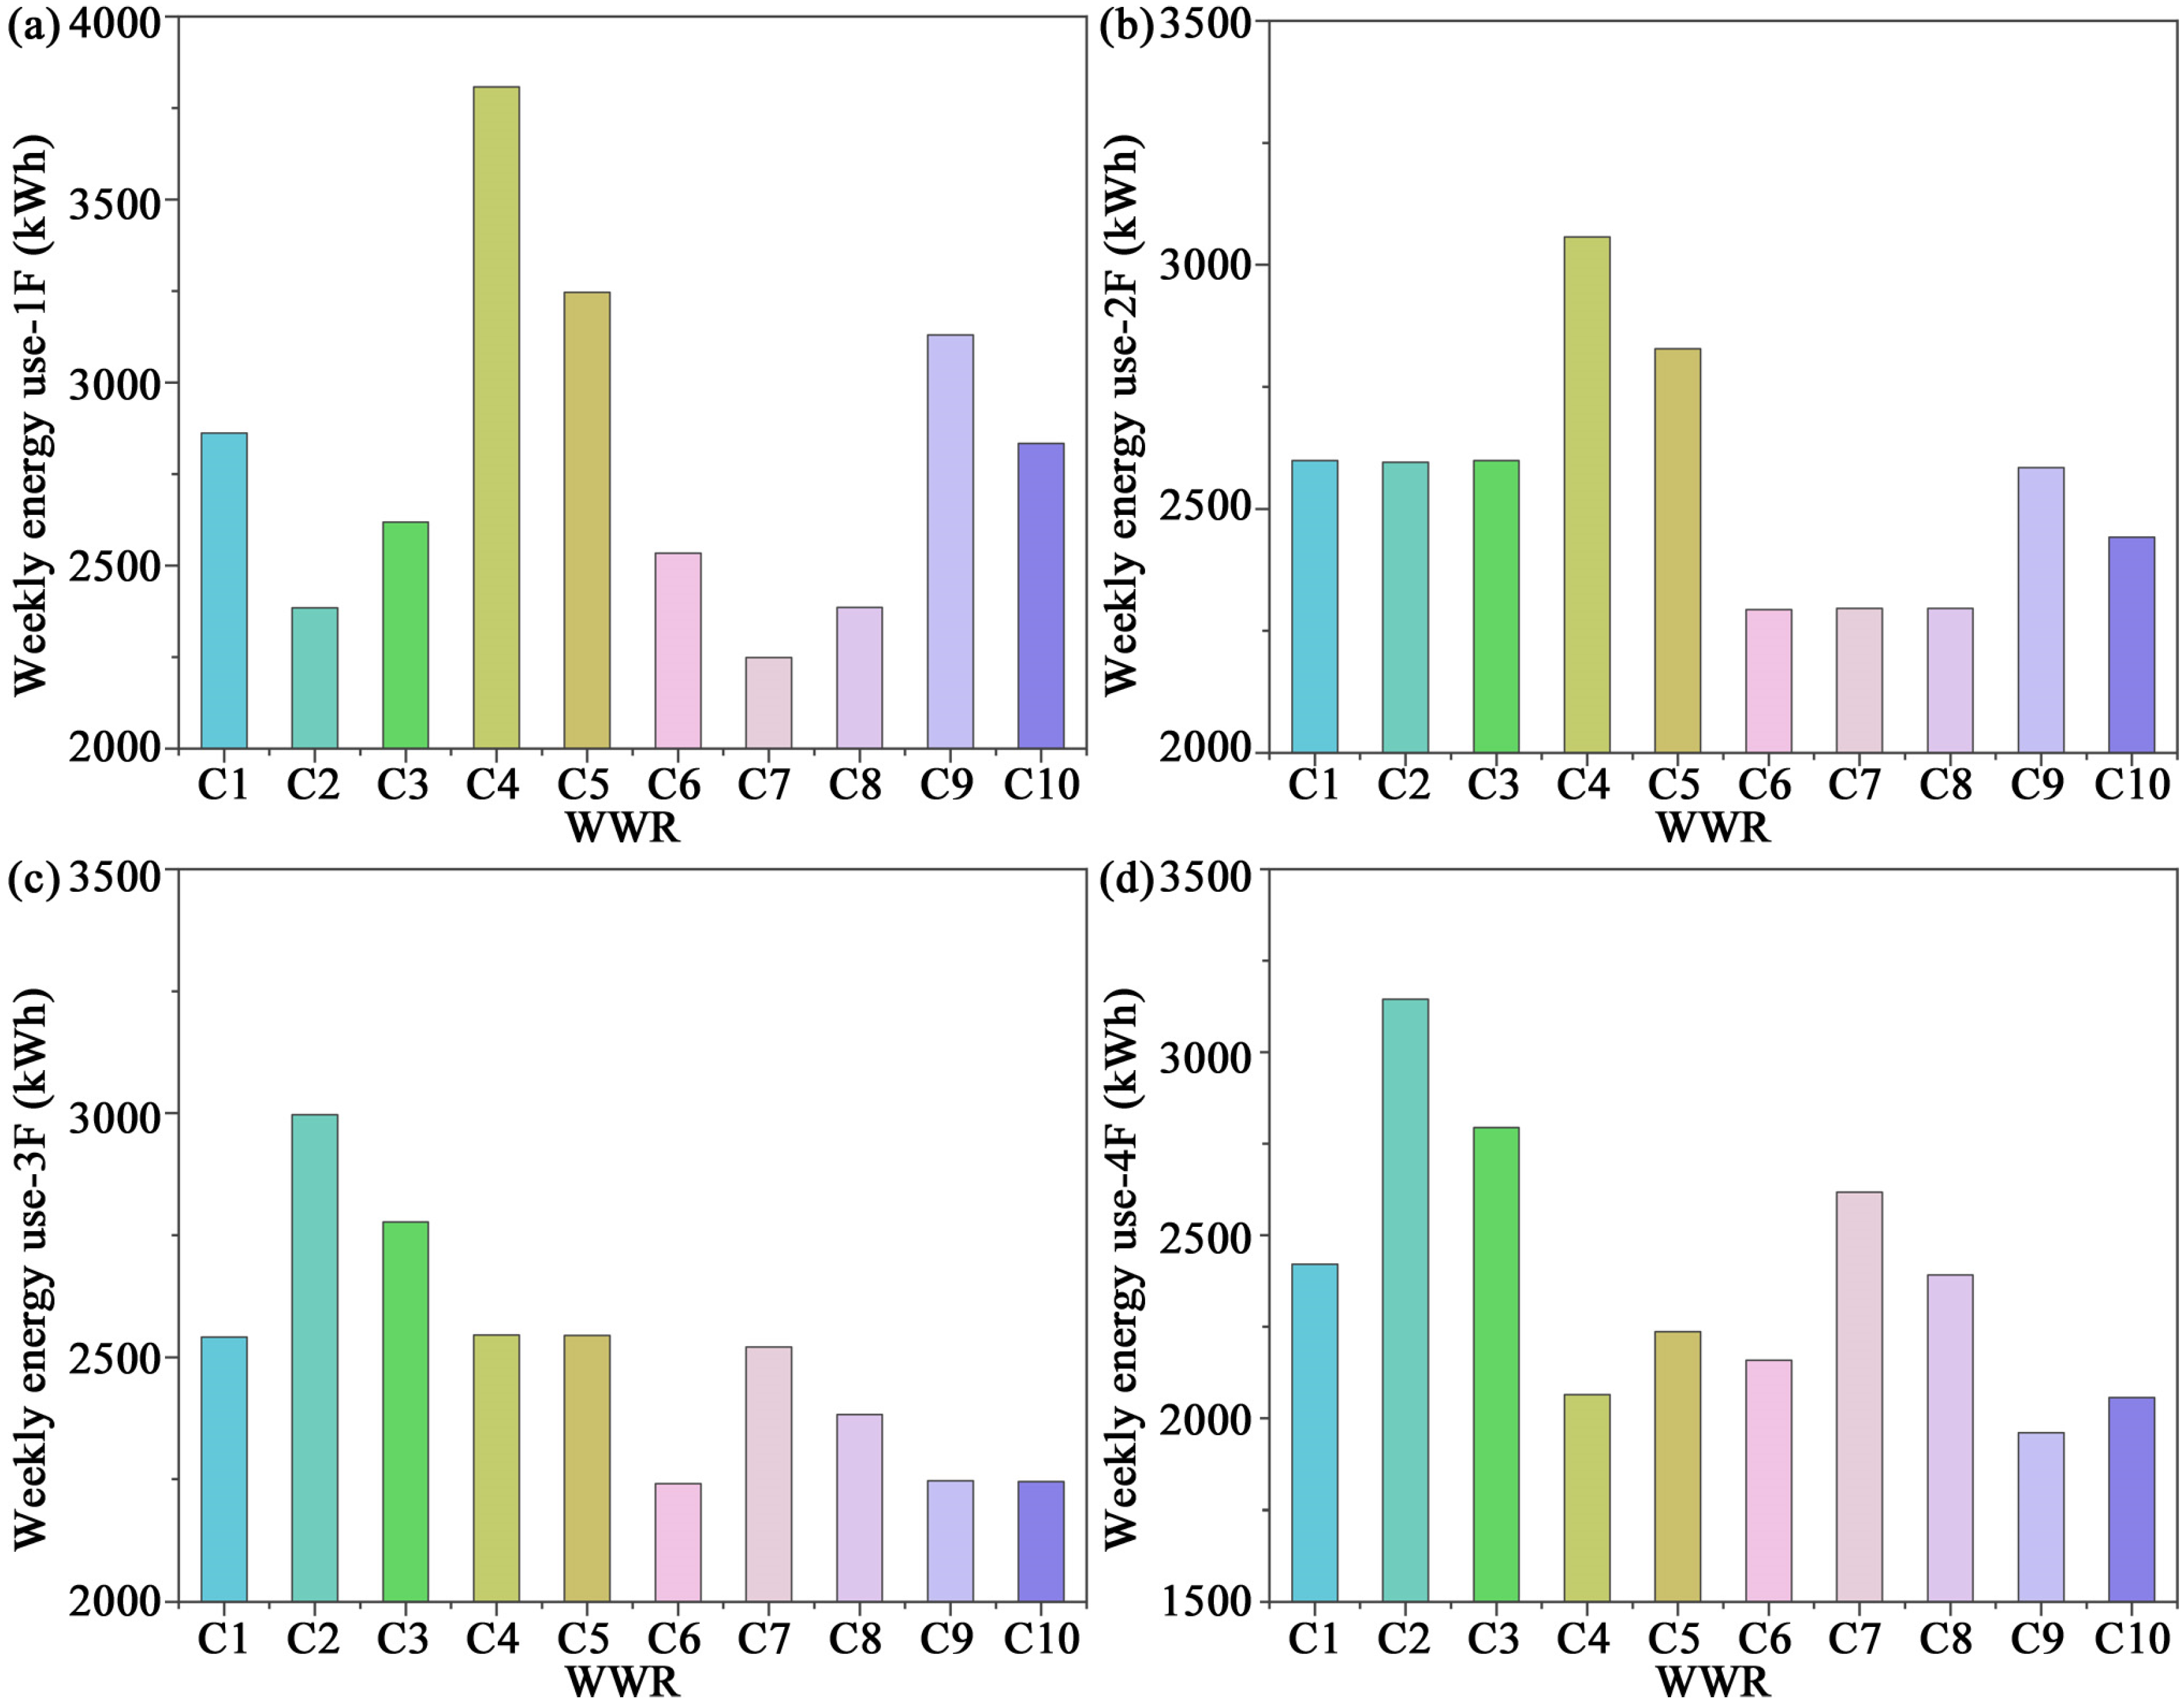
In July, energy consumption exhibited notable differences across floors under various WWR and glazing configurations (see Figure 12 and Table A5, Table A6, Table A7 and Table A8). For 1F, scenarios with sharply or gradually decreasing WWR exhibited the highest energy consumption, followed by uniform WWR settings, while sharply increasing WWR resulted in the lowest energy use. On 2F and 3F, scenarios with a WWR of 30% demonstrated lower energy consumption compared to those with WWR values of 40% or 50%. For 4F, energy consumption consistently decreased as WWR decreased. Overall, in July, a lower WWR corresponded to reduced energy consumption across all floors.
In July, scenarios with a uniform WWR of 30% yielded the lowest overall energy consumption, with C1 and C6 consuming 10,423.62 kWh and 9225.88 kWh, respectively (see Figure 13). Schemes with slight variations in WWR resulted in lower energy use compared to those with large variations. Specifically, C3 and C5 consumed 333.62 kWh and 617.80 kWh less energy than C2 and C4, respectively, while C8 and C10 reduced energy consumption by 228.75 kWh and 344.25 kWh compared to C7 and C9. Furthermore, under the same variation magnitude, schemes with WWR gradually increasing from bottom to top exhibited lower energy consumption than those with decreasing WWR. For instance, C2 consumed 333.62 kWh less than C4, C3 consumed 617.80 kWh less than C5, C8 consumed 228.75 kWh less than C7, and C10 consumed 344.25 kWh less than C9.
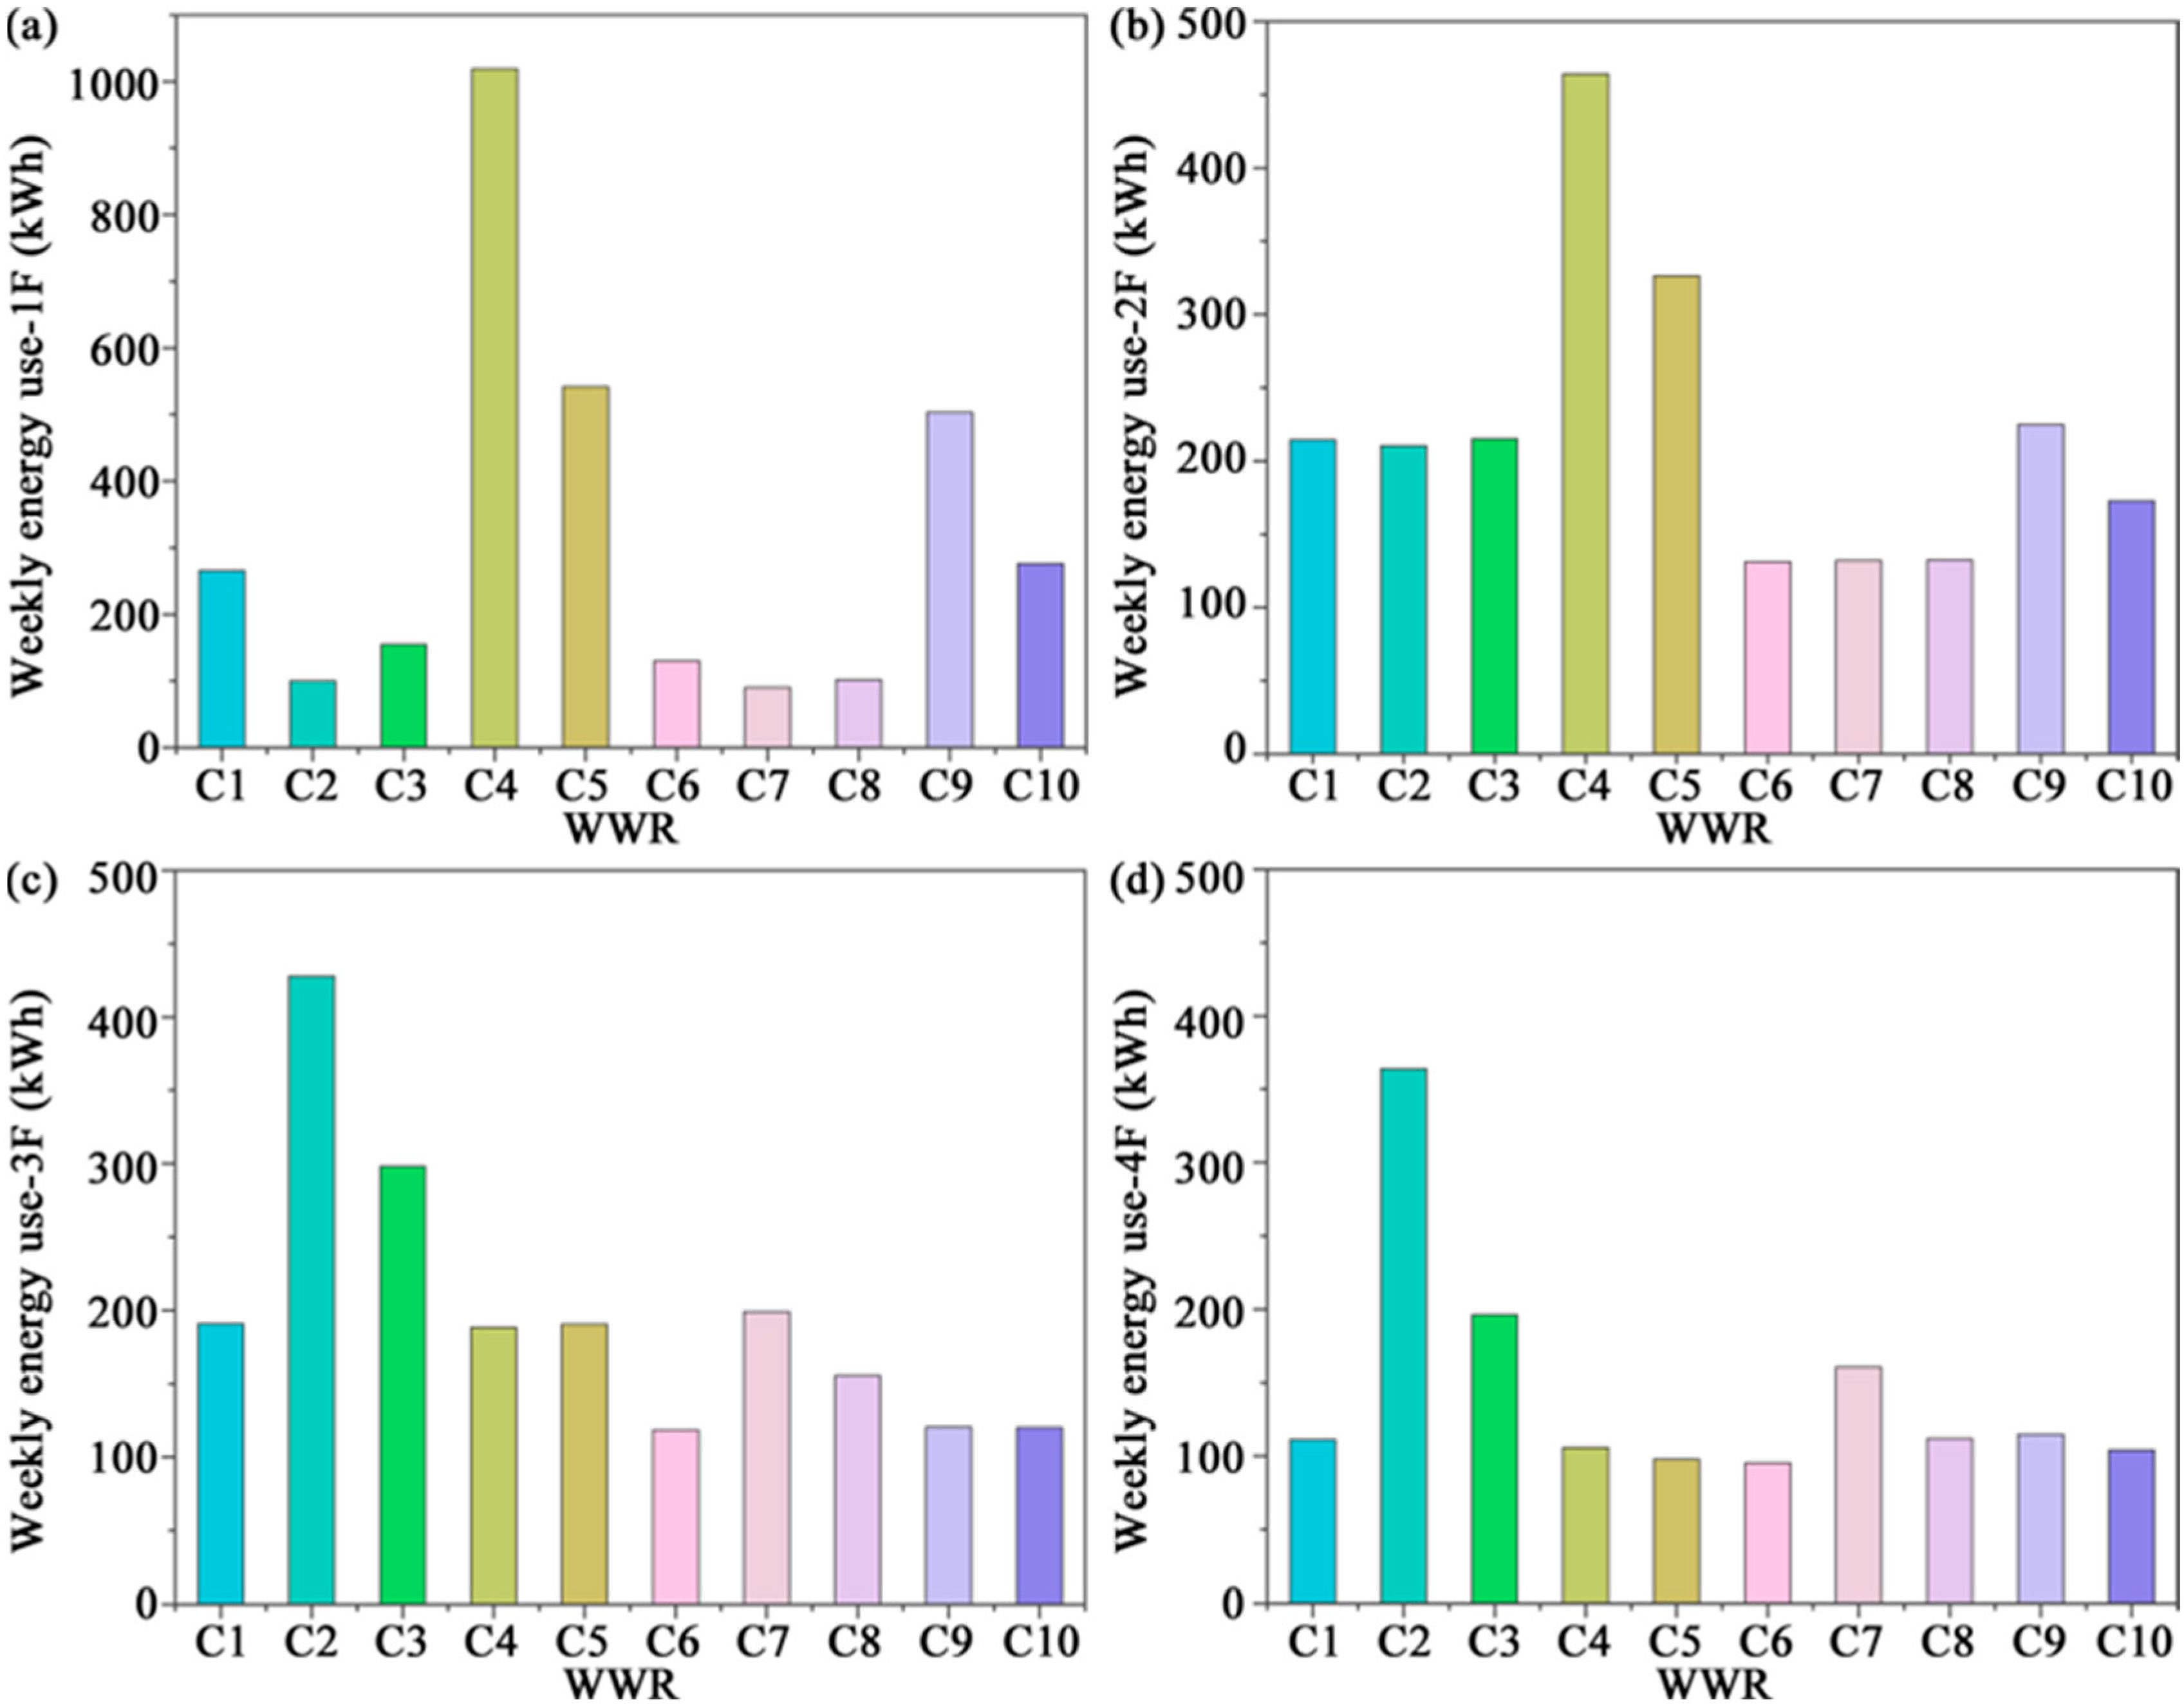
In October, energy consumption across all floors decreased as the WWR decreased (see Figure 14 and Table A9, Table A10, Table A11 and Table A12). On the 1st floor, the highest energy use occurred under the decreasing WWR scenarios, particularly for C4 and C9, with consumption reaching 1018.86 kWh and 503.04 kWh, respectively. A similar trend was observed on the 2nd floor. On the 3rd floor, WWRs of 30% resulted in the lowest energy consumption compared to 40% and 50%: for single glazing, energy use was reduced by 107.26–236.98 kWh, while for double glazing, the reduction ranged from 37.06 to 80.63 kWh. On the 4th floor, when the WWR was 10%, 20%, or 30%, the energy consumption remained similar regardless of glazing type (ranging from 95.43 to 114.96 kWh). However, when the WWR reached 70%, the energy consumption for single glazing was significantly higher than that for double glazing, with an increase of 203.38 kWh.
In October, scheme C4 exhibited the highest total energy consumption (1751.29 kWh), whereas C6 showed the lowest (462.28 kWh), followed by C8 (493.37 kWh) (see Figure 15). During the period from October 12th to 15th, schemes with increasing WWR configurations consumed significantly more energy than the others. Overall, configurations with large variations in WWR across floors resulted in higher energy demand.

3.4. Summary

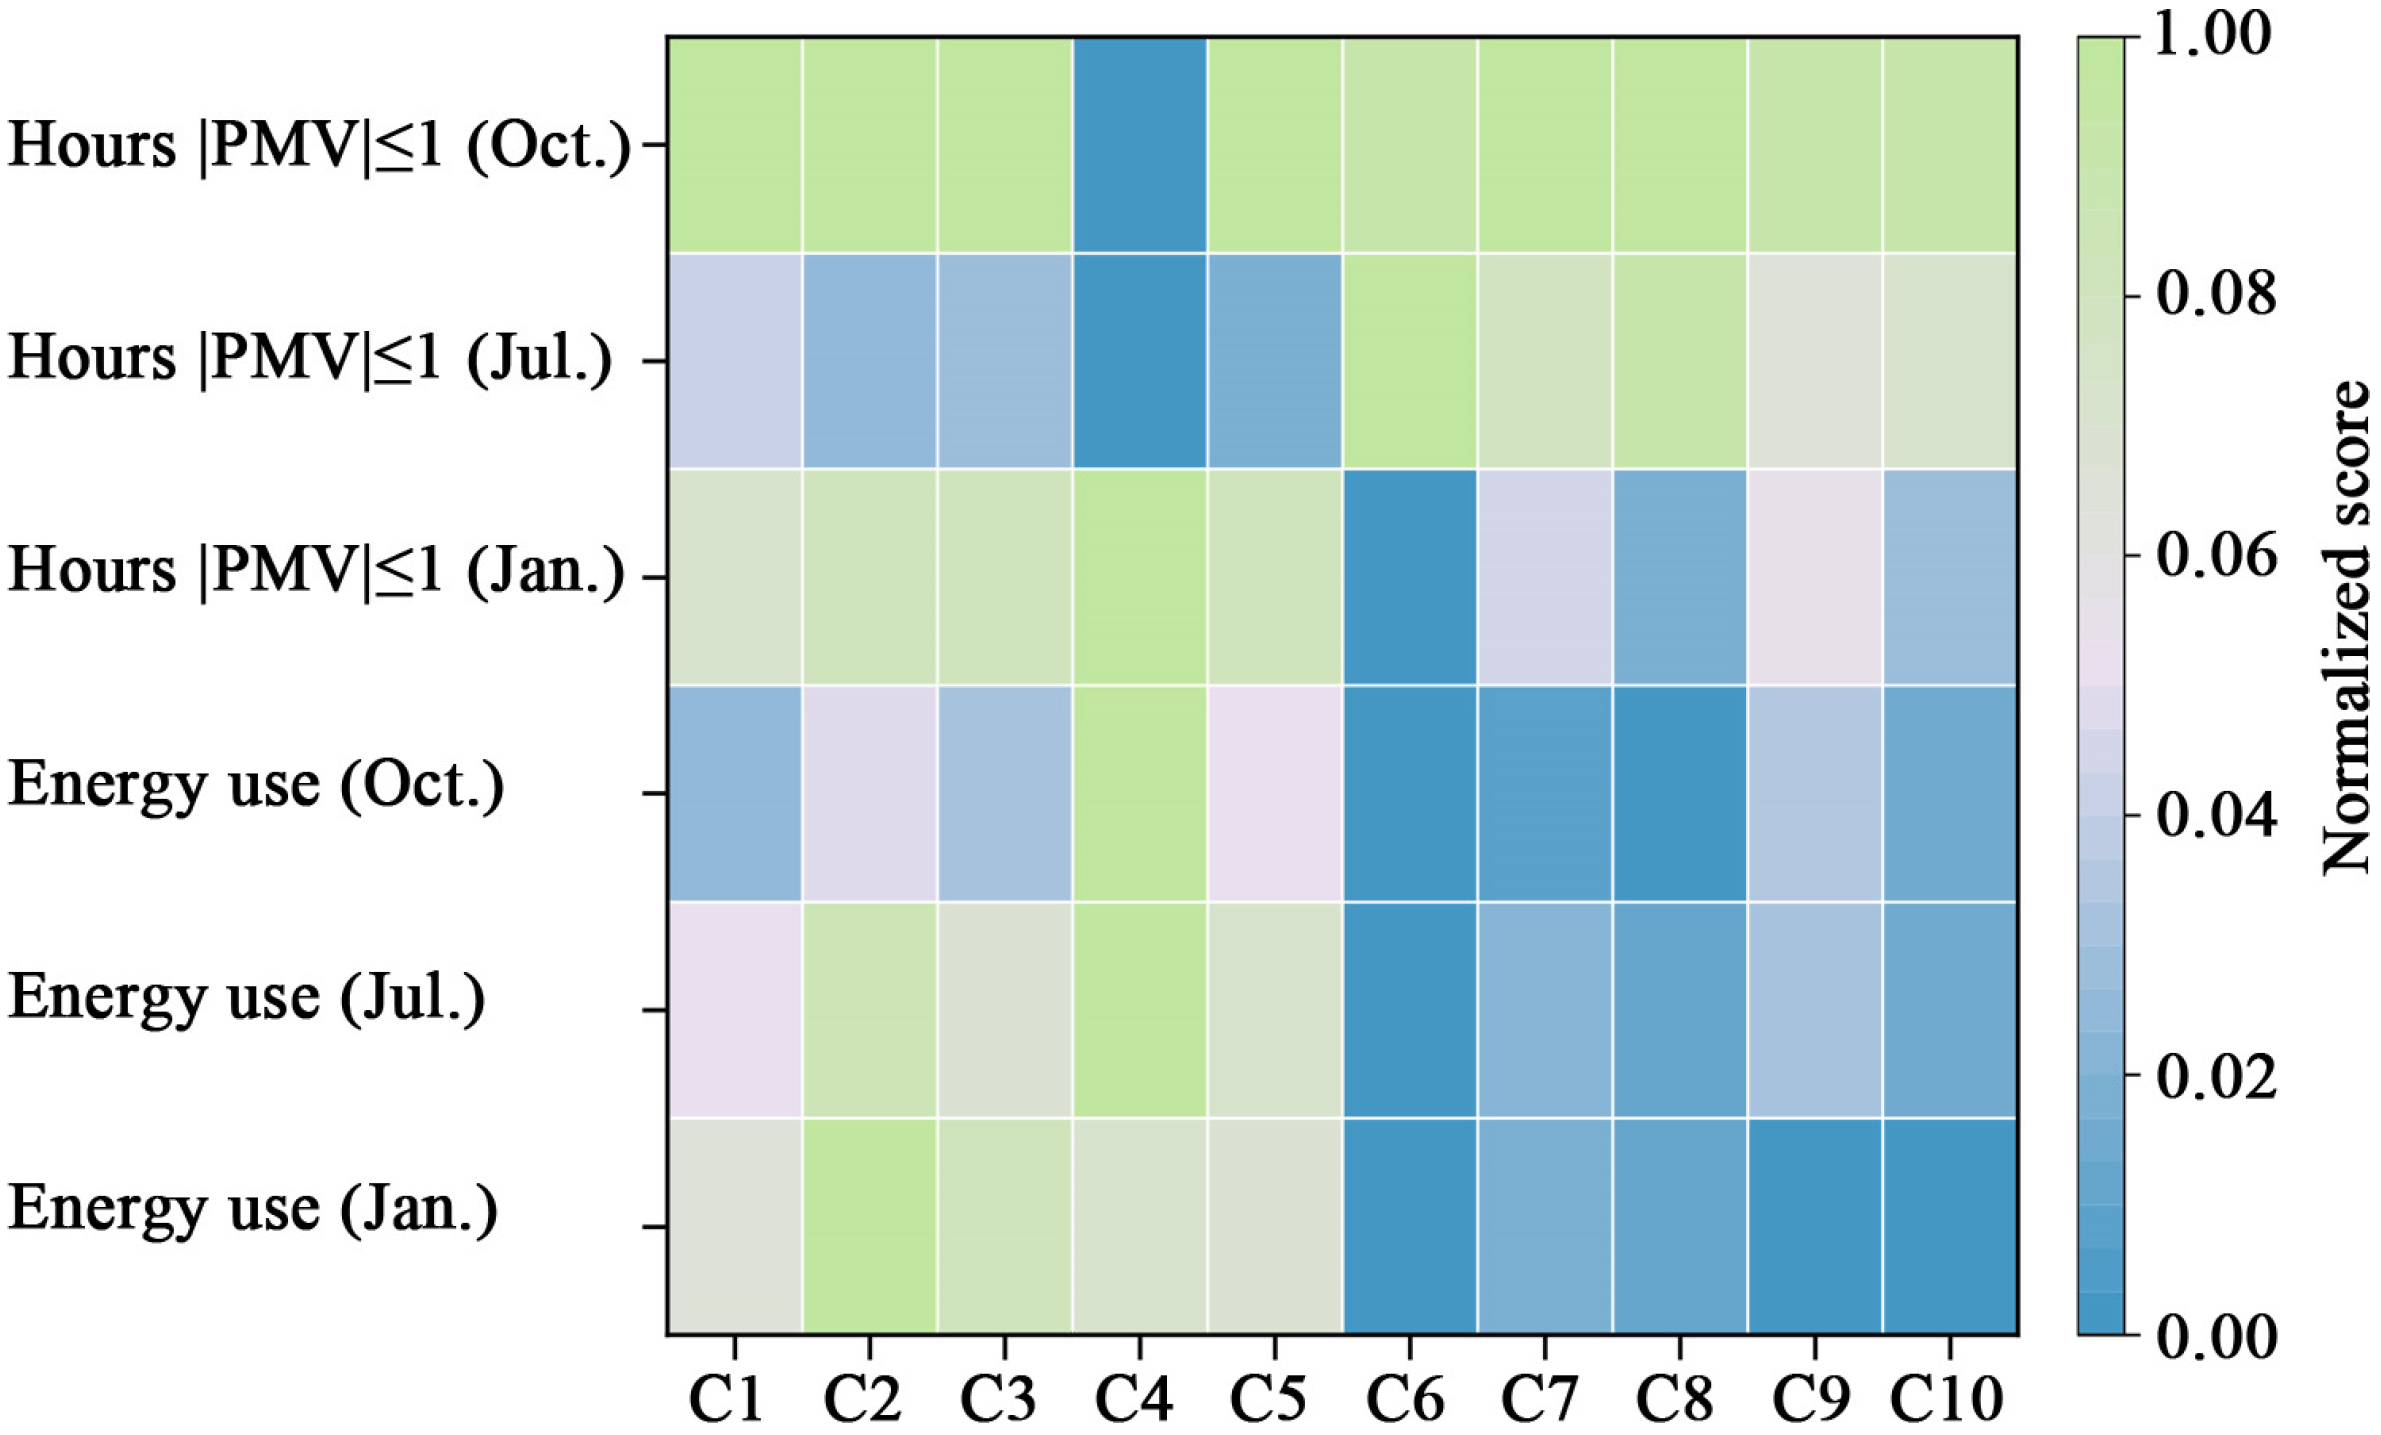
To provide a more intuitive comparison of the performance of scenarios C1–C10 across the three seasons, the indicator Hours |PMV| ≤ 1 represents the total hours during which the entire building maintained |PMV| ≤ 1. All indicators were normalized using the min–max method, with the color bar indicating normalized scores ranging from 0 to 1, where blue to light green represents low to high values (see Figure 16). In terms of thermal comfort, the Hours |PMV| ≤ 1 row in October appears predominantly light green, suggesting that all scenarios generally achieved longer comfort hours during the transitional season. In July, the differences were more pronounced, with single glazing performing worse than double glazing. Interestingly, in January, single glazing provided longer comfort hours compared with double glazing. With respect to energy use, significant differences were observed between single-glazing scenarios (C1–C5) and double-glazing scenarios (C6–C10), with the latter consistently exhibiting lower energy demand. Overall, scenario C6 demonstrated the most balanced performance, whereas configurations with large vertical variations in WWR showed inferior results.
In order to assess how various WWR–glazing configurations influence building energy consumption, the simulation outcomes of C1–C10 were analyzed against the corresponding measured data, and the percentage differences were calculated (see Figure 17). In January, the differences in C1–C10 relative to the actual baseline condition (single glazing, WWR = 30%) ranged from –1.25% to –4.89%, indicating relatively stable energy-saving effects during the heating season. In July, the variation was much larger, with combinations of high WWR and single glazing significantly increasing cooling loads. The largest discrepancies occurred in October, when the difference in C2 reached as high as 2.69 times that of the measured baseline, suggesting that WWR–glazing configurations are highly sensitive to energy performance in the transitional season. These findings highlight that in Qingdao’s temperate monsoon climate, adopting an appropriate WWR–glazing combination is crucial for maintaining favorable thermal conditions. Specifically, the design of 30% WWR with double glazing can achieve substantial year-round energy savings compared with the actual baseline building, while ensuring thermal comfort and reducing operational loads.

4. Discussion

4.1. Seasonal Differences in Thermal Environment Responses

Qingdao, characterized by a typical temperate monsoon climate, exhibits pronounced seasonal variations in building thermal responses. In January, with daily outdoor temperatures fluctuating around 0 °C, all floors maintained relatively low indoor temperatures. Notably, the first floor (1F) experienced substantial nocturnal temperature drops, with diurnal variations exceeding 10 °C. This can be attributed to its proximity to the cold ground surface and greater exposure to ambient outdoor air. In contrast, floors 2F to 4F showed similar and more stable thermal behavior. This vertical temperature gradient suggests that, in winter, enhanced insulation strategies should be prioritized for lower floors to mitigate nighttime heat loss and discomfort. In July, indoor temperatures were generally high, with peak values approaching 36 °C. The combination of high WWR and single-glazed windows further exacerbated overheating risks due to excessive solar gains and poor insulation. In October, the average temperatures were moderate, with an increased duration during which thermal comfort was achieved, indicating a relatively stable indoor thermal environment. Overall, for cities with a cold-winter and hot-summer temperate monsoon climate, such as Qingdao, the design of the building envelope should be flexibly adjusted according to seasonal requirements: strengthening insulation at the lower floors in winter, enhancing shading and heat protection at the upper floors in summer, and leveraging the building’s intrinsic thermal regulation capacity during transitional seasons. These findings are consistent with those reported by Chen et al. [12] and Liu et al. [13].

4.2. The Impact of WWR on Thermal Performance

In January, larger WWR values allowed greater solar heat gain during daytime, thereby raising indoor temperatures and alleviating cold-related thermal discomfort. This observation aligns with the findings of Zomorodian et al. [4]. However, higher WWR also led to increased nighttime heat loss, resulting in significant drops in indoor temperature during the night. At the whole-building scale, vertically increasing WWR distribution tended to raise overall energy consumption due to intensified thermal exchange. Similar conclusions were drawn by Xie et al. [19], who reported that larger WWR values make indoor temperatures more sensitive to outdoor temperature fluctuations. In July, lower WWR values consistently resulted in lower energy consumption, particularly evident on the third and fourth floors. This trend is consistent with the study by Hou et al. [28], which found that the combination of single-glazed windows and high WWR contributed to rapid temperature rise in summer due to increased solar radiation penetration. In October, when WWR exhibited large variations across floors, the discrepancies in energy consumption between different levels became more pronounced, potentially leading to uneven thermal comfort across the building. More than 21.2% of carbon emissions in China’s building sector are attributed to heating energy use in severe cold and cold climate zones [29,30]. Controlling the WWR is therefore a key strategy for energy conservation. Gong et al. [31] found in a multi-objective optimization study of buildings in cold regions that WWR was the most critical factor affecting both energy use and thermal comfort. Their Pareto-optimal solutions were concentrated around a WWR of 40%, where the energy use intensity decreased by about 20.9% relative to the baseline, while the percentage of thermal discomfort decreased by about 47%. For buildings in Qingdao, which is characterized by a temperate monsoon climate, a WWR of around 30% achieved favorable performance in terms of both thermal comfort and energy consumption. In addition, large vertical variations in WWR across floors should be avoided to maintain stable building performance.

4.3. The Impact of Glazing Type on Thermal Performance

Across all seasons—winter, summer, and the transitional period—double-glazed windows consistently demonstrated superior thermal performance compared to single-glazed alternatives. Double glazing effectively reduced the rate of heat transfer across the building envelope. In January, the total energy load of buildings with double-glazed windows was 366–500 kWh lower than that of those using single glazing. In July, single-glazed windows contributed to rapid indoor temperature increases and overheating, particularly under high WWR conditions and on upper floors. These findings are consistent with the findings of Sun et al. [32] and Xie et al. [19], who emphasized the vulnerability of single-glazed systems to solar heat gain during summer. In October, double glazing provides better balanced heat buffering and thermal insulation, leading to reduced indoor temperature fluctuations and a higher proportion of time within the thermal comfort range (|PMV| ≤ 0.5). As WWR increased, the advantages of double glazing in both thermal comfort and energy savings became more pronounced [19,33].
Interestingly, under the unheated condition in January, the passive comfort hours of single glazing were significantly longer than those of double glazing. This is mainly attributed to its higher solar transmittance, which allows for greater solar heat gains during winter daytime. However, under heating operation during the day, the higher thermal transmittance of single glazing leads to substantial nighttime heat loss, resulting in lower initial indoor temperatures in the morning and additional heating energy required to compensate for this deficit. Moreover, its continuous heat loss during operation is greater than that of double glazing, thereby causing the total heating energy demand to rise considerably. Consequently, single glazing in winter presents a paradoxical feature of “increased comfort hours but elevated energy consumption,” whereas double glazing is superior in terms of energy control [34]. This finding suggests that while single glazing indeed provides a passive heating advantage in winter, this contradiction could potentially be turned into an advantage if nighttime heat loss is effectively suppressed. For example, glazing with high solar transmittance but low thermal transmittance, such as double-silver Low-E glazing or vacuum glazing [35], can maintain solar heat gains during the day while reducing thermal losses. Alternatively, interior thermal insulation measures at night (e.g., heavy curtains, insulated roller blinds) can mitigate heat loss. In addition, composite envelope configurations such as double-skin façades, buffer corridors, or thermochromic smart windows can also balance passive solar gains with insulation performance [5,36]. Therefore, in practical design, glazing performance, WWR, and operational strategies should be considered in an integrated manner to achieve both passive heating benefits in winter and year-round energy efficiency.

4.4. Design Implications

The results of this study indicate that under Qingdao’s temperate monsoon climate, a moderate WWR (30%) combined with double glazing achieves a favorable balance between thermal comfort and energy performance throughout the year, whereas large inter-floor variations in WWR lead to overall performance deterioration. In practice, however, architectural façade esthetics and other design requirements often necessitate extensive glazing. Under such high-WWR conditions, it becomes essential to improve the thermal performance by integrating additional envelope design measures. For example, external shading devices can substantially mitigate the overheating risks associated with high WWR in summer [37,38]. Xue et al. [39] reported that in China, combined horizontal and vertical shading significantly increases the acceptable upper limit of WWR, with optimal thresholds of 0.70 for east–west façades and 0.55 for north–south façades. Since building orientation directly determines solar gains on each façade [40,41], high WWR on east–west orientations is more likely to increase cooling demand compared with north–south orientations. The impact of orientation-specific WWR settings on thermal performance, therefore, warrants further investigation. In addition, natural ventilation during summer and transitional seasons can enhance indoor heat dissipation and air movement, thereby improving thermal comfort and offsetting part of the additional energy demand caused by high WWR. Yue et al. [16], in a simulation study of public buildings in Qingdao, further suggested that under nighttime cooling conditions, single glazing combined with high WWR may be more effective for lowering indoor temperatures. Therefore, in practical design applications, while a consistent WWR of around 30% with high-performance double glazing should be prioritized, additional strategies such as shading, orientation-based control, and natural ventilation should also be integrated to further optimize the thermal performance of buildings. Future research should incorporate these factors into comprehensive assessments supported by year-round simulations and extensive field measurements, in order to develop more generalizable and actionable design recommendations for building envelopes.

4.5. Limitations and Future Work

Unlike the numerous parametric studies focusing on WWR and glazing type, this study was conducted on an actual building with model development and validation. A quantitative evaluation was performed by comparing simulated results with measured data. Furthermore, this study simultaneously considered both energy use and thermal comfort, and revealed the influence of spatial WWR distribution strategies (uniform, increasing, and decreasing) on the overall stability of the indoor thermal environment.
Although this study systematically examined the impact of different WWR and glazing type combinations on indoor temperature, thermal comfort, and energy consumption during representative months (January, July, and October), several limitations remain: (1) The PMV values used in this study were derived from the Fanger model, which is based on average population responses. In real-world environments, however, thermal comfort depends on a complex interplay of factors, particularly behavioral adaptation and subjective thermal expectation, and activity level. Especially in naturally ventilated or non-air-conditioned spaces, it is essential to consider individuals’ subjective thermal adaptability. Therefore, future studies should incorporate adaptive thermal comfort models and simulate behavioral responses under various usage scenarios to enhance the real-world applicability of the findings. (2) While this study focused on WWR and glazing type as the main variables, other factors such as building orientation, shading, and natural ventilation also have significant impacts on thermal performance and energy consumption. Future research should include these parameters [42], and explore a wider range of WWR distribution strategies and glazing materials to achieve more comprehensive optimization. (3) It should be noted that this study only conducted simulations for representative weeks in winter, summer, and the transitional season, rather than performing full-year hourly simulations. This inevitably limits the generalizability of the results to some extent. Future work will employ annual meteorological data to perform full-year simulations and compare the consistency between representative weeks and annual outcomes, in order to further verify the robustness of the conclusions.

5. Conclusions

This study conducted a systematic assessment of how various combinations of window-to-wall ratios (WWR) and glazing types affect thermal comfort and energy consumption in office buildings, using Qingdao—a temperate monsoon climate—as a case study, across representative weeks in January, July, and October. The main findings are as follows:
(1)
Significant inter-floor and seasonal differences in thermal environment were observed. In Qingdao’s winter, low outdoor temperatures combined with strong ground heat loss caused the first floor to experience the largest fluctuations, with a pronounced diurnal temperature range. In summer (July), under typical hot conditions, peak indoor temperatures reached 36.07 °C and the diurnal variation exceeded 22.6 °C, highlighting the large thermal fluctuations characteristic of temperate monsoon climates. In October, although the overall climate was milder, the diurnal variation still induced slight overheating on the first floor.
(2)
In the hot summer with large diurnal variations, low WWR combined with double glazing effectively suppressed overheating and improved comfort; specifically, with WWR = 30% and double glazing, the proportion of comfortable hours (|PMV| ≤ 0.5) reached 51.14%. In winter, due to the combined effects of low ambient temperatures and daytime solar radiation, higher WWR improved passive solar gains and enhanced daytime comfort. However, in the transitional season (October), excessively high WWR easily led to overheating because of the large diurnal temperature swing.
(3)
In January, it reduced total building loads by 366–500 kWh compared with single glazing. In climates with both heating and cooling demands and large diurnal variations, the overall trend showed that smaller WWR generally reduced energy consumption. However, large variations in WWR across floors disrupted thermal stability and markedly increased energy demand. Notably, single glazing exhibited stronger passive solar gains in winter daytime; if nighttime heat loss could be effectively mitigated, overall energy efficiency could potentially be improved.
(4)
In summer and the transitional season, energy consumption differences were more volatile. In particular, during October, the combination of single glazing with a strongly increasing WWR pattern resulted in energy consumption that was 2.69 times higher than the measured baseline, underscoring the strong sensitivity of energy performance to WWR and glazing configurations.
In summary, for office buildings in Qingdao and similar temperate monsoon climates, adopting a WWR of approximately 30% in combination with high-performance double glazing is recommended to achieve a balance between thermal comfort and energy efficiency. Moreover, large vertical variations in WWR across floors should be avoided to maintain stable thermal conditions and overall energy performance.

Author Contributions

Conceptualization, X.L. and N.Z.; methodology, X.L.; software, Z.W.; validation, X.L., N.Z. and Z.W.; formal analysis, Z.W.; investigation, X.L.; resources, N.Z.; data curation, N.Z.; writing—original draft preparation, X.L.; writing—review and editing, W.G.; visualization, W.G.; supervision, N.Z.; project administration, Z.W.; All authors have read and agreed to the published version of the manuscript.

Funding

This research received no external funding.

Data Availability Statement

The data presented in this study are available on request from the corresponding author.

Conflicts of Interest

The authors declare no conflicts of interest.

Appendix A

Table A1. Energy consumption of the 1st floor in January.
Daily Energy Use (kWh)
C1C2C3C4C5C6C7C8C9C10
10th210.57220.01215.43192.02203.24210.85219.93215.49192.43201.71
11st207.22227.66217.77165.15190.84213.85229.30221.77181.66197.99
12nd229.31251.77240.88183.66211.45236.92253.55245.44202.44219.90
13rd298.96296.59297.68303.79301.14289.75292.64291.20284.71287.25
14th333.13323.27328.13350.44340.94317.86316.62317.26320.38319.39
15th403.22380.00391.46445.42421.56379.44369.85374.59398.46389.43
16th411.10409.25410.42408.99412.15401.70403.32402.67396.42399.91
17th470.12436.72453.16531.95496.67439.00423.38431.11469.96455.19
Total2563.632545.272554.932581.422577.992489.372508.592499.532446.462470.77
Table A2. Energy consumption of the 2nd floor in January.
Daily Energy Use (kWh)
C1C2C3C4C5C6C7C8C9C10
10th242.49242.38242.40238.77240.46241.22241.11241.16236.33238.70
11st210.00209.81209.90200.08204.74211.74211.58211.65202.67207.12
12nd202.93202.81202.83192.23197.26204.49204.39204.43194.71199.52
13rd241.84241.80241.79249.90245.63230.75230.65230.70231.67231.17
14th262.82262.56262.64280.15271.17245.12244.85244.95251.61248.38
15th323.82323.52323.62354.92339.12297.56297.31297.39313.21305.49
16th338.97338.78338.83358.33348.33320.99320.77320.84331.03326.19
17th384.32384.45384.37426.11405.10350.96350.97350.93374.07362.83
Total2207.192206.112206.382300.492251.812102.832101.632102.052135.302119.40
Table A3. Energy consumption of the 3rd floor in January.
Daily Energy Use (kWh)
C1C2C3C4C5C6C7C8C9C10
10th241.86237.65239.69241.92241.89240.70235.46238.02240.73240.72
11st209.53198.51203.99209.66209.56211.69201.90206.73211.74211.71
12nd201.60189.78195.65201.81201.67203.71193.04198.33203.80203.72
13rd238.86245.75242.32239.16238.97228.32228.22228.22228.49228.39
14th257.62273.03265.49258.22257.85240.62245.53243.07240.98240.78
15th316.77345.73331.58317.68317.15291.33305.06298.27291.93291.63
16th330.50347.69339.50331.63330.99313.26321.31317.41314.06313.65
17th375.24415.53395.98376.45375.76342.46363.91353.41343.38342.94
Total2171.982253.672214.22176.532173.842072.092094.432083.462075.112073.54
Table A4. Energy consumption of the 4th floor in January.
Daily Energy Use (kWh)
C1C2C3C4C5C6C7C8C9C10
10th280.18278.26278.78282.57281.26278.42272.92275.43281.92280.13
11st266.53252.41258.93275.54270.87268.01254.36260.90275.79271.84
12nd269.09253.1260.37279.55274.09270.74255.07262.52279.76275.17
13rd307.71321.54313.75303.58305.31299.03299.85298.93300.20299.46
14th330.82358.72344.07319.48324.83316.46325.33320.40313.72314.91
15th391.34441.36415.91368.56379.60369.51392.81380.72359.71364.41
16th414.44446.81430.35400.56407.19398.72413.52405.78393.23395.79
17th458.80527.45493.07426.28442.19430.31466.21447.93414.31422.08
Total2718.912879.652795.232656.122685.342631.22680.072652.612618.642623.79
Table A5. Energy consumption of the 1st floor in July.
Daily Energy Use (kWh)
C1C2C3C4C5C6C7C8C9C10
10th261.58277.84271.34269.14247.36271.83280.33276.33247.06259.17
11st294.66273.31281.27410.61337.39280.01276.97273.44339.58299.50
12nd319.44225.08270.15488.36392.58259.76200.79230.42379.65321.62
13rd349.46261.27305.21499.07414.55291.14235.80263.22395.95346.31
14th353.73275.82314.63486.48411.66299.90251.47275.69391.30348.08
15th377.91311.50344.69490.80427.52330.57289.64310.14407.91371.48
16th429.03359.19393.87551.44481.83378.89336.97357.84459.83421.22
17th476.50400.55438.07611.73534.17421.52376.97399.05508.57466.70
Total2862.312384.562619.233807.633247.062533.622248.942386.133129.852834.08
Table A6. Energy consumption of the 2nd floor in July.
Daily Energy Use (kWh)
C1C2C3C4C5C6C7C8C9C10
10th276.45276.48276.46268.14272.31280.94280.94280.96275.87278.42
11st276.81277.28277.07282.72271.72287.54287.80287.70274.96281.25
12nd226.93225.18226.15313.56271.63180.93180.55180.72231.59201.94
13rd282.77281.40282.30371.08328.57224.69224.36224.61284.13255.13
14th312.90312.28312.88392.03353.97254.73255.05255.04311.35284.88
15th353.50353.37353.74421.69388.87301.84302.56302.36350.23327.6
16th409.80410.05410.25477.48444.91357.96358.95358.61404.36382.59
17th459.53459.77459.96530.35496.17405.12406.09405.74452.01429.91
Total2598.692595.812598.813057.052828.152293.752296.32295.742584.52441.72
Table A7. Energy consumption of the 3rd floor in July.
Daily Energy Use (kWh)
C1C2C3C4C5C6C7C8C9C10
10th276.57268.42272.48276.55276.57281.05276.08278.59281.04281.03
11st279.05278.79271.38278.69278.88289.44278.13283.78289.16289.29
12nd213.20297.27257.65215.05214.18175.79214.26189.55176.45176.15
13rd267.37355.04313.92268.65268.18210.09266.07239.64212.06211.24
14th300.50380.40343.11301.25301.15240.96297.56270.79242.49241.98
15th344.64414.46382.02345.04345.18291.66340.98317.66292.76292.49
16th404.18473.99441.45404.26404.52351.03399.02376.29351.81351.70
17th456.13528.75494.79456.18456.43400.62449.08426.07401.28401.22
Total2541.642997.122776.82545.672545.092240.642521.182382.372247.052245.1
Table A8. Energy consumption of the 4th floor in July.
Daily Energy Use (kWh)
C1C2C3C4C5C6C7C8C9C10
10th282.60271.44277.20281.09284.36283.90279.02282.53278.44281.90
11st290.87272.48278.08302.97297.14298.71282.46290.84305.86302.40
12nd177.18296.64230.62166.35164.91161.73203.64176.68171.70165.89
13rd228.14371.94302.25160.39189.92176.27270.81224.74151.48160.73
14th271.19406.69343.73194.13231.90217.29312.77266.18169.29193.48
15th327.82446.39391.89256.08293.24277.65362.95322.33230.42254.29
16th392.65508.92455.31323.09358.88343.00424.79385.83298.33320.86
17th450.57570.53514.84380.08416.13399.33481.26442.12355.25377.41
Total2421.023145.032793.922064.182236.482157.882617.72391.251960.772056.96
Table A9. Energy consumption of the 1st floor in October.
Daily Energy Use (kWh)
C1C2C3C4C5C6C7C8C9C10
10th13.0322.3718.7644.0710.3419.7222.8523.5410.5012.81
11st22.9243.2834.9459.3414.6236.3446.5541.9815.3720.91
12nd13.667.476.30137.9258.176.668.147.4354.3216.29
13rd27.420.005.20153.9781.822.160.000.0074.5530.52
14th52.461.3120.49182.20109.7213.420.001.9999.1953.76
15th27.420.005.20153.9781.822.160.000.0074.5530.52
16th27.571.6313.6597.6958.419.290.001.6955.6529.72
17th80.9824.1350.30189.70127.0640.5212.7125.42118.9181.88
Total265.46100.19154.841018.86541.96130.2790.25102.05503.04276.41
Table A10. Energy consumption of the 2nd floor in October.
Daily Energy Use (kWh)
C1C2C3C4C5C6C7C8C9C10
10th17.7917.8017.8010.2913.8623.1523.1423.1517.4322.09
11st40.8241.0640.9526.9935.0046.9947.1247.0439.8143.46
12nd6.696.796.7516.757.129.9210.019.986.487.24
13rd2.582.042.3551.9020.190.000.000.004.610.00
14th25.2823.9025.0697.3361.900.670.580.6128.9211.19
15th2.582.042.3551.9020.190.000.000.004.610.00
16th32.7631.7933.4173.7955.737.848.018.1136.1221.13
17th85.8684.9186.51135.00112.3242.6143.1843.4286.7167.62
Total214.36210.33215.18463.95326.31131.18132.04132.31224.69172.73
Table A11. Energy consumption of the 3rd floor in October.
Daily Energy Use (kWh)
C1C2C3C4C5C6C7C8C9C10
10th17.8110.3013.8617.8017.8123.1717.4322.1223.1523.14
11st41.6529.4836.7041.4841.5547.6341.1344.4147.5047.57
12nd7.1312.216.357.027.0810.487.127.7410.3610.42
13rd0.6539.2412.660.970.820.000.940.000.000.00
14th16.6487.5651.4017.8417.450.0018.445.390.000.00
15th0.6539.2412.660.970.820.000.940.000.000.00
16th25.8572.9952.4624.7325.713.2029.5415.314.183.88
17th80.40136.74111.9577.5579.4633.9583.5260.5235.4135.24
Total190.78427.76298.04188.36190.70118.43199.06155.49120.60120.25
Table A12. Energy consumption of the 4th floor in October.
Daily Energy Use (kWh)
C1C2C3C4C5C6C7C8C9C10
10th24.4611.2917.3733.6524.2825.5721.9424.2439.7831.97
11st48.9133.3541.7255.9352.3153.2544.2948.8956.4755.64
12nd10.418.496.7711.5411.6011.427.3610.4912.1411.43
13rd0.0025.461.530.930.000.000.000.001.500.99
14th0.0078.0921.760.000.000.009.050.000.000.00
15th0.0025.461.530.930.000.000.000.001.500.99
16th0.5855.1021.430.000.000.0012.700.620.000.00
17th26.89126.6884.212.719.655.1965.2027.653.572.92
Total111.25363.92196.32105.6997.8495.43160.54111.89114.96103.94

References

  1. Tsinghua University. Building energy conservation research center. In 2020 Annual Report on China Building Energy Efficiency; China Architecture & Building Press: Beijing, China, 2020. [Google Scholar]
  2. Cappelletti, F.; Prada, A.; Romagnoni, P.; Gasparella, A. Passive performance of glazed components in heating and cooling of an open-space office under controlled indoor thermal comfort. Build. Environ. 2014, 72, 131–144. [Google Scholar] [CrossRef]
  3. Needell, D.R.; Phelan, M.E.; Hartlove, J.T.; Atwater, H.A. Solar power windows: Connecting scientific advances to market signals. Energy 2021, 219, 119567. [Google Scholar] [CrossRef]
  4. Zomorodian, Z.S.; Tahsildoost, M. Assessment of window performance in classrooms by long term spatial comfort metrics. Energy Build. 2017, 134, 80–93. [Google Scholar] [CrossRef]
  5. Hee, W.J.; Alghoul, M.A.; Bakhtyar, B.; Elayeb, O.; Shameri, M.A.; Alrubaih, M.S.; Sopian, K. The role of window glazing on daylighting and energy saving in buildings. Renew. Sustain. Energy Rev. 2015, 42, 323–343. [Google Scholar] [CrossRef]
  6. Amaral, A.R.; Rodrigues, E.; Gaspar, A.R.; Gomes, Á. A thermal performance parametric study of window type, orientation, size and shadowing effect. Sustain. Cities Soc. 2016, 26, 456–465. [Google Scholar] [CrossRef]
  7. Kim, S.H.; Kim, S.S.; Kim, K.W.; Cho, Y.H. A study on the proposes of energy analysis indicator by the window elements of office buildings in Korea. Energy Build. 2014, 73, 153–165. [Google Scholar] [CrossRef]
  8. Goia, F. Search for the optimal window-to-wall ratio in office buildings in different European climates and the implications on total energy saving potential. Sol. Energy 2016, 132, 467–492. [Google Scholar] [CrossRef]
  9. Alghoul, S.K.; Rijabo, H.G.; Mashena, M.E. Energy consumption in buildings: A correlation for the influence of window to wall ratio and window orientation in Tripoli, Libya. J. Build. Eng. 2017, 11, 82–86. [Google Scholar] [CrossRef]
  10. Wen, J.; Fu, W.; Meng, X. Climate adaptation analysis of the thermal performance of dynamic rotating latent-energy-storage envelope (DRLESE) in China. Case Stud. Therm. Eng. 2025, 71, 106254. [Google Scholar] [CrossRef]
  11. Guan, Y.; Hu, C.; Meng, X. Formation analysis of cooling load from envelopes under air-conditioning intermittent operation. Sol. Energy 2025, 292, 113428. [Google Scholar] [CrossRef]
  12. Chen, X.; Xu, Z.; Qiu, Y.; Hu, H.; Wang, X. China’s newest design of apartment buildings with modernized façade: A comparative evaluation of its energy performance in five major climate zones. Sustain. Cities Soc. 2024, 117, 105954. [Google Scholar] [CrossRef]
  13. Liu, R.; Wang, G.; Deng, Q. Multi-objective optimization of rural residential envelopes in cold regions of China based on performance and economic efficiency. Case Stud. Therm. Eng. 2024, 61, 104937. [Google Scholar] [CrossRef]
  14. Li, Y.; Zhang, H.; Shen, X.; Qu, K. Interpretable machine learning for predicting and optimizing residential building performance in cold regions. Energy Build. 2025, 116321. [Google Scholar] [CrossRef]
  15. Hu, S.T.; Li, L.J.; Liu, G.D.; Zhang, L. Exploration on an optimal Wall-window ratio in public buildings based on building energy consumption in Qingdao area. Build. Sci. 2016, 32, 85–89. [Google Scholar]
  16. Yue, N.; Li, L.; Morandi, A.; Zhao, Y. A metamodel-based multi-objective optimization method to balance thermal comfort and energy efficiency in a campus gymnasium. Energy Build. 2021, 253, 111513. [Google Scholar] [CrossRef]
  17. Ashrafian, T.; Moazzen, N. The impact of glazing ratio and window configuration on occupants’ comfort and energy demand: The case study of a school building in Eskisehir, Turkey. Sustain. Cities Soc. 2019, 47, 101483. [Google Scholar] [CrossRef]
  18. Guo, R.; Hu, Y.; Liu, M.; Heiselberg, P. Influence of design parameters on the night ventilation performance in office buildings based on sensitivity analysis. Sustain. Cities Soc. 2019, 50, 101661. [Google Scholar] [CrossRef]
  19. Xie, X.; Chen, X.-N.; Xu, B.; Pei, G. Investigation of occupied/unoccupied period on thermal comfort in Guangzhou: Challenges and opportunities of public buildings with high window-wall ratio. Energy 2022, 244, 123186. [Google Scholar] [CrossRef]
  20. Ochoa, C.E.; Aries, M.B.; Van Loenen, E.J.; Hensen, J.L. Considerations on design optimization criteria for windows providing low energy consumption and high visual comfort. Appl. Energy 2012, 95, 238–245. [Google Scholar] [CrossRef]
  21. Guo, F.; Ma, Y.; Zhang, K.; Han, L.; Guo, L. The Climate Change in Qingdao during 1899–2015 and Its Response to Global Warming. J. Geosci. Environ. Prot. 2018, 6, 58–70. [Google Scholar] [CrossRef]
  22. GB 50176-2016; Code for Thermal Design of Civil Buildings. China Architecture & Building Press: Beijing, China, 2016.
  23. GB 50189-2015; Design Standard for Energy Efficiency of Public Buildings. China Architecture & Building Press: Beijing, China, 2015.
  24. ANSI/ASHRAE Standard 55-2004; Thermal Environmental Conditions for Human Occupancy. ASHRAE: Atlanta, GA, USA, 2004.
  25. Liu, N.; Qin, Y. Building Thermal Environment; Tsinghua University Press: Beijing, China, 2005. [Google Scholar]
  26. Heydari, A.; Sadati, S.E.; Gharib, M.R. Effects of different window configurations on energy consumption in building: Optimization and economic analysis. J. Build. Eng. 2021, 35, 102099. [Google Scholar] [CrossRef]
  27. Mustufa, A.; Anwar, M.; Khan, T.I. Energy optimization of an institutional building to reduce the energy and air conditioning demand. J. Build. Eng. 2024, 98, 111309. [Google Scholar] [CrossRef]
  28. Hou, J.; Liu, Z.-A.; Zhang, L. Influence and sensitivity evaluation of window thermal parameters variations on economic benefits of insulation materials for building exterior walls–a case study for traditional dwelling in China. Therm. Sci. Eng. Prog. 2023, 46, 102207. [Google Scholar] [CrossRef]
  29. Hu, S.; Zhou, X.; Yan, D.; Guo, F.; Hong, T.; Jiang, Y. A systematic review of building energy sufficiency towards energy and climate targets. Renew. Sustain. Energy Rev. 2023, 181, 113316. [Google Scholar] [CrossRef]
  30. Yang, L.; Jiang, S.; Qiao, Y.; Ye, Y.; Wang, C.; Liu, Y. Key drivers of life-cycle carbon emission for residential buildings in cold zone of China: A comparative study of thermal design and morphological design factors. J. Build. Eng. 2025, 111, 113449. [Google Scholar] [CrossRef]
  31. Gong, Q.; Ding, W.; Liu, X.; Zeng, Y.; Adu, E.; Shao, H. Multi-objective optimization framework for the building envelope of public rental housing in China’s cold regions. J. Build. Eng. 2025, 104, 112261. [Google Scholar] [CrossRef]
  32. Sun, H.; Calautit, J.K.; Jimenez-Bescos, C. Examining the regulating impact of thermal mass on overheating, and the role of night ventilation, within different climates and future scenarios across China. Clean. Eng. Technol. 2022, 9, 100534. [Google Scholar] [CrossRef]
  33. Gamero-Salinas, J.; Monge-Barrio, A.; Sánchez-Ostiz, A. Overheating risk assessment of different dwellings during the hottest season of a warm tropical climate. Build. Environ. 2020, 171, 106664. [Google Scholar] [CrossRef]
  34. Hien, W.N.; Wang, L.; Chandra, A.N.; Pandey, A.R.; Wei, X. Effects of double glazed facade on energy consumption, thermal comfort and condensation for a typical office building in Singapore. Energy Build. 2005, 37, 563–572. [Google Scholar] [CrossRef]
  35. Alawadhi, E.M. Using phase change materials in window shutter to reduce the solar heat gain. Energy Build. 2012, 47, 421–429. [Google Scholar] [CrossRef]
  36. Wang, S.; Jiang, T.; Meng, Y.; Yang, R.; Tan, G.; Long, Y. Scalable thermochromic smart windows with passive radiative cooling regulation. Science 2021, 374, 1501–1504. [Google Scholar] [CrossRef] [PubMed]
  37. Huo, H.; Xu, W.; Li, A.; Lv, Y.; Liu, C. Analysis and optimization of external venetian blind shading for nearly zero-energy buildings in different climate regions of China. Sol. Energy 2021, 223, 54–71. [Google Scholar] [CrossRef]
  38. Huo, H.; Xu, W.; Li, A.; Chu, J.; Lv, Y. Sensitivity analysis and prediction of shading effect of external Venetian blind for nearly zero-energy buildings in China. J. Build. Eng. 2021, 41, 102401. [Google Scholar] [CrossRef]
  39. Xue, P.; Li, Q.; Xie, J.; Zhao, M.; Liu, J. Optimization of window-to-wall ratio with sunshades in China low latitude region considering daylighting and energy saving requirements. Appl. Energy 2019, 233, 62–70. [Google Scholar] [CrossRef]
  40. Chi, F.A.; Wang, Y.; Wang, R.; Li, G.; Peng, C. An investigation of optimal window-to-wall ratio based on changes in building orientations for traditional dwellings. Sol. Energy 2020, 195, 64–81. [Google Scholar] [CrossRef]
  41. Hong, Y.; I Ezeh, C.; Deng, W.; Hong, S.-H.; Peng, Z.; Tang, Y. Correlation between building characteristics and associated energy consumption: Prototyping low-rise office buildings in Shanghai. Energy Build. 2020, 217, 109959. [Google Scholar] [CrossRef]
  42. Hacker, J.N.; De Saulles, T.P.; Minson, A.J.; Holmes, M.J. Embodied and operational carbon dioxide emissions from housing: A case study on the effects of thermal mass and climate change. Energy Build. 2008, 40, 375–384. [Google Scholar] [CrossRef]
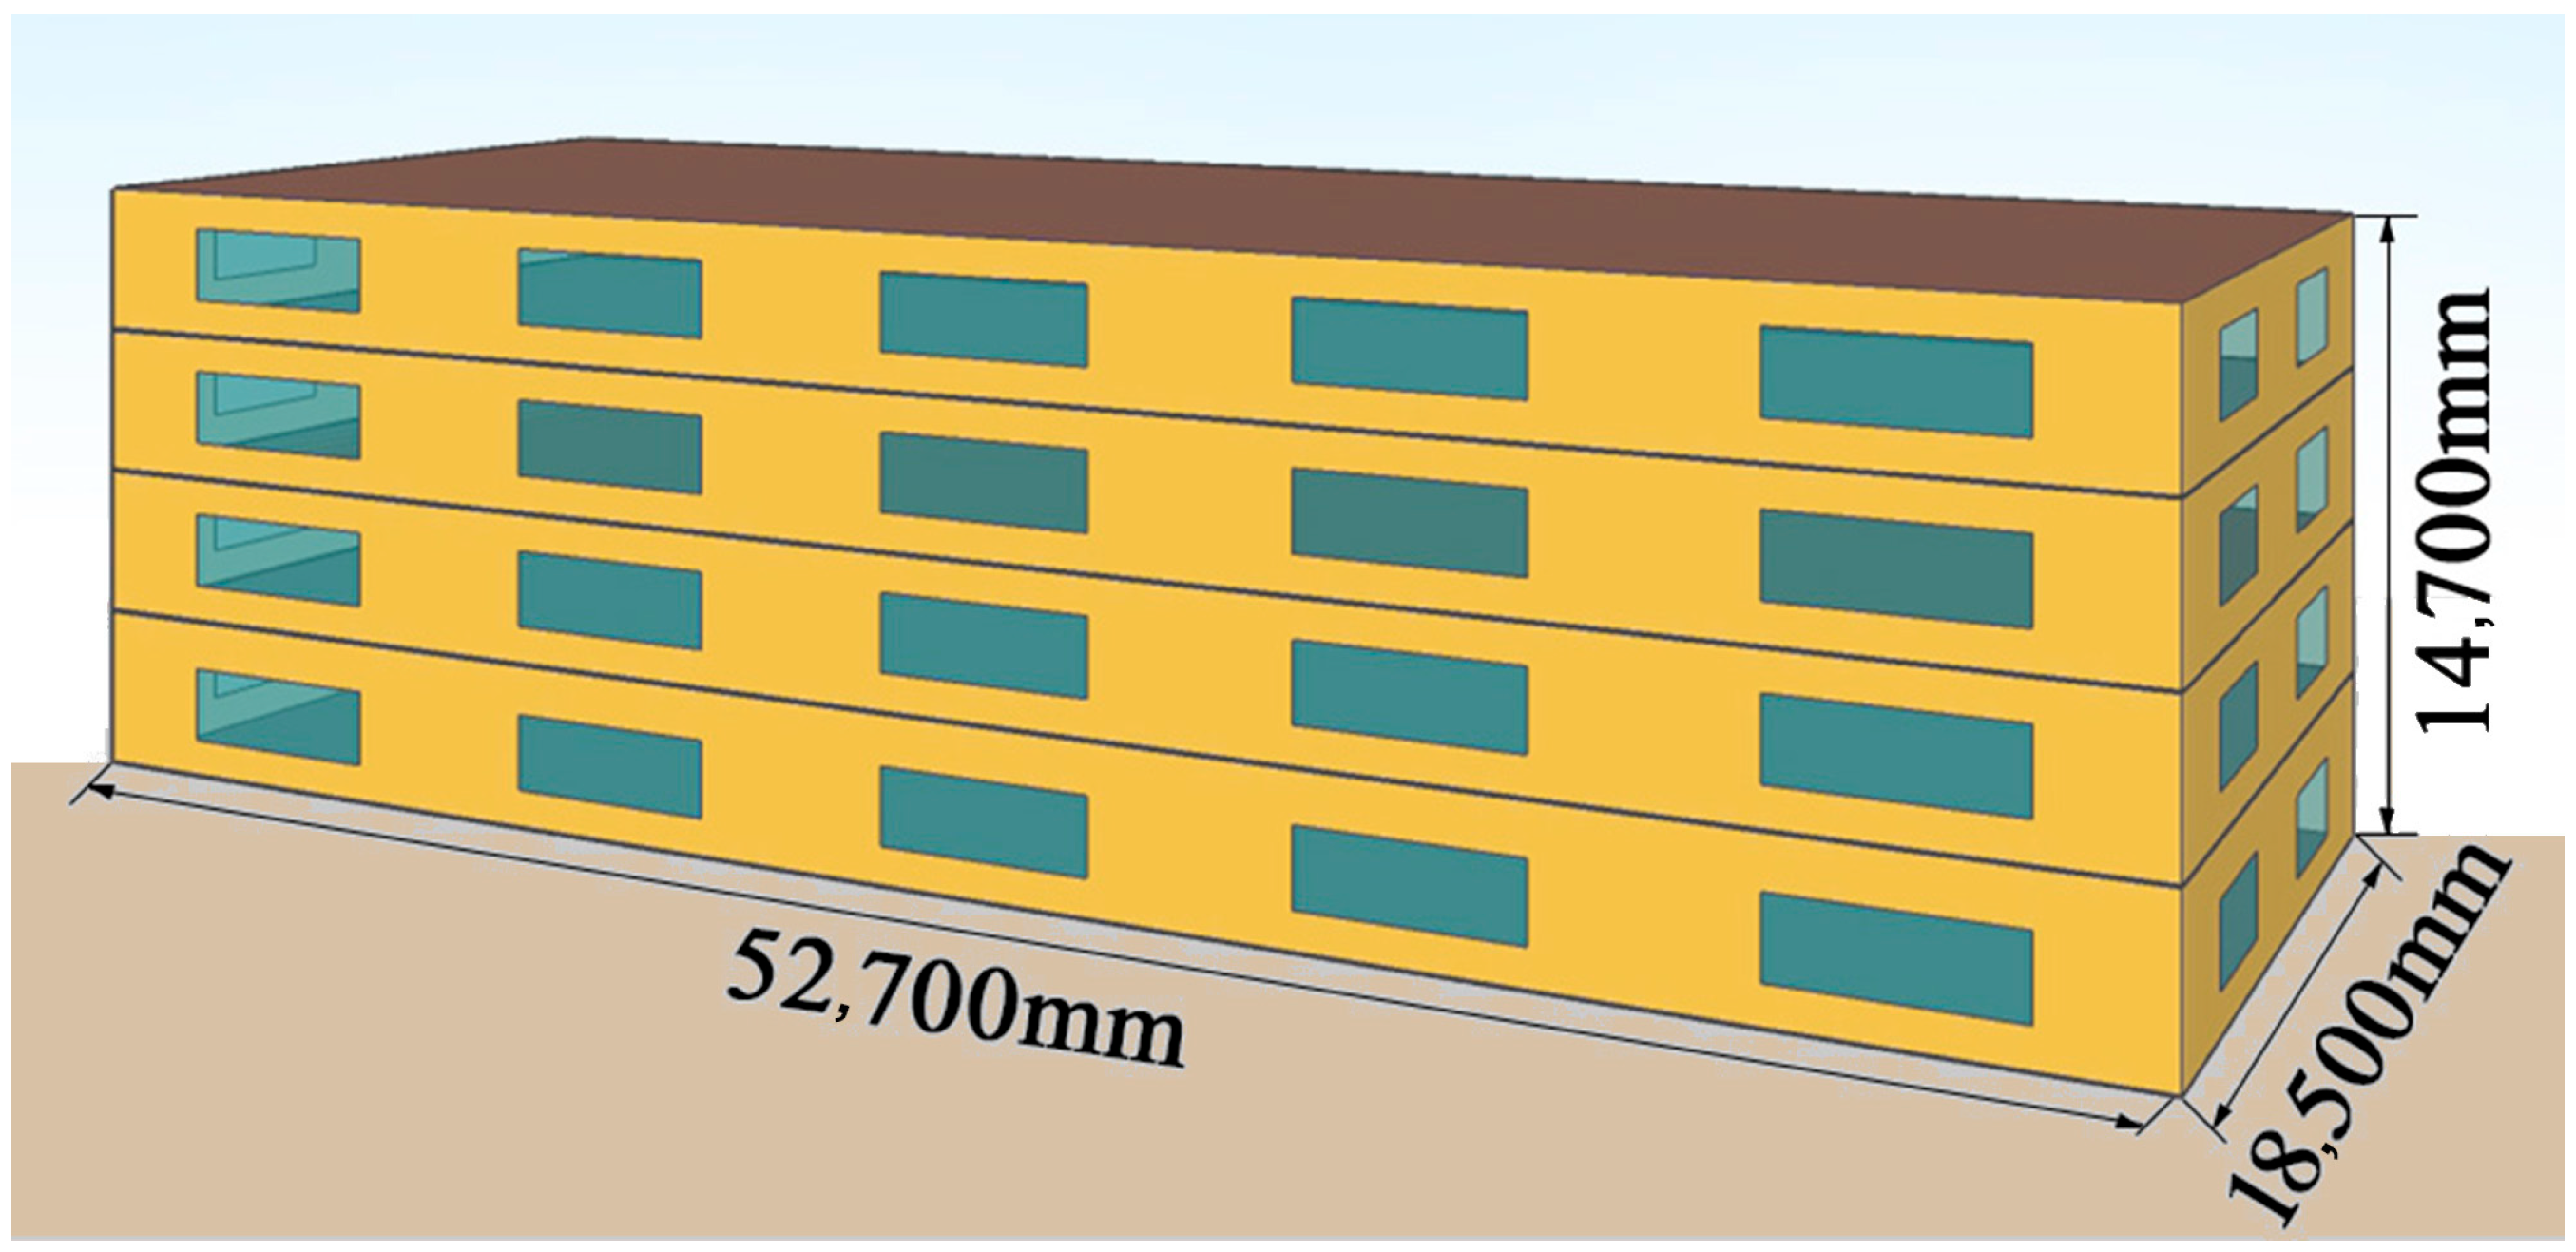
Figure 1. Building model.
Buildings 15 03156 g001
Figure 2. The corresponding temperature variations in Qingdao during (a) January, (b) July, and (c) October.
Buildings 15 03156 g002
Figure 3. Internal load settings for energy consumption.
Buildings 15 03156 g003
Figure 4. Indoor temperature of (a) 1F, (b) 2F, (c) 3F, and (d) 4F, in January.
Buildings 15 03156 g004
Figure 5. Indoor temperature of (a) 1F, (b) 2F, (c) 3F, and (d) 4F, in July.
Buildings 15 03156 g005
Figure 6. Indoor temperature of (a) 1F, (b) 2F, (c) 3F, and (d) 4F, in October.
Buildings 15 03156 g006
Figure 7. Daytime PMV comfort compliance ratio of (a) 1F, (b) 2F, (c) 3F, and (d) 4F, in January.
Buildings 15 03156 g007
Figure 8. Daytime PMV comfort compliance ratio of (a) 1F, (b) 2F, (c) 3F, and (d) 4F, in July.
Buildings 15 03156 g008
Figure 9. Daytime PMV comfort compliance ratio of (a) 1F, (b) 2F, (c) 3F, and (d) 4F, in October.
Buildings 15 03156 g009
Figure 10. Energy consumption of (a) 1F, (b) 2F, (c) 3F, and (d) 4F, in January.
Buildings 15 03156 g010
Figure 11. (a) Weekly and (b) daily energy consumption of the building in January.
Buildings 15 03156 g011
Figure 12. Energy consumption of (a) 1F, (b) 2F, (c) 3F, and (d) 4F, in July.
Buildings 15 03156 g012
Figure 13. (a) Weekly and (b) daily energy consumption of the building in July.
Buildings 15 03156 g013
Figure 14. Energy consumption of (a) 1F, (b) 2F, (c) 3F, and (d) 4F, in October.
Buildings 15 03156 g014
Figure 15. (a) Weekly and (b) daily energy consumption of the building in October.
Buildings 15 03156 g015
Figure 16. Heatmaps of the performance of scenarios C1–C10 across three seasons.
Buildings 15 03156 g016
Figure 17. Percentage differences between simulated and measured energy use.
Buildings 15 03156 g017
Table 1. Simplified thermal parameters of the opaque envelopes.
ComponentTotal Thickness (mm)U/W·m−2K−1Description
Roof (Top slab)1550.224EPS + RC + mortar
Exterior wall3200.485Plaster + insulation + brick
Table 2. Window thermal and optical performance.
TypeU-valueSolar TransmittanceVisible Transmittance
Double 140111.2400.3540.529
Single 1025.6900.8230.855
Table 3. Comparison of simulated and measured temperature and energy use.
Temperature-Jan. (Mean)Temperature-Jul. (Mean)Temperature-Oct. (Mean)Energy Use-Jan.
(Total)
Energy Use-Jul.
(Total)
Energy Use-Oct.
(Total)
Simulation10.88 °C25.70 °C21.38 °C27,118.91 kWh2421.02 kWh111.25 kWh
Measured11.03 °C26.83 °C22.15 °C2753.34 kWh2298.56 kWh98.57 kWh
CVRMSE5.33%3.41%4.48%5.25%8.62%6.21%
Disclaimer/Publisher’s Note: The statements, opinions and data contained in all publications are solely those of the individual author(s) and contributor(s) and not of MDPI and/or the editor(s). MDPI and/or the editor(s) disclaim responsibility for any injury to people or property resulting from any ideas, methods, instructions or products referred to in the content.