Article

Enhanced Convolutional Neural Network–Transformer Framework for Accurate Prediction of the Flexural Capacity of Ultra-High-Performance Concrete Beams

1
School of Architecture Engineering, Shaanxi A&F Technology University, Xianyang 712100, China
2
Shaanxi Construction Engineering Group No.5 Construction Co., Ltd., Xi’an 710032, China
*
Author to whom correspondence should be addressed.
Buildings 2025, 15(17), 3138; https://doi.org/10.3390/buildings15173138
Submission received: 26 July 2025 / Revised: 22 August 2025 / Accepted: 28 August 2025 / Published: 1 September 2025
(This article belongs to the Special Issue Trends and Prospects in Cementitious Material)

Abstract

Ultra-high-performance concrete (UHPC) is increasingly employed in long-span and heavily loaded structural applications; however, the accurate prediction of its flexural capacity remains a significant challenge because of the complex interactions among geometric parameters, reinforcement details, and advanced material properties. Existing design codes and single-architecture machine learning models often struggle to capture these nonlinear relationships, particularly when experimental datasets are limited in size and diversity. This study proposes a compact hybrid CNN–Transformer model that combines convolutional layers for local feature extraction with self-attention mechanisms for modeling long-range dependencies, enabling robust learning from a database of 120 UHPC beam tests drawn from 13 laboratories worldwide. The model’s predictive performance is benchmarked against conventional design codes, analytical and semi-empirical formulations, and alternative machine learning approaches including Convolutional Neural Networks (CNN), eXtreme Gradient Boosting (XGBoost), and K-Nearest Neighbors (KNN). Results show that the proposed architecture achieves the highest accuracy with an R2 of 0.943, an RMSE of 41.310, and a 25% reduction in RMSE compared with the best-performing baseline, while maintaining strong generalization across varying fiber dosages, reinforcement ratios, and shear-span ratios. Model interpretation via SHapley Additive exPlanations (SHAP) analysis identifies key parameters influencing capacity, providing actionable design insights. The findings demonstrate the potential of hybrid deep-learning frameworks to improve structural performance prediction for UHPC beams and lay the groundwork for future integration into reliability-based design codes.

1. Introduction

The use of UHPC has garnered significant attention in modern structural engineering due to its exceptional mechanical properties, low permeability, and remarkable durability [1,2,3,4,5]. Unlike traditional concrete, UHPC exhibits superior compressive strength, enabling it to withstand heavy loads and resist deformation under pressure [6,7,8]. This material has proven to be a game-changer in applications requiring high structural integrity and resilience [9,10].
In addition to its compressive strength, UHPC has extraordinary flexural strength and tensile strain-hardening properties, making it highly resistant to cracking or breaking under bending and stretching forces [11,12,13]. Its unique combination of strength, flexibility, and durability stems from an optimized microstructure achieved through a meticulously tailored granular mixture design, low water-to-binder ratio, use of superplasticizers, and fiber reinforcement [14,15,16,17,18,19]. These characteristics position UHPC as a promising material for a wide range of structural applications, especially in areas where safety and longevity are paramount [12,20,21,22].
The structural advantages of UHPC have been well documented. For example, Qiu et al. [23] investigated the flexural behavior of reinforced UHPC T-beams, highlighting how the material’s high-strength compression zone resists crushing, thereby enhancing the load-bearing capacity and durability of the beams. Similarly, Zhu et al. [24] reviewed advanced techniques for using UHPC to strengthen concrete structures, emphasizing its role in improving the flexural performance and extending the service life. These studies underscore the importance of flexural capacity in the design and application of UHPC elements.
However, predicting the flexural capacity of UHPC beams remains a significant challenge due to the material’s complex behavior [25,26,27]. UHPC’s ultra-high compressive strength, high ductility, and unique microstructural properties complicate its flexural behavior, rendering traditional predictive methods inadequate [22,28,29]. Existing models often fail to fully capture the intricate interactions among the material’s parameters, leading to inaccuracies and limiting their practical applicability [30].
To address this gap, recent research has explored the use of steel fibers, shear-span ratios, and reinforcement configurations to optimize the structural performance of UHPC beams [31,32]. Zhang et al. [33] demonstrated that incorporating steel fibers enhances load capacity, ductility, and flexural toughness. Similarly, studies have highlighted the influence of shear-span ratios and stirrup configurations on shear resistance and the importance of longitudinal reinforcement in improving load-bearing capacity and crack control [34,35,36,37]. Despite these advancements, international codes and standards for UHPC structural design remain underdeveloped, underscoring the need for more robust predictive models [32,38,39].
To address these challenges, this study introduces an innovative deep-learning model that combines Convolutional Neural Networks (CNN) and Transformer architectures (CNN-Transformer) for accurately predicting the flexural capacity of UHPC beams [40]. Unlike conventional machine learning models, the proposed CNN-Transformer framework effectively captures complex nonlinear interactions among structural parameters through CNN-based local feature extraction, while simultaneously incorporating global contextual dependencies via the Transformer module [41]. By integrating advanced deep-learning methodologies and extensive experimental datasets, the CNN-Transformer model aims to deliver a more accurate and generalizable predictive tool [42]. The results from this research not only enhance the accuracy of flexural capacity predictions but also contribute valuable insights for optimizing the design and performance of UHPC structural elements.

2. Design Code for Flexural Capacity

The calculation of flexural capacity for beams is a critical aspect of structural design, ensuring safety and performance under applied loads, as shown in Figure 1. Various international design codes provide guidelines and formulas for determining the flexural capacity of UHPC beams, reflecting regional practices and advancements in material science. Among these, standards from Europe (Eurocode), Japan, and China offer comprehensive approaches tailored to UHPC’s unique properties.

2.1. I-Shaped UHPFRC Beams

The design and analysis of I-shaped ultra-high-performance fiber-reinforced concrete (UHPFRC) beams require specific considerations due to their unique cross-sectional geometry and material properties. In the ultimate state of flexural capacity, the height of the compression zone (x) can be determined based on the axial force equilibrium of the cross-section:
α 1 f c b β 1 x + b f b h + h f + f y A s = f y A s + k f t b h x + k f t h f b f b
Symbols (units): α 1 , β 1 (−): compression-block coefficients; f c (MPa): concrete compressive strength; f t (MPa): concrete tensile strength; b (mm): section width; b f m m : bottom-flange width (tension side); b f (mm): compression-flange width; h (mm): overall section depth; h f (mm): compression-flange thickness; x (mm): neutral-axis depth; A s , A s (mm2): areas of tensile/compressive reinforcement; f y , f y (MPa): yield strengths of tensile/compressive reinforcement; k : fiber-bridging participation coefficient.
The height of the compression zone of the normal section can be obtained:
x = f y A s + k f t b h + k f t h f b f b α 1 f b f b h f f y A s α 1 f c b β 1 + k f t b
Based on the bending resistance theory of reinforced concrete structures, the ultimate bearing moment of the normal section can be obtained by taking the resultant force point of the longitudinal tensile steel bar as the moment:
M u = α f c b β x h o β x 2 + α f c b f b h f h o h f 2 + f y A s h o a s k f t b h x h x 2 a s
Symbols (units): M u (kN·m): ultimate flexural capacity; h o (mm): effective depth to tensile reinforcement; a s , a s (mm): distances from the tensile/compressive steel resultants to the nearest face; α , β (−): compression-block coefficients used here (consistent with α 1 , β 1 ); all other symbols are as in Equation (1).

2.2. Rectangular UHPFRC Beam

For rectangular UHPFRC beams, the design of flexural capacity involves determining the height of the compression zone, which is essential for calculating the ultimate bending moment. The height of the compression zone can be established from the axial force balance condition of the normal cross-section.
α 1 f c b β 1 x = f y A s f y A s + k f t b h k f t b x
Symbols (units): same as Equation (1); additional: b (mm): section width; h (mm): overall depth.
The height of the compression zone can be obtained by the following equation:
x = f y A s f y A s + k f t b h α 1 f c b β 1 + k f t b
Therefore, the ultimate bearing bending moment of the normal section can be obtained as follows:
M u = α f c b f β x h o β x 2 + f y A s h o a s k f t b h x h x 2 a s

2.3. T-Shaped UHPFRC Beams

The height of the compression zone of the normal cross-section of T-shaped UHPFRC beams can be established by the following equation from the axial force balance condition of the normal cross-section:
α 1 f c b β 1 x + b f b h f + f y A s = f y A s + k f t b h x
Symbols (units): same as Equation (1); additional: b f (mm): compression-flange width; h f (mm): compression-flange thickness.
The height of the compression zone can be obtained as follows:
x = f y A s + k f t b h α 1 f b f b h f f y A s α 1 f c b β 1 + k f t b
Therefore, the ultimate bearing bending moment of the normal section can be obtained by the following equation:
M a = α f c b β x h 0 β x 2 + α f c ( b f b ) h f h 0 h f 2 + f y A s ( h 0 a s ) k f t b ( h x ) h x 2 a s
Nominal moment capacity expressed through the neutral-axis depth:
x = A s f y + f t h f t ( ε f + 0.003 ) 0.003 + 0.85 β 1 f c , e = ε f + 0.003 0.003 x , a = β 1 x
M n = A s f y d a 2 + f t b h e h + e a 2
Symbols (units): x (mm): neutral-axis depth; a (mm): equivalent compression-block depth; e (mm): location of the tensile-side equivalent strain line; ε f (−): tensile-steel strain; f t (MPa): concrete tensile strength; β 1 (−): compression-block factor.
Fiber-reinforcement stress–strain bound:
σ f s = 2 τ f l f d f σ f y , ε f = σ f s E f s
Symbols (units): σ f s (MPa): fiber tensile stress; τ f (MPa): average bond shear stress; l f (mm): fiber length; d f (mm): fiber diameter; σ f y (MPa): fiber yield/ultimate stress; E f s (MPa): fiber elastic (Young’s) modulus; ε f (−): fiber strain.

3. Methodology

3.1. The Proposed CNN-Transformer Framework

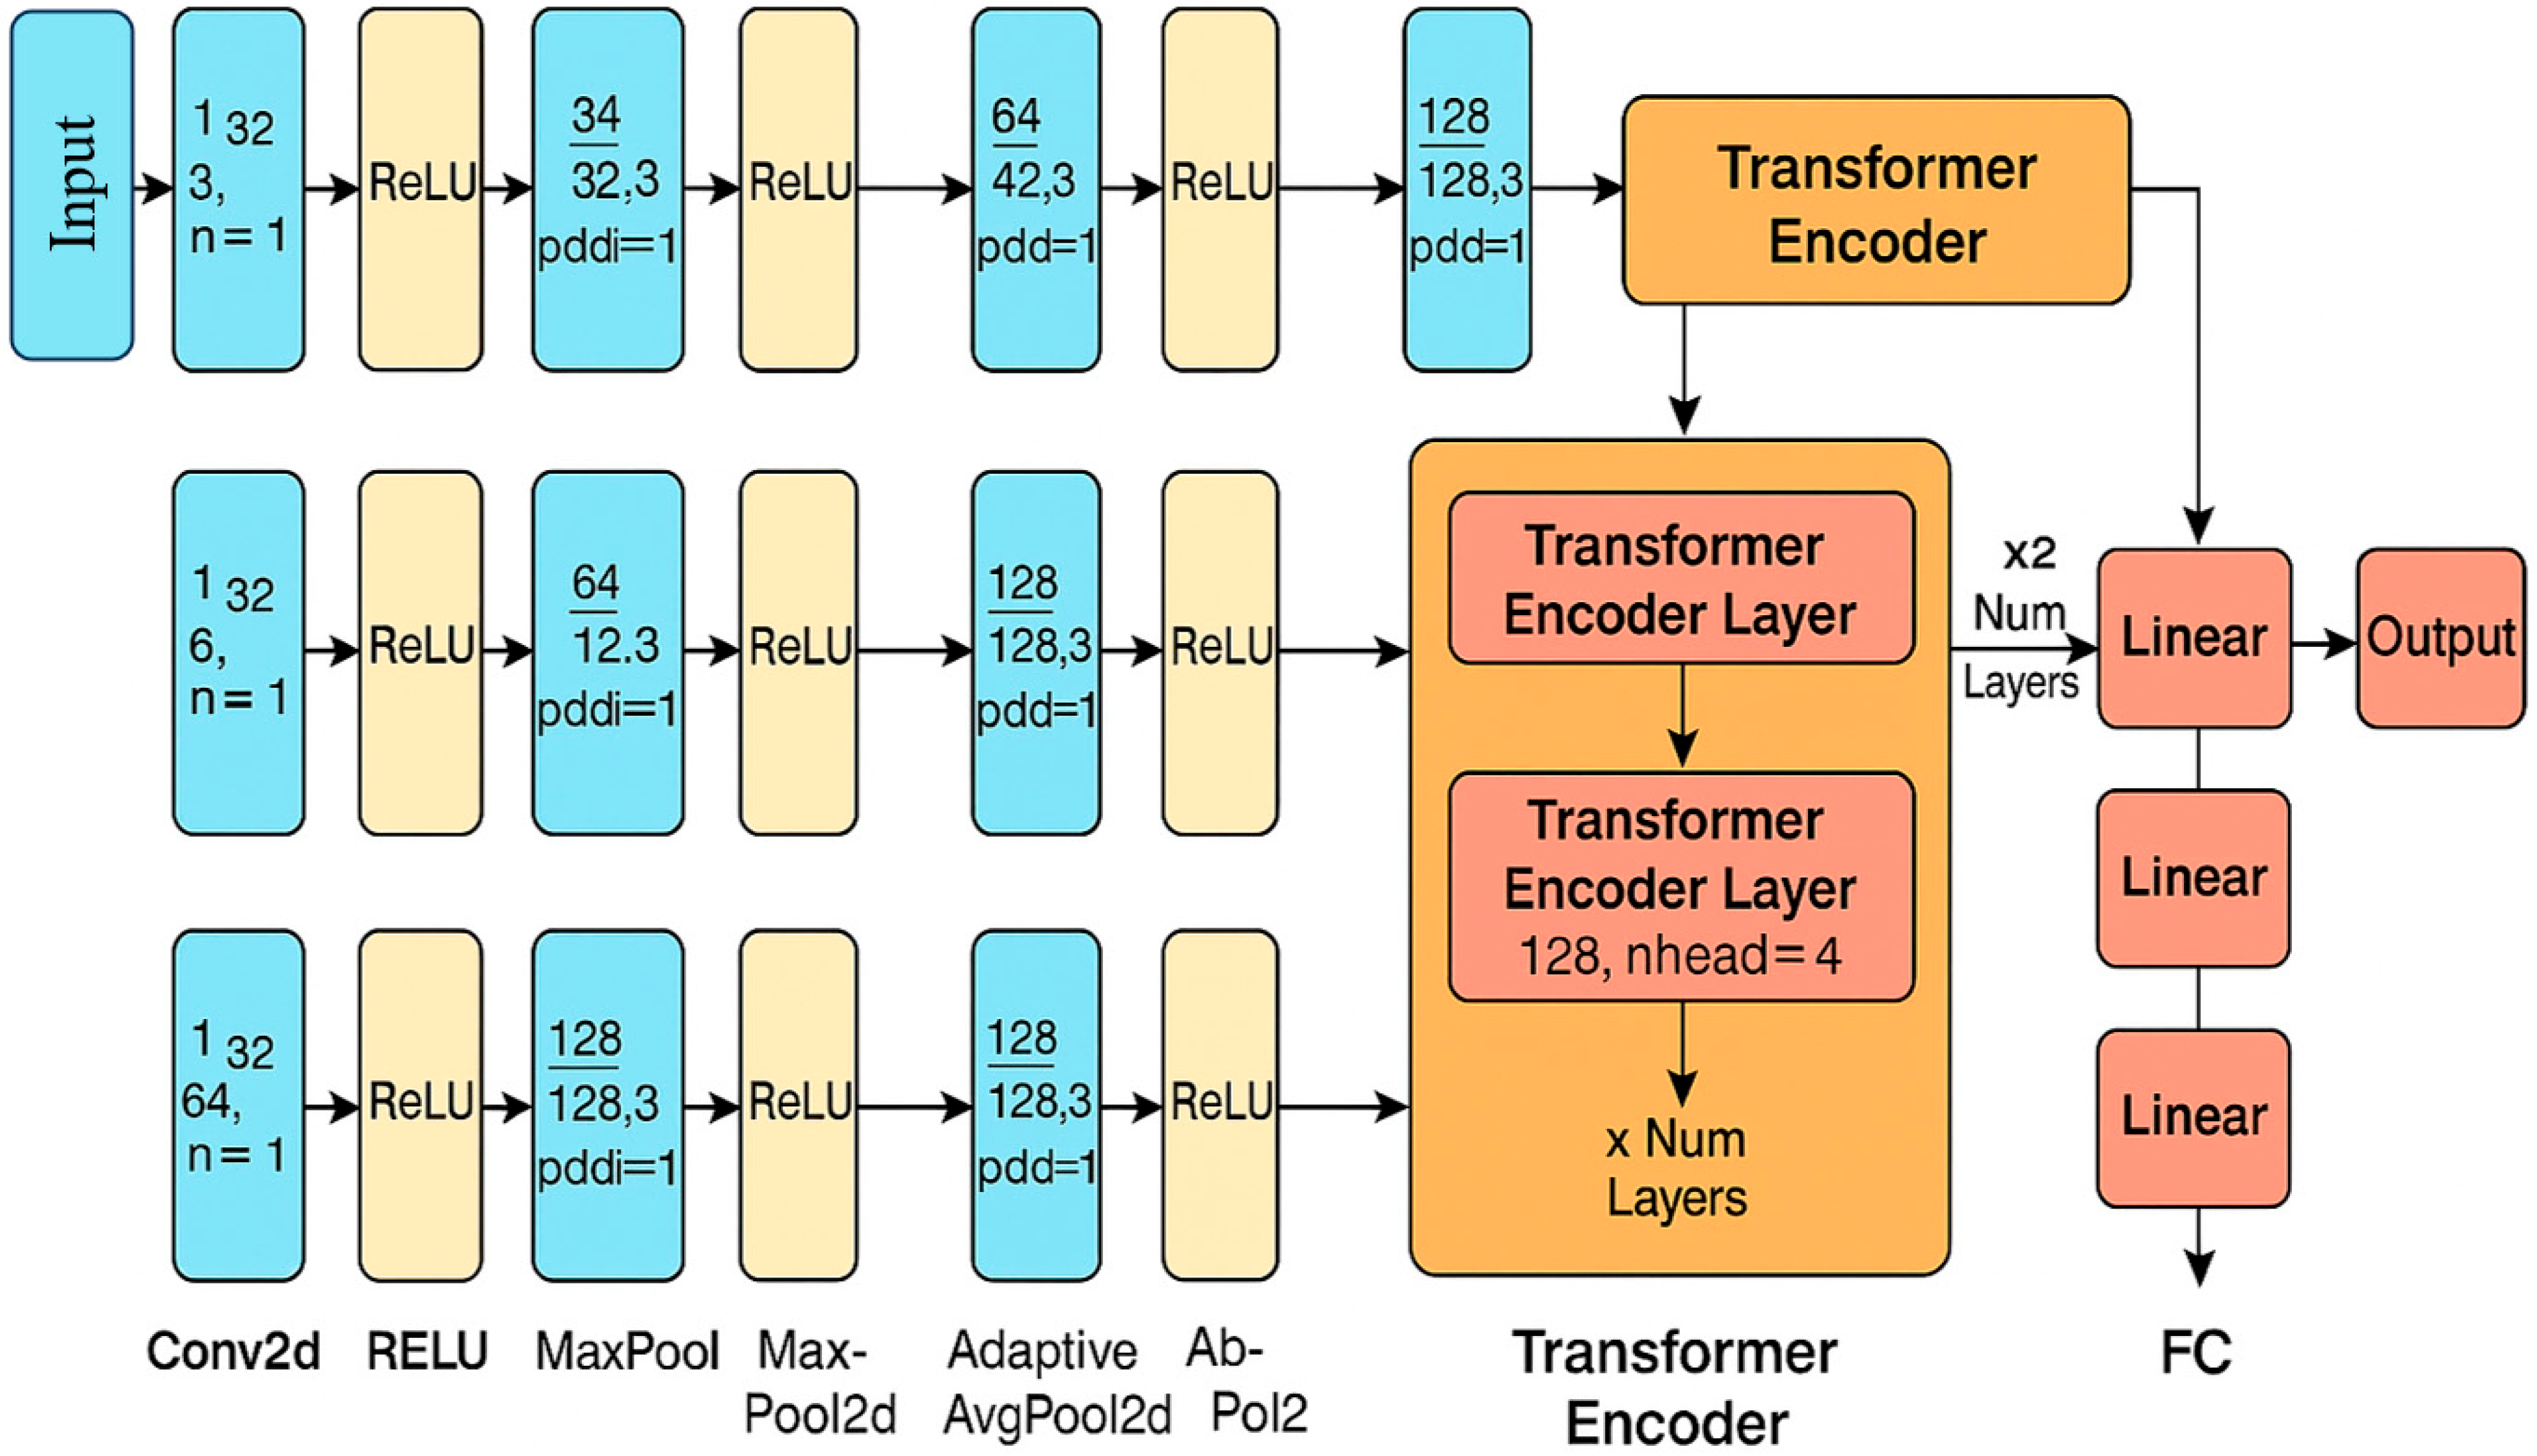
In this study, we propose an innovative hybrid deep-learning framework combining Convolutional Neural Networks (CNN) and Transformer architectures to leverage both spatial feature extraction and global context modeling capabilities, as shown in Figure 2. This CNN-Transformer model is specifically designed for regression tasks involving high-dimensional structured data, such as predicting engineering or structural responses [43]. The proposed model consists of two main stages: the CNN-based spatial feature extraction stage and the Transformer-based global context integration stage.
First, the input feature vectors X R n × d , which represents the number of samples and the number of features, are reshaped into two-dimensional feature images X i m g R d × d . These images are fed into a multi-layer CNN module defined by successive convolutional operations followed by non-linear activation functions and pooling layers. Mathematically, the convolution operation in each CNN layer is defined as follows:
X j l + 1 = f i C l   X i l W i j l + b j l
Symbols (dimensions): X l R C l × H l × W l feature maps; convolution; W i j l R C l 1 × C l × k × k kernels; b j l R C l 1 bias; C l number of input channels (–); k kernel size (–). (Tensors are dimensionless until mapped to physical units.)
Following CNN-based feature extraction, the high-level feature maps are flattened into sequences and fed into a Transformer encoder to capture global dependencies, as shown in Figure 3. The Transformer encoder consists of multi-head self-attention layers and fully connected feed-forward networks [44,45,46]. Specifically, the self-attention mechanism computes attention scores to capture relationships between feature elements, defined as
A t t e n t i o n ( Q , K , V ) = s o f t m a x Q K T d k V
Symbols (dimensions): Z R L × F token matrix from the CNN stage; Q = Z W Q , K = Z W K , V = Z W V with W Q , W K , W V R F × d k ; L tokens (−); F channel width (−); d k key dimension (−).
The multi-head attention integrates multiple such attention mechanisms, allowing the model to jointly attend to information from different representation subspaces:
M u l t i H e a d ( Q , K , V ) = C o n c a t ( h e a d 1 , , h e a d h ) W O
Symbols (dimensions): h e a d i = A t t n Z W Q i , Z W K i , Z W V i ;   W Q i , W K i , W V i R F × d k ; W O R h d k × F ; Concat concatenates along the feature dimension.
The resulting output from the Transformer encoder is then passed through a series of fully connected layers with ReLU activations to generate the final regression prediction y ^ . The training of the proposed CNN-Transformer framework employs the mean squared error (MSE) loss function, defined as follows:
L ( θ ) = 1 N i = 1 N   ( y i y ^ i ) 2
Symbols (units): y i (units of the target variable): ground-truth value for sample i ; y ^ i (same units as y i ): model prediction for sample i ; N (−): number of samples; θ (−): trainable parameters. Unit note: L has the squared units of y ; if y is normalized and dimensionless, L is dimensionless.

3.2. Data Collection and Analysis

To establish a foundation for this study, we conducted an extensive literature review to gather data from experiments on beams fabricated from UHPC, High Performance Concrete (HPC), and Reactive Powder Concrete (RPC), as detailed in Table 1. The goal was to compile a comprehensive set of experimental results that would offer valuable insights into the behavior of these materials under various loading conditions and structural configurations. We focused on studies that provided detailed experimental data, including specifics about the UHPC samples, bam dimensions, reinforcement details, and testing conditions.
The data collected included key parameters such as the beam’s cross-sectional shape, dimensions, span length, longitudinal and shear reinforcement ratios, and fiber characteristics. The beam shapes varied from rectangular, T-shaped, and I-shaped sections, each influencing the flexural capacity in different ways due to their geometry. The span lengths of the beams were also included, as they have a direct impact on the distribution of bending moments and shear forces. Additionally, the data covered the longitudinal reinforcement ratio, which represents the amount of reinforcement relative to the beam’s cross-sectional area, an important factor in determining flexural strength. The shear reinforcement ratio, which refers to the configuration and quantity of stirrups, was also documented, as it plays a critical role in enhancing the shear strength and preventing shear failure. Moreover, the fiber content and types used in the UHPC beams, such as steel and synthetic fibers, were noted. Fiber inclusion significantly improves the post-cracking performance and overall toughness of the concrete.

3.3. Experimental Data Scope

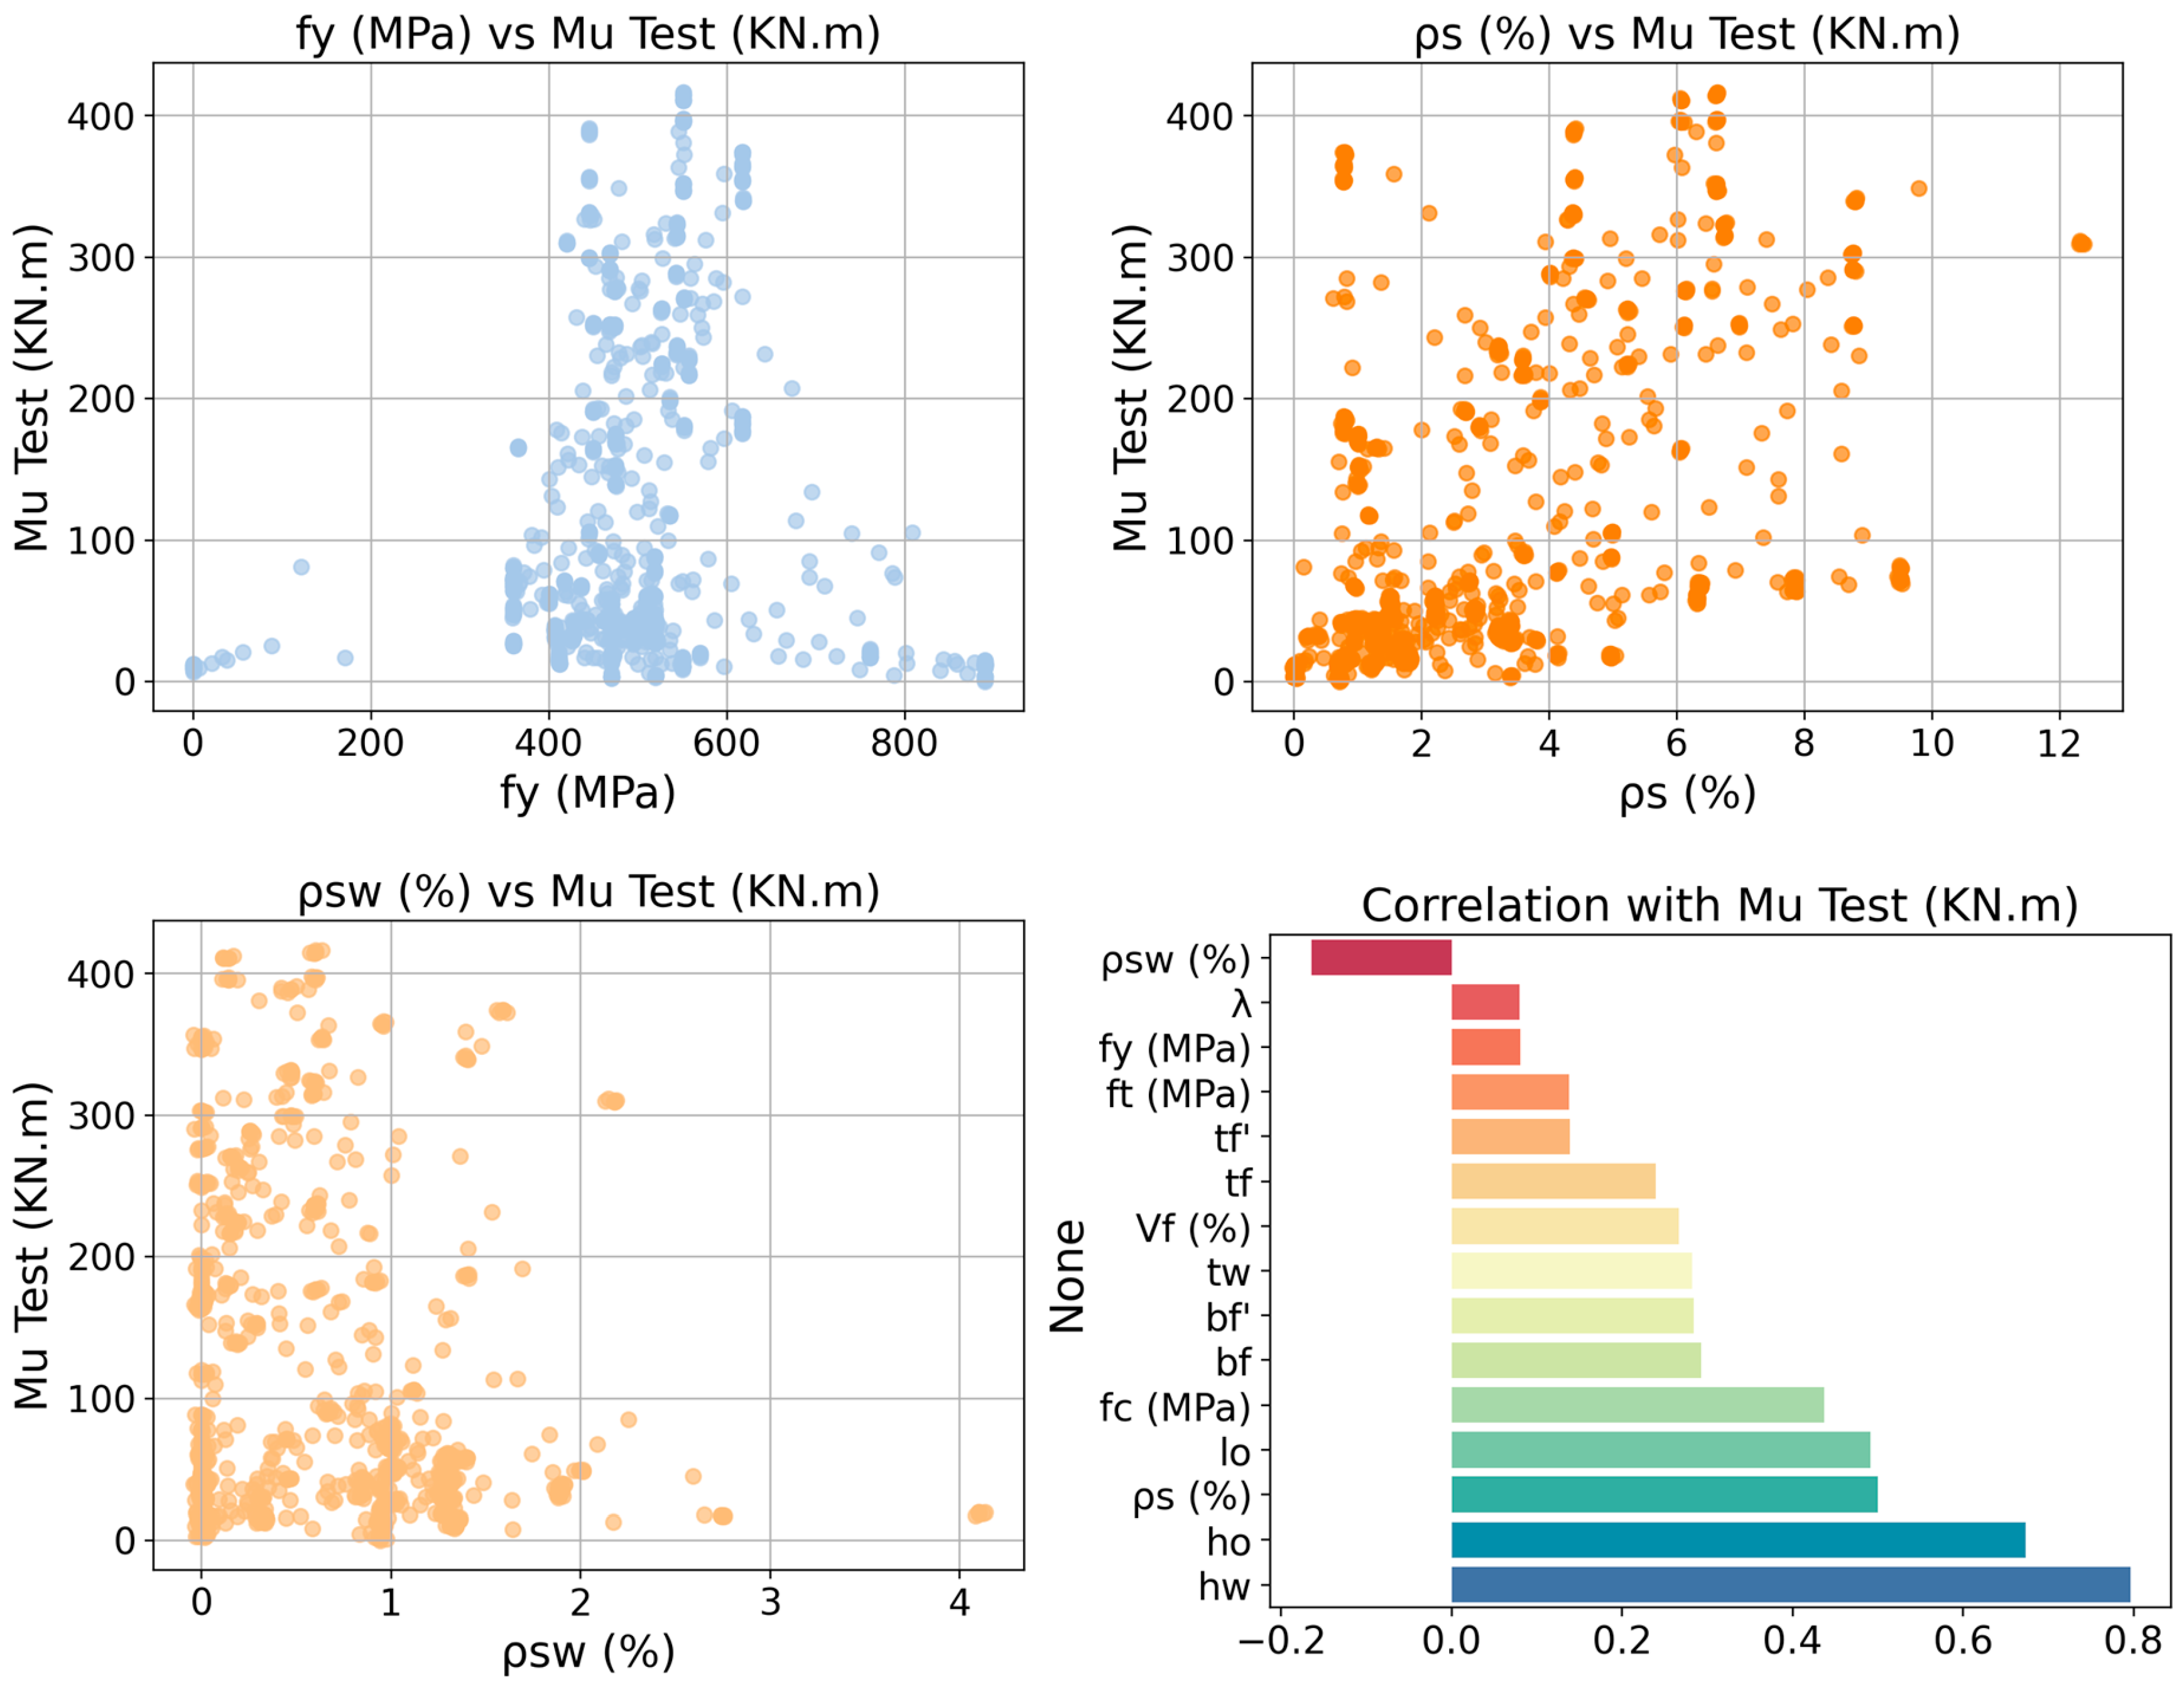
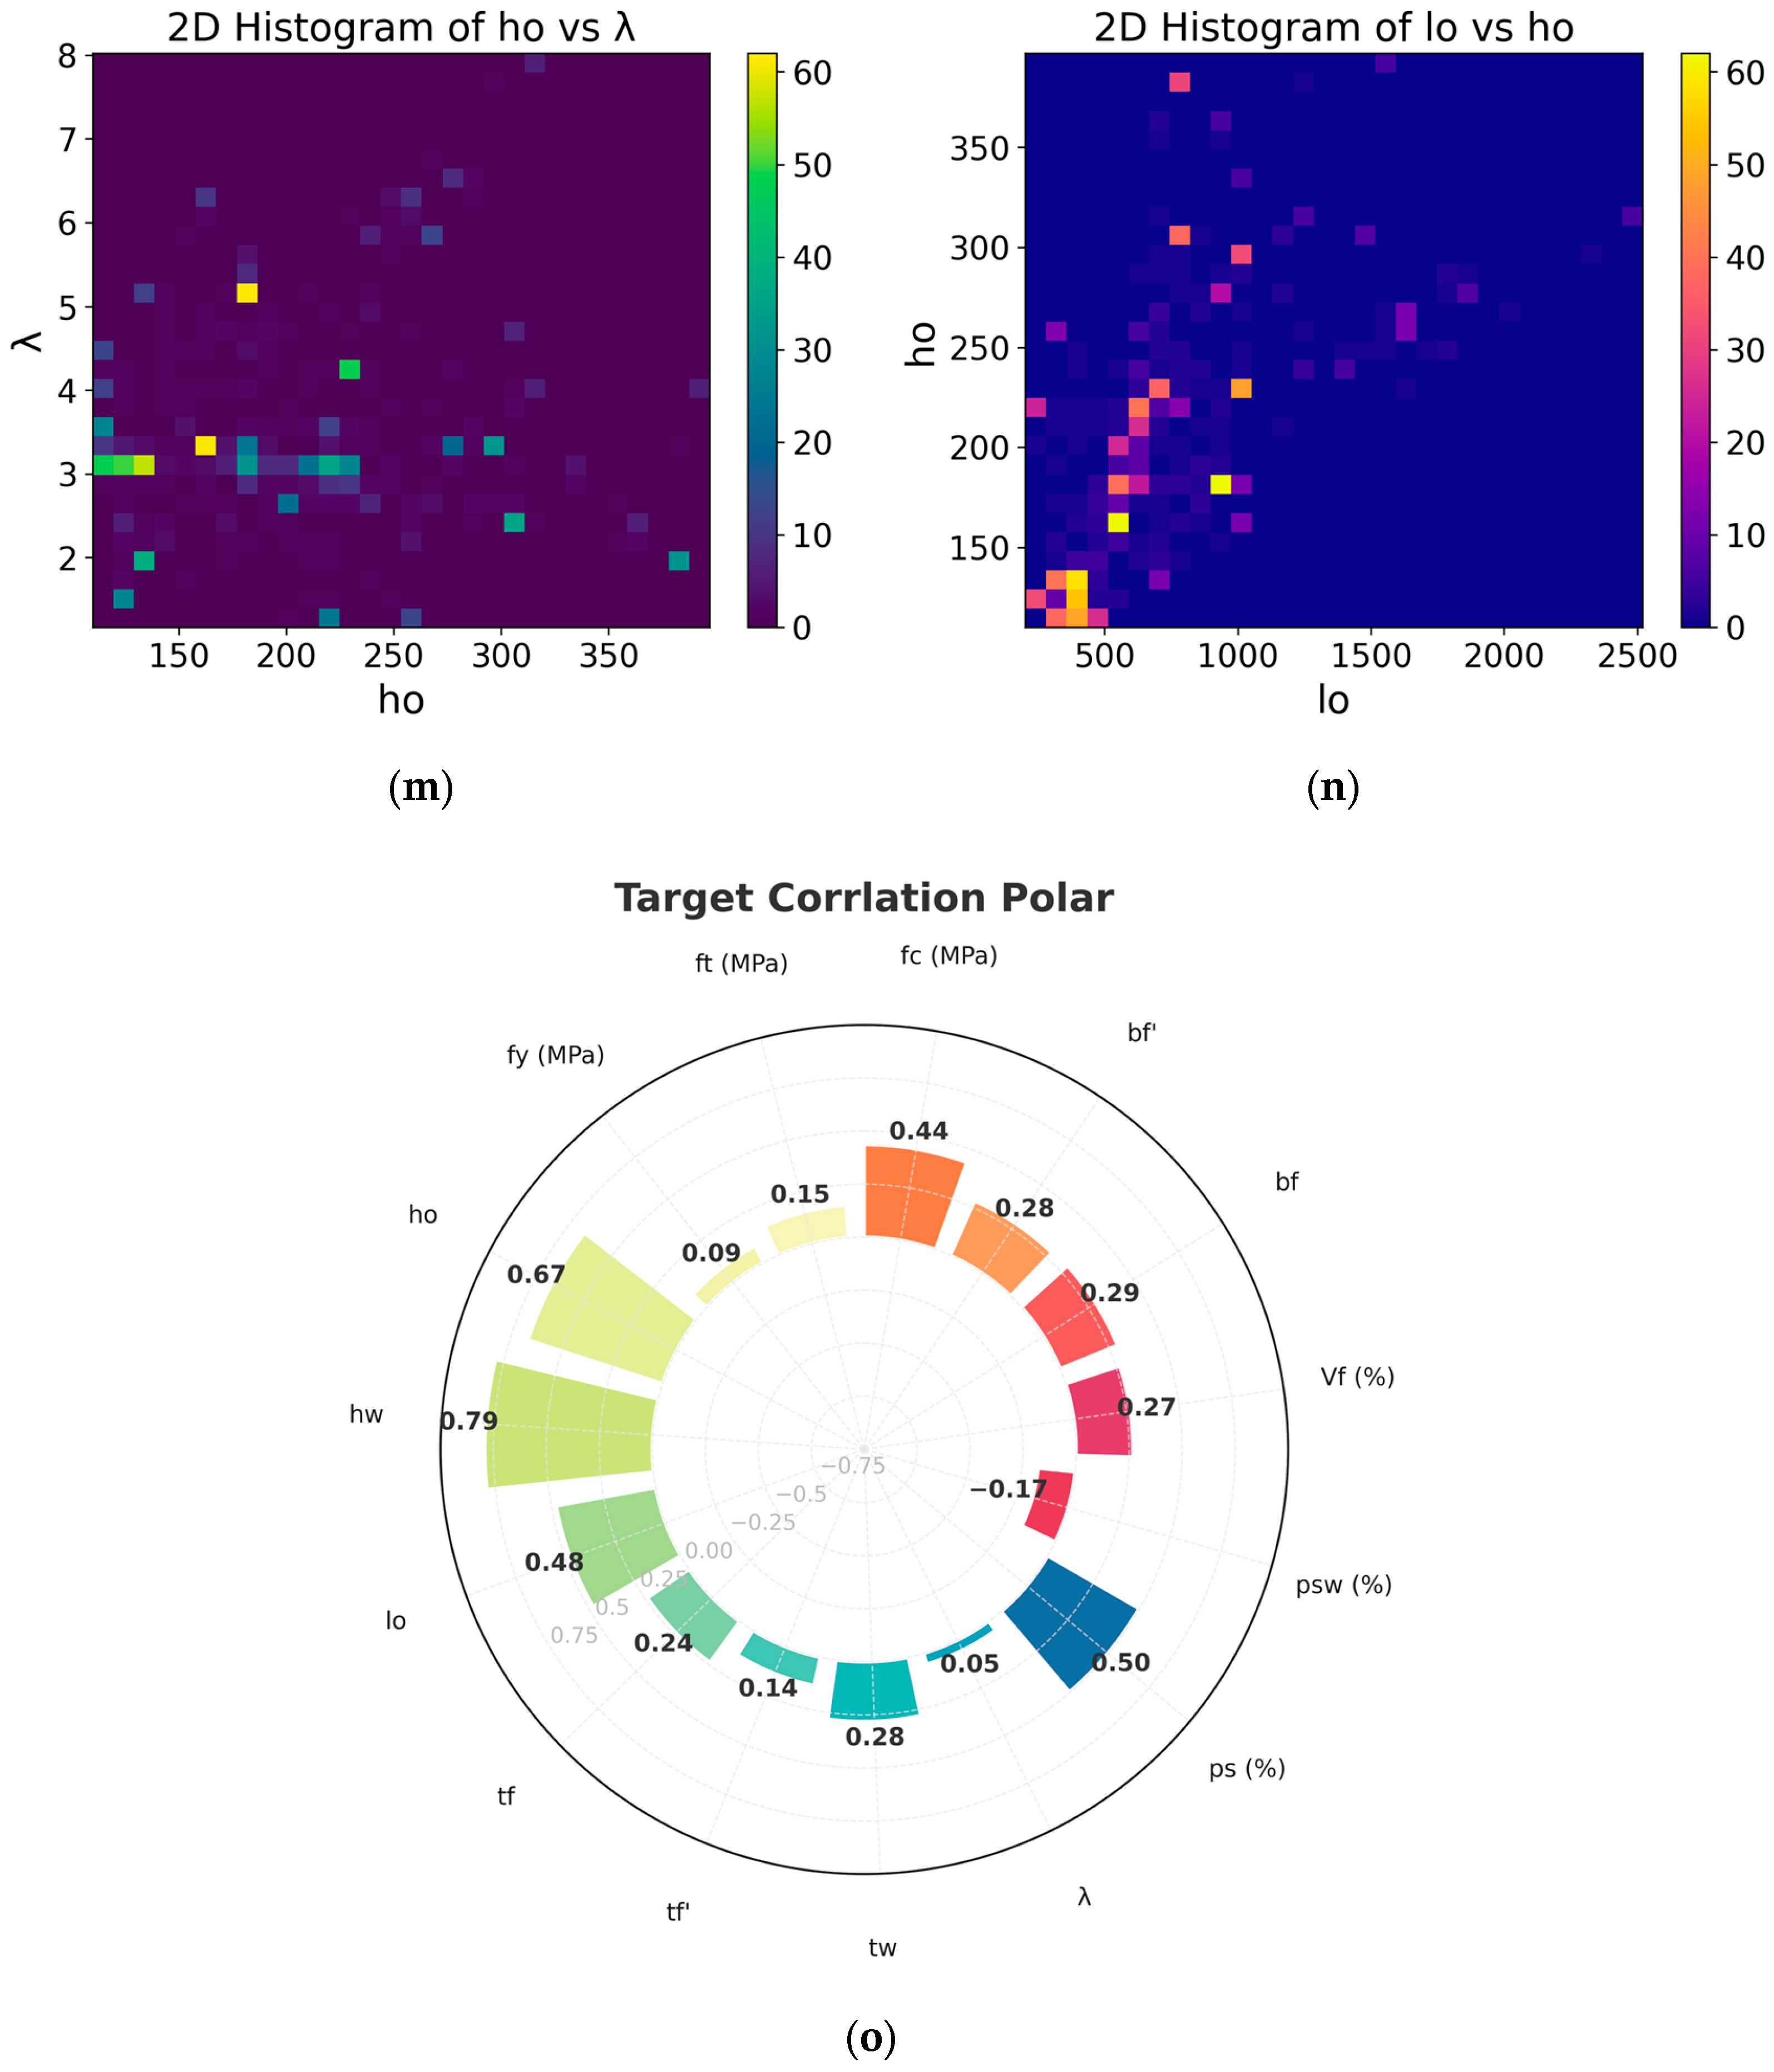
Figure 4 presents a quantitative analysis of the correlation coefficients between various input parameters and the target variable, Mu Test (KN·m). The correlation coefficients range from negative to positive, providing insight into the degree and direction of linear relationships. Parameters such as hw, ho, and ρs (%) exhibit strong positive correlations, indicating their significant influence on enhancing Mu Test values. In contrast, parameters like ρsw (%) show negative correlations, suggesting an inverse relationship. This visualization aids in understanding critical parameters impacting Mu Test predictions and guides the selection of features for model training and structural analysis.
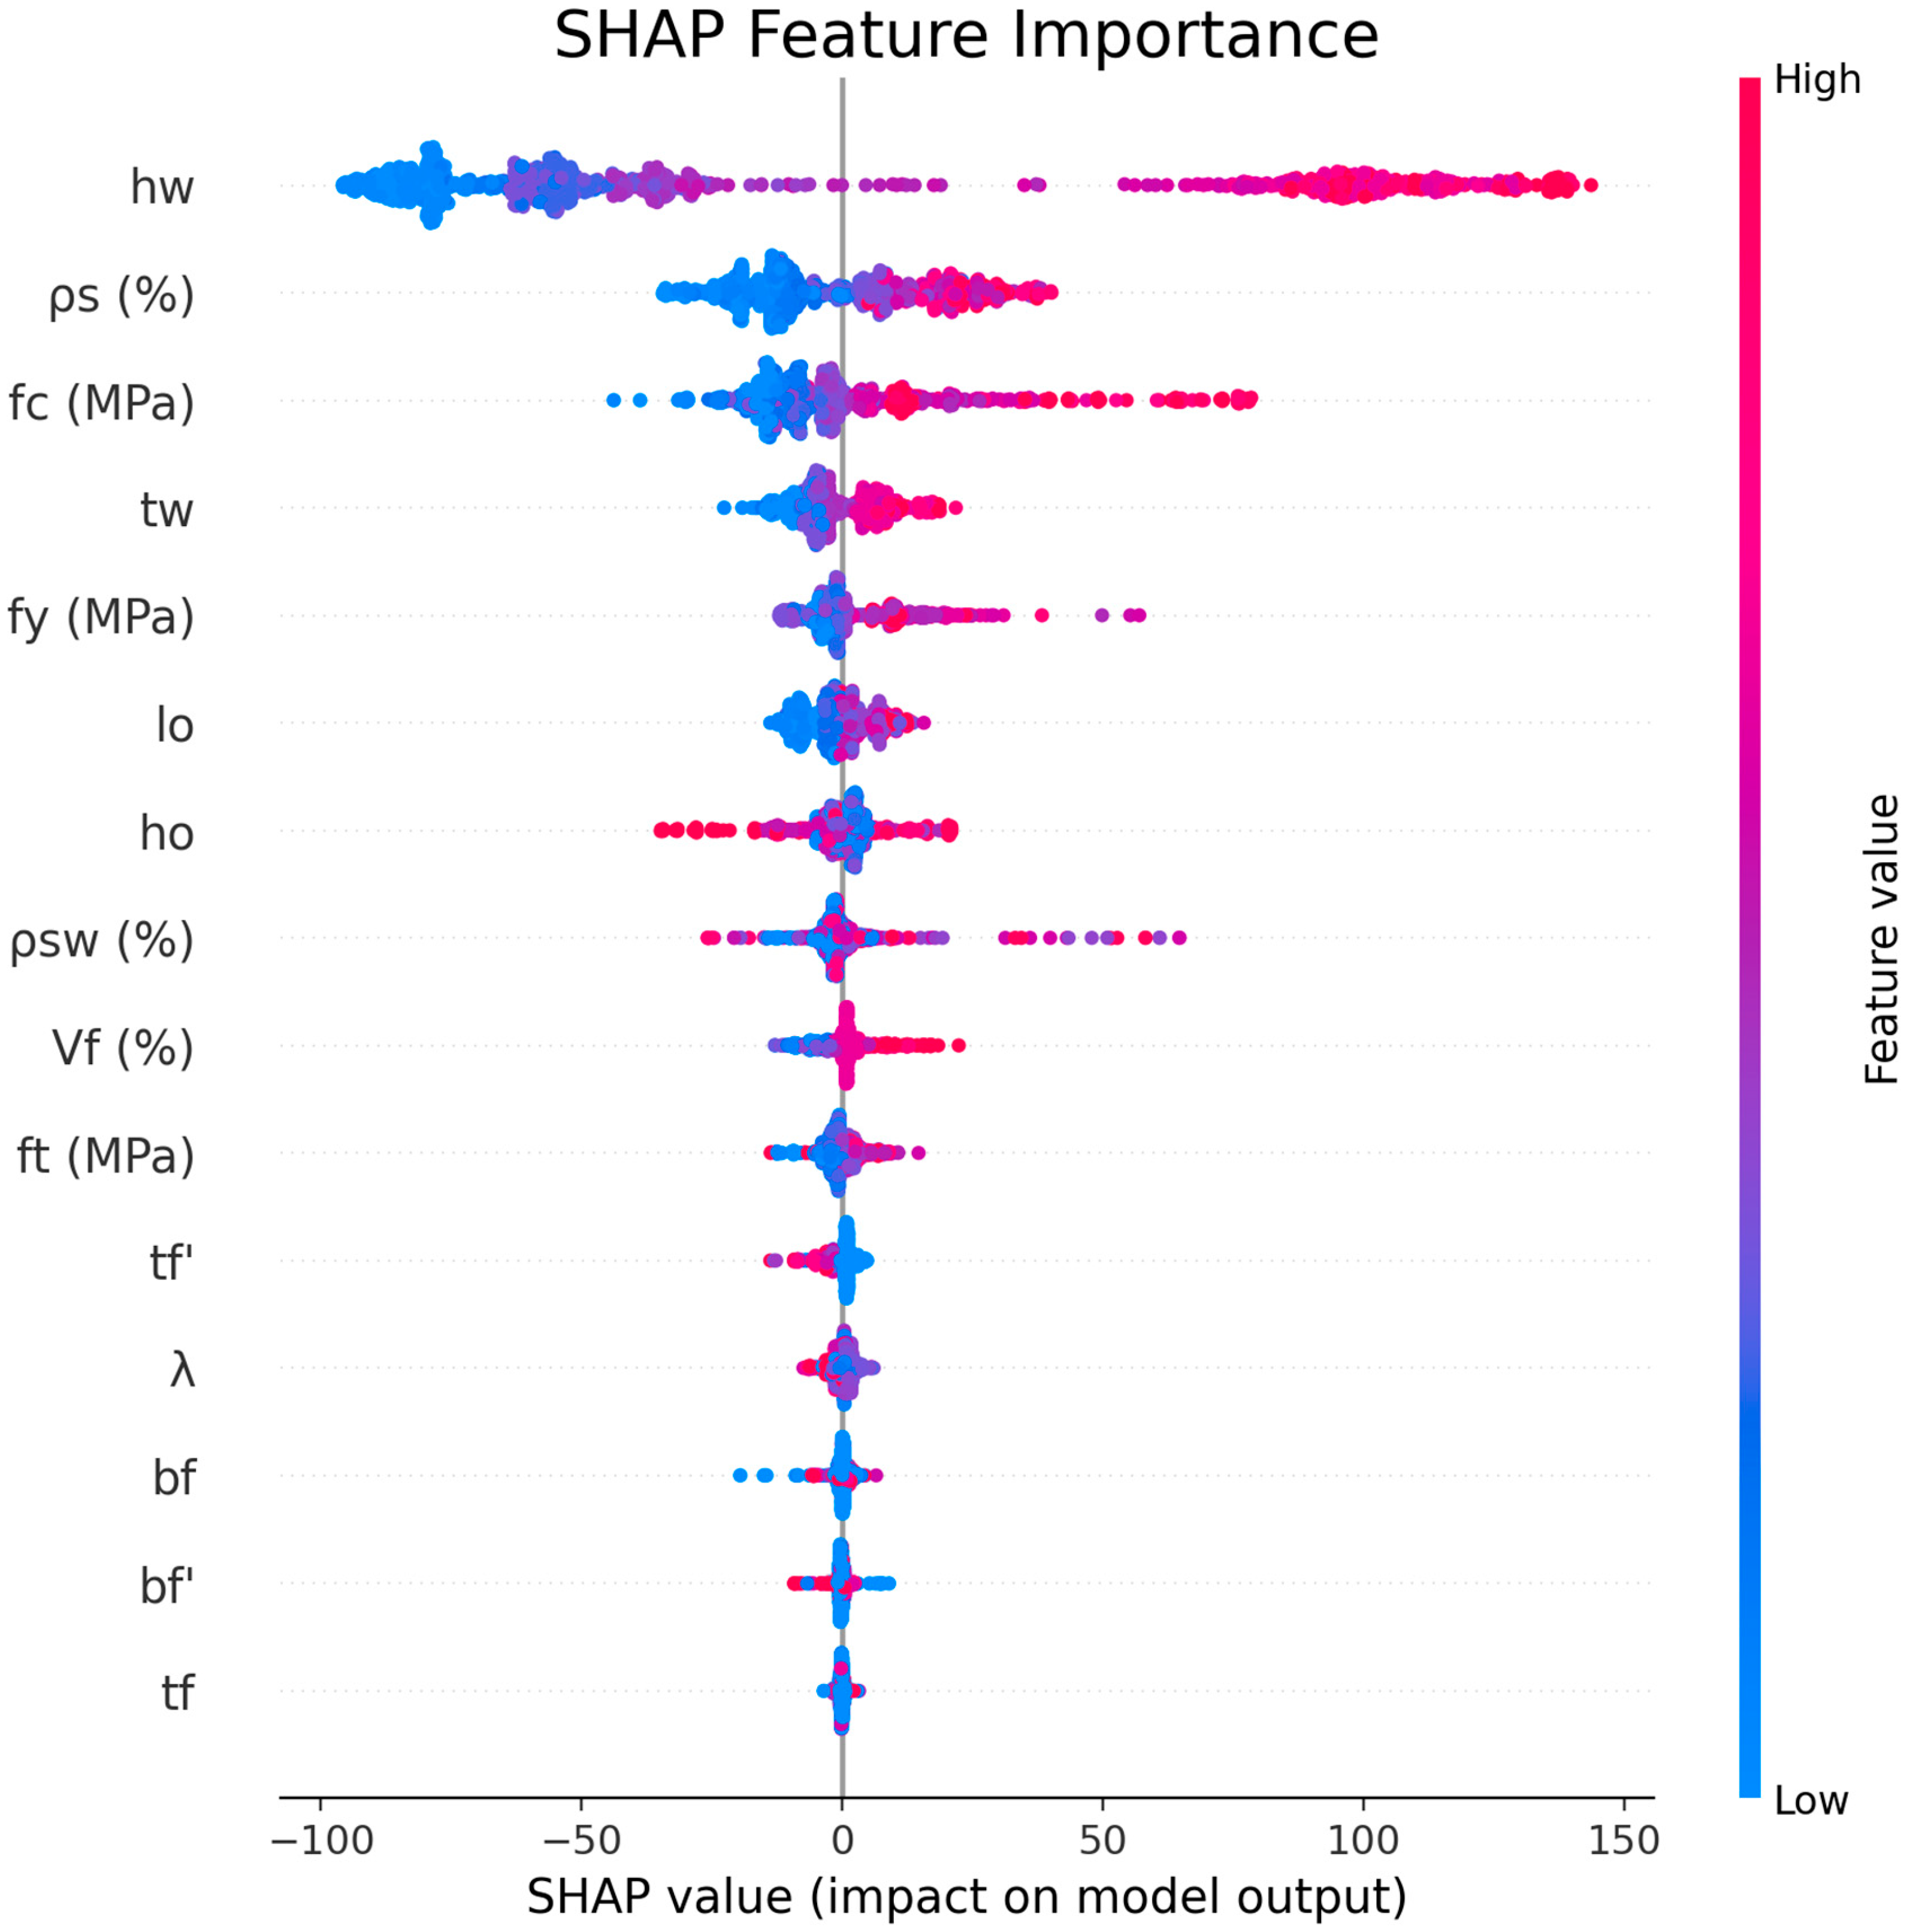
Figure 5 illustrates a SHapley Additive exPlanations (SHAP) summary plot, quantifying the importance of each input feature in predicting the structural performance of UHPFRC beams. Each point represents a SHAP value for a particular sample, with colors indicating the magnitude of the feature values (from low in blue to high in red). The plot reveals that the height of the beam web (hw) significantly impacts model predictions, exhibiting the widest distribution and largest absolute SHAP values ranging from approximately −100 to +150. This underscores the paramount importance of hw in determining structural response. Other influential parameters include the longitudinal reinforcement ratio (ρs), concrete compressive strength (fc), and web thickness (tw), which also show substantial influence with SHAP value ranges approximately between ±40 to ±60. In contrast, flange thickness (tf), flange width (bf), and effective flange width (bf) display minimal effects, with SHAP values concentrated around zero, indicating a limited impact on the predicted outcomes. Overall, the SHAP analysis quantitatively emphasizes key parameters that should be prioritized in structural design and optimization efforts.
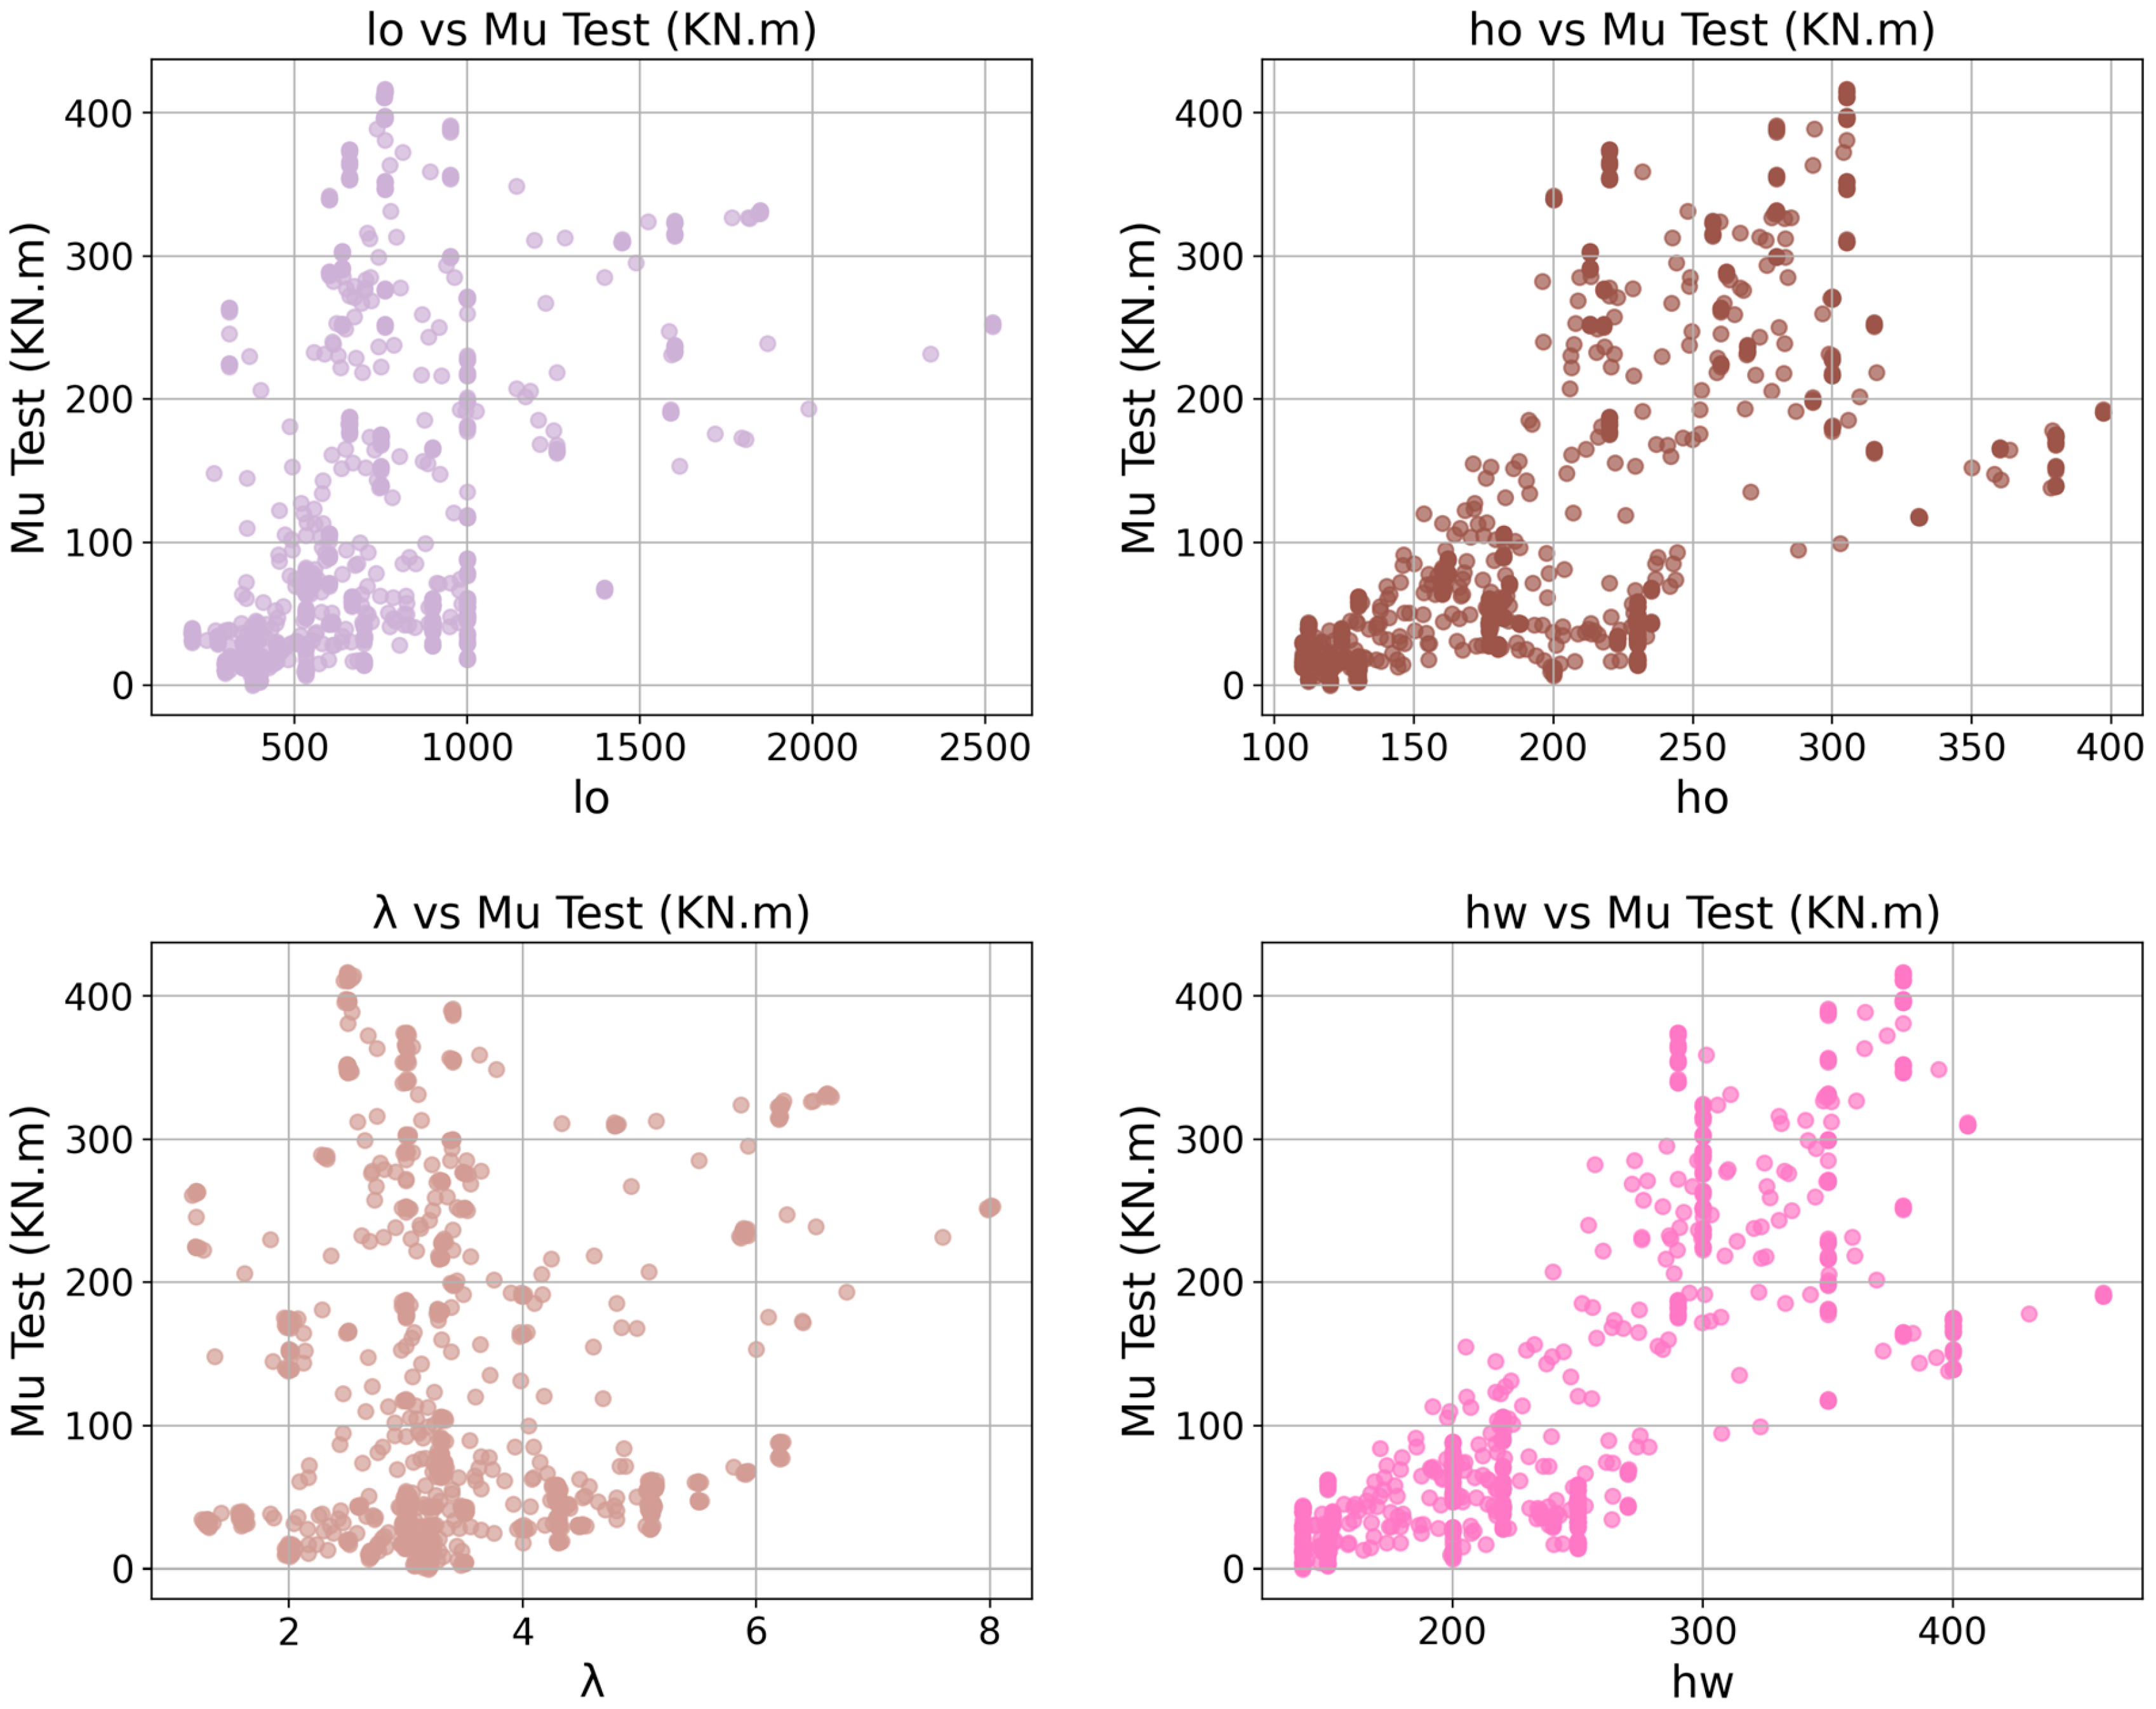
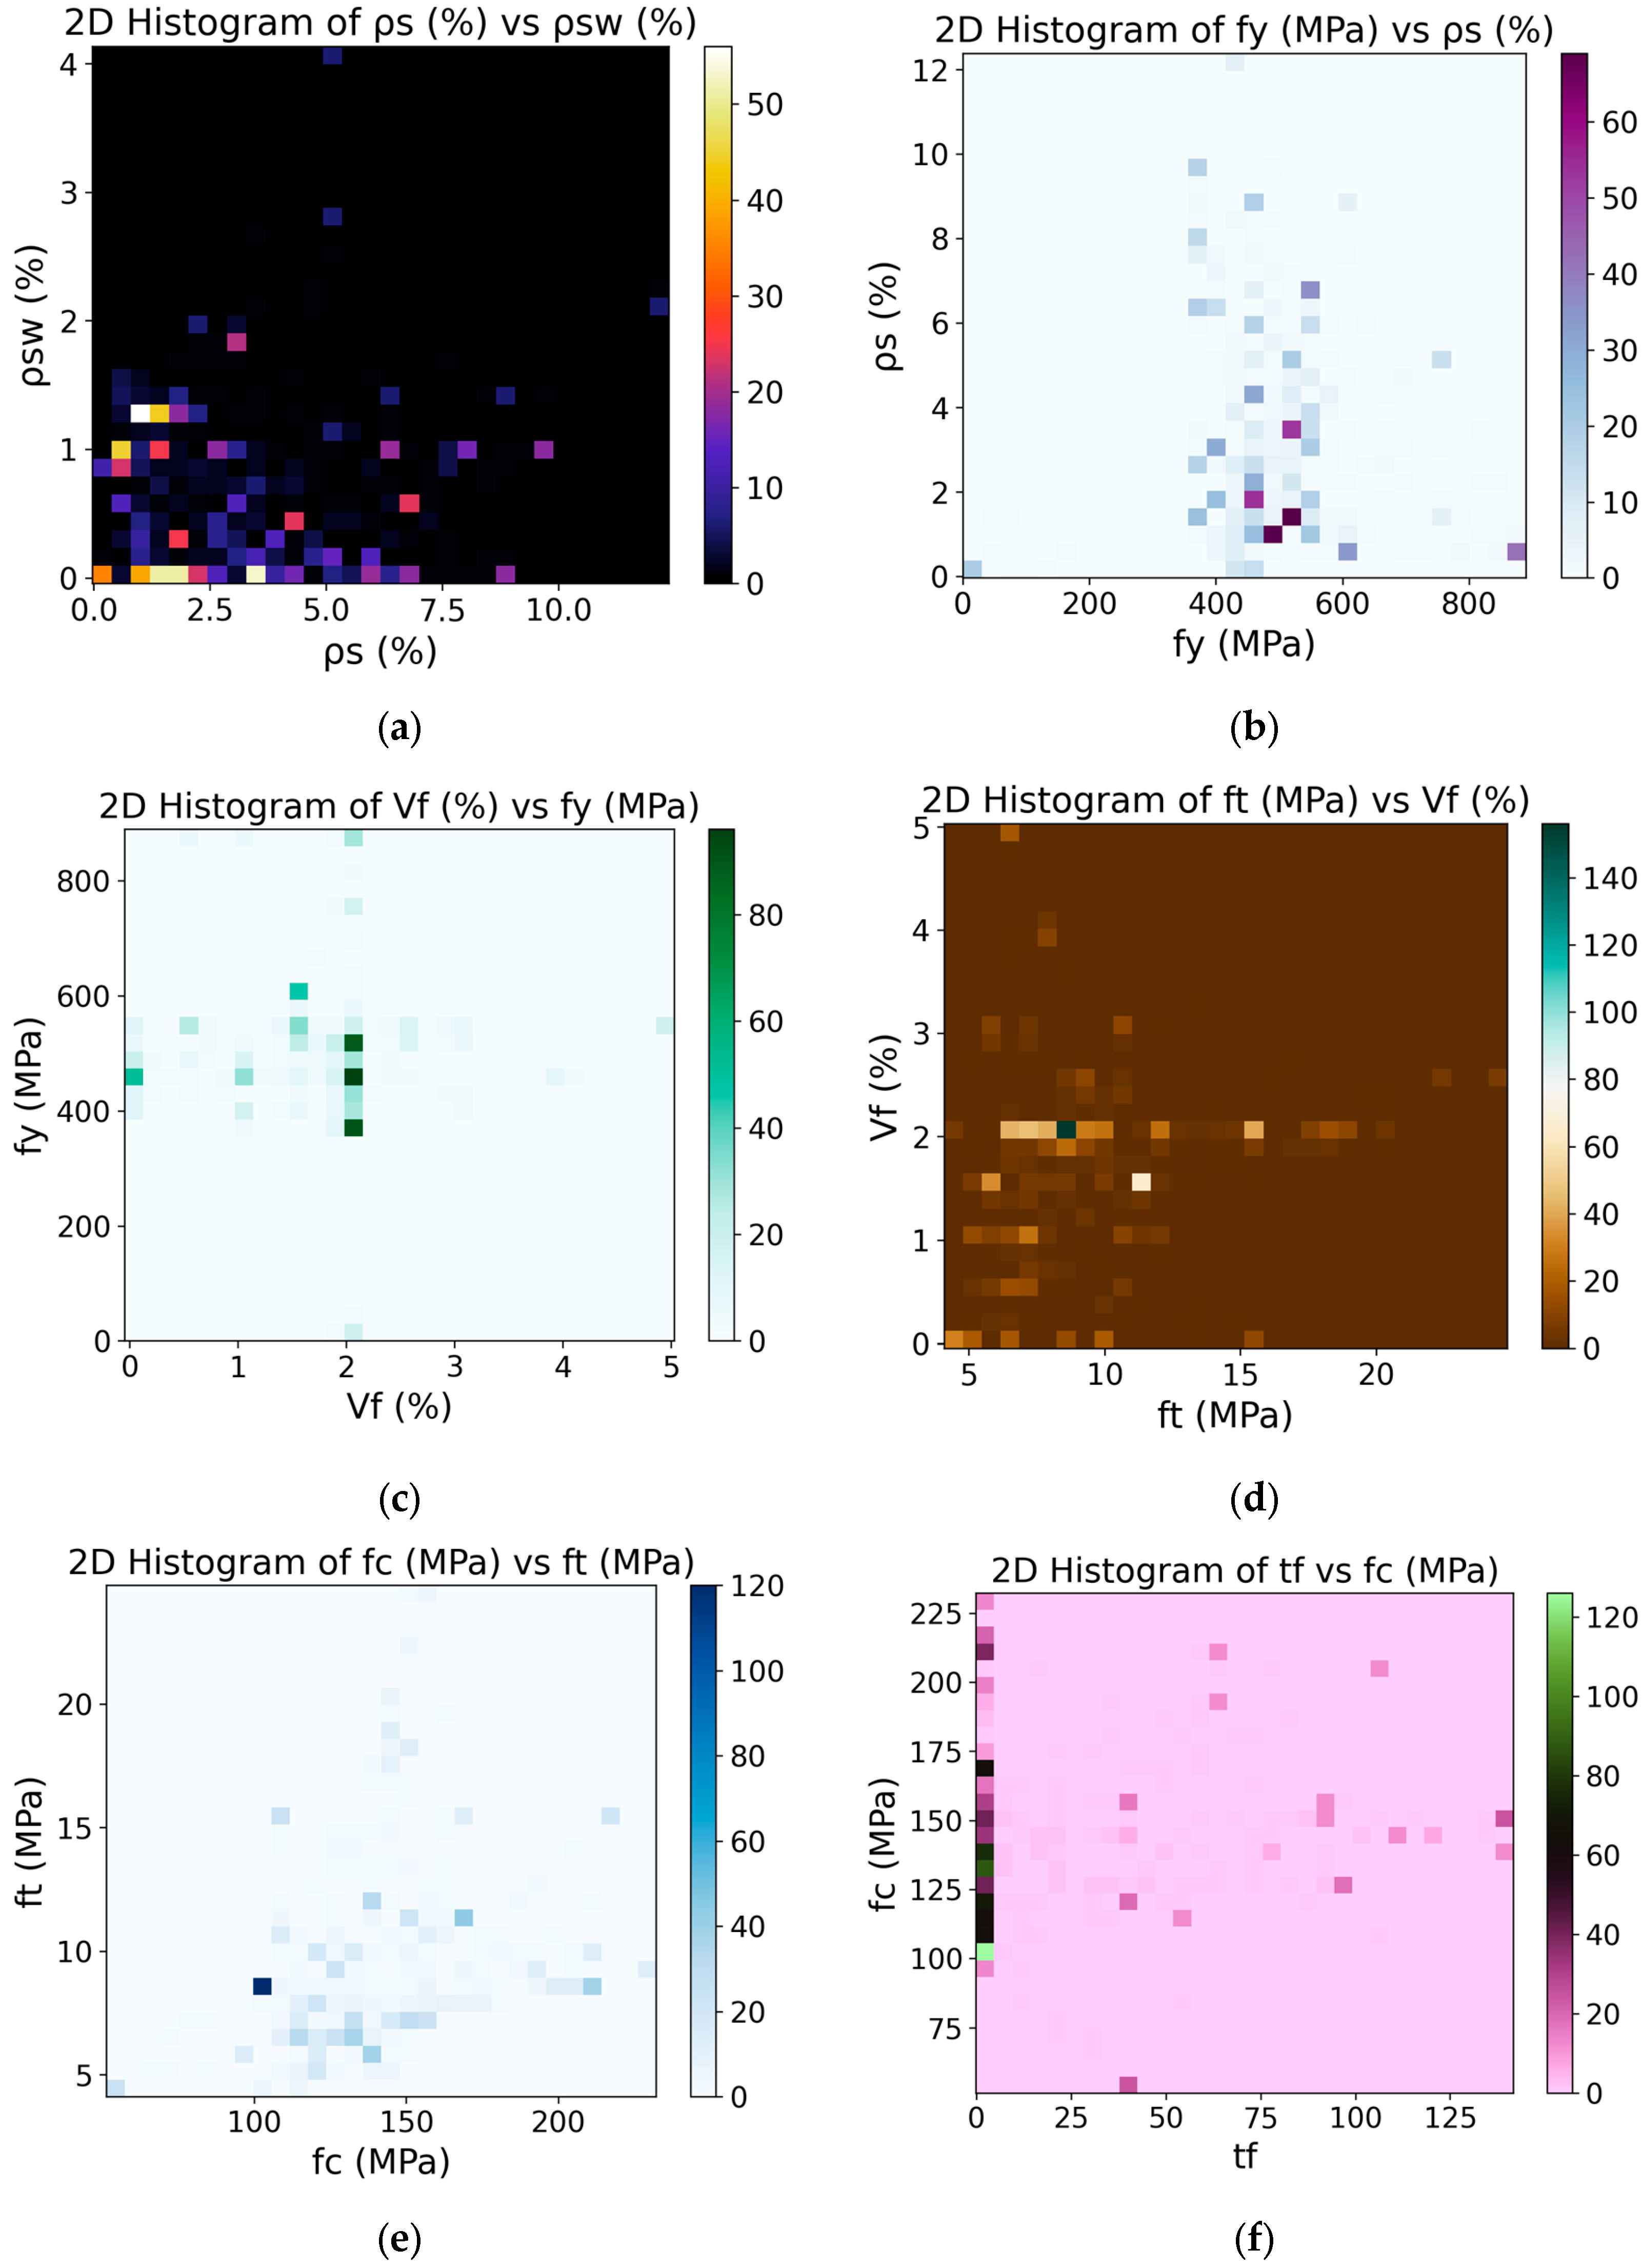
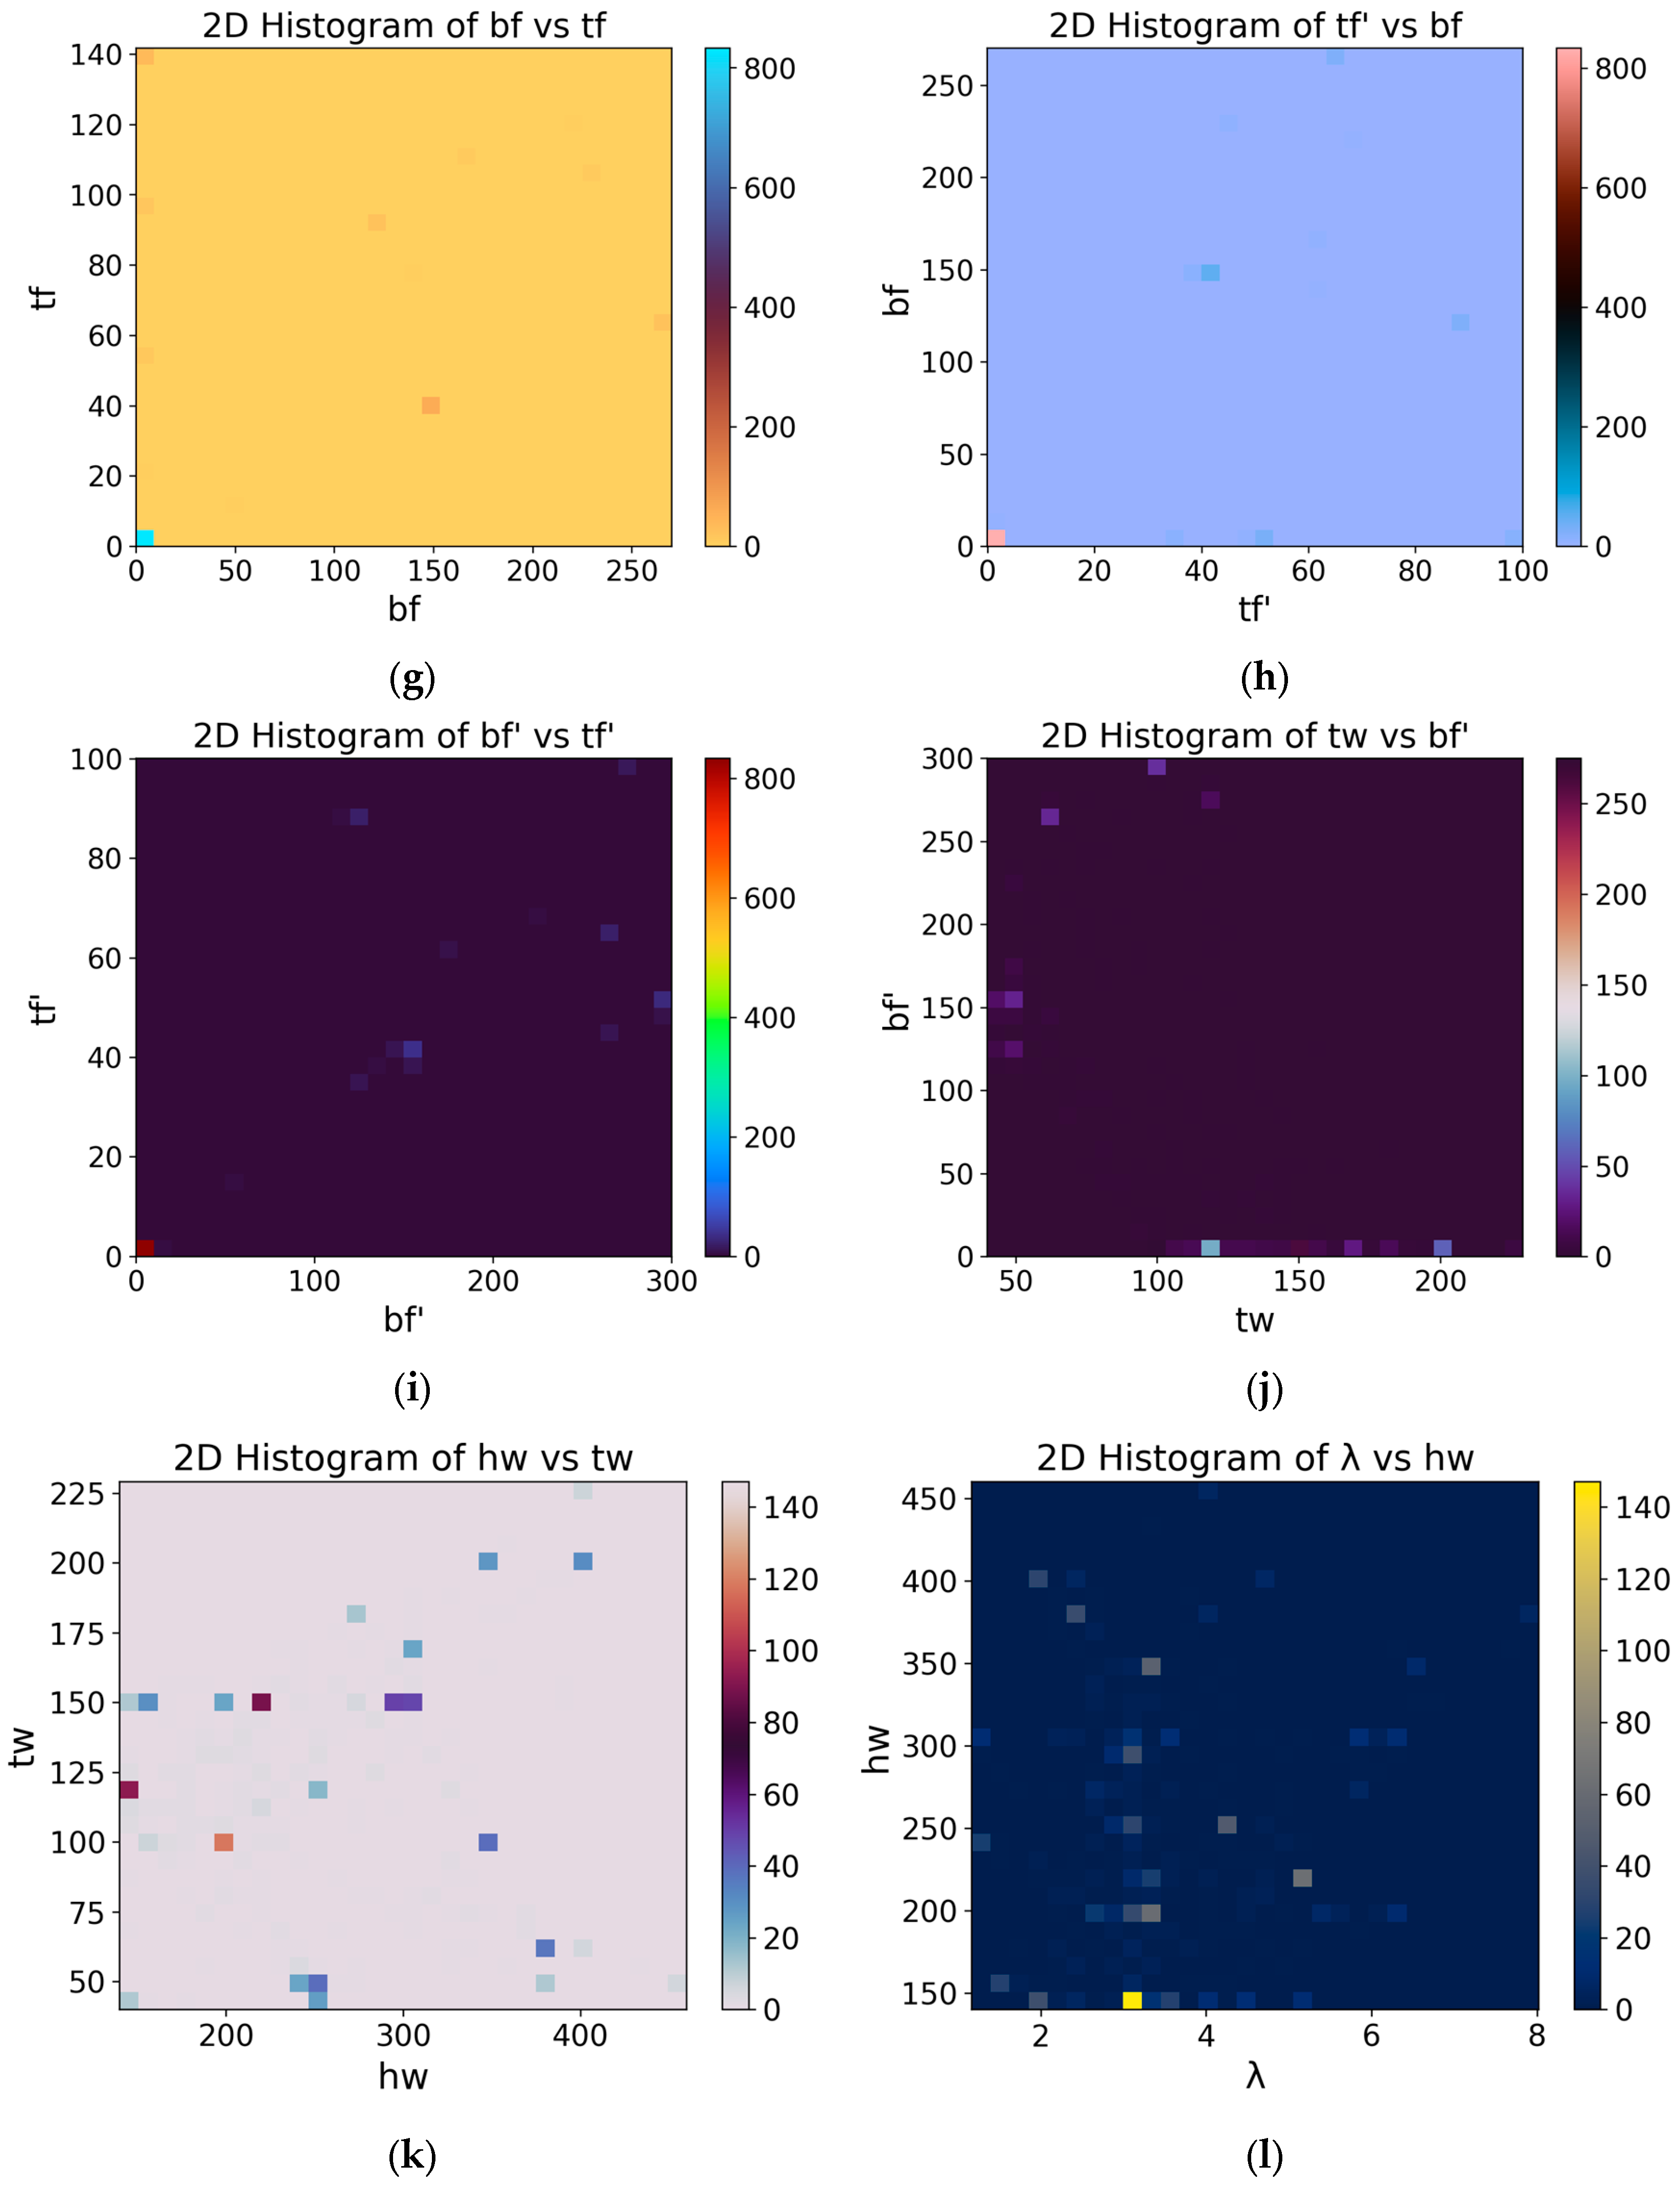
Figure 6 presents an extensive multivariate analysis through multiple two-dimensional histograms, highlighting interactions and distributions of key structural parameters influencing the mechanical performance of UHPFRC beams. Each histogram visualizes the joint distribution of parameter pairs such as reinforcement ratios (ρs vs. ρsw), yield strength versus fiber volume fraction (fy vs. Vf), geometric dimensions (e.g., web height hw, flange width bf), and material properties (compressive strength fc, tensile strength ft. Notably, the histogram of longitudinal versus shear reinforcement (ρs vs. ρsw) exhibits a concentrated density around lower reinforcement ratios, emphasizing common design preferences in practice. Additionally, the polar correlation plot at the bottom provides a concise visualization of the linear relationships between each parameter and the target variable, clearly demonstrating that web height (hw), reinforcement ratios (ρs, ρsw), and beam length parameters (lo, ho) exhibit relatively higher correlation magnitudes (ranging approximately 0.4–0.7) with the model prediction. This comprehensive visualization helps identify significant parameter interactions and dependencies critical for optimizing beam design and performance prediction.

4. Results and Discussion

4.1. Evaluation of Training Process

The network’s architecture was fixed a priori (three convolutional blocks followed by a two-layer Transformer encoder), while all scalar hyper-parameters were optimized with a Bayesian optimization routine implemented in Optuna 3.6 [47]. Each trial trained the full model for 60 epochs with early-stopping (patience = 8) on the validation loss; the objective metric was the mean RMSE over a 5-fold stratified cross-validation. The search space comprised seven continuous/discrete variables: learning rate lr [1 × 10⁻⁵, 3 × 10⁻³, log-uniform], batch-size ∈ {32, 64, 96, 128}, dropout p [0.05, 0.35], number of Transformer heads n ∈ {2, 4, 8}, model width d_model ∈ {32, 64, 96, 128}, convolutional kernel size k ∈ {3, 5, 7}, and weight-decay λ [1 × 10⁻⁶, 1 × 10⁻³]. The best configuration selected a learning rate of 8.7 × 10⁻⁴, batch-size = 64, dropout = 0.15, n_heads = 4, d_model = 64, kernel size = 5, and weight-decay = 3.4 × 10⁻⁵. With this setup, the final training (including 10-epoch warm-up and cosine-annealing scheduler) took 34 min on an NVIDIA RTX 3070.
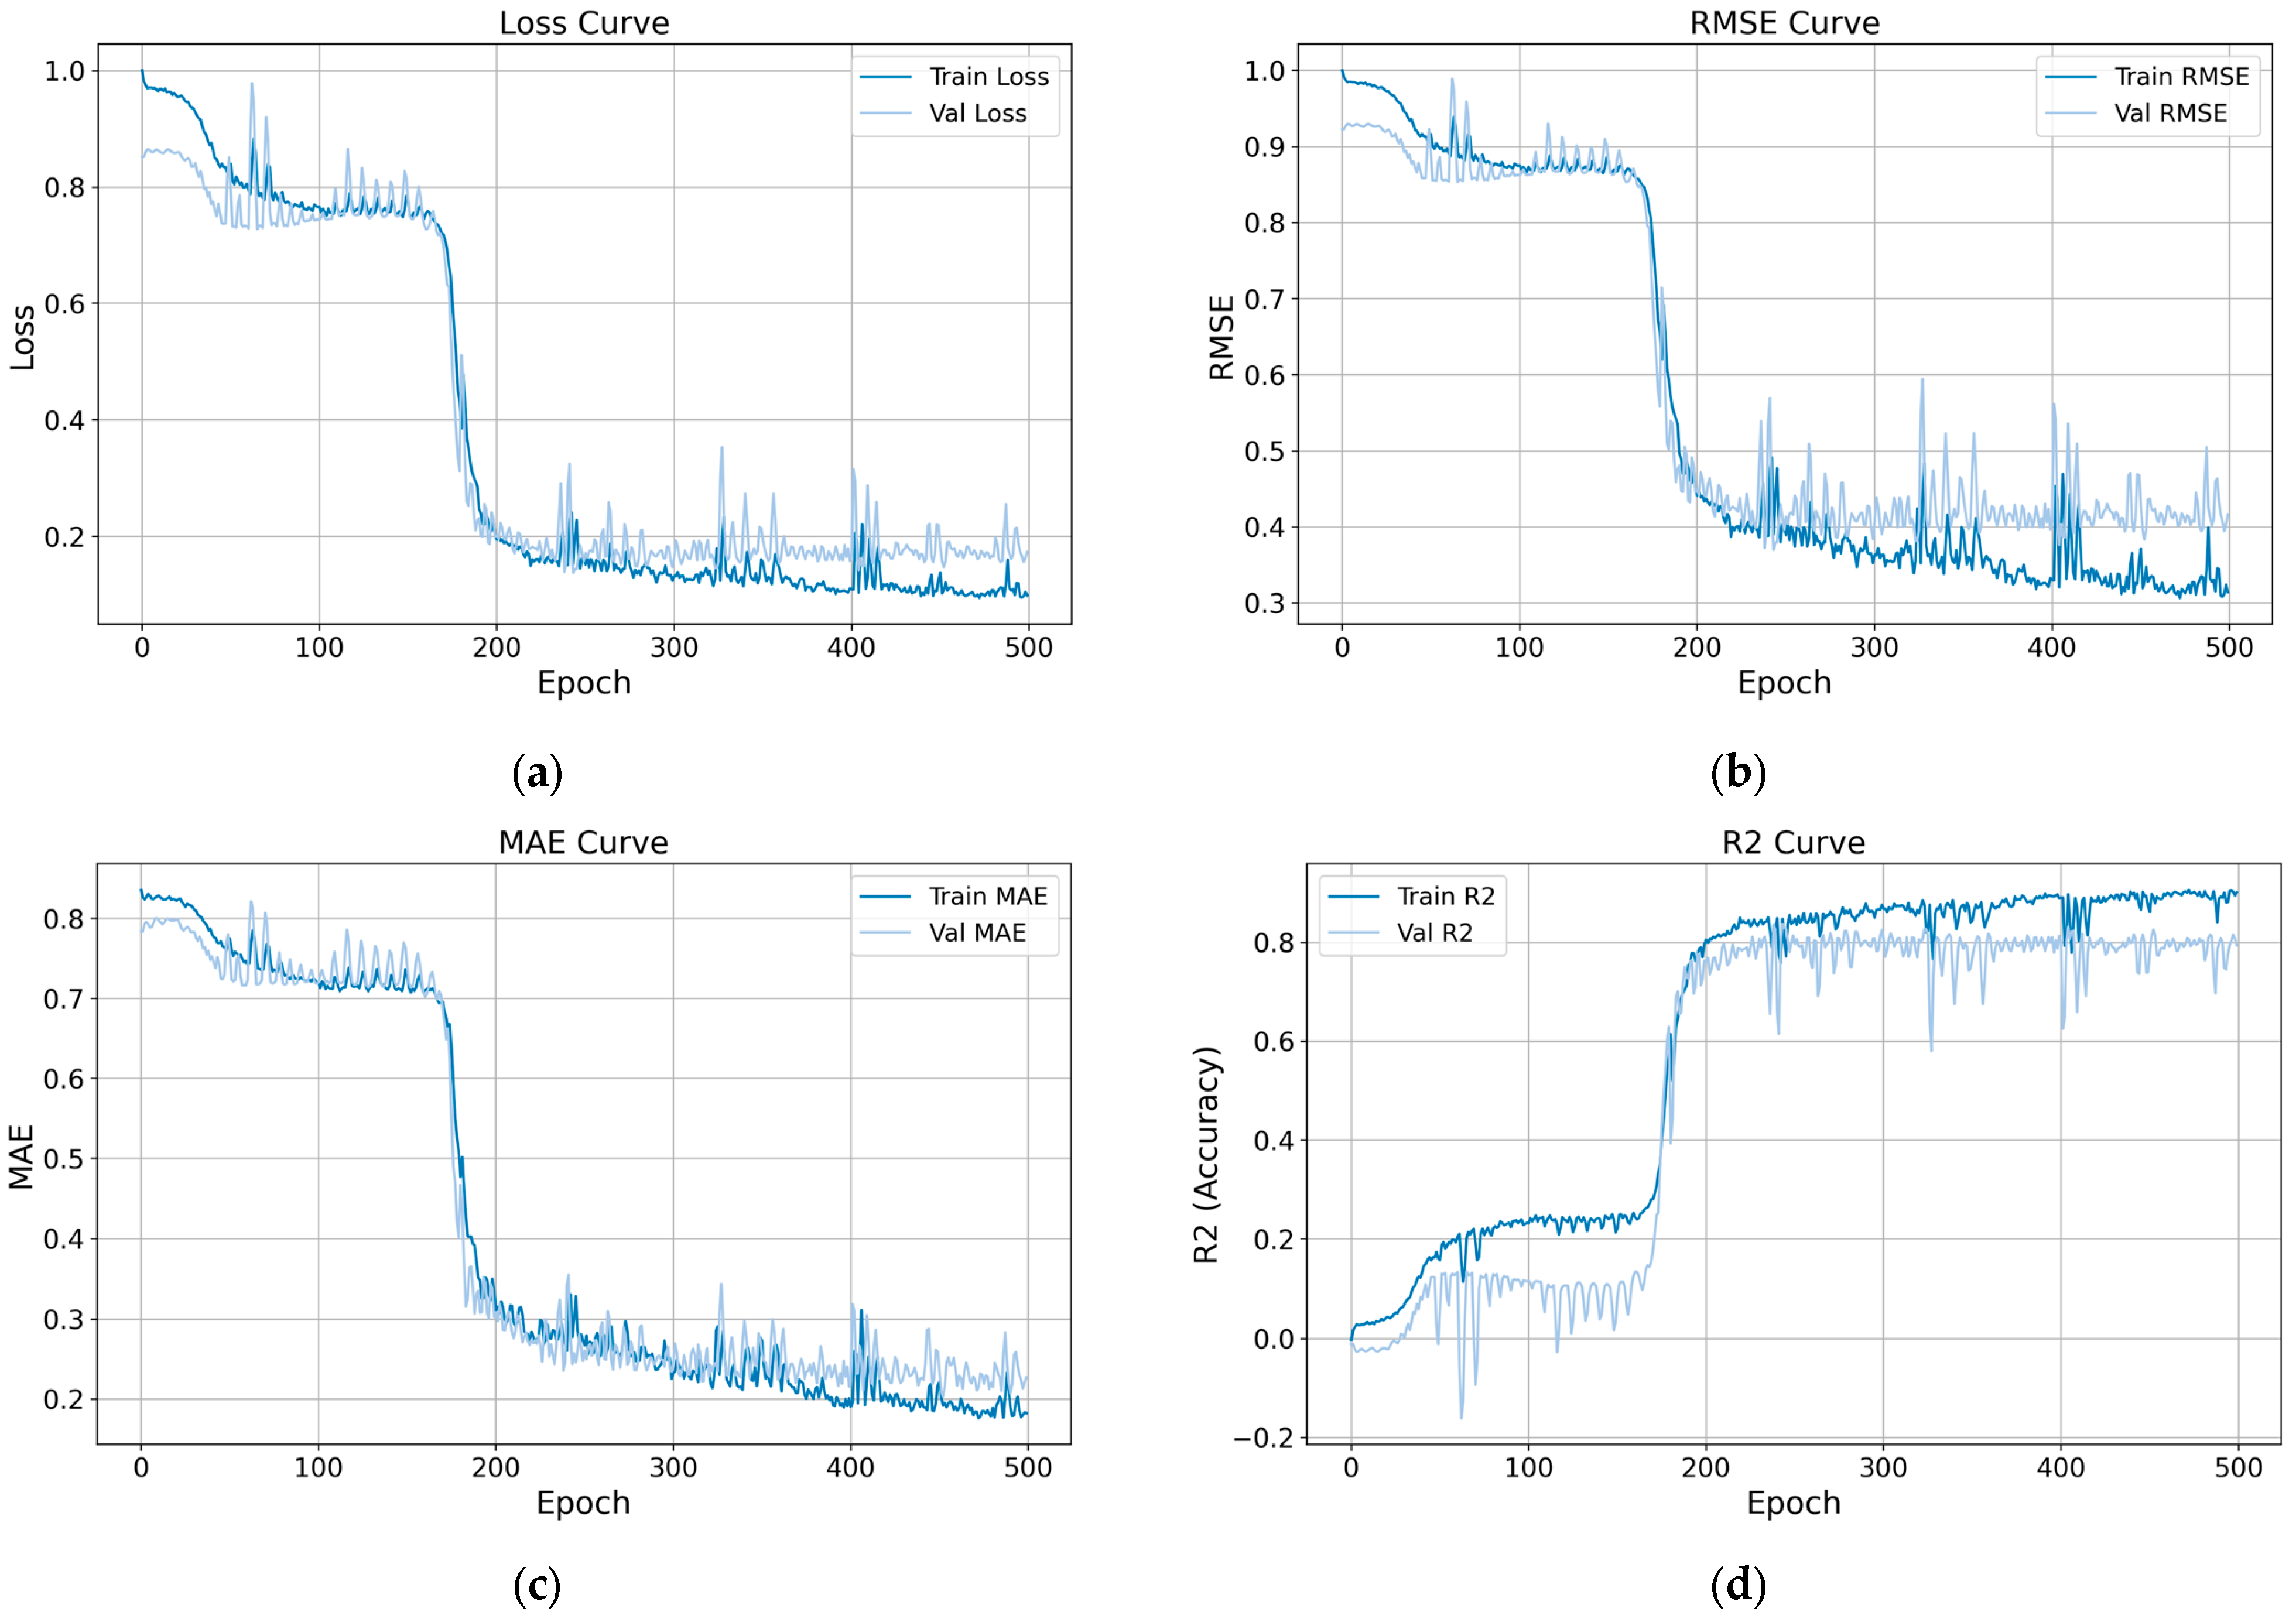
Figure 7 presents four evaluation metrics (Loss, RMSE, MAE, and R2) across 500 training epochs, demonstrating the training effectiveness and convergence behavior of the CNN-Transformer predictive model. The loss curve reveals a significant decrease from an initial value of approximately 1.0 down to roughly 0.2, stabilizing after approximately 200 epochs, indicating effective model convergence and stable learning behavior. Correspondingly, the RMSE and MAE plots exhibit similar declining trends, reducing from approximately 1.0 and 0.9 to around 0.35 and 0.3, respectively, confirming the improved prediction accuracy over training epochs. The R2 curve illustrates substantial accuracy enhancement from near 0 to above 0.8, underscoring the model’s explanatory power and predictive capability. These plots collectively verify the successful training and robust predictive performance of the proposed CNN-Transformer approach, effectively capturing the complex nonlinear relationships within the dataset.
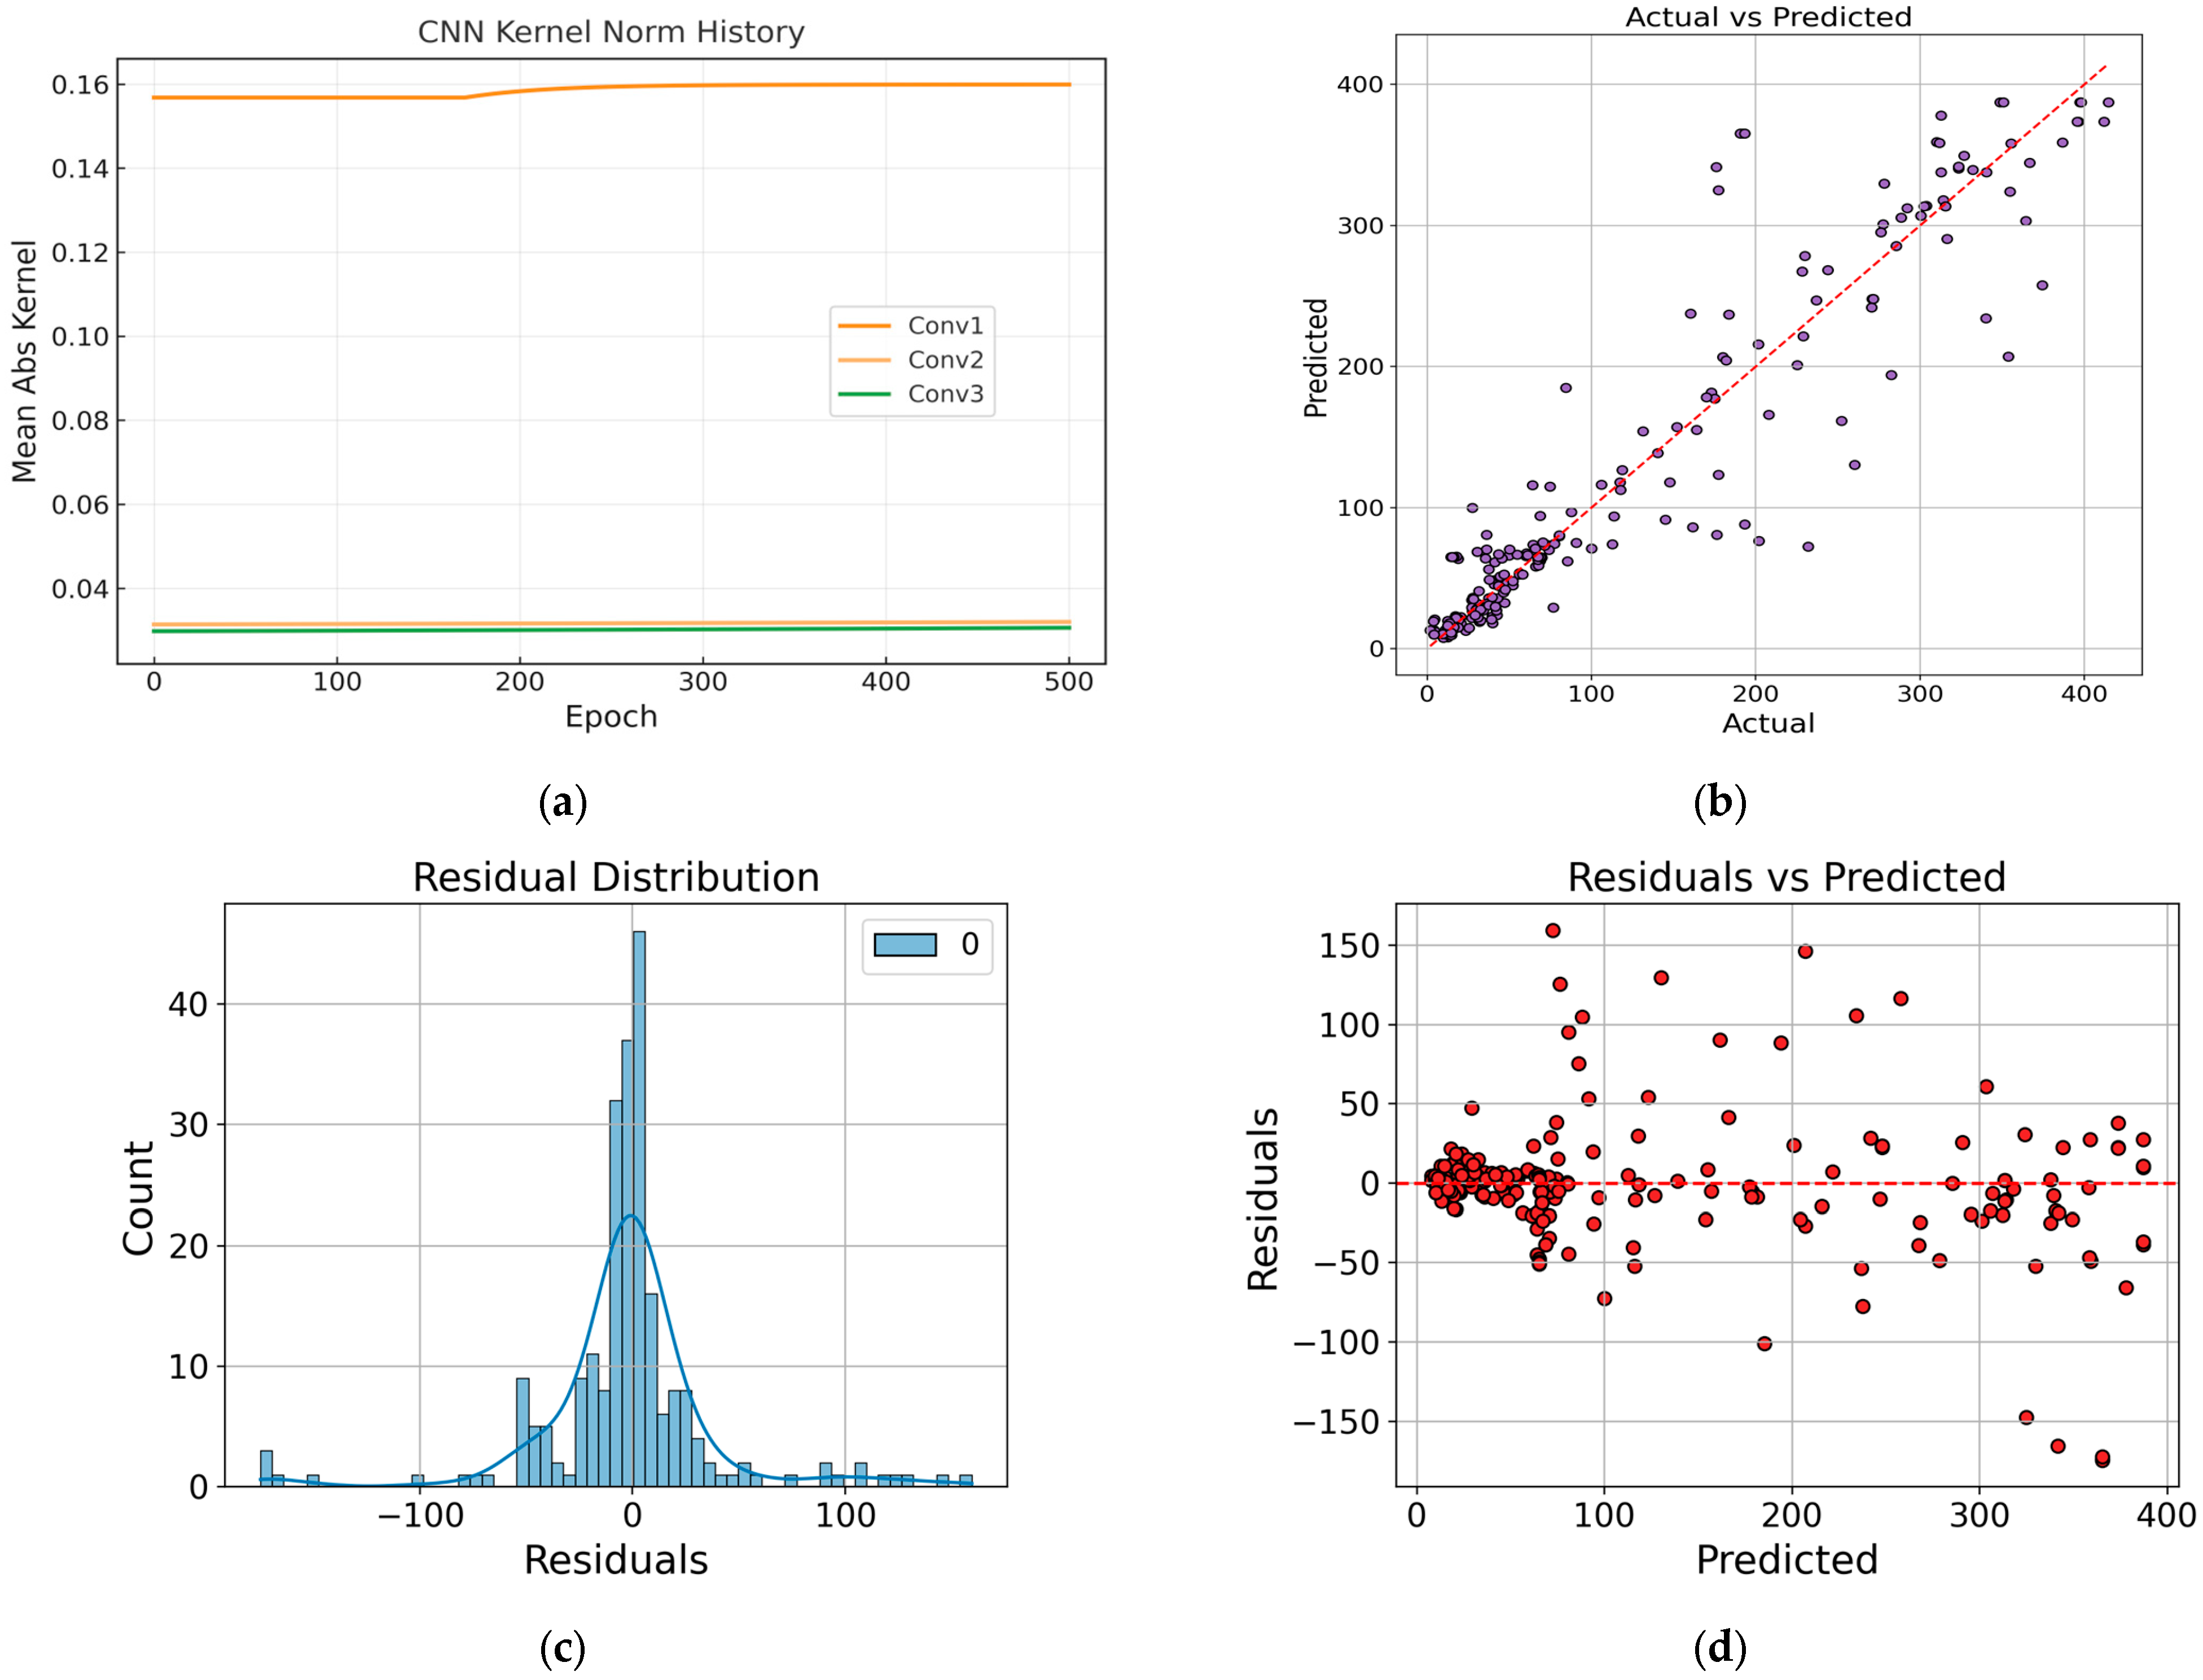
Figure 8 presents four critical diagnostic analyses of the CNN-Transformer model, assessing both internal model stability and external predictive accuracy. The CNN Kernel Norm History plot (top-left) indicates consistent kernel norm values across 3 convolutional layers over 500 epochs, suggesting stable feature extraction behavior within the model architecture. The Actual (Experimental results) vs. Predicted (Predicted results) scatter plot (top-right) demonstrates strong predictive agreement, with most points closely aligned along the ideal y = x reference line (red dashed), indicating accurate performance. Additionally, the Residual Distribution histogram (bottom-left) reveals a near-normal distribution cantered around zero, reinforcing the model’s unbiased predictive capacity. Finally, the Residuals vs. Predicted scatter plot (bottom-right) further confirms the absence of systematic errors, showing residuals evenly distributed around zero across the entire predicted range. Collectively, these analyses substantiate the accuracy and reliability of the CNN-Transformer model for predicting structural performance metrics.

4.2. Model Performance

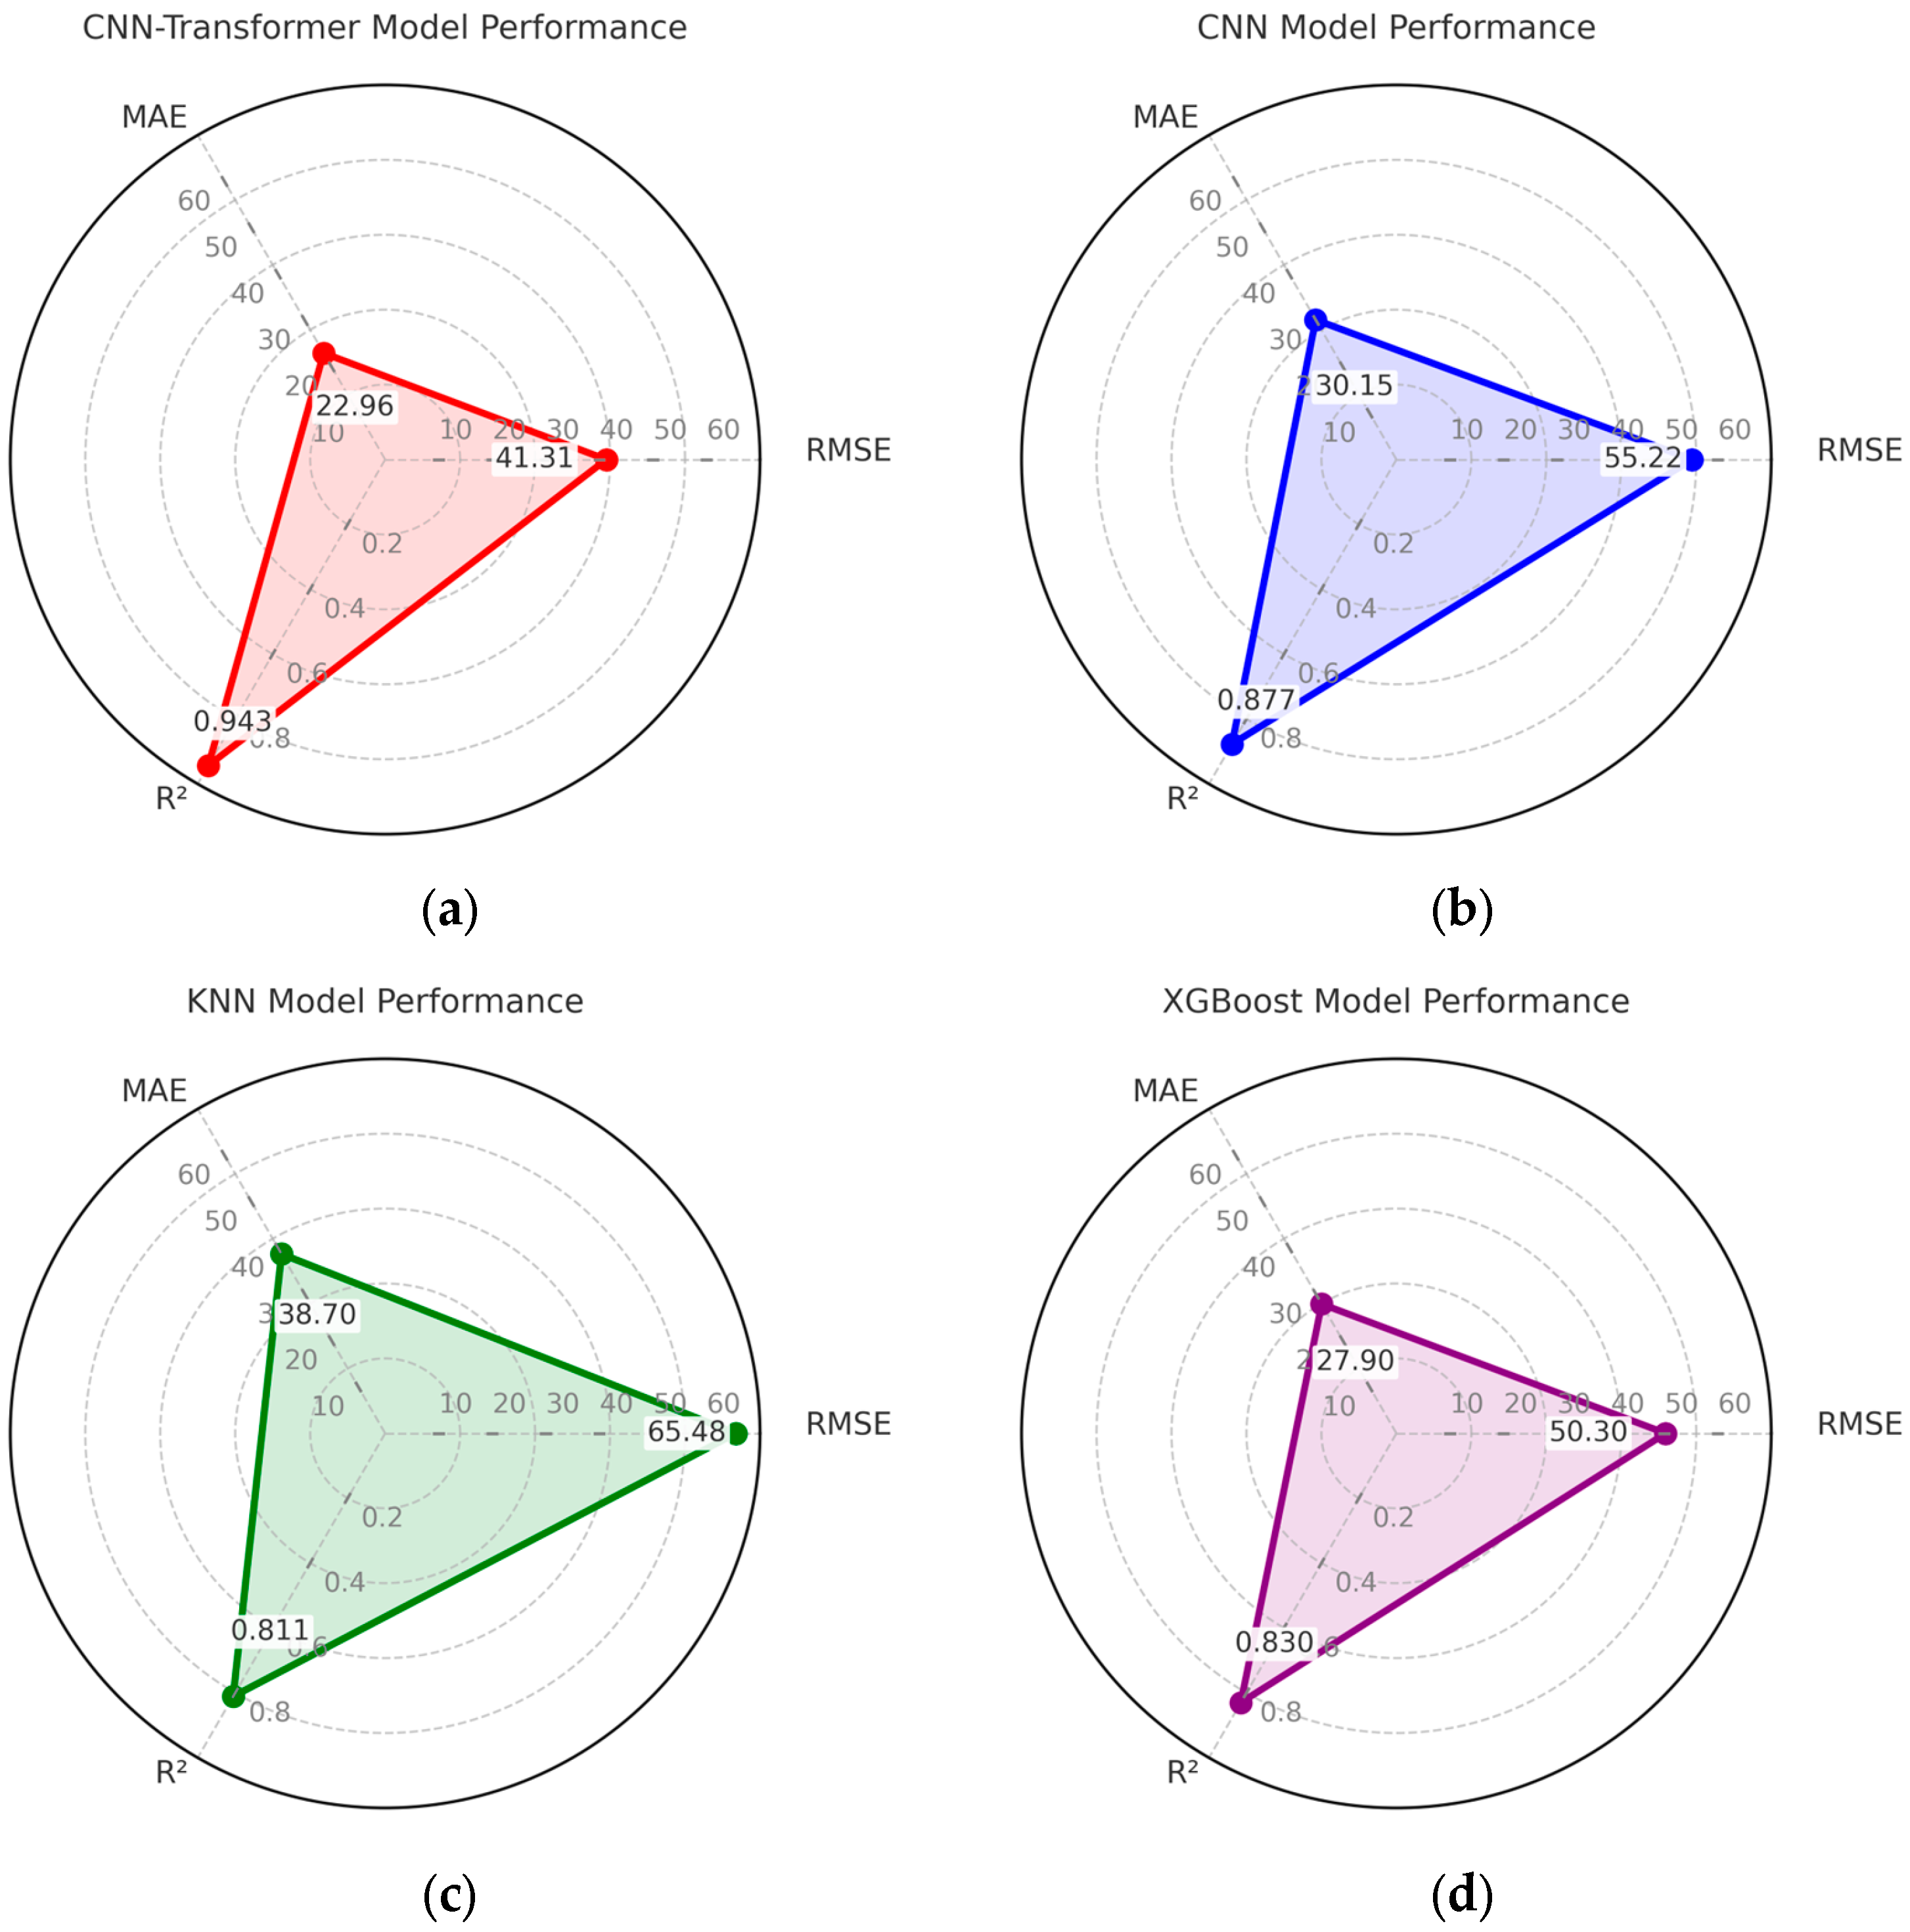
To comprehensively evaluate the accuracy and robustness of the proposed CNN-Transformer model, its predictive performance was benchmarked against three conventional models, namely CNN, K-Nearest Neighbors (KNN), and XGBoost, as shown in Figure 9. The comparison was conducted using three critical metrics: Root Mean Squared Error (RMSE), Mean Absolute Error (MAE), and the coefficient of determination (R2). The CNN-Transformer model achieved the lowest RMSE (41.310) and MAE (22.963) values, significantly outperforming CNN (RMSE = 55.220, MAE = 30.150), XGBoost (RMSE = 50.300, MAE = 27.900), and KNN (RMSE = 65.480, MAE = 38.700). Additionally, the CNN-Transformer exhibited the highest R2 value of 0.943, indicating superior predictive accuracy and better generalization capability compared to CNN (R2 = 0.877), XGBoost (R2 = 0.830), and KNN (R2 = 0.811). These results clearly validate the enhanced prediction capability of the proposed CNN-Transformer architecture, as detailed in Table 2.
In addition to the numerical results, the comparative performance highlights the distinct advantages of the proposed CNN-Transformer architecture. The convolutional layers capture local spatial relationships among geometric, reinforcement, and material parameters, enabling the model to learn fine-scale patterns such as the influence of fiber volume on tensile resistance within a given cross-section. The Transformer encoder complements this by modeling long-range dependencies and cross-feature interactions, which are critical for representing the coupled effects of section geometry, reinforcement ratios, and material properties on flexural behaviors. By contrast, the pure CNN baseline is effective at detecting local patterns but tends to miss complex interactions across the full feature set, while XGBoost, although strong on tabular data, relies on axis-aligned splits that can oversimplify nonlinear relationships [48]. KNN shows higher sensitivity to feature scaling and noise, resulting in greater prediction variability. The consistent superiority of the CNN-Transformer across both cross-validation and the hold-out test set indicates that the hybrid design not only fits the data well but also generalizes more effectively than the other models evaluated [49].
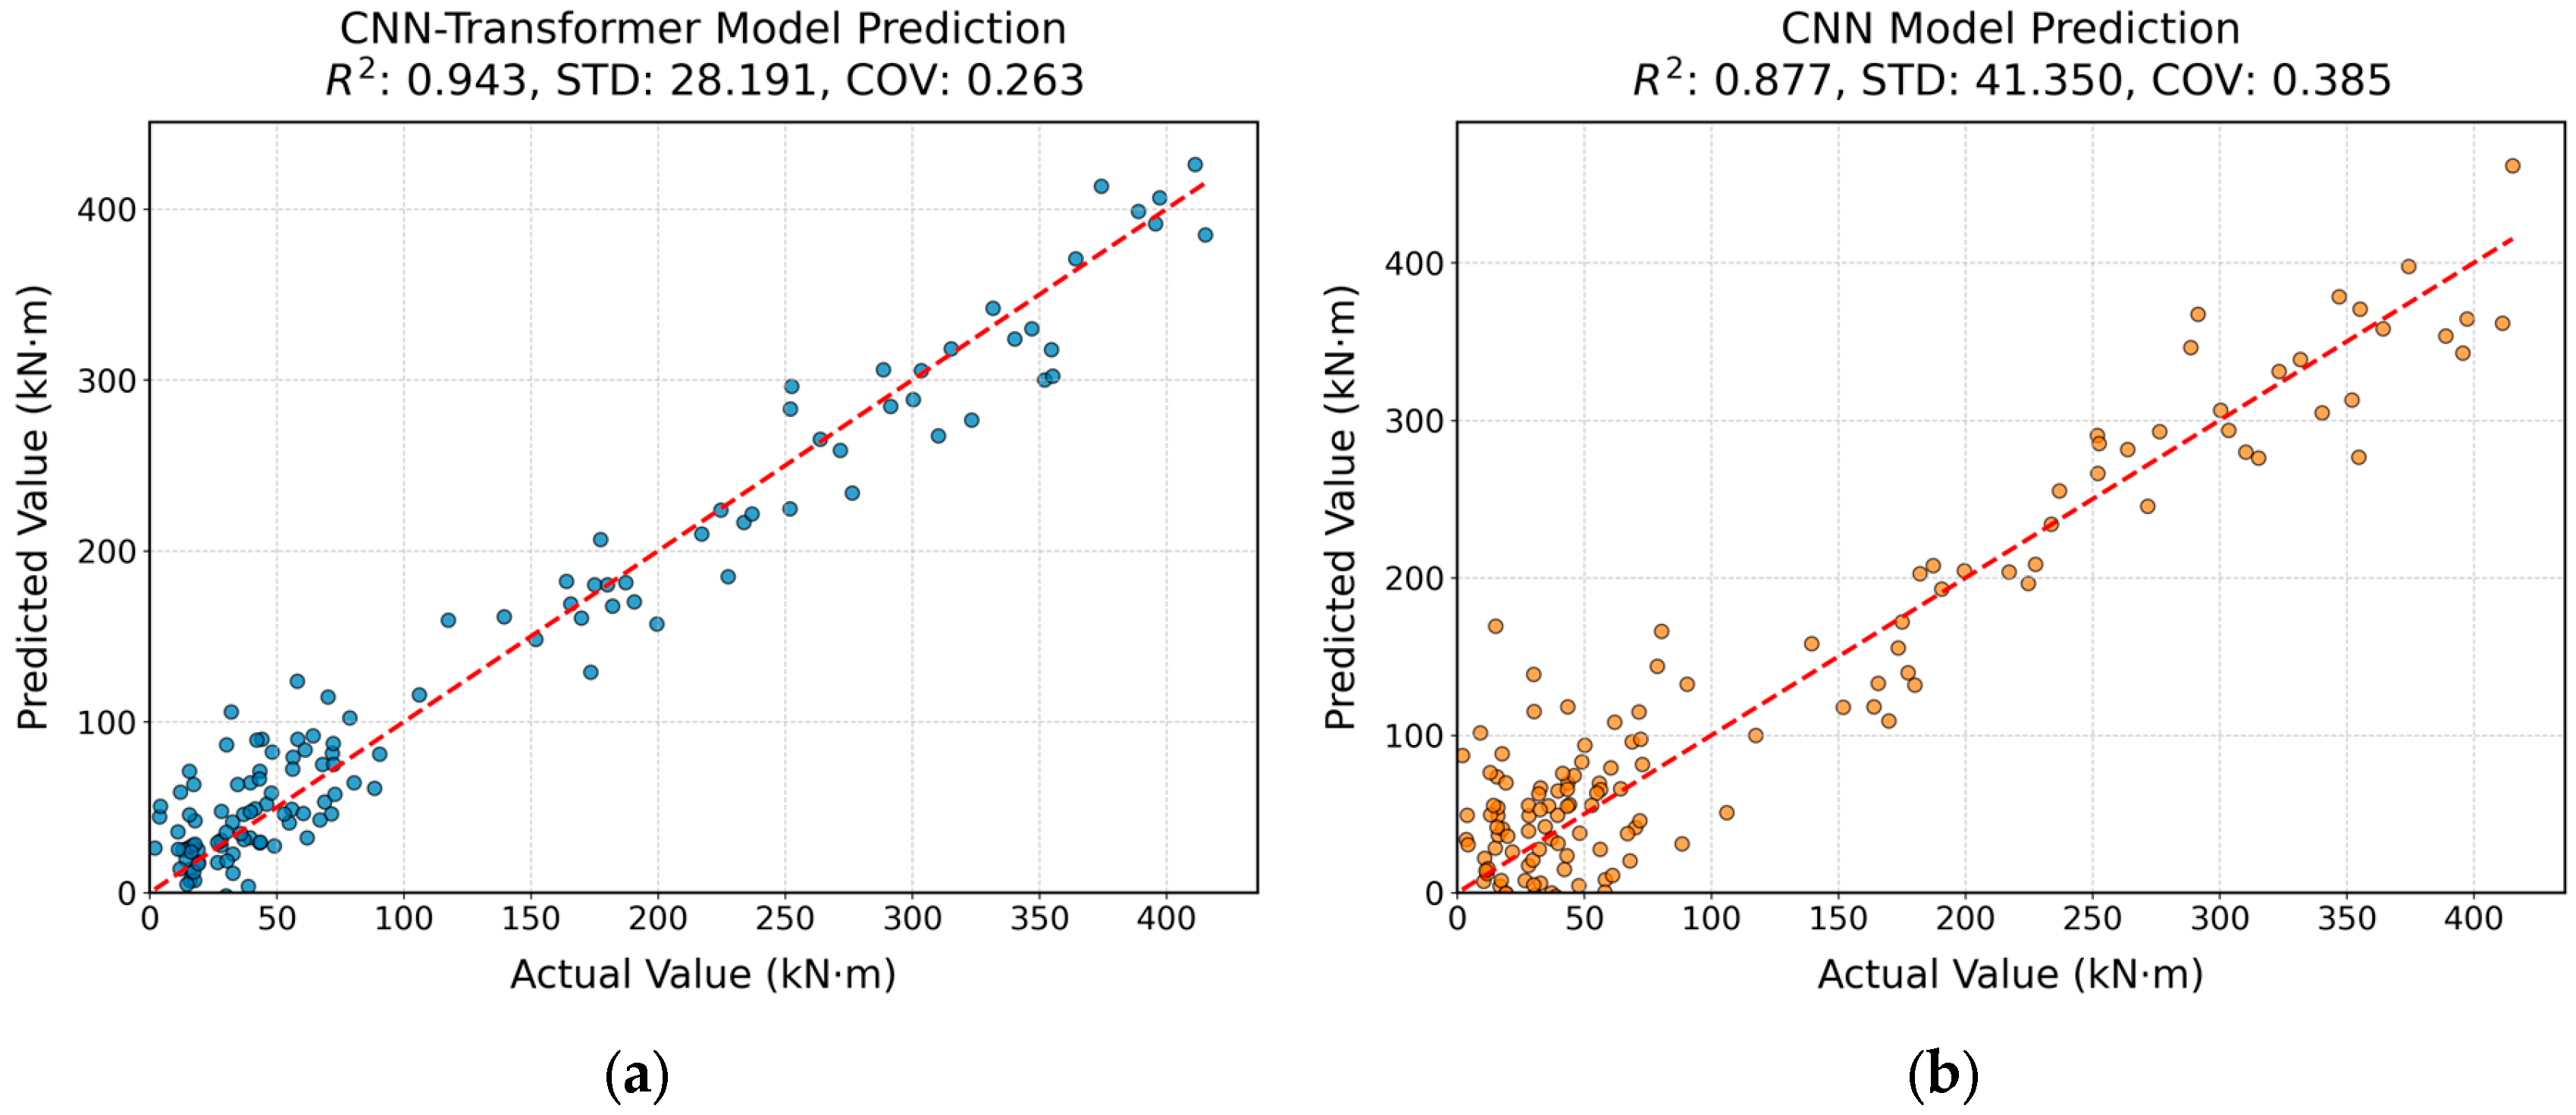
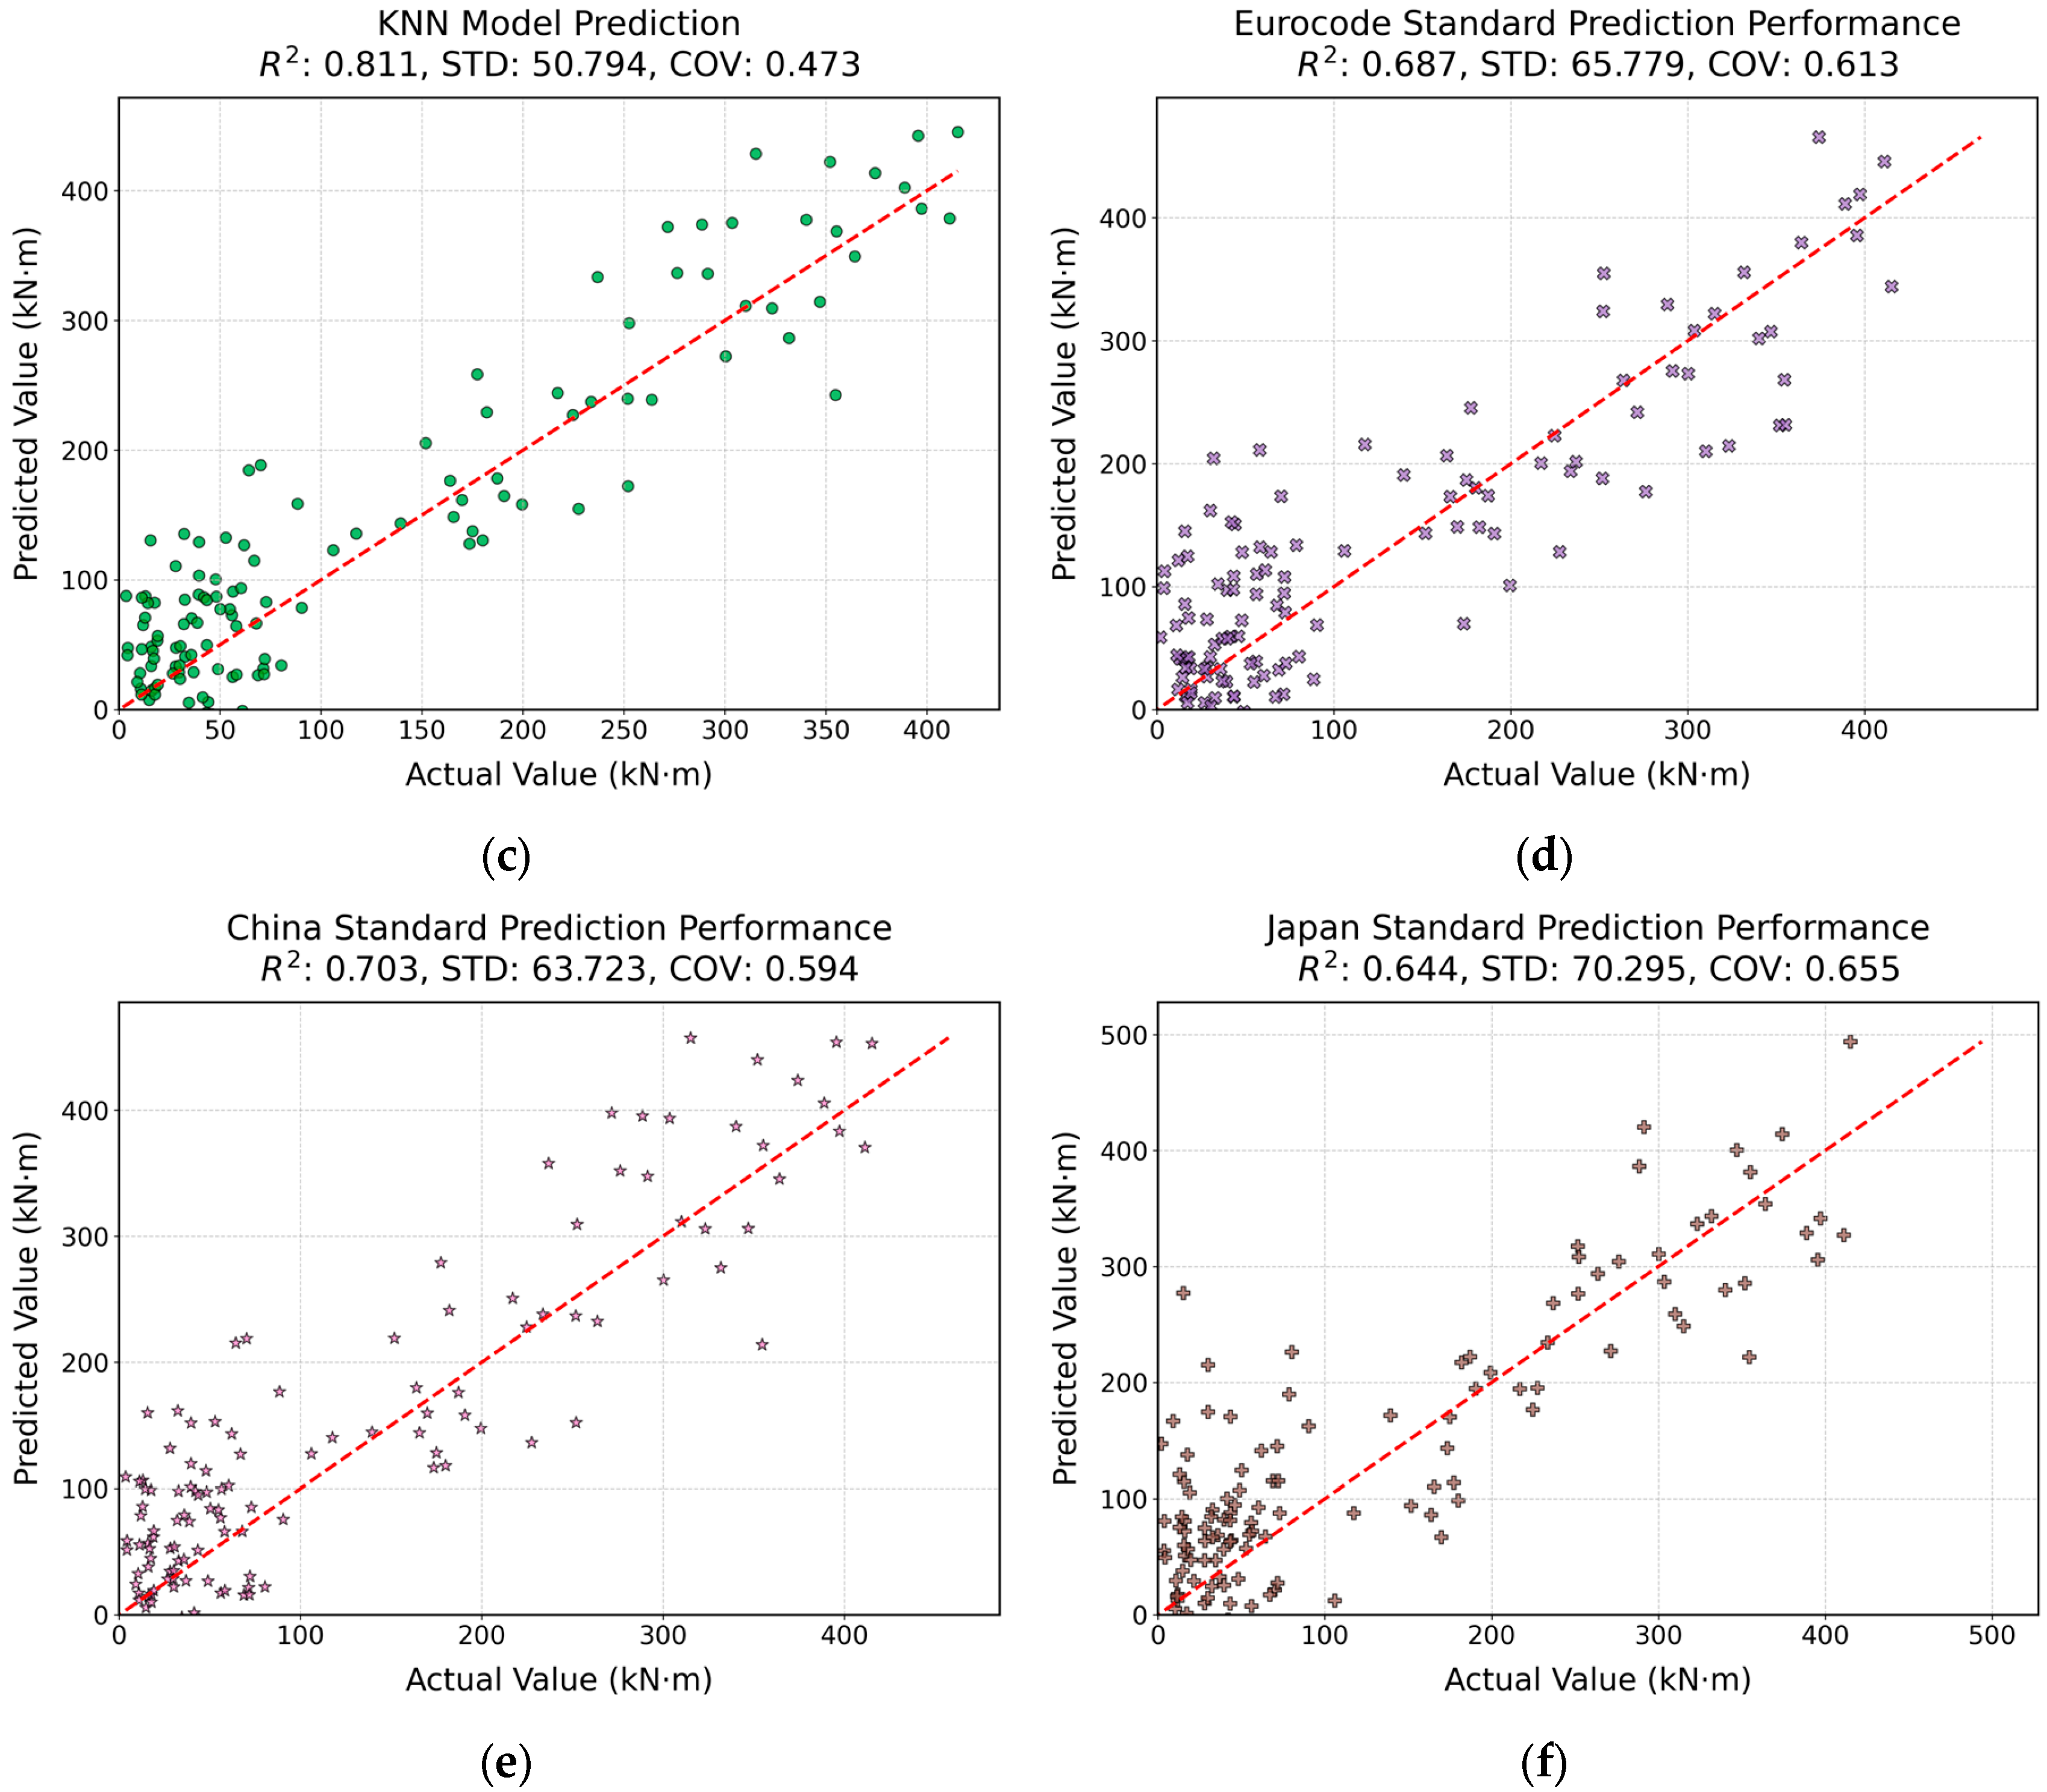
Figure 10 presents scatter plots comparing predicted versus actual flexural capacities of UHPC beams obtained from different machine learning models and international design standards. The CNN-Transformer model demonstrates the highest predictive accuracy with an R2 of 0.943, the lowest standard deviation (STD = 28.191), and the smallest coefficient of variation (COV = 0.263), signifying superior reliability and consistency. The CNN model exhibits moderate performance with an R2 of 0.877, while the KNN model displays lower accuracy (R2= 0.811), higher dispersion (STD = 50.794), and larger variability (COV = 0.473). Traditional international design standards, including the Eurocode, Chinese, and Japanese standards, show comparatively lower predictive accuracy (R2 ranging from 0.644 to 0.703), higher STD values (63.723–70.295), and higher COV (0.594–0.655), highlighting their limitations in accurately capturing the complex flexural behavior of UHPC beams. Overall, these comparisons underscore the significant potential of advanced CNN-Transformer architectures to enhance the precision of structural performance predictions, outperforming both conventional machine learning methods and established international design guidelines.

5. Conclusions

In this study, we proposed an advanced CNN-Transformer hybrid deep-learning framework to accurately predict the flexural capacity of UHPC beams and compare its performance with conventional machine learning models including CNN, KNN, and XGBoost. Comprehensive analyses based on RMSE, MAE, and R2 metrics were conducted, demonstrating the superior predictive capability of the proposed CNN-Transformer model. Key conclusions from this study are summarized as follows:
(1)
The CNN-Transformer model achieved the highest prediction accuracy, with a test RMSE of 41.310, MAE of 22.963, and an R2 value of 0.943, significantly outperforming traditional models.
(2)
Among the benchmarked methods, KNN exhibited the lowest predictive accuracy, indicating its limited capability in modeling complex UHPC beam behaviors.
(3)
Both CNN and XGBoost provided relatively satisfactory results; however, their accuracy was notably inferior to the proposed CNN-Transformer model, underscoring the advantage of integrating spatial feature extraction with global context modeling.
(4)
The proposed CNN-Transformer framework demonstrates high robustness and generalizability, making it a promising and reliable tool for structural engineers in the design optimization and safety assessment of UHPC beams.
Despite its strong predictive accuracy, the CNN-Transformer model is still limited by the scope of the underlying database and the narrow range of structural scenarios represented [50]. All Optuna 120 training and test specimens are monotonic four-point-bending experiments on rectangular, non-prestressed steel-fiber UHPC beams, with compressive strength ≤ 232 MPa, fiber volume ≤ 7%, and shear-span ratio ≤ 3.6. Consequently, the network’s extrapolations become uncertain when designers specify higher strengths, alternative fiber types, complex cross-sections (I-girders, box girders, T-beams), or reinforcement layouts that deviate markedly from those seen during training. Likewise, the model has not been exposed to cyclic, impact, torsional, or elevated-temperature loading regimes, and it currently relies on purely data-driven correlations rather than embedded equilibrium or compatibility constraints. Future research will focus on enlarging the experimental database with additional UHPC beams, alternative fiber types, and a broader range of cross-sections to strengthen generalization across material and geometric domains. In parallel, we will develop hybrid physics-informed versions of the CNN-Transformer that embed equilibrium and compatibility constraints as soft penalties, allowing the model to honor fundamental mechanics even when data are sparse.

Author Contributions

Conceptualization, L.Y. and P.L.; Methodology, L.Y. and P.L.; Software, L.Y.; Validation, L.Y.; Investigation, L.Y. and F.Y.; Resources, L.Y. and F.Y.; Data curation, L.Y. and F.Y.; Writing—original draft, L.Y.; Writing—review & editing, X.F.; Visualization, P.L. and X.F.; Supervision, P.L. and X.F. All authors have read and agreed to the published version of the manuscript.

Funding

This research received no external funding.

Data Availability Statement

Data are contained within the article.

Conflicts of Interest

Author Fan Yang was employed by the company Shaanxi Construction Engineering Group No.5 Construction Co., Ltd. The remaining authors declare that the research was conducted in the absence of any commercial or financial relationships that could be construed as a potential conflict of interest.

References

  1. Amran, M.; Huang, S.-S.; Onaizi, A.M.; Makul, N.; Abdelgader, H.S.; Ozbakkaloglu, T. Recent trends in ultra-high performance concrete (UHPC): Current status, challenges, and future prospects. Constr. Build. Mater. 2022, 352, 129029. [Google Scholar] [CrossRef]
  2. Zhou, M.; Lu, W.; Song, J.; Lee, G.C. Application of ultra-high performance concrete in bridge engineering. Constr. Build. Mater. 2018, 186, 1256–1267. [Google Scholar] [CrossRef]
  3. Sharma, R.; Jang, J.G.; Bansal, P.P. A comprehensive review on effects of mineral admixtures and fibers on engineering properties of ultra-high-performance concrete. J. Build. Eng. 2022, 45, 103314. [Google Scholar] [CrossRef]
  4. Murali, G. Recent research in mechanical properties of geopolymer-based ultra-high-performance concrete: A review. Def. Technol. 2024, 32, 67–88. [Google Scholar] [CrossRef]
  5. Li, Y.-Y.; Nie, J.-G.; Ding, R.; Fan, J.-S. Seismic performance of squat UHPC shear walls subjected to high-compression shear combined cyclic load. Eng. Struct. 2023, 276, 115369. [Google Scholar] [CrossRef]
  6. Xue, J.; Briseghella, B.; Huang, F.; Nuti, C.; Tabatabai, H.; Chen, B. Review of ultra-high performance concrete and its application in bridge engineering. Constr. Build. Mater. 2020, 260, 119844. [Google Scholar] [CrossRef]
  7. Ravichandran, D.; Prem, P.R.; Kaliyavaradhan, S.K.; Ambily, P. Influence of fibers on fresh and hardened properties of Ultra High Performance Concrete (UHPC)—A review. J. Build. Eng. 2022, 57, 104922. [Google Scholar] [CrossRef]
  8. Deng, Z.; Liu, X.; Zhou, X.; Yang, Q.; Chen, P.; de la Fuente, A.; Ren, L.; Du, L.; Han, Y.; Xiong, F.; et al. Main engineering problems and countermeasures in ultra-long-distance rock pipe jacking project: Water pipeline case study in Chongqing. Tunn. Undergr. Space Technol. 2022, 123, 104420. [Google Scholar] [CrossRef]
  9. Abid, M.; Hou, X.; Zheng, W.; Hussain, R.R. Effect of fibers on high-temperature mechanical behavior and microstructure of reactive powder concrete. Materials 2019, 12, 329. [Google Scholar] [CrossRef]
  10. Yong, W.T.L.; Thien, V.Y.; Misson, M.; Chin, G.J.W.L.; Hussin, S.N.I.S.; Chong, H.L.H.; Yusof, N.A.; Ma, N.L.; Rodrigues, K.F. Seaweed: A bioindustrial game-changer for the green revolution. Biomass Bioenergy 2024, 183, 107122. [Google Scholar] [CrossRef]
  11. El-Abbasy, A.A. Tensile, flexural, impact strength, and fracture properties of ultra-high-performance fiber-reinforced concrete–a comprehensive review. Constr. Build. Mater. 2023, 408, 133621. [Google Scholar] [CrossRef]
  12. Min, W.; Jin, W.; He, X.; Wu, R.; Chen, K.; Chen, J.; Xia, J. Experimental study on the flexural fatigue performance of slag/fly ash geopolymer concrete reinforced with modified basalt and PVA hybrid fibers. J. Build. Eng. 2024, 94, 109917. [Google Scholar] [CrossRef]
  13. Regalla, S.S.; Kumar, N.S. Investigation of hydration kinetics, microstructure and mechanical properties of multiwalled carbon nano tubes (MWCNT) based future emerging ecological economic ultra high-performance concrete (E3 UHPC). Results Eng. 2024, 23, 102432. [Google Scholar] [CrossRef]
  14. Zaid, O.; El Ouni, M.H. Advancements in 3D printing of cementitious materials: A review of mineral additives, properties, and systematic developments. Constr. Build. Mater. 2024, 427, 136254. [Google Scholar] [CrossRef]
  15. Khayat, K.H.; Meng, W.; Vallurupalli, K.; Teng, L. Rheological properties of ultra-high-performance concrete—An overview. Cem. Concr. Res. 2019, 124, 105828. [Google Scholar] [CrossRef]
  16. Wu, C.; Yu, Z.; Shao, R.; Li, J. A comprehensive review of extraterrestrial construction, from space concrete materials to habitat structures. Eng. Struct. 2024, 318, 118723. [Google Scholar] [CrossRef]
  17. Deng, Z.; Chen, P.; Liu, X.; Du, L.; Tan, J.; Liang, N. Study on the tensile and compressive mechanical properties of multi-scale fiber-reinforced concrete: Laboratory test and mesoscopic numerical simulation. J. Build. Eng. 2024, 86, 108852. [Google Scholar] [CrossRef]
  18. Deng, Z.; Liu, X.; Chen, P.; de la Fuente, A.; Zhao, Y.; Liang, N.; Zhou, X.; Du, L.; Han, Y. Basalt-polypropylene fiber reinforced concrete for durable and sustainable pipe production. Part 2: Numerical and parametric analysis. Struct. Concr. 2022, 23, 328–345. [Google Scholar] [CrossRef]
  19. Deng, Z.; Liu, X.; Chen, P.; de la Fuente, A.; Zhou, X.; Liang, N.; Han, Y.; Du, L. Basalt-polypropylene fiber reinforced concrete for durable and sustainable pipe production. Part 1: Experimental program. Struct. Concr. 2022, 23, 311–327. [Google Scholar] [CrossRef]
  20. Bischof, P.; Mata-Falcón, J.; Kaufmann, W. Fostering innovative and sustainable mass-market construction using digital fabrication with concrete. Cem. Concr. Res. 2022, 161, 106948. [Google Scholar] [CrossRef]
  21. Abellán-García, J.; Carvajal-Muñoz, J.S.; Ramírez-Munévar, C. Application of ultra-high-performance concrete as bridge pavement overlays: Literature review and case studies. Constr. Build. Mater. 2024, 410, 134221. [Google Scholar] [CrossRef]
  22. Qian, Y.; Yang, J.; Yang, W.; Alateah, A.H.; Alsubeai, A.; Alfares, A.M.; Sufian, M. Prediction of ultra-high-performance concrete (UHPC) properties using gene expression programming (GEP). Buildings 2024, 14, 2675. [Google Scholar] [CrossRef]
  23. Qiu, M.; Shao, X.; Wille, K.; Yan, B.; Wu, J. Experimental investigation on flexural behavior of reinforced ultra high performance concrete low-profile T-beams. Int. J. Concr. Struct. Mater. 2020, 14, 5. [Google Scholar] [CrossRef]
  24. Zhu, Y.; Zhang, Y.; Hussein, H.H.; Chen, G. Flexural strengthening of reinforced concrete beams or slabs using ultra-high performance concrete (UHPC): A state of the art review. Eng. Struct. 2020, 205, 110035. [Google Scholar] [CrossRef]
  25. Solhmirzaei, R.; Salehi, H.; Kodur, V. Predicting flexural capacity of ultrahigh-performance concrete beams: Machine learning–based approach. J. Struct. Eng. 2022, 148, 04022031. [Google Scholar] [CrossRef]
  26. Ergen, F.; Katlav, M. Machine and deep learning-based prediction of flexural moment capacity of ultra-high performance concrete beams with/out steel fiber. J. Civ. Eng. 2024, 25, 4541–4562. [Google Scholar] [CrossRef]
  27. Safdar, M.; Matsumoto, T.; Kakuma, K. Flexural behavior of reinforced concrete beams repaired with ultra-high performance fiber reinforced concrete (UHPFRC). Compos. Struct. 2016, 157, 448–460. [Google Scholar] [CrossRef]
  28. Abellan-Garcia, J.; Fernandez, J.; Khan, M.I.; Abbas, Y.M.; Carrillo, J. Uniaxial tensile ductility behavior of ultrahigh-performance concrete based on the mixture design–Partial dependence approach. Cem. Concr. Compos. 2023, 140, 105060. [Google Scholar] [CrossRef]
  29. Khaoula, E.; Amine, B.; Mostafa, B.; Deifalla, A.; El-Said, A.; Salama, M.; Awad, A. Machine learning-based prediction of torsional behavior for ultra-high-performance concrete beams with variable cross-sectional shapes. Case Stud. Constr. Mater. 2025, 22, e04136. [Google Scholar] [CrossRef]
  30. Schmidt, J.; Marques, M.R.; Botti, S.; Marques, M.A.L. Recent advances and applications of machine learning in solid-state materials science. npj Comput. Mater. 2019, 5, 83. [Google Scholar] [CrossRef]
  31. Zhang, Y.; Li, X.; Zhu, Y.; Shao, X. Experimental study on flexural behavior of damaged reinforced concrete (RC) beam strengthened by toughness-improved ultra-high performance concrete (UHPC) layer. Compos. Part B Eng. 2020, 186, 107834. [Google Scholar] [CrossRef]
  32. Abuodeh, O.R.; Abdalla, J.A.; Hawileh, R.A. Assessment of compressive strength of Ultra-high Performance Concrete using deep machine learning techniques. Appl. Soft Comput. 2020, 95, 106552. [Google Scholar] [CrossRef]
  33. Zhang, Y.; Zhu, Y.; Qu, S.; Kumar, A.; Shao, X. Improvement of flexural and tensile strength of layered-casting UHPC with aligned steel fibers. Constr. Build. Mater. 2020, 251, 118893. [Google Scholar] [CrossRef]
  34. Li, W.-W.; Li, Z.-C.; Chen, H.-D.; Zhou, Y.-W.; Mansour, W.; Wang, X.-Q.; Wang, P. Effects of concrete-stirrup interaction on shear behavior of RC beams under varying shear span-depth ratio scenarios. Structures 2024, 61, 106071. [Google Scholar] [CrossRef]
  35. Amin, A.; Foster, S.J. Shear strength of steel fibre reinforced concrete beams with stirrups. Eng. Struct. 2016, 111, 323–332. [Google Scholar] [CrossRef]
  36. Wei, F.; Chen, H.; Xie, Y. Experimental study on seismic behavior of reinforced concrete shear walls with low shear span ratio. J. Build. Eng. 2022, 45, 103602. [Google Scholar] [CrossRef]
  37. Gu, J.; Li, L.; Huang, X.; Chen, H. Experimental study on the reinforced concrete beams with varied stirrup reinforcement ratio under static and impact loads. Struct. Concr. 2025, 26, 3124–3145. [Google Scholar] [CrossRef]
  38. Ye, M.; Li, L.; Yoo, D.-Y.; Li, H.; Zhou, C.; Shao, X. Prediction of shear strength in UHPC beams using machine learning-based models and SHAP interpretation. Constr. Build. Mater. 2023, 408, 133752. [Google Scholar] [CrossRef]
  39. Ombres, L.; Aiello, M.A.; Cascardi, A.; Verre, S. Modeling of steel-reinforced grout composite system-to-concrete bond capacity using artificial neural networks. J. Compos. Constr. 2024, 28, 04024034. [Google Scholar] [CrossRef]
  40. Jasmine, P.H.; Arun, S. Machine learning applications in structural engineering—A review. IOP Conf. Ser. Mater. Sci. Eng. 2021, 1114, 012012. [Google Scholar] [CrossRef]
  41. Xiong, J.; Guo, S.; Wu, Y.; Yan, D.; Xiao, C.; Lu, X. Predicting the response of heating and cooling demands of residential buildings with various thermal performances in China to climate change. Energy 2023, 269, 126789. [Google Scholar] [CrossRef]
  42. Phoeuk, M.; Kwon, M. Accuracy prediction of compressive strength of concrete incorporating recycled aggregate using ensemble learning algorithms: Multinational dataset. Adv. Civ. Eng. 2023, 2023, 5076429. [Google Scholar] [CrossRef]
  43. Ray, P.; Reddy, S.S.; Banerjee, T. Various dimension reduction techniques for high dimensional data analysis: A review. Artif. Intell. Rev. 2021, 54, 3473–3515. [Google Scholar] [CrossRef]
  44. Huang, F.; Li, Y.; Wu, J.; Dong, J.; Wang, Y. Identification of repeatedly frozen meat based on near-infrared spectroscopy combined with self-organizing competitive neural networks. Int. J. Food Prop. 2016, 19, 1007–1015. [Google Scholar] [CrossRef]
  45. Chin, Y.-H.; Wang, J.-C.; Huang, C.-L.; Wang, K.-Y.; Wu, C.-H. Speaker identification using discriminative features and sparse representation. IEEE Trans. Inf. Forensics Secur. 2017, 12, 1979–1987. [Google Scholar] [CrossRef]
  46. Zhao, L.; Liu, Y.; Zhao, J.; Zhang, Y.; Xu, L.; Xiang, Y.; Liu, J. Robust PCA-deep belief network surrogate model for distribution system topology identification with DERs. Int. J. Electr. Power Energy Syst. 2021, 125, 106441. [Google Scholar] [CrossRef]
  47. Ajin, R.S.; Segoni, S.; Fanti, R. Optimization of SVR and CatBoost models using metaheuristic algorithms to assess landslide susceptibility. Sci. Rep. 2024, 14, 24851. [Google Scholar] [CrossRef]
  48. Prokhorenkova, L.; Gusev, G.; Vorobev, A.; Dorogush, A.V.; Gulin, A. CatBoost: Unbiased boosting with categorical features. Adv. Neural Inf. Process. Syst. 2018, 31, 6639–6649. [Google Scholar] [CrossRef]
  49. Mohan, M.; Jetti, K.D.; Smith, M.D.; Demerdash, O.N.; Kidder, M.K.; Smith, J.C. Accurate machine learning for predicting the viscosities of deep eutectic solvents. J. Chem. Theory Comput. 2024, 20, 3911–3926. [Google Scholar] [CrossRef]
  50. D’Amico, B.; Myers, R.J.; Sykes, J.; Voss, E.; Cousins-Jenvey, B.; Fawcett, W.; Richardson, S.; Kermani, A.; Pomponi, F. Machine learning for sustainable structures: A call for data. Structures 2019, 19, 1–4. [Google Scholar] [CrossRef]
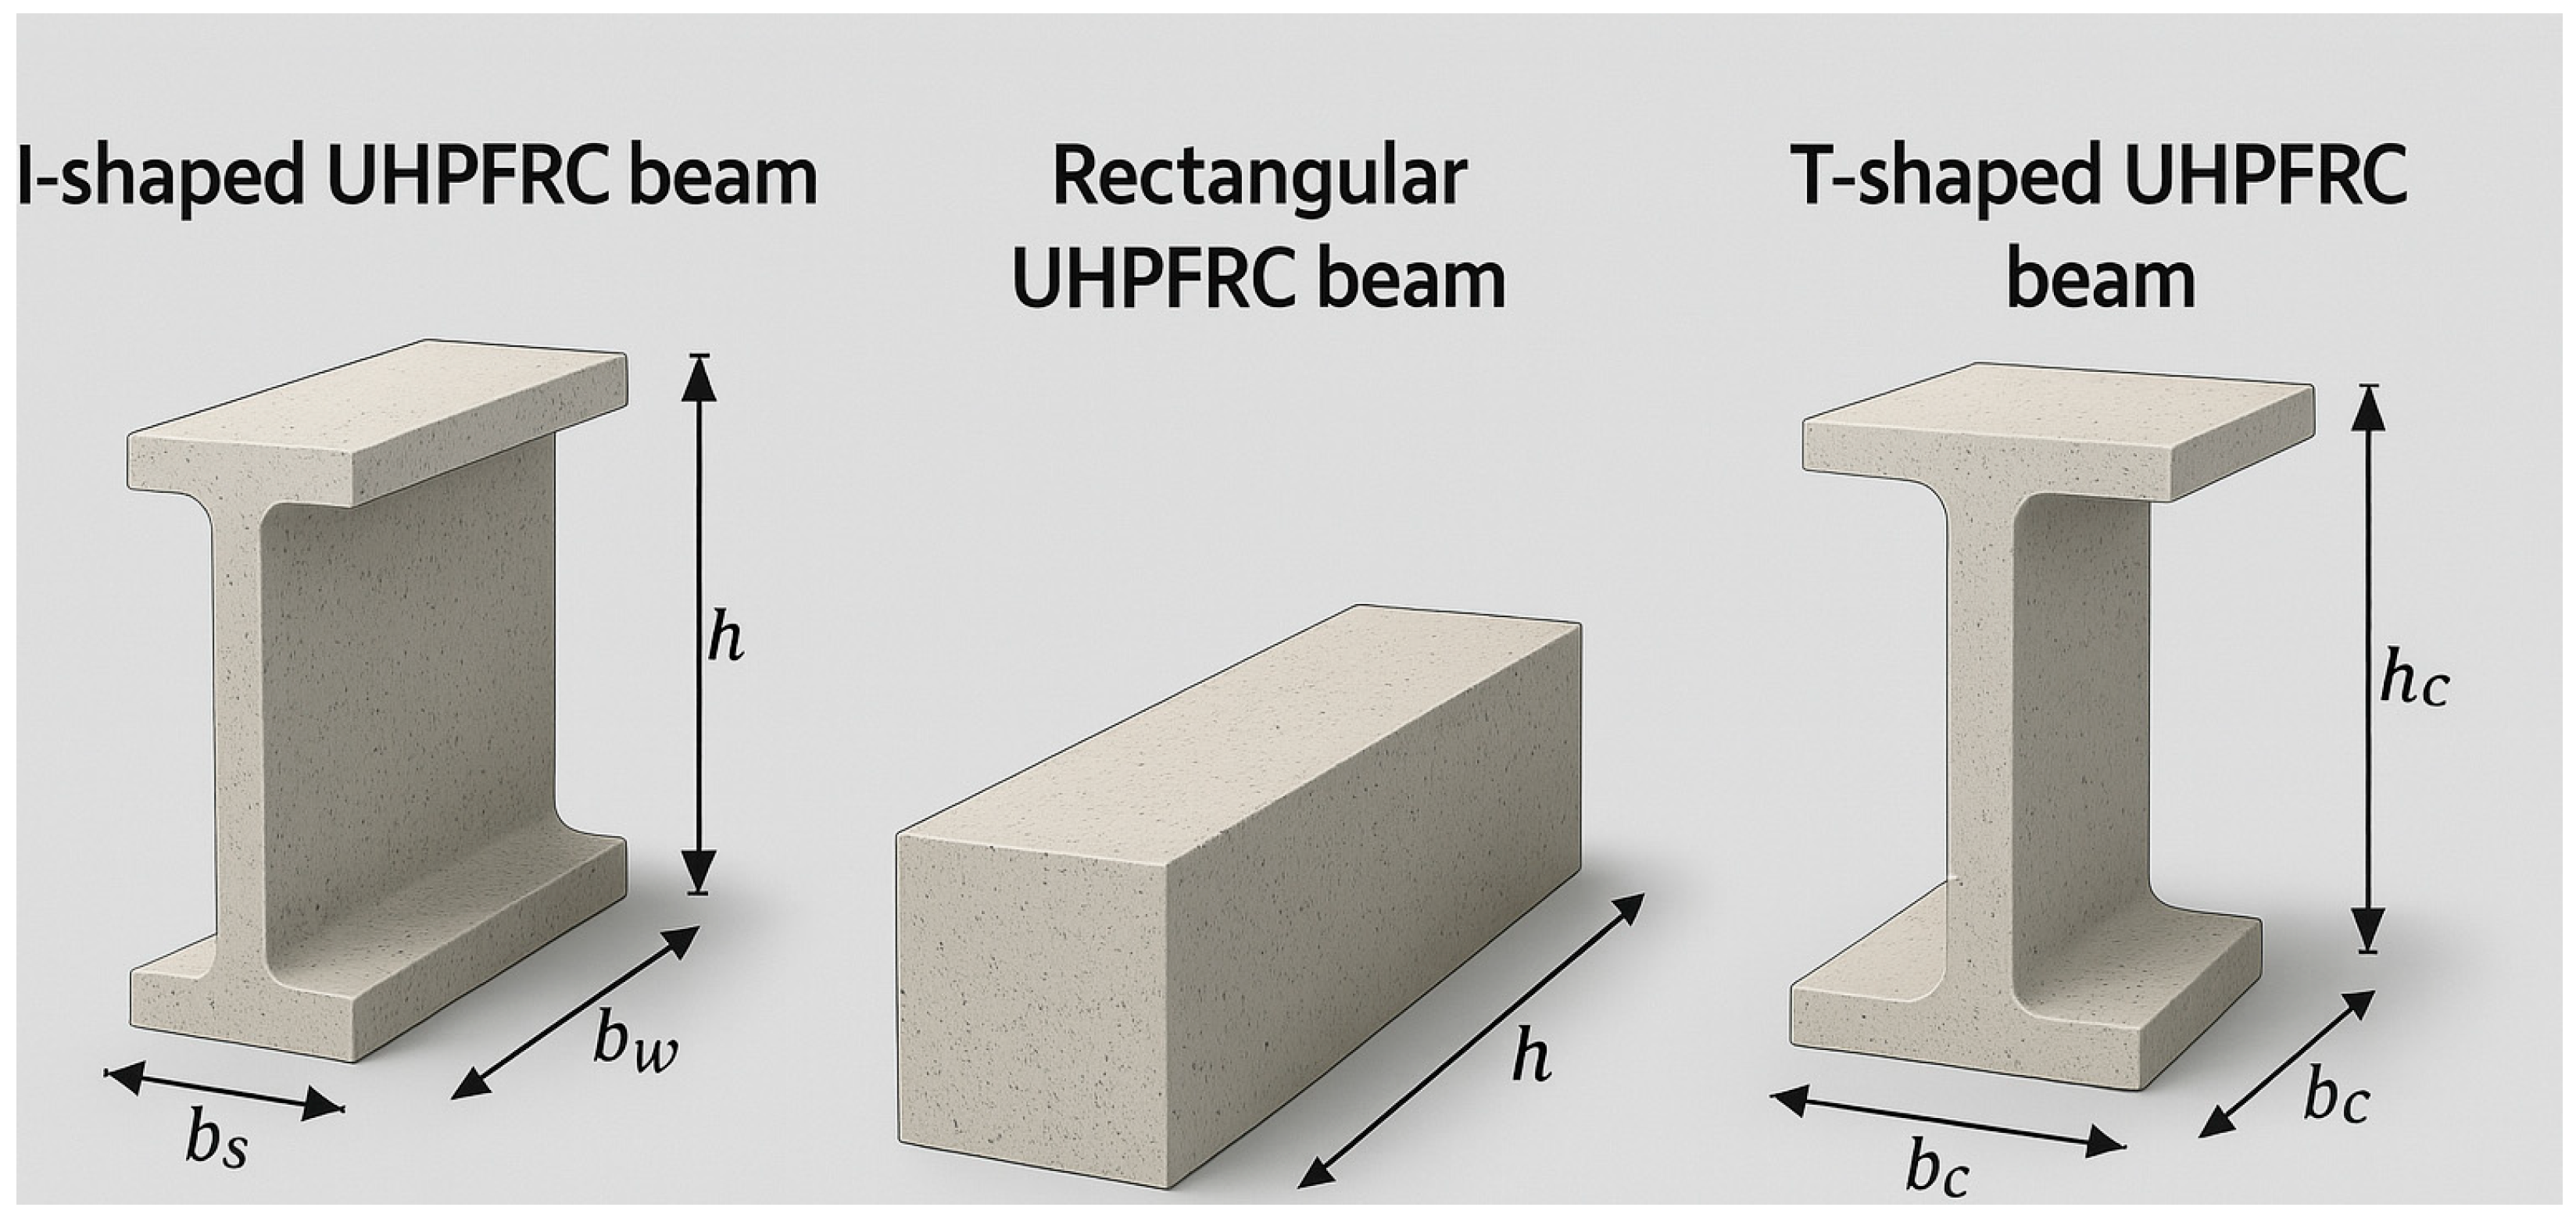
Figure 1. Typical UHPFRC beam cross-sections used in this study, including rectangular, T-shaped, and I-shaped sections, which correspond to the analytical formulas and the compiled test database.
Buildings 15 03138 g001
Figure 2. Hybrid CNN–Transformer framework for flexural-capacity regression. Convolutional layers extract local patterns from reshaped feature maps, while a Transformer encoder captures long-range dependencies prior to fully connected regression output.
Buildings 15 03138 g002
Figure 3. Details of the proposed framework.
Buildings 15 03138 g003
Figure 4. Pearson correlations between input features and the target flexural capacity (Mu, kN·m) computed on the compiled dataset. Positive values indicate direct relationships; negative values indicate inverse relationships.
Buildings 15 03138 g004aBuildings 15 03138 g004bBuildings 15 03138 g004c
Figure 5. SHAP summary plot for the CNN–Transformer model. Each point is a SHAP value for one sample, colored by the feature magnitude (low to high). Web height (hw) shows the largest absolute SHAP values (≈−100 to +150).
Buildings 15 03138 g005
Figure 6. Two-dimensional histograms showing the joint distributions of key reinforcement, material, and geometric variables in the UHPC dataset (color bars indicate bin counts; higher values denote greater data density): (a) ρs (%) vs. ρsw (%); (b) fy (MPa) vs. ρs (%); (c) Vf (%) vs. fy (MPa); (d) ft (MPa) vs. Vf (%); (e) fc (MPa) vs. ft (MPa); (f) tf (mm) vs. fc (MPa); (g) bf (mm) vs. tf (mm); (h) tf′ (mm) vs. bf (mm); (i) bf′ (mm) vs. tf′ (mm); (j) tw (mm) vs. bf′ (mm); (k) hw (mm) vs. tw (mm); (l) λ (dimensionless) vs. hw (mm); (m) ho (mm) vs. λ (dimensionless); (n) lo (mm) vs. ho (mm); (o) correlation analysis.
Buildings 15 03138 g006aBuildings 15 03138 g006bBuildings 15 03138 g006c
Figure 7. Training and validation performance metrics of the proposed framework: (a) training and validation loss; (b) RMSE; (c) MAE; (d) R2.
Buildings 15 03138 g007
Figure 8. CNN–Transformer evolution and model prediction diagnostics: (a) kernel-norm history for three convolutional layers; (b) actual vs. predicted Mu,the red dashed line denotes the 1:1 reference; (c) residual histogram, the blue curve denotes the kernel density estimate (KDE) of residuals; (d) residuals vs. predicted, the red dashed horizontal line indicates the zero-residual baseline.
Buildings 15 03138 g008
Figure 9. Comparative model performance presented as radar summaries: (a) CNN–Transformer; (b) CNN; (c) XGBoost; (d) KNN.
Buildings 15 03138 g009
Figure 10. Predicted versus actual flexural capacities (Mu, kN·m) for ML models and international codes against the y = x reference: (a) CNN–Transformer; (b) CNN; (c) KNN; (d)Eurocode 2; (e) Chinese JTG 3362; (f) Japanese JSCE.
Buildings 15 03138 g010aBuildings 15 03138 g010b
Table 1. Summary of the collected database.
Test No.Datalo (mm)ho (mm)λhw (mm)tw (mm)bf(mm)tf(mm)bf (mm)tf (mm)fc (MPa)ft (MPa)Vf (%)fy (MPa)ρs(%)ρsw(%)Mu(kN·m)
127603052.53806527045230105203–2058.55–8.592–2.55516.060.14395.58–411.16
2109001775.12201500000200.9–232.18.5–9.140–2495–5100.94–1.51.3128.17–60.26
32610–13972352.6–5.9270180000016715.304360.94–1.26043.34–67.82
44762.53052.5380652706527065195–2129.5–9.82–2.55516.620–0.6346.94–415.18
527632183.53001500000153–1597.42–7.571–24746.120251.79–276.21
6363921333001500000153–1547.42–7.451–24688.760252.41–303.53
73600–1448.8200–3602.5–4.8290–40660–2290–1400–600–1400–80137.6–1677.22–12.21–3365–6181.28–12.340–2.18165.6–340.2
8630013021501000000127–1356.76–6.970–0.55501.2–1.71.3410.37–15.87
94392–5041123.5–4.51401000000110–15115.4–18.525203.404.31–39.59
10410002304.325040150401504051.34.30467–4700.8–2.21.2618.84–45.98
11575038024002000000106.4–1175–110–147510–0.28139.35–174.94
12310002304.3250501504015040145–1595.3–10.70–2.54702.20–2.0148.91–58.2
134952–18482803.4–6.63502000000117–2177.84–15.4824454.380–0.47300.2–388.8
1431260–2520315–3974–8380–46050170–23060–70165–220110–12014619–2024502.69–6.980163.8–252
154600182–1883.2–3.32201500000141.5122417–4611.09–4.990.45–1.1243.26–105.93
166660–700220–2303250–29050–1500–1500–400–1500–40121–166.96.71–9.980–1.5470–617.70.78–1.760–1.43.48–187.11
1784001303.11501000000124.9–176.96.71–7.981–44700–1.7403.48–19.06
184278.752231.3240501209012090148–1557.35–24.82–2.555121.37030.38–34.43
19370023032501202801000098.913125.39.3424.6–427.90.21–0.740.8432.2–41.3
20410003003.33501003005000141.67148.6–149.89.7–11.5551.8–5572.9–4.590.15180–271.5
218361.38–350110–1143.1–3.2140–15040–1200–1200–350052.5–127.334.11–1160–7.1411.4–760.90.8–4.960.31–4.112.95–30.08
228203–312.5124–2601.2–1.6–2.5150–300100–1520000113.3–164.84.75–10.520–3406.2–5703.2–5.230–1.8919.06–263.64
2361000162–3313–6.2–3.4200–350100–1500–3000–5000140.1–141.675.6–140.11.5–…518.3–535.71.18–4.96048.1–199.35
2441600257–269.55.9–6.23001700000119.7–135.65.63–6.263–5543.43.21–6.740.59233.6–323.2
253599.98–666.7130–2622.3–5.1150–3001500000130.5–138.16.79–9.82–5400–5434–6.310–1.458–288.5
2641600257–269.55.9–6.23001700000119.7–135.65.63–6.263–5543.43.21–6.740.59233.6–323.2
2783801203.2140120000094.3–135.65.83–6.990.5–2760.9–889.70.7–1.570.941.86–21.5
28366022032901500000166.911.51.5617.70.780.63–1.59354.62–374.22
294392–5041123.5–4.51401000000110–15115.4–18.525203.4028–43.12
Note: b: Beam width, measured perpendicular to the longitudinal axis of the beam’s cross-section (mm); h: Total section height, from the bottom fiber to the top fiber of the cross-section (mm); ho: Effective depth, measured from the extreme compression fiber to the centroid of the tensile reinforcement (mm); hw: Web depth, the clear vertical distance of the web portion in flanged sections or equal to the total height for rectangular sections (mm); hf: Flange thickness, measured from the top surface to the junction between flange and web (mm); bf: Flange width, the horizontal width of the flange portion in flanged sections (mm); fc: Concrete compressive strength, determined from standard cylinder or cube tests at 28 days (MPa); Vf: Fiber volume fraction, expressed as the volume of fibers divided by the total volume of concrete (%); lf/df: Fiber aspect ratio, defined as the length of fibers (lf, mm) divided by their equivalent diameter (df, mm); ρs: Longitudinal reinforcement ratio, the ratio of the area of longitudinal tensile reinforcement to the product of beam width and effective depth (%); ρsw: Transverse reinforcement ratio, the ratio of the area of shear reinforcement to the product of stirrup spacing, web width, and effective depth (%); As: Area of longitudinal tensile reinforcement (mm2); As: Area of longitudinal compression reinforcement (mm2); fy: Yield strength of longitudinal tensile reinforcement (MPa); fy: Yield strength of longitudinal compression reinforcement (MPa); s: Center-to-center spacing of transverse reinforcement (mm); a/d: Shear-span ratio, defined as the distance from the applied load to the nearest support (a, mm) divided by the effective depth (d, mm); Mu,test: Ultimate flexural capacity obtained from laboratory tests (kN·m); Mu,pred: Ultimate flexural capacity predicted by the proposed model or design equations (kN·m).
Table 2. The matrixes of used models.
Model/StandardRMSEMAER2STDCOV
CNN-Transformer41.3122.9630.94328.1910.263
CNN55.2230.150.87741.350.385
XGBoost50.327.90.8347.210.453
KNN65.4838.70.81150.7940.473
Eurocode 20.70363.7230.594
Chinese JTG 33620.67167.480.627
Japanese JSCE0.64470.2950.655
Disclaimer/Publisher’s Note: The statements, opinions and data contained in all publications are solely those of the individual author(s) and contributor(s) and not of MDPI and/or the editor(s). MDPI and/or the editor(s) disclaim responsibility for any injury to people or property resulting from any ideas, methods, instructions or products referred to in the content.