Article

Experimental and Numerical Investigations on Shear Performance of Large-Scale Stirrup-Free I-Shaped UHPC Beams

1
School of Civil and Transportation Engineering, Guangdong University of Technology, Guangzhou 510006, China
2
Zhonglu Dura International Engineering Co., Ltd., Guangzhou 510430, China
*
Author to whom correspondence should be addressed.
Buildings 2025, 15(17), 3129; https://doi.org/10.3390/buildings15173129
Submission received: 4 August 2025 / Revised: 22 August 2025 / Accepted: 27 August 2025 / Published: 1 September 2025
(This article belongs to the Section Building Structures)

Abstract

Ultra-High-Performance Concrete (UHPC) is a game-changing, innovative material with the merits of exceptional tensile strength, making it suitable for stirrup-free UHPC beams. In this study, two 4.0 m-long large-scale stirrup-free I-shaped UHPC beams were experimentally explored in bending tests and shear tests. Cracking patterns, failure modes, and ultimate load-bearing capacity were obtained. Experimental findings revealed that the shear capacity of the stirrup-free I-shaped UHPC beams with a web thickness of merely 50.0 mm reached more than 20.0 MPa and demonstrated excellent post-cracking shear behavior. Finite element models were established and verified with experimental results to investigate the shear behaviors of stirrup-free I-shaped UHPC beams, considering the parameters of shear span-depth ratio and longitudinal reinforcement strength. The results demonstrated that as the shear span-depth ratio increases, the shear capacity of UHPC beams exhibits a declining trend, accompanied by increased mid-span deflection and a degradation in stiffness. French code and PCI report were suggested for design purposes, due to rationally conservative prediction and explicit physical indication.

1. Introduction

Ultra-High-Performance Concrete (UHPC) is a novel cementitious composite material composed of cement, mineral admixtures, fine aggregates, high-strength short steel fibers, superplasticizers, and water [1,2,3,4,5]. UHPC not only achieves ultra-high compressive strength but also demonstrates ultra-high flexural strength and excellent toughness [6,7]. This guarantees UHPC significant advantages in applications involving heavy loads, long spans, joint connections, and complex engineering conditions [8,9]. UHPC outperforms high-strength and conventional concrete in durability metrics such as air permeability, chloride ion penetration, brine corrosion, carbonation, and freeze-thaw resistance [7,10,11]. These benefits stem from its low water-to-binder ratio, which yields a highly dense microstructure with nanoscale pore structures [12]. UHPC also exhibits notable autogenous crack-healing properties, attributed to unreacted cement particles that continue to hydrate at post-cracking, thereby enhancing structural durability and reducing maintenance costs. As such, UHPC is recognized as a game-changing material that is more suitable for bridge structures [13,14,15,16].
Today, UHPC is widely applied in practical engineering, particularly in bridge construction. In 1997, Canada constructed the world’s first UHPC pedestrian bridge using UHPC truss girders and deck slabs [7]. In 2006, Wapello County, IA, USA, inaugurated the Mars Hill Bridge, the nation’s first UHPC highway bridge, showcasing the material’s innovation through its UHPC Bulb-T girders [17]. China’s first UHPC (RPC) T-beam bridge was completed on the Qian-Cao Railway in 2006 [17]. Subsequently, the application of UHPC in bridge construction has gradually become widespread in many countries, such as Austria, Croatia, New Zealand, Germany, Switzerland, China, Australia, Japan, Italy, South Korea, Slovenia, The Netherlands, and Malaysia [18]. In Malaysia alone, 26 UHPC bridges were constructed between 2014 and 2015 [7].
From the UHPC bridge practices, it was gradually recognized that the conventional shear reinforcement could be eliminated in UHPC beams by leveraging the shear contribution of steel fibers in the UHPC matrix, thereby creating stirrup-free UHPC beams. Moreover, compared with rectangular-shaped UHPC beams, I-shaped UHPC beams were preferred due to their higher structural effectiveness, cost efficiency, lighter self-weight, and higher longitudinal reinforcement ratios. Thus, stirrup-free I-shaped UHPC beams possess wild prospective anticipation in bridge structures [19,20,21,22]. However, owing to the removal of stirrups in the beams, shear deficiency and shear mechanism emerged as prominent concerns.
Global scholars have conducted extensive experimental studies on the shear behavior of UHPC beams. Sun et al. [23] tested 11 prestressed UHPC rectangular beams with stirrups, examining the effects of varying steel fiber volumes and shear span-to-depth ratios. They noted strain-hardening behavior post-cracking and inverse relationships between the shear span-to-depth ratio and shear strength. Their proposed formula, incorporating fiber–matrix interactions, demonstrated high accuracy.
Feng et al. [23] experimentally demonstrated that prestressing enhances the post-cracking shear capacity of stirrup-free UHPC T-shaped beams with varying steel fiber volumes and shear span-to-depth ratio using 13 specimens. Feng et al. [24] developed a Modified Compression Field Theory-based model for prestressed UHPC T-shaped beams under combined bending and shear, validated by experiments. Their findings highlighted the critical role of shear span-to-depth ratio in shear capacity and failure modes, proposing a simplified predictive formula aligned with experimental data. Ye et al. [25] studied externally prestressed UHPC T-shaped beams with stirrup, observing reduced stiffness and shear strength with increased shear span-to-depth ratios. Stirrups enhanced shear resistance but induced brittleness, while higher longitudinal reinforcement ratios promoted ductility. The experiments by Jiang et al. [26] on eight prestressed T-shaped beams with varying stirrup and steel-fiber contents show that steel fibers suppress crack formation and enhance the beam’s shear strength.
Voo et al. [27] validated a proposed shear capacity formula through tests on eight prestressed stirrup-free UHPC I-shaped beams with different steel fiber parameters and shear span-to-depth ratio. Lee et al. [28] demonstrated that prestressed stirrup-free UHPC I-shaped beams exhibit superior ductility, with shear strength progressively increasing post-cracking, contrary to the brittle failure of conventional concrete beams. EL-Helou R.G. et al. [29,30] emphasized UHPC’s strain-hardening capacity and localized crack strain in governing shear behavior through experiments on six prestressed I-beams. Tu et al. [31] compared tests on a 25 m prestressed stirrup-free I-shaped UHPC-NC composite beam with ABAQUS simulations. They found that increasing the web width and reducing the shear span ratio effectively boost the beam’s shear capacity.
The research object mentioned above primarily focuses on prestressed UHPC beams. Although prestressed UHPC beams offer many advantages, they also have their limitations. Prestressing steel is more prone to corrosion than mild steel, and manufacturing prestressed beams requires specialized equipment and associated costs, such as prestressing beds and skilled labor. Additionally, prestressing losses are difficult to predict, and applying prestress to large-scale or curved components incurs higher costs. Due to its high compressive strength, UHPC enables beams to incorporate more reinforcement, allowing the compressive zone to be fully utilized and enhancing the beam’s cracking resistance. Furthermore, the bridging effect of UHPC’s steel fibers contributes to a high initial cracking strength. These advantages collectively allow for the elimination of prestressing in UHPC beams. Therefore, research on non-prestressed UHPC beams is essential. Certain scholars have also conducted research on non-prestressed beams.
Ahmad et al. [32,33] identified significant impacts of shear span-to-depth ratio, steel fiber content, and stirrup spacing on shear capacity in non-prestressed stirrup-free UHPC rectangular beams, corroborating their model of UHPC beam shear strength. Zhang et al. [34] found that introducing a reduction factor into Xu’s formula improves its accuracy for non-prestressed stirrup-free UHPC rectangular beams with varying span-to-depth ratios and steel fiber volumes.
The majority of scholarly research on non-prestressed UHPC beams without stirrups focuses on rectangular cross-sections [32,33,34,35]. Cross-section selection critically impacts beam costs, particularly relevant given UHPC’s higher material expense. Yet UHPC’s exceptional strength makes it especially suitable for I-shaped cross-section beam designs. The efficient cross-sectional properties of I-shaped sections enable further material reduction while maintaining structural load-bearing capacity and stiffness. The lightweight nature of I-shaped UHPC beams further reduces transportation and hoisting expenses, while minimizing substructure requirements. Enhanced durability and extended service life significantly decrease the frequency of maintenance and repair, as well as the costs associated with demolition and reconstruction, demonstrating a clear life-cycle cost advantage. However, current research on non-prestressed stirrups-free I-shaped UHPC beams remains limited. Extensive parametric shear tests are still required to investigate the shear failure mechanisms of the beams and evaluate their shear safety, particularly for large-scale, thin-webbed, non-prestressed, stirrup-free, I-shaped UHPC beams.

2. Research Significance

In this research, two 4.0 m-long large-scale stirrup-free I-shaped UHPC beams provided by Zhonglu Dura International Engineering Co., Ltd. (Guangzhou, China) were experimentally and numerically investigated, with a special focus on their shear behavior. The experimental outcomes can amplify the data set of shear tests in UHPC beams. The established FEMs can optimize the design scheme. Shear behaviors and shear failure mechanisms were unveiled using experimental and numerical methods, considering the parameters of shear span–depth ratio and longitudinal reinforcement characteristics. The applicability of four formulae for evaluating the shear strength of UHPC beams was verified with experimental results.

3. Experimental Programs

3.1. Experimental Specimen Design

In this study, the test specimens consisted of two 4 m-long large-scale stirrup-free I-shaped UHPC beams. To investigate their flexural and shear behavior, each beam underwent flexural testing first, followed by shear testing on one side. The beams were provided by Zhonglu Dura International Engineering Co., Ltd. It is worth noting that conducting a flexural test in the mid-span region followed by a shear test at the beam ends is an established experimental approach. This method allows for efficient use of large-scale test beams. For example, a similar procedure was adopted by Wenjie Tu et al. [31] in their tests on a 25 m full-scale prestressed UHPC-NC composite I-beam without stirrups.
Figure 1a shows the general configuration of the stirrup-free I-shaped UHPC test beam. The overall dimensions of the test beam were 300 mm × 400 mm × 4000 mm. Except for the rectangular cross-sections at both ends, the remaining sections of the beam were I-shaped, with a web thickness of only 50 mm, as illustrated in Figure 1b,c.
The test beam utilized four HRB400 steel bars (nominal diameter: 16 mm) as longitudinal tension reinforcement, placed at 25 mm from the beam bottom and spaced 60 mm apart. Two HRB400 steel bars (nominal diameter: 16 mm) served as longitudinal compression reinforcement, positioned at 25 mm from the beam top and spaced 100 mm apart. No additional reinforcement was included.
For easy identification of the test beams, the following naming convention was adopted as T(N)-UI-F(S)- λ #-R#. Here, “T(N)” denotes test beam (T) or numerical simulation beam (N); “UI” represents the test number of the I-shaped UHPC beam; “F/S” indicates flexural test (F) or shear test (S); “ λ #” denotes the shear span-to-depth ratio; and “R#” specifies the reinforcement strength grade.

3.2. Material Properties

3.2.1. Preparation and Mechanical Properties of UHPC and Steel Reinforcement

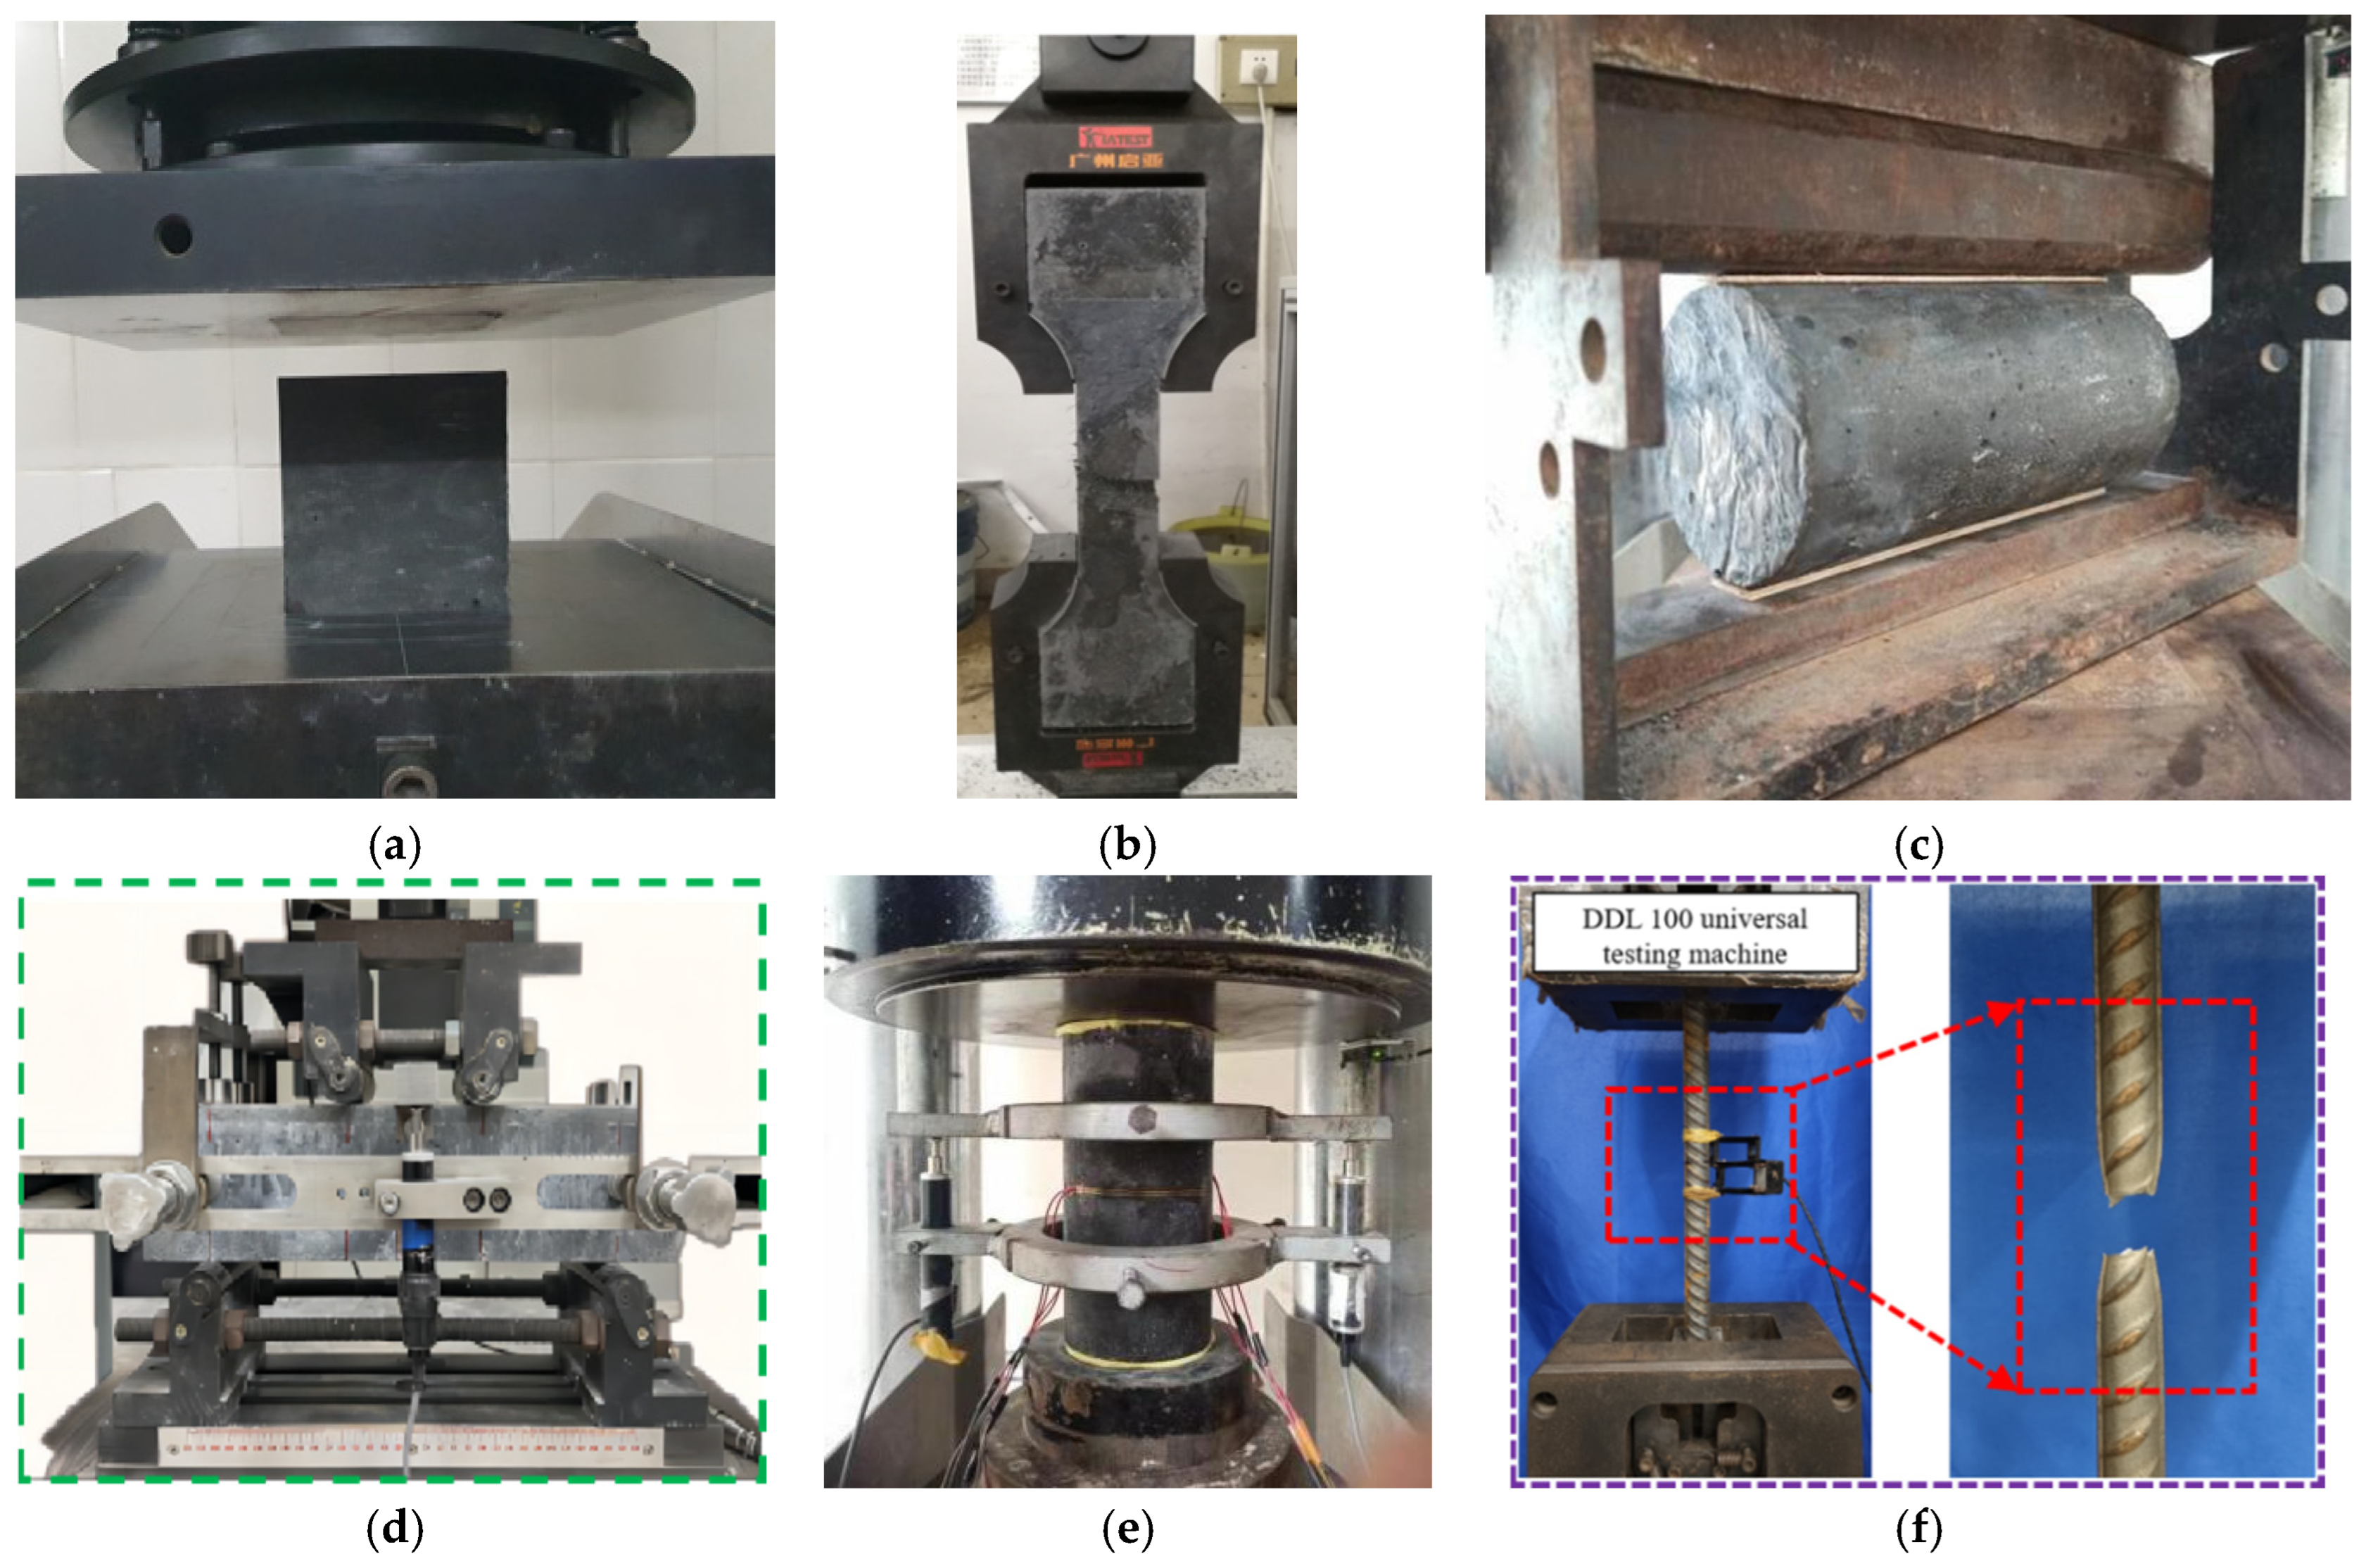
The UHPC used in this study was provided by Zhonglu Dura International Engineering Co., Ltd., and employed to cast all UHPC test beams. The specific mix proportions, as provided by the company, are detailed in Table 1. It is worth noting that the uniformity of steel fiber distribution significantly influences material properties and, consequently, the experimental results. The uniformity of the steel fiber distribution is guaranteed by the manufacturer’s validated and established production techniques, which have previously been verified through rigorous methods such as CT scanning analysis. Complying to the French standard for UHPC mechanical property testing, NF P 18-470 (hereafter referred to as French code) [36], and the PCI Report (hereafter PCI report) [37], mechanical properties were evaluated as follows: compressive strength was tested using 100 × 100 × 100 mm3 cubes; splitting tensile strength, elastic modulus, and Poisson’s ratio were measured using ϕ 100   m m × 200   m m cylinders; and tensile strength was determined using 100 mm × 50 mm × 368 mm dog-bone-shaped specimens. The average test results are summarized in Table 2. The material property testing process is illustrated in Figure 2.
Post-cracking residual strength is a critical mechanical performance index for UHPC. Tests were conducted in accordance with the French code. The steel fibers used in this study were micro straight copper-coated steel fibers with a diameter of 0.2 mm, a length of 20 mm, and a tensile strength of 2950 MPa. As specified by the French code, the cross-sectional dimensions of prism specimens must be 5–7 times the length of the longest fiber. Therefore, prism specimens with dimensions of 100 × 100 × 400 mm were adopted. The formula for calculating the post-cracking residual tensile strength is as follows:
σ f 1 = 1 w * 0 w * σ f ( w ) d w
The design value of the post-cracking residual tensile strength is calculated using the formula:
σ f 2 = 1 K γ c f 1 w * 0 w * σ f ( w ) d w ,
where w * represents the maximum crack width at crack initiation, with a maximum value of 0.3 mm; σ f ( w ) denotes the residual tensile stress intensity (MPa) associated with the crack width; K is the orientation coefficient of steel fibers, taken as 1.25; and γ c f is the partial safety factor for concrete, taken as 1.3. The tested σ f 1 and σ f 2 are listed in Table 2.
According to the PCI Report, the residual tensile strength depends on the first-crack strength f r r , and its calculation formula is the following:
f r r = ψ f f u ,
where f f u represents the ultimate flexural strength, and ψ denotes the conversion factor from ultimate flexural strength to post-cracking tensile strength, taken as 0.375 according to the PCI Report. The calculation results are also exhibited in Table 2.
The steel reinforcement used in the tests was evaluated in accordance with the Chinese national standard GB/T50448—2015 (Metallic Materials—Tensile Testing) [38]. A DDL 100 universal testing machine equipped with an extensometer was employed to measure the yield strength, ultimate strength, and elastic modulus of the steel reinforcement. The steel reinforcement testing setup is shown in Figure 2f, and the average test data are compiled in Table 3.

3.2.2. Specimen Fabrication and Curing

Steel reinforcement was first tied according to the design dimensions, according to the drawings. All test beams were cast using wooden molds in a single batch pouring. The formwork was stripped when the UHPC reached a compressive strength of 100 MPa (standard cube compressive strength). The beams were then cured under a plastic membrane to maintain moisture and prevent evaporation. For the UHPC test beams, steam curing was applied at 90 °C and 95% relative humidity for 48 h.

3.3. Test Loading

3.3.1. Flexural Test Loading

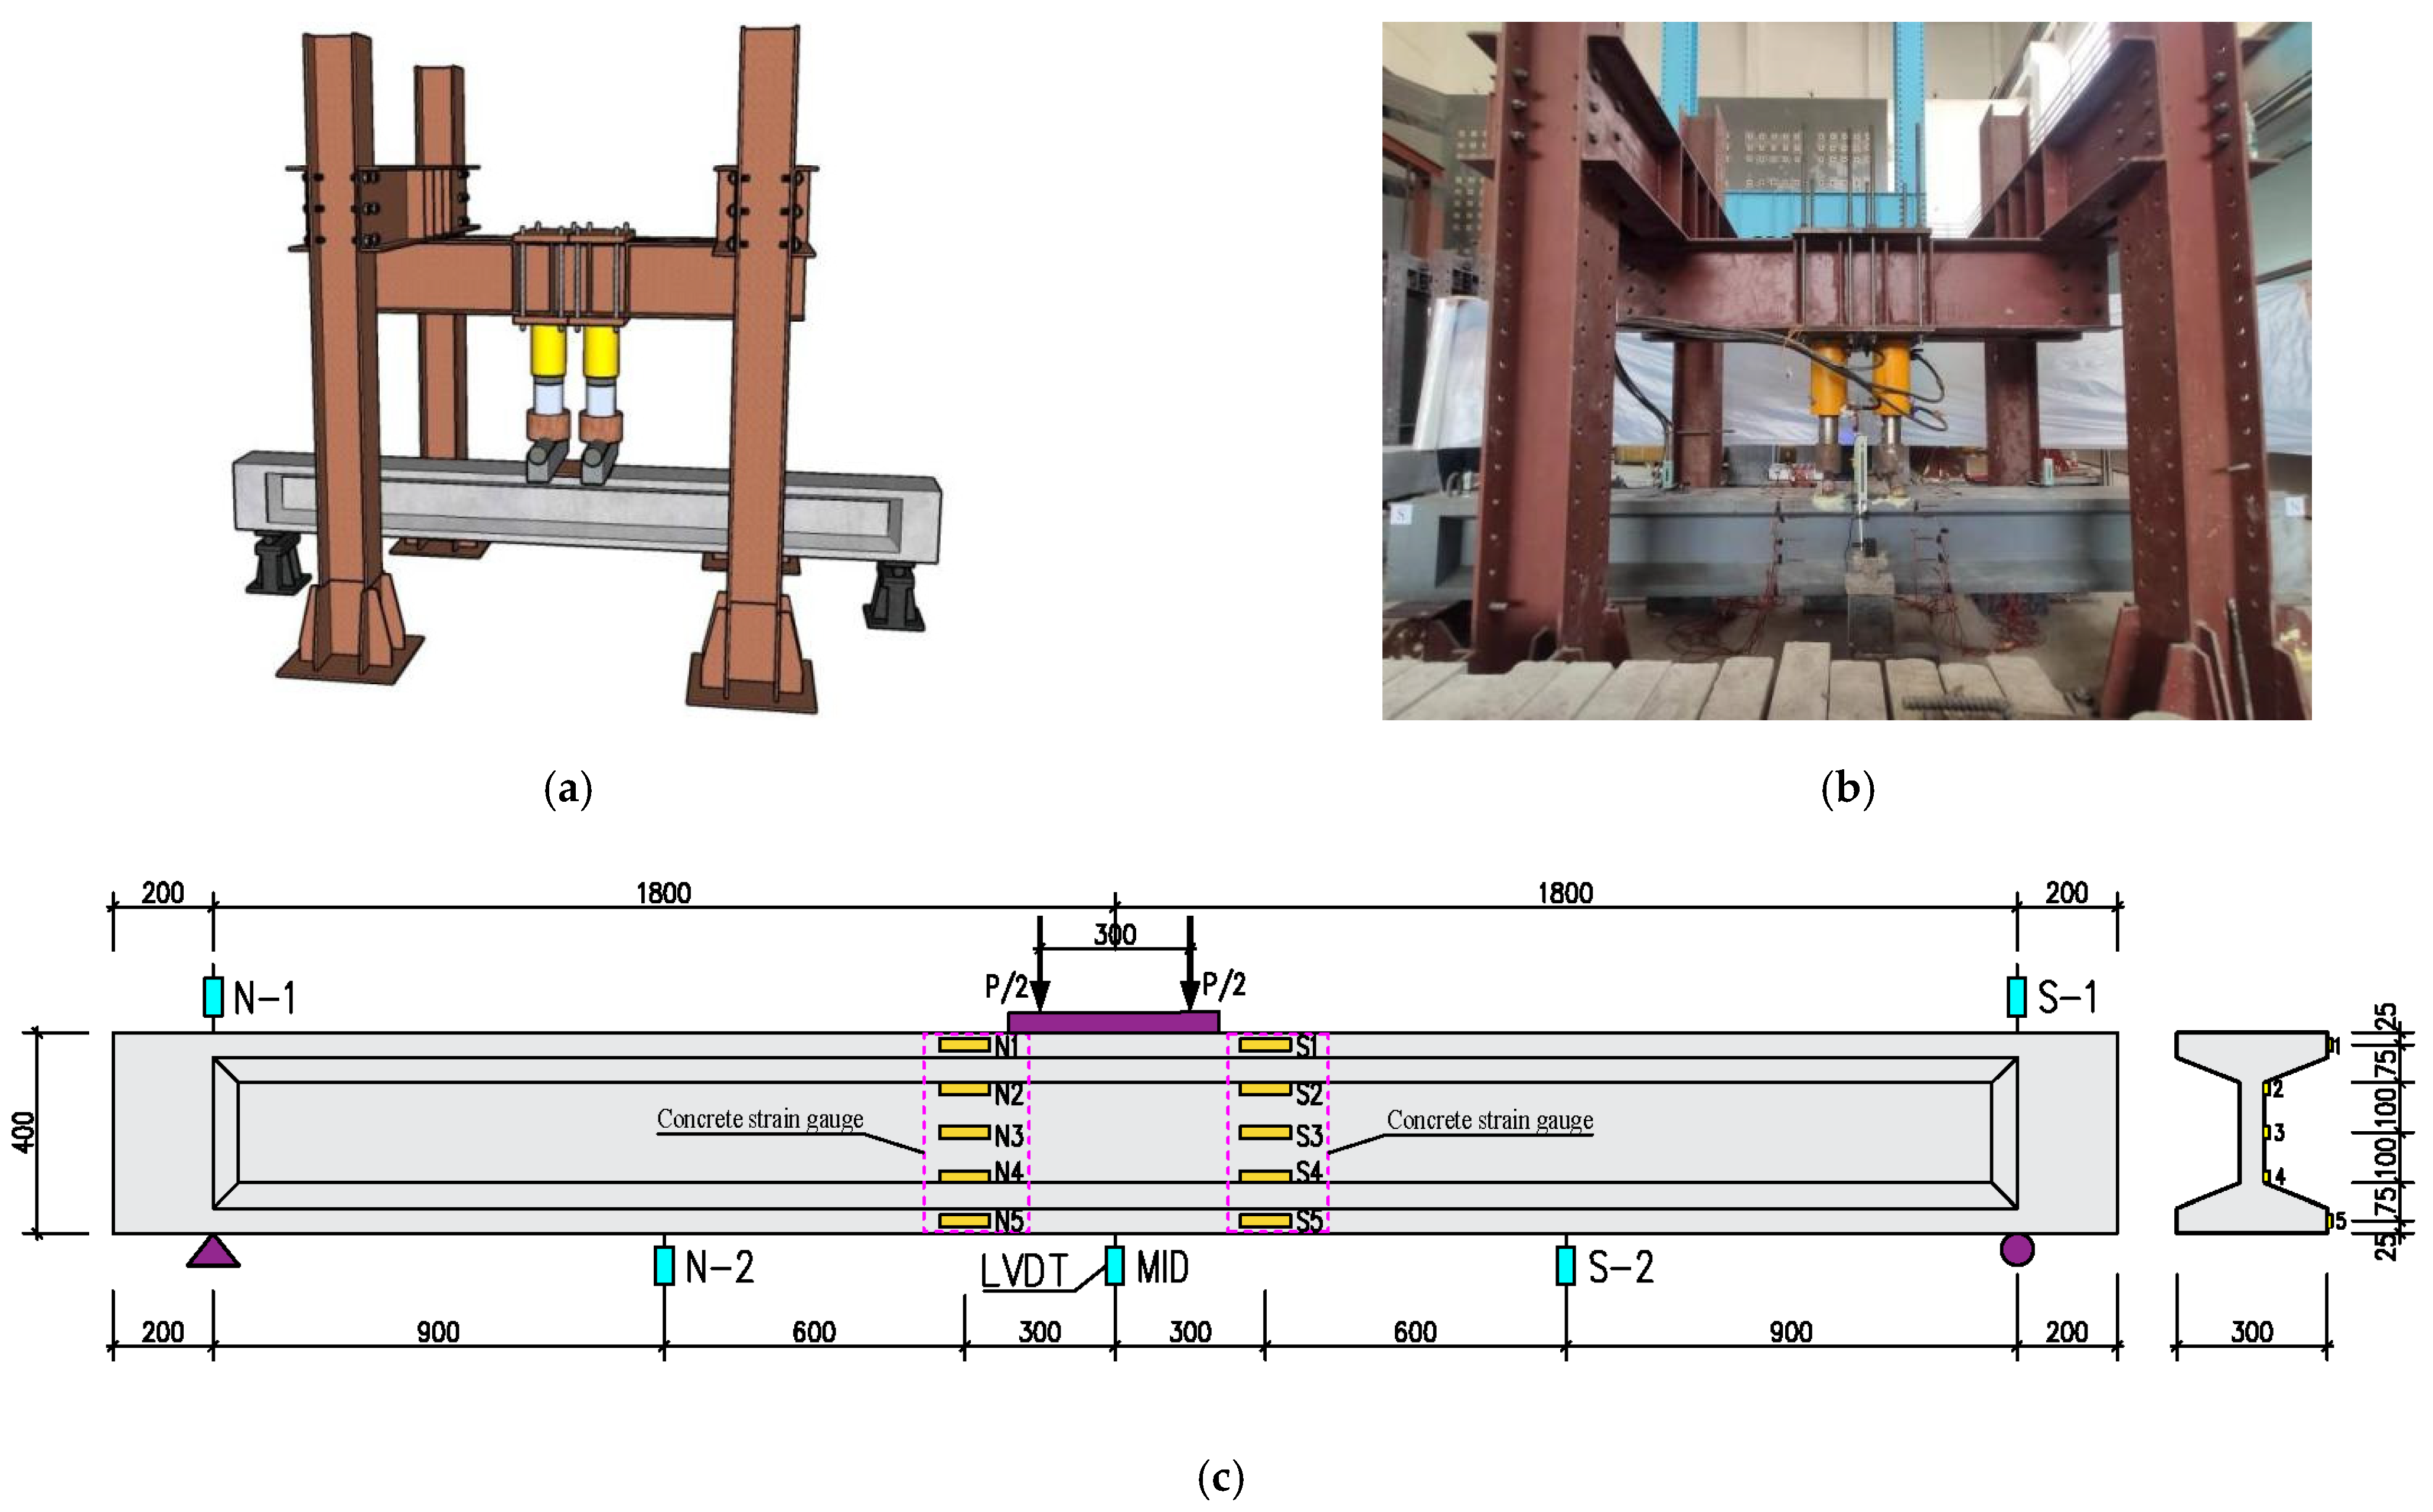
The flexural test adopted a three-point loading setup. Pin and sliding hinge supports were placed 200 mm from each beam end. A steel plate was positioned at the loading point on the beam’s top surface to prevent local crushing, as shown in Figure 3. Loading was applied using a manual hydraulic pump combined with a flow divider and two 100-ton manual jacks. Load data were monitored and recorded in real time via pressure sensors connected to a data acquisition system. Before cracking, force-controlled loading was applied in 20 kN increments.
After the beam cracking, displacement-controlled loading was initiated, with mid-span displacement monitored and increased by 1.0 mm per step until significant failure occurred. Cracks were marked with a pen marker at each load increment, noting their locations and corresponding loads.

3.3.2. Shear Test Loading

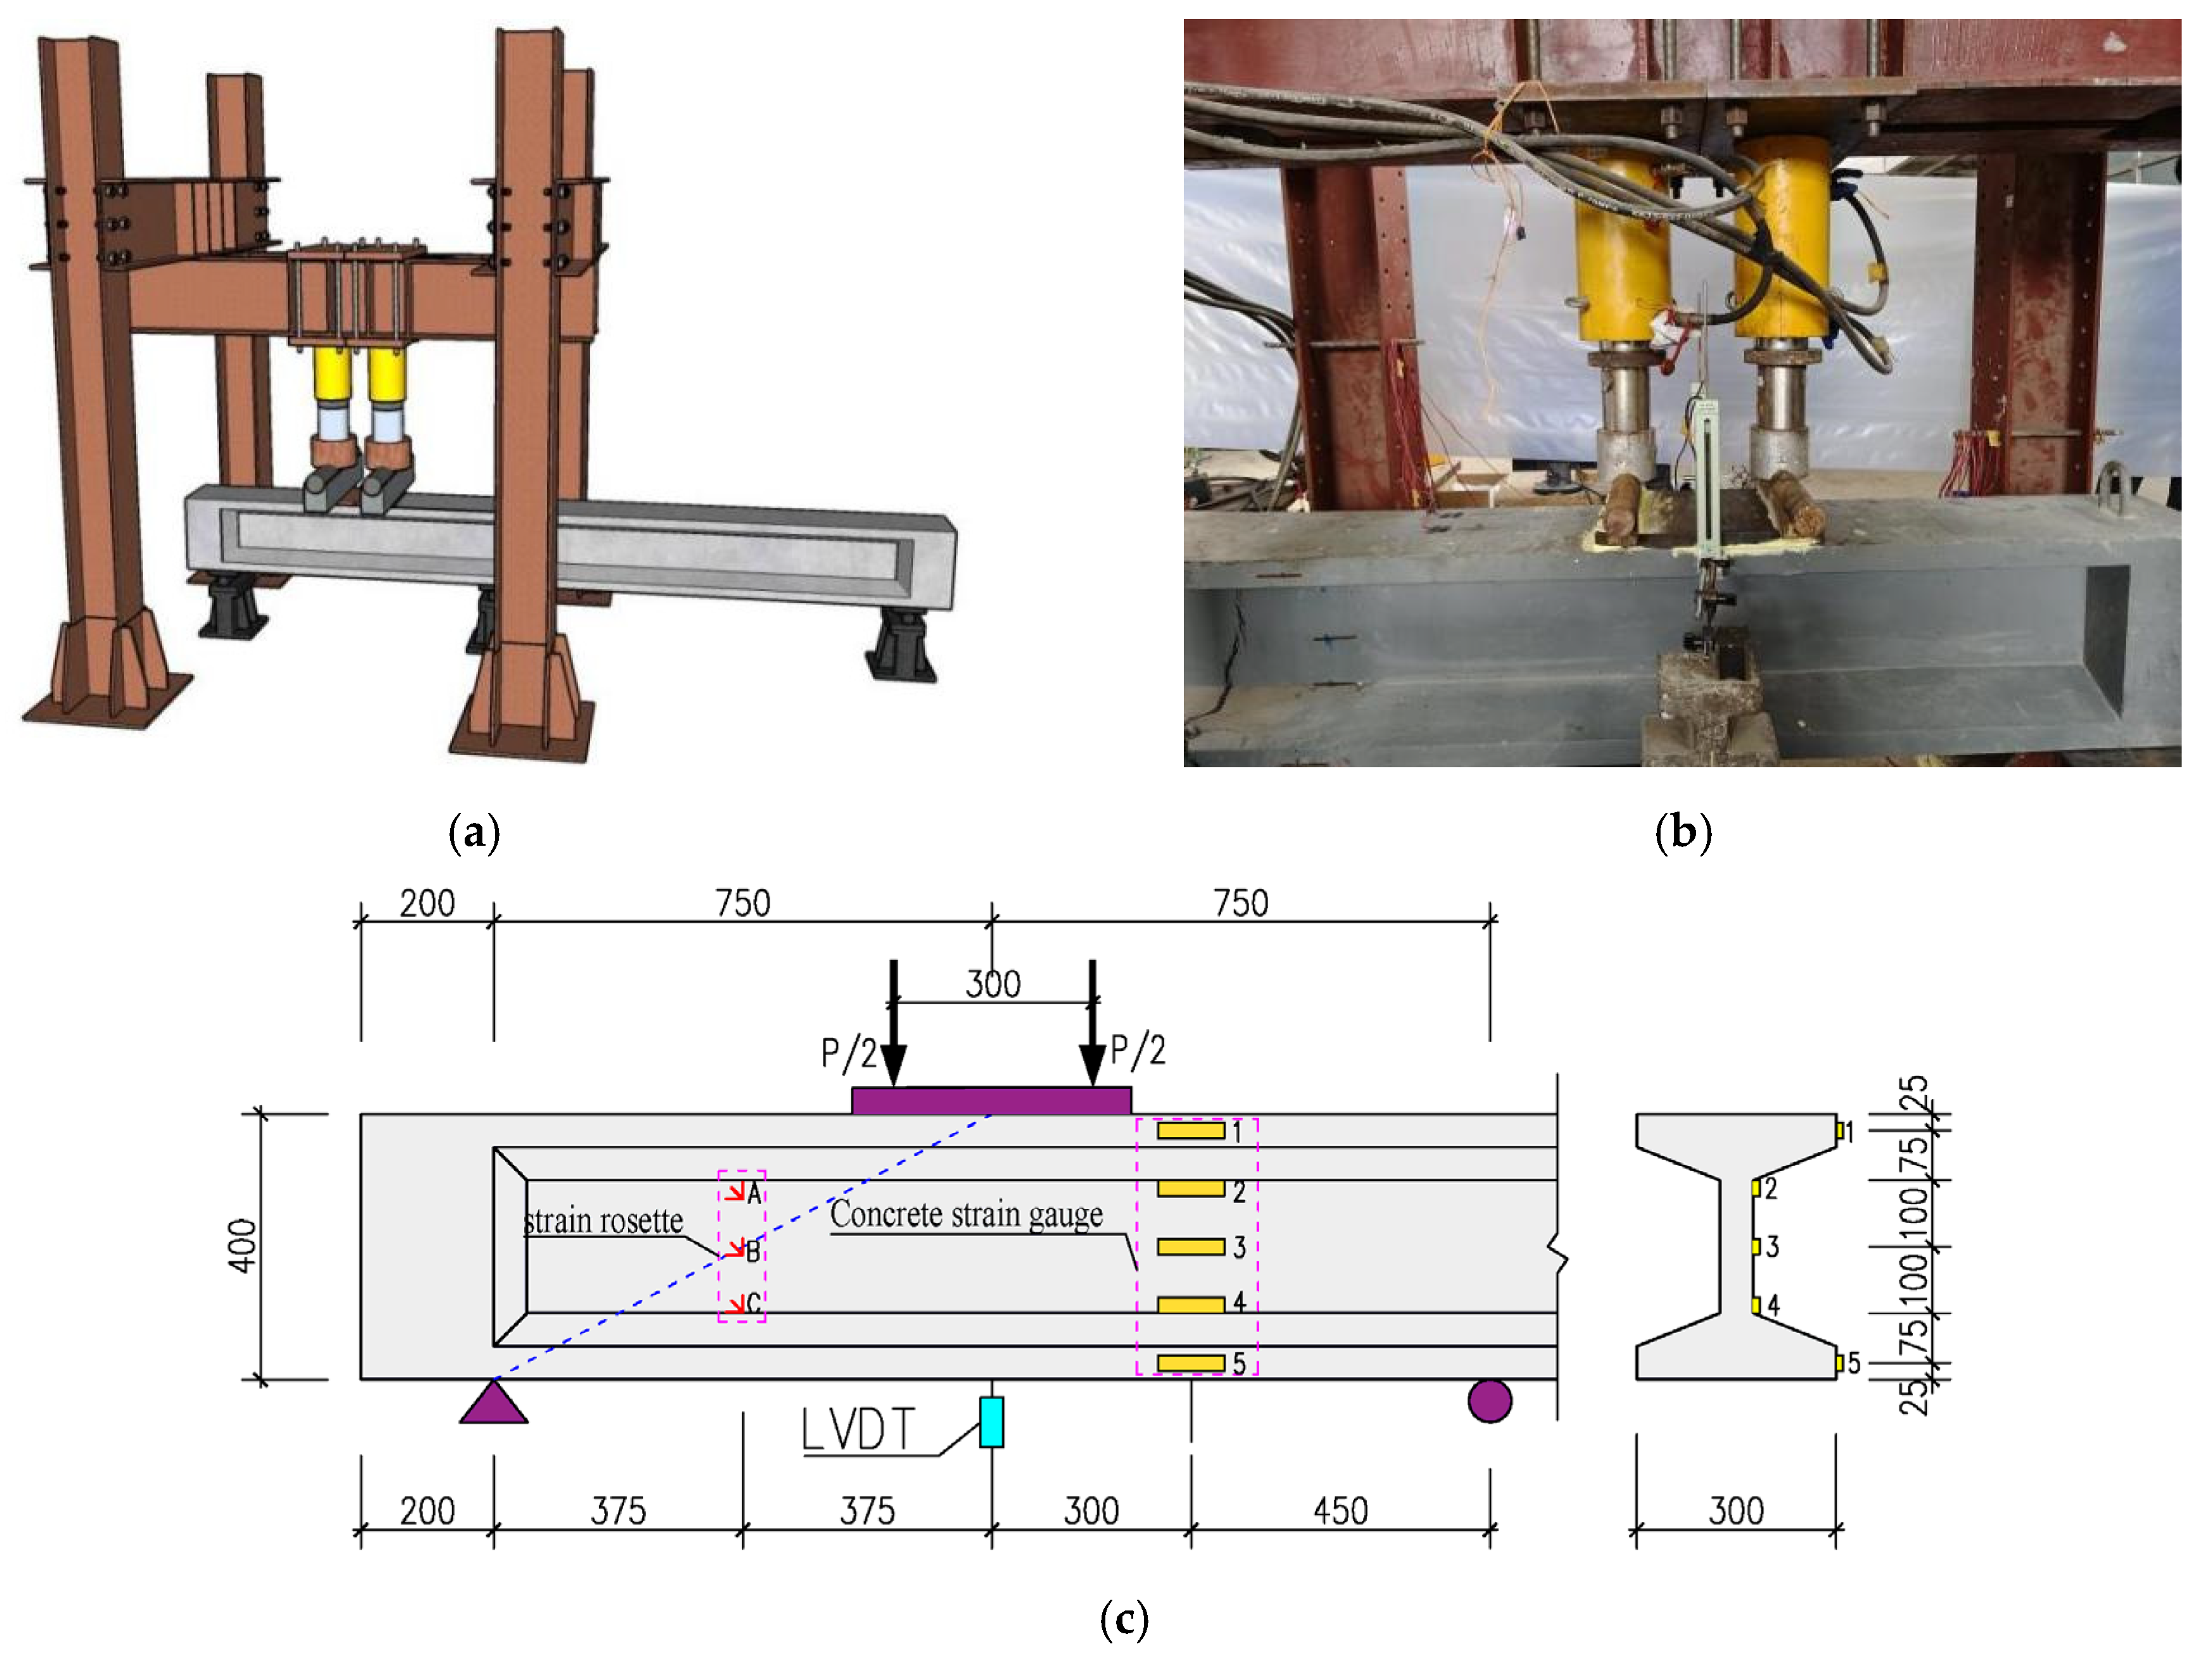
After the flexural test, the undamaged side of the beam was selected for shear testing. A three-point loading setup with a shear span-to-depth ratio of 2.0 was employed. The supports were spaced 1500 mm apart, with the load applied at the mid-span (Figure 4). The cantilevered portion of the beam was supported by a third bearing. Loading was applied using the same hydraulic pump and jacks with real-time load monitoring via pressure sensors. Before diagonal cracking, force-controlled loading used 20 kN increments. After diagonal cracking, displacement-controlled loading was applied at 0.1 mm increments using a mid-span displacement gauge. The test was terminated when a significant failure occurred or the load dropped to 80% of the ultimate shear capacity. Cracks were marked and recorded at each load increment.

3.4. Test Instrumentation Layout

3.4.1. Instrumentation Layout for Flexural Tests

Figure 3 illustrates the schematic drawing of the experimental setup, the photo of the experimental setup, and the arrangement of Linear Variable Displacement Transducers and concrete strain gauges. To measure deflection variations at different positions of the test beam during the flexural test, two LVDTs (Linear Variable Differential Transformers) were installed at the N-side and S-side supports, respectively. Additional LVDTs were placed at the quarter points of the beam length, and one LVDT was positioned at the mid-span, totaling five displacement measurement points. These instruments were labeled sequentially from the N-side to the S-side as N-1, N-2, MID, S-2, and S-1.
To capture strain distribution along the beam height near the loading points, concrete strain gauges were arranged vertically along the N-side Section and S-side Section. A total of 10 strain gauges were installed, labeled N1–N5 and S1–S5, respectively.

3.4.2. Instrumentation Layout for Shear Tests

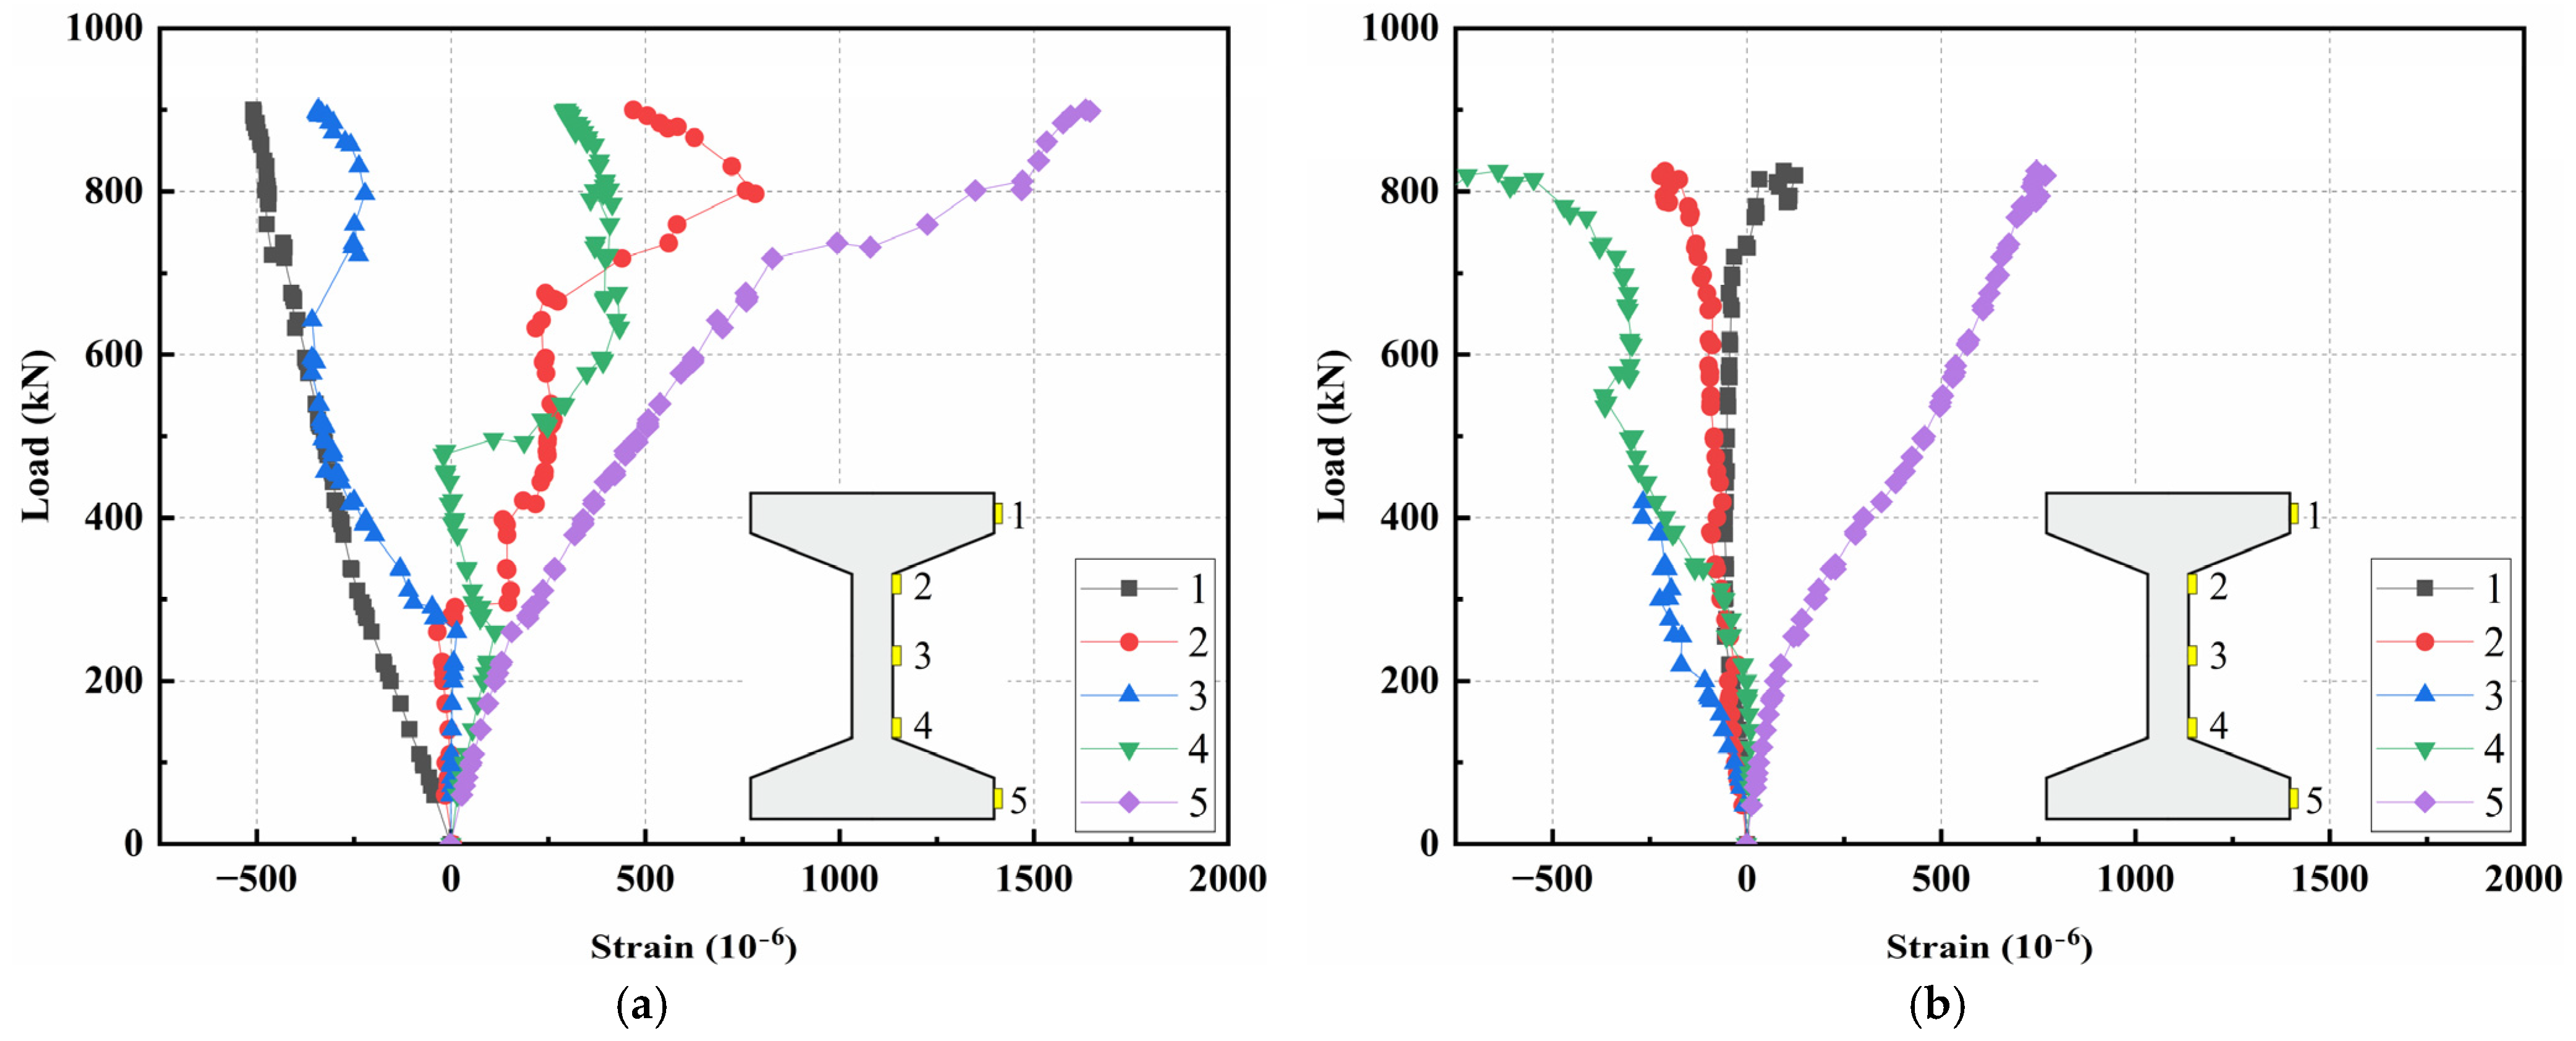
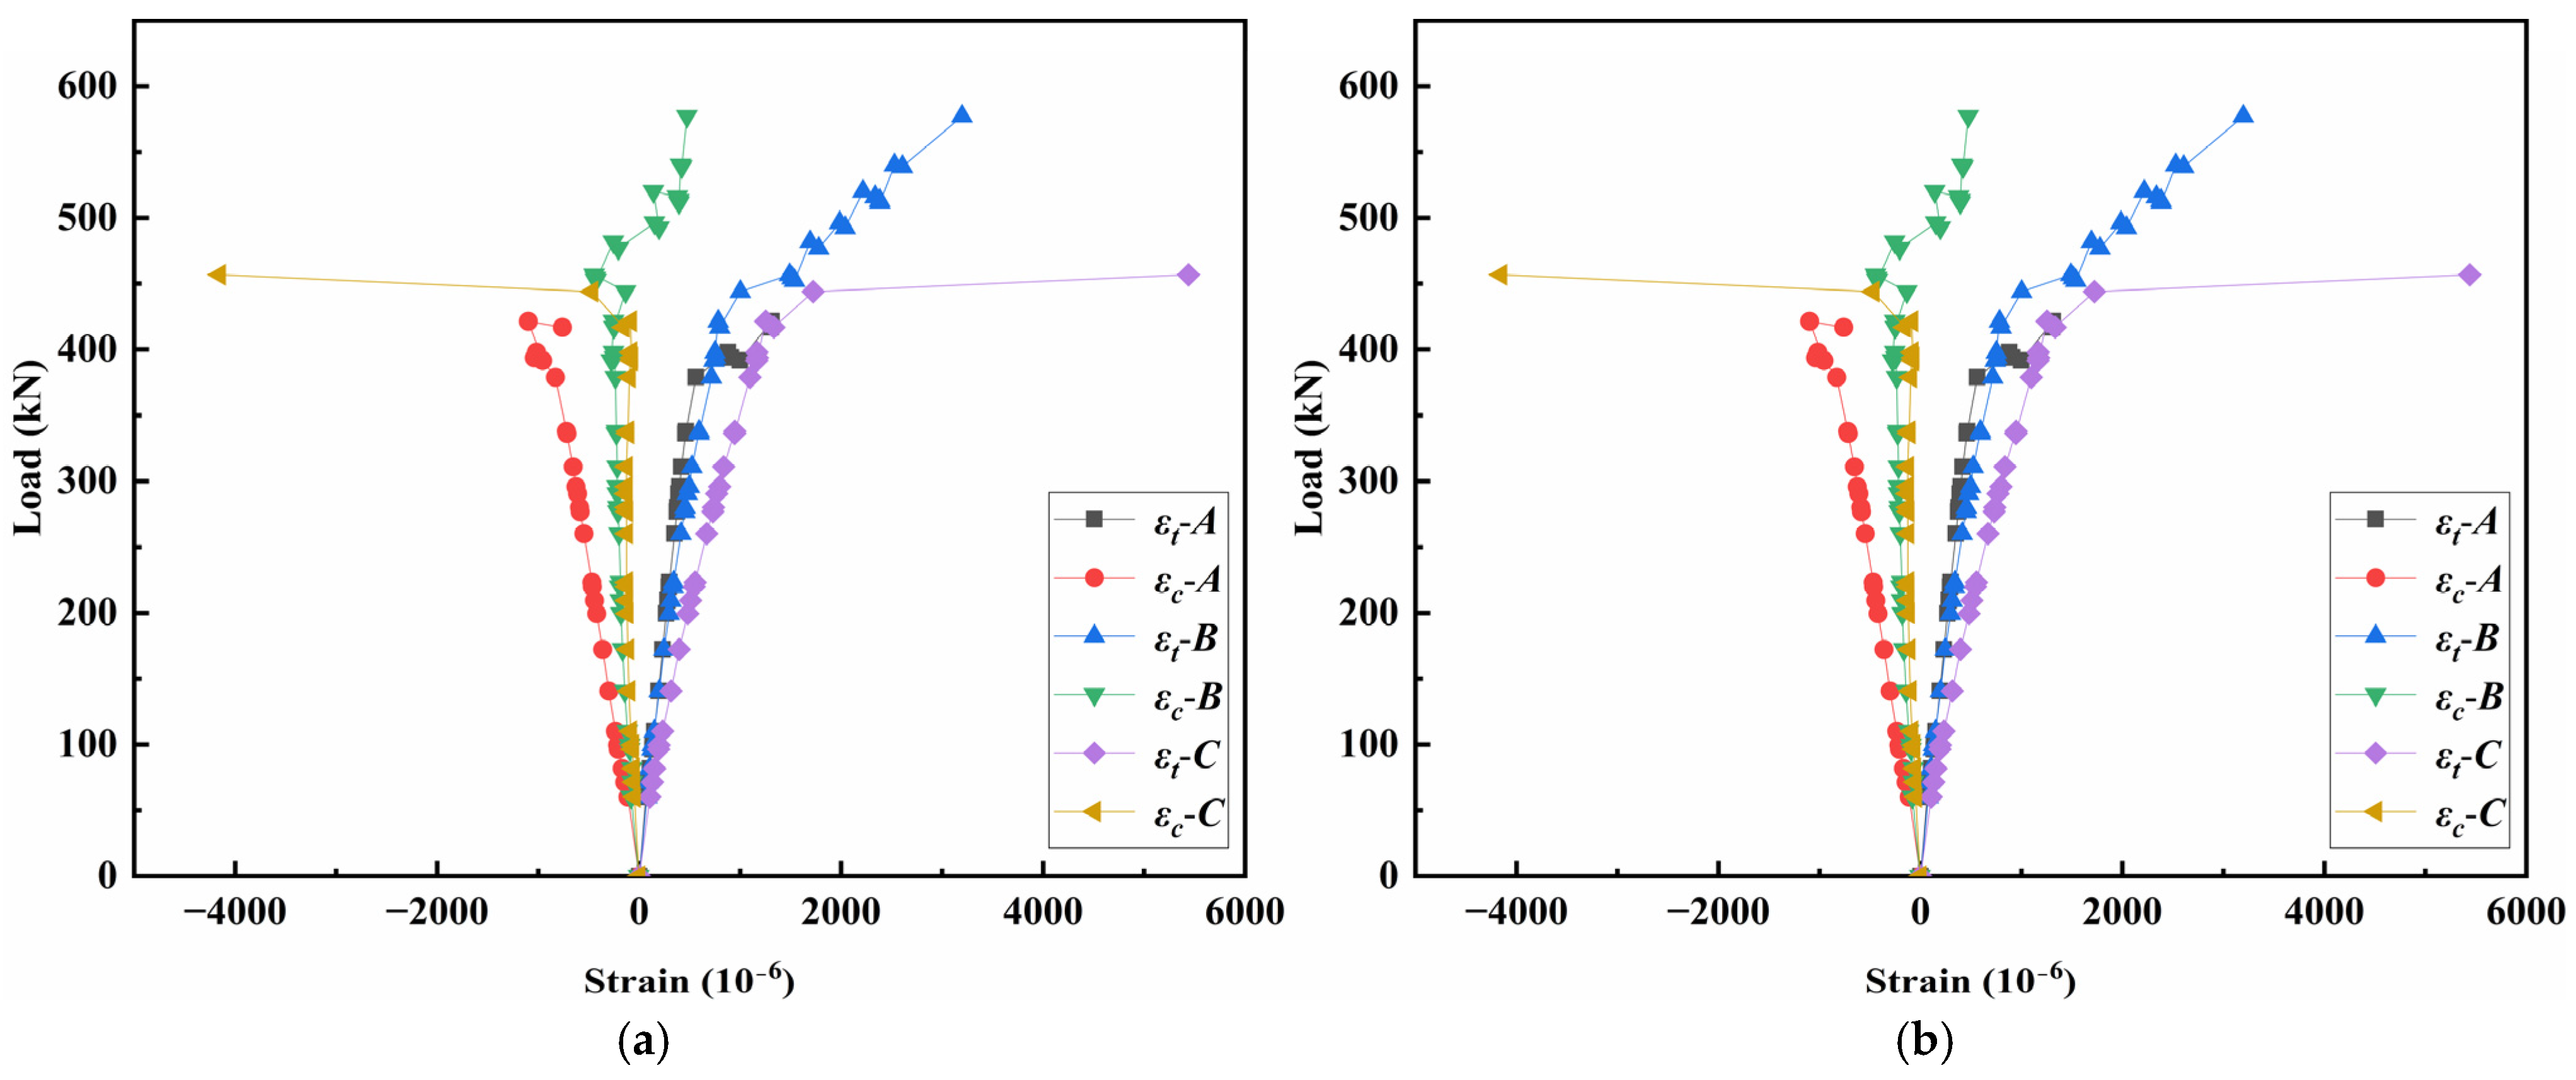
Figure 4 illustrates the schematic drawing of the experimental setup, the photo of the experimental setup, and the arrangement of Linear Variable Displacement Transducers and concrete strain gauges. One LDVT was installed at the loading point to measure mid-span deflection. Five concrete strain gauges (labeled 1–5) were vertically arranged along the beam height at a position 300 mm from the center loading point. Three sets of strain rosettes (labeled A, B, and C) were uniformly distributed on the web at a position 375 mm from the supporting to capture principal strain variations.

3.5. Test Results and Analysis

3.5.1. Summary and Comparison of Test Results

The results of the flexural and shear tests are summarized in Table 4, including the flexural cracking loads, flexural cracking stresses, deflection at cracking, diagonal cracking loads, diagonal cracking stresses, deflection at diagonal cracking, ultimate load-bearing capacities, corresponding mid-span deflections at ultimate loads, and ultimate stress, for each test beam.
The tests revealed that the 4 m-long large-scale stirrup-free I-shaped UHPC beams exhibited a flexural capacity of approximately 369.00 kN and a shear capacity of approximately 864.58 kN. During the flexural test, the bending crack initiation load was approximately 155 kN, corresponding to a nominal cracking stress of 12.35 MPa, while the diagonal crack initiation load was approximately 220 kN, yielding a nominal shear cracking stress of 5.85 MPa. In the shear test, no bending cracks were observed, so no corresponding data are listed in the table; the diagonal crack initiation load was approximately 230 kN, with a calculated cracking stress of 6.15 MPa.
To evaluate the post-cracking performance of the test beams, the following formulas were applied:
P C S R = P u P c r P u × 100 % ,
P C S R = P u P c i P u × 100 % ,
where Equation (4) corresponds to post-cracking performance in flexural tests, and Equation (5) corresponds to shear tests. Calculations indicated that the post-cracking performance ranged between 56.1% and 59.9% for flexural tests and 68.9% and 78.3% for shear tests, demonstrating the excellent post-cracking behavior of the stirrup-free I-shaped UHPC beams. The meanings of the symbols used in Equations (4) and (5) are provided in the note to Table 4.

3.5.2. Test Observations and Failure Modes

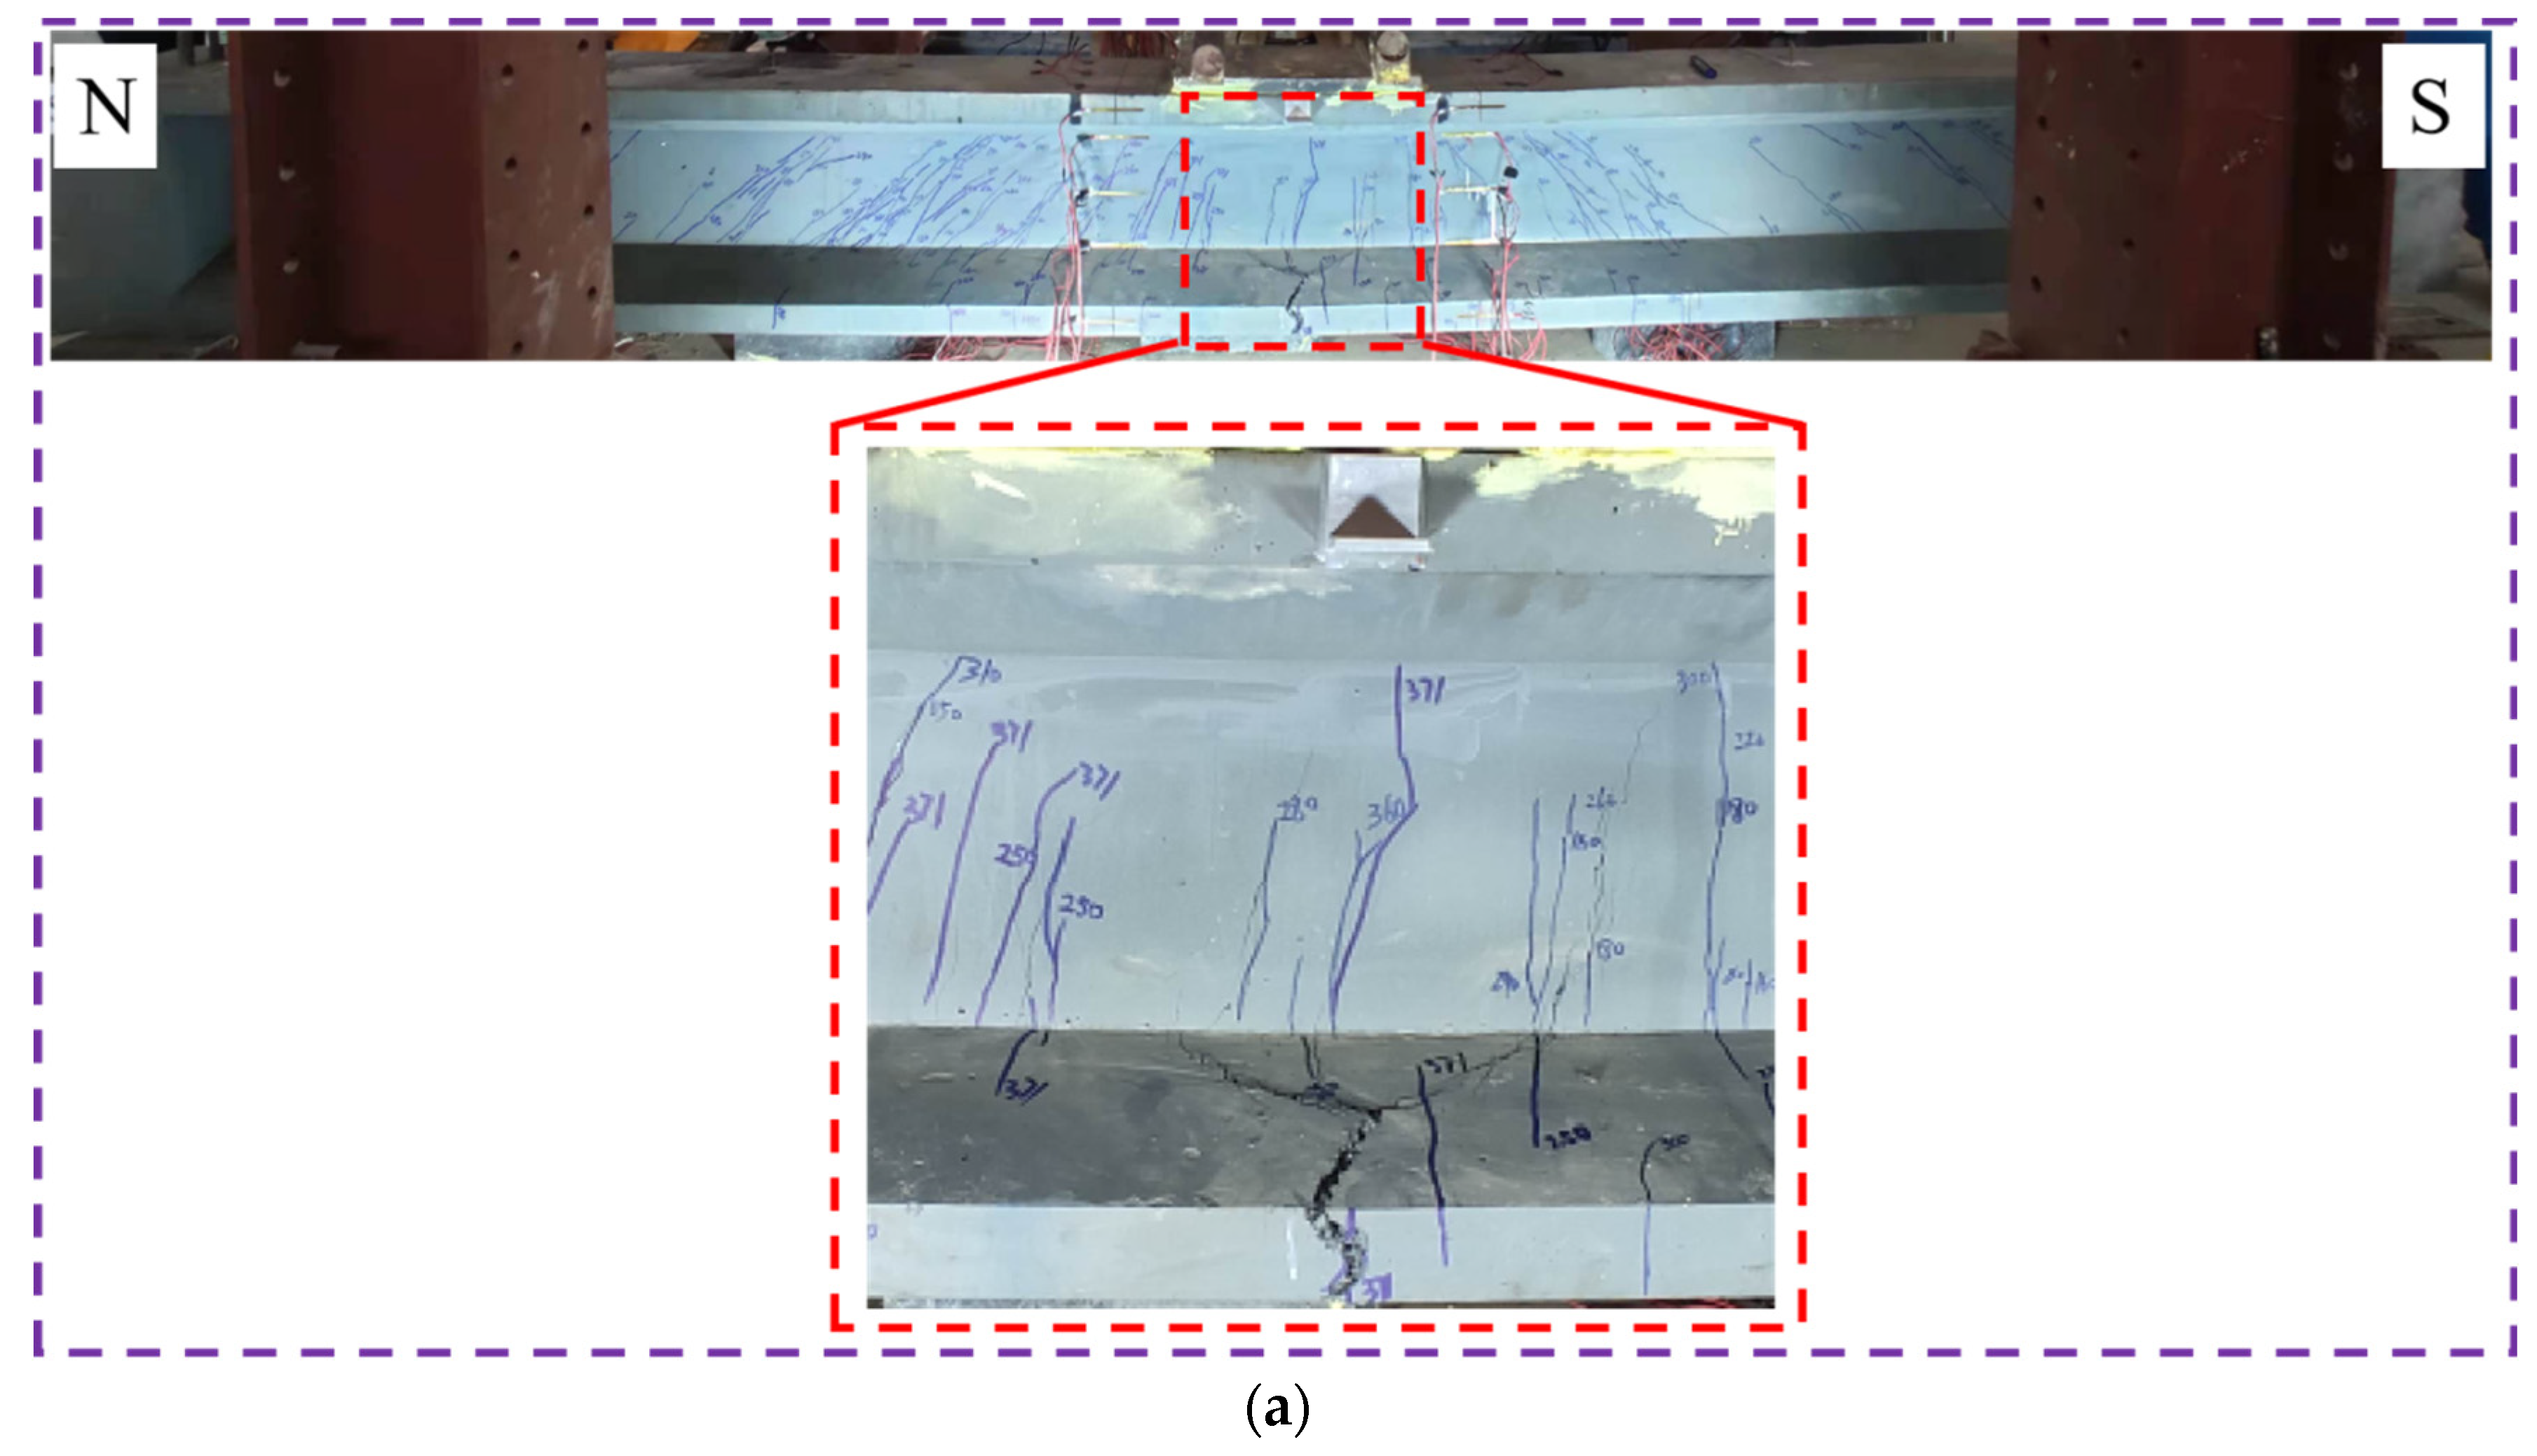
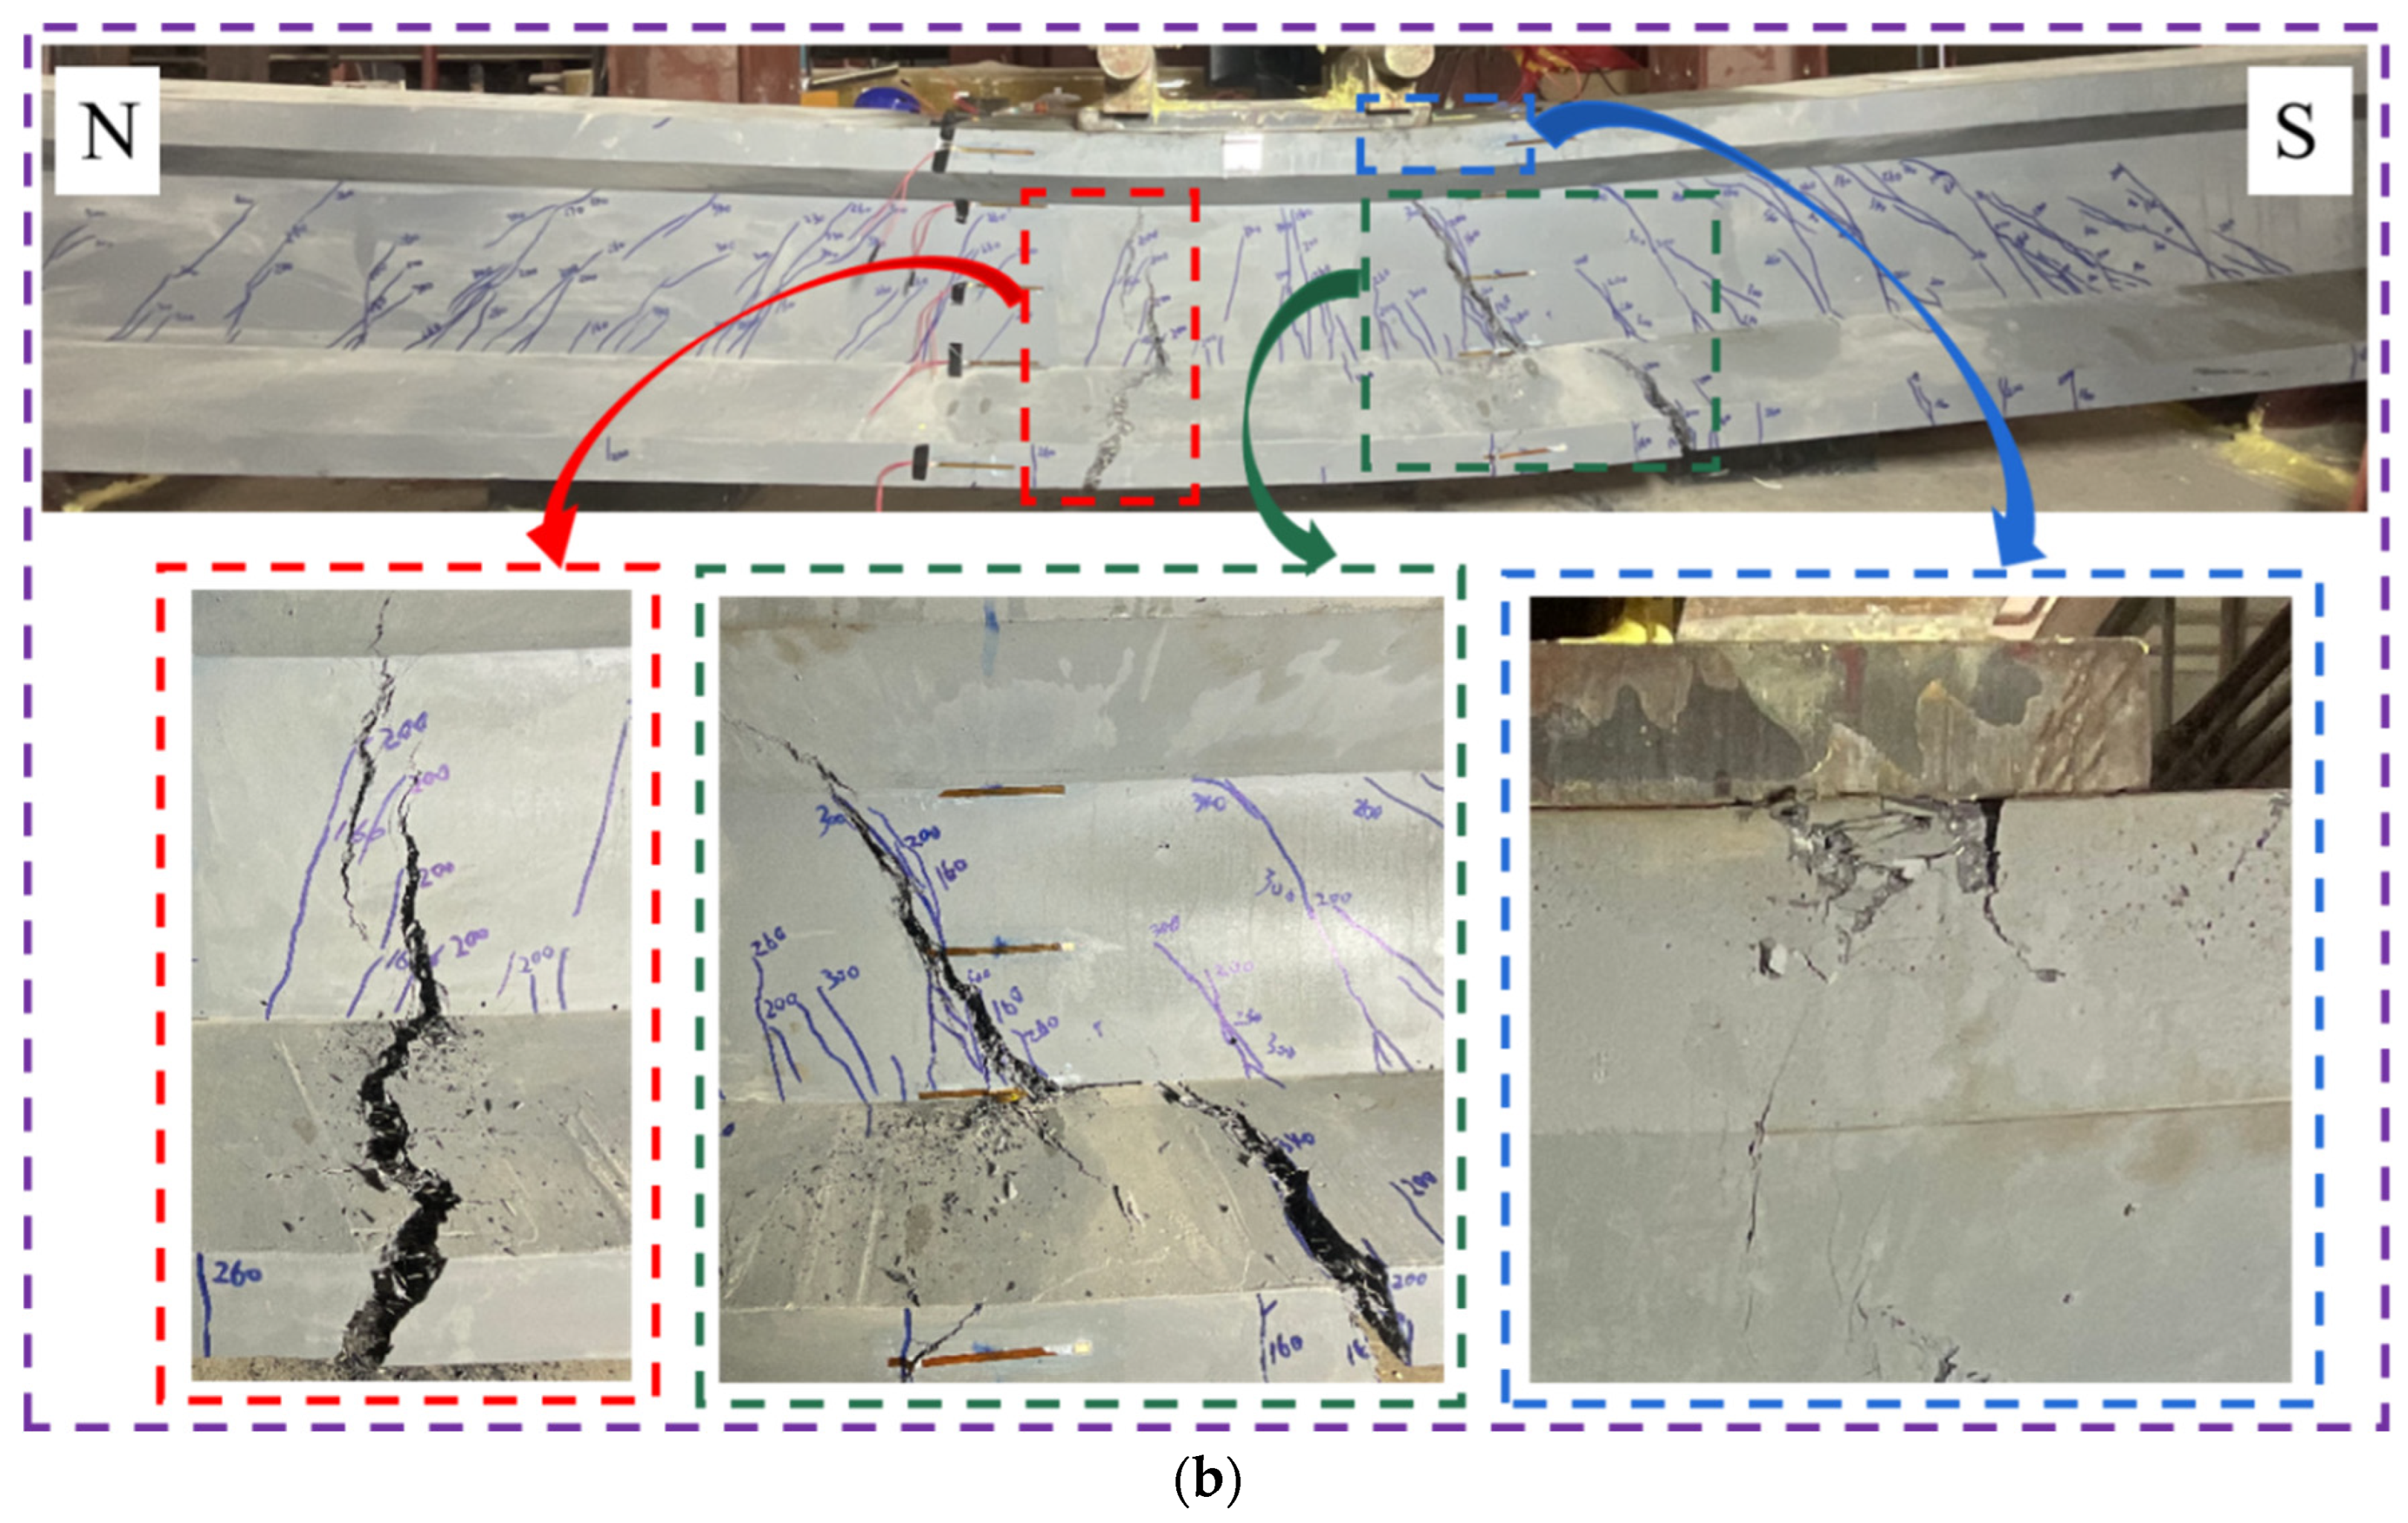
Figure 5 illustrates the crack distributions and failure patterns of the two stirrup-free I-shaped UHPC beams during the flexural tests. Both beams exhibited significant flexural failure, with wide bending cracks emerging at the mid-span bottom near the loading point.
For the T-UI1-F-4.8-R400 beam (Figure 5a), the first bending crack appeared at the mid-span bottom under a load of 150 kN. As the load reached 240 kN, short diagonal cracks developed in the flexural-shear zones of the web, primarily concentrated near the N-side and S-side loading points, with a few extending toward the beam ends. At 371 kN, the load nearly stagnated, but mid-span deflection increased rapidly. Notably, no significant cracks were observed in the upper web concrete, nor was crushing detected near the loading points.
For the T-UI2-F-4.8-R400 beam (Figure 5b), the first bending crack appeared at the mid-span bottom at 160 kN, accompanied by web cracks. At 200 kN, short diagonal cracks emerged in the flexural-shear zones. Upon reaching 340 kN, load developing slowed while deflection accelerated. Two dominant bending cracks widened rapidly, extending from the beam bottom to the upper web concrete. Localized crushing occurred beneath the steel loading pad, prompting test termination.
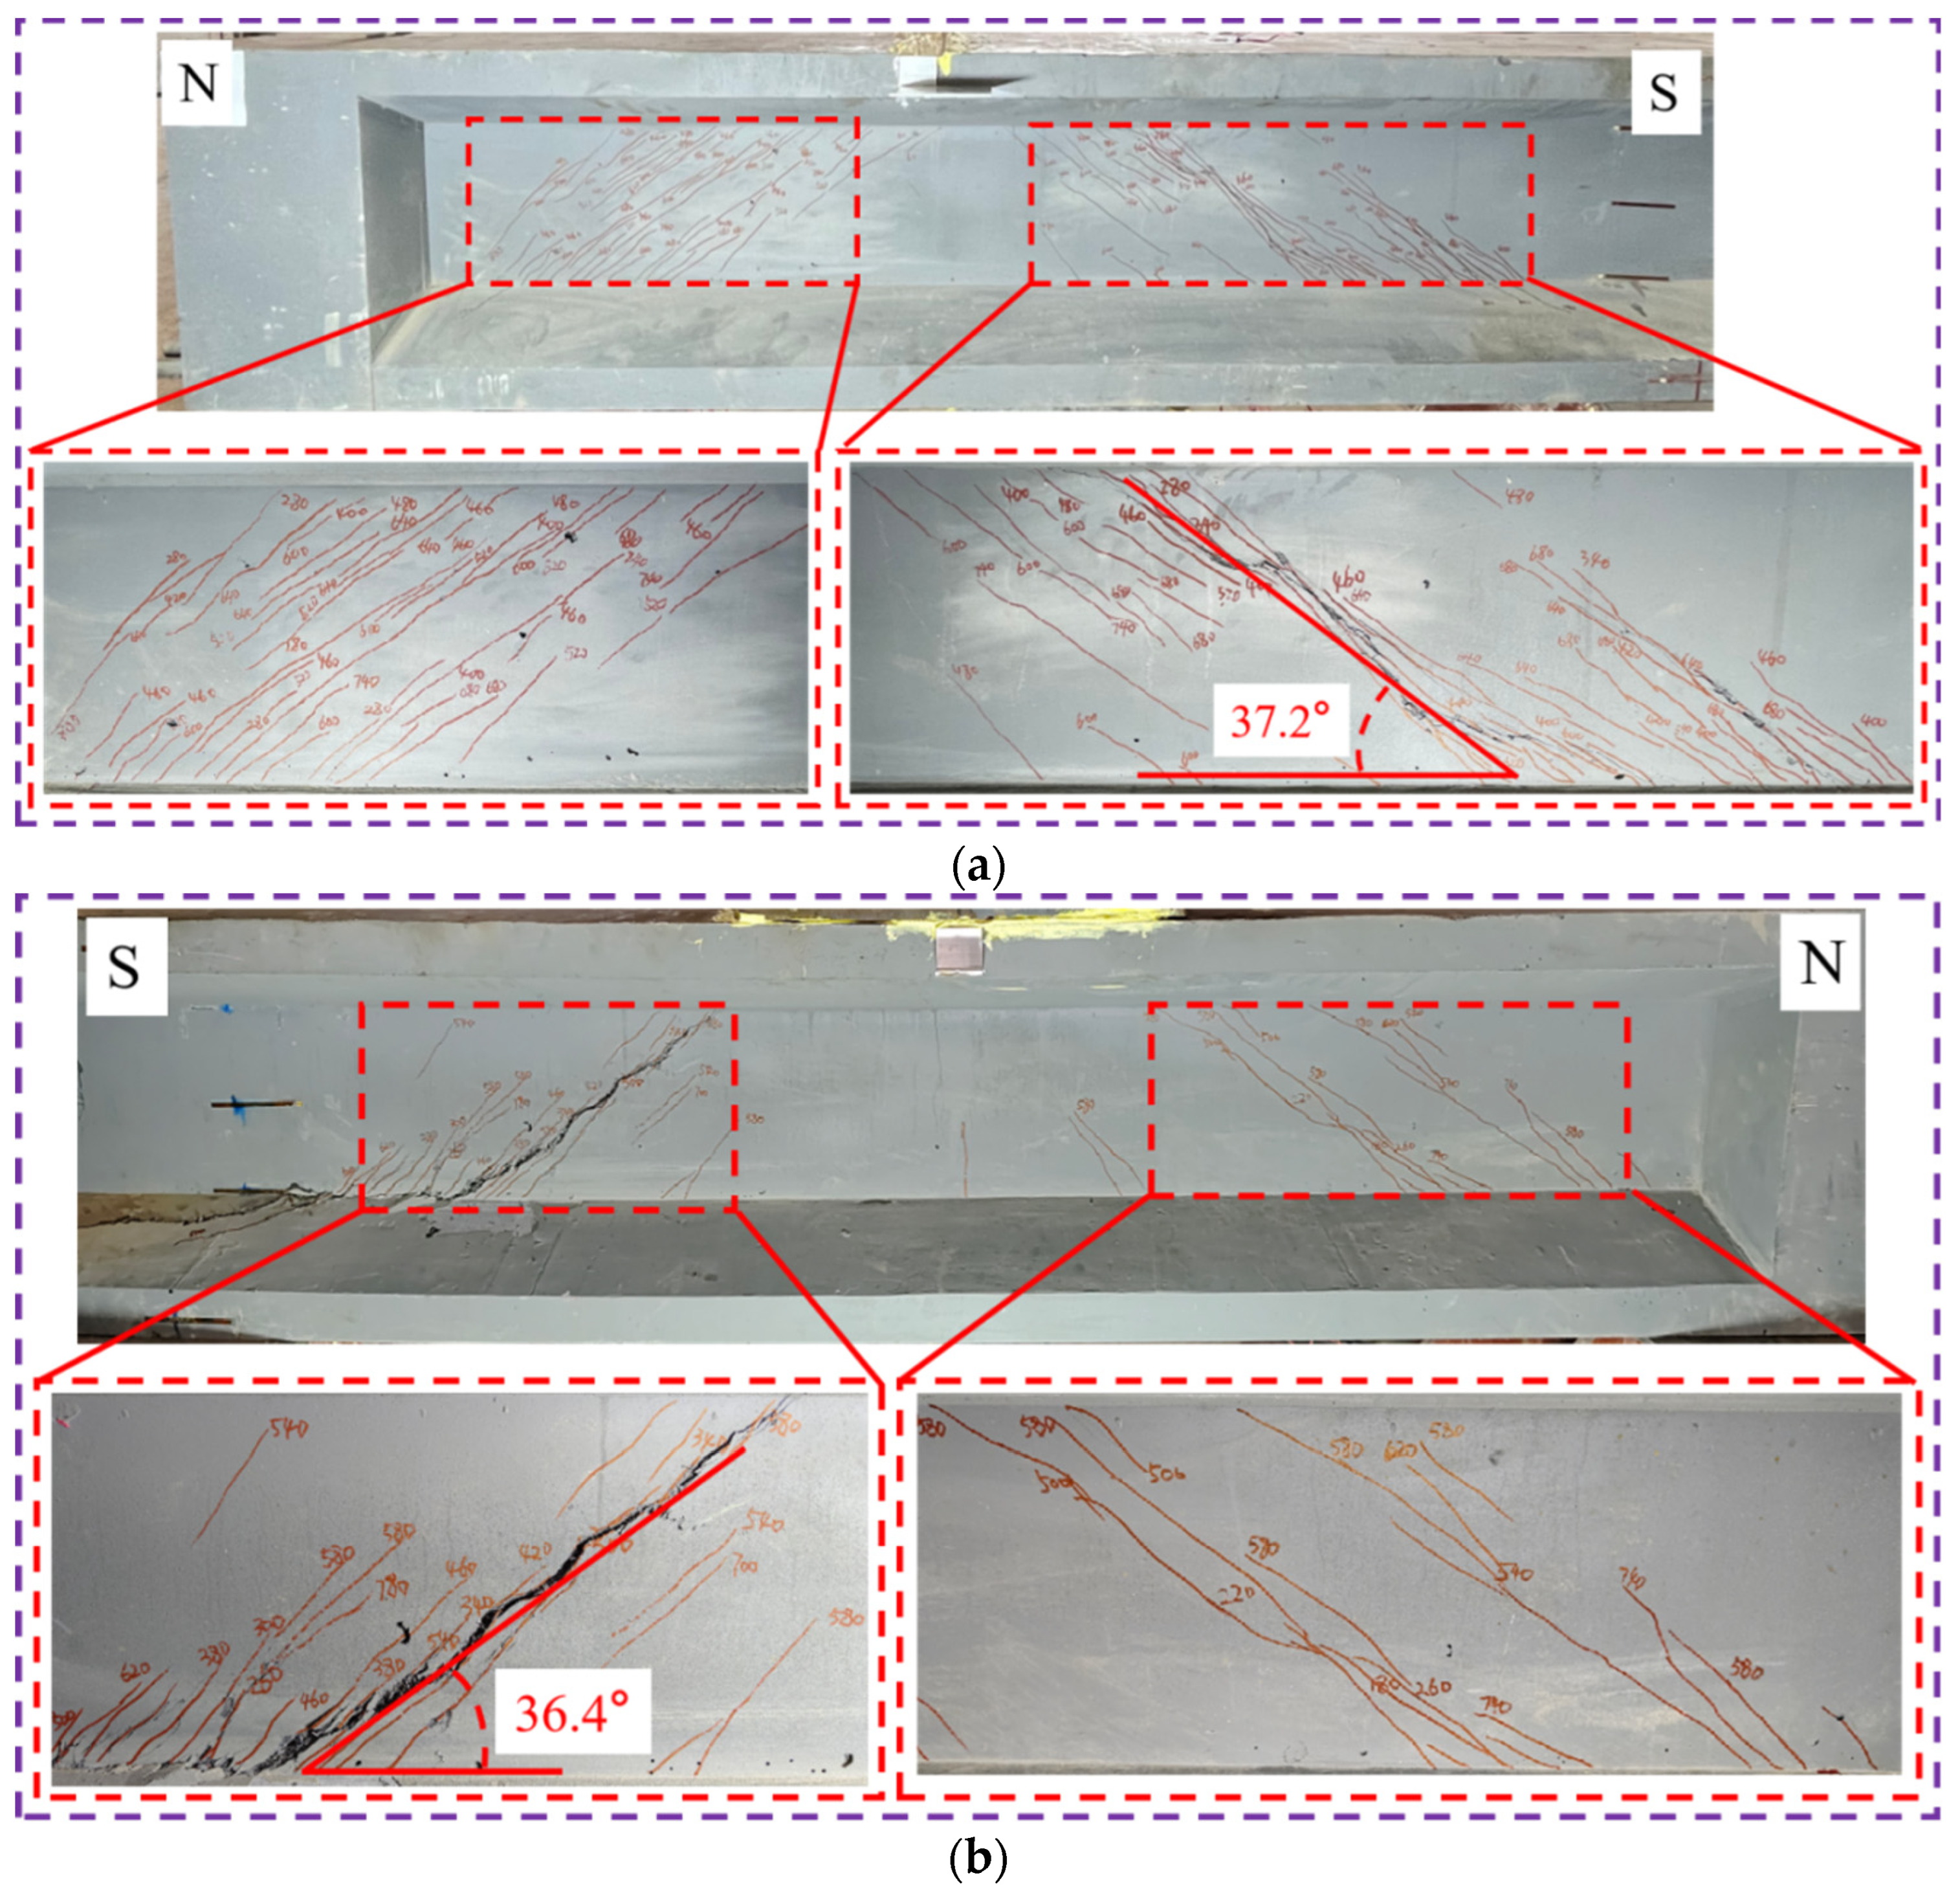
Figure 6 shows the failure patterns and crack distributions of the two I-shaped UHPC beams during the shear tests. Both beams failed in shear along diagonal critical cracks originating from the S-side flexural-shear zones.
For the T-UI1-S-2.0-R400 beam (Figure 6a), all cracks were diagonal shear cracks in the flexural-shear zones, with no bending cracks observed. The first diagonal crack appeared in the N-side web at 280 kN. Subsequent loading generated dense, parallel diagonal cracks, with one evolving into a critical crack that propagated horizontally along the upper web-flange concrete interface. The failure mode was identified as shear-compression failure. The diagonal angle of the critical crack was 37.2°.
For the T-UI2-S-2.0-R400 beam (Figure 6b), the first diagonal crack formed in the N-side web at 180 kN. Further loading produced fewer diagonal cracks compared with T-UI1-S-2.0-R400, but the critical crack similarly developed in the S-side flexural-shear zone, extending horizontally along the inferior web-flowing concrete interface. This failure was also classified as shear-compression failure. Notably, no significant concrete crushing occurred near the loading points in either shear test. The diagonal angle of the critical crack was 36.4°.

3.5.3. Deflection Development in Flexural Test Beams

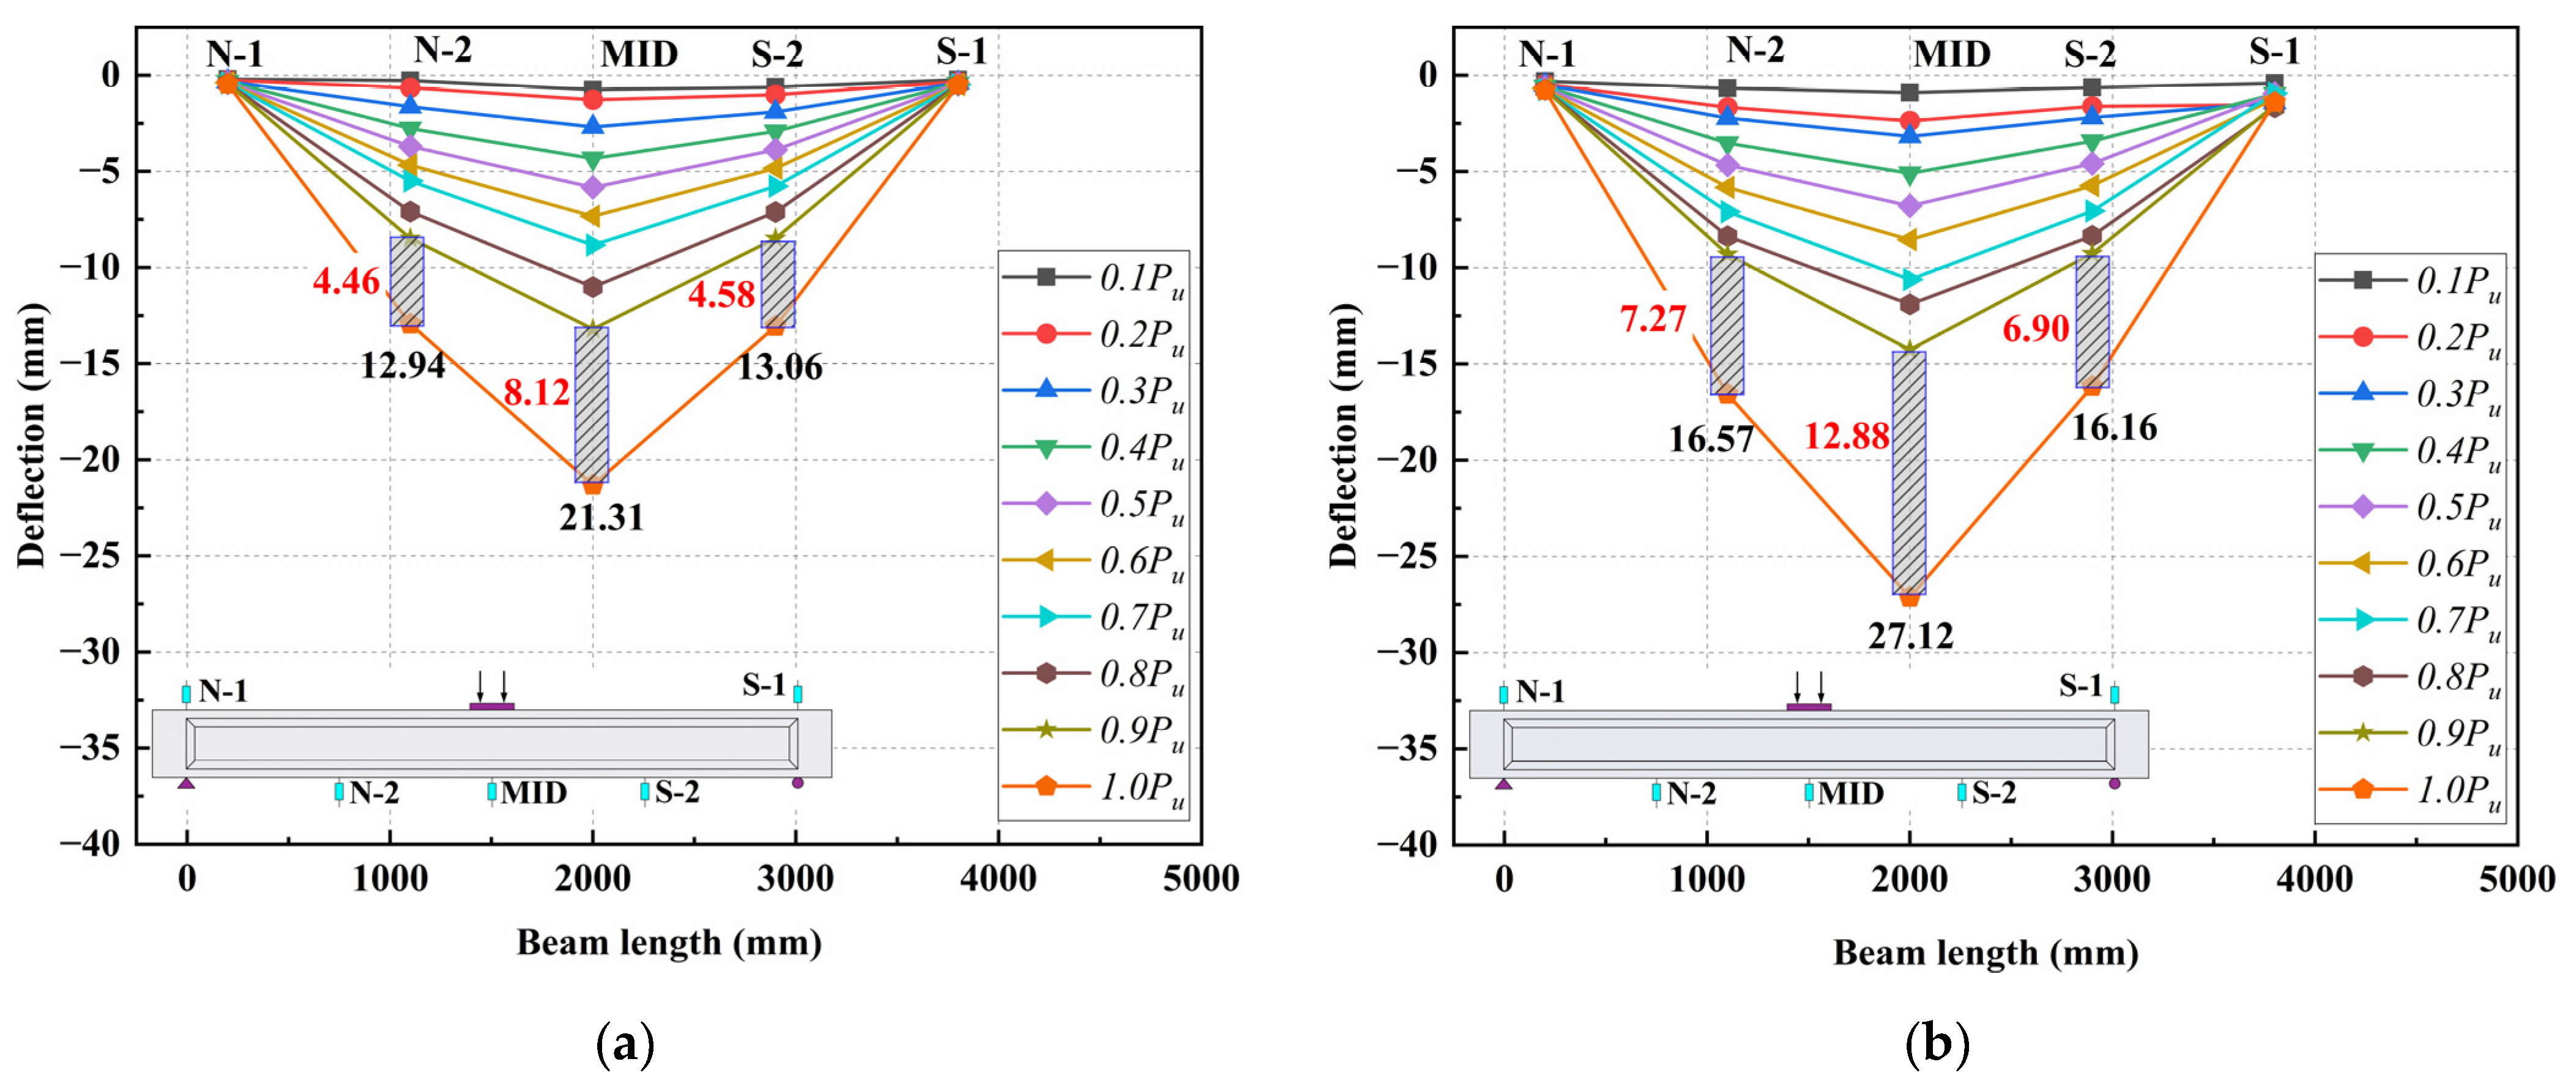
Figure 7 illustrates the deflection variations along the length of the test beams during the flexural tests. The data reveal that the deflection exhibited significant mid-span symmetry, with the majority of deformation concentrated in the mid-span region. This deformation trend initially followed a linear growth pattern. However, as the load increased from 0.9 times the ultimate load to the ultimate load-bearing capacity, the deflection markedly accelerated compared with the pre-phase of 0.9 times. This indicates that 0.9 times the ultimate load serves as a critical threshold for deflection behavior. The observed rapid deflection growth aligns with the slowed load increase in the later test stages. This phenomenon is primarily attributed to the synergistic interaction between the bridging effect of steel fibers and the longitudinal tensile reinforcement, which enhanced the beam’s ductility. Beyond the 0.9-time threshold, the widening of bending cracks led to progressive pull-out of steel fibers, diminishing their bridging effectiveness. It can be inferred that the longitudinal reinforcement yielded in this phase led to an acceleration in deflection growth. This inference is further supported by the finite element analysis presented in Section 4, which clearly indicates yielding of the reinforcement.

3.5.4. Analysis of Load Versus Mid-Span Deflection Curves

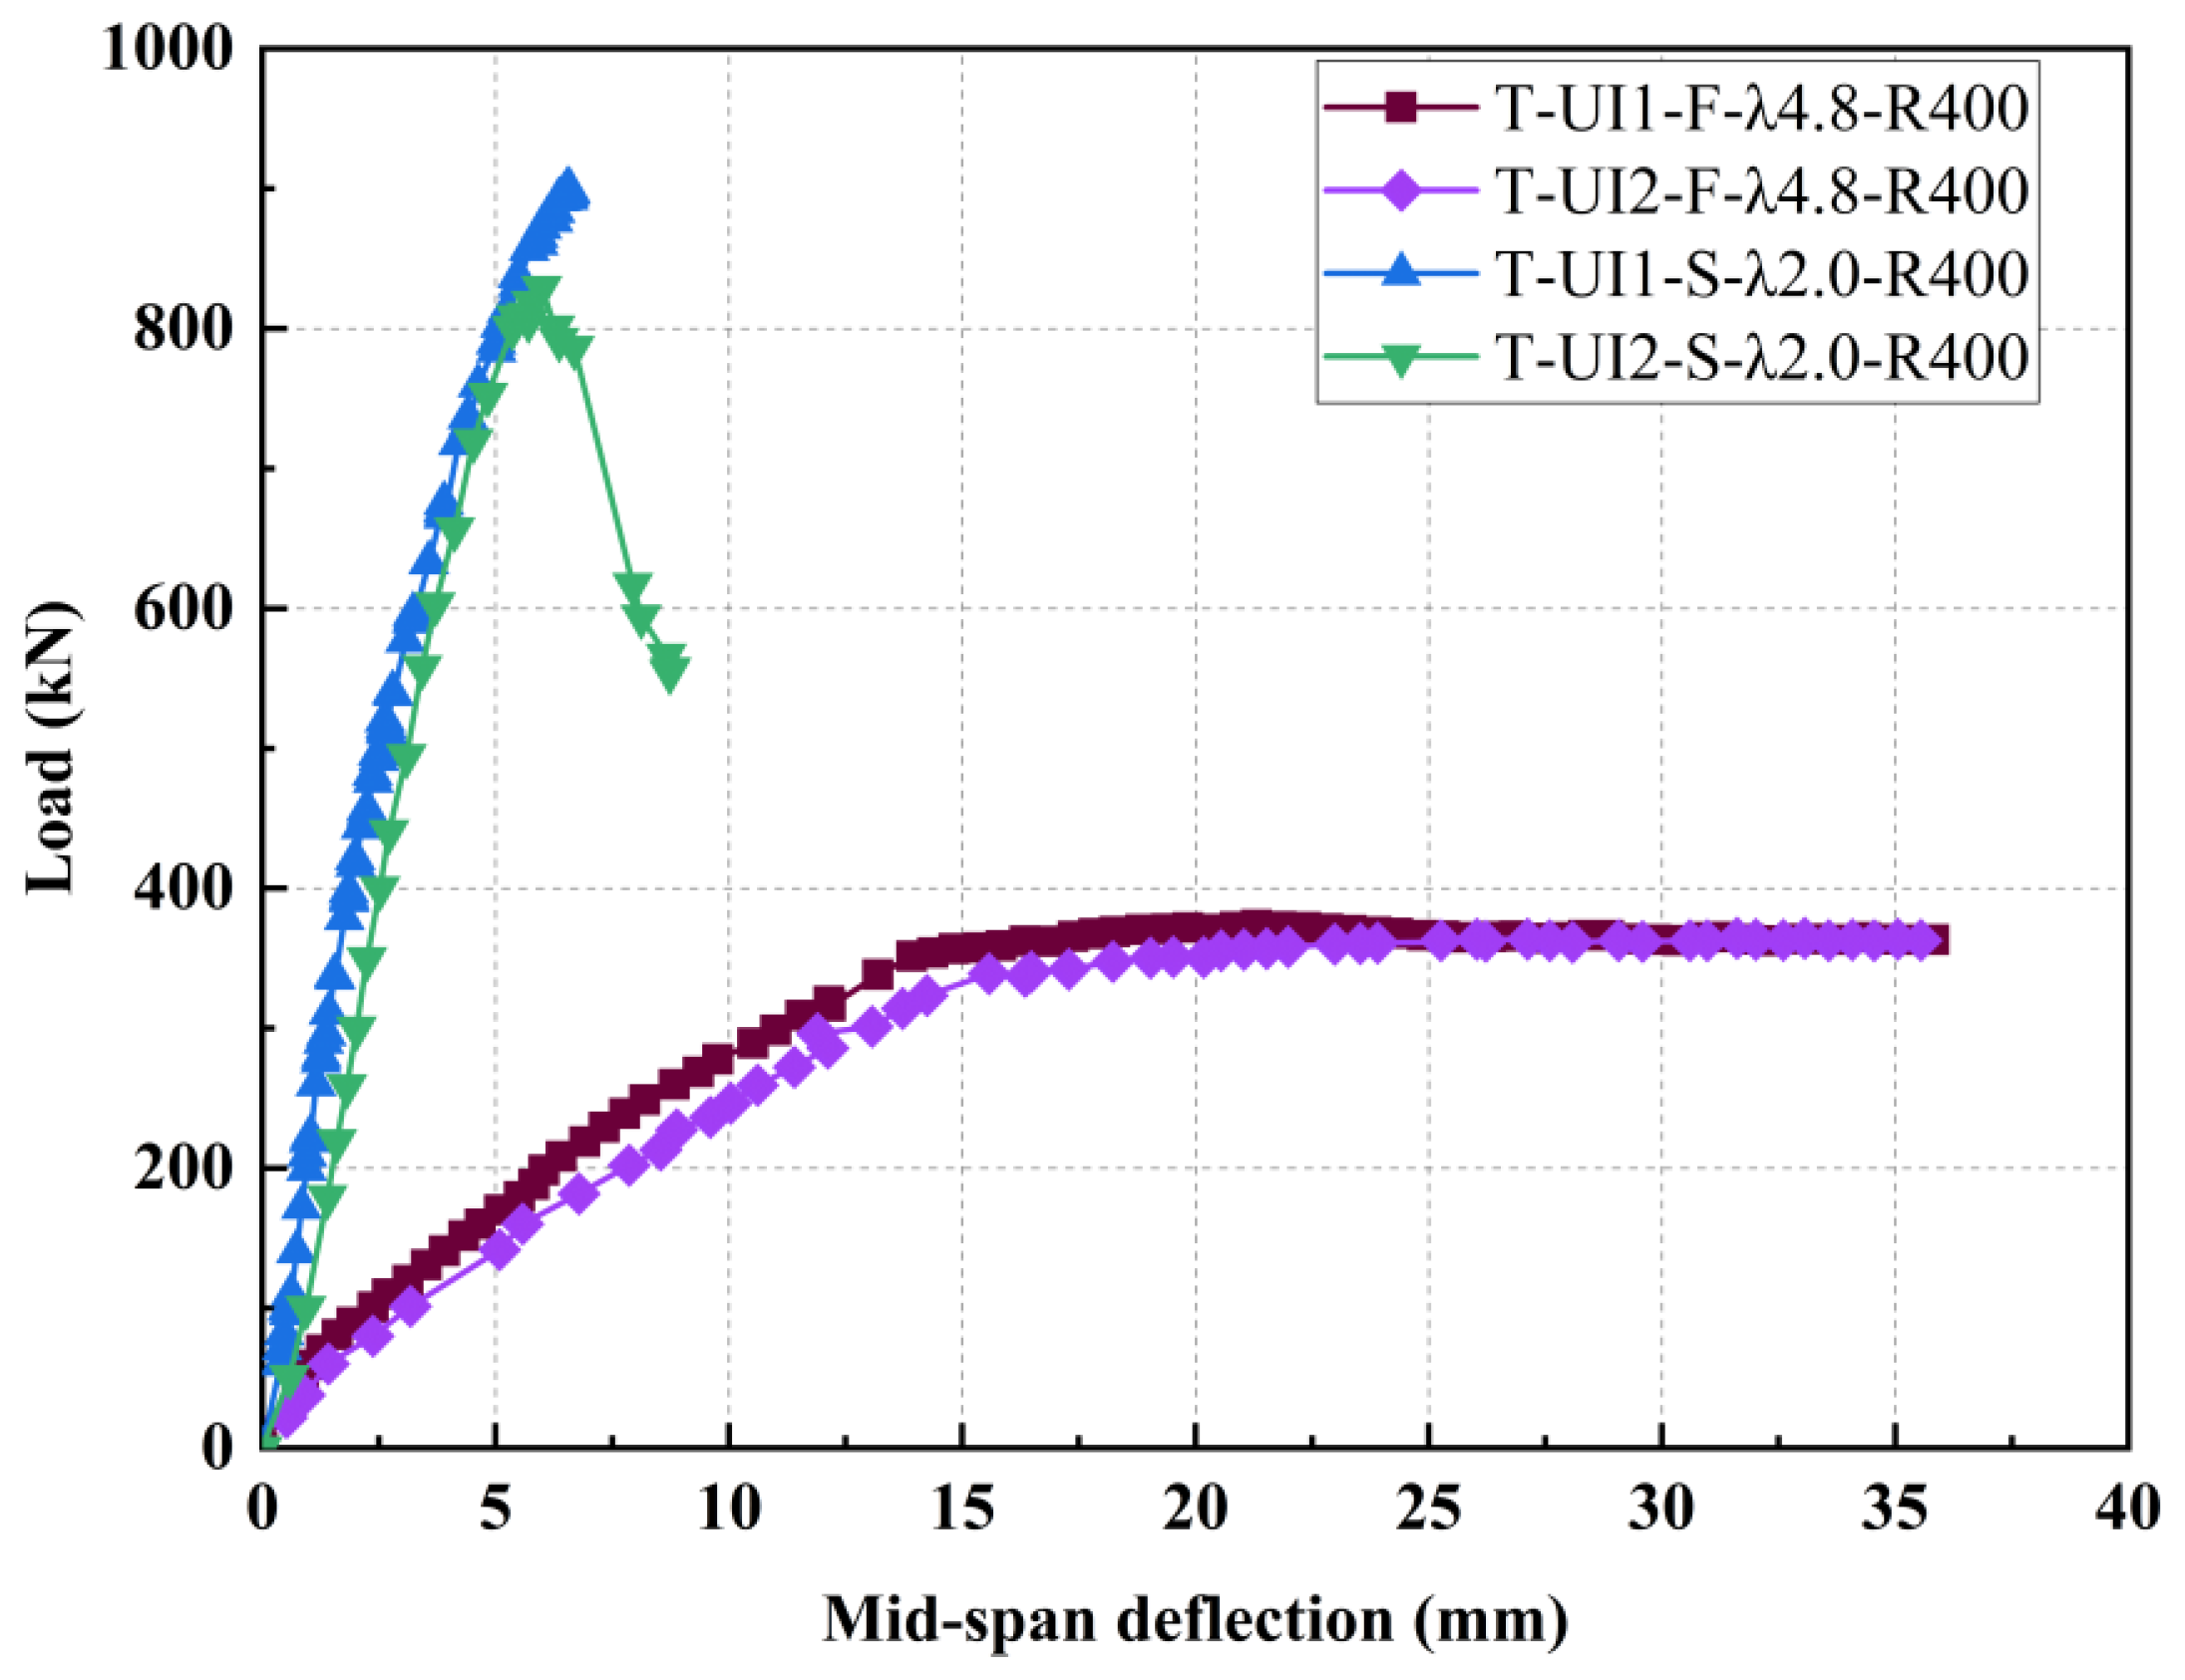
Figure 8 presents the load versus mid-span deflection curves from two flexural tests and two shear tests. The curves for the two flexural tests overlap closely, as do those for the two shear tests, indicating low test errors. The shear test curves exhibited a distinct descending branch after peak load. In the later stages of the flexural tests, the curves plateaued horizontally, demonstrating the excellent ductility of the beams under flexural loading.

3.5.5. Concrete Strain Analysis

(1)
Flexural tests
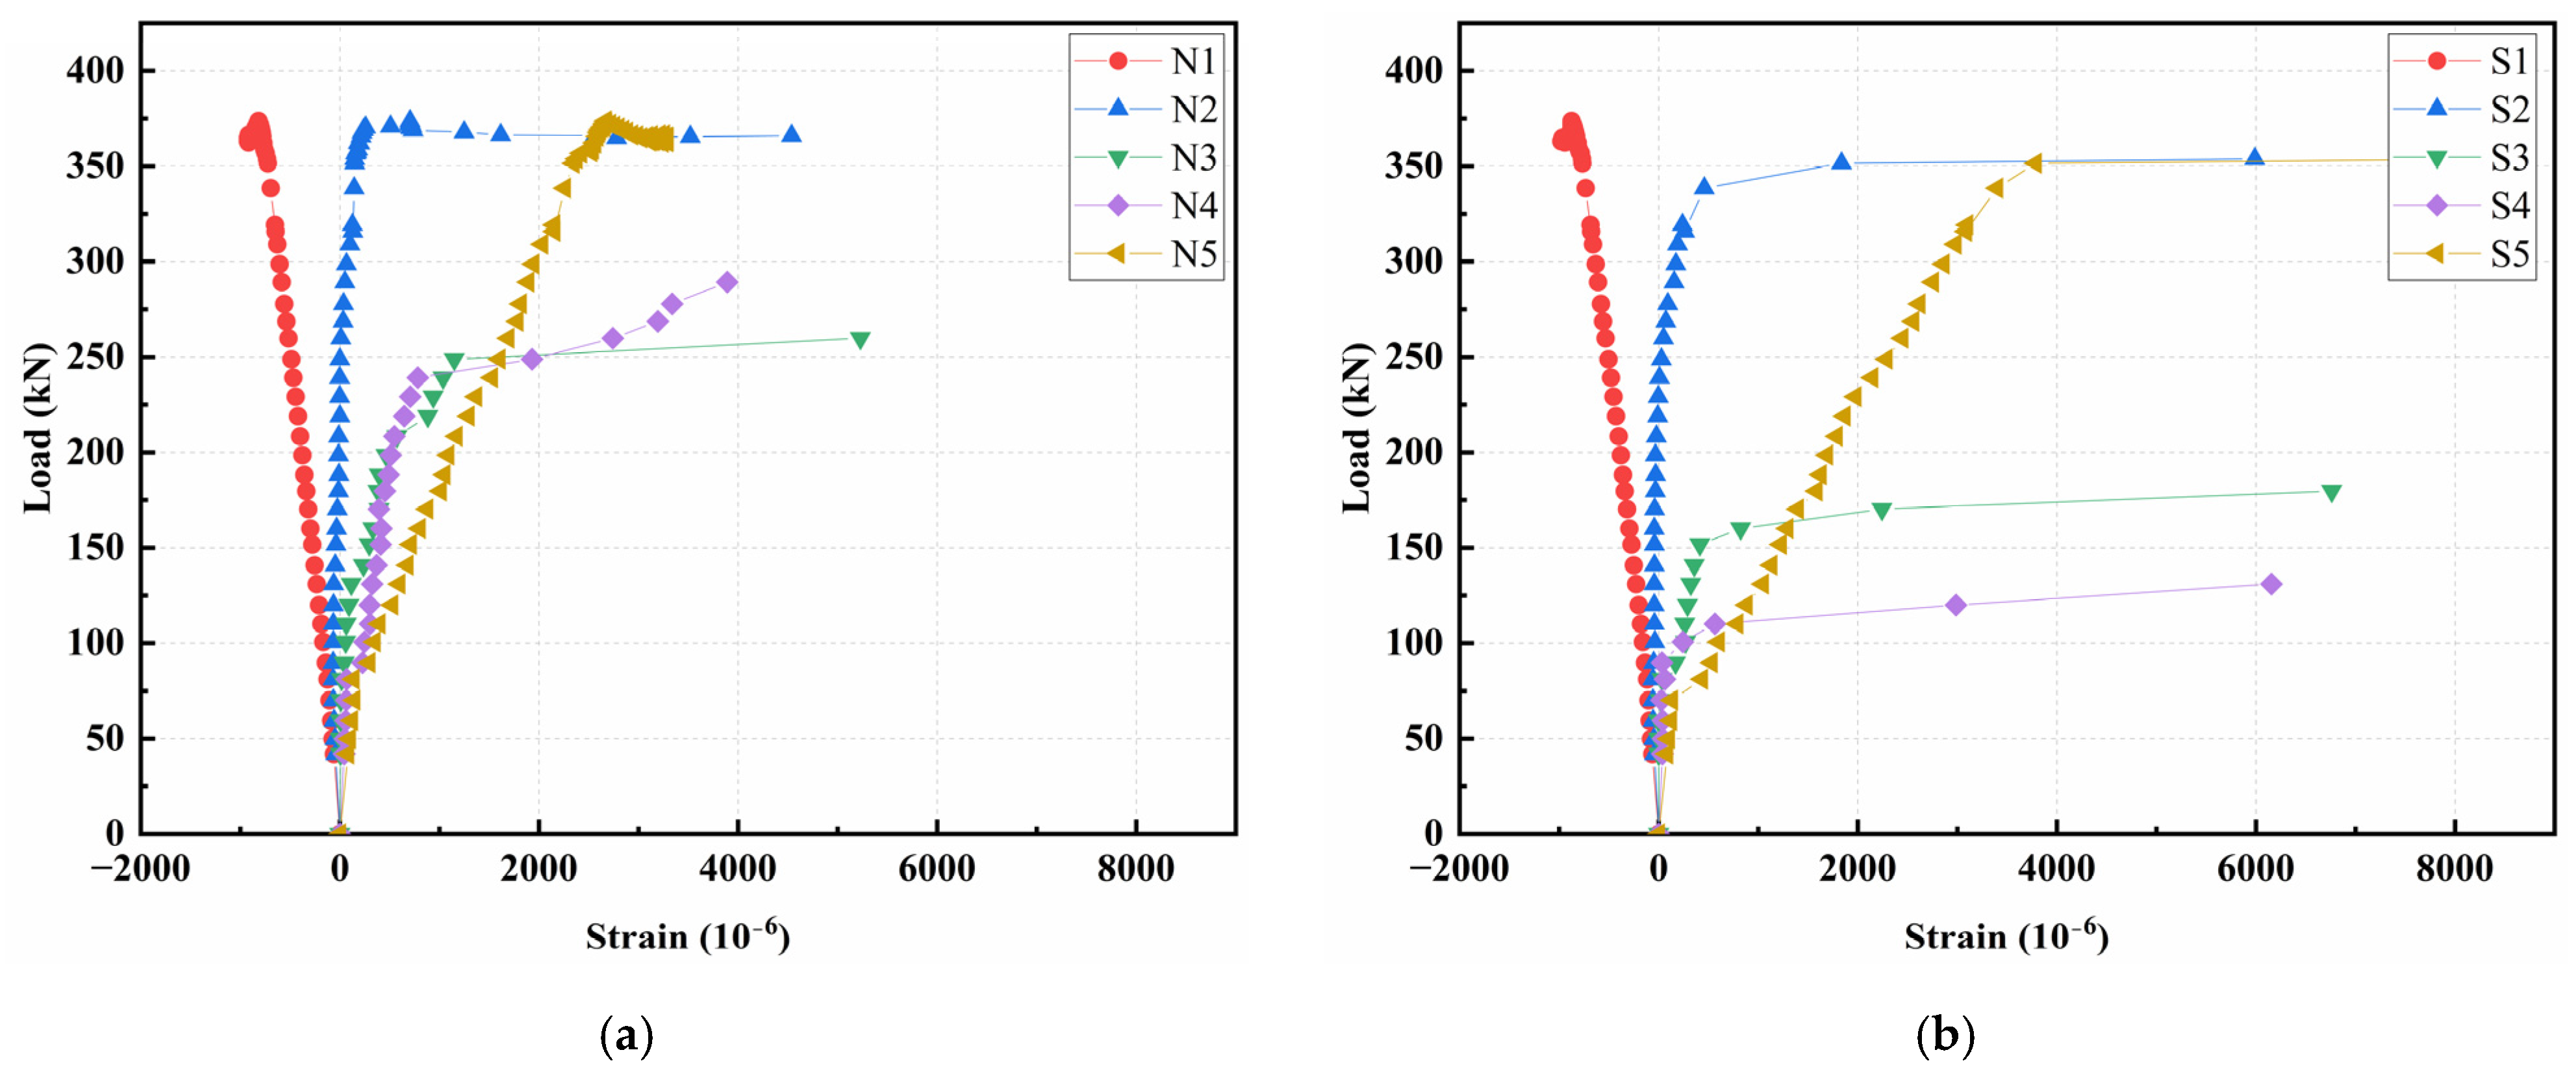
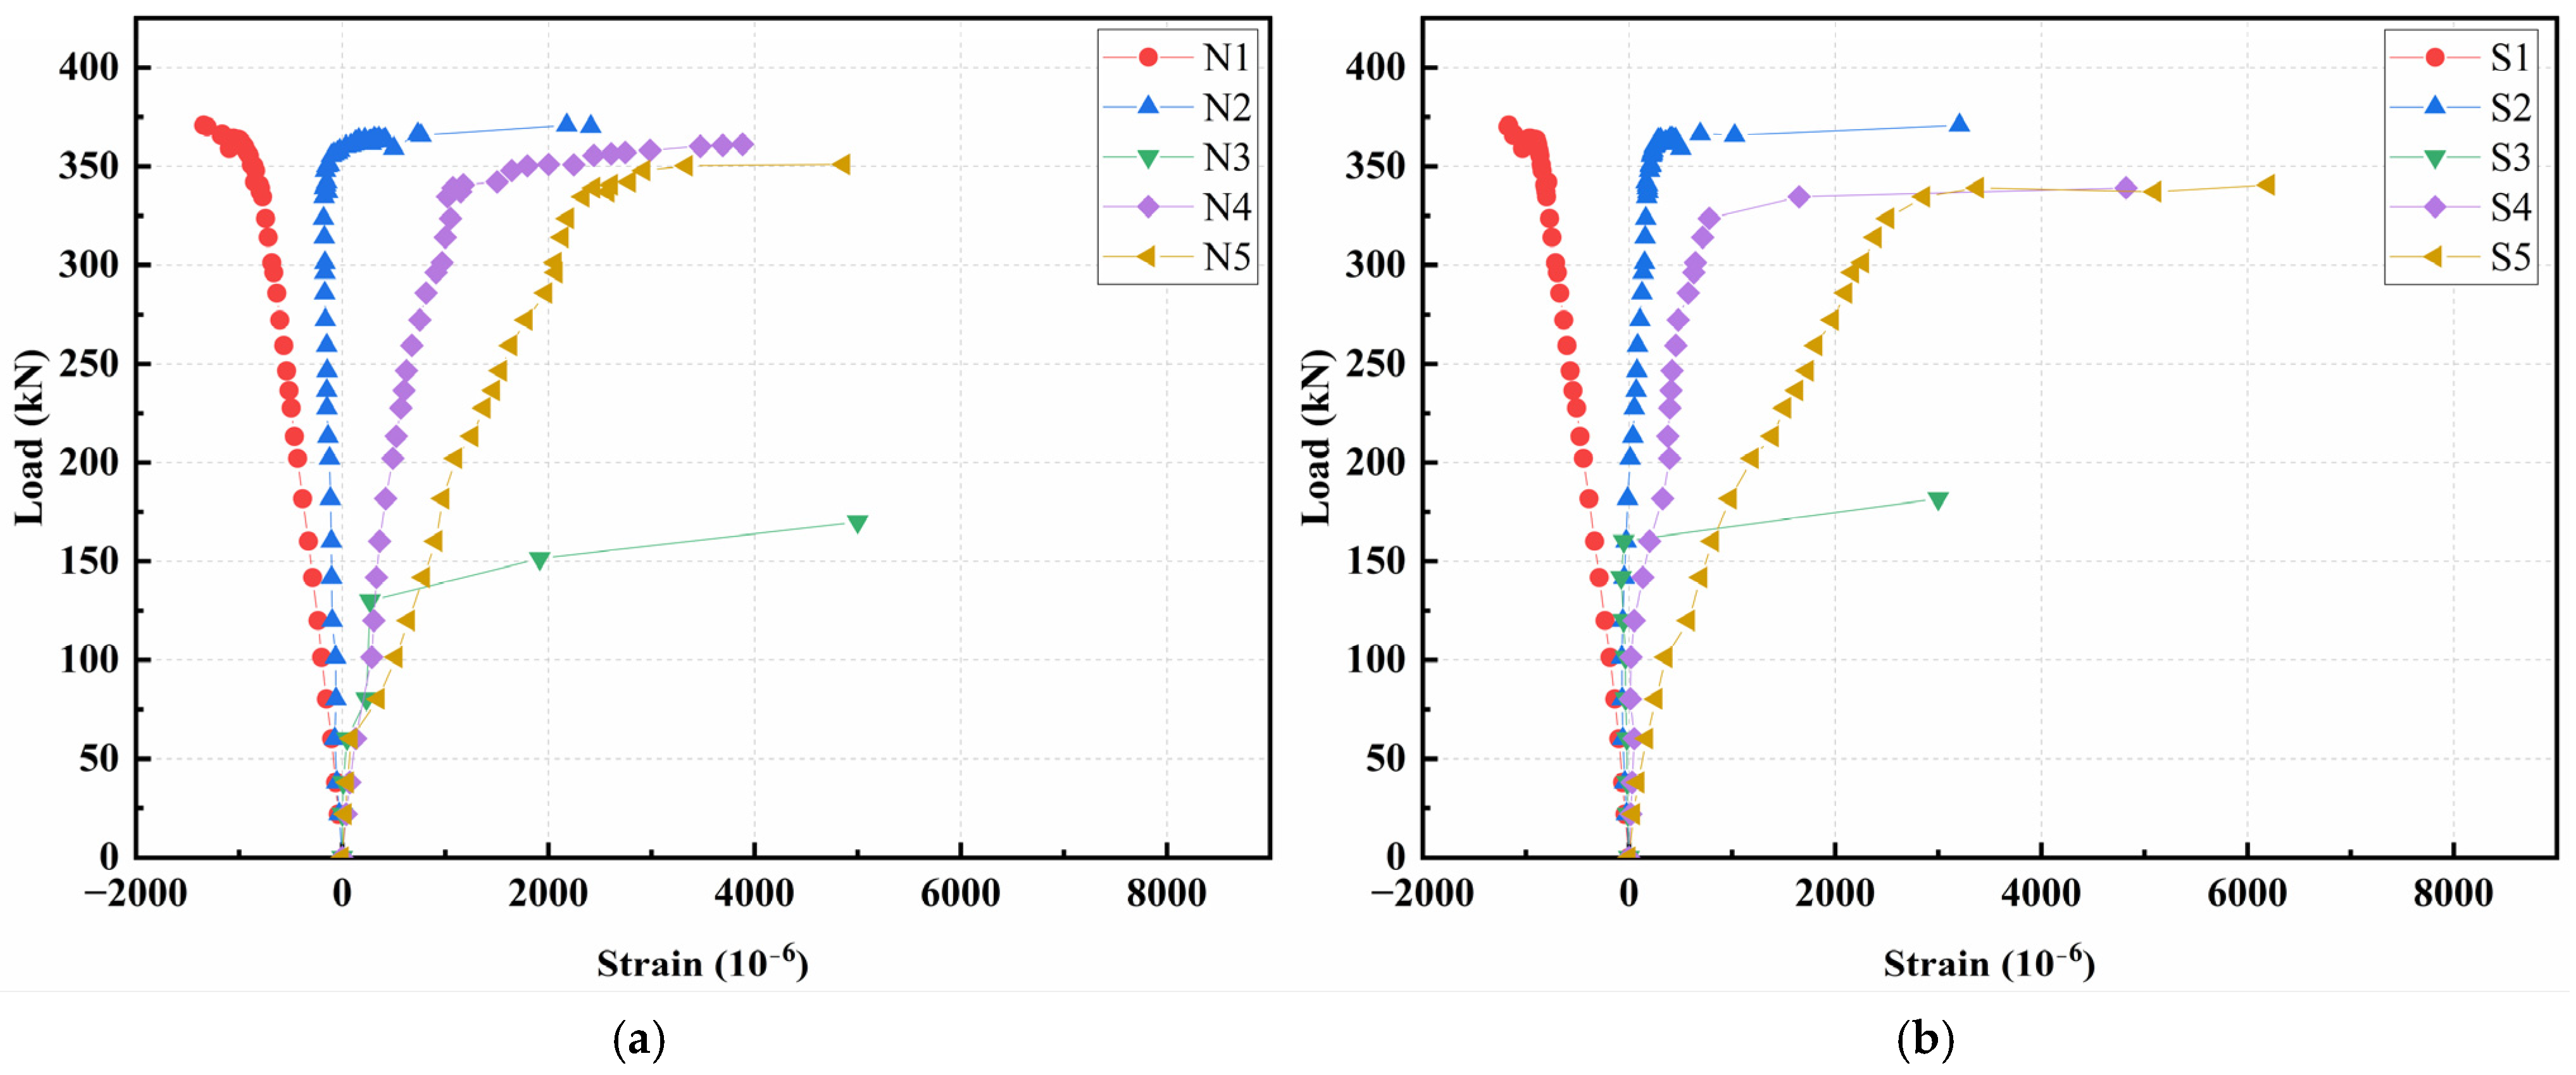
Figure 9 and Figure 10 show the concrete strain evolution at the N-side and S-side cross-sections near the loading points of the two test beams under flexural loading. The strain generally increased linearly with load. Concrete at the N1 position remained in compression, while strain at N2 showed minimal variation. Positions N3–N5 were predominantly in tension. As loading progressed, bending cracks initiated and propagated upward, causing abrupt strain changes at N2–N5 due to strain gauge failure at crack intersections. Notably, positions N3, N4, S3, and S4 (particularly N3 and S3 at the mid-web) exhibited sudden strain increase, indicating crack initiation and propagation. This aligns with experimental observations where cracks first appeared at the beam bottom and extended into the web.
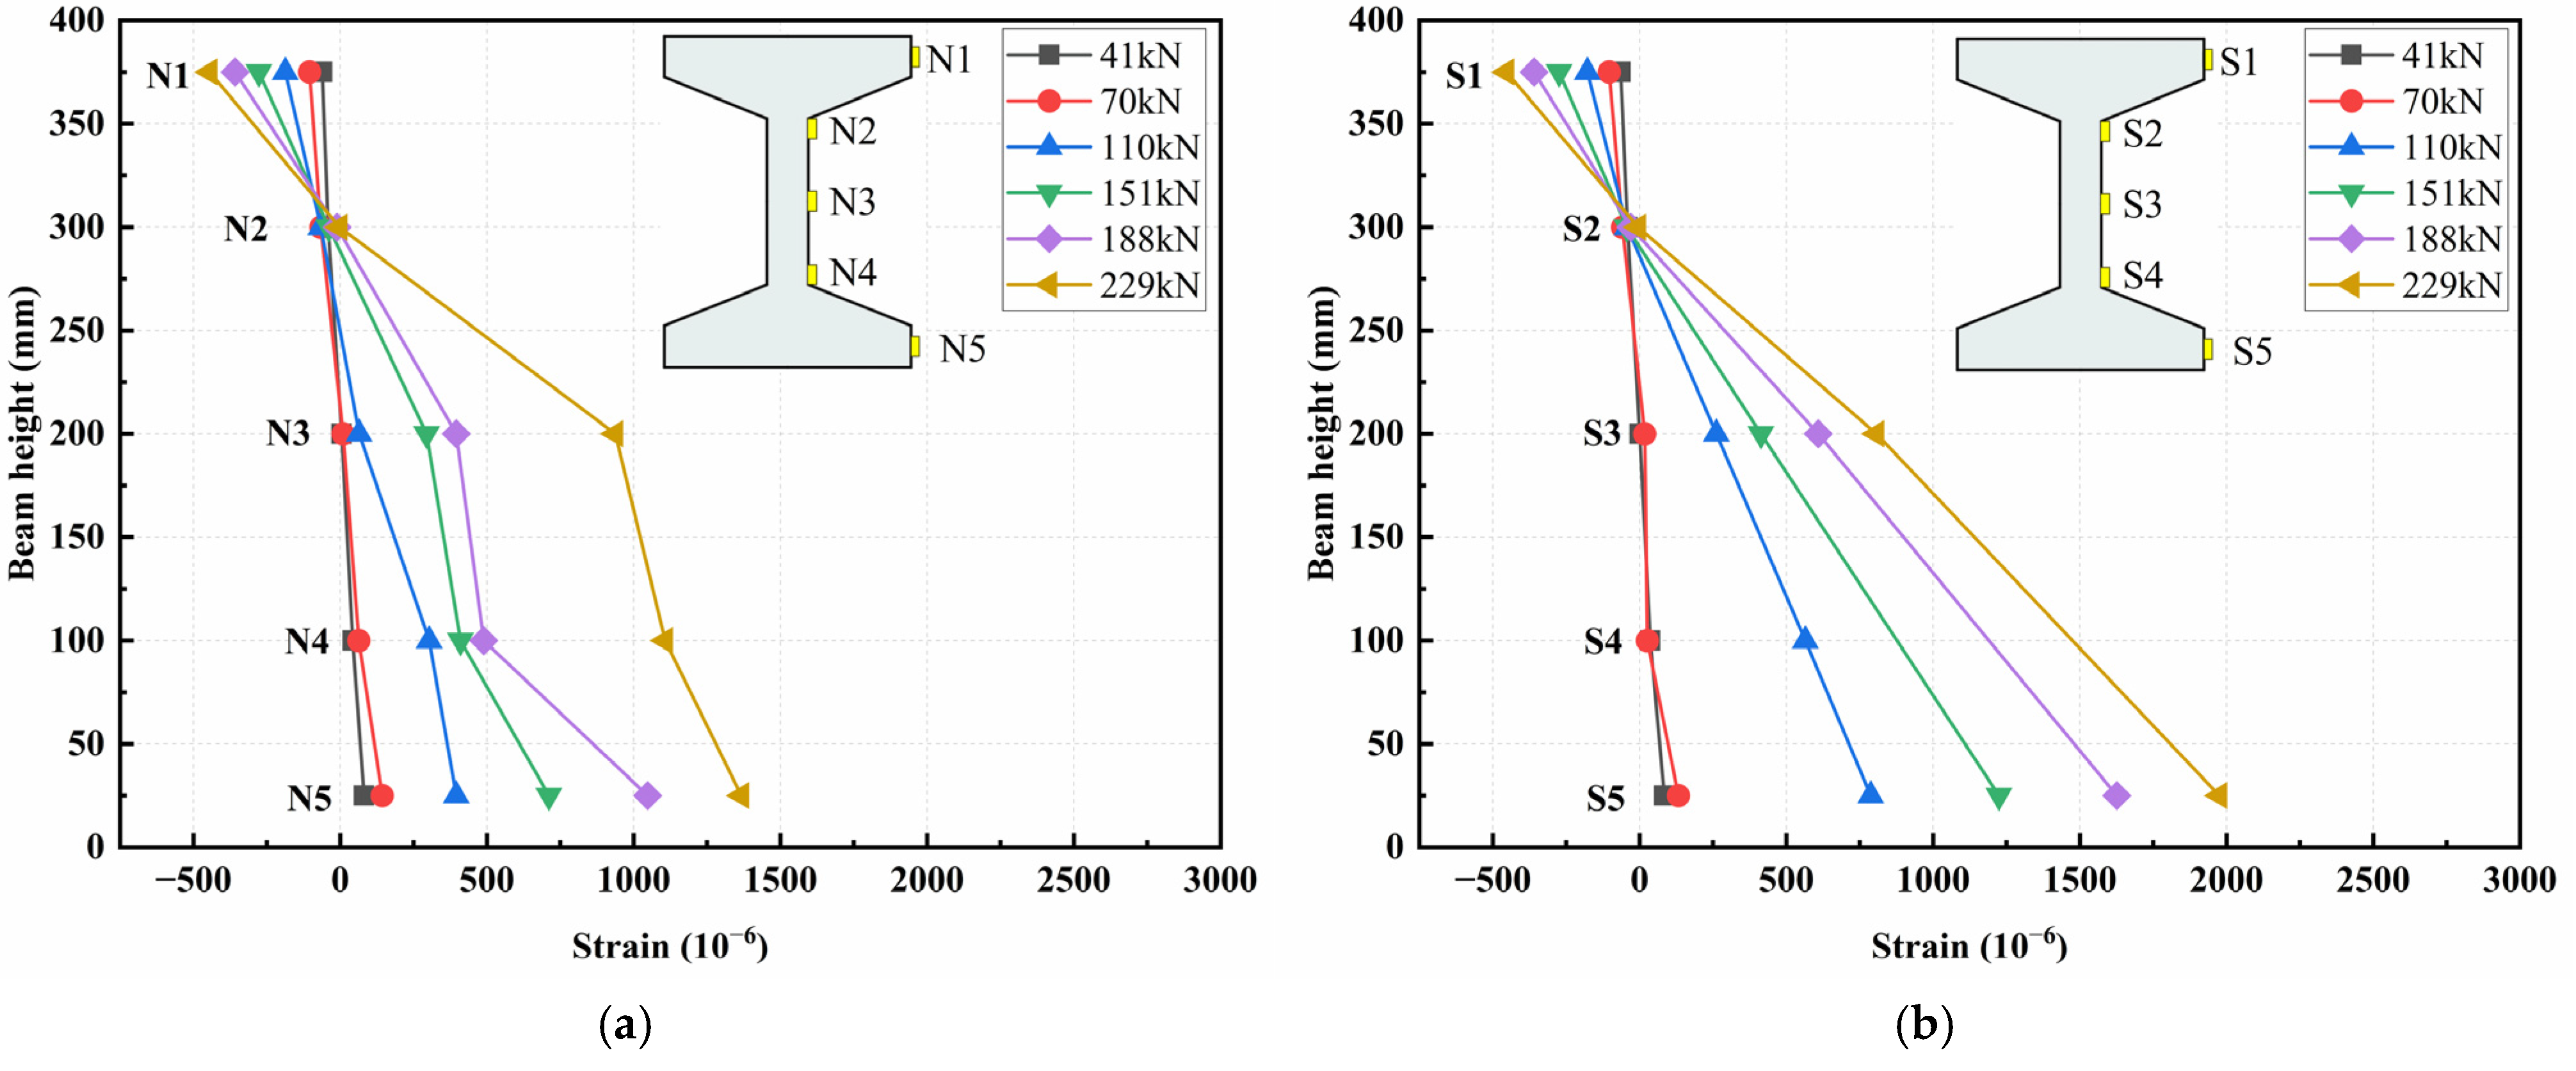
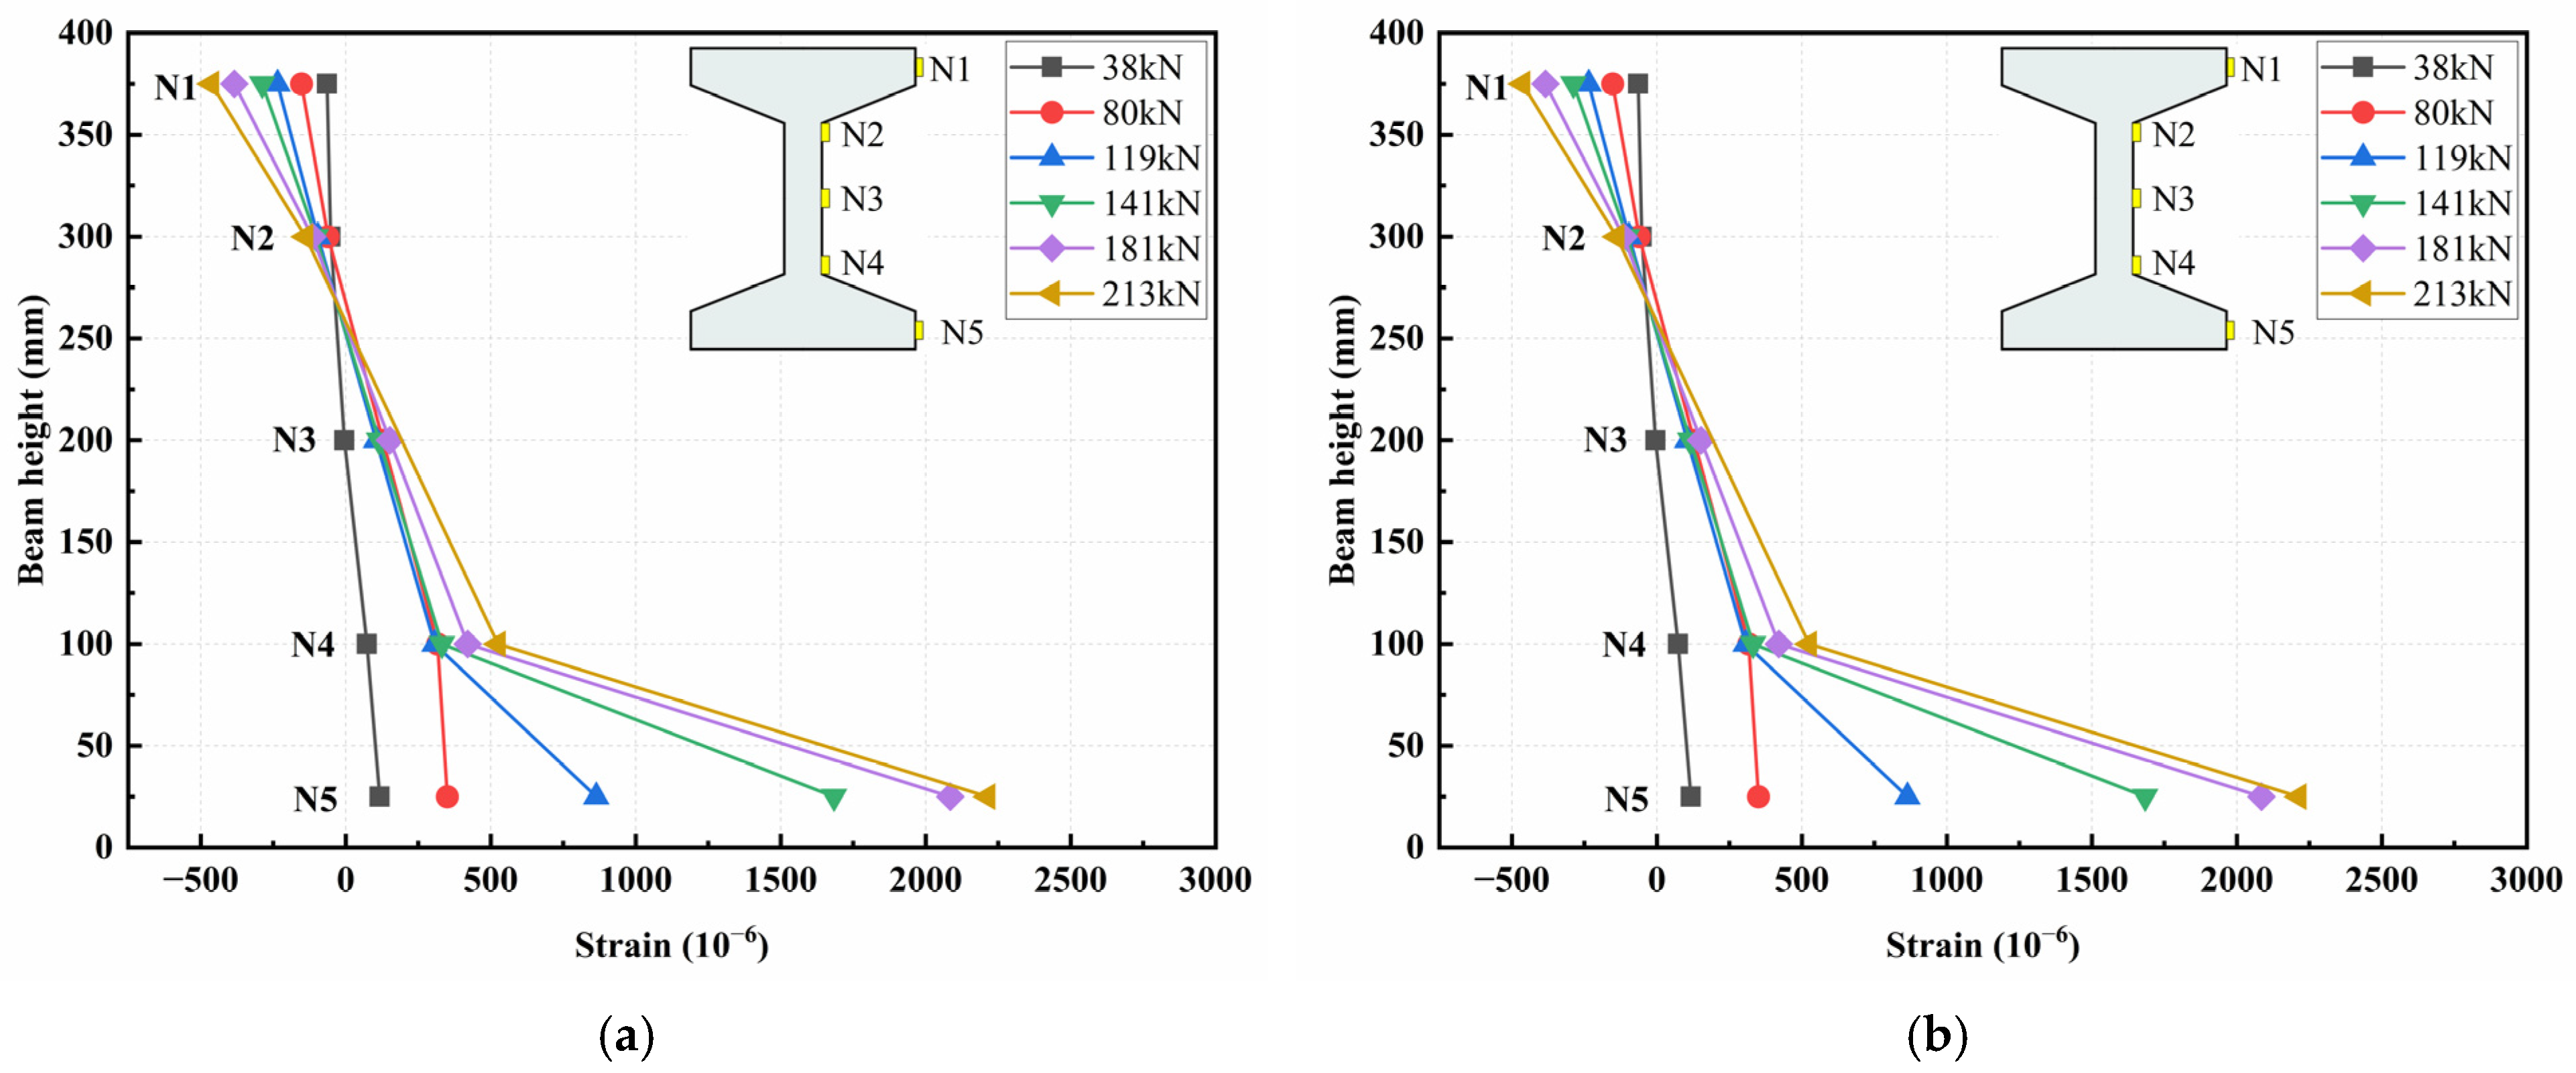
Figure 11 and Figure 12 illustrate the concrete strain distribution along the beam height at the N-side and S-side cross-sections. The strain distribution near the loading points generally conformed to the plane section assumption, with the neutral axis located approximately 300 mm from the beam bottom.
In summary, the concrete strain near the loading points increased linearly with load during flexural tests. Cracks concentrated in the web region due to its reduced thickness, and the strain distribution approximately followed the plane section assumption, with the neutral axis located at the interface between the upper flange and web.
(2)
Shear tests
Figure 13 shows the longitudinal concrete strain evolution at the S-side cross-sections near the loading points of the two test beams in shear tests. For the T-UI1-S-2.0-R400 beam, position 1 (upper flange) and position 5 (lower flange) experienced the highest compressive and tensile strains, respectively. Position 3 transitioned from minimal strain to compression at approximately 300 kN, while positions 2 and 4 (web-flange junctions) remained in tension, because their load-strain curves exhibited irregular fluctuations due to unpredictable crack propagation. For the T-UI2-S-2.0-R400 beam, the longitudinal strains in the N-side web cross-section increased linearly with load. Positions 1 and 2 showed negligible strain changes that may be unfunctional compared with other locations; position 5 remained in tension (consistent with T-UI1-S-2.0-R400); position 3 (web) was predominantly in compression; and position 4 transitioned to compression near 300 kN. The complex stress state in the web during shear tests arises from continuous stress redistribution caused by irregular crack growth.
Figure 14 presents the load versus principal strain curves derived from strain rosettes A, B and C. Principal tensile and compressive strains were calculated using Equation (6):
ε t ε c = ε x + ε y 2 ± ( ε x ε y 2 ) 2 + ( ε x + ε y 2 ε 45 ° ) 2 ,
where ε x , ε 45 ° , and ε y are the strain values measured by strain gauges oriented at 0°, 45°, and 90°, respectively. Positive results indicate principal tensile strain, while negative values denote principal compressive strain.
The principal strains in the N-side web increased linearly with load until abrupt jumps occurred when cracks intersected the rosettes. For T-UI1-S-2.0-R400, rosettes B predominantly experienced principal tensile strain, while rosettes A had both principal compressive and tensile strains. For T-UI2-S-2.0-R400, rosettes A and C were subjected to principal tensile strain, while rosette B illustrates both compressive and tensile strains.

4. Finite Element Analysis on Shear Behaviors of Stirrup-Free I-Shaped UHPC Beams

4.1. Abaqus Finite Element Models

This section employs the finite element analysis software ABAQUS(v2024) to establish a numerical model for analyzing the shear behavior of concrete beams.
Firstly, developing finite element models based on the test beam dimensions, experimental parameters, material properties, boundary conditions, and loading protocols. The simulation results are compared to experimental data (e.g., failure patterns, load versus mid-span deflection curves, ultimate load-bearing capacity) to validate the model’s accuracy.
Secondly, expanding the validated FEMs to investigate the effects of shear span-to-depth ratio and longitudinal reinforcement strength on the shear performance of stirrup-free I-shaped UHPC beams.

4.1.1. Material Constitutive Relationships

(1)
Concrete material
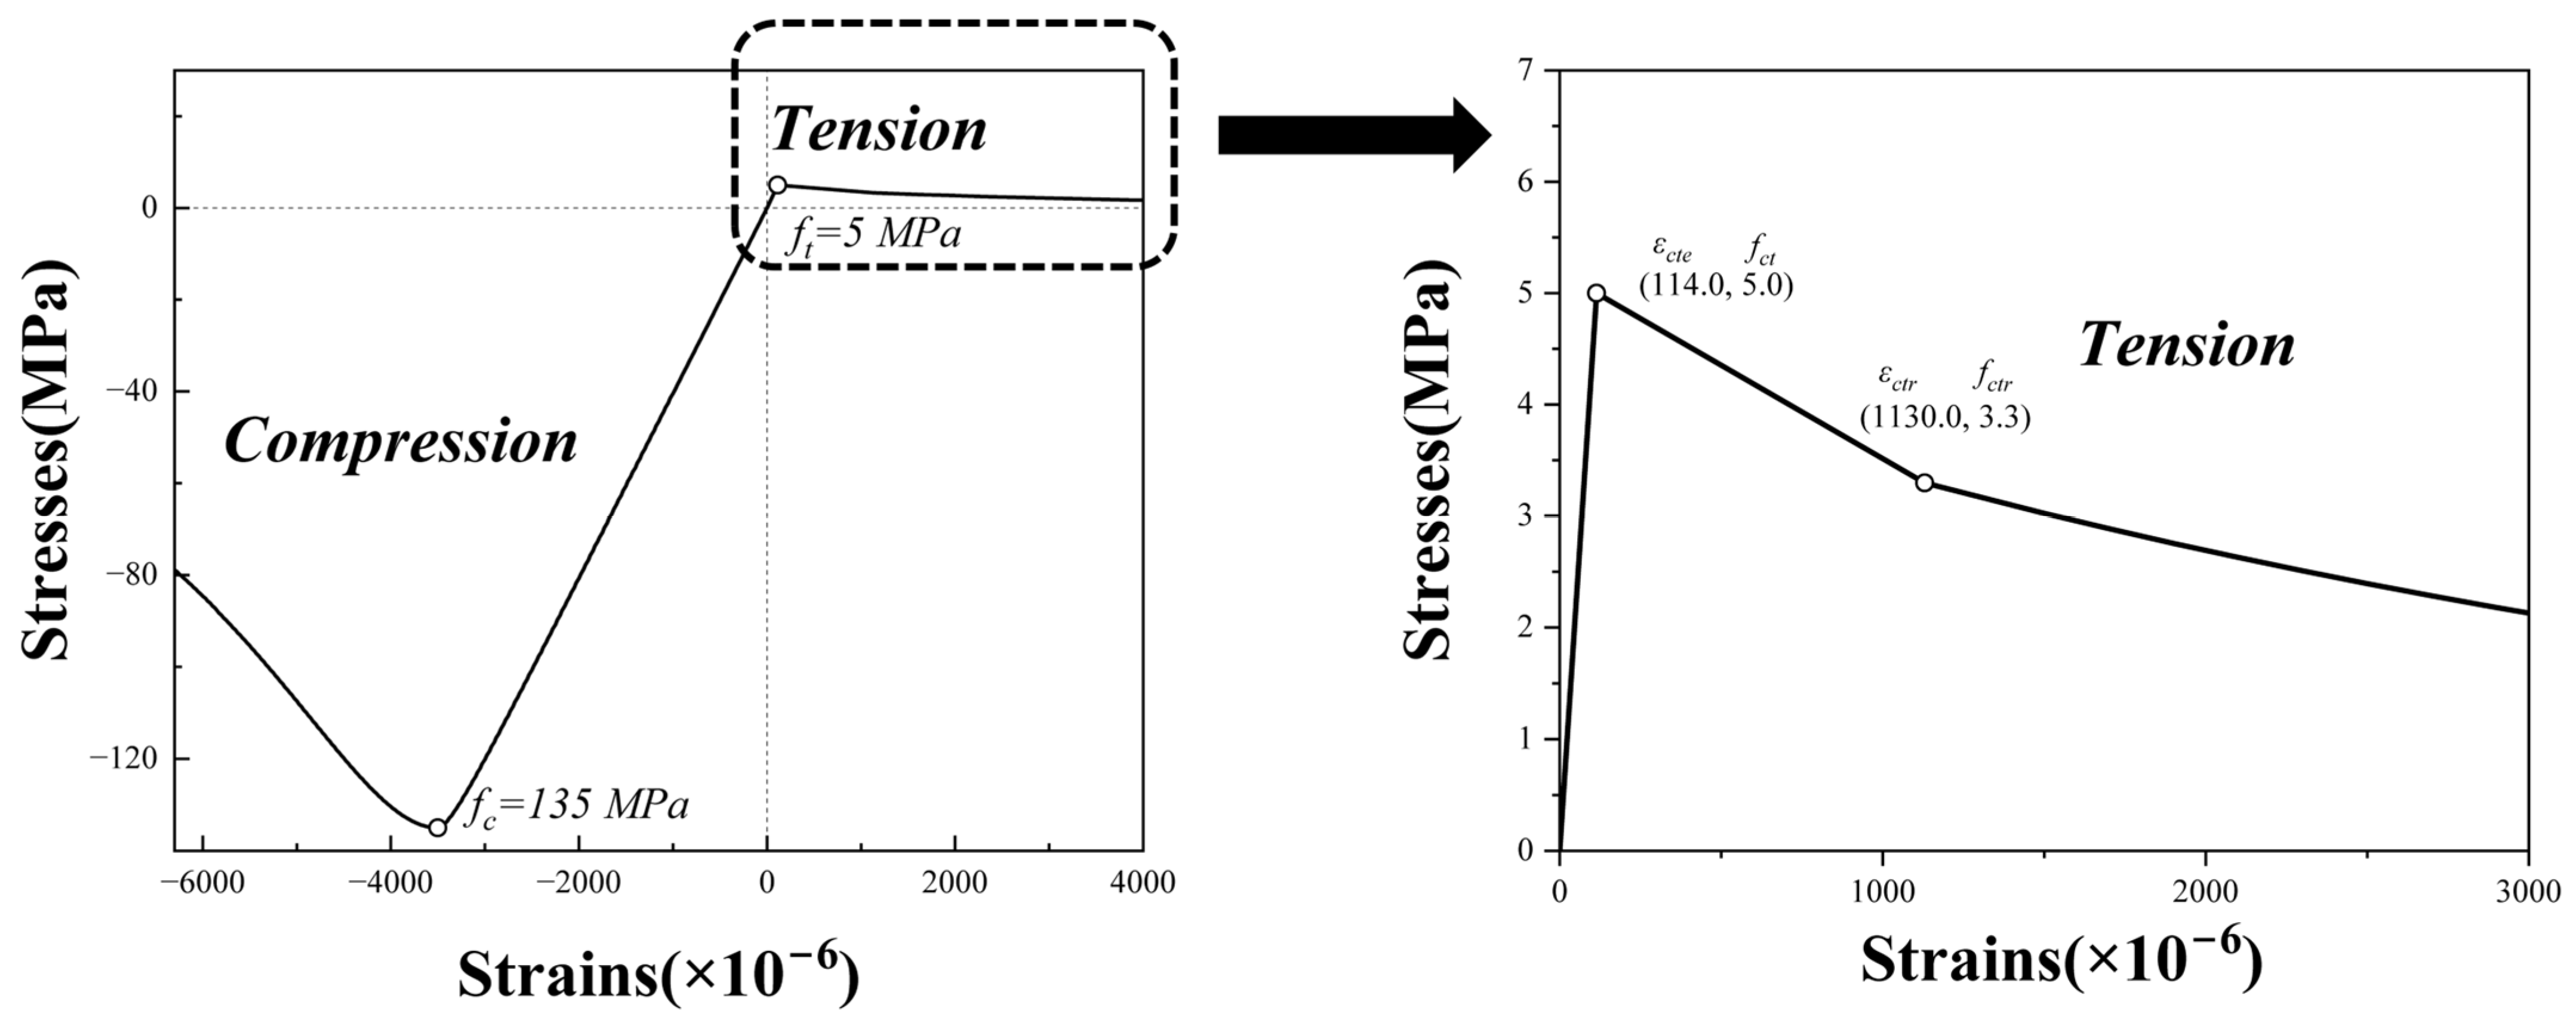
This study adopts the curve-fitting equation proposed by Yang Jian et al. [39] to represent the uniaxial compressive stress-strain relationship of UHPC, as shown in the following Equation (7).
σ c = f c n ξ ξ 2 1 + ( n 2 ) ξ , ε ε 0 f c ξ 2 ( ξ 1 ) 2 + ξ , ε > ε 0 ,
ξ = ε ε 0 ,
n = E c E s ,
where f c represents the axial compressive strength of UHPC, taken as 135 MPa; ε is the compressive; σ c is the compressive stress; ε 0 is the peak strain of UHPC, taken as 3095 × 10 6 ; E c is the initial elastic modulus, taken as 45 GPa; and E s is the secant modulus, taken as 43.62 GPa.
The uniaxial tensile stress–strain relationship of UHPC adopts the formula recommended by Reference [40], as shown in the following Equation (10).
σ c t = f t ε c t e ε c t                                                                                                                                                             0 < ε c t < ε c t e f c t + f c t r     f c t ε c t r     ε c t e · ε c t ε c t e                                                                 ε c t e < ε c t < ε c t r f c t × 1 + c 1 ε c t     ε c t e ε c t , m a x 3 e c 2 ε c t ε c t e ε c t , m a x                                                     ε c t r < ε c t ,
where f c t represents the tensile strength of UHPC, taken as 5 MPa; ε c t e is the tensile strain at the tensile strength, taken as 114 × 10 6 ; f c t r represents the residual tensile strength of UHPC, taken as 3.34 MPa; ε c t r is the characteristic strain at residual tensile strength, taken as 1130 × 10 6 ; and ε c t , m a x represents the maximum tensile strain, taken as 0.0325. c 1 and c 2 asare the curve-fitting parameters, which are taken as c 1 = 50 , c 2 = 7.8 .
The constitutive relationship of UHPC obtained from the above equations is shown in Figure 15.
This paper adopted the proportional strain method to calculate the UHPC damage factor [41]. In Abaqus, the UHPC plasticity parameters are set according to Reference [42]. Table 5 details the UHPC plasticity parameters used in this section’s finite element model analysis. Our finite element simulations and parametric studies are based on macroscopic structural parameters. So, we adopted a holistic approach by calibrating the constitutive relationships in our model to implicitly reflect the overall influence of these complex experimental factors. This strategy allows the model to deliver engineering-level accuracy that aligns with the objective of addressing industry-driven requirements, even though it does not fully capture every detailed physical aspect of the actual loading process.
(2)
Reinforcing steel material
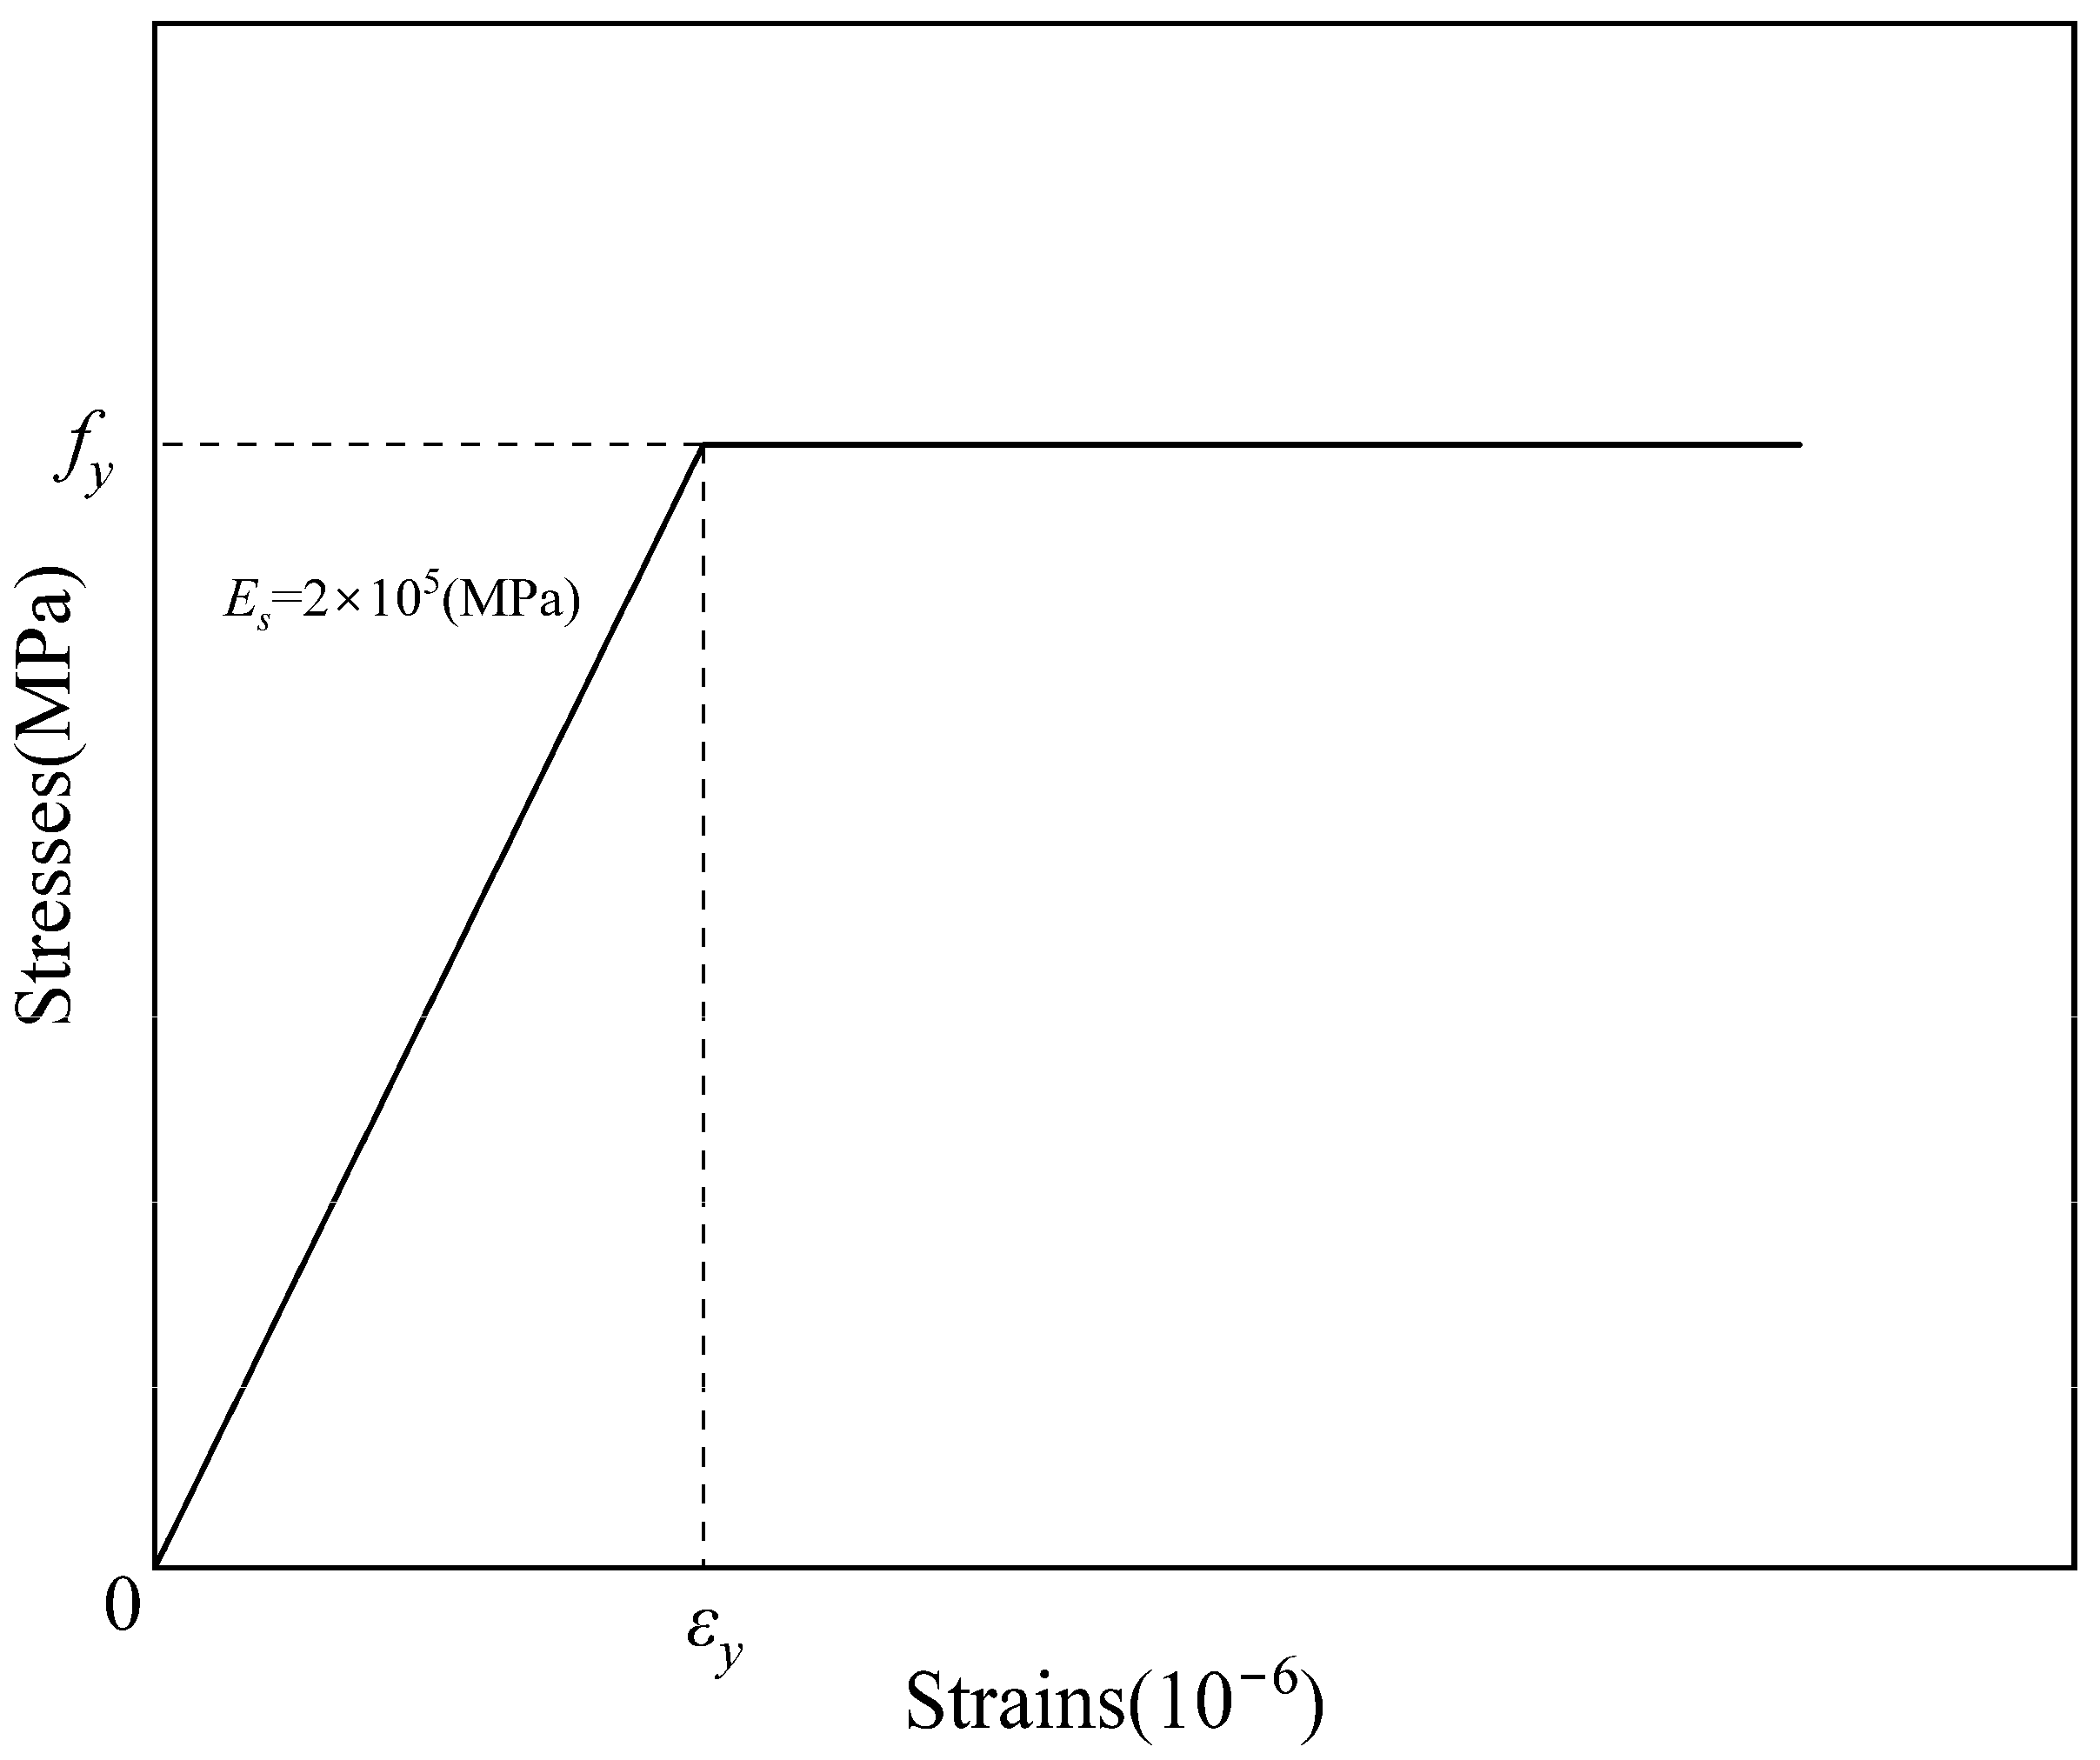
In the finite element model, the constitutive relationship of reinforcing steel is idealized as linear elastic-perfectly plastic, as shown in the following Equation (11). The stress-strain relationship is shown in Figure 16. The material parameters of reinforcing steel used in the analysis are listed in Table 6.
σ s = E s ε s , ε s ε y f y , ε s ε y ,
where the following is true:
  • E s —Elastic modulus of reinforcing steel;
  • ε s —Yield strain of reinforcing steel;
  • f y —Yield stress of reinforcing steel.

4.1.2. Model Establishing

(1)
Element type selection
In the finite element model, C3D8R (8-node linear brick elements with reduced integration) were selected for both the concrete beam and the loading steel plates [43,44,45,46]. This element type effectively avoids shear locking under bending loads, ensures displacement accuracy, and minimizes sensitivity to mesh distortion during large deformations. For the steel reinforcement, T3D2 (3D truss elements with two nodes) were adopted [26,46]. The T3D2 elements allow flexible geometric definition of reinforcement bars (e.g., diameter, length, position) to better simulate real-world reinforcement layouts. Their simplicity enhances modeling efficiency, while explicit material property definitions (e.g., elastic modulus, Poisson’s ratio, yield stress) improve simulation accuracy and reliability.
(2)
Contact definitions
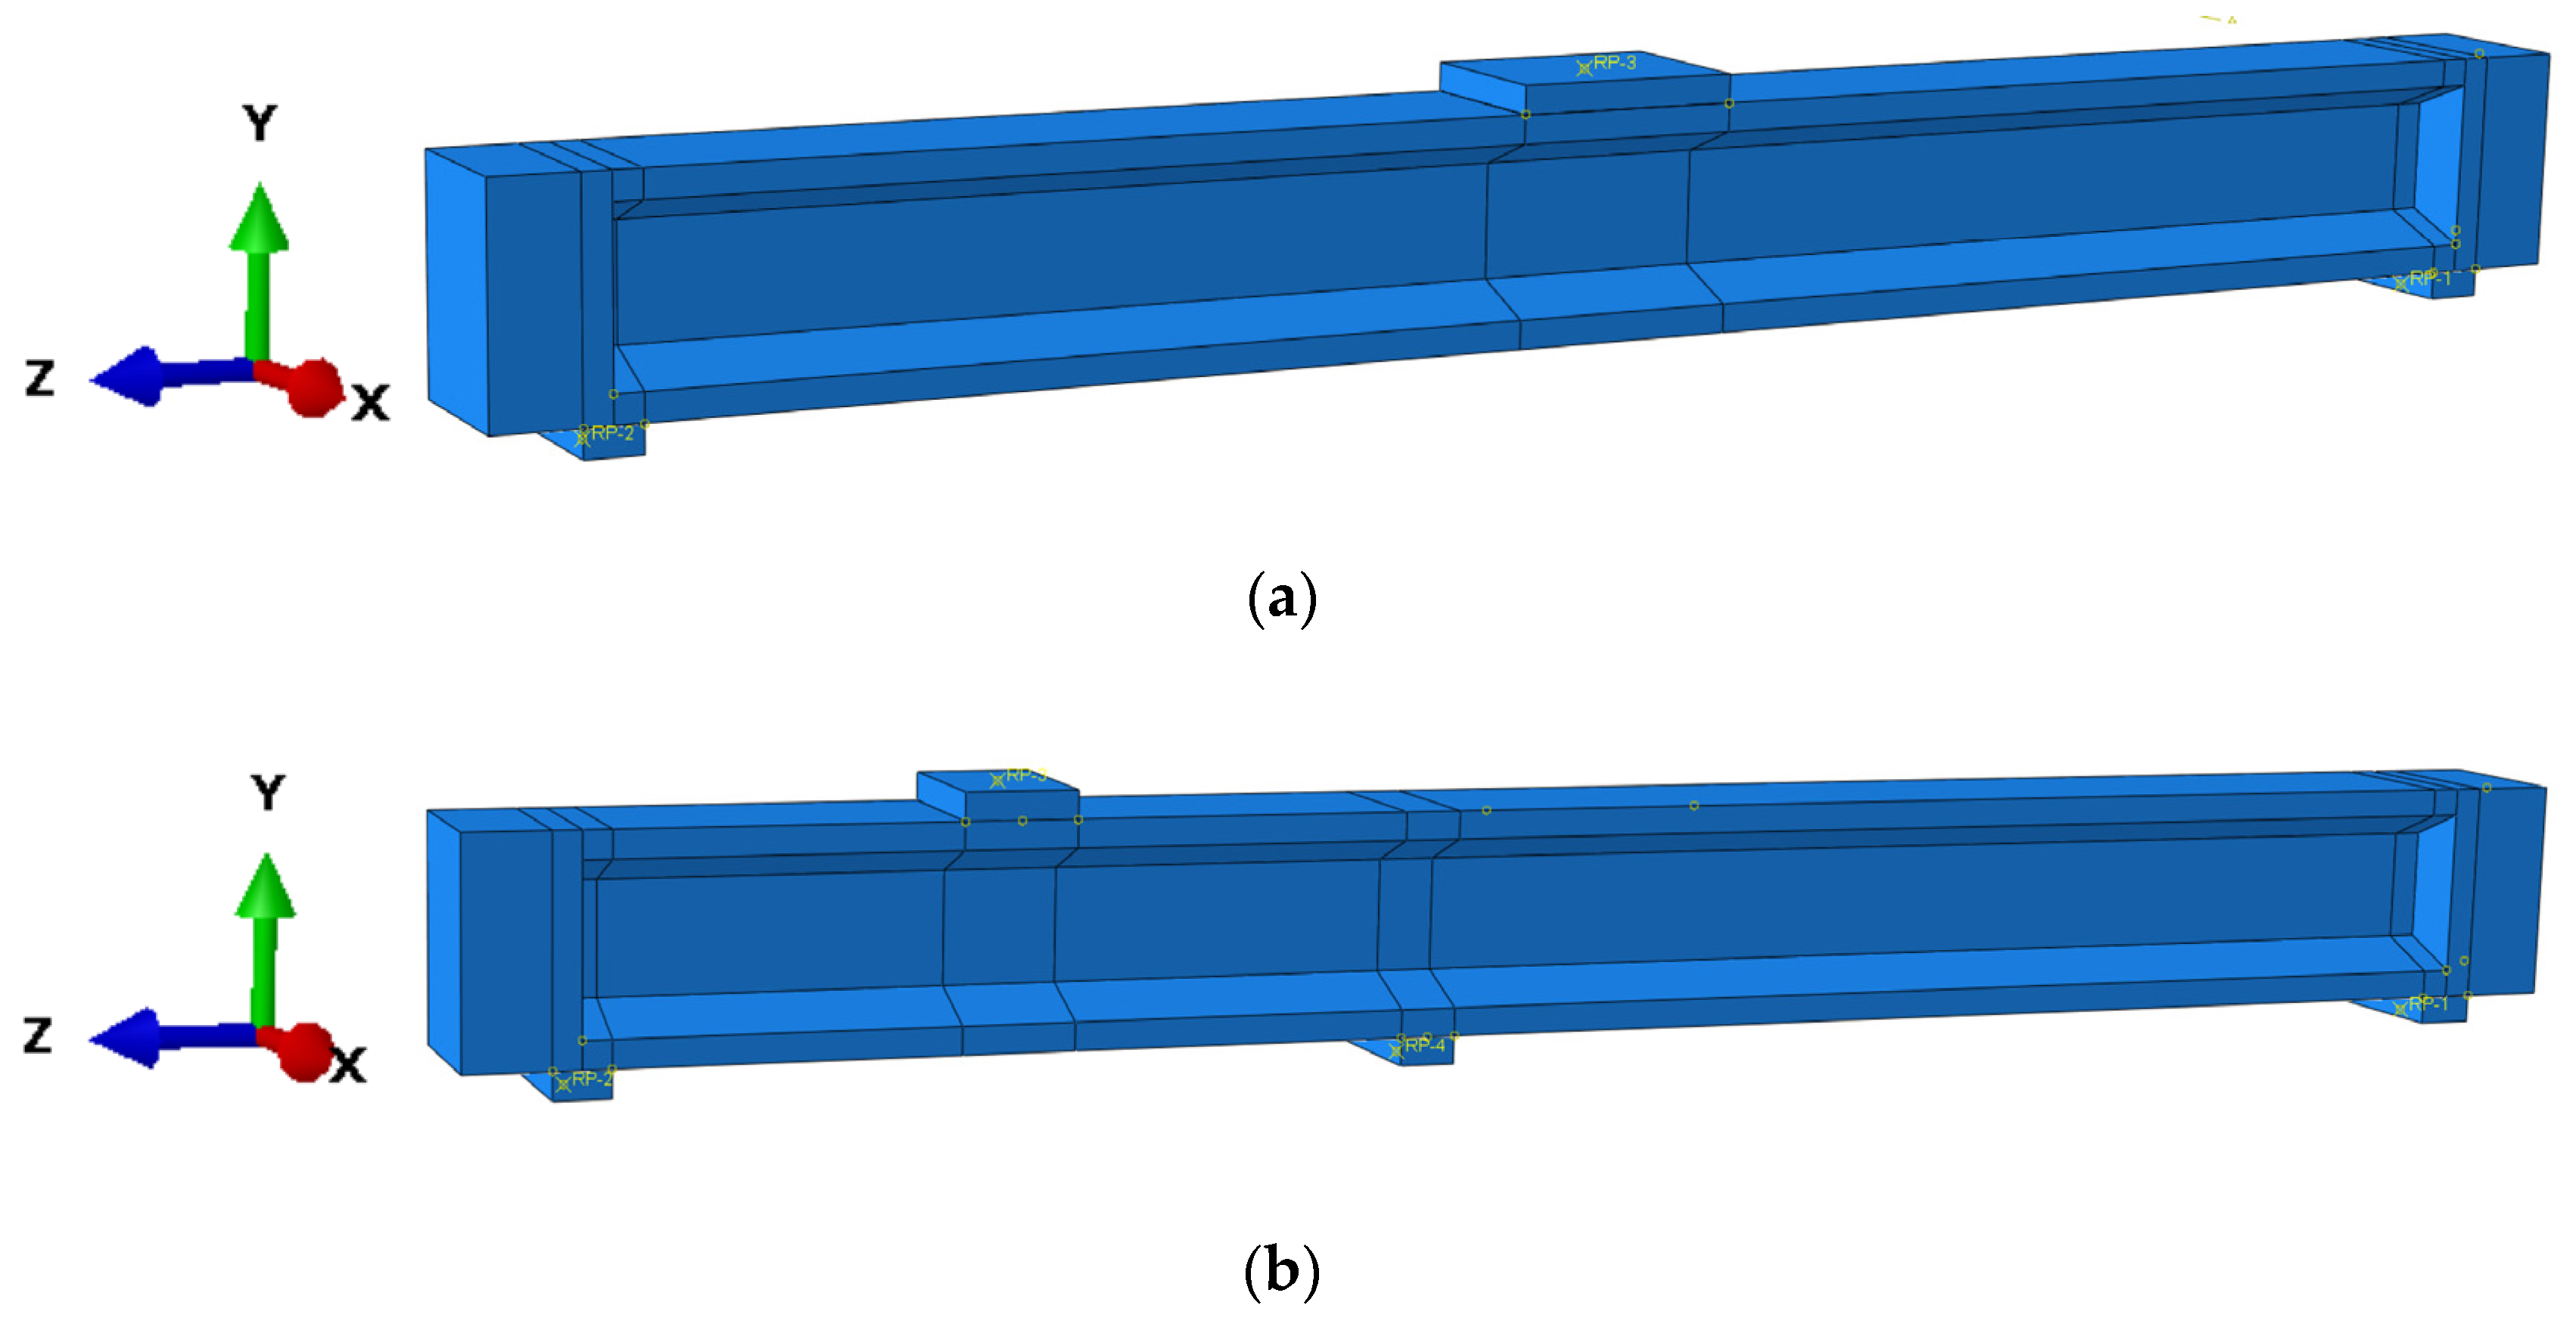
Figure 17 shows the geometric model of the test beam. To prevent localized crushing at loading and support points, steel plates were modeled and tied to the beam using Tie constraints. Reference points were defined on the supports and loading plates, connected to the steel plates via Coupling constraints. Perfect bond behavior between the concrete beam and reinforcement cage was assumed, with the reinforcement embedded using embedded constraints to simulate integrated structural behavior.
(3)
Boundary conditions and loading protocol
In the finite element model, boundary conditions were defined to match experimental setups: one end was modeled as a fixed hinge support (restricting X-, Y-, and Z-axis displacements while permitting rotation about the X-axis), and the other as a sliding support (restricting X- and Y-axis displacements while allowing Z-axis translation and X-axis rotation). The coordinate system is detailed in Figure 17.
ABAQUS offers two loading methods: force-controlled and displacement-controlled. Given UHPC’s nonlinear material behavior, displacement-controlled loading was selected for its enhanced numerical stability and reduced convergence issues. A downward displacement (negative Y-axis direction) was applied to the reference point of the loading steel plate, with the displacement magnitude determined by the mid-span deflection at failure observed in physical tests.
(4)
Mesh generation
A global mesh size of 20 mm was applied to both the concrete beam and reinforcement cage.

4.2. Finite Element Model Verification

4.2.1. Comparison of Failure Patterns

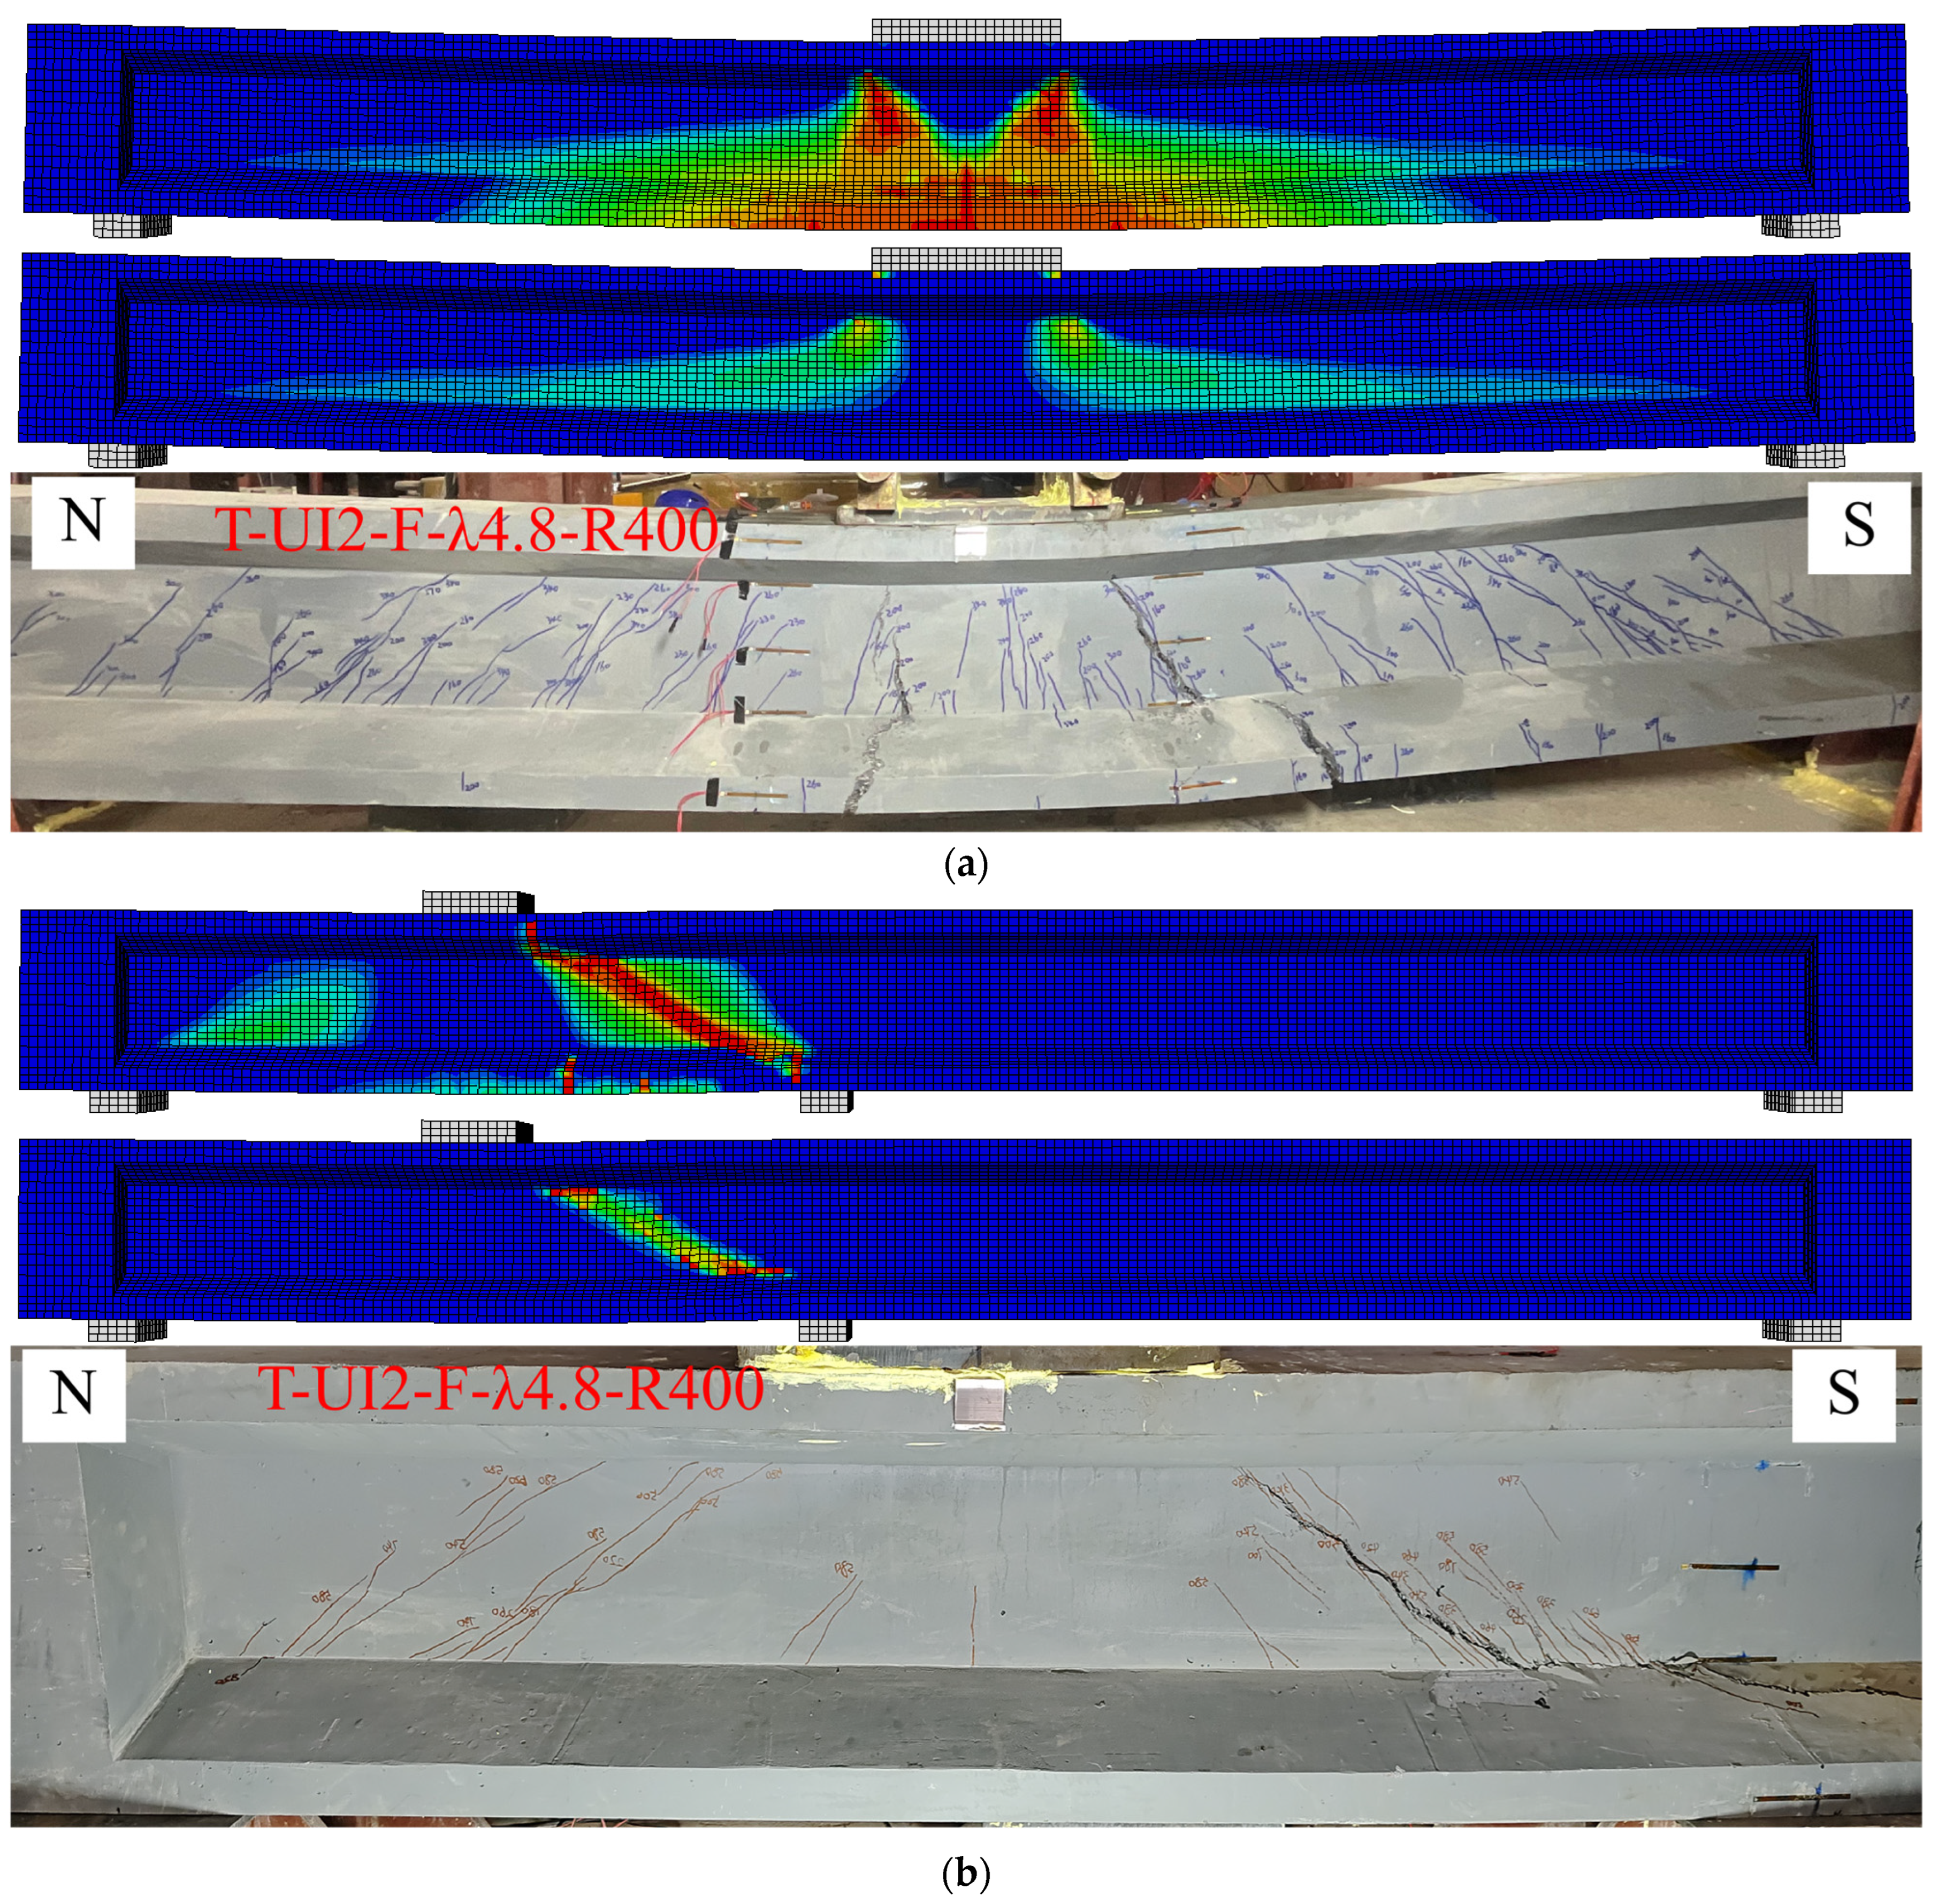
Figure 18 compares the failure patterns of the finite element models of the test beams with those observed in the experiments. Each group of images includes three figures: the first shows the tension damage of the model beam, the second the compression damage, and the third the failure pattern of the actual test beam. Overall, the comparison reveals a close alignment between the model and experimental results. The model beams exhibit cracking patterns similar to the test beams, with initial large tensile stresses and bending cracks appearing in the mid-span region. This is followed by significant tension damage and the emergence of diagonal cracks in the shear-flexure zone. Additionally, concrete near the loading points and supports experiences high compressive stresses. The failure mode of the model beams matches that of the test beams, with both failing in shear.

4.2.2. Ultimate Load and Mid-Span Deflection Comparison

Table 7 summarizes the ultimate load capacity and corresponding mid-span vertical deflection obtained from the finite element model and compares them to the experimental results. The average ratio of the simulated beam’s ultimate shear capacity to the experimental value is 1.02, with a standard deviation of 0.04. For the mid-span vertical deflection at ultimate shear capacity, the average ratio is 0.96, with a standard deviation of 0.16. This shows that the finite element model built via ABAQUS software offers a fairly accurate prediction of the ultimate load capacity and mid-span deflection for both UHPC beams without stirrups and with stirrups.

4.2.3. Comparison of Load-Mid-Span Deflection Curves

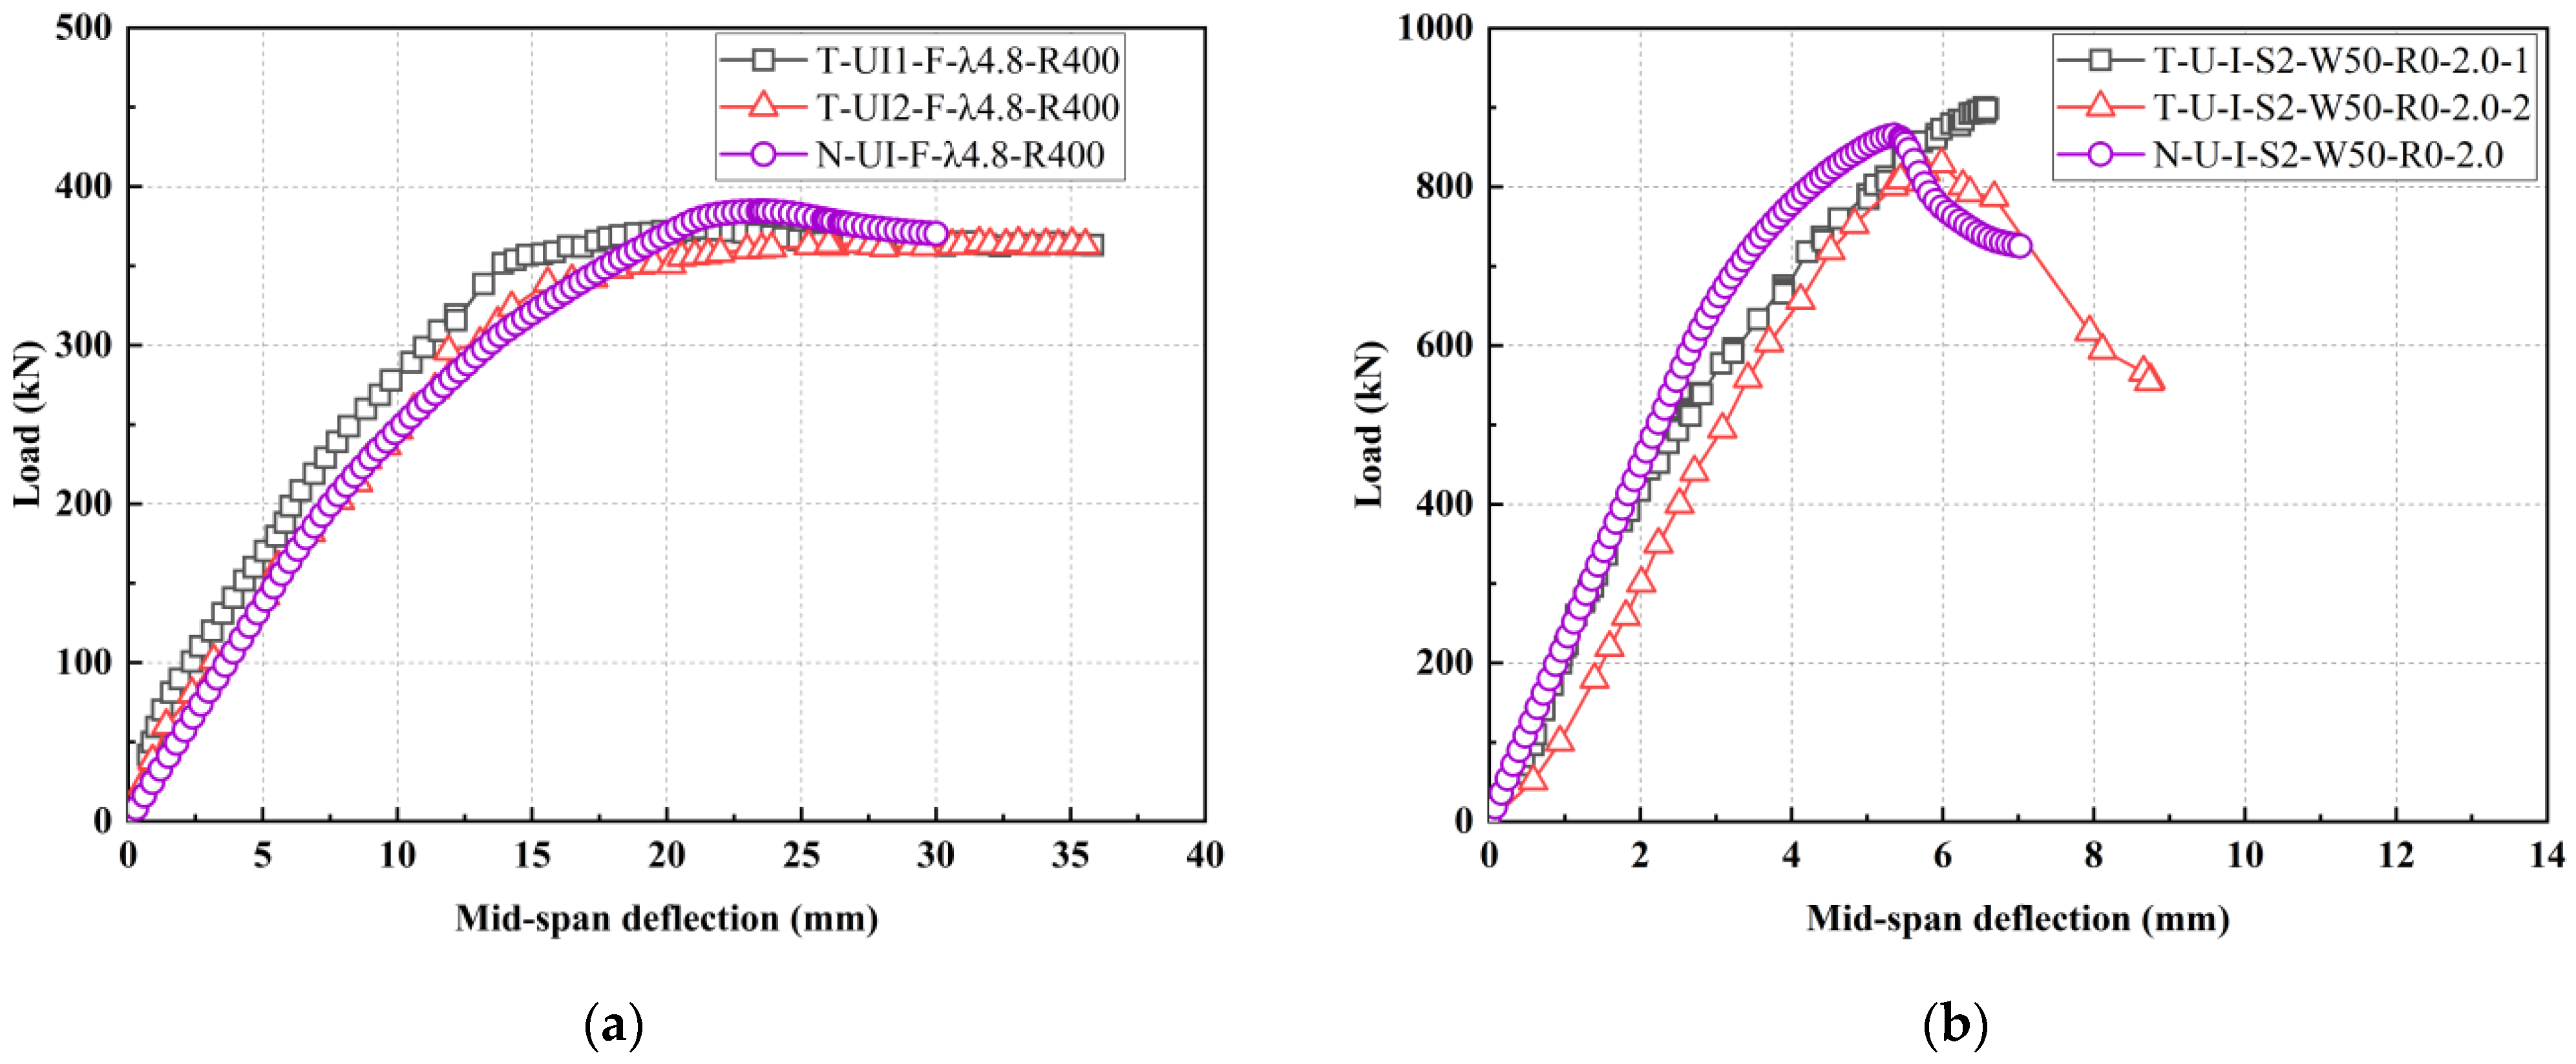
Figure 19 intuitively compares the load-mid-span deflection curves of the tested beams to those simulated by the finite element model. The simulation and experimental curves align closely, with an overall trend that mirrors the experimental curve, and errors are kept within 10%. However, it is worth noting that in the elastic stage, the simulation curve exhibits greater stiffness than the experimental one. The reasons for these discrepancies are as follows:
In the simulation, the rebar cage and concrete beam are connected via an Embedded constraint. This constraint enables the transfer of displacement, forces, and other conditions between the rebar and concrete, coupling their behavior. As a result, the rebar cage and concrete function as a unified structure, prohibiting rebar slippage. The relatively high stiffness of the rebar consequently increases the overall stiffness of the simulated beam.

4.3. Finite Element Simulation Parameter Expansion

The previous section comprehensively compared the finite element model beams created with ABAQUS software to the experimental beams, including failure patterns, ultimate load capacity, mid-span deflection, and load-mid-span deflection curves. The finite element model showed high accuracy in simulating the actual behavior and failure characteristics of beams. To further explore the factors affecting the shear performance of stirrup-free I-shaped UHPC beams, the parameters of span-to-depth ratio and longitudinal reinforcement strength were expanded in the model. All expanded models used a UHPC constitutive law with a steel fiber volume of 2%, as detailed in Table 8.

4.3.1. Effects of Span-to-Depth Ratio

The span-to-depth ratio is a key factor in determining the shear-bearing capacity. As there are few experiments on the shear performance of stirrup-free I-shaped UHPC beams, the shear span-to-depth ratio parameter was expanded based on the established finite element model. The specific parameters were 1.0, 1.25, 1.5, 1.75, 2.0, 2.25, 2.5, 2.75, and 3.0, and a four-point loading method was adopted.
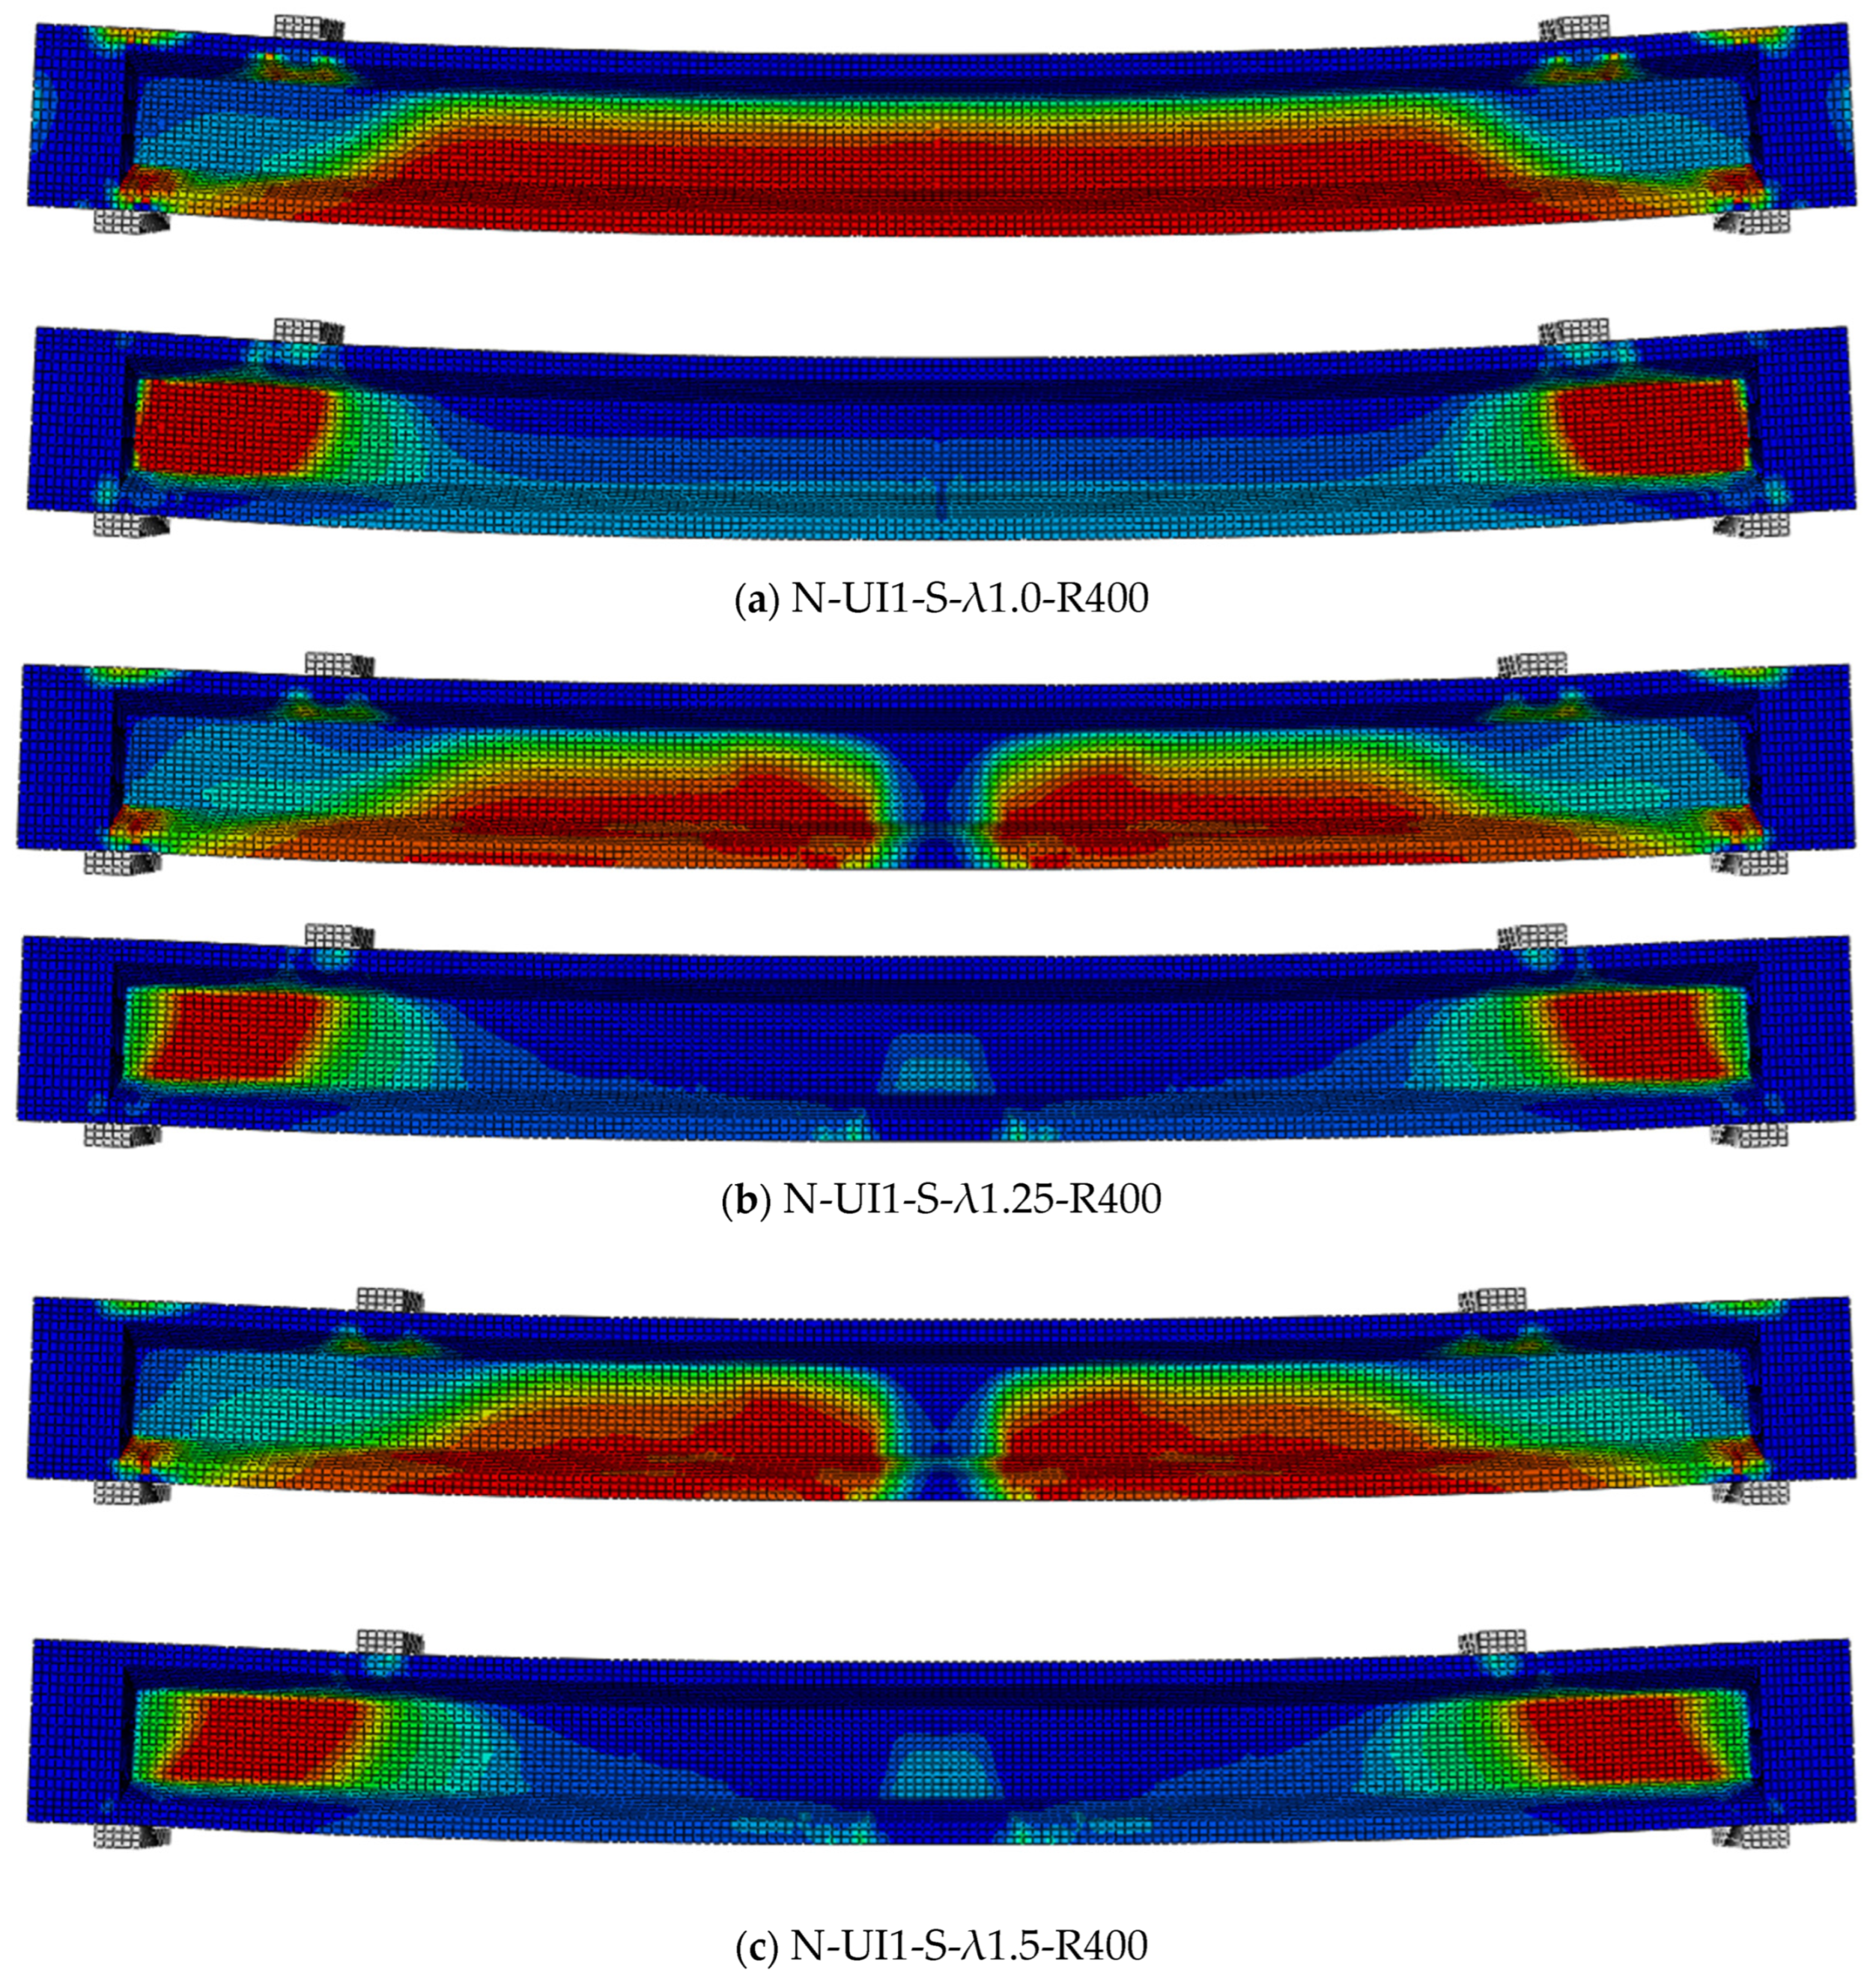
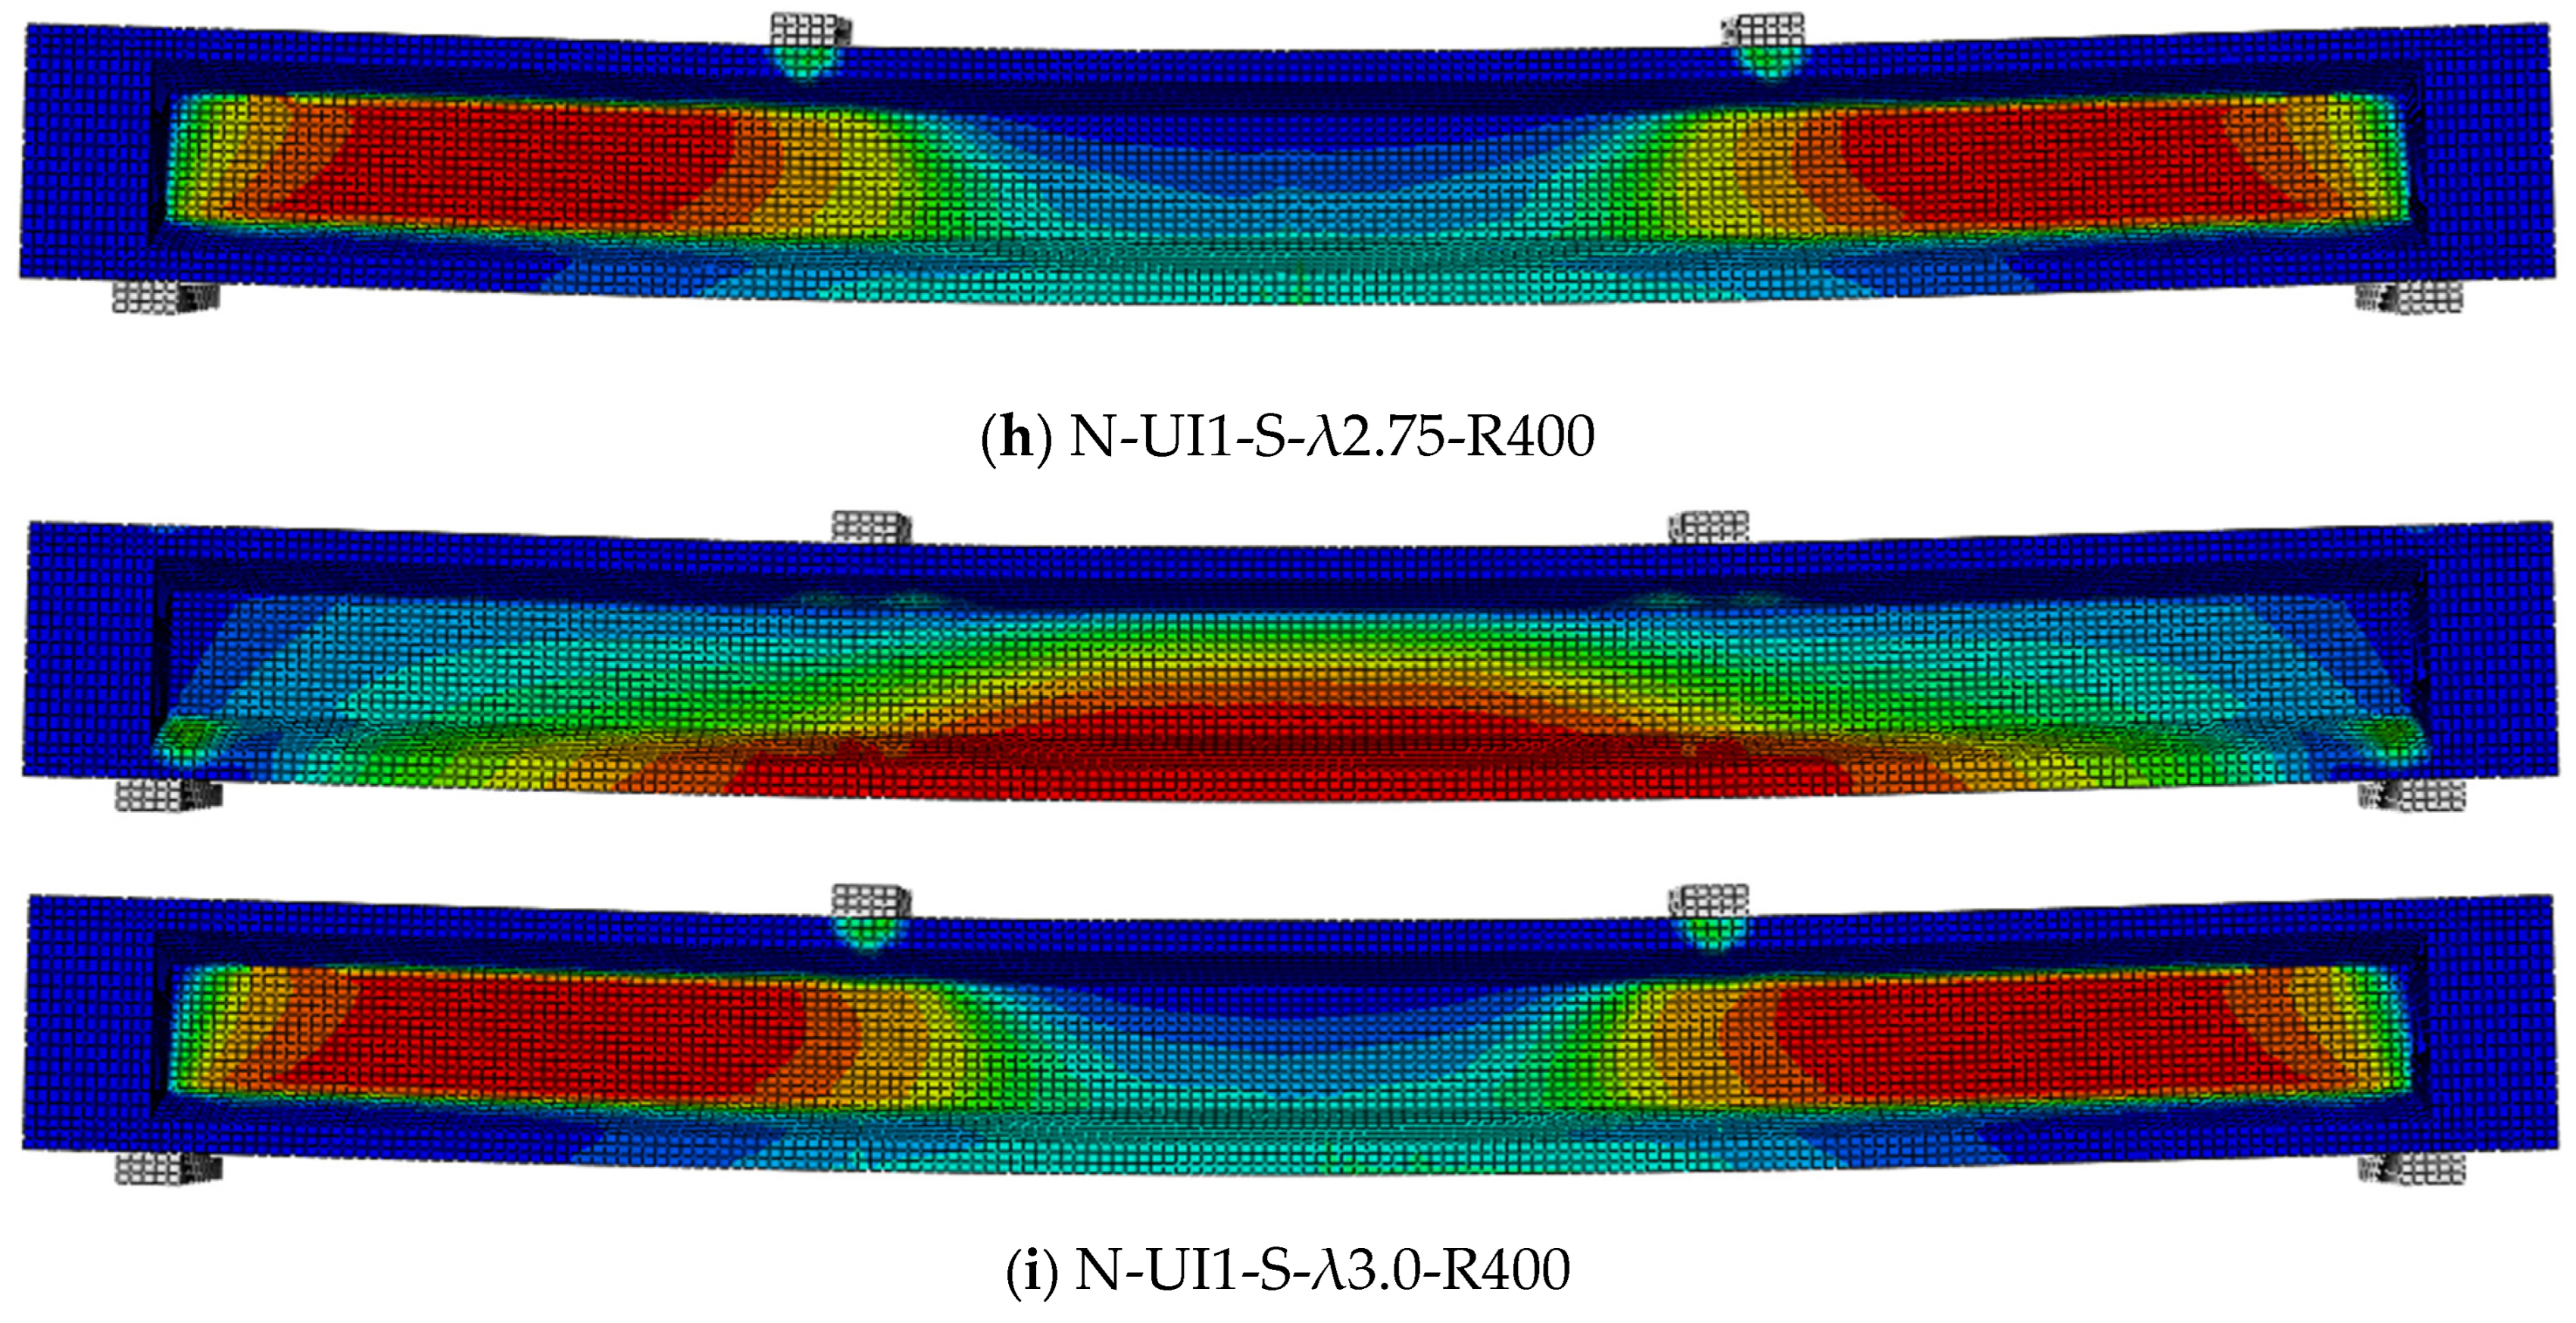
Figure 20 shows the tensile and compressive damage nephograms of stirrup-free I-shaped UHPC beams under different shear span-to-depth ratios. The first figure is the tensile damage nephogram, and the second is the compressive damage nephogram. As the span-to-depth ratio increases, the number of bending cracks in the mid-span pure bending section increases, and the compressive damage in the shear-flexure section decreases. The diagonal cracks are concentrated in the web, which matches the experimental phenomena.
Table 9 lists the ultimate load and displacement outcomes of the FEMs with different shear span-to-depth ratios. Figure 21 presents the load-mid-span deflection curves of the beams and the effects of different shear span-to-depth ratios on the shear capacity and loading point deflection of stirrup-free I-shaped UHPC beams. From the table and figure, as the shear span-to-depth ratio increases from 1.0 to 3.0, the shear capacity of the beams decreases. Compared with the beam with a shear span-to-depth ratio of 1.0, the shear capacity of the other beams decreases by 31.10%, 38.91%, 49.32%, 53.70%, 59.66%, 64.22%, 67.74%, and 70.56%, respectively. Along with the shear capacity decreases with increasing span-to-depth ratio, the corresponding vertical deflection at the loading point increases. Compared with the beam with a shear span-to-depth ratio of 1.0, the deflection of the other beams increases by 7.83%, 19.57%, 30.43%, 51.30%, 64.35%, 69.57%, and 74.78%. The load-displacement curves show that as the shear span-to-depth ratio increases, the stiffness of the beams gradually decreases, and the rate of stiffness reduction slows down.
In summary, for stirrup-free I-shaped UHPC beams, an increase in the span-to-depth ratio leads to a decrease in shear capacity, an increase in loading point deflection, and a gradual reduction in the rate of stiffness decrease.

4.3.2. Effects of Longitudinal Reinforcement Strength

Longitudinal reinforcement provides crucial flexural resistance, limits bending deformation, and maintains beam stability and integrity. In shear resistance, it offers good mechanical interlocking and aggregate interlock. Boosting longitudinal reinforcement strength can enhance the beam’s overall load-bearing capacity. Therefore, for stirrup-free I-shaped UHPC beams and with shear span-to-depth ratios of 1.0, 1.5, and 2.0, the longitudinal reinforcement strength was varied, with parameters set at 500 MPa and 600 MPa.
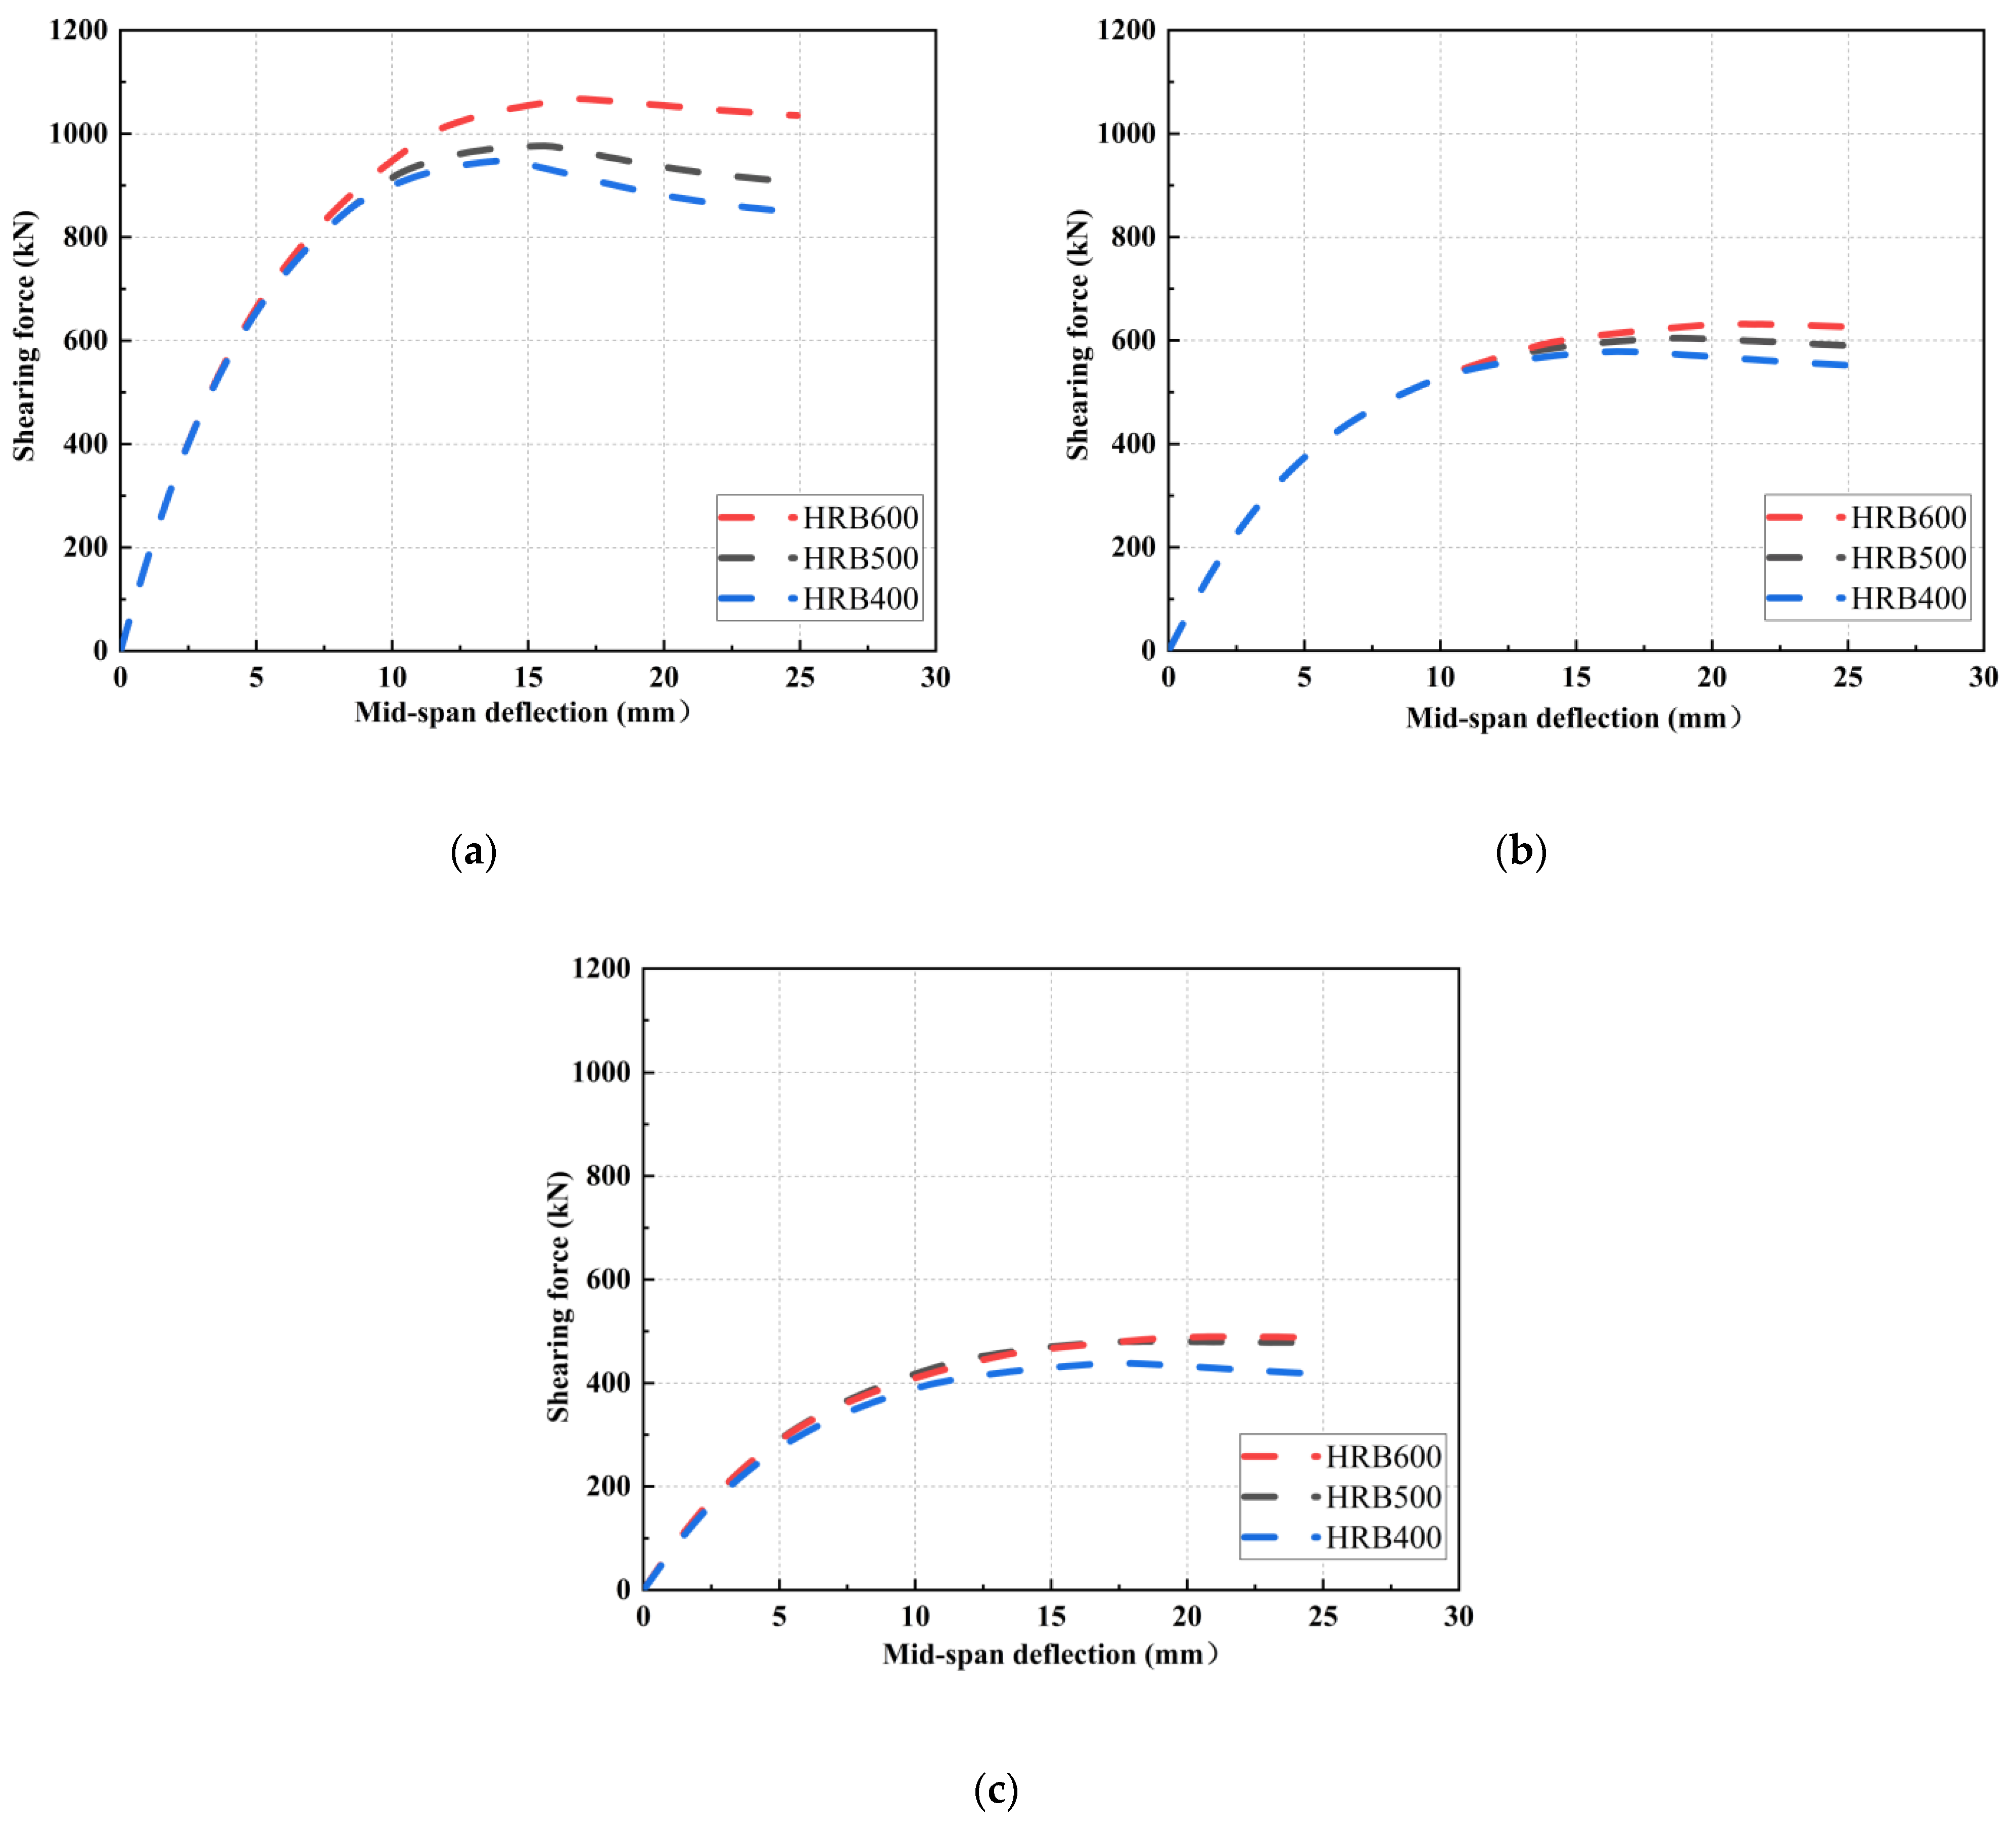
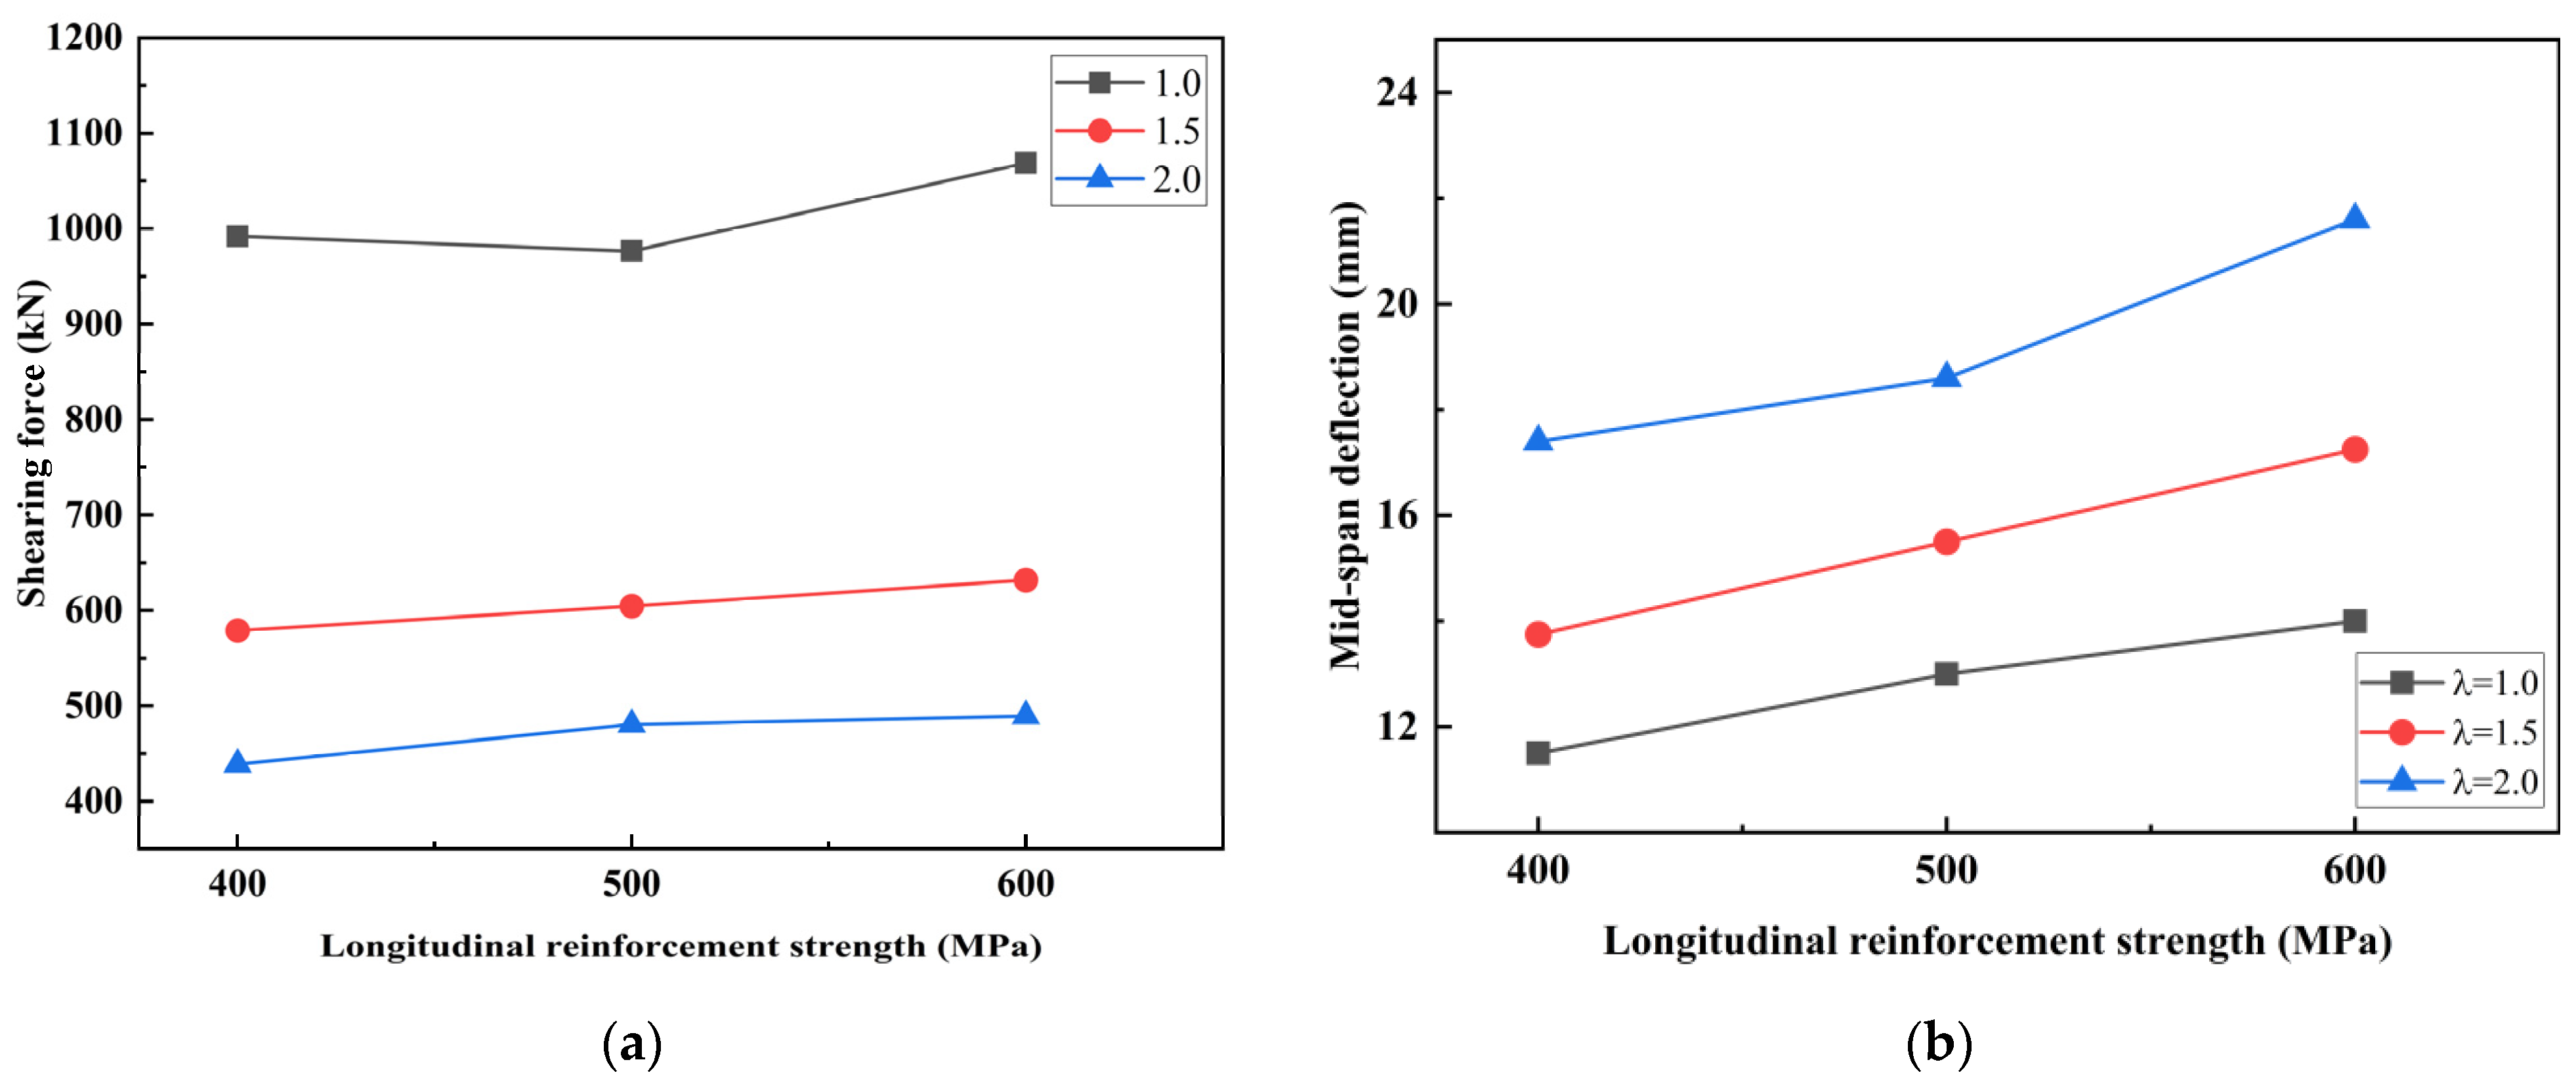
Table 9 presents the model outcomes for different longitudinal reinforcement strengths at shear span-to-depth ratios of 1.0, 1.5, and 2.0. Figure 22 and Figure 23 show the load-displacement curves and the impact of longitudinal reinforcement strength on shear capacity for the model beams. From the table and figures, compared with the model beam with HRB400 longitudinal reinforcement, when the span-to-depth ratio is 1.0, the shear capacity of the other model beams increases by 3.06% and 12.78%, while the loading point deflection rises by 13.04% and 21.74%. For a span-to-depth ratio of 1.5, the shear capacity increases by 4.45% and 9.15%, and the loading point deflection by 12.73% and 25.45%. When the span-to-depth ratio is 2.0, the shear capacity increases by 9.51% and 11.56%, and the loading point deflection by 6.90% and 24.14%.
In summary, each upgrade in longitudinal reinforcement strength leads to a shear capacity increase of 6–11% for stirrup-free I-shaped UHPC beams with span-to-depth ratios of 1.0, 1.5, and 2.0. Meanwhile, the loading point deflection also shows an upward trend.

5. Comparison of Code-Based Shear Capacity Calculations and Experimental Results for Test Beams

5.1. Comparison of Code-Based Shear Capacity Calculations and Experimental Results for Test Beams

5.1.1. Shear Capacity Calculations Based on French Code

The French UHPC code establishes the formula for the shear capacity of UHPC beams based on the classical truss model and the variable-angle truss model [36]. The French code represents an internationally recognized UHPC design formula and has been incorporated into the European standards. The formula comprises three parts: the shear capacity provided by the UHPC matrix, the shear capacity provided by the stirrups, and the shear capacity provided by the steel fibers. The specific calculation formula is as follows:
V u 1 = V c + V s + V f
V c = 0.21 γ c f γ E k 1 f c u b d
V s = A s v s z f s v cot θ
V f = A b σ f 1 cot θ
In the formula, V c represents the shear force provided by the UHPC matrix; γ c f γ E is the UHPC design safety factor, taken as γ c f γ E = 1.0 during this calculation; k 1 is the prestress influence coefficient, in here, k 1  = 1.0; f c u is the cube compressive strength; b is the web width of the beam; d is the effective height of the beam; A s v is the total cross—sectional area of the stirrups spacing along the beam length in the shear section; s is the spacing of the stirrups along the beam length (the distance between the axes of the stirrups); f s v is the yield strength of the stirrups; z is the distance between the upper and lower chords in the truss calculation model, taken as z = 0.9 d ;     A b = b z ; here, σ f 1 is the design residual tensile strength of UHPC after cracking; here, σ f 1 is adopted which neglects the safety factor θ is the angle between the inclined crack and the horizontal axil. For the simulated specimens, it is obtained based on the stress states at the shear span center position and the neutral axis through θ = 0.5 tan 1 2 τ x y σ x σ y . σ x represents the longitudinal stress; σ y represents the vertical stress; τ x y represents the shear stress; The specific calculation parameters, calculation results, and the ratio of calculation results to experimental values are detailed in Table 10.

5.1.2. Shear Capacity Calculation Based on PCI Report

The PCI Report calculates the shear capacity of UHPC beams based on the UHPC matrix, steel fibers, stirrups, and prestressing tendon [37]. The formula omitting the prestressing contribution is as follows:
V u 2 = V c f + V s + V p
V c f = ( 4 f r r 3 ) b z cot θ
V s = A s v f y z cot θ s
θ = 29 ° + 3500 ε s
In the formula, V c f represents the shear capacity provided jointly by the UHPC matrix and steel fibers; f r r denotes the residual stress. For detailed calculation parameters, results, and the ratio of calculated to experimental values, refer to Table 11. Given that the simulation shows yielding of reinforcing steel, the θ of 36° is selected.

5.1.3. Shear Capacity Calculation Based on Feng’s Modified Compression Field Theory (MCFT)

Collins and Mitchell (1980) proposed the Compression Field Theory (CFT) for the shear and torsional capacity of reinforced concrete members [47]. Vecchio and Collins (1986) subsequently developed the Modified Compression Field Theory (MCFT), incorporating aggregate interlock effects in cracked concrete [48].
The MCFT models cracked concrete as an equivalent homogeneous material using average stress-strain relationships. It accounts for concrete softening under compression, establishes biaxial constitutive models, and formulates equilibrium and compatibility equations for shear analysis through iterative methods.
Collins and Vecchio continued to refine the theory, while other researchers expanded its applications through theoretical developments, constitutive modeling, and studies on concrete types and reinforcement ratios. These contributions have been incorporated into the North American shear design code [49,50]. Feng et al. [24], based on MCFT and considering the unique material properties of prestressed UHPC, established an analysis model for the shear capacity of prestressed UHPC beams under combined bending and shear. The proposed formula (Feng’s formula) is as follows:
V u 3 = V c + V s + V p
V c = ( 3.42 λ 0.38 ) f c u b d
V s = ( 0.506 λ 0.18 ) f s v ρ s v b d
In the formula, λ is the shear span-to-depth ratio. If λ < 1.5, λ = 1.5 is employed. If λ > 3.0, λ = 3.0 is adapted. ρ s v represents the stirrup reinforcement ratio. The formula includes V p for shear capacity from prestressing tendons, but it is not included in this study as prestressing was not applied. For the detailed calculation parameters, results, and the ratio of calculated to experimental values, refer to Table 12. All other symbols are the same as in the previous text.

5.1.4. Shear Capacity Calculation Based on Ye’s Regression Analysis Method

Ye et al. [25] proposed a formula to predict the shear-cracking strength. After parametric analysis and regression of key parameters-UHPC’s compressive strength, shear span-to-depth ratio, steel-fiber-reinforcement index, and prestress level, they presented a formula (Ye’s formula) to predict the shear capacity of prestressed T-shaped UHPC beams without stirrups, as follows:
V u 4 b d = 21.5 ( 1 + 11.3 f p c f c ) f c u ( 9.1 ρ p + 1.1 ρ s λ ) + 13.7 λ f 0.25 λ 0.34
λ f = ρ f l f / d f
In the formula, λ f is the steel fiber content characteristic parameter; ρ f is the percentage of steel fiber volume;   l f is the equivalent length of steel fibers; d f   is the equivalent diameter of steel fibers; and f p c and ρ p respectively represent the prestress applied load and the reinforcement ratio of prestressing tendons. In this paper, f p c = 0, ρ p = 0; ρ s is the longitudinal reinforcement ratio. For specific calculation parameters, results, and the ratio of calculated to experimental values, refer to Table 13. All other symbols are the same as in the previous text.

5.1.5. Summary and Analysis of UHPC Code Formula Calculations and Experimental Results

Table 14 presents the results of various UHPC formulas and their ratios to experimental results. Among these, Ye’s formula shows the most accurate predictions, with an average ratio of 0.78, closely matching the experimental results. The French formula yields overly conservative results for stirrup-free I-shaped UHPC beams. PCI report and Feng’s formulas produce moderate results closer to experimental data, with Feng’s formula showing less dispersion. The French formula and PCI report underestimate the capacity of beams with low span-to-depth ratios but perform better for beams with high ratios, especially above 2.75, as they do not account for the shear span-to-depth ratio’s impact on shear capacity. Feng’s formula, considering the shear span-to-depth ratio’s influence, gives predictions closer to experimental results, particularly for ratios near 1.5. Ye’s formula, accounting for the span-to-depth ratio, steel fibers, and longitudinal reinforcement ratio, offers the best predictions. Yet, Ye’s formula was a regression equation based on experienced data.
It is worth mentioning that both T-beams and box girders can be conceptually regarded as specialized forms of I-girders in terms of their structural mechanical principles, sharing common load-transfer mechanisms. Therefore, provided that the girders in question exhibit similarity in critical geometric parameters (e.g., aspect ratio, effective flange width) and material properties to those modeled in this study, the behavioral trends are expected to be comparable. Consequently, our conclusions, including the data-validated formulas, should be applicable.
Nonetheless, for cases with significantly different structural configurations, we recommend additional case-specific validation. The models and formulas presented in this study can serve as a robust tool for preliminary assessment.
In structural design, beams with a shear span-to-depth ratio of over 2.0 are commonly used. Hence, test beams with ratios from 2.25 to 3.0 were analyzed, and the data are summarized in Table 15. The French and Feng’s formulas relatively underestimate the capacity of high-ratio beams. The PCI report and Ye’s formula better predict the capacity of high shear span-to-depth beams, with average ratios of 1.01 and 0.97, respectively. Ye’s formula has a lower error, with a standard deviation of 0.06 and a coefficient of variation of 0.07. In real-world beam design, the French code and PCI report formulation were recommended due to their distinct physical implication and relatively accurate prediction of capacity.

6. Conclusions

This study conducted two bending tests and two shear tests on two 4 m-long large-scale stirrup-free I-shaped UHPC beams, where cracking patterns, load-bearing capacities, deflection performances, and concrete strains were observed. Finite element models were established using the ABAQUS software and verified against experimental results. The validated FE models were used to explore the shear performance of the beams through parameter expansions. The main conclusions are drawn as follows:
(1)
The UHPC beams have a bending load of approximately 369.00 kN and a shear load of approximately 864.58 kN. The UHPC beams exhibited good post-cracking performance, with indexes of post-cracking capacities in bending and shear tests ranging from 56.1% to 59.9% and 68.9% to 78.3%, respectively.
(2)
Cracks are likely to appear on the web during bending and shear tests, mainly due to the thin web and stress concentration at the intersection of the web and flange. For the two bending tests, the first vertical cracks emerged at the inferior portion of mid-span at around 155 kN. For the two shear tests, all cracks were diagonal cracks in the shear span. As load enhancing, cracks in shear span average nominal diagonal stress was 6.15 MPa. As load enhancing, one crack evolved into the critical diagonal crack, until typical shear-compression failure was exhibited. The angles of critical diagonal cracks were 37.2°and 36.4°, respectively.
(3)
In two bending tests, the beam’s deflection increases linearly and symmetrically with respect to the mid-span along the beam length. When the load exceeds 0.9, the deflection grows rapidly from the load-mid-span deflection curves. Due to the steel fiber bridging effect and longitudinal reinforcement, the beam demonstrates excellent ductility. The maximum deflections were 21.31 mm and 27.12 mm respectively. The load-deflection curves of two shear tests illustrated a distinctly precipitous descent after peak loads, indicating brittle failure.
(4)
In the bending test, strain variations along the vertical section basically conformed to the plane section assumption, with the neutral axis approximately at the junction of the top flange and the web. In the shear test, the strains along the vertical section and principal strain at the shear span were complex, due to the irregular propagation of cracks and stress distributions.
(5)
The cracking patterns and cracking failures simulated by FEMs aligned with the experimental observation. According to extensive parameter analysis of FEMs, the shear load of stirrup-free I-shaped UHPC beams significantly decreased with the increase in shear span–depth ratios. Otherwise, the influence of longitudinal rebars was limited.
(6)
Comparisons of FEMs outcomes and predicting values of four formulas corroborated that Ye’s formula yielded the most accurate. In the scenario of design practice of stirrup-free I-shape UHPC beams at high shear span-depth ratio (≥2.0), two formulations of the French code and PCI reports were recommended, owing to the rationally conservative predictions, and explicit physical indication.

Author Contributions

Investigation S.W., C.Z., F.M. and H.J.; writing—original draft S.W. and F.M.; writing—review and editing S.W., C.Z. and F.M.; visualization S.W. and H.J.; conceptualization L.Z. and H.J.; supervision L.Z., Y.T. and J.F.; funding acquisition H.J.; project administration Y.T. and J.F. All authors have read and agreed to the published version of the manuscript.

Funding

This research was funded by the National Natural Science Foundation of China with the grant number 51778150.

Data Availability Statement

The original contributions presented in the study are included in the article; further inquiries can be directed to the corresponding author.

Acknowledgments

This project was undertaken at the plant of the Zhonglu Dura International Engineering Co., Ltd. in Zhaoqing China, and the Structural Laboratory of Guangdong University of Technology in Guangzhou, China. The authors would like to acknowledge this generous support.

Conflicts of Interest

Authors Yueqiang Tian and Junfa Fang were employed by the company of Zhonglu Dura International Engineering Co., Ltd. The remaining authors declare that the research was conducted in the absence of any commercial or financial relationships that could be construed as potential conflicts of interest.

References

  1. Olivito, R.S.; Zuccarello, F.A. An experimental study on the tensile strength of steel fiber reinforced concrete. Compos. Part B Eng. 2010, 41, 246–255. [Google Scholar] [CrossRef]
  2. Yu, R.; Spiesz, P.; Brouwers, H.J.H. Mix design and properties assessment of Ultra-High Performance Fibre Reinforced Concrete (UHPFRC). Cem. Concr. Res. 2014, 56, 29–39. [Google Scholar] [CrossRef]
  3. Xu, Y.; Liu, J.; Liu, J.; Zhang, P.; Zhang, Q.; Jiang, L. Experimental studies and modeling of creep of UHPC. Constr. Build. Mater. 2018, 175, 643–652. [Google Scholar] [CrossRef]
  4. Hung, C.-C.; Chen, Y.-T.; Yen, C.-H. Workability, fiber distribution, and mechanical properties of UHPC with hooked end steel macro-fibers. Constr. Build. Mater. 2020, 260, 119944. [Google Scholar] [CrossRef]
  5. Li, J.; Wu, Z.; Shi, C.; Yuan, Q.; Zhang, Z. Durability of ultra-high performance concrete—A review. Constr. Build. Mater. 2020, 255, 119296. [Google Scholar] [CrossRef]
  6. Kang, S.-T.; Kim, J.-K. Investigation on the flexural behavior of UHPCC considering the effect of fiber orientation distribution. Constr. Build. Mater. 2012, 28, 57–65. [Google Scholar] [CrossRef]
  7. Xue, J.; Briseghella, B.; Huang, F.; Nuti, C.; Tabatabai, H.; Chen, B. Review of ultra-high performance concrete and its application in bridge engineering. Constr. Build. Mater. 2020, 260, 119844. [Google Scholar] [CrossRef]
  8. Jiang, H.; Zhang, L.; Deng, B.; Gao, X.; Xie, S.; Sha, Z.; Chen, M. The direct shear behavior of the ultra-high performance concrete-filled socket connections between the bridge piers and footings. Structures 2024, 66, 106888. [Google Scholar] [CrossRef]
  9. Jiang, H.; Chen, Z.; Fang, Z.; Fang, S.; Tu, W.; Mo, F.; Xie, S.; Liu, J. Rapid hardening high performance concrete (RHHPC) for bridge expansion joints: From material properties to interfacial shear performance. Constr. Build. Mater. 2025, 458, 139638. [Google Scholar] [CrossRef]
  10. Shafieifar, M.; Farzad, M.; Azizinamini, A. Experimental and numerical study on mechanical properties of Ultra High Performance Concrete (UHPC). Constr. Build. Mater. 2017, 156, 402–411. [Google Scholar] [CrossRef]
  11. Abdal, S.; Mansour, W.; Agwa, I.; Nasr, M.; Abadel, A.; Özkılıç, Y.O.; Akeed, M.H. Application of Ultra-High-Performance Concrete in Bridge Engineering: Current Status, Limitations, Challenges, and Future Prospects. Buildings 2023, 13, 185. [Google Scholar] [CrossRef]
  12. Peng, Y.; Zhang, J.; Liu, J.; Ke, J.; Wang, F. Properties and microstructure of reactive powder concrete having a high content of phosphorous slag powder and silica fume. Constr. Build. Mater. 2015, 101, 482–487. [Google Scholar] [CrossRef]
  13. Kunieda, M.; Choonghyun, K.; Ueda, N.; Nakamura, H. Recovery of Protective Performance of Cracked Ultra High Performance-Strain Hardening Cementitious Composites (UHP-SHCC) Due to Autogenous Healing. J. Adv. Concr. Technol. 2012, 10, 313–322. [Google Scholar] [CrossRef]
  14. Binard, J.P. UHPC: A game-changing material for PCI bridge producers. PCI J. 2017, 62, 34–46. [Google Scholar] [CrossRef]
  15. Estefanía, C.; Francesco, L.M.; Marina, M.; Andrea, S.; Liberato, F. Effects of Autogenous and Stimulated Self-Healing on Durability and Mechanical Performance of UHPFRC: Validation of Tailored Test Method through Multi-Performance Healing-Induced Recovery Indices. Sustainability 2021, 13, 11386. [Google Scholar]
  16. Estefania, C.; Valentin, P.; Liberato, F. Cellulose nanofibers to improve the mechanical and durability performance of self-healing Ultra-High Performance Concretes exposed to aggressive waters. Constr. Build. Mater. 2023, 374, 130785. [Google Scholar]
  17. Zhou, M.; Lu, W.; Song, J.; Lee, G.C. Application of Ultra-High Performance Concrete in bridge engineering. Constr. Build. Mater. 2018, 186, 1256–1267. [Google Scholar] [CrossRef]
  18. Amran, M.; Huang, S.-S.; Onaizi, A.M.; Makul, N.; Abdelgader, H.S.; Ozbakkaloglu, T. Recent trends in ultra-high performance concrete (UHPC): Current status, challenges, and future prospects. Constr. Build. Mater. 2022, 352, 129029. [Google Scholar] [CrossRef]
  19. Voo, Y.L.; Foster, S.J.; Voo, C.C. Ultrahigh-Performance Concrete Segmental Bridge Technology: Toward Sustainable Bridge Construction. J. Bridge Eng. 2014, 20, B5014001. [Google Scholar] [CrossRef]
  20. Hung, C.-C.; El-Tawil, S.; Chao, S.-H. A Review of Developments and Challenges for UHPC in Structural Engineering: Behavior, Analysis, and Design. J. Struct. Eng. 2021, 1479, 03121001. [Google Scholar] [CrossRef]
  21. Feng, Z.; Li, C.; Ke, L.; Yoo, D.-Y. Experimental and numerical investigations on flexural performance of ultra-high-performance concrete (UHPC) beams with wet joints. Structures 2022, 45, 199–213. [Google Scholar] [CrossRef]
  22. Randl, N.; Mészöly, T.; Harsányi, P. Shear Behaviour of UsHPC Beams with Varying Degrees of Fibre and Shear Reinforcement. In High Tech Concrete—Where Technology and Engineering Meet, Proceedings of the Fib Symposium, Maastricht, The Netherlands, 12–14 June 2017; Springer International Publishing: Cham, Switzerland, 2017; pp. 500–507. [Google Scholar]
  23. Feng, J.; Li, P.; Wu, J.; Jiang, H.; Tian, Y.; Sun, X. Shear behavior of externally prestressed UHPC beams without stirrups. Case Stud. Constr. Mater. 2023, 18, e01766. [Google Scholar] [CrossRef]
  24. Feng, W.; Feng, H.; Zhou, Z.; Shi, X. Analysis of the Shear Capacity of Ultrahigh Performance Concrete Beams Based on the Modified Compression Field Theory. Adv. Mater. Sci. Eng. 2021, 2021, 5569733. [Google Scholar]
  25. Ye, M.; Li, L.; Pei, B.; Yoo, D.Y.; Li, H. Shear behavior of externally prestressed ultra-high-performance concrete (UHPC) T-beams without stirrups. Eng. Struct. 2023, 288, 116217. [Google Scholar]
  26. Jiang, H.; Hu, Z.; Cao, Z.; Gao, X.; Tian, Y.; Sun, X. Experimental and numerical study on shear performance of externally prestressed precast UHPC segmental beams without stirrups. Structures 2022, 46, 1134–1153. [Google Scholar] [CrossRef]
  27. Voo, Y.L.; Poon, W.K.; Foster, S.J. Shear Strength of Steel Fiber-Reinforced Ultrahigh-Performance Concrete Beams without Stirrups. J. Struct. Eng. 2010, 136, 1393–1400. [Google Scholar] [CrossRef]
  28. Lee, J.W.; Joh, C.; Choi, E.S.; Kwak, I.J.; Kim, B.S. Estimation of Shear Behavior of Ultra High Performance Concrete I Girder without Shear Stirrups. Key Eng. Mater. 2013, 525, 557–560. [Google Scholar]
  29. El-Helou, R.G.; Graybeal, B.A. Shear Behavior of Ultrahigh-Performance Concrete Pretensioned Bridge Girders. J. Struct. Eng. 2022, 148, 04022017. [Google Scholar] [CrossRef]
  30. El-Helou, R.G.; Graybeal, B.A. Shear Design of Strain-Hardening Fiber-Reinforced Concrete Beams. J. Struct. Eng. 2022, 149, 04022234. [Google Scholar] [CrossRef]
  31. Tu, W.; Cheng, Q.; Zhang, L.; Li, P.; Jiang, H.; Tian, Y.; Fang, J. Shear performance of 25 m full-scale prestressed UHPC-NC composite I-beam without stirrups. Case Stud. Constr. Mater. 2024, 21, e03942. [Google Scholar] [CrossRef]
  32. Ahmad, S.; Bahij, S.; Al-Osta, M.A.; Adekunle, S.K.; Al-Dulaijan, S.U. Shear Behavior of Ultra-High-Performance Concrete Beams Reinforced with High-Strength Steel Bars. ACI Struct. J. 2019, 116, 3–14. [Google Scholar] [CrossRef]
  33. Deng, B.; Zhang, L.; Wu, S.; Jiang, H.; Tian, Y.; Fang, J.; Zhou, C. Shear Behavior of Non-Stirrup Ultra-High-Performance Concrete Beams: Contribution of Steel Fibers and UHPC. Buildings 2024, 14, 2705. [Google Scholar] [CrossRef]
  34. Zhang, L.; Deng, B.; He, B.; Jiang, H.; Xiao, J.; Tian, Y.; Fang, J. Experimental Investigation on Shear Behavior of Non-Stirrup UHPC Beams under Larger Shear Span–Depth Ratios. Buildings 2024, 14, 1374. [Google Scholar] [CrossRef]
  35. Li, P.; Cheng, Q.; Chen, N.; Tian, Y.; Fang, J.; Jiang, H. Experimental Study on Shear Behavior of Non-Stirrup Ultra-High Performance Concrete Beams. Materials 2023, 16, 4177. [Google Scholar] [CrossRef]
  36. NFP 18 470:2016; Concrete-Ultra-High Performance Fibre-Reinforced Concrete-Specifications, Performance, Production and Conformity. French Standardization Association: Paris, France, 2016.
  37. Tadros, M.; Lawler, J.; El-Khier, M.A.; Gee, D.; Kurt, A.; Lucier, G.; Wagner, E. Implementation of Ultra-High-Performance Con crete in Long-Span Precast Pretensioned Elements for Concrete Buildings and Bridges; Precast/Prestressed Concrete Institute (PCI): Chicago, IL, USA, 2021. [Google Scholar]
  38. GB/T50448—2015; Technical Code for Application of Cementitious Grout. China Architecture and Building Press: Beijing, China, 2015.
  39. Yang, J.; Fang, Z. Research on stress-strain relation of ultra-high-performance concrete. Concrete 2008, 7, 11–15. [Google Scholar]
  40. Shi, Z.C.; Su, Q.T.; Kavoura, F.; Veljkovic, M. Uniaxial tensile response and tensile constitutive model of ultra-high performance concrete containing coarse aggregate (CA-UHPC). Cem. Concr. Compos. 2023, 136, 136104878. [Google Scholar] [CrossRef]
  41. Birtel, V.; Mark, P. Parameterised finite element modelling of RC beam shear failure. In Proceedings of the ABAQUS Users’ Conference; Ruhr-University Bochture: Bochum, Germany, 2006. [Google Scholar]
  42. Chuanbo, Z. Research on Uniaxial Compressive Strength of Reactive Powder Concrete; Hunan University: Changsha, China, 2017. [Google Scholar]
  43. Fang, Z.; Zhang, S.; Wu, J.; Ma, Y.; Fang, S.; Zhao, G.; Jiang, H. Experimental and numerical study on shear performance of grouped bolt-UHPC pocket connections under static loading. J. Build. Eng. 2023, 76, 106966. [Google Scholar] [CrossRef]
  44. Fang, S.; Ma, F.; Xian, B.; Fang, Z.; Jiang, H.; Ma, Y.; Zhao, G. Numerical and theoretical investigation on interfacial shear performance of prefabricated steel-UHPC composite beams with grouped stud-UHPC pocket connections. Structures 2024, 69, 107300. [Google Scholar] [CrossRef]
  45. Luo, J.; Wu, G.; Zhao, G.; Ma, Y.; Fang, Z.; Fang, S. Experimental and numerical analysis on shear performance of single embedded nut bolted shear connectors in prefabricated steel-UHPC composite structures under cyclic loading. Structures 2025, 73, 108446. [Google Scholar] [CrossRef]
  46. Zou, S.; Chen, R.; Wang, H.; Fang, Z.; Qu, C.; Zhang, C. Effect of shear key geometrical dimensions on seismic performance of prefabricated concrete piers with shallow socket connections. Structures 2025, 71, 107975. [Google Scholar] [CrossRef]
  47. Collins, M.P.; Mitchell, D. Shear and Torsion Design of Prestressed and Non-Prestressed Concrete Beams. PCI J. 1980, 25, 32–100. [Google Scholar] [CrossRef]
  48. Vecchio, F.J.; Collins, M.P. The modified compression-field theory for reinforced concrete elements subjected to shear. ACI J. 1986, 83, 219–231. [Google Scholar]
  49. Collins, M.P.; Mitchell, D. Rational Approach to Shear Design—The 1984 Canadian Code Provisions. J. Proc. 1986, 83, 925–933. [Google Scholar]
  50. Gamble, W.L.; Ramirez, J.A. Recent approaches to shear design of structural concrete. J. Struct. Eng. 2000, 126, 853. [Google Scholar] [CrossRef]
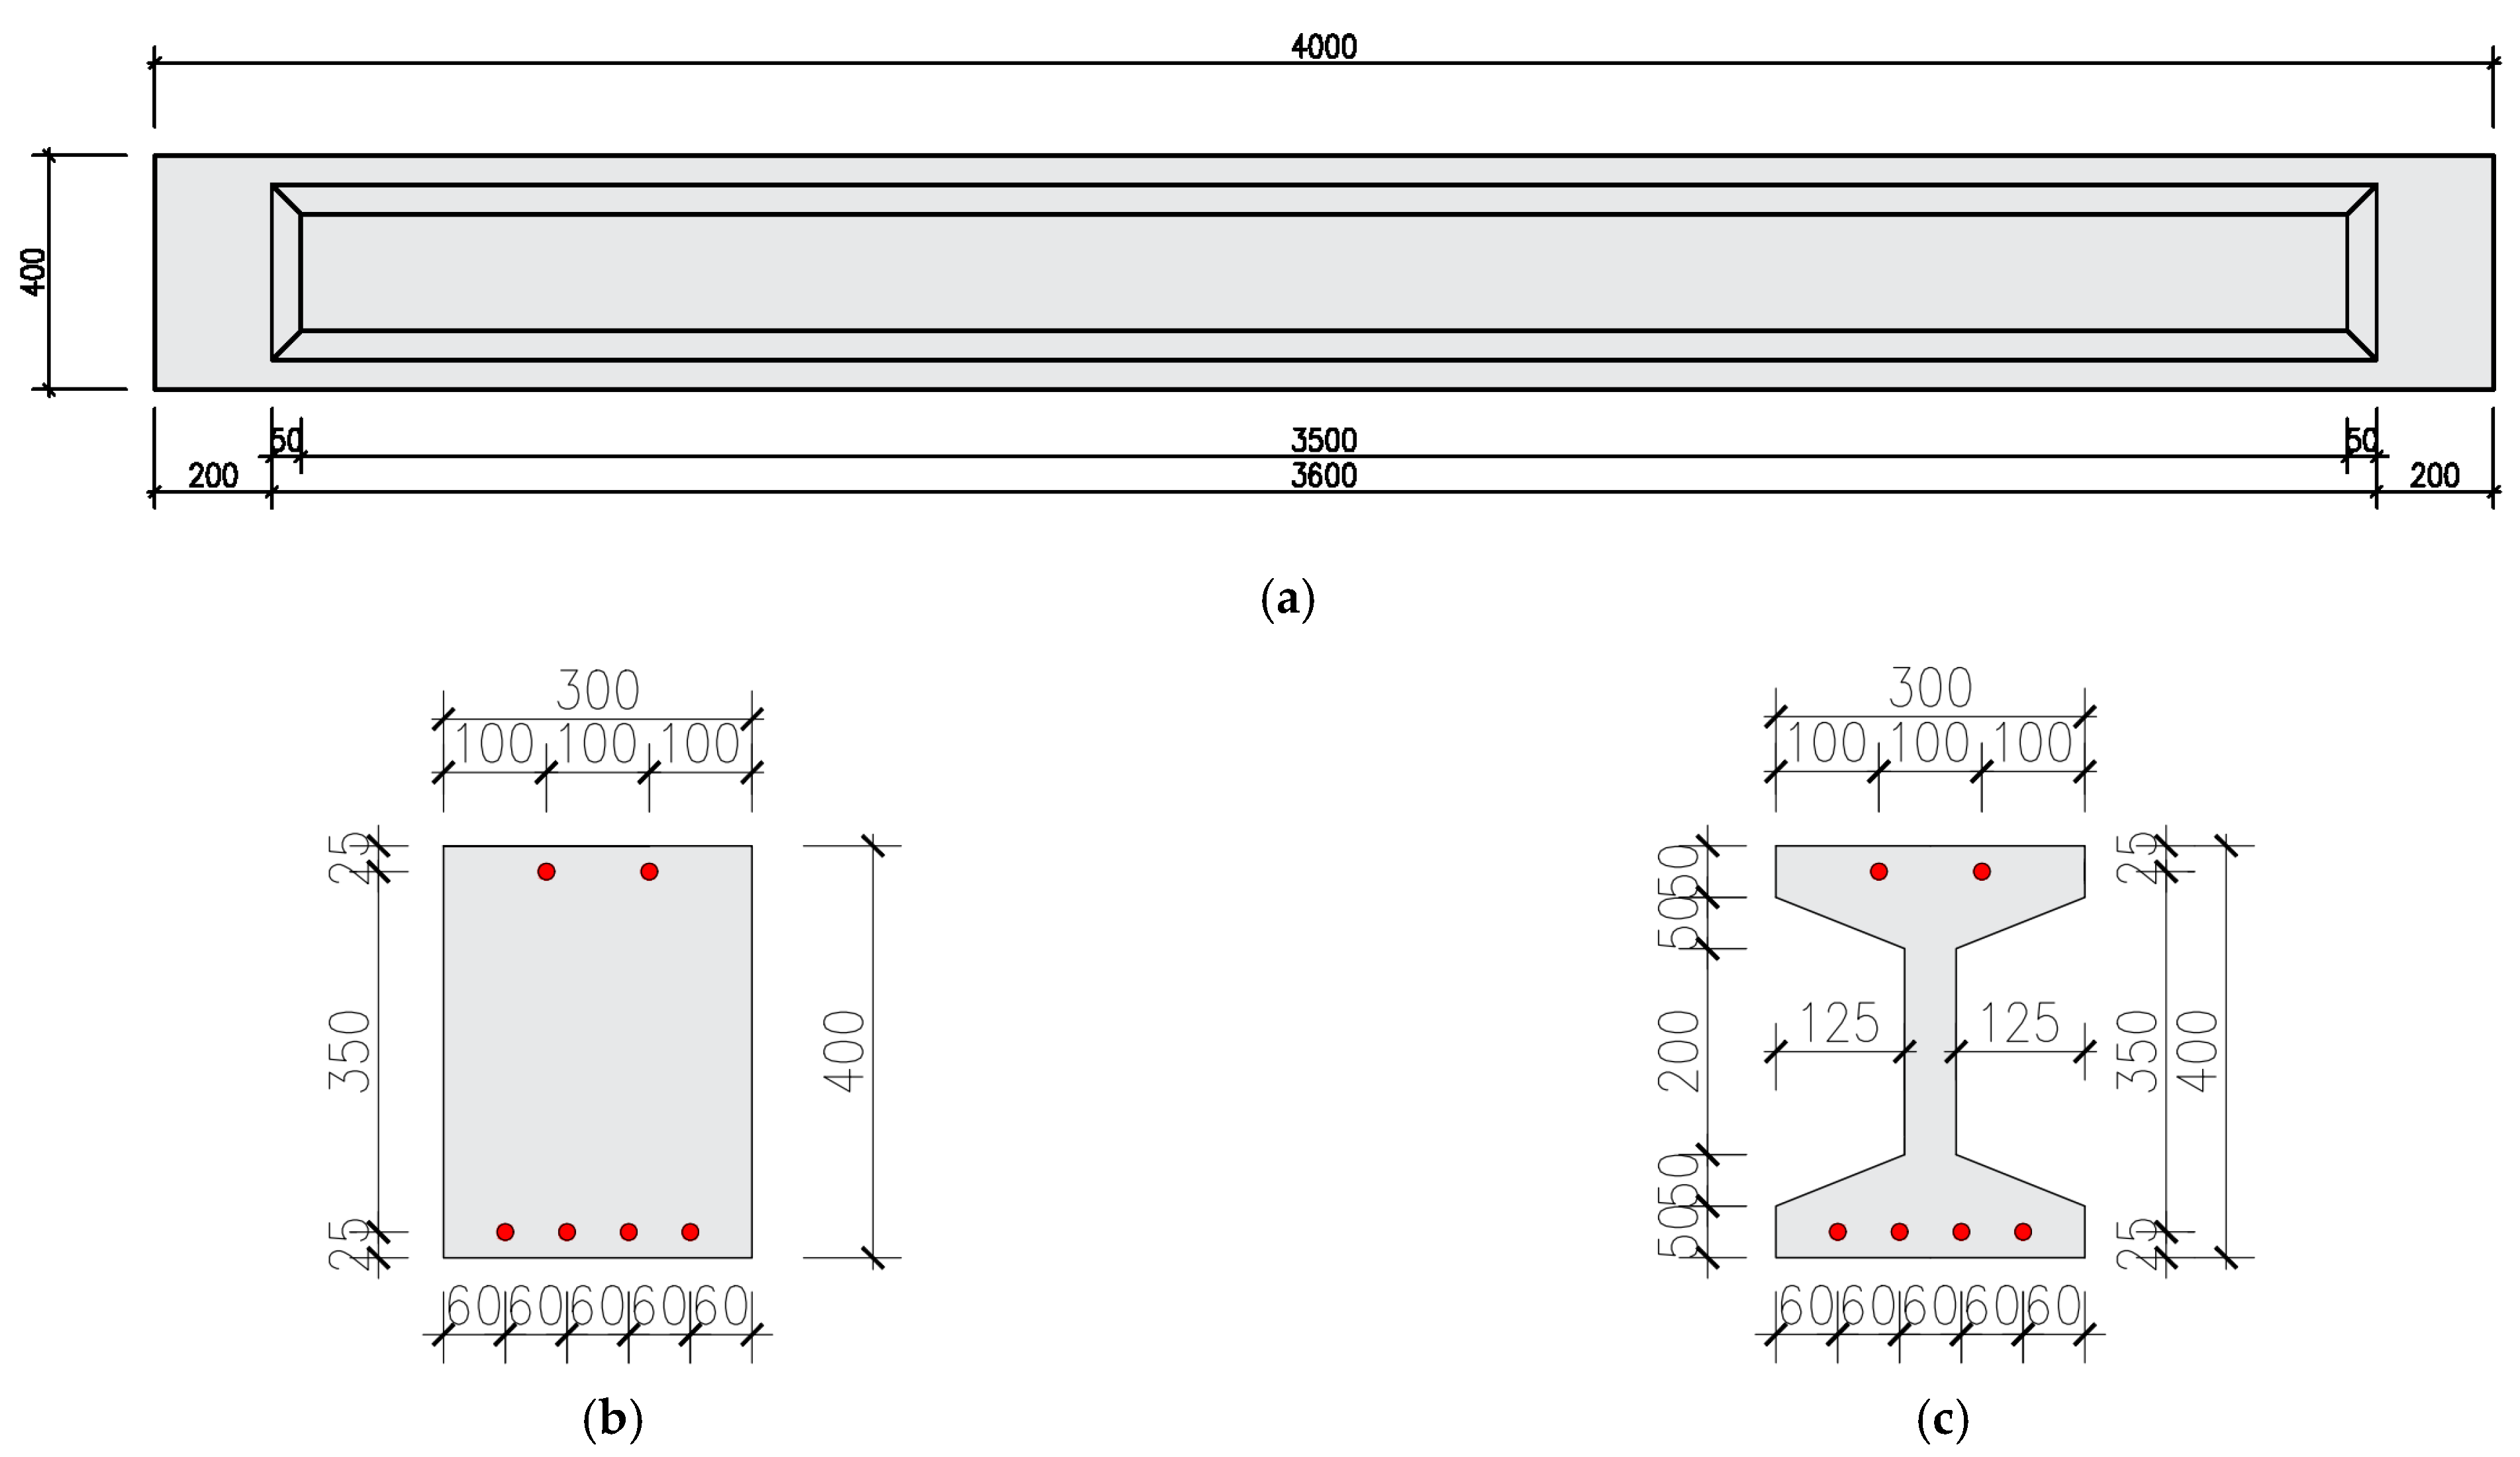
Figure 1. General dimensions of the test beams: (a) Side view of stirrup-free I-shaped UHPC beam; (b) Beam end section; (c) Mid-span section (unit: mm). The red circles in the figure represent the reinforcing bars.
Buildings 15 03129 g001
Figure 2. Material performance tests. (a) Cube compressive test; (b) Tensile test; (c) Splitting test; (d) Four-point bending test; (e) Elastic modulus test; (f) Steel reinforcement tensile test.
Buildings 15 03129 g002
Figure 3. Test set-up and measuring point arrangement for bending tests. (a) Schematic drawing of experimental setup; (b) Photo of experimental setup; (c) Arrangement of LVDTs and concrete strain gauges (unit: mm).
Buildings 15 03129 g003
Figure 4. Test set-up and measuring point arrangement for shear tests. (a) Schematic drawing of experimental setup; (b) Photo of experimental setup; (c) Arrangement of LVDTs and concrete strain gauges (unit: mm).
Buildings 15 03129 g004
Figure 5. Distribution of cracks in flexural test beams. (a) T-UI1-F- λ 4.8-R400; (b) T-UI2-F- λ 4.8-R400.
Buildings 15 03129 g005aBuildings 15 03129 g005b
Figure 6. Distribution of cracks in shear test beams. (a) T-UI1-S- λ 2.0-R400; (b) T-UI2-S- λ 2.0-R400.
Buildings 15 03129 g006
Figure 7. Test beam deflection along the length of the beam. (a) T-UI1-F- λ 4.8-R400 ( P u = 373.67 kN) (b) T-UI2-F- λ 4.8-R400 ( P u = 364.33 kN).
Buildings 15 03129 g007
Figure 8. Load-mid-span deflection curves.
Buildings 15 03129 g008
Figure 9. Load-concrete strain curves of the T-UI1-F- λ 4.8-R400. (a) N-side section of the loading point; (b) S-side section of the loading point.
Buildings 15 03129 g009
Figure 10. Load-concrete strain curves of the T-UI2-F- λ 4.8-R400. (a) N-side section of the loading point; (b) S-side section of the loading point.
Buildings 15 03129 g010
Figure 11. Concrete strain distribution of the T-UI1-F- λ 4.8-R400. (a) N-side section; (b) S-side section.
Buildings 15 03129 g011
Figure 12. Concrete strain distribution of the T-UI2-F- λ 4.8-R400. (a) N-side section; (b) S-side section.
Buildings 15 03129 g012
Figure 13. Load-concrete strain curve. (a) T-UI1-S- λ 2.0-R400; (b) T-UI2-S- λ 2.0-R400.
Buildings 15 03129 g013
Figure 14. Load-principal stress relationship for concrete diagonal section. (a) T-UI1-S- λ 2.0-R400; (b) T-UI2-S- λ 2.0-R400.
Buildings 15 03129 g014
Figure 15. Constitutive relationship curve of UHPC.
Buildings 15 03129 g015
Figure 16. Constitutive relationship curve of reinforcing steel.
Buildings 15 03129 g016
Figure 17. Geometric model of test beam. (a) Flexural test; (b) Shear test.
Buildings 15 03129 g017
Figure 18. Comparison of damage between the finite element model beams and the test beams. (a) Flexural test; (b) Shear test.
Buildings 15 03129 g018
Figure 19. Comparison of load-mid-span deflection curves from tests and finite element simulations. (a) Flexural test; (b) Shear test.
Buildings 15 03129 g019
Figure 20. Tensile and compressive damage maps of model beams with different shear-to-span ratios. (a) Span-to-depth ratio 1.0; (b) Span-to-depth ratio 1.25; (c) Span-to-depth ratio 1.5; (d) Span-to-depth ratio 1.75; (e) Span-to-depth ratio 2.0; (f) Span-to-depth ratio 2.25; (g) Span-to-depth ratio 2.5; (h) Span-to-depth ratio 2.75; (i) Span-to-depth ratio 3.0.
Buildings 15 03129 g020aBuildings 15 03129 g020bBuildings 15 03129 g020c
Figure 21. Comparison of finite element analysis with different shear span-to-depth ratios. (a) Load-displacement curve; (b) Shear capacity variation; (c) Deflection at loading point variation.
Buildings 15 03129 g021
Figure 22. Load-displacement curve. (a) Shear span-to-depth ratio 1.0; (b) Shear span-to-depth ratio 1.5; (c) Shear span-to-depth ratio 2.0.
Buildings 15 03129 g022
Figure 23. Comparison of finite element analysis of different longitudinal reinforcement strengths. (a) Shear capacity variation; (b) Deflection variation at loading point.
Buildings 15 03129 g023
Table 1. UHPC material mixing ratios (kg/m3).
TypeCementSilica FumeMicrosphere PowderQuartz SandSteel FiberWater ReducerWater
UHPC-2%86818110294116146153
Note: UHPC-2% indicates that the steel fiber volumetric content is 2%.
Table 2. Basic mechanical properties of UHPC.
Concrete TypeSteel Fiber Content f c u (MPa) f c (MPa) σ f 1   ( MPa ) σ f 2   ( MPa ) f f u   ( MPa ) f r r (MPa) f t u   ( MPa ) E c
( GPa )
ν
UHPC-2%2%158.8142.08.75.428.110.549.2943.620.23
Table 3. Tensile properties of reinforcing steel.
Reinforcing Steel Bar Samples f y (MPa) f u (MPa) E s   ( GPa )
HRB-400-16425.16611.29199
Note: The naming rule for deformed steel bar specimens is as follows: HRB—steel bar strength (400)—nominal diameter (16 mm).
Table 4. Summary of test results.
Test Specimen Name P c r
kN
c r
mm
σ c r
MPa
P c i
kN
c i
mm
ν c i
MPa
P u
kN
u
mm
ν u
MPa
Post-Cracking Performance M u
kN · m
T - UI 1 - F - λ 4.8-R4001504.3212.32407.776.4373.6721.3110.059.9%336.3
T - UI 2 - F - λ 4.8-R4001605.5812.42007.875.3364.3327.129.7056.1%327.9
T - UI 1 - S - λ 2.0-R400------2801.267.5900.036.5524.068.9%337.5
T - UI 2 - S - λ 2.0-R400------1801.394.8829.135.9922.178.3%310.9
Note: P c r —Cracking load of bending cracks; c r —Mid-span deflection at bending crack initiation; σ c r —Cracking strength of bending cracks ( σ c r = 6 M c r b h 0 2 ,   V c r = P c r 2 ); P c i —Cracking load of diagonal cracks; c i —Mid-span deflection at diagonal crack initiation; ν c i —Cracking strength of diagonal cracks ( ν c i = V c i b h 0 , V c i = P c i 2 ); P u —Ultimate load-bearing capacity; u —Vertical mid-span deflection under ultimate load-bearing capacity; ν u —Nominal shear stress at ultimate load. M u —Mid-span Moment ( M u = P u · a ).
Table 5. Plastic damage model parameters for UHPC.
ConcreteDilation AngleEccentricity Rate f b 0 / f c 0 KViscosity Coefficient
UHPC360.11.160.6670.005
Table 6. Reinforcing steel material parameters.
Reinforcing Steel Type Density   ( k g / m 3 )Young’s Modulus (MPa)Poisson’s RatioYield Strength (MPa)
HRB4007800200,0000.3420
HRB5007800200,0000.3520
HRB6007800200,0000.3620
Table 7. Comparison of test values of ultimate shear capacity and their corresponding test values of mid-span deflection with simulated values.
Specimen P u (kN) u (mm) P N u   ( kN ) N u   ( mm ) P N u / P u N u / u
T - UI 1 - F - λ 4.8-R400373.6721.31386.025.281.031.19
T - UI 2 - F - λ 4.8-R400364.3327.12386.025.281.060.93
T - UI 1 - S - λ 2.0-R400900.036.55865.15.360.97 0.82
T - UI 2 - S - λ 2.0-R400829.135.99865.15.361.05 0.89
Mean1.03 0.96
Standard Deviation0.04 0.16
Note: P N u —Simulated ultimate load capacity; N u —Simulated mid-span vertical deflection at ultimate load capacity.
Table 8. Parameter analysis working conditions.
Extended Parameter Test Beam Condition
Span-to-depth ratio4-m I-section UHPC beam without stirrupsλ = 1.0, 1.25, 1.5, 1.75, 2.0,
2.25, 2.5, 2.75, 3.0
Longitudinal reinforcement strengthUHPC beam without stirrupsHRB500, HRB600
Table 9. Summary of model results for different shear span-to-depth ratios.
CategorySpecimen Name V u (kN)Deflection at Loading Point u 1 (mm)Bending Moment
Mu (kN·m)
T-UI1-S-λ2.0-R400450.02 6.55 337.51
T-UI2-S-λ2.0-R400414.57 5.99 310.92
N-UI1-S-λ2.0-R400432.55 5.40 324.41
N-UI1-S-λ1.0-R400947.7 11.50 355.39
N-UI1-S-λ1.25-R400652.95 12.40 306.07
N-UI1-S-λ1.5-R400578.99 13.75 325.68
N-UI1-S-λ1.75-R400480.30 15.00 315.20
N-UI1-S-λ2.0-R400438.83 17.40 329.12
N-UI1-S-λ2.25-R400382.27 18.30 322.54
N-UI1-S-λ2.50-R400339.10 18.90 317.91
N-UI1-S-λ2.75-R400305.74 19.50 315.29
N-UI1-S-λ3.0-R400279.00 20.10 313.88
N-UI1-S-λ1.0-R500976.74 13.00 366.28
N-UI1-S-λ1.5-R500604.74 15.50 340.17
N-UI1-S-λ2.0-R500480.58 18.60 360.44
N-UI1-S-λ1.0-R6001068.80 14.00 400.80
N-UI1-S-λ1.5-R600631.94 17.25 355.47
N-UI1-S-λ2.0-R600489.56 21.60 367.17
Table 10. Comparison of French code calculated parameters and results with experimental values.
CategorySpecimen Name θ ° f c u
(MPa)
σ f
(MPa)
b
(mm)
z
(mm)
V c
(kN)
V s
(kN)
V f
(kN)
V u 1
(kN)
V u
(kN)
V u 1 / V u
T-UI1-S-λ2.0-R40037.20158.808.7050.00337.5049.620.00193.42243.04450.0150.54
T-UI2-S-λ2.0-R40036.40158.808.7050.00337.5049.620.00199.13248.75414.5650.60
N-UI1-S-λ2.0-R40040.19158.808.7050.00337.5049.620.00173.78223.40432.550.52
N-UI1-S-λ1.0-R40042.35158.808.7050.00337.5049.620.00161.06210.68947.710.22
N-UI1-S-λ1.25-R40044.11158.808.7050.00337.5049.620.00151.43201.05652.950.31
N-UI1-S-λ1.5-R40040.34158.808.7050.00337.5049.620.00172.87222.49578.990.38
N-UI1-S-λ1.75-R40040.99158.808.7050.00337.5049.620.00168.95218.57480.30.46
N-UI1-S-λ2.0-R40039.75158.808.7050.00337.5049.620.00176.52226.14438.830.52
N-UI1-S-λ2.25-R40039.64158.808.7050.00337.5049.620.00177.20226.82382.270.59
N-UI1-S-λ2.50-R40039.46158.808.7050.00337.5049.620.00178.34227.95339.10.67
N-UI1-S-λ2.75-R40039.65158.808.7050.00337.5049.620.00177.17226.79305.740.74
N-UI1-S-λ3.0-R40040.29158.808.7050.00337.5049.620.00173.19222.812790.80
N-UI1-S-λ1.0-R50042.68158.808.7050.00337.5049.620.00159.20208.82976.740.21
N-UI1-S-λ1.5-R50041.51158.808.7050.00337.5049.620.00165.86215.48604.740.36
N-UI1-S-λ2.0-R50039.40158.808.7050.00337.5049.620.00178.74228.35480.580.48
N-UI1-S-λ1.0-R60042.84158.808.7050.00337.5049.620.00158.30207.921068.80.19
N-UI1-S-λ1.5-R60041.35158.808.7050.00337.5049.620.00166.80216.41631.940.34
N-UI1-S-λ2.0-R60039.67158.808.7050.00337.5049.620.00177.03226.65489.560.46
Overall mean: 0.47; Standard deviation: 0.18; Coefficient of variation: 0.38
① Test beams: I—section, λ = 2.0; ② Simulated beams: I—section, λ = 2.0; ③ Simulated I—section beams, varying λ (4—point loading); ④ Simulated I—section beams, varying λ and reinforcement strength.
Table 11. Comparison of PCI report calculated parameters and results with experimental values.
CategorySpecimen Name θ ° f r r
(MPa)
b
(mm)
z
(mm)
V c f
(kN)
V s
(kN)
V u 2
(kN)
V u
(kN)
V u 2 / V u
T-UI1-S-λ2.0-R40036°10.50 50.00 337.50 325.17 0.00 325.17 450.0150.72
T-UI2-S-λ2.0-R40036°10.50 50.00 337.50 325.17 0.00 325.17 414.5650.78
N-UI1-S-λ2.0-R40036°10.50 50.00 337.50 325.17 0.00 325.17 432.550.75
N-UI1-S-λ1.0-R40036°10.50 50.00 337.50 325.17 0.00 325.17 947.710.34
N-UI1-S-λ1.25-R40036°10.50 50.00 337.50 325.17 0.00 325.17 652.950.50
N-UI1-S-λ1.5-R40036°10.50 50.00 337.50 325.17 0.00 325.17 578.990.56
N-UI1-S-λ1.75-R40036°10.50 50.00 337.50 325.17 0.00 325.17 480.30.68
N-UI1-S-λ2.0-R40036°10.50 50.00 337.50 325.17 0.00 325.17 438.830.74
N-UI1-S-λ2.25-R40036°10.50 50.00 337.50 325.17 0.00 325.17 382.270.85
N-UI1-S-λ2.50-R40036°10.50 50.00 337.50 325.17 0.00 325.17 339.10.96
N-UI1-S-λ2.75-R40036°10.50 50.00 337.50 325.17 0.00 325.17 305.741.06
N-UI1-S-λ3.0-R40036°10.50 50.00 337.50 325.17 0.00 325.17 2791.17
N-UI1-S-λ1.0-R50036°10.50 50.00 337.50 325.17 0.00 325.17 976.740.33
N-UI1-S-λ1.5-R50036°10.50 50.00 337.50 325.17 0.00 325.17 604.740.54
N-UI1-S-λ2.0-R50036°10.50 50.00 337.50 325.17 0.00 325.17 480.580.68
N-UI1-S-λ1.0-R60036°10.50 50.00 337.50 325.17 0.00 325.17 1068.80.30
N-UI1-S-λ1.5-R60036°10.50 50.00 337.50 325.17 0.00 325.17 631.940.51
N-UI1-S-λ2.0-R60036°10.50 50.00 337.50 325.17 0.00 325.17 489.560.66
Overall mean: 0.67; Standard deviation: 0.24; Coefficient of variation: 0.36
① Test beams: I—section, λ = 2.0; ② Simulated beams: I—section, λ = 2.0; ③ Simulated I—section beams, varying λ (4—point loading); ④ Simulated I—section beams, varying λ and reinforcement strength.
Table 12. Comparison of Feng’s Modified Compression Field Theory calculation results with Experimental Values.
CategorySpecimen Name λ f c u
(MPa)
b
(mm)
d
(mm)
ρ s v V c
(kN)
V s
(kN)
V u 3
(kN)
V u
(kN)
V u 3 / V u
T-UI1-S-λ2.0-R4002158.80 50.00 375.00 0.00%314.25 0.00 314.25 450.02 0.70
T-UI2-S-λ2.0-R4002158.80 50.00 375.00 0.00%314.25 0.00 314.25 414.57 0.76
N-UI1-S-λ2.0-R4002158.80 50.00 375.00 0.00%314.25 0.00 314.25 432.55 0.73
N-UI1-S-λ1.0-R4001.5158.80 50.00 375.00 0.00%448.93 0.00 448.93 947.710.47
N-UI1-S-λ1.25-R4001.5158.80 50.00 375.00 0.00%448.93 0.00 448.93 652.95 0.69
N-UI1-S-λ1.5-R4001.5158.80 50.00 375.00 0.00%448.93 0.00 448.93 578.99 0.78
N-UI1-S-λ1.75-R4001.75158.80 50.00 375.00 0.00%371.97 0.00 371.97 480.30 0.77
N-UI1-S-λ2.0-R4002158.80 50.00 375.00 0.00%314.25 0.00 314.25 438.83 0.72
N-UI1-S-λ2.25-R4002.25158.80 50.00 375.00 0.00%269.36 0.00 269.36 382.27 0.70
N-UI1-S-λ2.50-R4002.5158.80 50.00 375.00 0.00%233.44 0.00 233.44 339.10 0.69
N-UI1-S-λ2.75-R4002.75158.80 50.00 375.00 0.00%204.06 0.00 204.06 305.74 0.67
N-UI1-S-λ3.0-R4003158.80 50.00 375.00 0.00%179.57 0.00 179.57 279.00 0.64
N-UI1-S-λ1.0-R5001.5158.80 50.00 375.00 0.00%448.93 0.00 448.93 976.74 0.46
N-UI1-S-λ1.5-R5001.5158.80 50.00 375.00 0.00%448.93 0.00 448.93 604.74 0.74
N-UI1-S-λ2.0-R5002158.80 50.00 375.00 0.00%314.25 0.00 314.25 480.58 0.65
N-UI1-S-λ1.0-R6001.5158.80 50.00 375.00 0.00%448.93 0.00 448.93 1068.80 0.42
N-UI1-S-λ1.5-R6001.5158.80 50.00 375.00 0.00%448.93 0.00 448.93 631.94 0.71
N-UI1-S-λ2.0-R6002158.80 50.00 375.00 0.00%314.25 0.00 314.25 489.56 0.64
Overall mean: 0.66; Standard deviation: 0.11; Coefficient of variation: 0.16
① Test beams: I—section, λ = 2.0; ② Simulated beams: I—section, λ = 2.0; ③ Simulated I—section beams, varying λ (4—point loading); ④ Simulated I—section beams, varying λ and reinforcement strength.
Table 13. Comparison of Ye’s regression analysis method calculation results with experimental values.
CategorySpecimen Name λ λ f f c u
(MPa)
b
(mm)
d
(mm)
ρ s V u 4
(kN)
V u
(kN)
V u 4 / V u
T-UI1-S-λ2.0-R40022.00 158.80 50.00 375.00 4.30%361.48 450.0150.80
T-UI2-S-λ2.0-R40022.00 158.80 50.00 375.00 4.30%361.48 414.5650.87
N-UI1-S-λ2.0-R40022.00 158.80 50.00 375.00 4.30%361.48 432.550.84
N-UI1-S-λ1.0-R40012.00 158.80 50.00 375.00 4.30%545.76 947.710.58
N-UI1-S-λ1.25-R4001.252.00 158.80 50.00 375.00 4.30%475.39 652.950.73
N-UI1-S-λ1.5-R4001.52.00 158.80 50.00 375.00 4.30%426.33 578.990.74
N-UI1-S-λ1.75-R4001.752.00 158.80 50.00 375.00 4.30%389.85 480.30.81
N-UI1-S-λ2.0-R40022.00 158.80 50.00 375.00 4.30%361.48 438.830.82
N-UI1-S-λ2.25-R4002.252.00 158.80 50.00 375.00 4.30%338.66 382.270.89
N-UI1-S-λ2.50-R4002.52.00 158.80 50.00 375.00 4.30%319.82 339.10.94
N-UI1-S-λ2.75-R4002.752.00 158.80 50.00 375.00 4.30%303.95 305.740.99
N-UI1-S-λ3.0-R40032.00 158.80 50.00 375.00 4.30%290.36 2791.04
N-UI1-S-λ1.0-R50012.00 158.80 50.00 375.00 4.30%545.76 976.740.56
N-UI1-S-λ1.5-R5001.52.00 158.80 50.00 375.00 4.30%426.33 604.740.70
N-UI1-S-λ2.0-R50022.00 158.80 50.00 375.00 4.30%361.48 480.580.75
N-UI1-S-λ1.0-R60012.00 158.80 50.00 375.00 4.30%545.76 1068.80.51
N-UI1-S-λ1.5-R6001.52.00 158.80 50.00 375.00 4.30%426.33 631.940.67
N-UI1-S-λ2.0-R60022.00 158.80 50.00 375.00 4.30%361.48 489.560.74
Overall mean: 0.787; Standard deviation: 0.14; Coefficient of variation: 0.19
① Test beams: I—section, λ = 2.0; ② Simulated beams: I—section, λ = 2.0; ③ Simulated I—section beams, varying λ (4—point loading); ④ Simulated I—section beams, varying λ and reinforcement strength.
Table 14. Summary and analysis of ratios of calculated to experimental values.
CategorySpecimen Name V u 1 / V u V u 2 / V u V u 3 / V u V u 4 / V u
T-UI1-S-2.0-R4000.54 0.72 0.70 0.80
T-UI2-S-2.0-R4000.60 0.78 0.76 0.87
N-UI1-S-2.0-R4000.52 0.75 0.73 0.84
N-UI1-S-1.0-R4000.22 0.34 0.47 0.58
N-UI1-S-1.25-R4000.31 0.50 0.690.73
N-UI1-S-1.5-R4000.38 0.56 0.780.74
N-UI1-S-1.75-R4000.46 0.68 0.770.81
N-UI1-S-2.0-R4000.52 0.74 0.720.82
N-UI1-S-λ2.25-R4000.59 0.85 0.700.89
N-UI1-S-λ2.50-R4000.67 0.96 0.690.94
N-UI1-S-λ2.75-R4000.74 1.06 0.670.99
N-UI1-S-λ3.0-R4000.80 1.17 0.641.04
N-UI1-S-1.0-R5000.21 0.33 0.460.56
N-UI1-S-1.5-R5000.36 0.54 0.740.70
N-UI1-S-2.0-R5000.48 0.68 0.650.75
N-UI1-S-1.0-R6000.19 0.30 0.420.51
N-UI1-S-1.5-R6000.34 0.51 0.710.67
N-UI1-S-2.0-R6000.46 0.66 0.640.74
Mean0.470.67 0.660.78
Standard Deviation0.180.24 0.110.14
Coefficient of Variation0.380.36 0.160.19
① Test beams: I-section, λ = 2.0; ② Simulated beams: I-section, λ = 2.0; ③ Simulated I-section beams, varying λ (4-point loading); ④ Simulated I—section beams, varying λ and reinforcement strength.
Table 15. Summary and analysis of ratios of calculated to experimental values for beams with large shear span-to-depth ratios.
CategorySpecimen Name V u 1 / V u V u 2 / V u V u 3 / V u V u 4 / V u
N-UI1-S-λ2.25-R4000.590.850.70.89
N-UI1-S-λ2.50-R4000.670.960.690.94
N-UI1-S-λ2.75-R4000.741.060.670.99
N-UI1-S-λ3.0-R4000.81.170.641.04
Mean0.701.010.680.97
Standard Deviation0.090.140.030.06
Coefficient of Variation0.130.140.040.07
③ Simulated I-section beams, varying λ (4-point loading).
Disclaimer/Publisher’s Note: The statements, opinions and data contained in all publications are solely those of the individual author(s) and contributor(s) and not of MDPI and/or the editor(s). MDPI and/or the editor(s) disclaim responsibility for any injury to people or property resulting from any ideas, methods, instructions or products referred to in the content.