Article

Deteriorated Cyclic Behaviour of Corroded RC Framed Elements: A Practical Proposal for Their Modelling

by
José Barradas-Hernández
1,
Dariniel Barrera-Jiménez
1,*,
Irving Ramírez-González
1,
Franco Carpio-Santamaría
1,*,
Alejandro Vargas-Colorado
1,
Sergio Márquez-Domínguez
1,
Rolando Salgado-Estrada
2,
José Piña-Flores
1 and
Abigail Zamora-Hernández
1
1
Instituto de Ingeniería, Universidad Veracruzana, S. S. Juan Pablo II, Zona Universitaria, Boca del Río 94294, VER, Mexico
2
Facultad de Ingeniería de la Construcción y el Hábitat, Universidad Veracruzana, Adolfo Ruiz Cortines No. 455, Fracc. Costa Verde, Boca del Río 94294, VER, Mexico
*
Authors to whom correspondence should be addressed.
Buildings 2025, 15(17), 3110; https://doi.org/10.3390/buildings15173110
Submission received: 17 July 2025 / Revised: 11 August 2025 / Accepted: 27 August 2025 / Published: 29 August 2025
(This article belongs to the Special Issue Seismic Performance and Durability of Engineering Structures)

Abstract

Corrosion is a phenomenon that significantly impacts the durability of reinforced concrete (RC) structures, particularly in highly corrosive environments like coastal regions. The existing numerical modelling often relies on complex approaches that are impractical for structural assessment. For this reason, this study proposes a simplified numerical modelling approach to simulate the cyclic behaviour of existing RC framed structures with corrosion levels (η) below 25%. The proposed modelling employs concentrated plasticity hinges for beams and fiber sections for columns, incorporating corrosion-induced degradation through modified backbone curves and material properties based on the corrosion level of the structural element. The modelling approach was validated against experimental results from the literature; the proposed model adequately captures hysteretic energy, lateral load, and deformation capacities, with maximum errors of 11% for maximum lateral load, 12% for ultimate load, and 33% for dissipated energy in RC frames. For isolated columns, the errors were 11, 12, and 22%, respectively. In addition, a maximum difference of 7% was found in the lateral load capacity of the corroded frames associated with the Life Safety limit state. Finally, it was concluded that the proposed methodology is suitable for representing the cyclic behaviour of corroded RC columns and frames and provides engineers with a tool to evaluate the behaviour of corroded structures without resorting to complex models.

1. Introduction

Corrosion is a critical threat to the durability and safety of reinforced concrete (RC) structures, particularly in coastal areas with high chloride concentrations that accelerate steel degradation [1,2,3], such as The Gulf of Mexico, the second most corrosive area globally [4,5,6] due to strong winds and high humidity [7]. This process reduces the cross-sectional rebar area [8], diminishes the bond strength of the concrete [9,10,11], causes concrete cover cracking [12,13,14], and induces core confinement decrement [15,16,17], ultimately compromising the load and deformation capacities of RC elements [18,19] (see Figure 1). The latter are essential to understand the behaviour of structures when they are under corrosion process.
Although the effects of corrosion at the material level have been widely investigated, such as reduced rebar area and concrete strength properties [8,9,10,11,12,13,14,15,16,17], there remains a significant gap in simplified and practical numerical models for assessing the hysteretic behaviour of corroded RC frames under cyclic loading. The existing approaches often rely on complex finite element models, which are computationally intensive and require more specialized expertise [20,21,22,23,24], making them impractical for routine engineering purposes.
Structural design codes, such as NTC-Concrete, underscore the need to account for the deterioration effects, including those attributable to corrosion [25,26,27]. In this instance, it is deemed permissible to acknowledge a certain degree of deterioration in the rebar, considering the extant diameter of both the longitudinal and transversal reinforcing bars, in conjunction with the spalling of the concrete cover. In this context, the corrosion level (η) is the main issue to assess rebar corrosion, as it quantifies the loss of cross-sectional area in the rebars. For practical purposes, if the corrosion level is more than 25%, it will be necessary to replace the element or to add another type of reinforcement [27,28]. Therefore, in structures with a corrosion level (η) below 25%, it is important to assess their capacity and response to a corrosion deterioration process under seismic actions, which is the motivation behind the present research. In this sense, when η is equal to 1, the reinforcement cross-sectional area is equal to the original one and, by contrast, when η is equal to 0, it means that the complete remaining area is totally degraded.
The main purpose of this paper is to put forward a simplified modelling approach for the cyclic behaviour of corroded (η < 25%) RC isolated columns and frames, which can be replicated using conventional software (ETABS v22) [29], providing engineers with a suitable tool to evaluate the seismic performance of corroded structures without resorting to complex models. To that end, a macro-model based on frame elements was developed. It should be noted that the numerical element formulations and the structural analysis procedure remain unchanged. This model must integrate the hysteretic behaviour through concentrated plasticity hinges in beams and discretize the fiber-section along the columns. These considerations are in accordance with the recommendations set out in NTC-Concrete [25], as well as others found in the literature [16,30].
A suitable corrosion degradation analysis was performed on the hysteretic behaviour, which includes the material behaviour of the fiber sections and backbone curve at the plastic hinge. The validation of the cyclic behaviour of the numerical modelling proposal was carried out by means of a comparison between the experimental tests of isolated columns and frames. In this manner, the energy dissipation capacity, pinching effect, lateral load, and drift ratio capacities were evaluated.

2. Modelling Considerations and Experimental Tests

2.1. Description of the Proposed Modelling

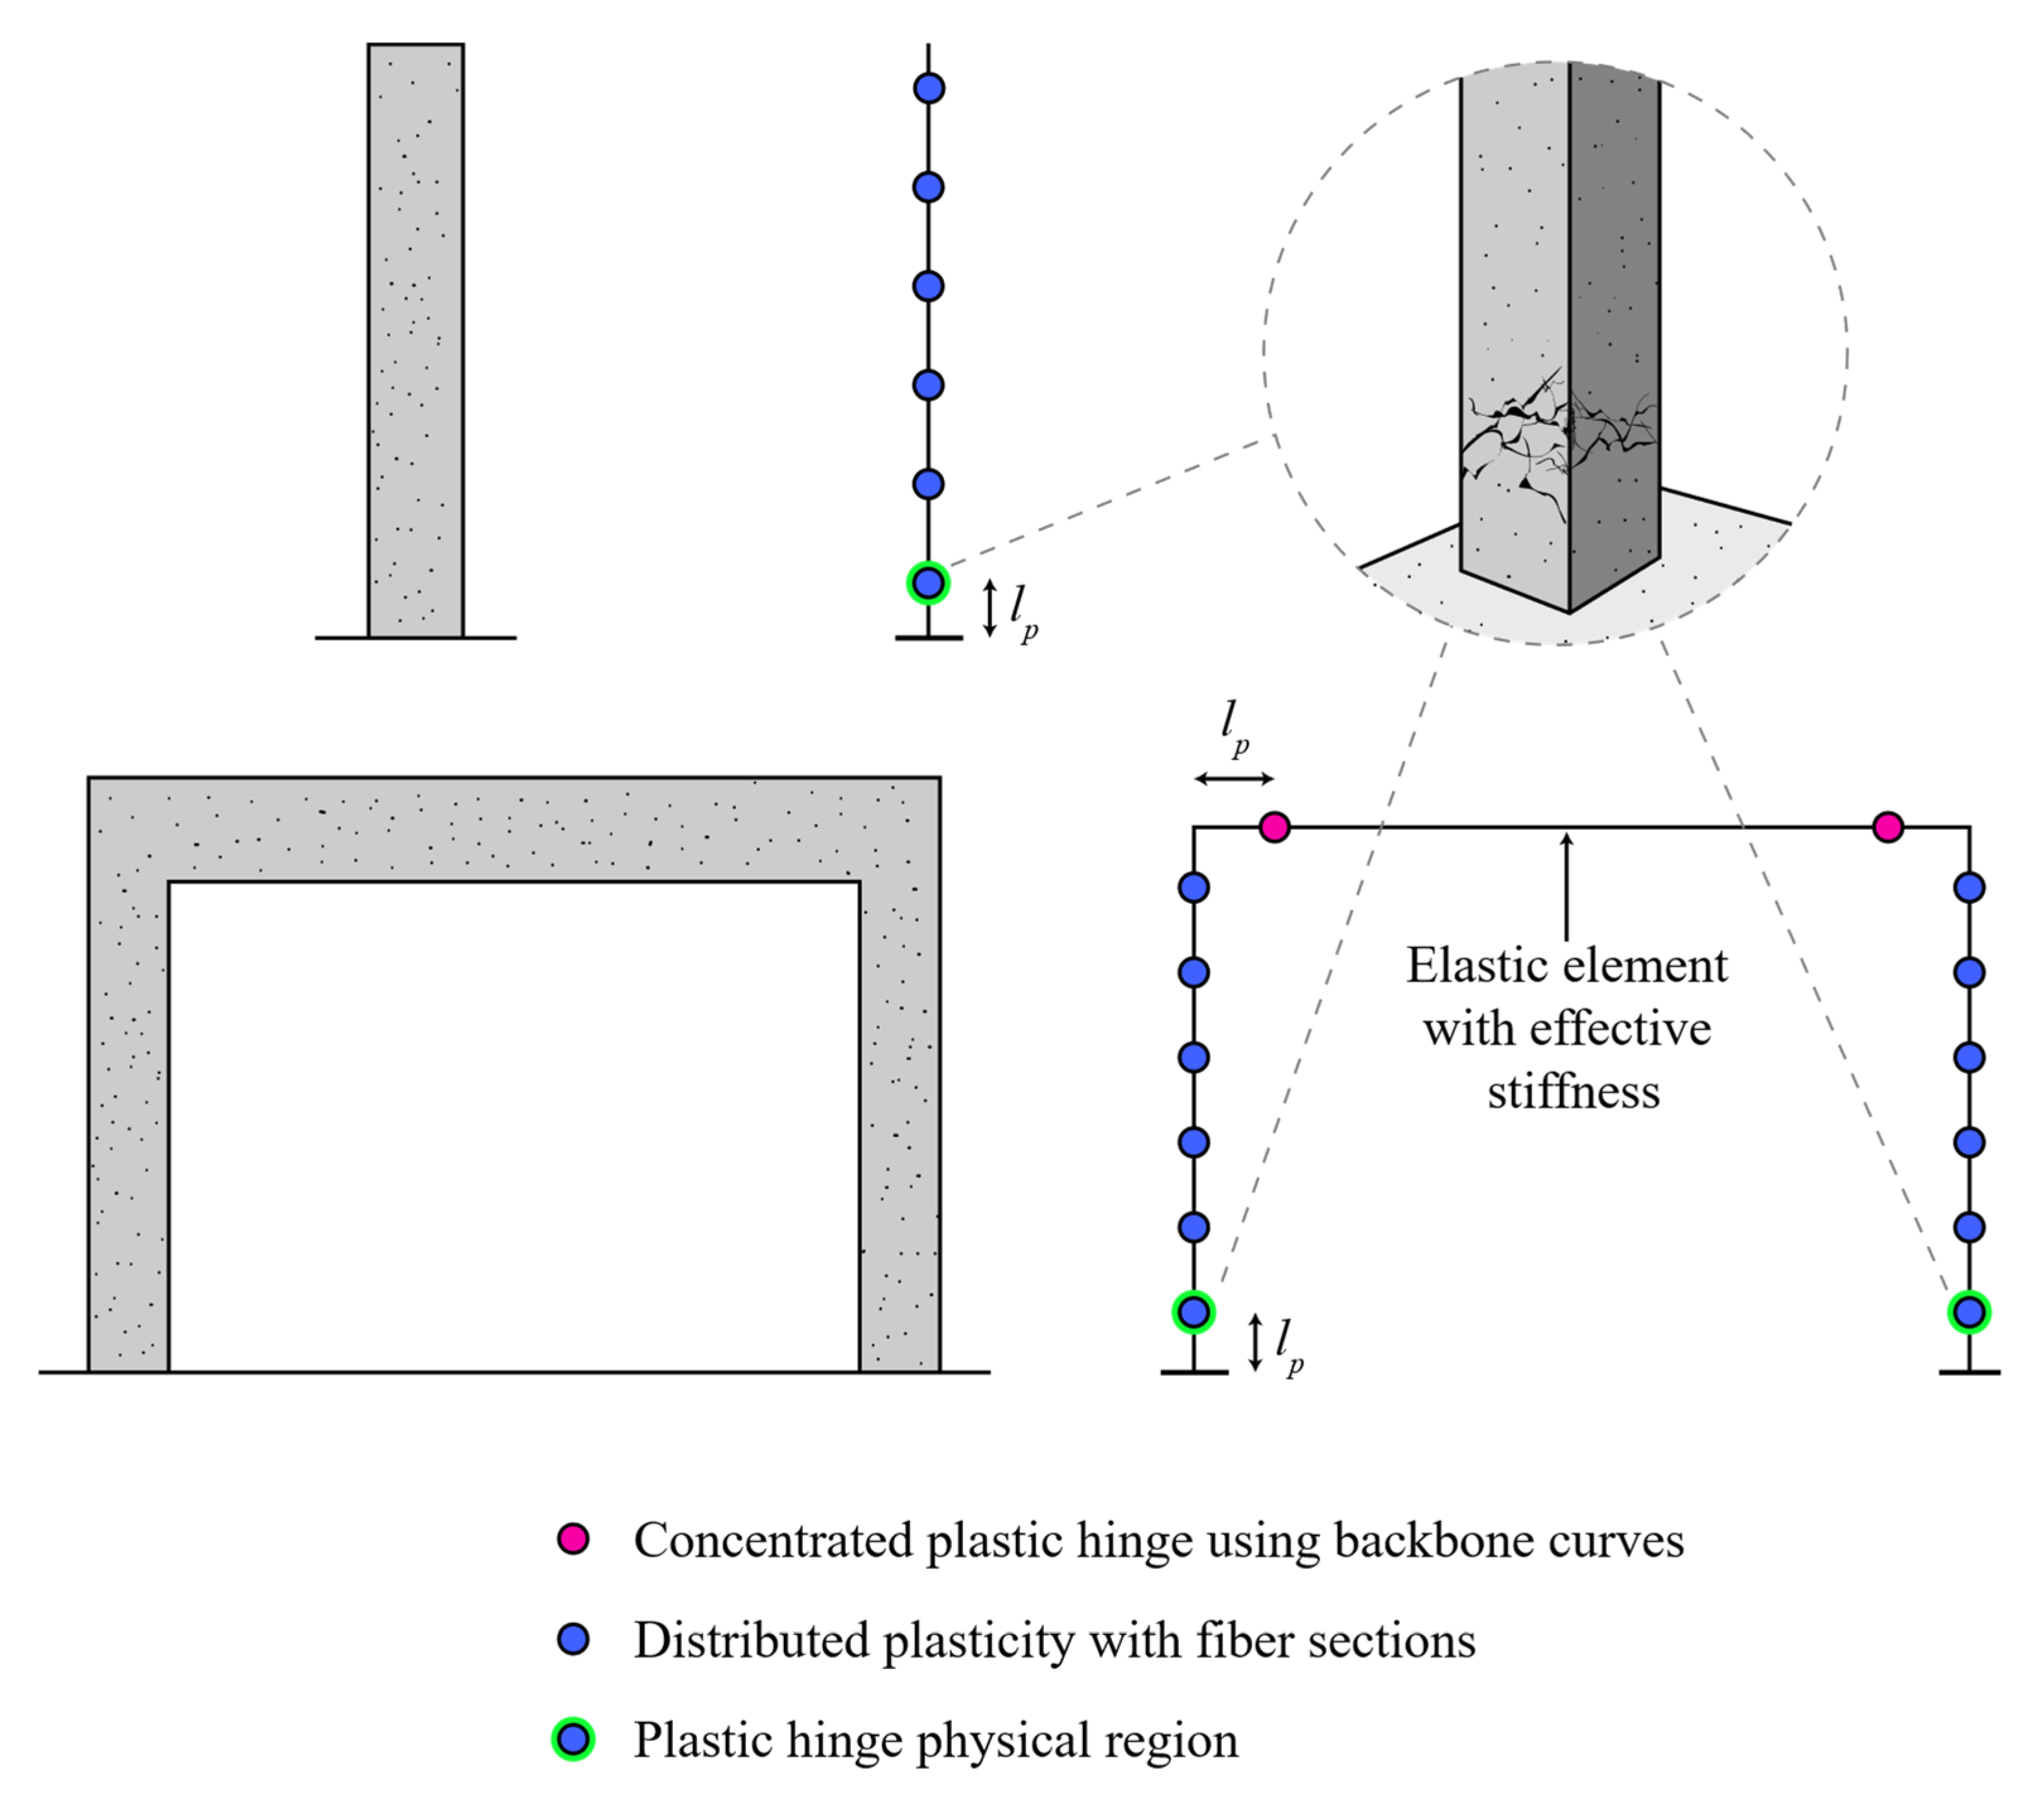
The proposed numerical modelling exemplified the cyclic behaviour of RC columns and frames in corrosion processes (for η < 0.25). To this end, the structural elements (beams and columns) were modelled by using unidimensional frame elements (second order). Plastic hinges were incorporated into both the fiber sections within the columns [30,31] and the concentrated plasticity hinges within the beams [32,33] (see Figure 2) to reduce the computational effort. The plastic hinge length was defined by Equation (1), where h represents the section depth [25].
0.5   h l p 0.75   h
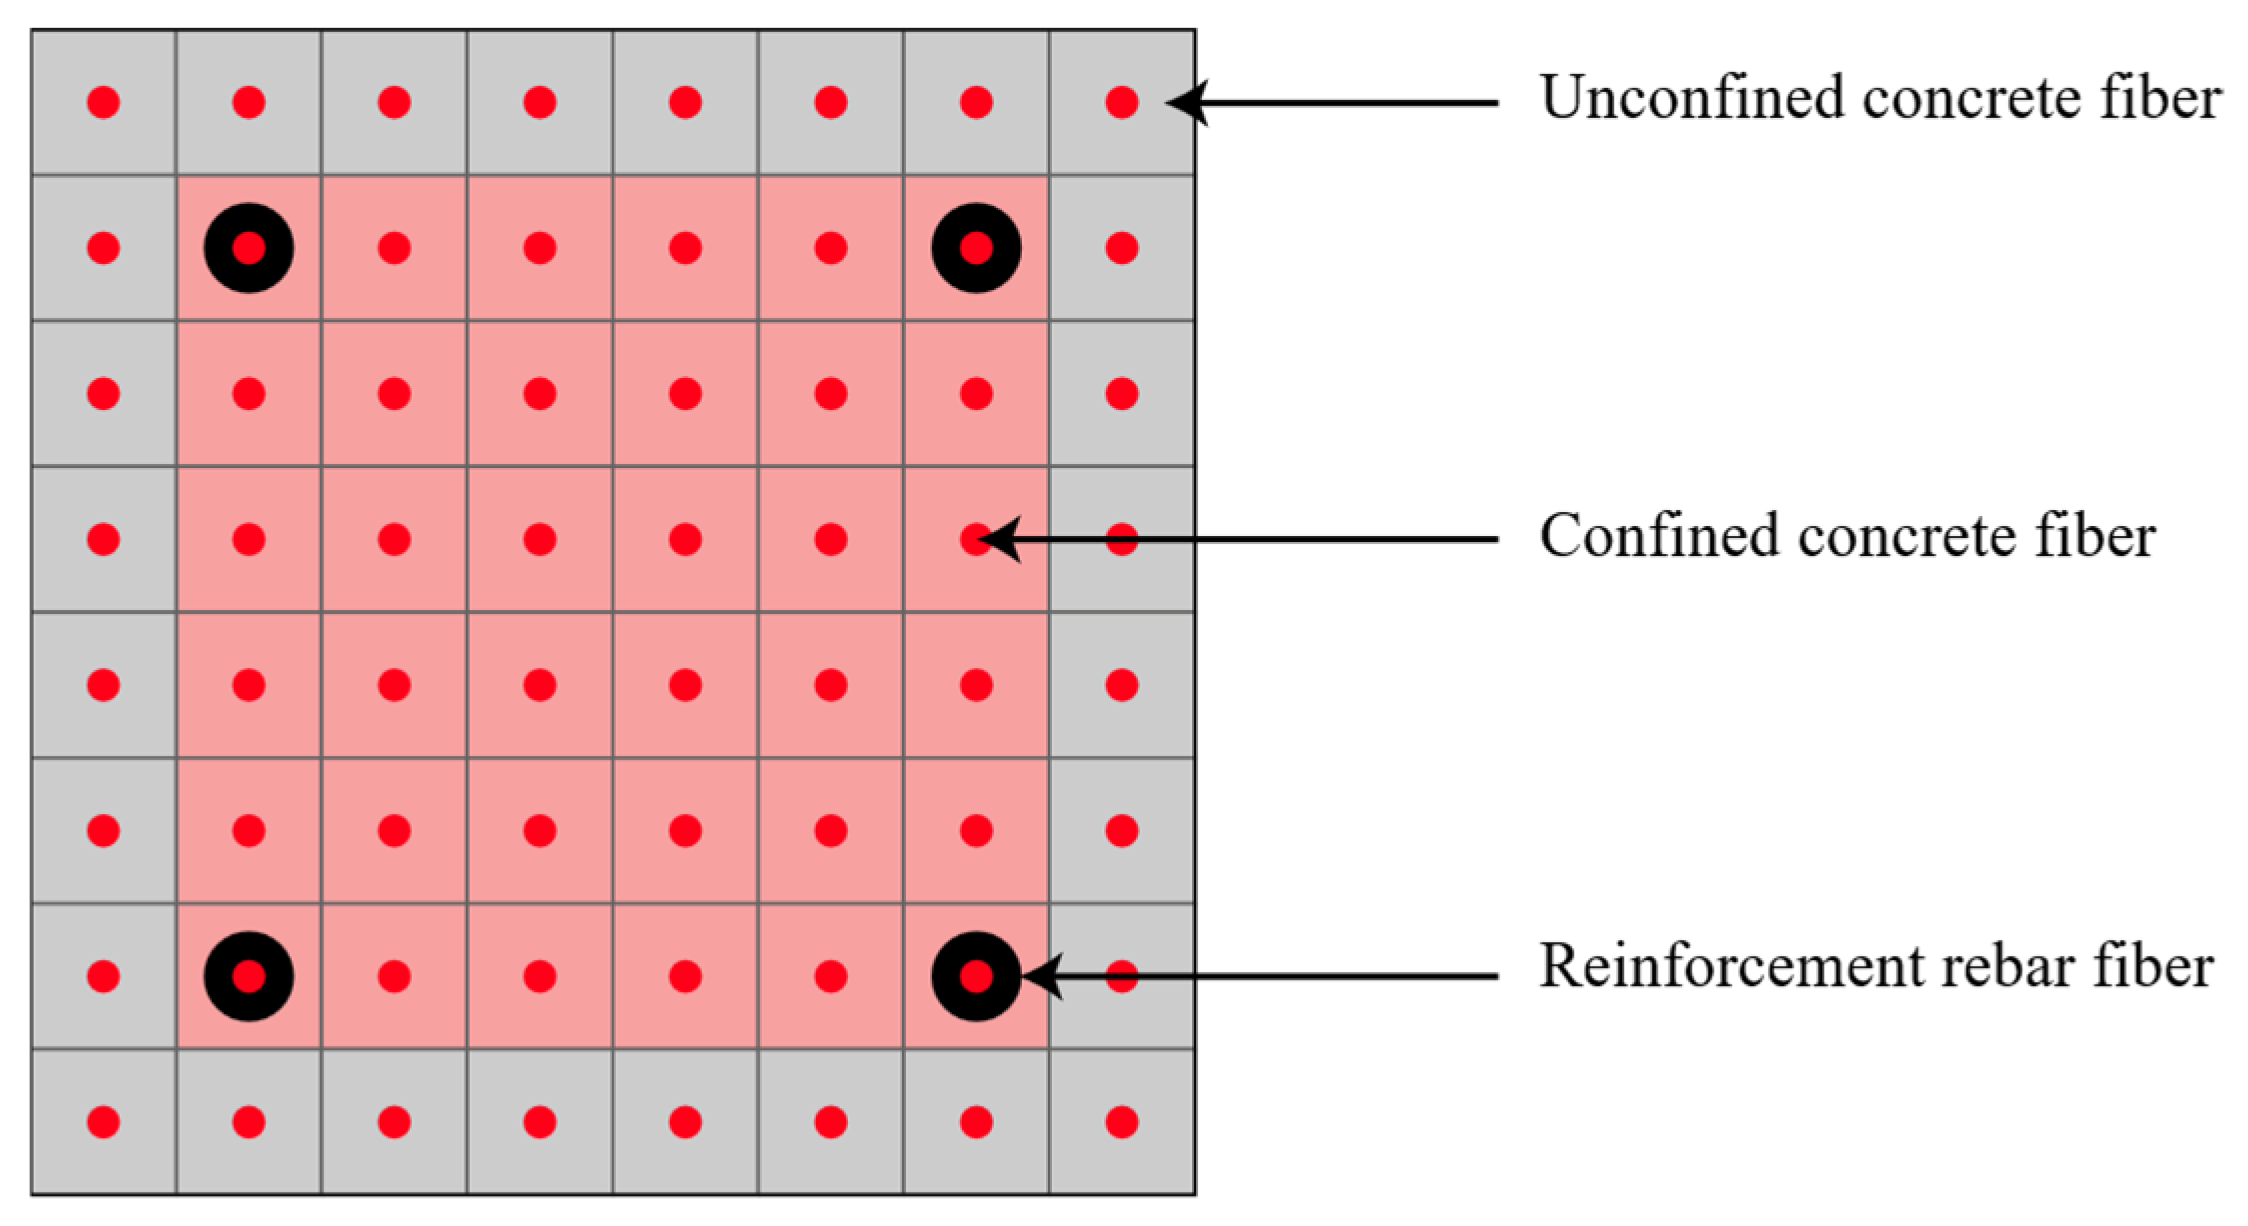
For structural elements in flexure-compression (columns), the stiffness degradation effect due to cracking caused by tension was incorporated as fiber sections distributed along the length (l) of the bar element (0.15l, see Figure 2). Furthermore, in Arias et al. [30] the fiber sections were meshed in an 8 × 8 configuration (see Figure 3).
In the fiber sections, the material behaviour of reinforcing steel and confined and unconfined concrete were represented by models proposed by Park and Paulay [34] and Mander et al. [35], respectively.
In Figure 4, the degradation effect in the longitudinal reinforcement is incorporated [36,37,38], where the corrosion level (η) was directly implemented into the model by modifying the cross-sectional area and ultimate strain of the reinforcement steel. Moreover, in this paper, it is assumed there is a uniform reinforced steel corrosion and a perfect bond between the reinforced steel bars and the concrete. In this sense, the reduction in bond strength is negligible (less than 10%) for corrosion levels below 17% [9]. As follows, a nonlinear cross-section analysis of the structural elements is performed assuming uniform corrosion in the reinforcement bars, which implies that their centroid remains static.
In addition, the confinement effect will be diminished in the concrete core due to the degradation of the reinforcement, where the longitudinal and transverse cross-sectional areas of the rebars were reduced, even though the concrete properties remain unchanged [16,39]. For longitudinal and transverse residual reinforcement, their reduced area (Acorr, see Equation (2)) and ultimate strain (εucorr, see Equation (3)) were calculated according to corrosion level (η) considering their original cross-sectional area (A) and ultimate strain (εu).
In the concrete cover, cracking effects due to the expansion of corroded reinforcement were incorporated by reducing the cover’s compressive strength, as proposed by Shayanfar et al. [40] (fcc, Equations (4)–(7)). The degradation of concrete strength (λ) depends on its water–cement ratio (A/C) and longitudinal reinforcement corrosion level (η). For this paper, a water–cement ratio of 0.45 was applied, and the concrete with cracking effects due to corrosion appears, and is called corroded concrete. Figure 4 shows the applied deteriorations in the structural elements.
A c o r r = A · η
ε u c o r r = ( 1 2.59 η ) ε u
f c c = ( 1 λ ) f c
λ = 2.72 η 1.98 ,   for   A / C = 0.40
λ = 2.28 η 1.73 ,   for   A / C = 0.45
λ = 2.57 η 1.87 ,   for   A / C = 0.50
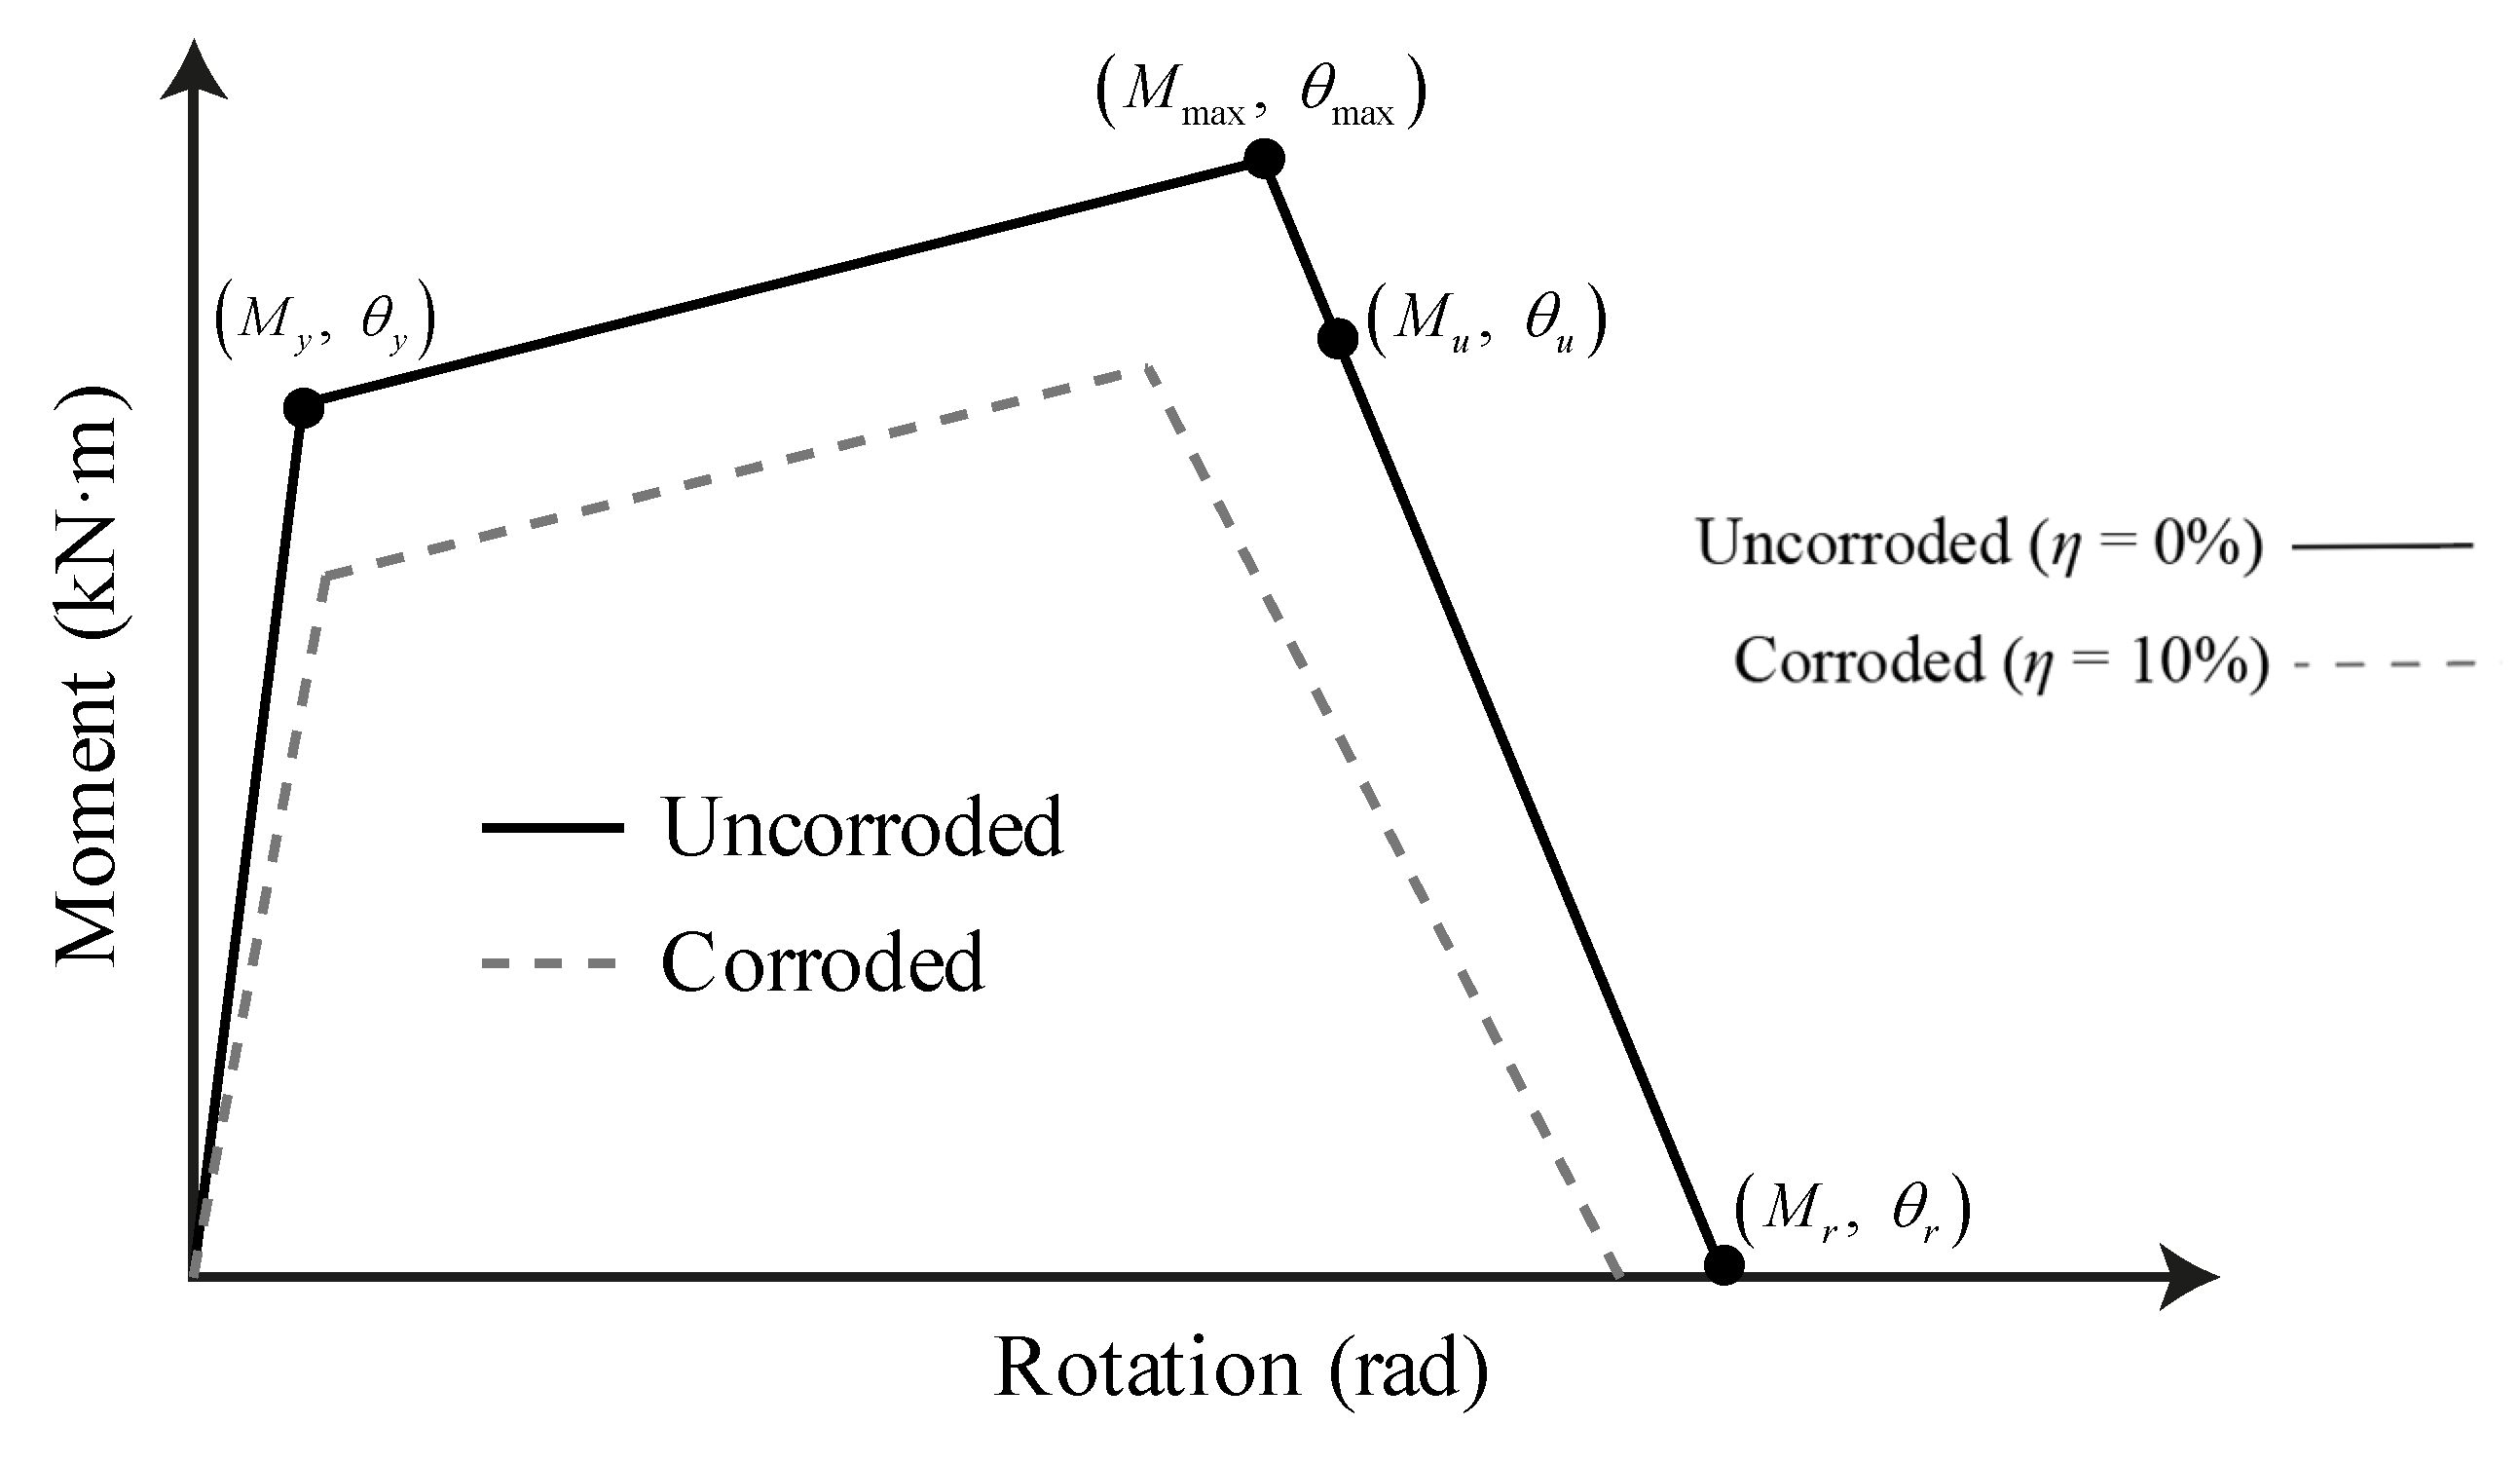
For the structural elements (beams) in bending, the nonlinear material behaviour was incorporated through concentrated plasticity hinges with flexural backbone curves, where, according to the NTC-Concrete [25], the moment–rotation curve was conceptualized as a trilinear curve whose tendency follows the yield (My), maximum (Mmax), and residual (Mr) bending moments (see Figure 5). The bending moments and their rotations were calculated using Equations (8)–(12) [25]:
M m a x = ( 1.25 ) 0.89 ϑ 0.91 0.01 c u f c ( M y )
θ m a x = 0.12 1 + 0.55 a s 1 0.16 ϑ 0.02 + 40 ρ s h 0.43 0.54 0.01 c u f c 0.66 0.1 s n 2.27 10 ρ
θ u = θ y + θ r θ m a x M r M u ( M u M r )
θ r = ( 0.76 ) 0.031 ϑ 0.02 + 40 ρ s h 1.02   0.10
M r = 0
where as1 = 1, unless slippage is prevented by bond failure, ϑ = P/Agfc is the axial load index, psh = Ash/sb is the transverse reinforcement ratio in the plastic hinge zone, cu is equal to 1, sn = (s/db)(fy/100)0.5 is a factor that considers the buckling of the stirrups, s is the separation of the stirrups, db is the stirrup diameter, and ρ is the longitudinal reinforcement ratio. Moreover, the cracking effect along the length of the beams was considered by reducing the inertia moment (Ig) of the bar elements (0.35Ig) [25]. The deterioration effect due to corrosion was considered by reducing the longitudinal and transverse reinforcement ratio, according to the corrosion level in Equation (2).
For the nonlinear cyclic behaviour of concrete and reinforcement steel, the Pivot model was used [41], which is widely used and has proven reliable for general cyclic behaviour [42]. Nevertheless, the Pivot model was developed for non-corroded RC elements, thus it is not possible to explicitly model some deterioration due to corrosion (e.g., non-uniform section loss from pitting and bond–slip degradation [41,43]). However, the Pivot model was used due to its widespread use in conventional and academic software [43], consistent with the practical focus of this paper. The values of the Pivot parameters were defined, considering the recommendations for the RC elements [43,44,45], for the unloading stiffness (α) and pinching behaviour (β) factors, which were equal to 10 and 0.4, respectively.

2.2. Procedure for the Validation of the Proposed Modelling

The proposed numerical modelling for corroded RC columns was subjected to validation by comparing it with the experimental results reported by Yang et al. [46], as is described in Section 2.3. The model was also validated by using corroded the RC frames evaluated by Chen and Jiang [47], as is shown in Section 2.4.
In both experimental campaigns, the structural elements were subjected to an accelerated process of uniform corrosion on all four faces of their perimeter. Nevertheless, as deterioration did not occur uniformly along the structural elements, the corrosion level reported closest to the plasticity hinge or fiber section was considered in the numerical models. This simplification was assumed due to the nonlinear behaviour in a framed element, which is developed only in its hinge zone.
The parameters evaluated included the following: the maximum lateral load; the ultimate lateral load determined according to the criterion reported and applied in the experimental test; the lateral load–displacement relation, obtained from the maximum values of cyclic behaviour; the dissipated energy, obtained by summing the areas of the hysteretic cycles; and the circular stiffness, obtained by calculating the ratio of the difference between the discharge points in the positive and negative envelopes to the difference between their respective displacements.
For the columns, the dissipated energy, the maximum and ultimate lateral loads, and the stiffness degradation were compared throughout the displacement domain. To validate the effect of corrosion on the structural behaviour, the maximum and ultimate lateral loads and dissipated energy were compared along the corrosion level domain. The results were normalized with respect to the non-corroded column.
For corroded frames, specimens have different corrosion levels and detailed seismic design, in accordance with the structural code GB 50011-2010 [48], inducing flexural failure. The results used for the behaviour comparison included cumulative dissipated energy and stiffness degradation normalized to yielding. In addition, due to the loading protocol used for frame testing and for the calculation of accumulated energy, the energy from cycles with equivalent displacements was averaged rather than summed. It is important to note that, in Chen and Jiang [47], it is reported that the stirrups of the structural elements were isolated from the accelerated corrosion process, so deterioration was mainly concentrated on the longitudinal reinforcement.

2.3. Considerations for Isolated Columns

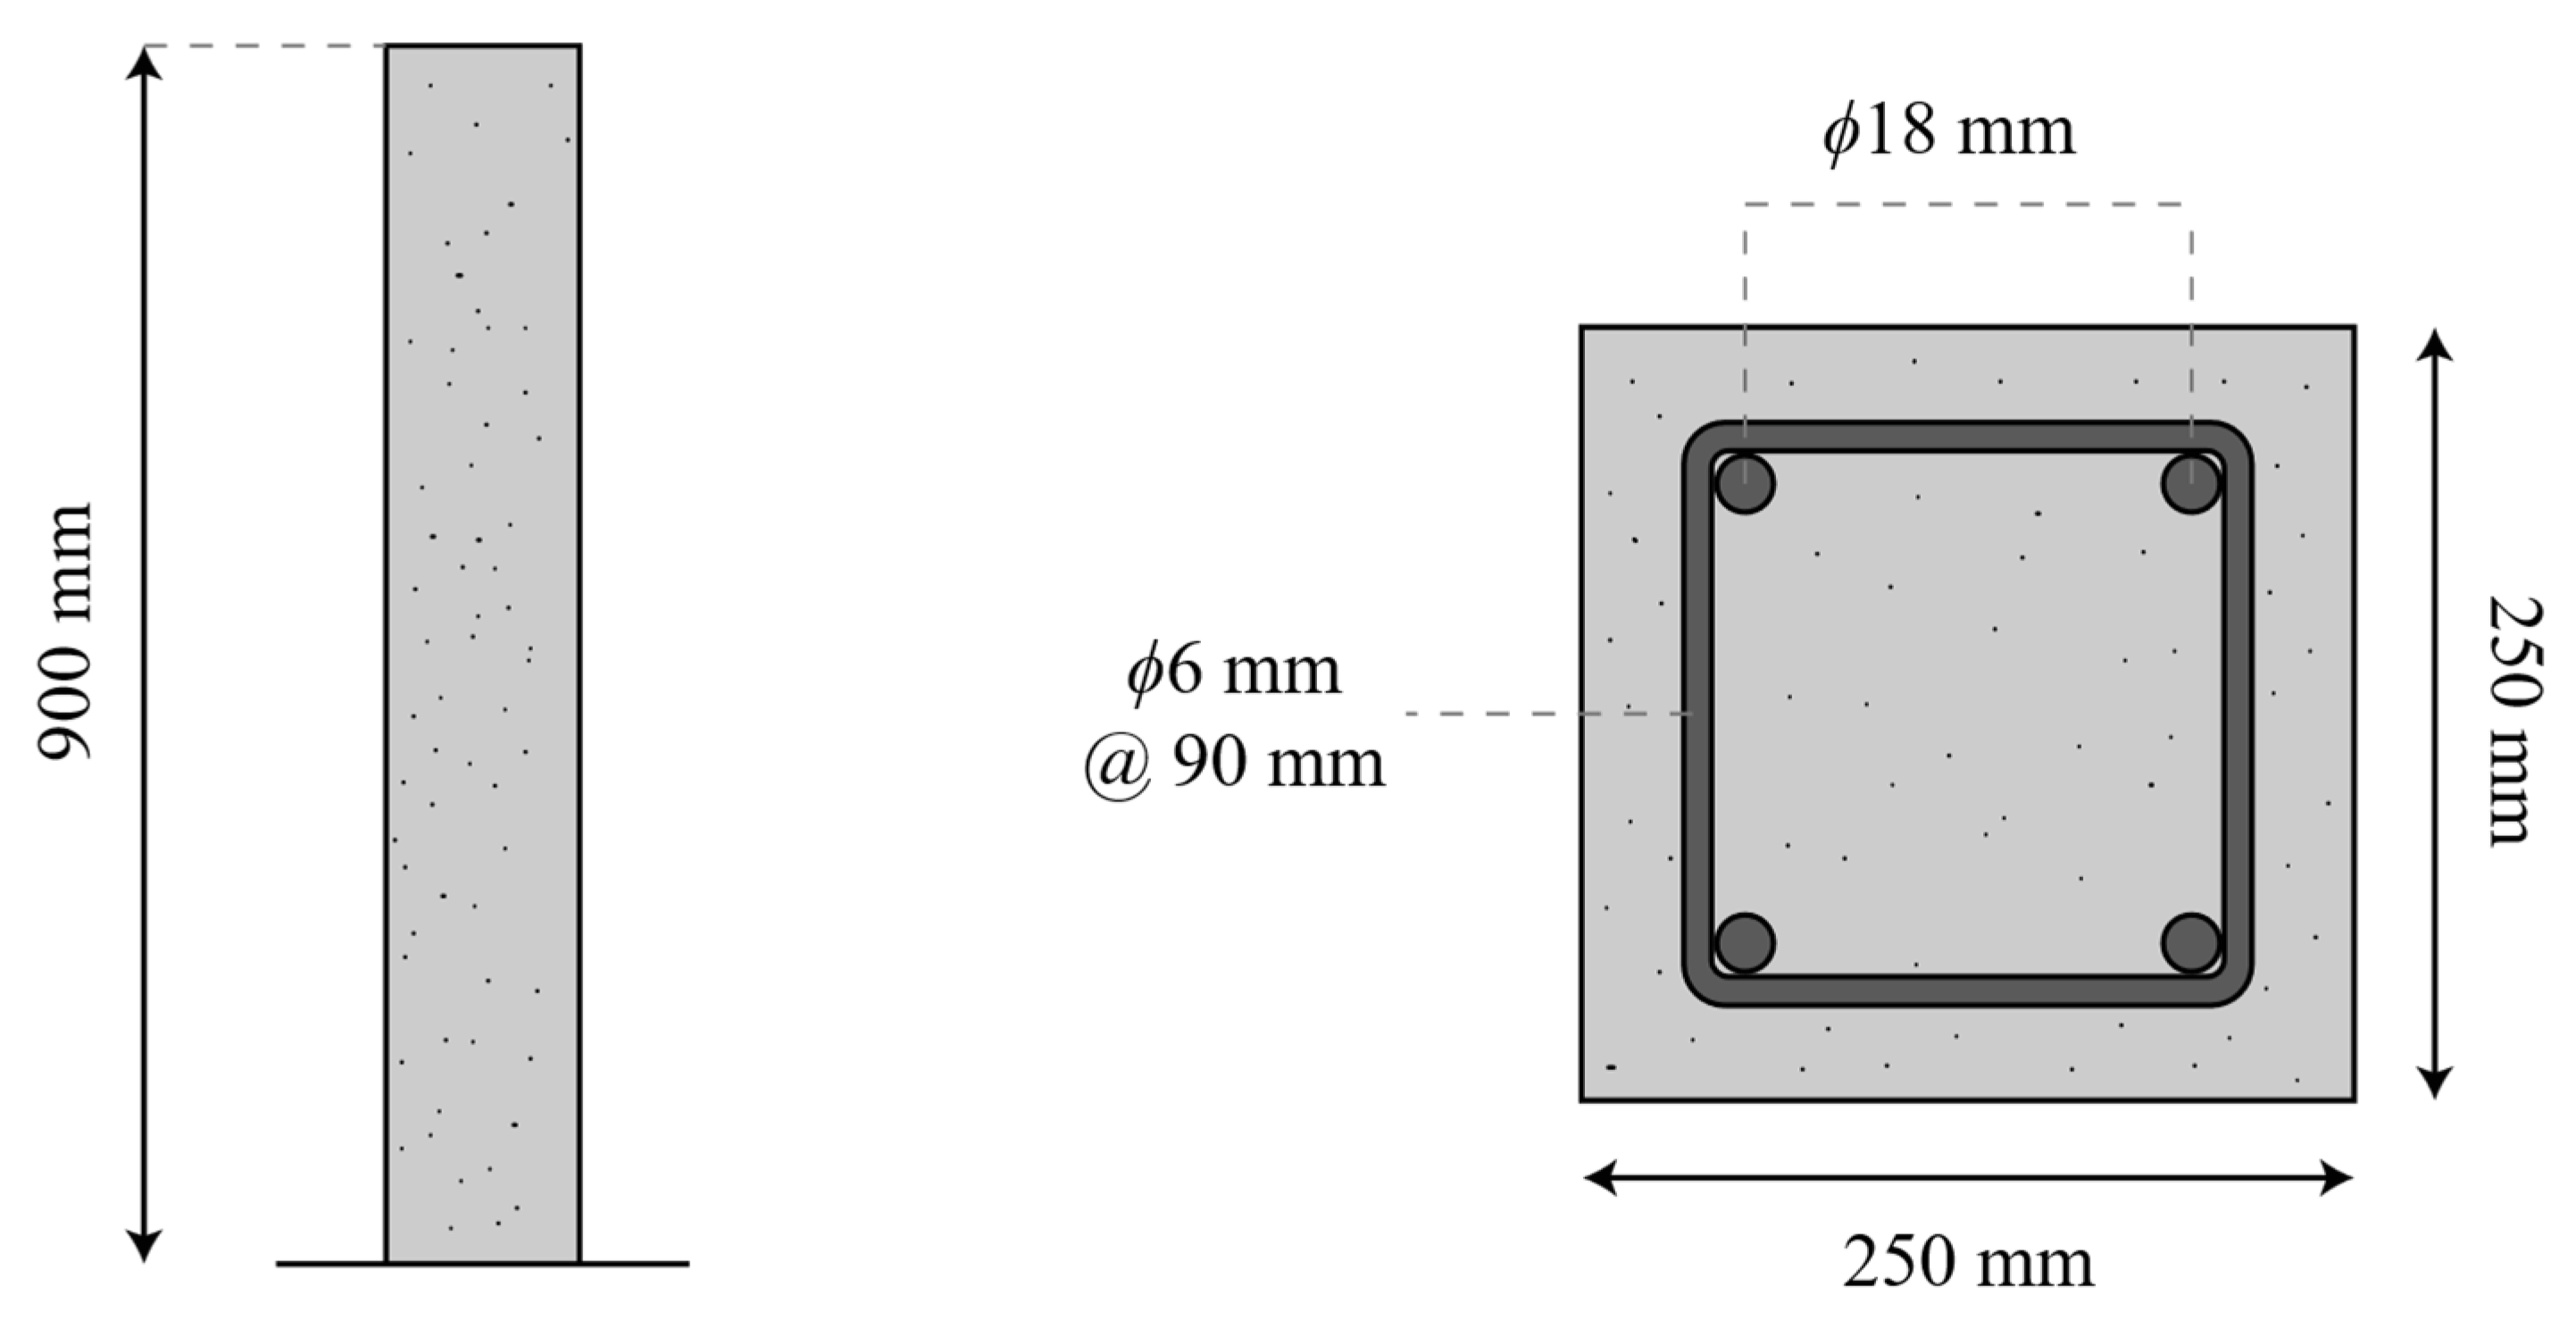
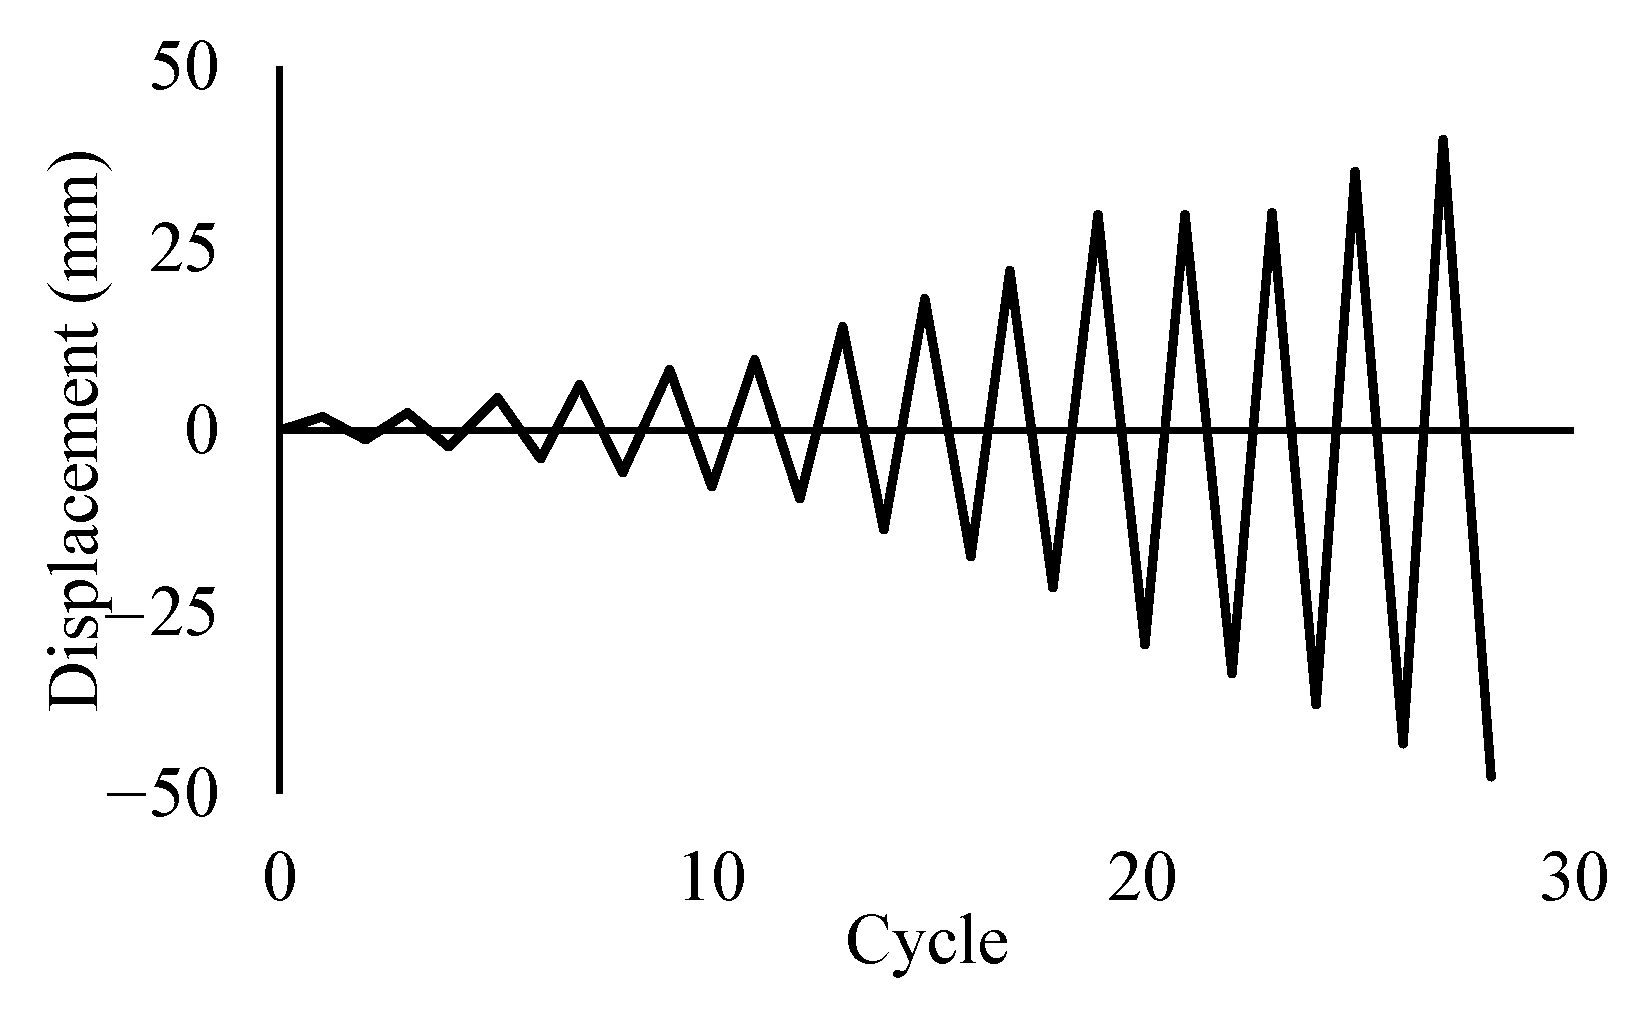
In the experimental results reported by Yang et al. [46], the cyclic behaviour of RC columns with different corrosion levels was analysed. The specimens were subjected to an electrochemical accelerated corrosion method simulating a coastal environment. In Figure 6, the geometrical properties and reinforcement details of the columns studied are described. For the present study, the results of RC columns with corrosion levels (η) of 0, 5.1, 13.2, and 16.8% were used. For the test, an axial load equal to 22.5% of the axial load index (0.225 fc∙Ag = 294.65 kN) was firstly applied to the top of the column. Figure 7 describes a protocol for the lateral displacements applied. The ultimate lateral load criterion was defined with a lateral load equivalent to 80% of the maximum load [46].
In the numerical models for the non-corroded columns, the mechanical properties of the reinforcement concrete established by Yang et al. [46] was used; by contrast, for the corroded columns, the properties were estimated using Equations (2)–(7) according with the corrosion level in longitudinal and transverse reinforcement (see Table 1). On the other hand, Young’s modulus of steel, as well as Young’s modulus and tensile strength of concrete, were not reported. Consequently, these values were proposed following the design code [25] using Equations (13) and (14) to estimate Young’s modulus and the tensile strength of the concrete, respectively. Young’s modulus for steel was 200,000 MPa. Figure 2 shows the numerical models and the distribution of its concentrated plasticity hinges with fiber sections.
4400 f c
0.47 f c

2.4. Considerations for Frames

To validate the proposed modelling process on frames, the experimental results reported by Chen and Jiang [47] were used as a reference. Figure 8 describes the geometrical properties and reinforcement details of the tested samples, and Table 2 shows the properties and corrosion levels. The vertical load applied to each frame column corresponds to 10% of the axial load index (0.10∙fc∙Ag = 242.5 kN); while, the protocol for the application of the cyclic loading is described in Figure 9, where firstly the force control stage is focused on reaching the state of yielding in the longitudinal reinforcement of the element, and subsequently it is subjected to the displacement control stage applying three cycles for each displacement amplitude. The ultimate deformation observed in the experimental test corresponded to a reduction of the maximum load to 85% [47]. Therefore, in this research, the lateral load and the ultimate displacement were defined by the experimental criterion. Additionally, Young’s modulus of steel and Young’s modulus and the tensile strength of concrete were determined according to the design code [25].

3. Column Behaviour

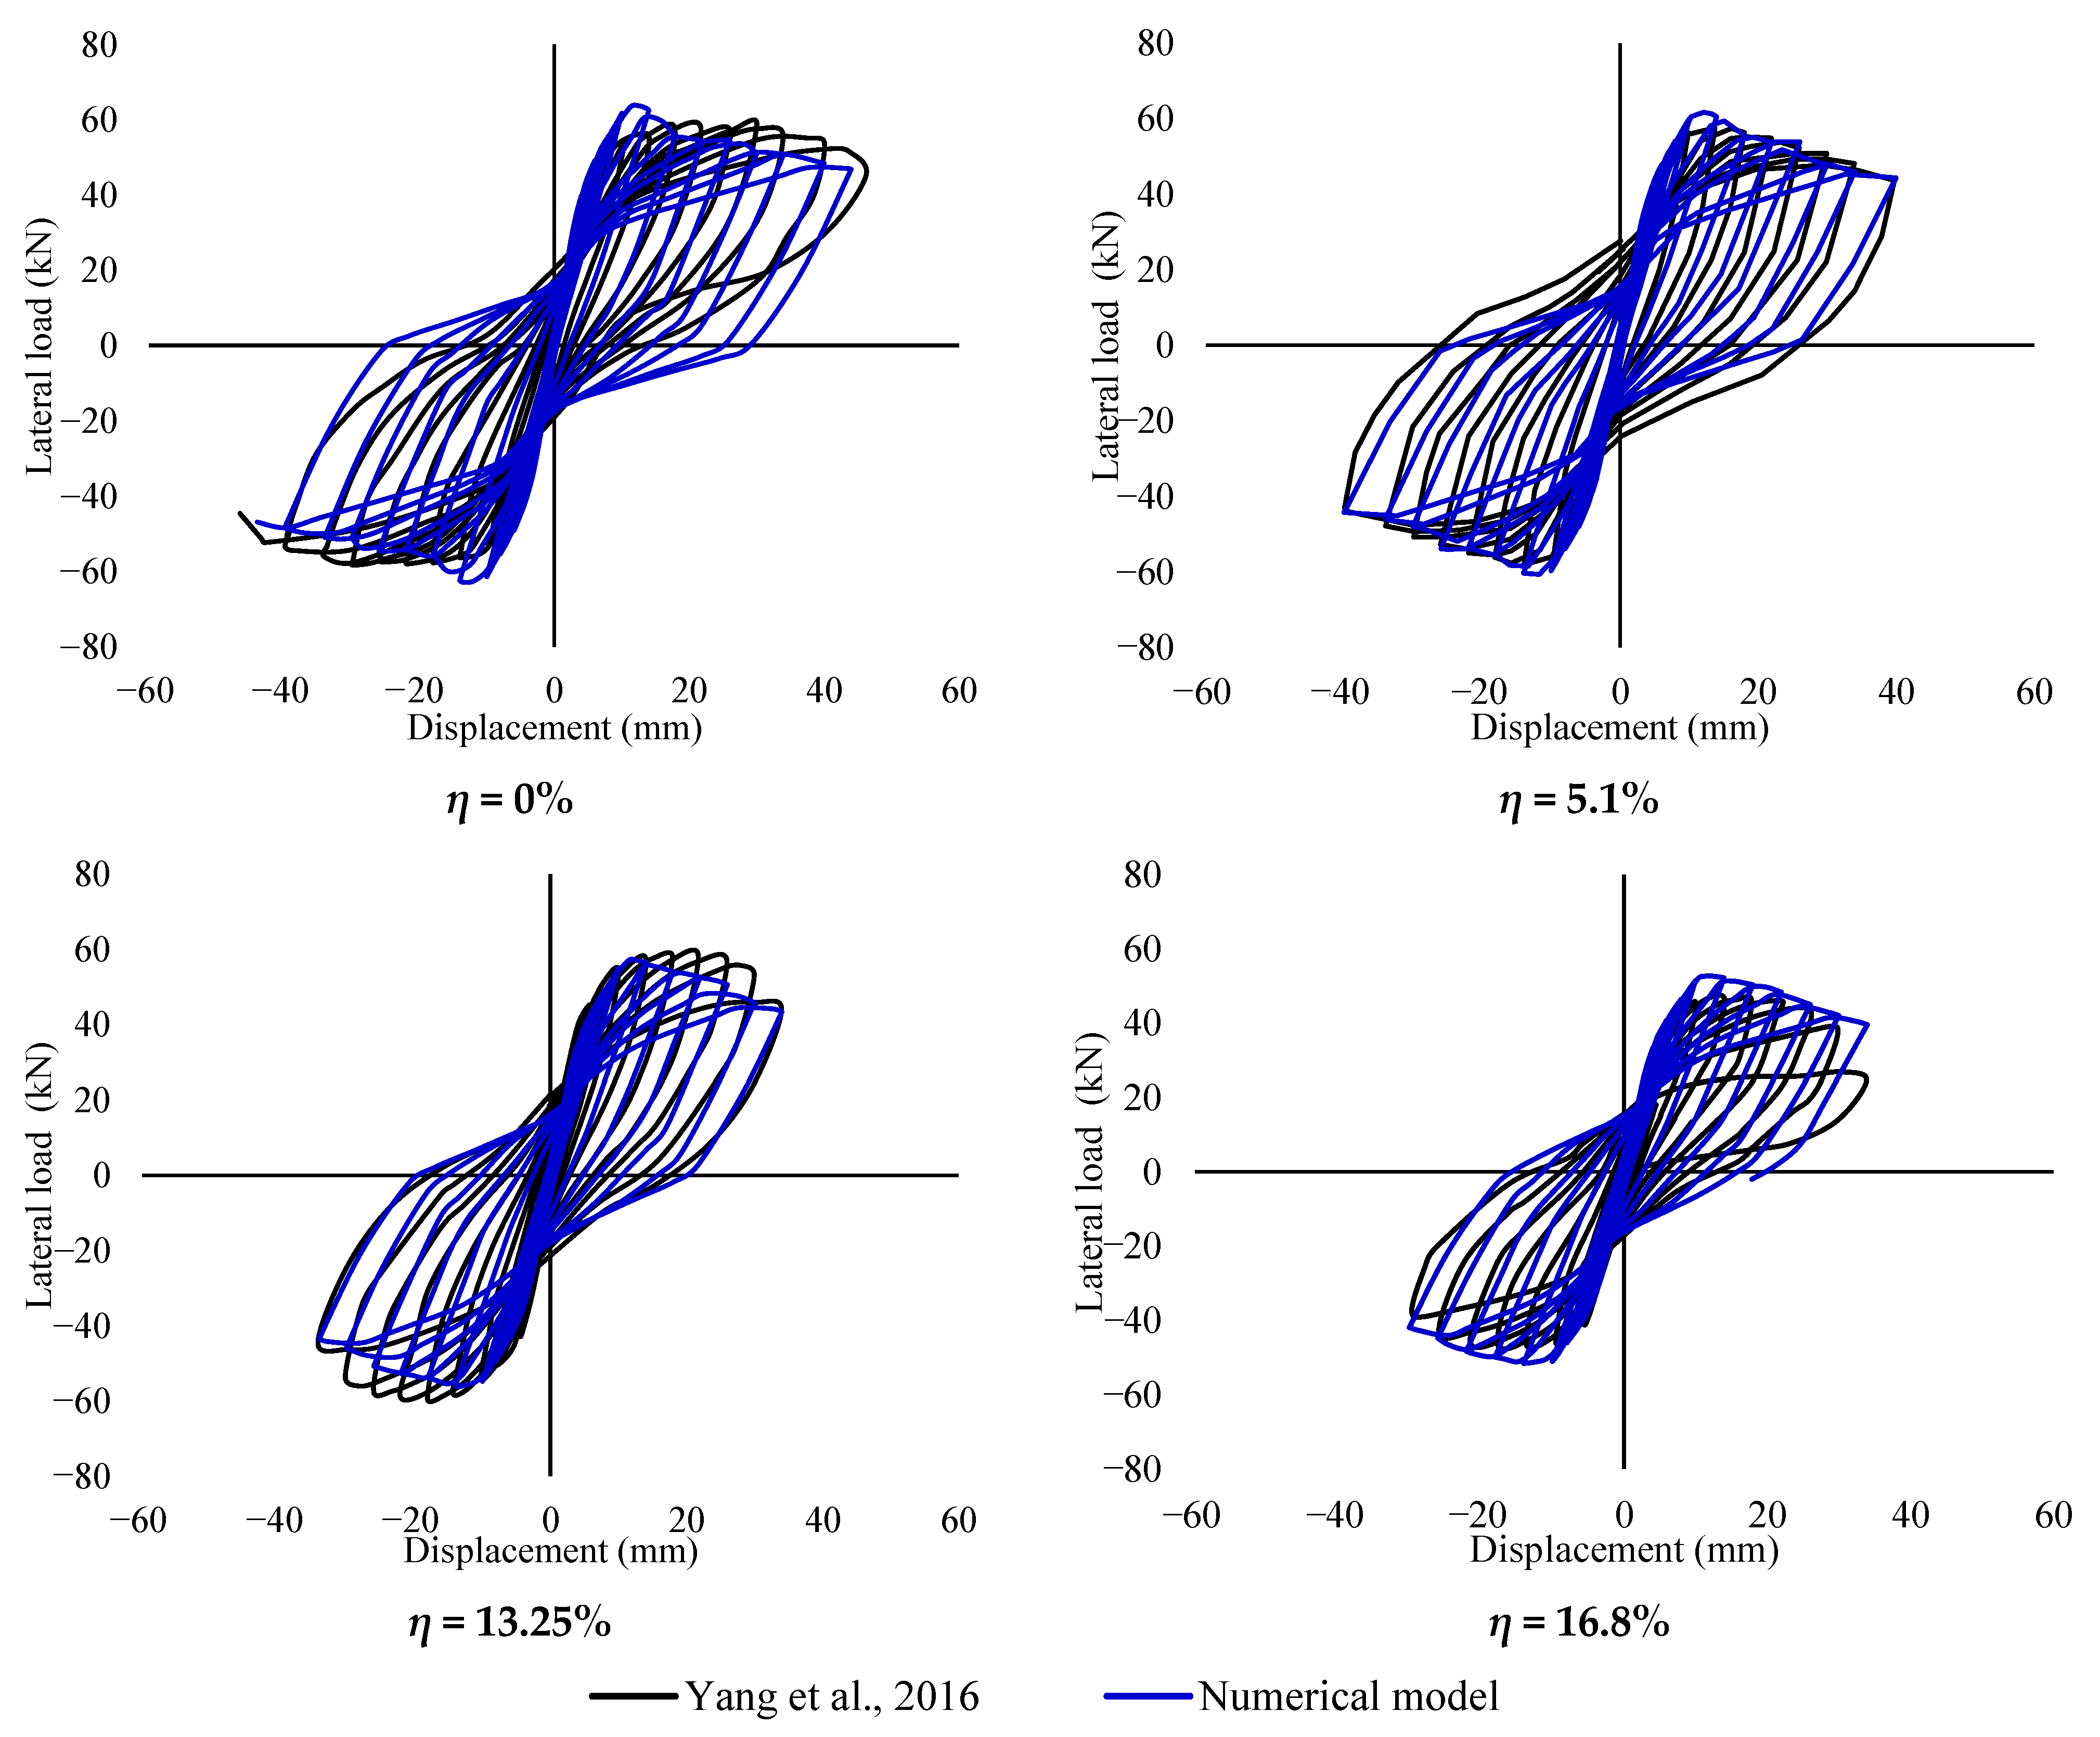
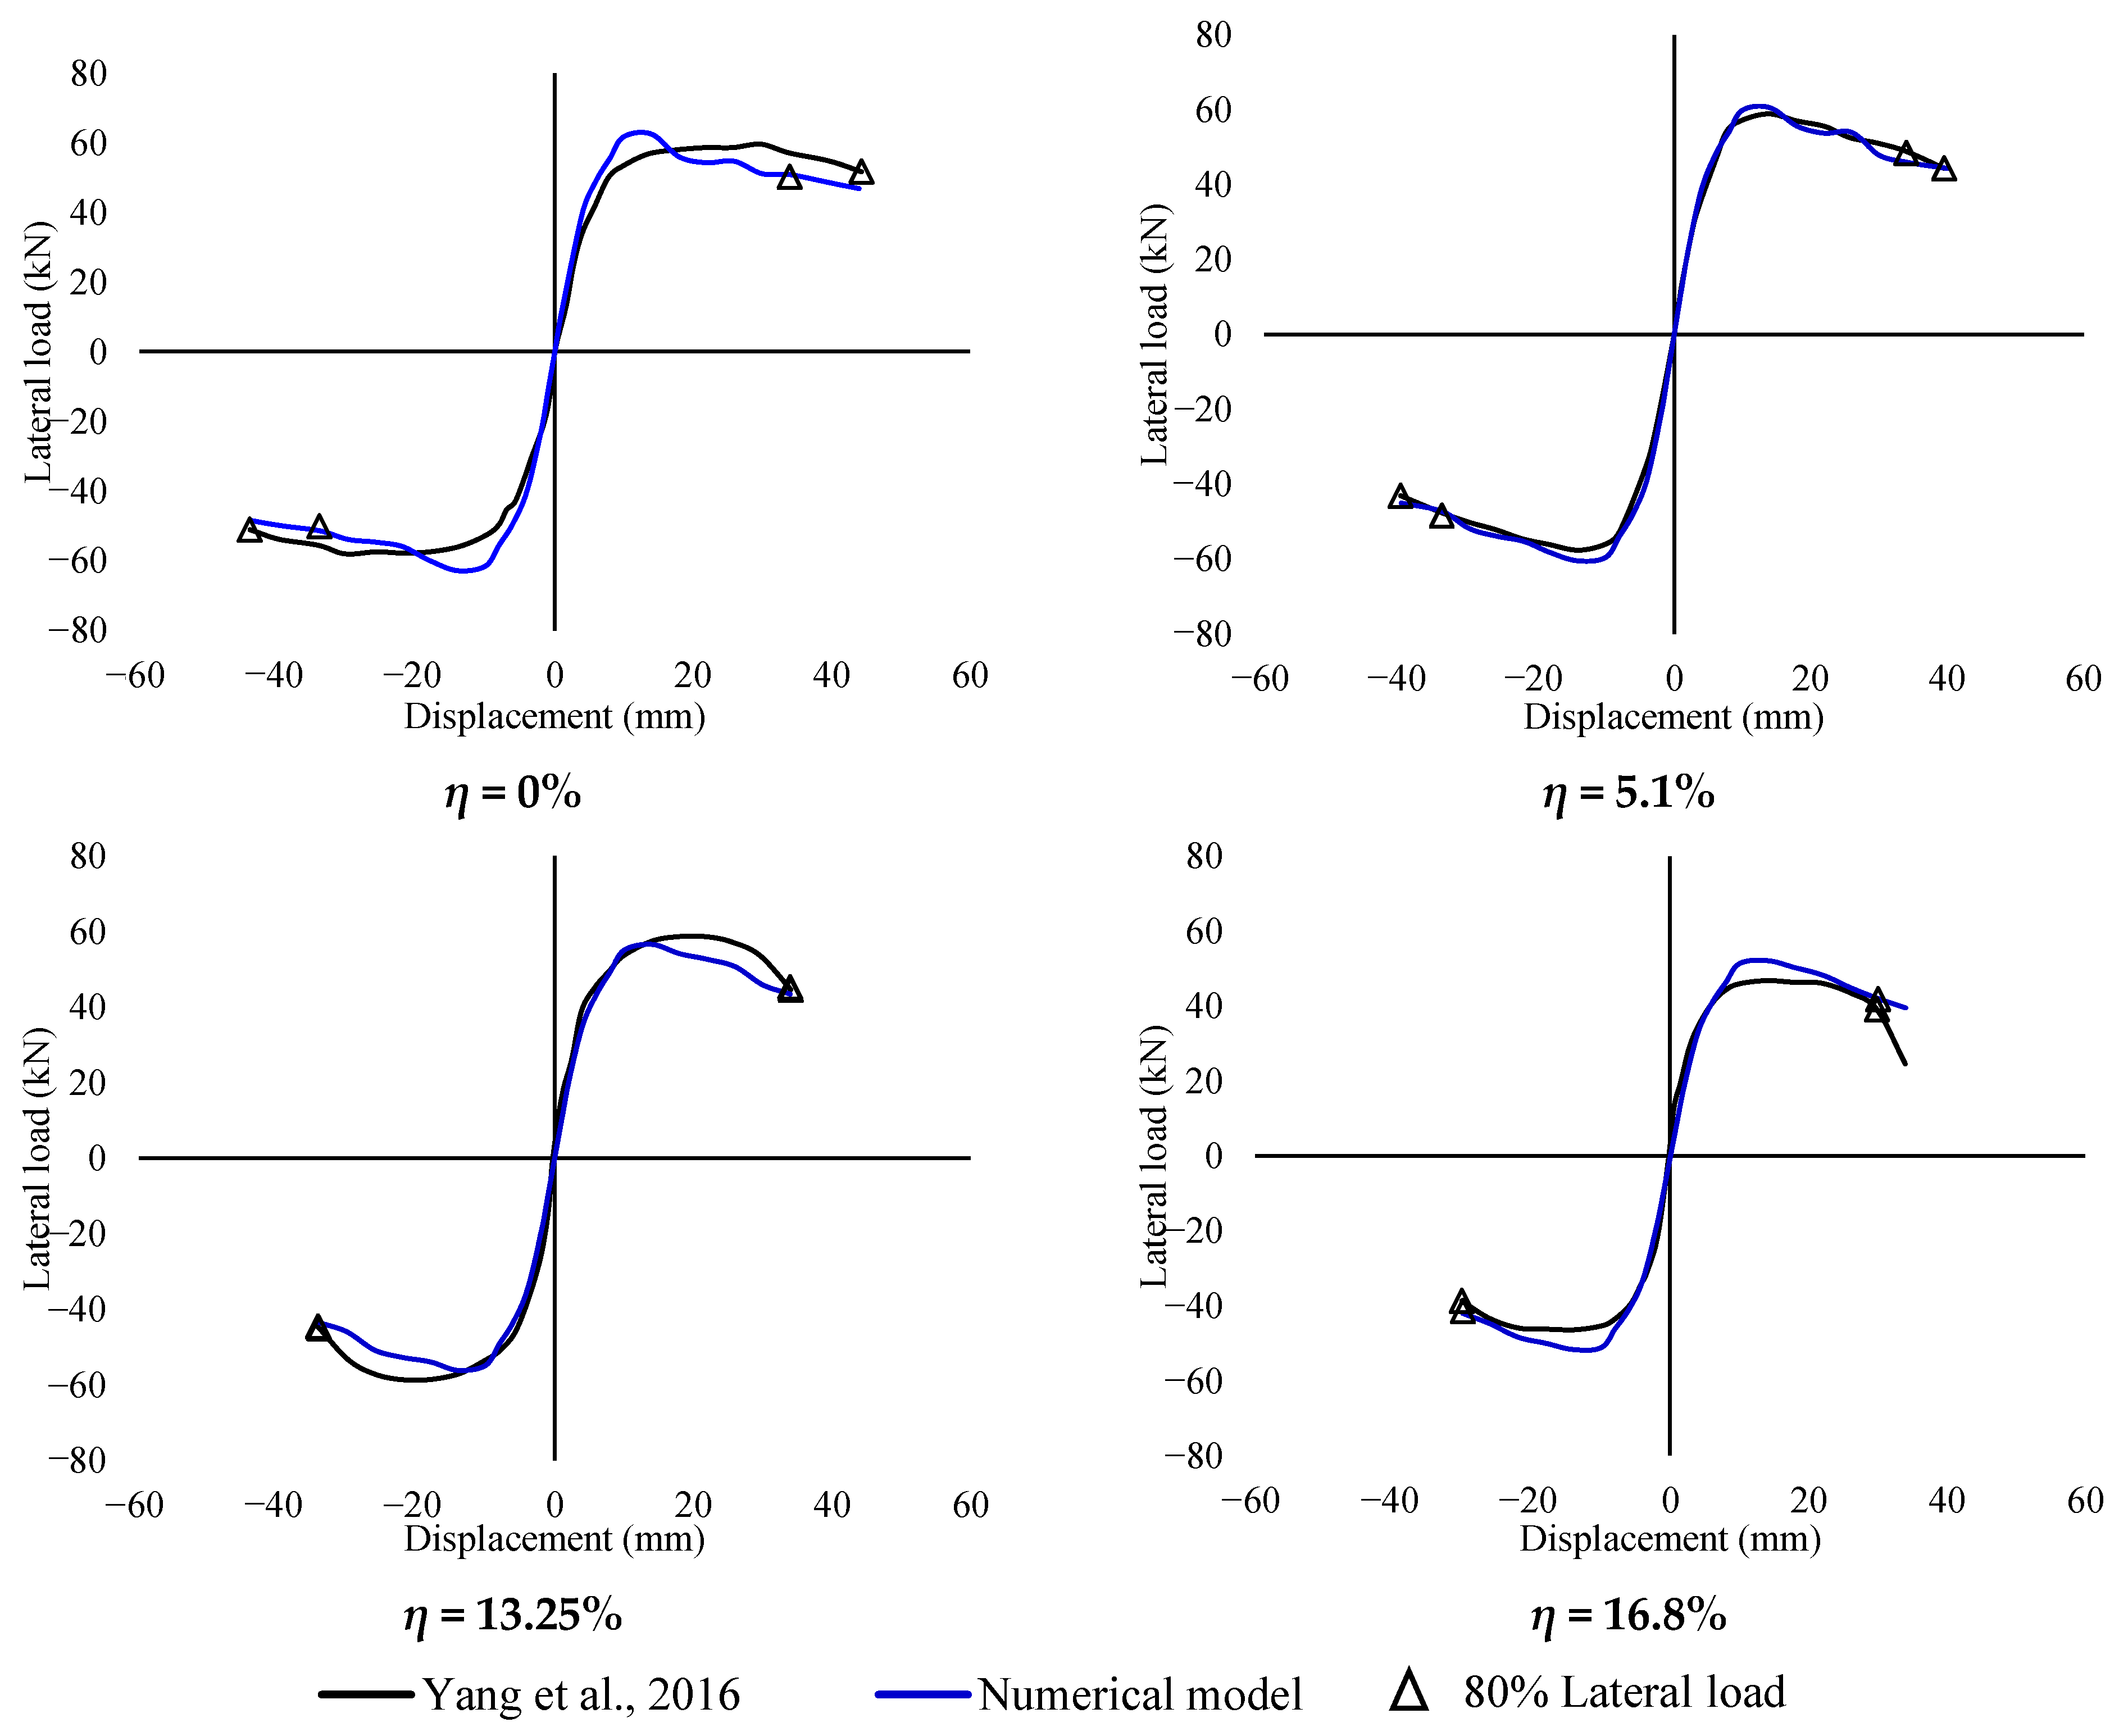
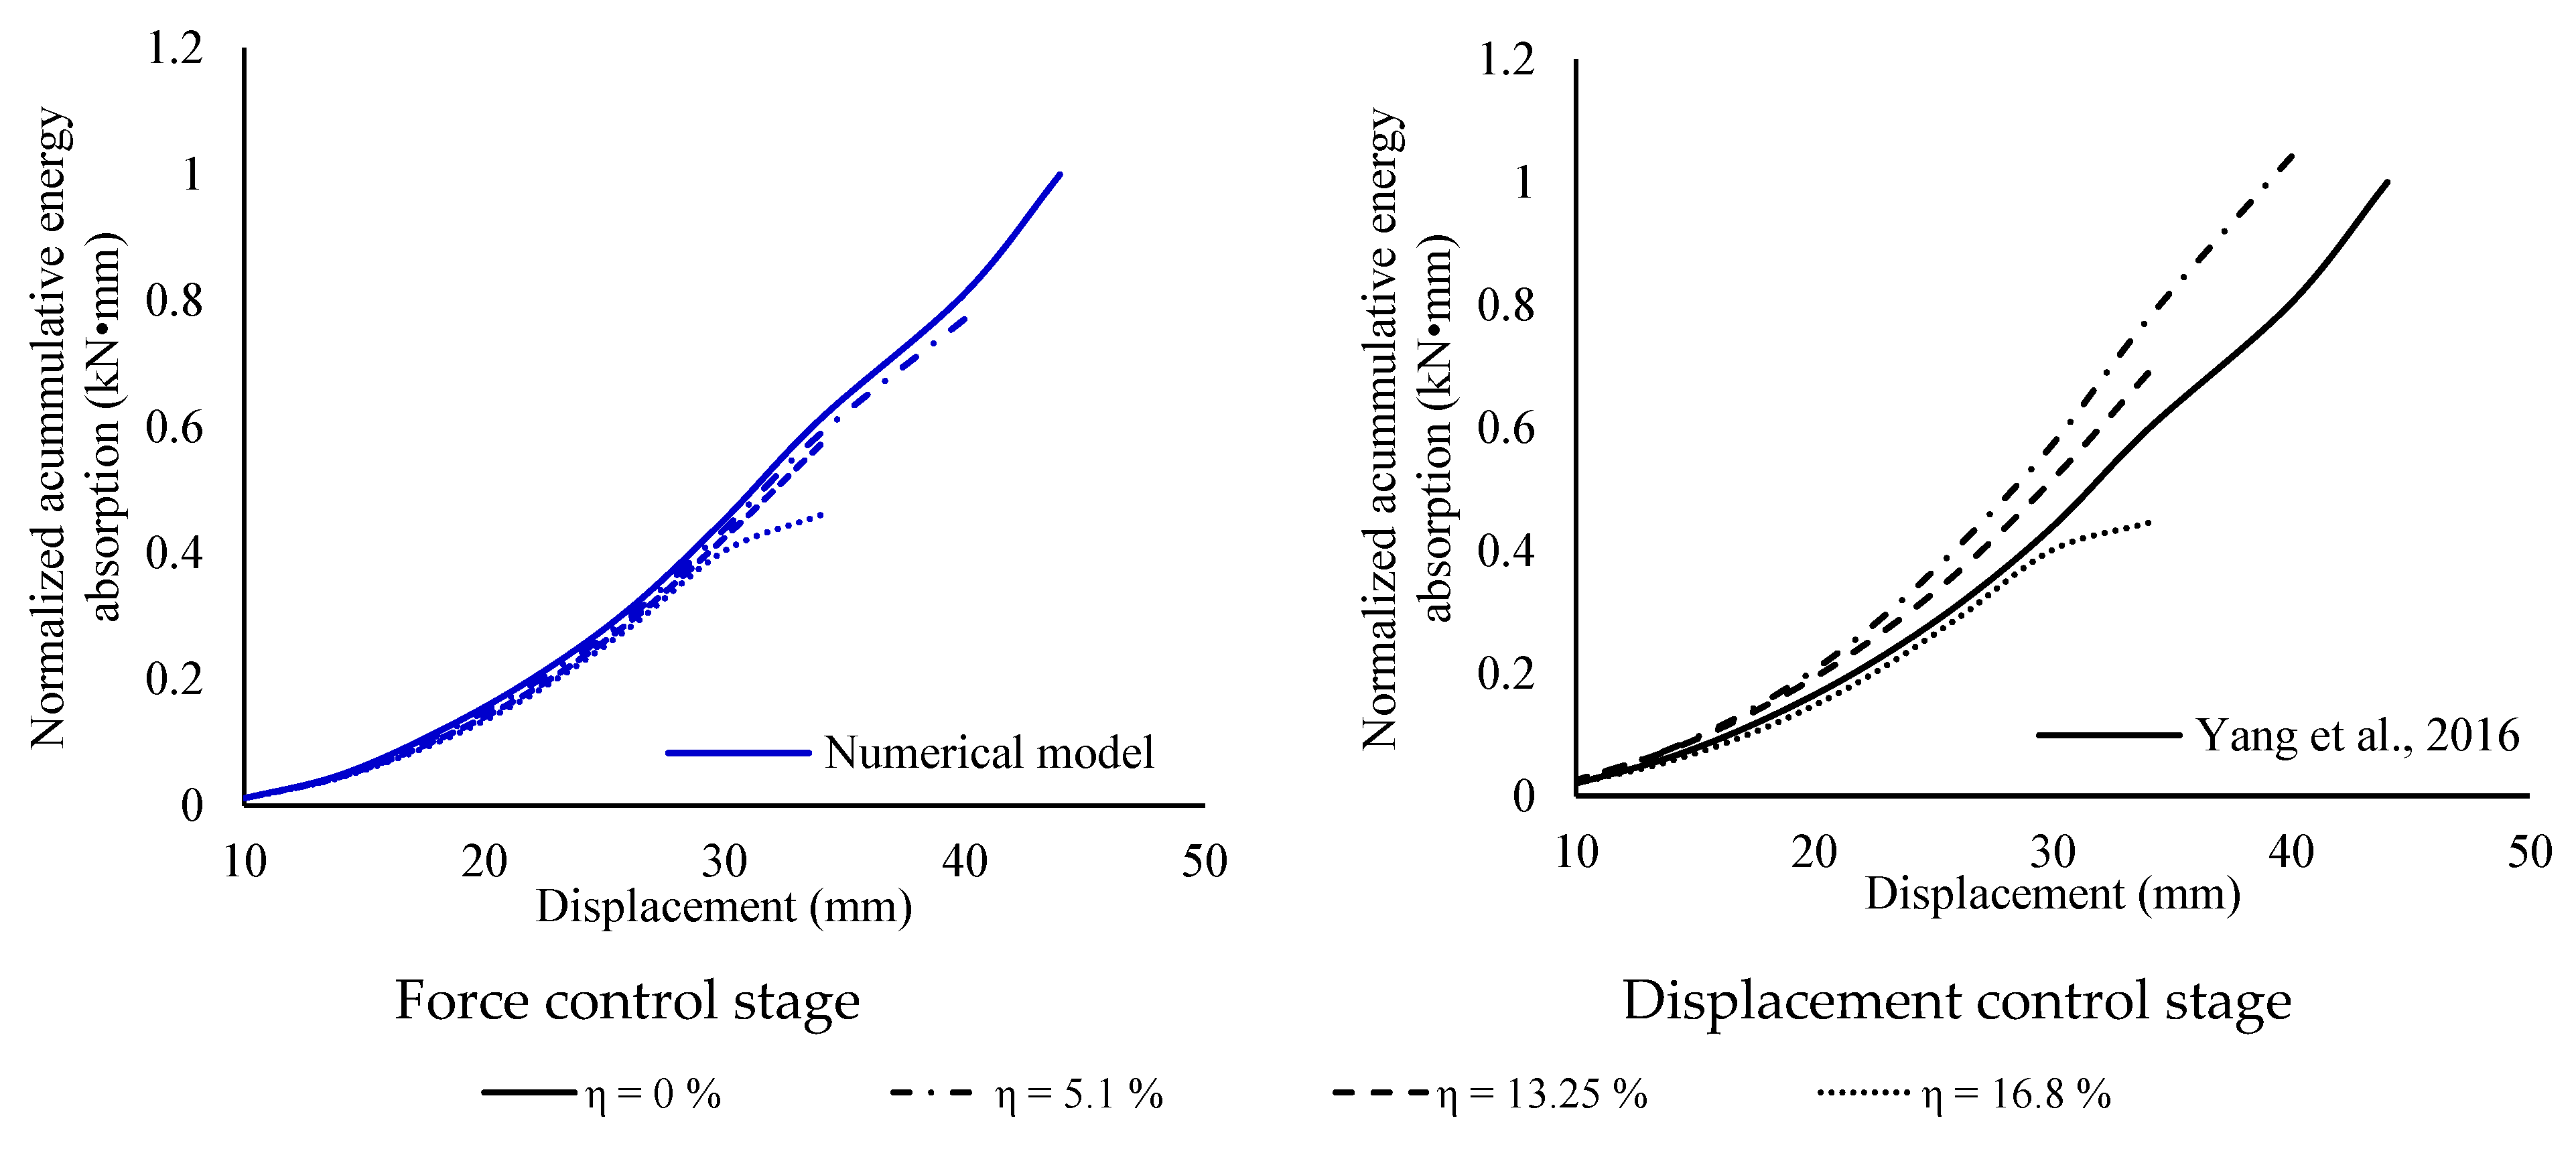
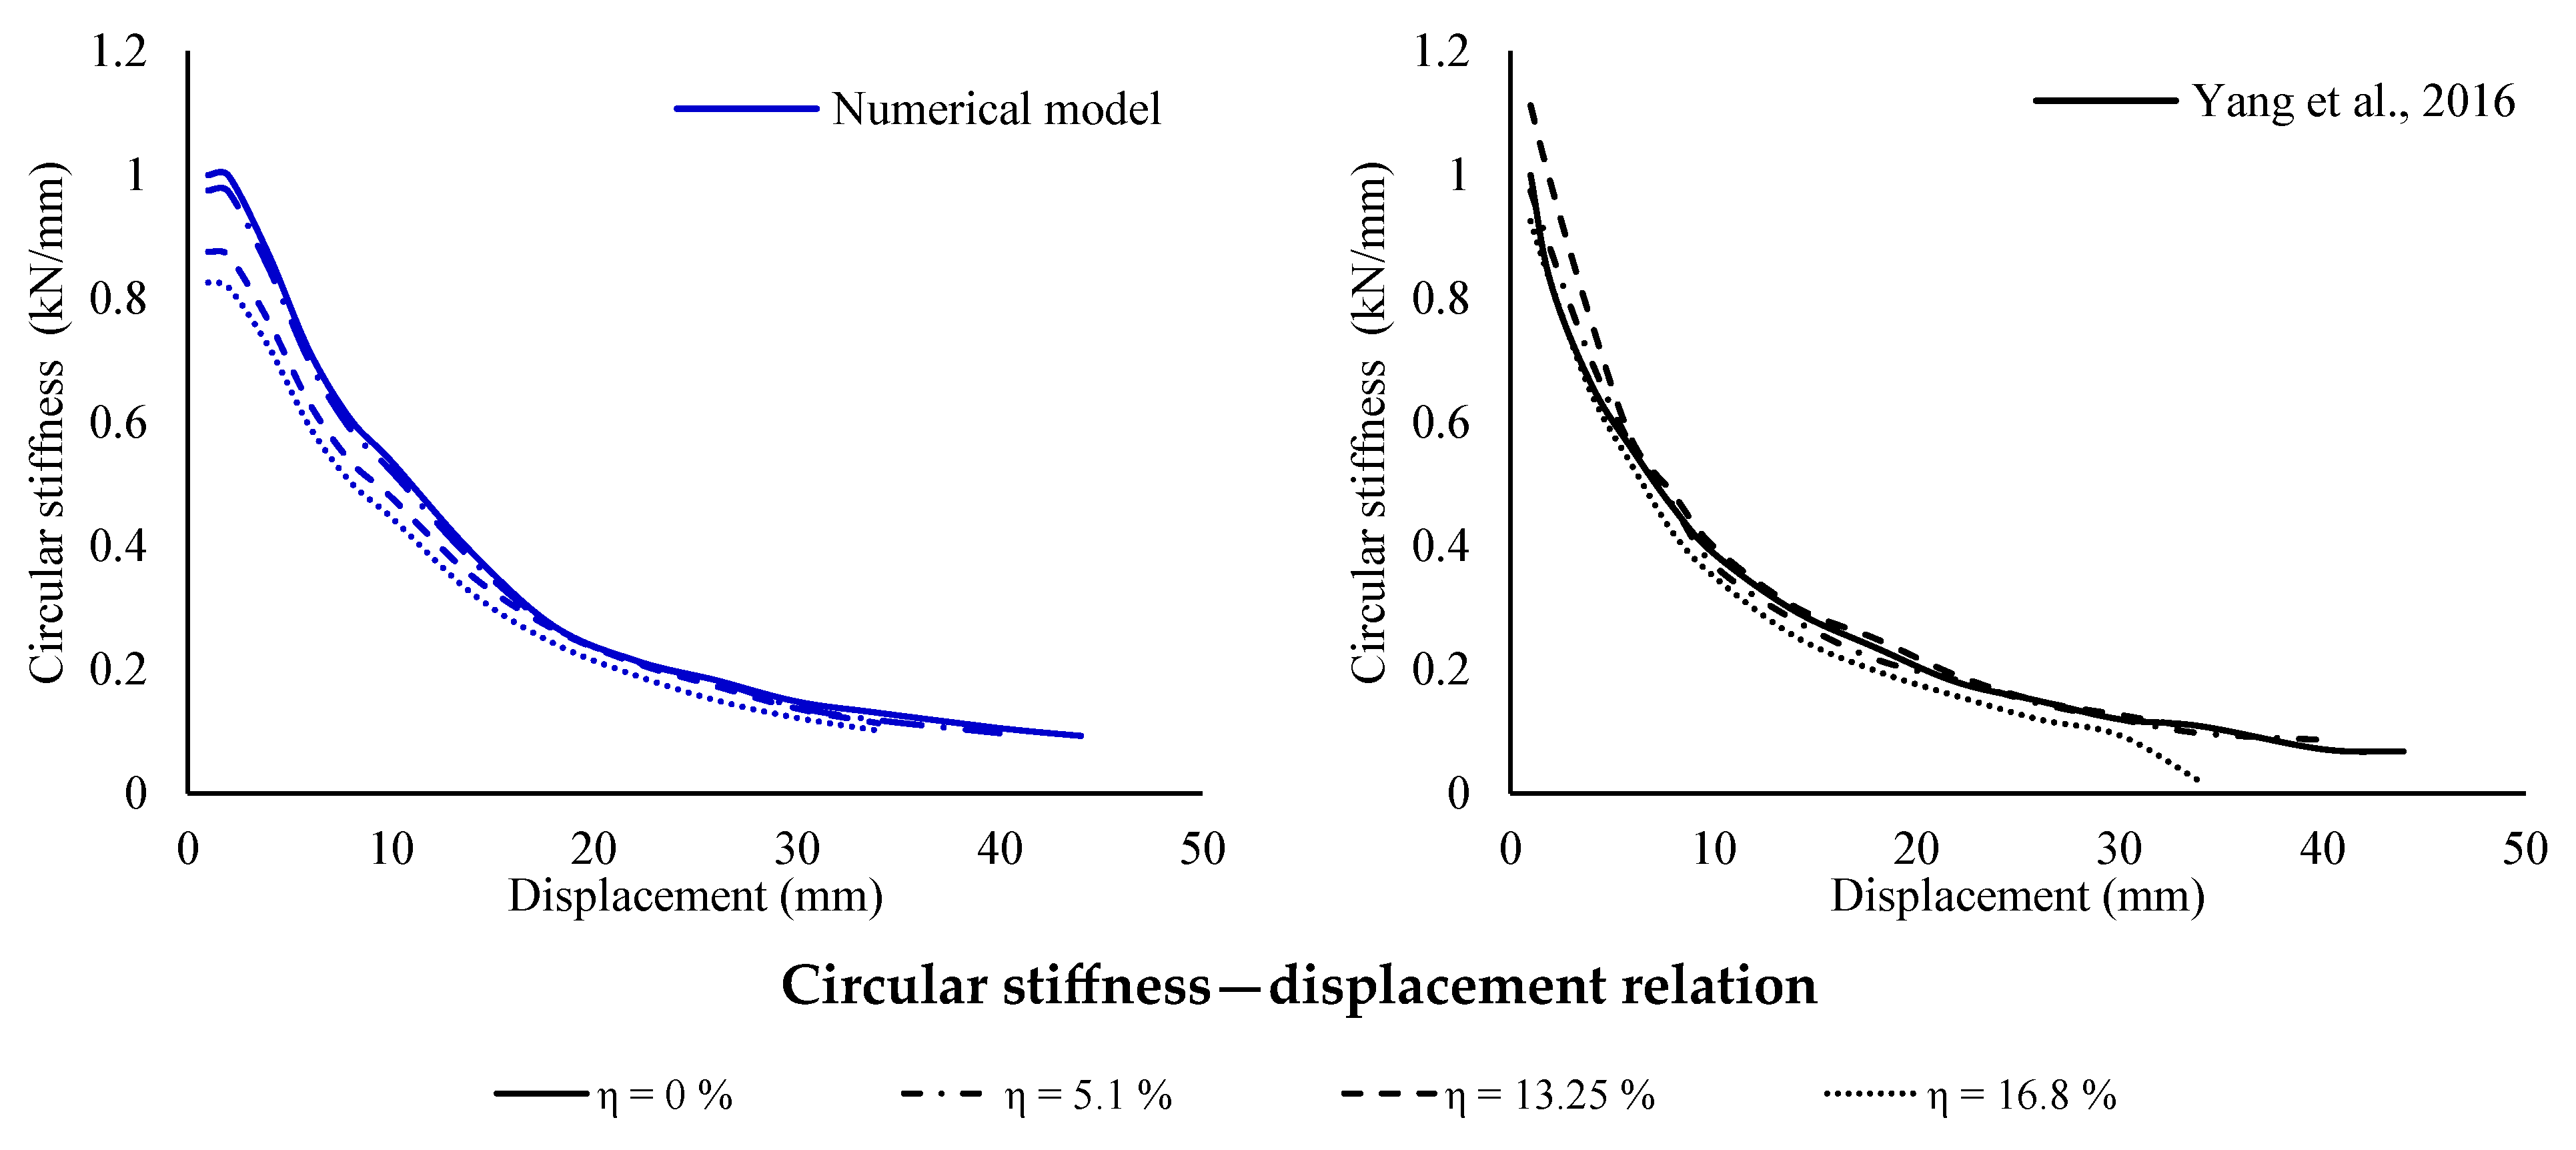
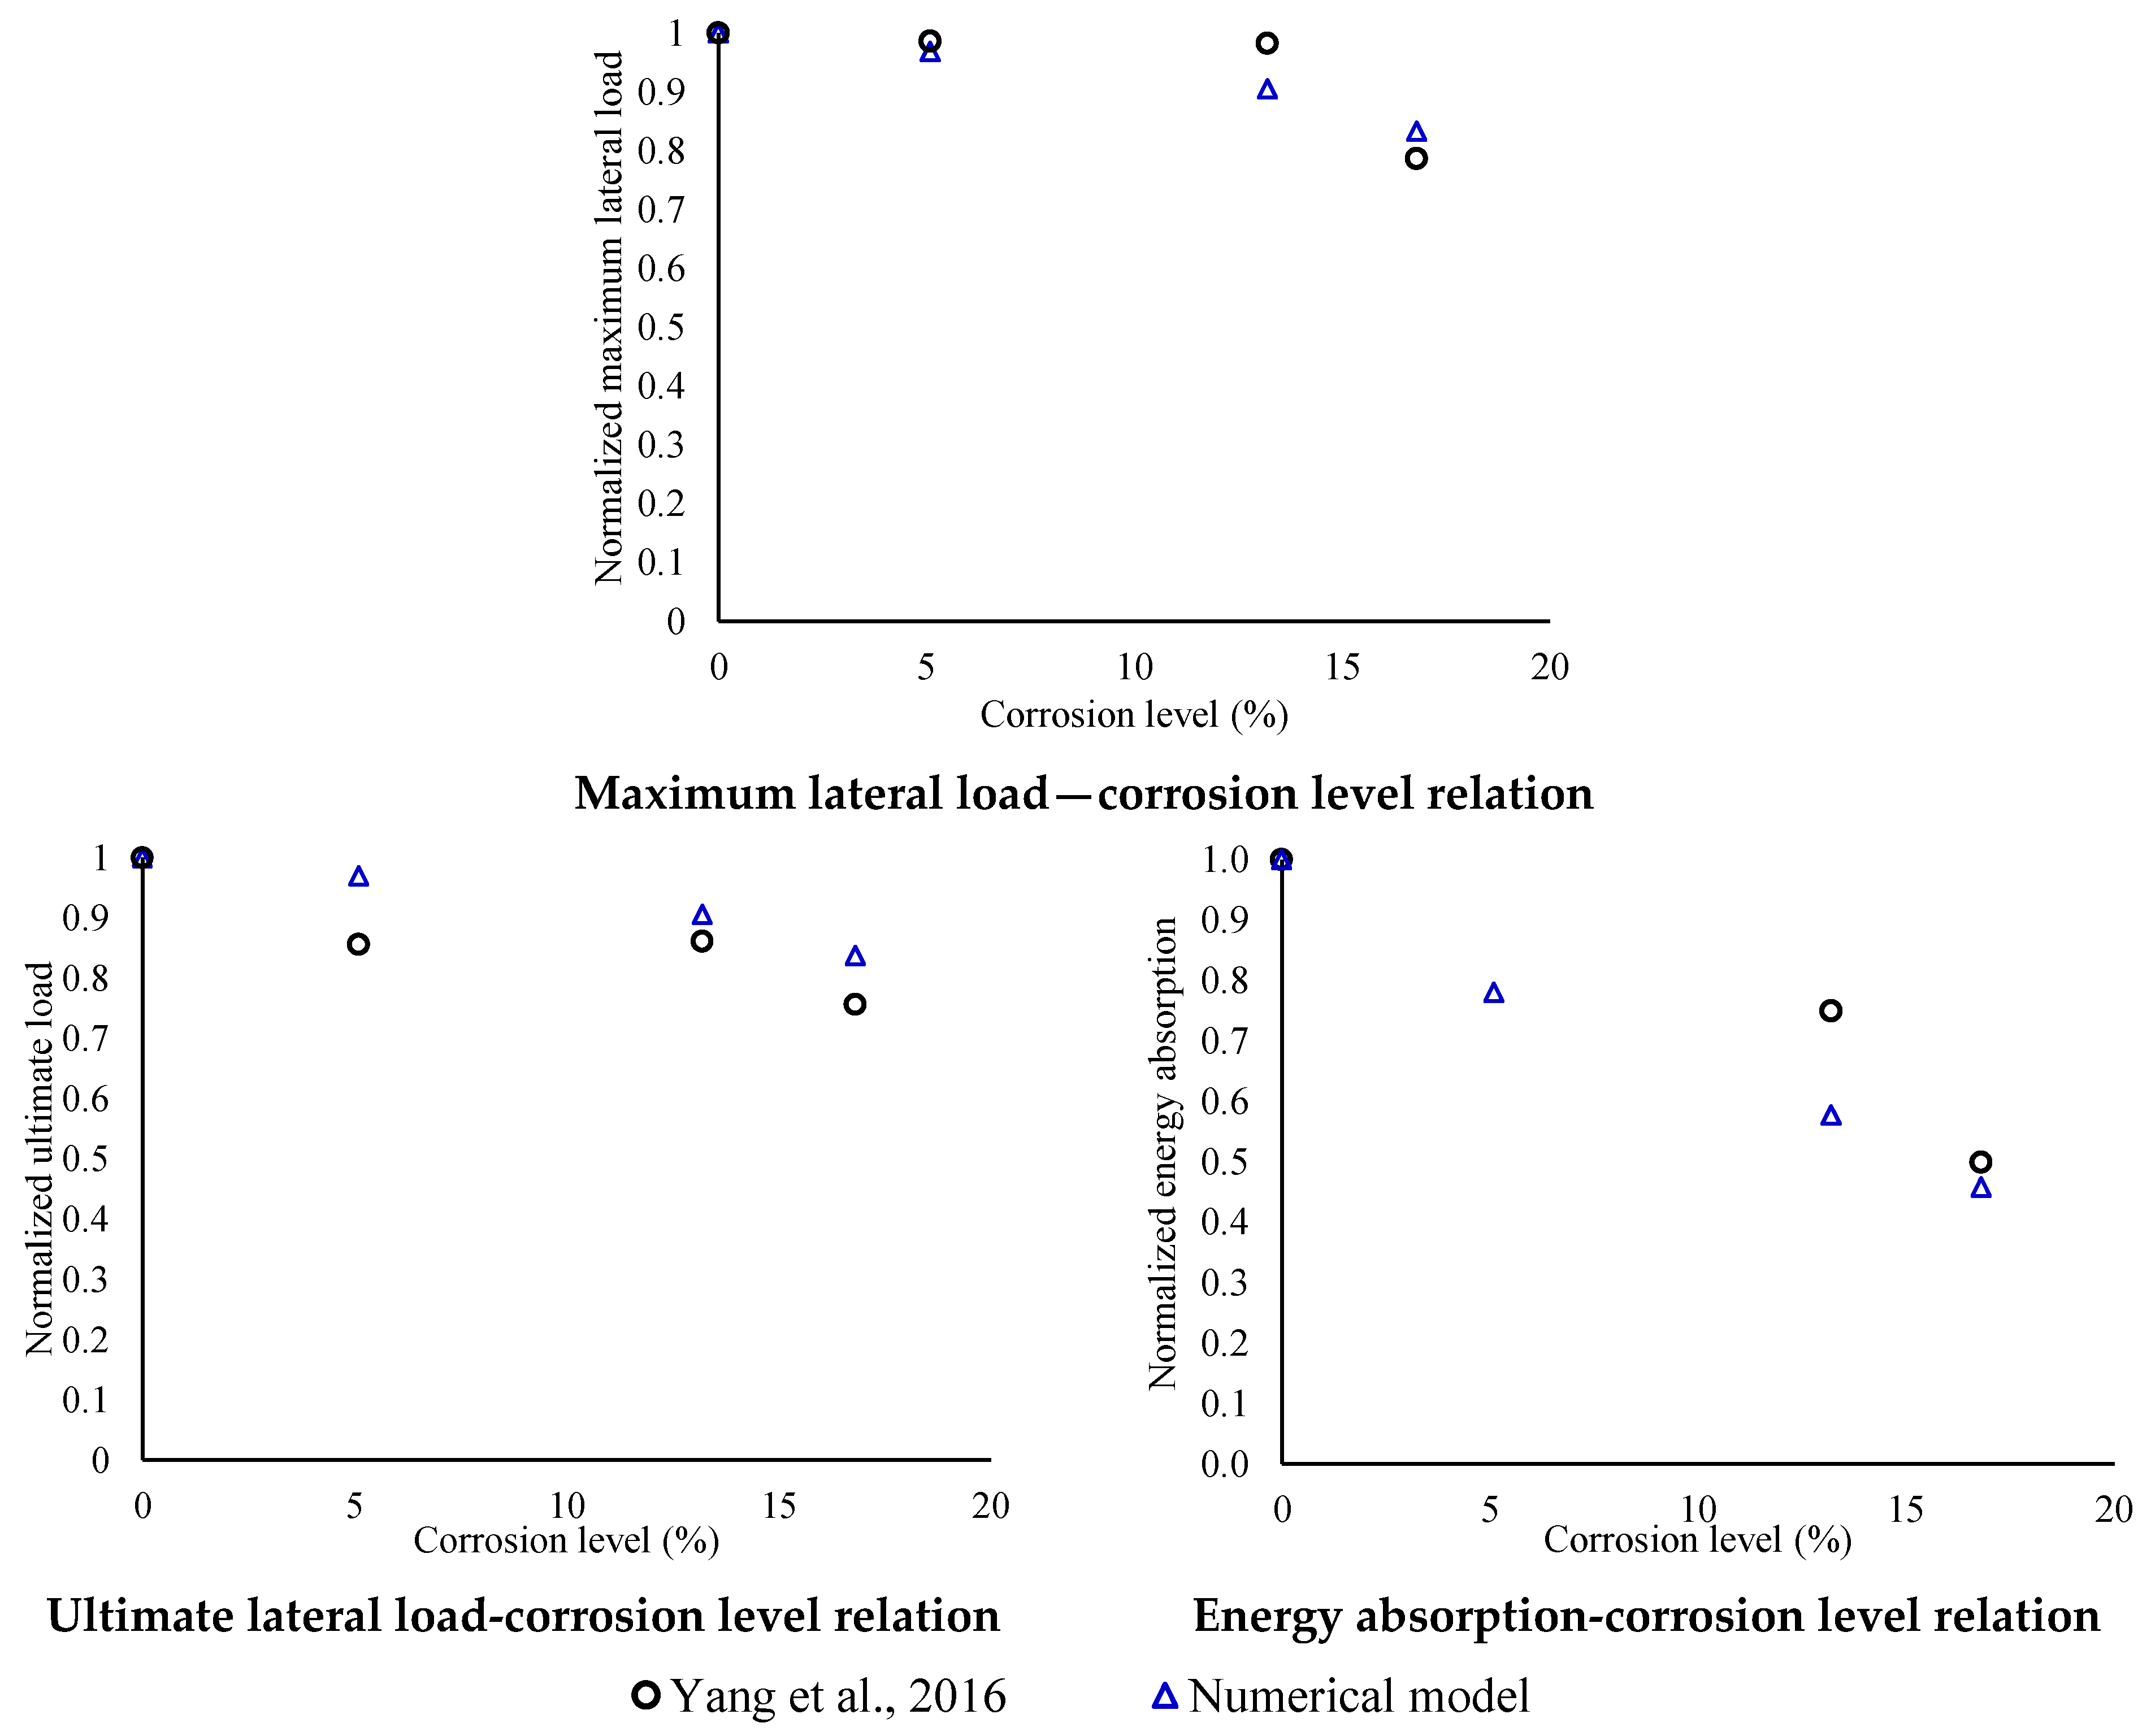
The numerical and experimental behaviour of corroded isolated columns were compared based on the force–displacement relation (see Figure 10), their envelopes (see Figure 11), the maximum and ultimate lateral loads, and the total dissipated energy (see Table 3). In the displacement domain, the normalized degradation of dissipated energy and circular stiffness per cycle were analysed (see Figure 12 and Figure 13). In the corrosion level domain, the normalized dissipated energy and the maximum and ultimate lateral loads were also evaluated (see Figure 14). It is important to notice that the ultimate lateral load is evaluated at its penultimate cycle, and that the normalization was conducted with respect to the non-corroded column.
The numerical cyclic behaviour is suitable following the experiment trend related to the amplitude of hysteretic cycles. Moreover, the Pivot model, with the values obtained from the literature, represents the pinching effect in a suitable way (see Figure 10). The highest errors in the maximum and ultimate lateral loads were 11.1 and 12.3%, respectively (see Table 3). However, with regard to elastic branch, the numerical model overestimates the lateral load, with the yielding of the reinforcing steel coinciding with the maximum lateral load; subsequently, for the inelastic behaviour, the error decreases (<15%). This effect can be attributed to the non-uniform progression of corrosion in the tested columns, which leads to localized and uneven material degradation. Additionally, discrepancies stem from modelling assumptions, particularly those related to Young’s modulus and the tensile strength of concrete, both of which influence the simulated structural response. Furthermore, the ultimate deformation has been estimated at 80% of the maximum lateral load, resulting in a maximum error of 23.4 and 14.1% in the non-corroded and corroded columns, respectively. On the other hand, a maximum error of 22.1% was obtained when the dissipated energy was evaluated.
Figure 11 shows the envelope derived from the maximum hysteretic cycles. The numerical model gives an accurate estimation of the slope of the elastic branch; however, it overestimates the yielding element load (<15%), which also coincides with its maximum lateral load.
Figure 12 and Figure 13 illustrate a comparation of the accumulated energy and the normalized circular stiffness. Due to the reported data, only the dissipated energy in the cycles after 10 mm was compared. It has been observed that the dissipated energy decreased as the corrosion level increased (up to 55%). On the other hand, the numerical model demonstrates an overestimation of circular stiffness with the largest error (up to 30%) attributable to the coincidence between the element yield and its maximum lateral load (see Figure 11). Subsequently, at the yield point of the reinforcing steel, the error decreases (<30%) as the displacement increases.
As shown in Figure 14, the analysis encompasses the degradation of the maximum and ultimate loads, as well as the dissipated energy within the corrosion level domain. In comparison to the experiment, the numerical model presents errors of 17, 15, and 55% in the maximum load, the ultimate load, and the dissipated energy, respectively.
In general, suitable errors in the pinching effect and opening of the hysteretic cycles were produced by the Pivot model with values obtained from the literature, where the dynamic behaviour of the numerical model provides an adequate approximation in terms of maximum and ultimate loads, circular stiffness, and dissipated energy, with maximum errors of 11, 12, 30, and 22%, respectively. Furthermore, it should be noted that the longitudinal steel yield coincides with the maximum lateral load of the numerical model (see Figure 11).

4. Frame Behaviour

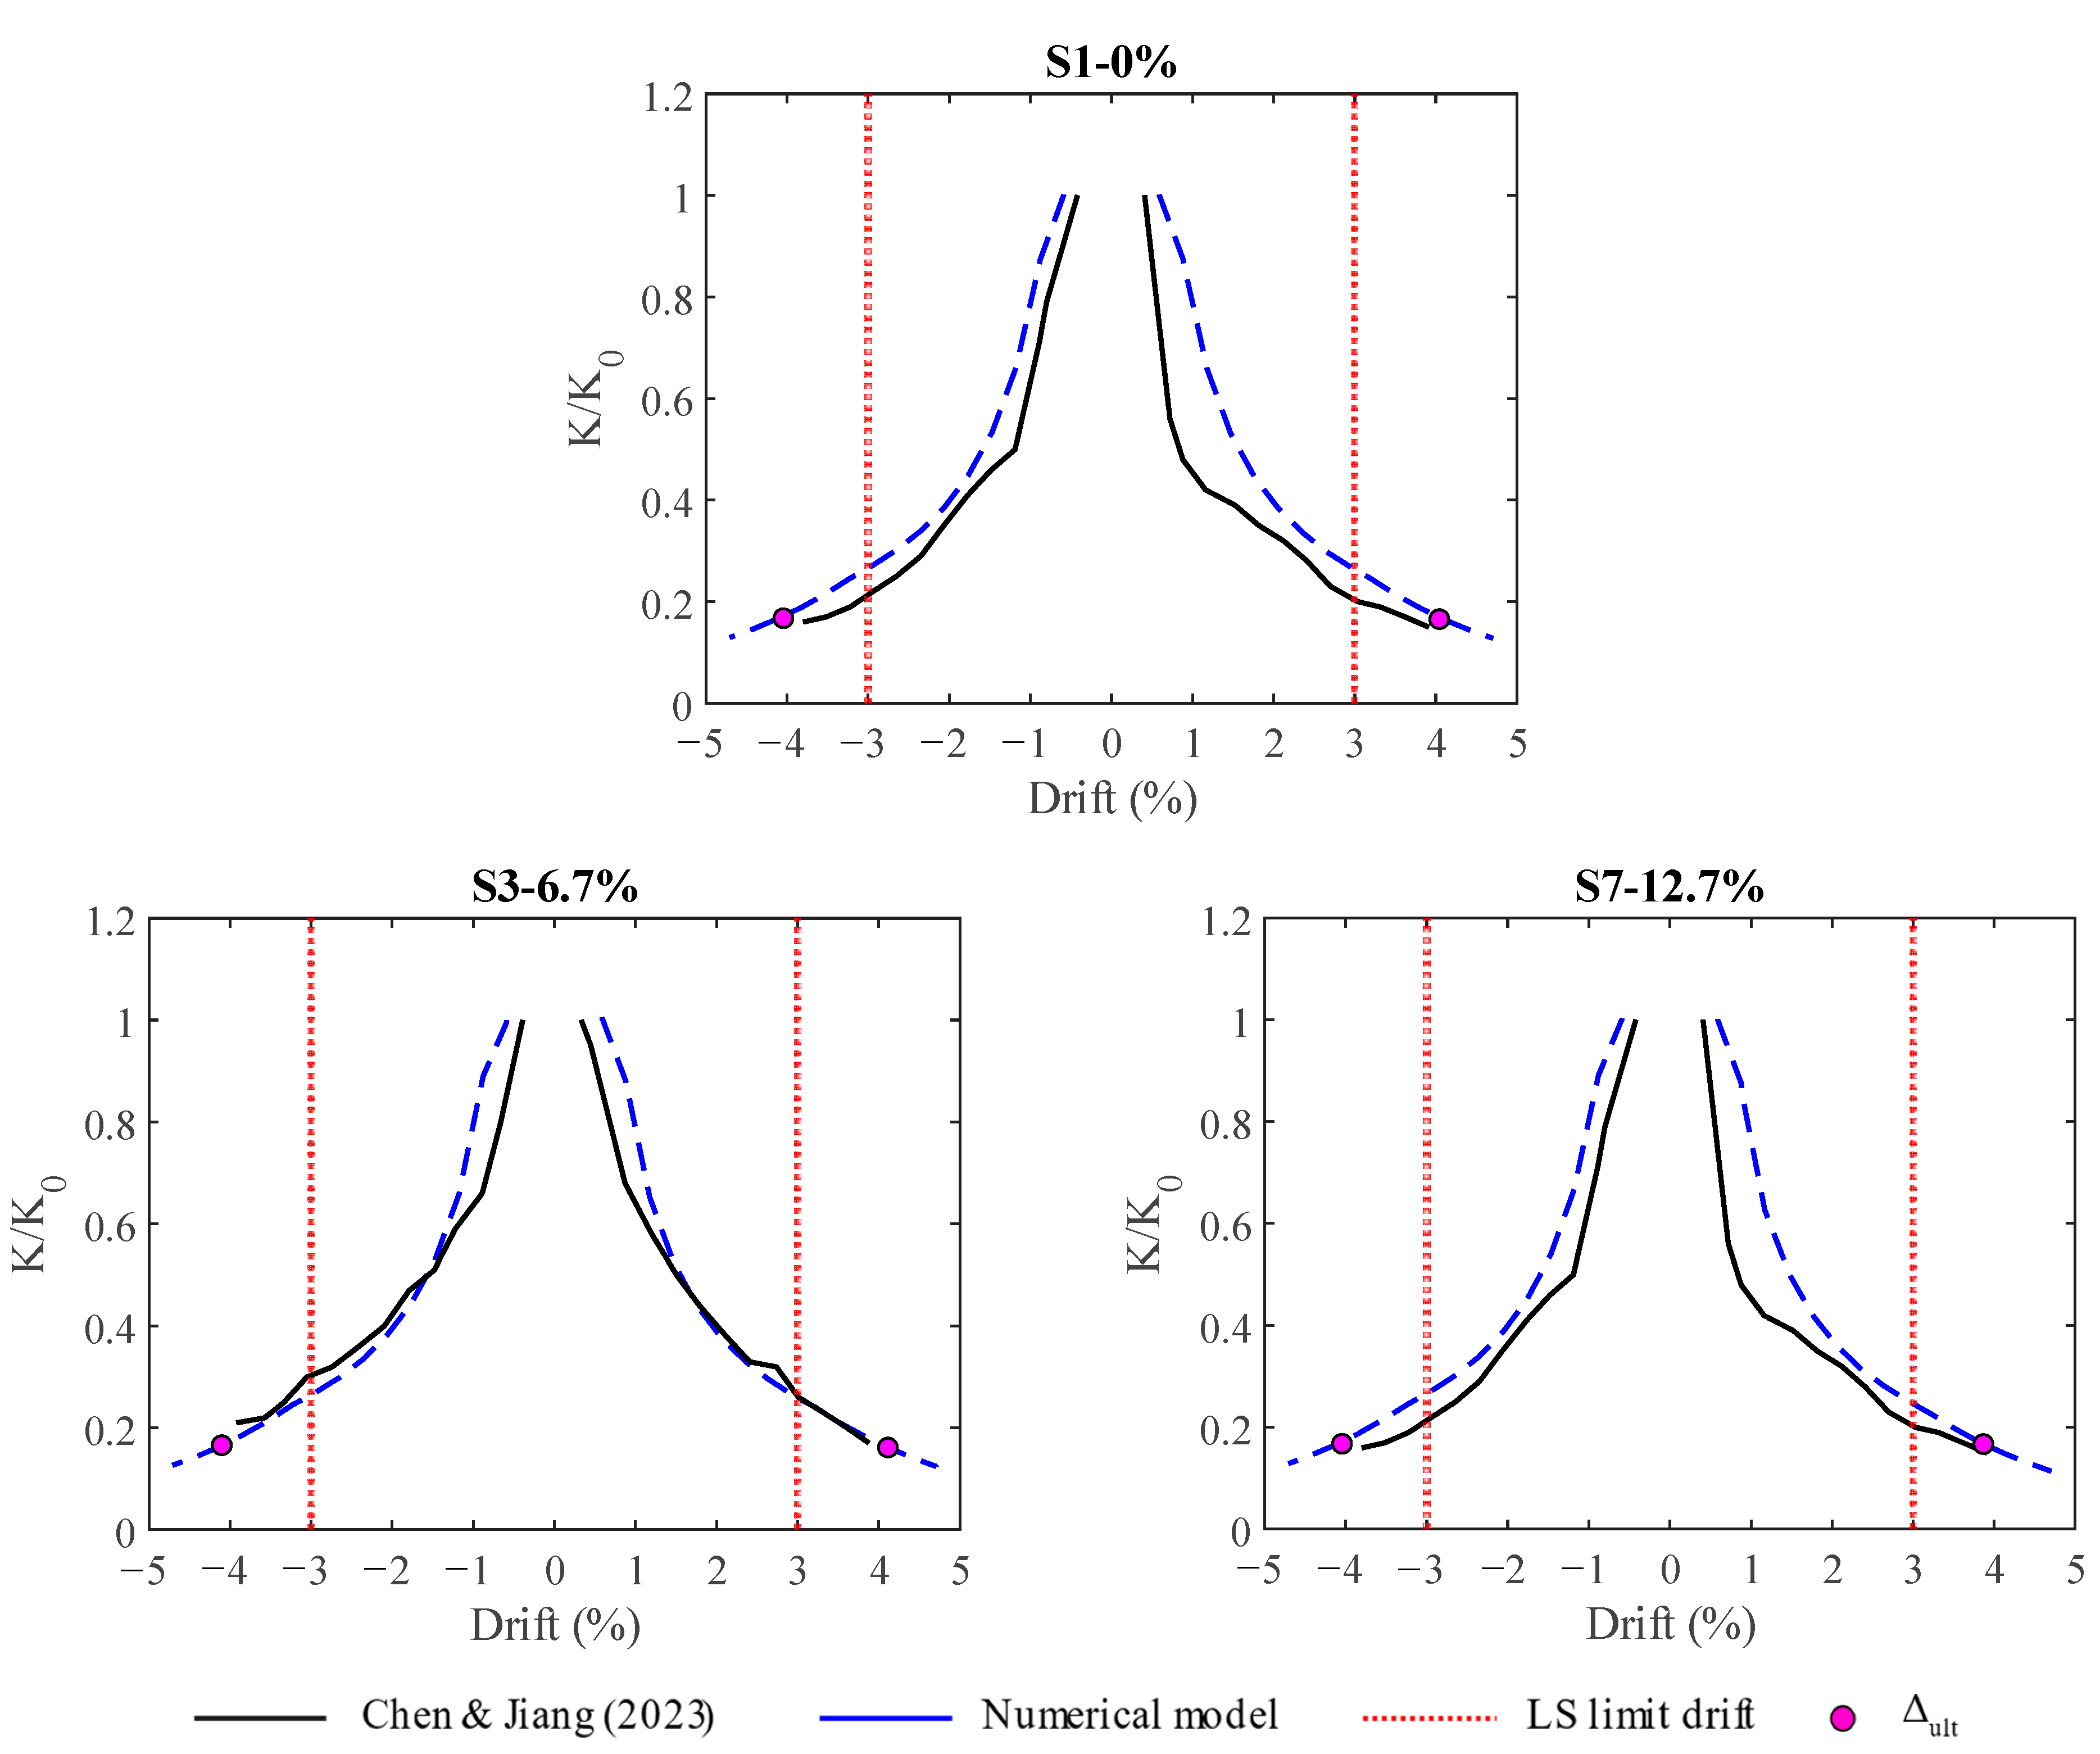
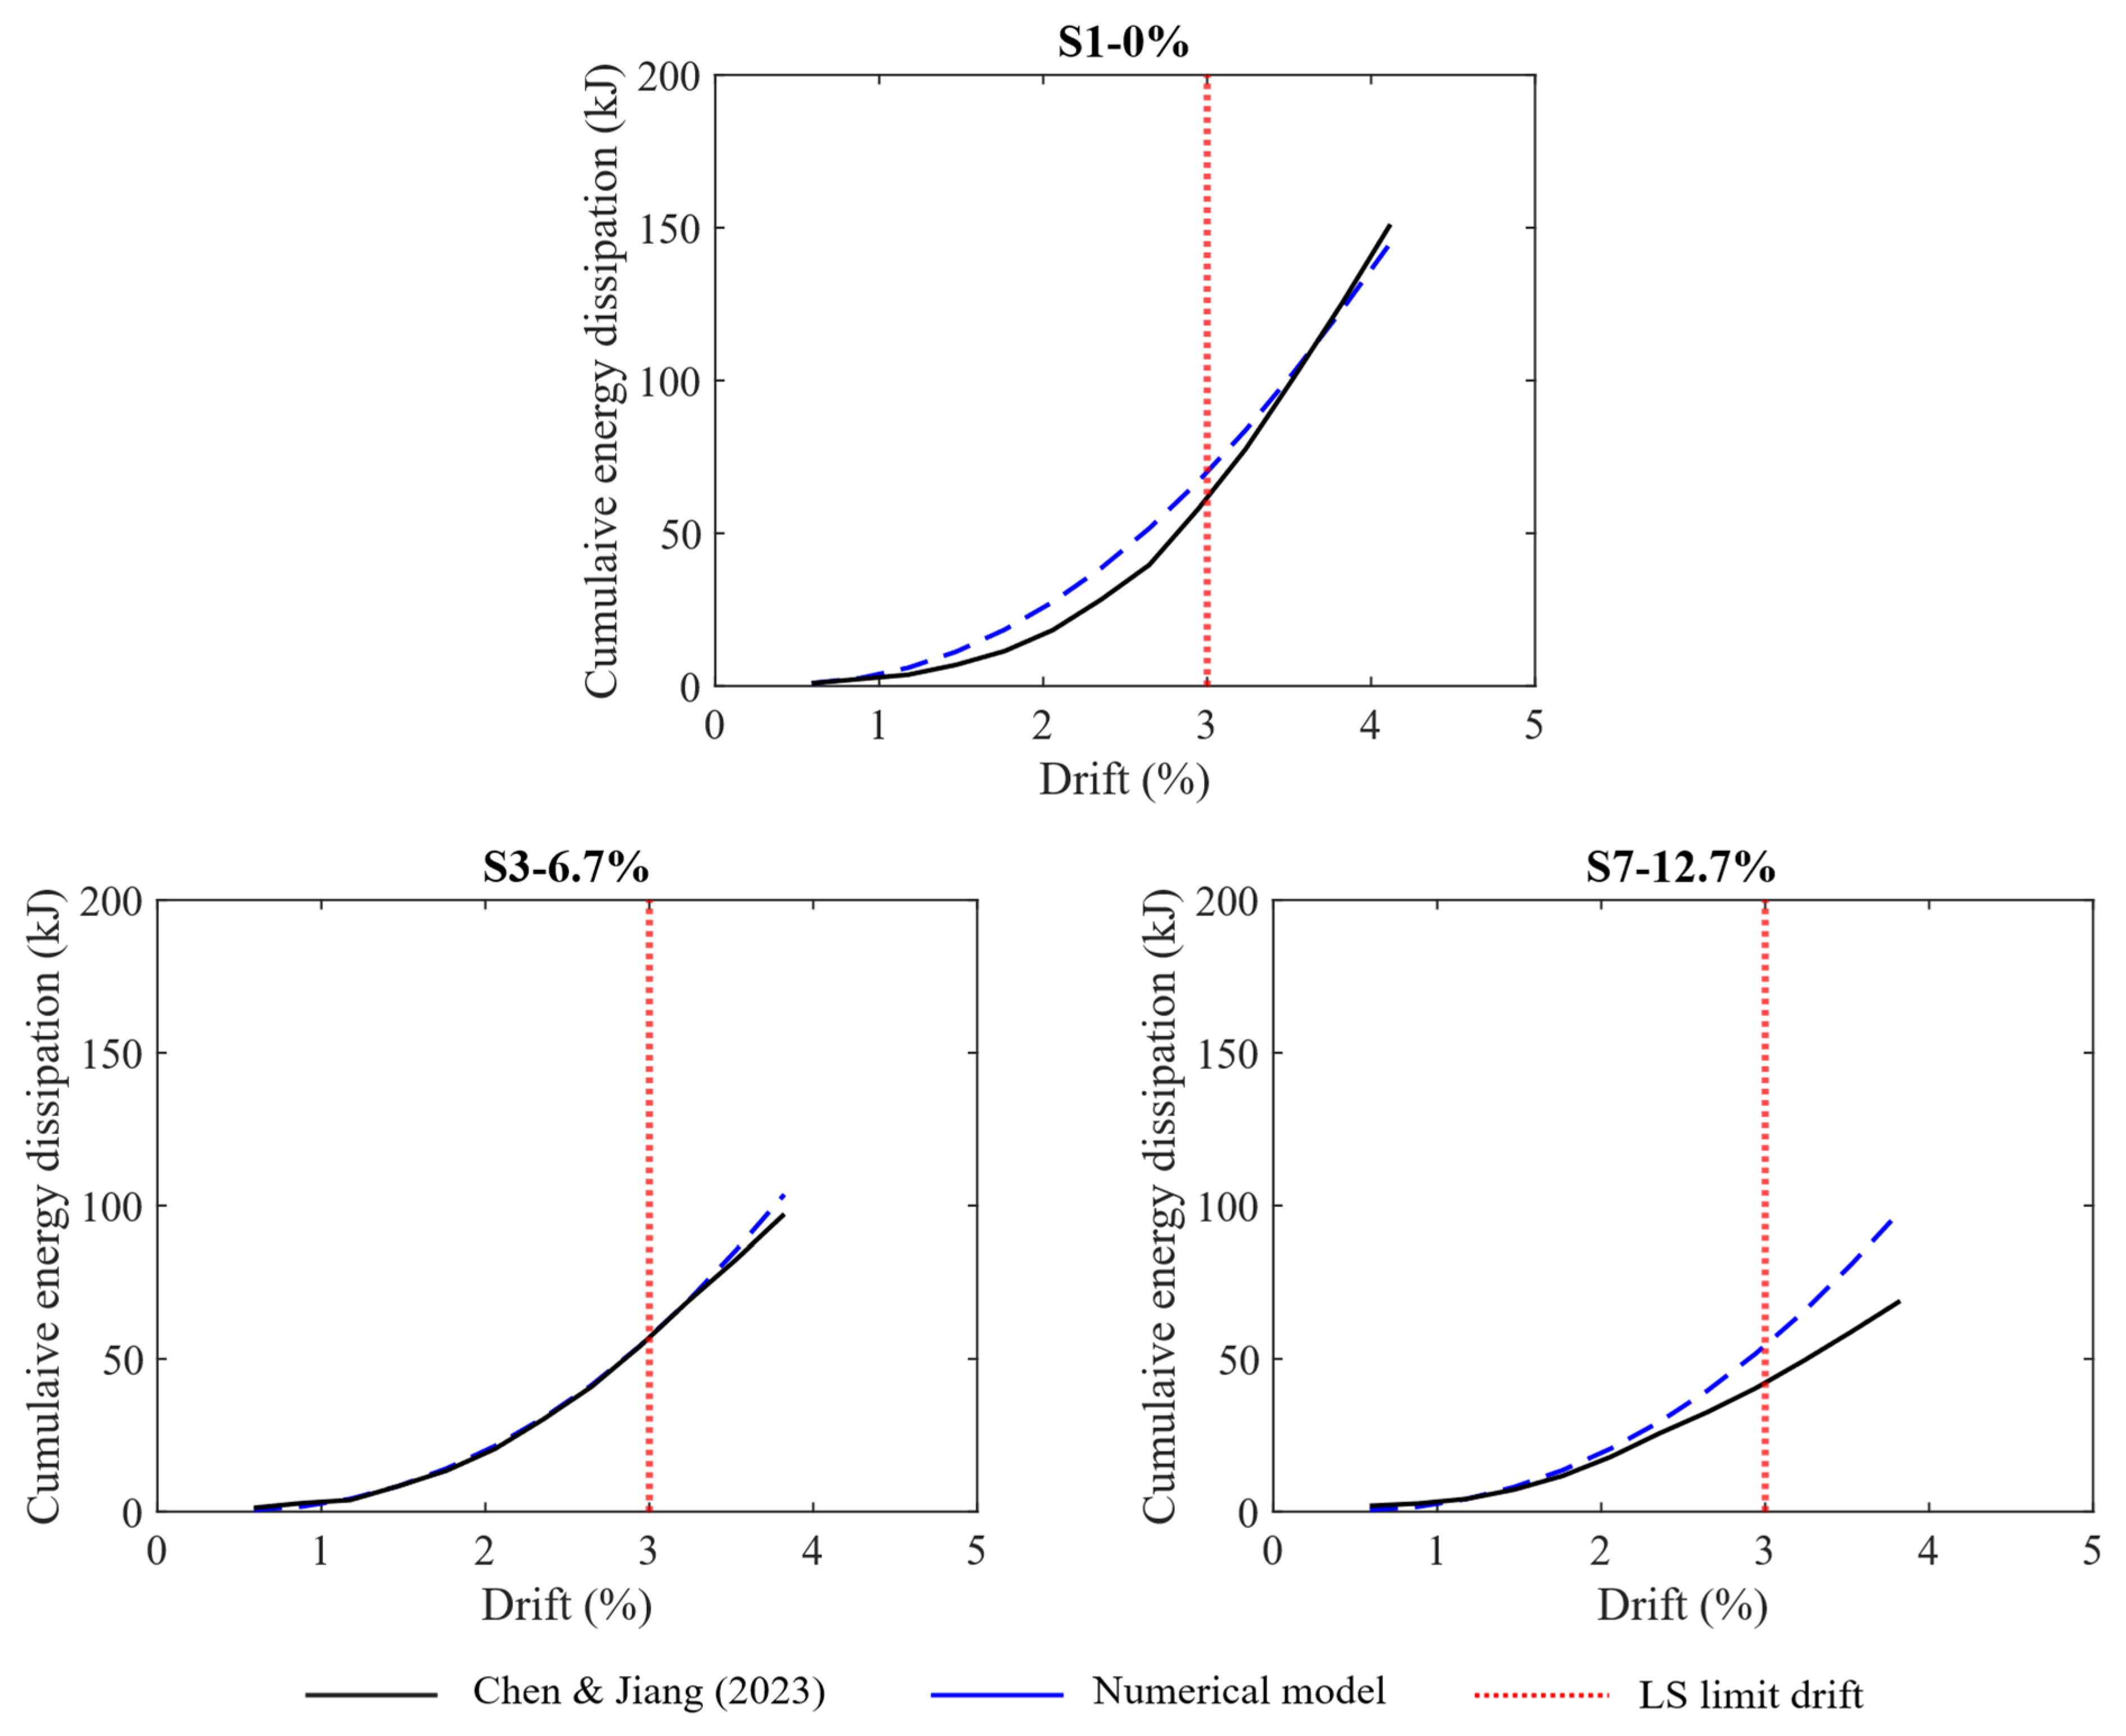
A comparative analysis between the numerical and the experimental results of cyclic behaviour, stiffness degradation, and dissipated energy is shown in Figure 15, Figure 16 and Figure 17. In addition, Table 4 makes a comparison between the analysed states, the maximum and ultimate lateral load, as well as the ultimate drift ratio. The results demonstrated that, in linear behaviour, the numerical models overestimated the lateral yield load. This phenomenon can be attributed to a number of factors, including the non-uniformity of the corrosion process in each of the frames and the subsequent deterioration of the elements. It is also influenced by the assumption of Young’s modulus of steel and Young’s modulus and the tensile strength of concrete.
In Figure 16, lateral stiffness, in the numerical results, tends to behave more symmetrically than in the experimental tests due to the non-uniform corrosion process; in the load-deformation history results, the error increases in the most corroded specimen. However, the ultimate displacements exhibit maximum differences of 9.9, 12.7, and 34.4%, which correspond to absolute displacement differences of 7.6, 7.9, and 17.6 mm for the frames with corrosion levels of 0, 6.7, and 12.7%, respectively.
The energy dissipated for each sample is analysed in Figure 17, where a suitable approximation was obtained. Frames with corrosion levels of 0 and 6.7% correspond to an error of 9.3 and 0%, respectively. Energy dissipation closely matched the experimental data within the drift ratio domain. On the other hand, the sample with a corrosion level of 12.7% shows an adequate similarity up to a 2.5% drift ratio, then the numerical model overestimates the dissipated energy up to the ultimate drift ratio with a 40% error rate.
According to the structural design codes, buildings are designed not to exceed the life safety (LS) limit state [25,49]. This implies that, for RC frames that have been seismically detailed, the expected drift ratio limit is 3.0%. As presented in Table 5, for seismically detailed specimens, the maximum observed errors were 30, 23.8 and 13.8% in positive and negative stiffness, and cumulative dissipated energy, respectively, for the non-corroded frame. For a corrosion level of 6.7%, the errors were 0.4, 13.3, and 0%, respectively, while for a corrosion level of 12.7%, they were 25, 28.5, and 29.1%, respectively. This implies that the applied methodology was adequate for structural revision purposes, with acceptable errors in terms of stiffness, strength, and dissipated energy.

5. Conclusions

In this paper, a practical modelling methodology was developed with the main aim to simulate the cyclic behaviour of reinforced concrete (RC) frames, considering the corrosion degradation (corrosion level < 25%) for structural assessment purposes. The employed methodology follows NTC-Concrete [25], the most significant errors were observed in the post-peak hysteretic response, caused by non-uniform corrosion along the RC element and the modelling assumptions regarding Young’s modulus and the tensile strength of concrete; however, these errors remained within acceptable values. On the other hand, the implemented models successfully captured the pinching effect in isolated columns and frames.
The differences observed between the proposed methodology and the experimental results are listed below:
-
For non-corroded columns: The dissipated energy and circular stiffness presented errors lower than 30%. The differences of the maximum and ultimate lateral load were lower than 5 and 3%, respectively.
-
With regard to corroded columns: The dissipated energy and circular stiffness showed errors lower than 30%. The differences of the maximum and ultimate lateral load were found to be less than 11 and 12%, respectively.
-
For non-corroded frames in LS: The dissipated energy and circular stiffness errors were found to be less than 23%. The differences in the maximum and ultimate lateral loads were found to be 6.8 and 7%, respectively.
-
With regard to corroded frames in LS: The dissipated energy and circular stiffness exhibited errors lower than 30%. The differences in the maximum and ultimate lateral loads were 15 and 12%, respectively.
In conclusion, the proposed methodology has been demonstrated to be an adequate representation of the cyclic behaviour of isolated columns and RC frames with and without corrosion in terms of maximum lateral load, ultimate lateral load, pinching effect, dissipated energy, and circular stiffness. For structural review purposes, the procedure is suitable, allowing for maximum errors of 33% in the dissipated energy. It is recommended to apply the methodology to further experimental tests under different corrosion mechanisms and design parameters (e.g., reinforcement ratios and cross-sections) in order to validate the findings or to define the appropriate Pivot parameter values for specific cases. Finally, this methodology provides engineers with a suitable tool to evaluate the behaviour of corroded structures without resorting to complex models.

Author Contributions

Conceptualization, F.C.-S. and J.B.-H.; Methodology, D.B.-J. and I.R.-G.; Project administration, R.S.-E.; Investigation, A.V.-C. and S.M.-D.; Writing—original draft, D.B.-J. and I.R.-G.; Writing—review & editing, J.P.-F., R.S.-E. and A.Z.-H.; Supervision, F.C.-S., R.S.-E. and J.B.-H.; Validation, J.P.-F.; Software, A.Z.-H. All authors have read and agreed to the published version of the manuscript.

Funding

This research received no external funding.

Data Availability Statement

Data are available from the authors.

Acknowledgments

The second and third authors would like to thank the Secretaría de Ciencia, Humanidades, Tecnología e Innovación (SECIHTI) for the master’s grants (Nos.1248432; 2080071), which allowed the present research, and to the Master’s in Engineering and Urban Resilience from the University of Veracruz.

Conflicts of Interest

The authors declare no conflicts of interest.

References

  1. Lin, H.; Zhao, Y.; Yang, J.Q.; Feng, P.; Ozbolt, J.; Ye, H. Effects of the Corrosion of Main Bar and Stirrups on the Bond Behavior of Reinforcing Steel Bar. Constr. Build Mater. 2019, 225, 13–28. [Google Scholar] [CrossRef]
  2. Angst, U.M. Predicting the Time to Corrosion Initiation in Reinforced Concrete Structures Exposed to Chlorides. Cem. Concr. Res. 2019, 115, 559–567. [Google Scholar] [CrossRef]
  3. Leporace-Guimil, B.; Conforti, A.; Zerbino, R.; Plizzari, G.A. Chloride-Induced Corrosion in Reinforced Concrete and Fiber Reinforced Concrete Elements under Tensile Service Loads. Cem. Concr. Compos. 2021, 124, 104245. [Google Scholar] [CrossRef]
  4. Cruz, C. Enemigo Número Uno de la Infraestructura Nacional; en Países Industrializados Provoca Pérdidas de Entre el Tres y Cinco Por Ciento del PIB. Available online: https://www.uv.mx/universo-hemeroteca/237/reportaje/reportaje.html (accessed on 16 January 2025).
  5. Valdez, B.; Ramirez, J.; Eliezer, A.; Schorr, M.; Ramos, R.; Salinas, R. Corrosion Assessment of Infrastructure Assets in Coastal Seas. J. Mar. Eng. Technol. 2016, 15, 124–134. [Google Scholar] [CrossRef]
  6. Baltazar-García, B.P.; Baltazar-Zamora, D.F.; Santiago-Hurtado, G.; Moreno-Landeros, V.; Lozano, D.; Landa-Ruiz, L.; Shukla, S.; Baltazar-Zamora, M.A. Behavior of Potential of Half-Cell AISI 1018 and GS in Concrete Buried in Sand in the Presence of MgSO4. Eur. J. Eng. Technol. Res. 2024, 9, 32–36. [Google Scholar] [CrossRef]
  7. Cook, D.C.; Van Orden, A.C.; Reyes, J.; Oh, S.J.; Balasubramanian, R.; Carpio, J.J.; Townsend, H.E. Atmospheric Corrosion in Marine Environments Along the Gulf of México; ASTM Special Technical Publication: West Conshohocken, PA, USA, 2000; pp. 75–97. [Google Scholar] [CrossRef]
  8. Yu, X.H.; Dai, K.Y.; Li, Y.S. Variability in Corrosion Damage Models and Its Effect on Seismic Collapse Fragility of Aging Reinforced Concrete Frames. Constr. Build Mater. 2021, 295, 123654. [Google Scholar] [CrossRef]
  9. Moodi, Y.; Sohrabi, M.R.; Mousavi, S.R. Corrosion Effect of the Main Rebar and Stirrups on the Bond Strength of RC Beams. Structures 2021, 32, 1444–1454. [Google Scholar] [CrossRef]
  10. Tondolo, F. Bond Behaviour with Reinforcement Corrosion. Constr. Build. Mater 2015, 93, 926–932. [Google Scholar] [CrossRef]
  11. Shunmuga Vembu, P.R.; Ammasi, A.K. A Comprehensive Review on the Factors Affecting Bond Strength in Concrete. Buildings 2023, 13, 577. [Google Scholar] [CrossRef]
  12. Zhang, K.; Xiao, J.; Zhao, Y.; Zhang, Q. Analytical Model for Critical Corrosion Level of Reinforcements to Cause the Cracking of Concrete Cover. Constr. Build Mater 2019, 223, 185–197. [Google Scholar] [CrossRef]
  13. Zhang, X.; Zhang, Y.; Liu, B.; Liu, B.; Wu, W.; Yang, C. Corrosion-Induced Spalling of Concrete Cover and Its Effects on Shear Strength of RC Beams. Eng. Fail Anal. 2021, 127, 105538. [Google Scholar] [CrossRef]
  14. Chen, H.P.; Jiang, Y.; Markou, G. Structural Performance Deterioration of Corroding Reinforced Concrete Columns in Marine Environments. Ocean. Eng. 2022, 262, 112155. [Google Scholar] [CrossRef]
  15. Zhang, G.; Cao, X.; Fu, Q. Experimental Study on Residual Strength of Concrete Confined with Corroded Stirrups. Can. J. Civ. Eng. 2016, 43, 583–590. [Google Scholar] [CrossRef]
  16. De Domenico, D.; Lamberto, G.; Messina, D.; Recupero, A. Seismic Vulnerability Assessment of Reinforced Concrete Bridge Piers Exposed to Chloride-Induced Corrosion. Procedia Struct. Integr. 2022, 44, 633–640. [Google Scholar] [CrossRef]
  17. Miao, Z.; Liu, Y.; Chen, K.; Niu, X. Modification of Uniaxial Stress–Strain Model of Concrete Confined by Pitting Corroded Stirrups. Materials 2024, 17, 6014. [Google Scholar] [CrossRef] [PubMed]
  18. Berto, L.; Caprili, S.; Saetta, A.; Salvatore, W.; Talledo, D. Corrosion Effects on the Seismic Response of Existing Rc Frames Designed According to Different Building Codes. Eng. Struct. 2020, 216, 110397. [Google Scholar] [CrossRef]
  19. Kordtabar, B.; Dehestani, M. Effect of Corrosion in Reinforced Concrete Frame Components on Pushover Behavior and Ductility of Frame. Struct. Concr. 2021, 22, 2665–2687. [Google Scholar] [CrossRef]
  20. Al-Huri, M.A.; Al-Osta, M.A.; Ahmad, S. Finite Element Modelling of Corrosion-Damaged RC Beams Strengthened Using the UHPC Layers. Materials 2022, 15, 7606. [Google Scholar] [CrossRef]
  21. Arunkumar, Y.M.; Prashanth, S.; Pandit, P.; Girish, M.G.; Shetty, A. Finite Element Analysis Of Bond Behavior In Corroded Reinforced Concrete Beams: State-Of-The-Art. J. Appl. Eng. Sci. 2023, 21, 1031–1042. [Google Scholar] [CrossRef]
  22. Zaghian, S.; Martín-Pérez, B.; Almansour, H. Nonlinear Finite Element Modeling of the Impact of Reinforcement Corrosion on Bridge Piers under Concentric Loads. Struct. Concr. 2022, 23, 138–153. [Google Scholar] [CrossRef]
  23. Castorena-González, J.H.; Martin, U.; Gaona-Tiburcio, C.; Núñez-Jáquez, R.E.; Almeraya-Calderón, F.M.; Bastidas, J.M.; Bastidas, D.M. Modeling Steel Corrosion Failure in Reinforced Concrete by Cover Crack Width 3D FEM Analysis. Front Mater 2020, 7, 483965. [Google Scholar] [CrossRef]
  24. Sæther, I.; Sand, B. FEM Simulations of Reinforced Concrete Beams Attacked by Corrosion. Nord. Concr. Res. 2012, 39, 15–31. [Google Scholar]
  25. Gaceta del Gobierno de la Ciudad de México NTC-Concrete; México, 2023. Available online: https://www.isc.cdmx.gob.mx/directores-res/cursos-de-actualizacion-2022/normas-tecnicas-complementarias-2023 (accessed on 10 July 2025).
  26. Rodríguez, J.; Andrade, C.; Izquierdo, D.; Tanner, P. El Eurocódigo 2 y La Evaluación de Estructuras de Hormigón Armado Con Armaduras Corroídas. Hormigón Y Acero 2014, 65, 123–132. [Google Scholar] [CrossRef]
  27. Instituto Nacional de la Infraestructura Física Educativa Normatividad Técnica, Ciudad de México, México, 2024. Available online: https://www.gob.mx/inifed/acciones-y-programas/normatividad-tecnica (accessed on 10 July 2025).
  28. Gaceta del Gobierno de la Ciudad de México NTC- Evaluation and Rehabilitation; Ciudad de México, México, 2023. Available online: https://www.isc.cdmx.gob.mx/directores-res/cursos-de-actualizacion-2022/normas-tecnicas-complementarias-2023 (accessed on 10 July 2025).
  29. CSi America ETABS V22 2024. Available online: https://www.csiespana.com/software/5/etabs (accessed on 10 July 2025).
  30. Arias, D.; Rodriguez, D.; Pérez, K.; Muria, D. Análisis de Estrategias Numéricas Para El Modelado No Lineal de Muros de Concreto Reforzado. In Proceedings of the XXIV Congreso Nacional De Ingeniería Sísmica, Guadalajara, Mexico, 1–4 November 2023; Available online: https://www.researchgate.net/publication/378740048_Analisis_de_estrategias_numericas_para_el_modelado_no_lineal_de_muros_de_concreto_reforzado (accessed on 10 July 2025).
  31. Mostafaei, H.; Barmchi, M.A.; Bahmani, H. Seismic Resilience and Sustainability: A Comparative Analysis of Steel and Reinforced Structures. Buildings 2025, 15, 1613. [Google Scholar] [CrossRef]
  32. Inel, M.; Ozmen, H.B. Effects of Plastic Hinge Properties in Nonlinear Analysis of Reinforced Concrete Buildings. Eng. Struct. 2006, 28, 1494–1502. [Google Scholar] [CrossRef]
  33. Panandikar Hede, N.; Narayan, K.S.B. Sensitivity of Pushover Curve to Material and Geometric Modelling—An Analytical Investigation. Structures 2015, 2, 91–97. [Google Scholar] [CrossRef]
  34. Park, R.; Paulay, T. Reinforced Concrete Structures; John Wiley & Sons: Hoboken, NJ, USA, 1975; p. 769. [Google Scholar] [CrossRef]
  35. Mander, J.B.; Priestley, M.J.N.; Park, R. Theoretical Stress Strain Model for Confined Concrete. J. Struct. Eng.-Asce 1988, 114, 1804–1826. [Google Scholar] [CrossRef]
  36. Du, Y.; Clark, L.A.; Chan, A.H.C. Impact of Reinforcement Corrosion on Ductile Behavior of Reinforced Concrete Beams. Struct. J. 2007, 104, 285–293. [Google Scholar] [CrossRef]
  37. Kashani, M.M.; Lowes, L.N.; Crewe, A.J.; Alexander, N.A. Phenomenological Hysteretic Model for Corroded Reinforcing Bars Including Inelastic Buckling and Low-Cycle Fatigue Degradation. Comput. Struct 2015, 156, 58–71. [Google Scholar] [CrossRef]
  38. Lee, H.S.; Cho, Y.S. Evaluation of the Mechanical Properties of Steel Reinforcement Embedded in Concrete Specimen as a Function of the Degree of Reinforcement Corrosion. Int. J. Fract. 2009, 157, 81–88. [Google Scholar] [CrossRef]
  39. Zhao, G.; Zhang, M.; Li, Y.; Li, D. The Hysteresis Performance and Restoring Force Model for Corroded Reinforced Concrete Frame Columns. J. Eng. 2016, 2016, 7615385. [Google Scholar] [CrossRef]
  40. Shayanfar, M.A.; Barkhordari, M.A.; Ghanooni-Bagha, M. Effect of Longitudinal Rebar Corrosion on the Compressive Strength Reduction of Concrete in Reinforced Concrete Structure. Adv. Struct. Eng. 2016, 19, 897–907. [Google Scholar] [CrossRef]
  41. Dowell, R.K.; Seible, F.; Wilson, E.L. Pivot Hysteresis Model for Reinforced Concrete Members. Struct. J. 1998, 95, 607–617. [Google Scholar] [CrossRef]
  42. Son, J.K.; Lee, C.H. Evaluation of Appropriate Hysteresis Model for Nonlinear Dynamic Analysis of Existing Reinforced Concrete Moment Frames. Materials 2021, 14, 524. [Google Scholar] [CrossRef]
  43. Ling, Y.C.; Mogili, S.; Hwang, S.J. Parameter Optimization for Pivot Hysteresis Model for Reinforced Concrete Columns with Different Failure Modes. Earthq. Eng. Struct. Dyn. 2022, 51, 2167–2187. [Google Scholar] [CrossRef]
  44. Lepage, A.; Hopper, M.W.; Delgado, S.A.; Dragovich, J.J. Best-Fit Models for Nonlinear Seismic Response of Reinforced Concrete Frames. Eng. Struct 2010, 32, 2931–2939. [Google Scholar] [CrossRef]
  45. Sharma, A.; Eligehausen, R.; Reddy, G.R. Pivot Hysteresis Model Parameters for Reinforced Concrete Columns, Joints, and Structures. ACI Struct. J. 2013, 110, 217–227. [Google Scholar] [CrossRef]
  46. Yang, S.Y.; Song, X.B.; Jia, H.X.; Chen, X.; Liu, X. La Experimental Research on Hysteretic Behaviors of Corroded Reinforced Concrete Columns with Different Maximum Amounts of Corrosion of Rebar. Constr. Build Mater. 2016, 121, 319–327. [Google Scholar] [CrossRef]
  47. Chen, S.; Jiang, H. Experimental Investigation on Seismic Performance of Non-Uniformly Corroded RC Moment-Resisting Frames. Materials 2023, 16, 2649. [Google Scholar] [CrossRef]
  48. GB 50011-2010; Code for Seismic Design of Buildings. Ministry of Housing and Urban-Rural Development of the People’s Republic of China: Beijing, China, 2016. Available online: https://www.codeofchina.com/standard/GB50011-2010(2016).html (accessed on 10 July 2025).
  49. ACI-318; Building Code Requirements for Structural Concrete and Commentary. American Concrete Institute: Farmington Hills, MI, USA, 2025. Available online: https://www.concrete.org/store/productdetail.aspx?ItemID=318U19&Language=English&Units=US_Units (accessed on 10 July 2025).
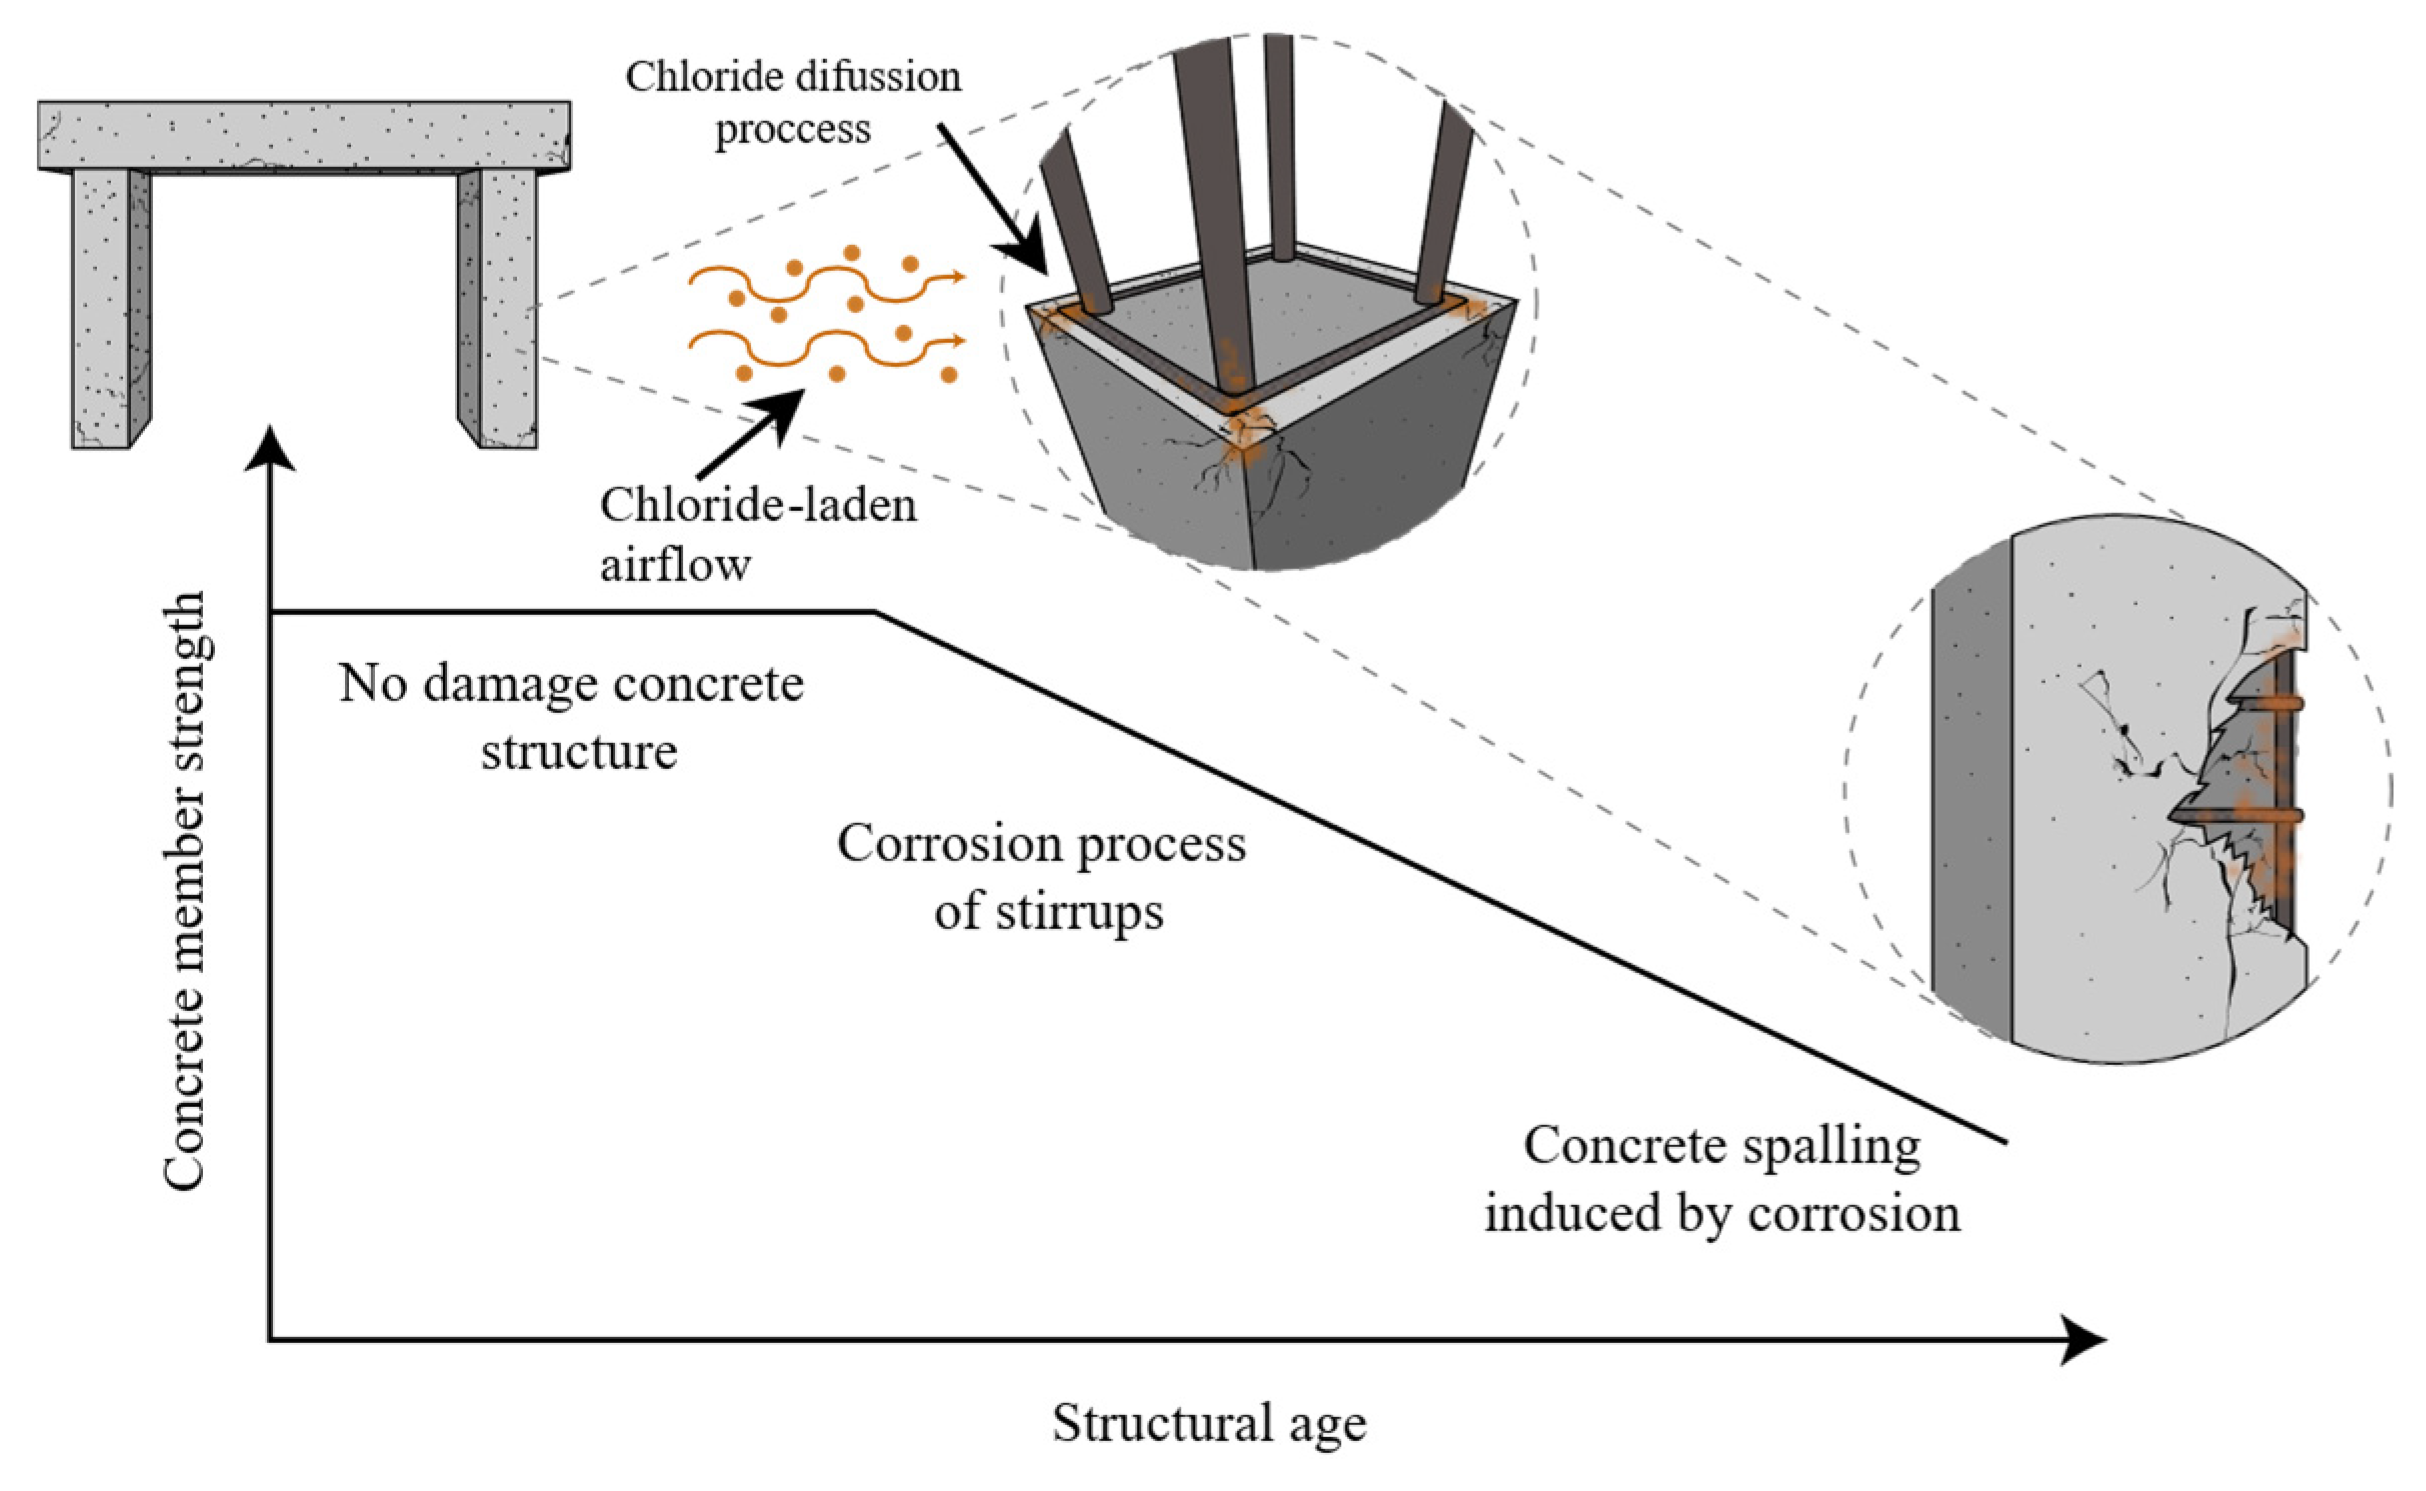
Figure 1. Typical corrosion deterioration process in RC structures that do not fulfil the durability design.
Buildings 15 03110 g001
Figure 2. RC specimens modelling, fiber sections, and concentrated plasticity hinges.
Buildings 15 03110 g002
Figure 3. Fiber section meshing in an 8 × 8 configuration.
Buildings 15 03110 g003
Figure 4. Deterioration effects in load-strain relations on a corroded RC column.
Buildings 15 03110 g004
Figure 5. Moment–rotation relation considering the corrosion effects calculated using Equations (8)–(12), considering NTC-Concrete [25].
Buildings 15 03110 g005
Figure 6. Geometrical properties and reinforcement details of the tested columns [46].
Buildings 15 03110 g006
Figure 7. Lateral displacements applied [46].
Buildings 15 03110 g007
Figure 8. Lateral loading protocol [47].
Buildings 15 03110 g008
Figure 9. Geometrical properties and reinforcement details of the frames [47].
Buildings 15 03110 g009
Figure 10. Lateral load—displacement relation of the columns [46].
Buildings 15 03110 g010
Figure 11. Lateral load—displacement envelope [46].
Buildings 15 03110 g011
Figure 12. Normalized cumulative energy degradation on displacement domain [46].
Buildings 15 03110 g012
Figure 13. Normalized circular stiffness degradation on displacement domain [46].
Buildings 15 03110 g013
Figure 14. Normalized degradations on corrosion level domain: maximum load, ultimate load and dissipated energy absorption [46].
Buildings 15 03110 g014
Figure 15. Lateral load—displacement relation of frames [47].
Buildings 15 03110 g015
Figure 16. Normalized stiffness degradation of frames [47].
Buildings 15 03110 g016
Figure 17. Cumulative energy dissipation [47].
Buildings 15 03110 g017
Table 1. Mechanical properties of RC for columns models.
MaterialPropertyColumns
Reinforcing
steel
Corrosion level (%)05.113.216.8
Φ = 6 mmCross-section area (mm2)28.228.127.726.1
Φ = 18 mmCross-section area (mm2)254.4241.4220.7211.7
ConcreteYoung’s modulus (MPa)30,100.028,254.224,467.922,582.3
Unconfined compressive strength (MPa)46.841.230.926.3
Confined compressive strength (MPa)52.050.748.747.3
Tensile strength (MPa)3.23.02.62.4
Table 2. Mechanical properties of RC for frame models.
MaterialPropertyFrame
S1S3S7
Reinforcing
steel
Corrosion level (%)06.712.7
Φ = 6 mmCross-section area (mm2)113.0105.498.7
Ultimate strain0.090.070.06
Φ = 18 mmCross-section area (mm2)153.9143.6134.4
Ultimate strain0.090.070.06
ConcreteYoung’s modulus (MPa)27,407.425,083.922,504.6
Unconfined compressive strength (MPa)38.832.526.1
Confined compressive strength (MPa)43.638.833.2
Tensile strength (MPa)2.92.62.4
Table 3. Isolated column comparison: maximum and ultimate loads, ultimate displacement, and dissipated energy.
CapacityCorrosion Level (η)
0%5.1%13.25%16.8%
ENε (%)ENε (%)ENε (%)ENε (%)
Maximum load (kN) (+)59.662.65.058.760.63.258.656.63.446.952.111.1
Ultimate load (kN) (+)51.750.03.344.248.59.744.545.31.839.141.97.2
Ultimate displacement (mm) (+)44.3734.023.439.634.014.134.034.00.029.830.00.7
Ultimate load (kN) (−)51.150.21.843.148.412.344.544.80.738.641.37.0
Ultimate displacement (mm) (−)44.033.923.043.148.512.534.033.90.330.129.90.7
Energy absorption (kN∙mm)14,861.015,055.01.314,947.111,748.021.411,145.98684.022.17407.06890.07.0
E: Experimental capacity; N: Numerical capacity; ε: Relative error.
Table 4. Frame comparison: maximum and ultimate loads, displacement, and dissipated energy.
CapacityCorrosion Level (η)
0%6.7%12.7%
ENεENεENε
Yield load (kN) (+)105.3110.54.9102.2102.70.591.894.12.5
Yield load (kN) (−)95.6109.414.468.2101.8549.357.798.069.8
Maximum load (kN) (+)119.6113.84.8118.4103.412.7109.593.015.1
Maximum load (kN) (−)121.9113.66.8105.5104.21.293.3100.27.4
Ultimate displacement (mm) (+)73.068.85.862.069.912.762.165.75.8
Ultimate load (kN) (+)101.696.25.3100.688.112.493.081.012.9
Ultimate displacement (mm) (−)76.468.89.970.169.70.651.268.834.4
Ultimate load (kN) (−)103.696.37.089.689.30.379.385.17.3
Total cumulative energy dissipation (kJ)151.1145.14.097.2100.53.469.097.140.7
E: Experimental capacity; N: Numerical capacity; ε: Relative error.
Table 5. Frame comparison in LS: maximum and ultimate loads, displacement, and dissipated energy.
ParameterCorrosion Level (η)
0%6.7%12.7%
Positive stiffness error (%)300.425.0
Negative stiffness error (%)23.813.328.5
Accumulative dissipated energy (%)13.80.029.1
Disclaimer/Publisher’s Note: The statements, opinions and data contained in all publications are solely those of the individual author(s) and contributor(s) and not of MDPI and/or the editor(s). MDPI and/or the editor(s) disclaim responsibility for any injury to people or property resulting from any ideas, methods, instructions or products referred to in the content.