4.1. IDA of the Structure
To analyze the seismic vulnerability of the SRC frame-RC core tube high-rise structure, the IDA of the structure was first conducted with bidirectional ground motions input. For each group, the PGA
y of the selected ground motion along the structural
Y-axis is sequentially scaled to 0.02 g, 0.07 g, 0.1 g, 0.2 g, 0.3 g, …, 1.0 g, 1.2 g, 1.4 g, 1.6 g, …, while maintaining the ratio of PGA
y/PGA
x = 1:0.85 constant. The elastic or elastic–plastic time–history analysis of the structure was conducted one by one, and the scaling and calculation were terminated when the slope between two adjacent performance points was less than 0.2
Ke or the
θmax exceeded 0.1. The PGA
yi was converted into corresponding
S90ci. Taking
θmax as the seismic response indicator, a series of performance points (
θmaxi,
S90ci) were obtained, and connecting these performance points forms a single IDA curve. By varying the ground motions and repeating the above procedure, additional IDA curves were obtained. Finally, the IDA curve clusters of the structure under LPGMs and OGMs were obtained, as shown in
Figure 3.
4.2. Structural Damage Assessment Based on Seismic Vulnerability Curves
The structural seismic vulnerability is the conditional probability P(LS|IM) that the EDP reaches or exceeds the quantitative limit value corresponding to a certain performance level under ground motions of different intensities [
34], which is usually represented by a seismic vulnerability curve, that is, the relationship curve between IM and exceeding probability P(LS|IM).
Assuming that the limit value of EDP corresponding to the performance level LS
i is
edpi, the conditional probability
can be expressed as:
Assuming that
follows a logarithmic standard normal distribution, that is:
where
μlnEDP|IM = im and
σlnEDP|IM = im are the logarithmic mean and logarithmic standard deviation of EDP given IM = im, respectively, and Φ(
x) is the standard normal distribution function.
Based on the IDA results of the structure under LPGMs and OGMs in
Section 4.1, the conditional probability
P(LS
i) that the
θmax exceeds each performance level LS
i was calculated according to Equation (5). Taking
S90c as the horizontal axis and
P(LS
i|
S90c) as the vertical axis, the seismic vulnerability curve of the structure, that is, the exceeding probability curve of each performance level, was drawn.
The calculation process of the vulnerability curve of the basic usability performance level was illustrated as an example. Firstly, according to the structural IDA results, the corresponding
θmax under the same
S90c for each group of ground motions was obtained, and the
μlnθmax and
σlnθmax of
θmax were calculated. Secondly,
μlnθmax,
σlnθmax, and the limit value of
θmax for a basic usability performance level of 1/400 were substituted into Equation (5) to calculate the exceeding probability as:
Finally, taking S90c as the horizontal axis and P(θmax ≥ 1/400|S90c) as the vertical axis, the seismic vulnerability curve of the basic usability performance level for the structure was drawn.
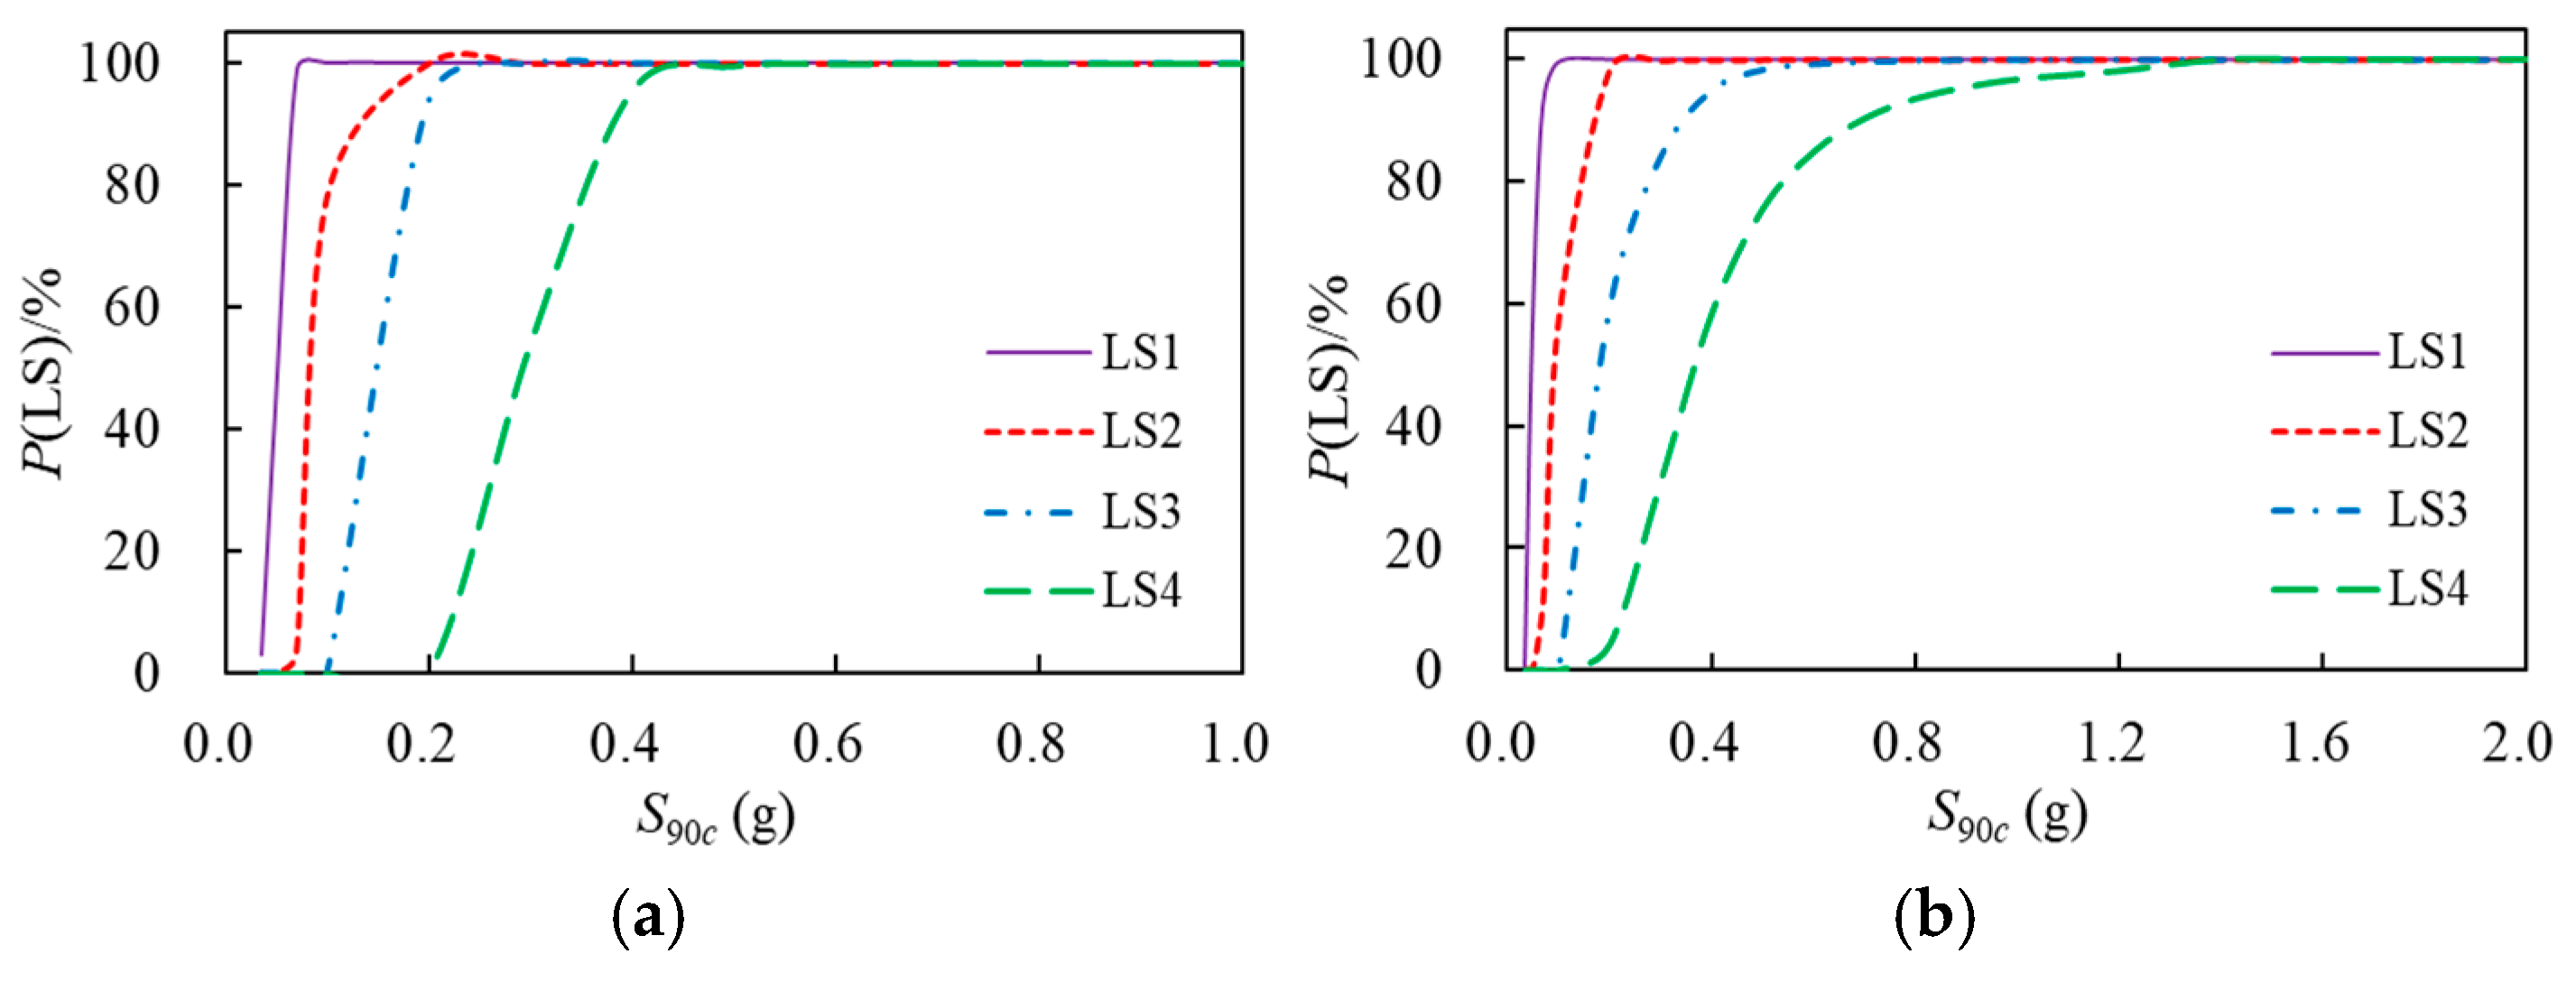
Figure 4 represents the seismic vulnerability curves of the structure under LPGMs and OGMs. As observed from
Figure 4, the vulnerability curve of the normal usability performance level LS
1 is the steepest, indicating that maintaining normal performance levels without structural damage during earthquakes is challenging; that is, it is relatively easy for the structure to exceed the limit of the elastic inter-story drift angle and enter the plastic state. As
S90c increases, the structural damage gradually accumulates, and the vulnerability curves of the basic usability performance level LS
2, repairable usability performance level LS
3, and life safety performance level LS
4 gradually become flatter, indicating that the exceeding probability of the above performance levels under the ground motions of the same intensity continuously decreases, and the range of ground motion intensity changes required increases. This is because the ductility of the structure entering the elastic–plastic stage gradually comes into play, thereby enhancing seismic resistance.
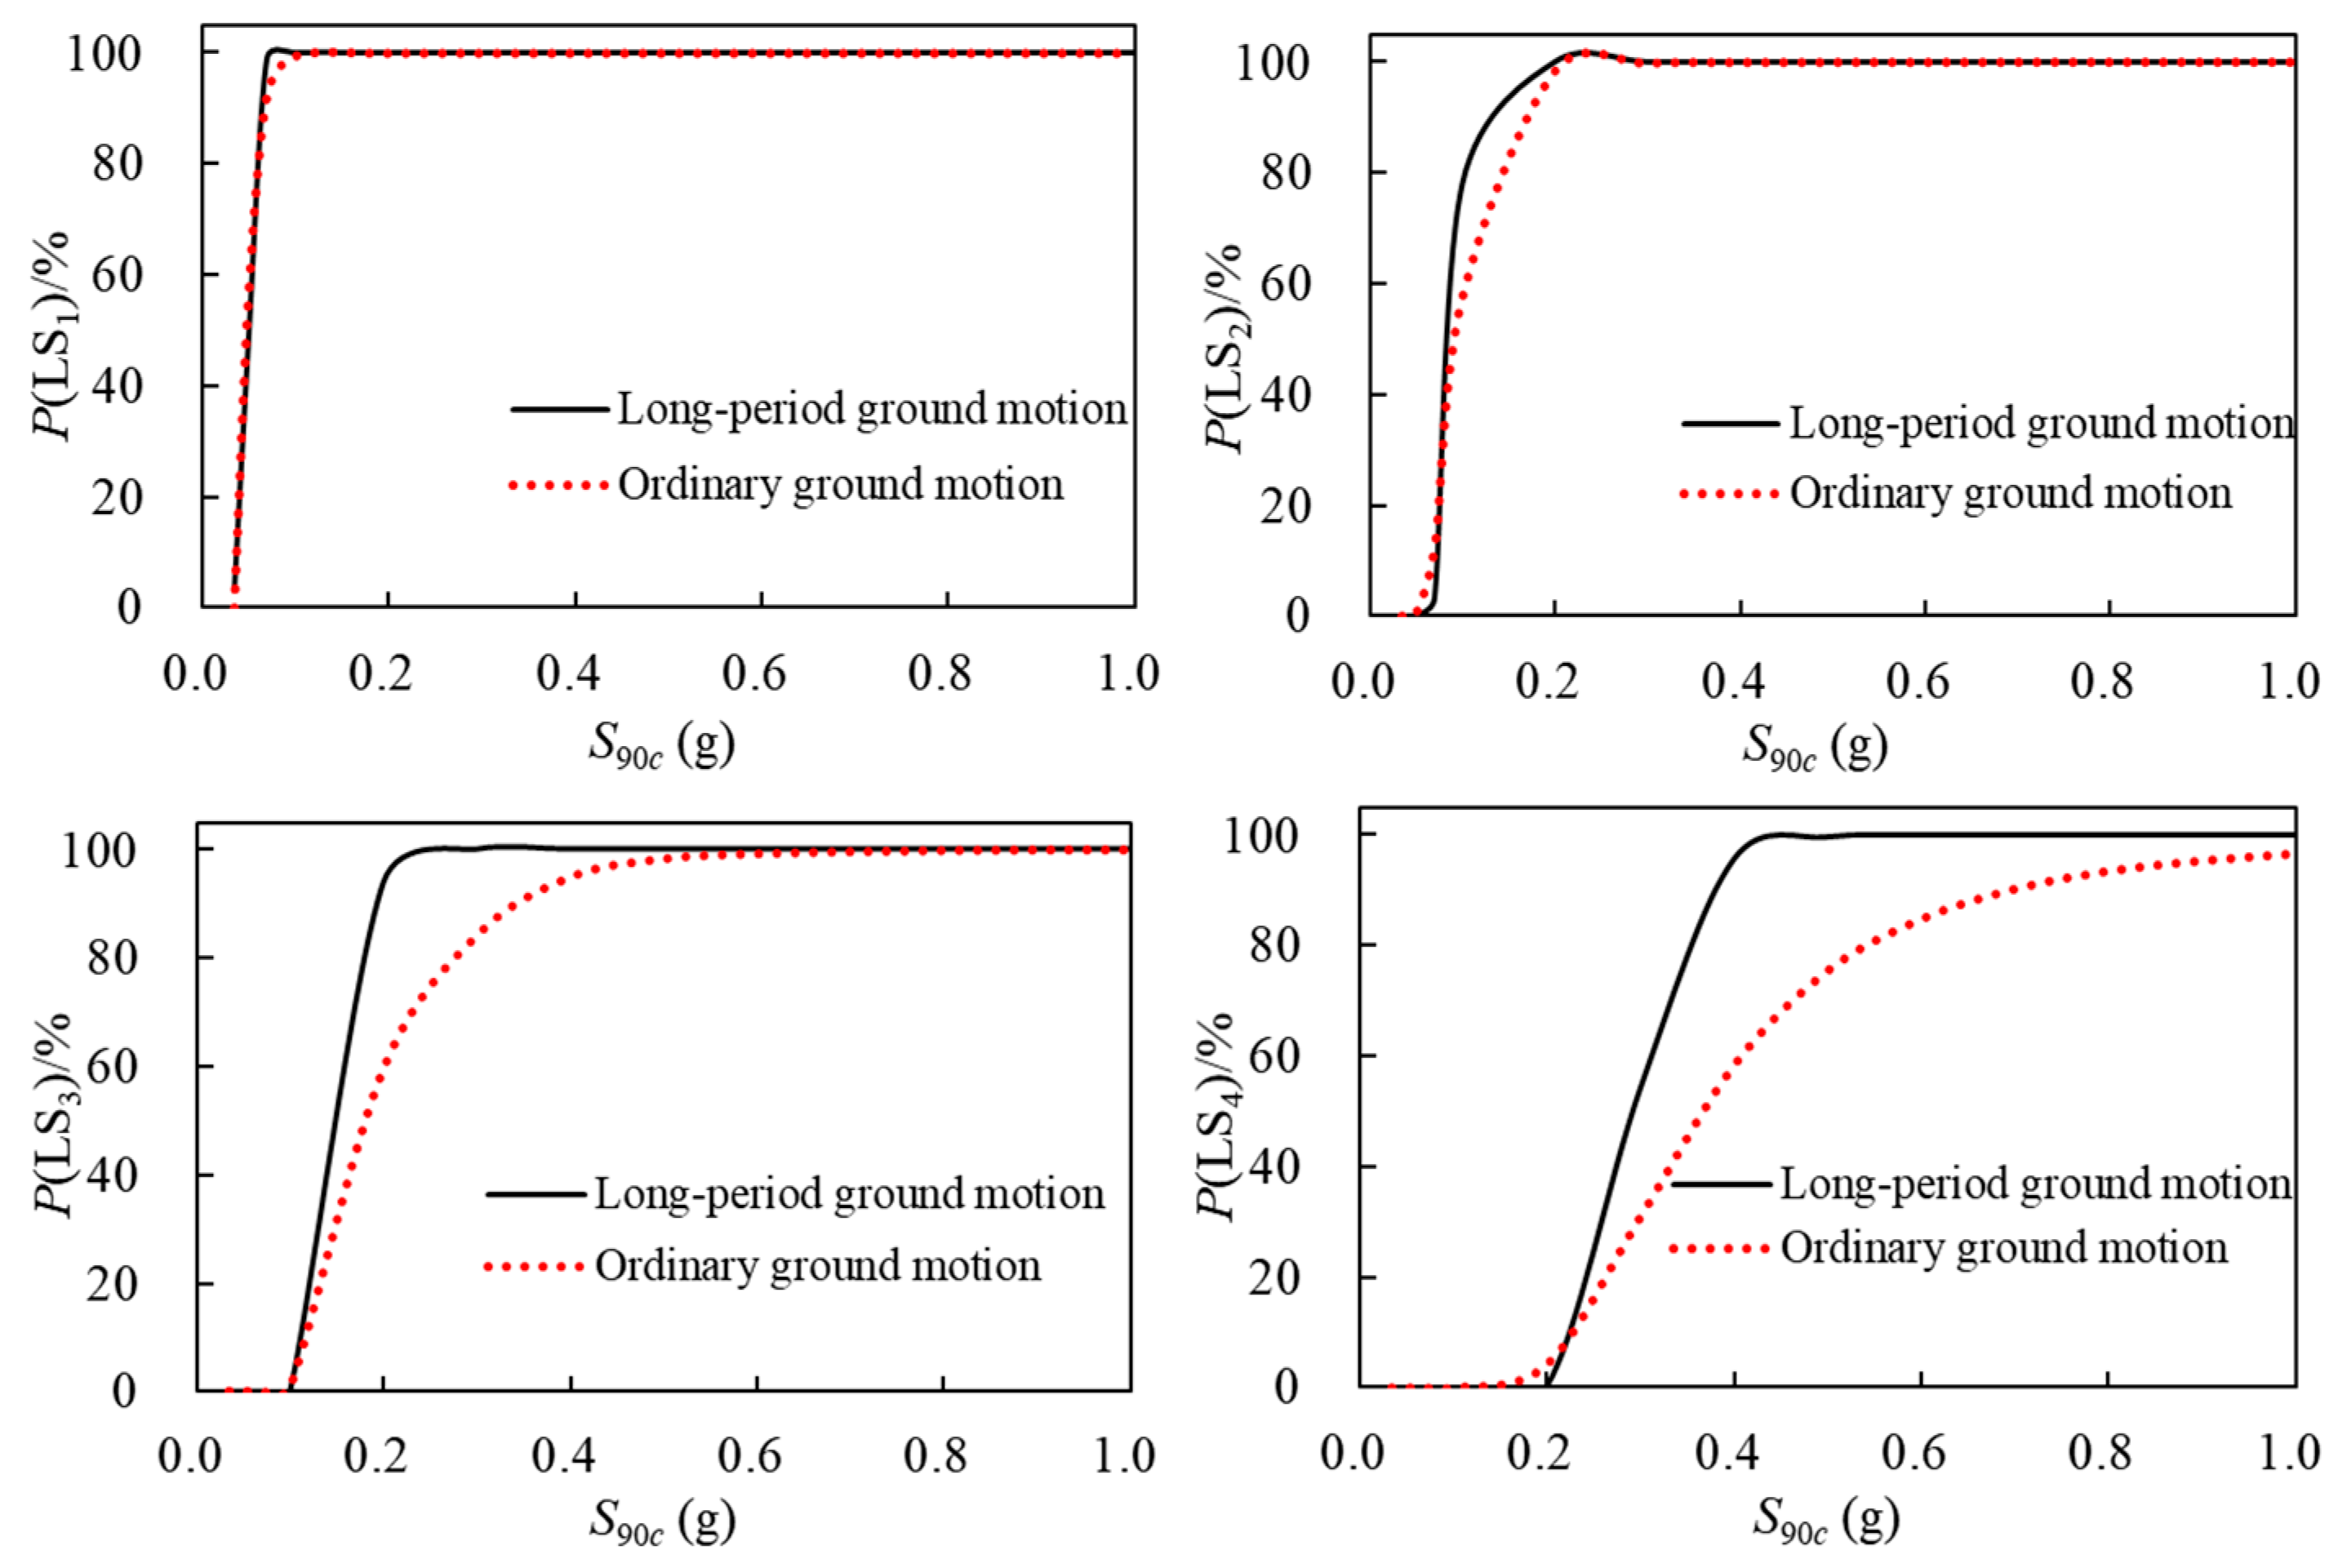
To further evaluate the differences in structural seismic damage under LPGMs and OGMs, the seismic vulnerability curves of each performance level of the structure under two types of ground motions were compared, as shown in
Figure 5. The vulnerability curves of the normal usability performance level LS
1 of the structure are basically coincident, indicating that the probability of exceeding the normal usability performance level under LPGMs and OGMs with the same intensity
S90c is similar, and the influence of ground motion type is relatively minimal. However, the differences in the vulnerability curves of the basic usability performance level LS
2 and the repairable usability performance level LS
3 of the structure gradually increase. The conditional probabilities of exceeding the above performance levels under LPGMs with the same intensity
S90c are generally larger than those under OGMs, especially for life safety performance level LS
4, indicating that it is much more difficult to control the structural damage at the life safety performance level under LPGMs than under OGMs.
The high-rise structure in this study was located in an area with a seismic fortification intensity of 8 degrees (0.2 g). Based on
Figure 4, the exceeding probabilities of the performance levels of the structure under LPGMs and OGMs at 8-degree seismic levels were calculated, thereby assessing the seismic damage of the structure. The
S90c of each group of ground motions under the 8-degree frequent earthquake, design earthquake, and rare earthquake was calculated using the “average value method” [
34], and then the average value of
S90c was used to calculate the exceeding probabilities of each performance level. The results are listed in
Table 6 and
Table 7. Specific analyses are as follows:
During an 8-degree frequent earthquake, under LPGMs, the structure reaches normal usability performance level LS1; the exceeding probability of the basic usability performance level LS2 is 94.08%, indicating it is very difficult to maintain a basic usability performance level. However, the exceeding probability of life safety performance level LS4 is very low, only 5.19%. Under OGMs, the probability of reaching normal usability performance level LS1 is significantly reduced to 51.42%, and the exceeding probabilities of basic usability LS2, repairable usability LS3, and life safety LS4 performance levels are nearly zero.
During an 8-degree design earthquake, under LPGMs, the structure definitely reaches the performance levels of normal usability LS1, basic usability LS2, and repairable usability LS3, and the probability of reaching life safety performance level LS4 is 97.25%. Under OGMs, the probabilities of reaching the performance levels of basic usability LS2 and repairable usability LS3 are greatly reduced to 69.68% and 23.56%, respectively; the possibility of continued use after repair is relatively large, and the probability of reaching the life safety performance level LS4 drops further to 4.88%.
During an 8-degree rare earthquake, under LPGMs, the structure definitely exceeds all performance levels. Under OGMs, although the structure is also basically determined to exceed the performance levels of normal usability LS1 and basic usability LS2, the probability of reaching the life safety state and subsequent collapse is less than that under LPGMs, only 33.45%.
4.3. Structural Damage Assessment Based on Vulnerability Index
Although seismic vulnerability curves can evaluate structural damage under ground motions of different intensities, the damage assessment results are expressed as conditional probabilities of exceeding various performance levels, which are not intuitive and difficult to be widely accepted by engineering personnel [
35]. Therefore, it is more appropriate to adopt a single quantitative value to assess structural damage performance. To address this issue, the “vulnerability index” is used to further assess the seismic damage of a high-rise structure under LPGMs.
The damage states of the high-rise structure are classified into five grades based on the four defined performance levels: basically intact, slight damage, moderate damage, severe damage, and near collapse. According to the vulnerability curves of each performance level, the differences in the exceeding probabilities between two adjacent performance levels are calculated sequentially to obtain the probabilities of the structure being in different damage states, denoted as
P(DS
i|
S90c), which can be expressed using the following formula:
where DS
i (
i = 1, 2, 3, 4, 5) represents the five damage states of basically intact, slight damage, moderate damage, severe damage, and near collapse, respectively.
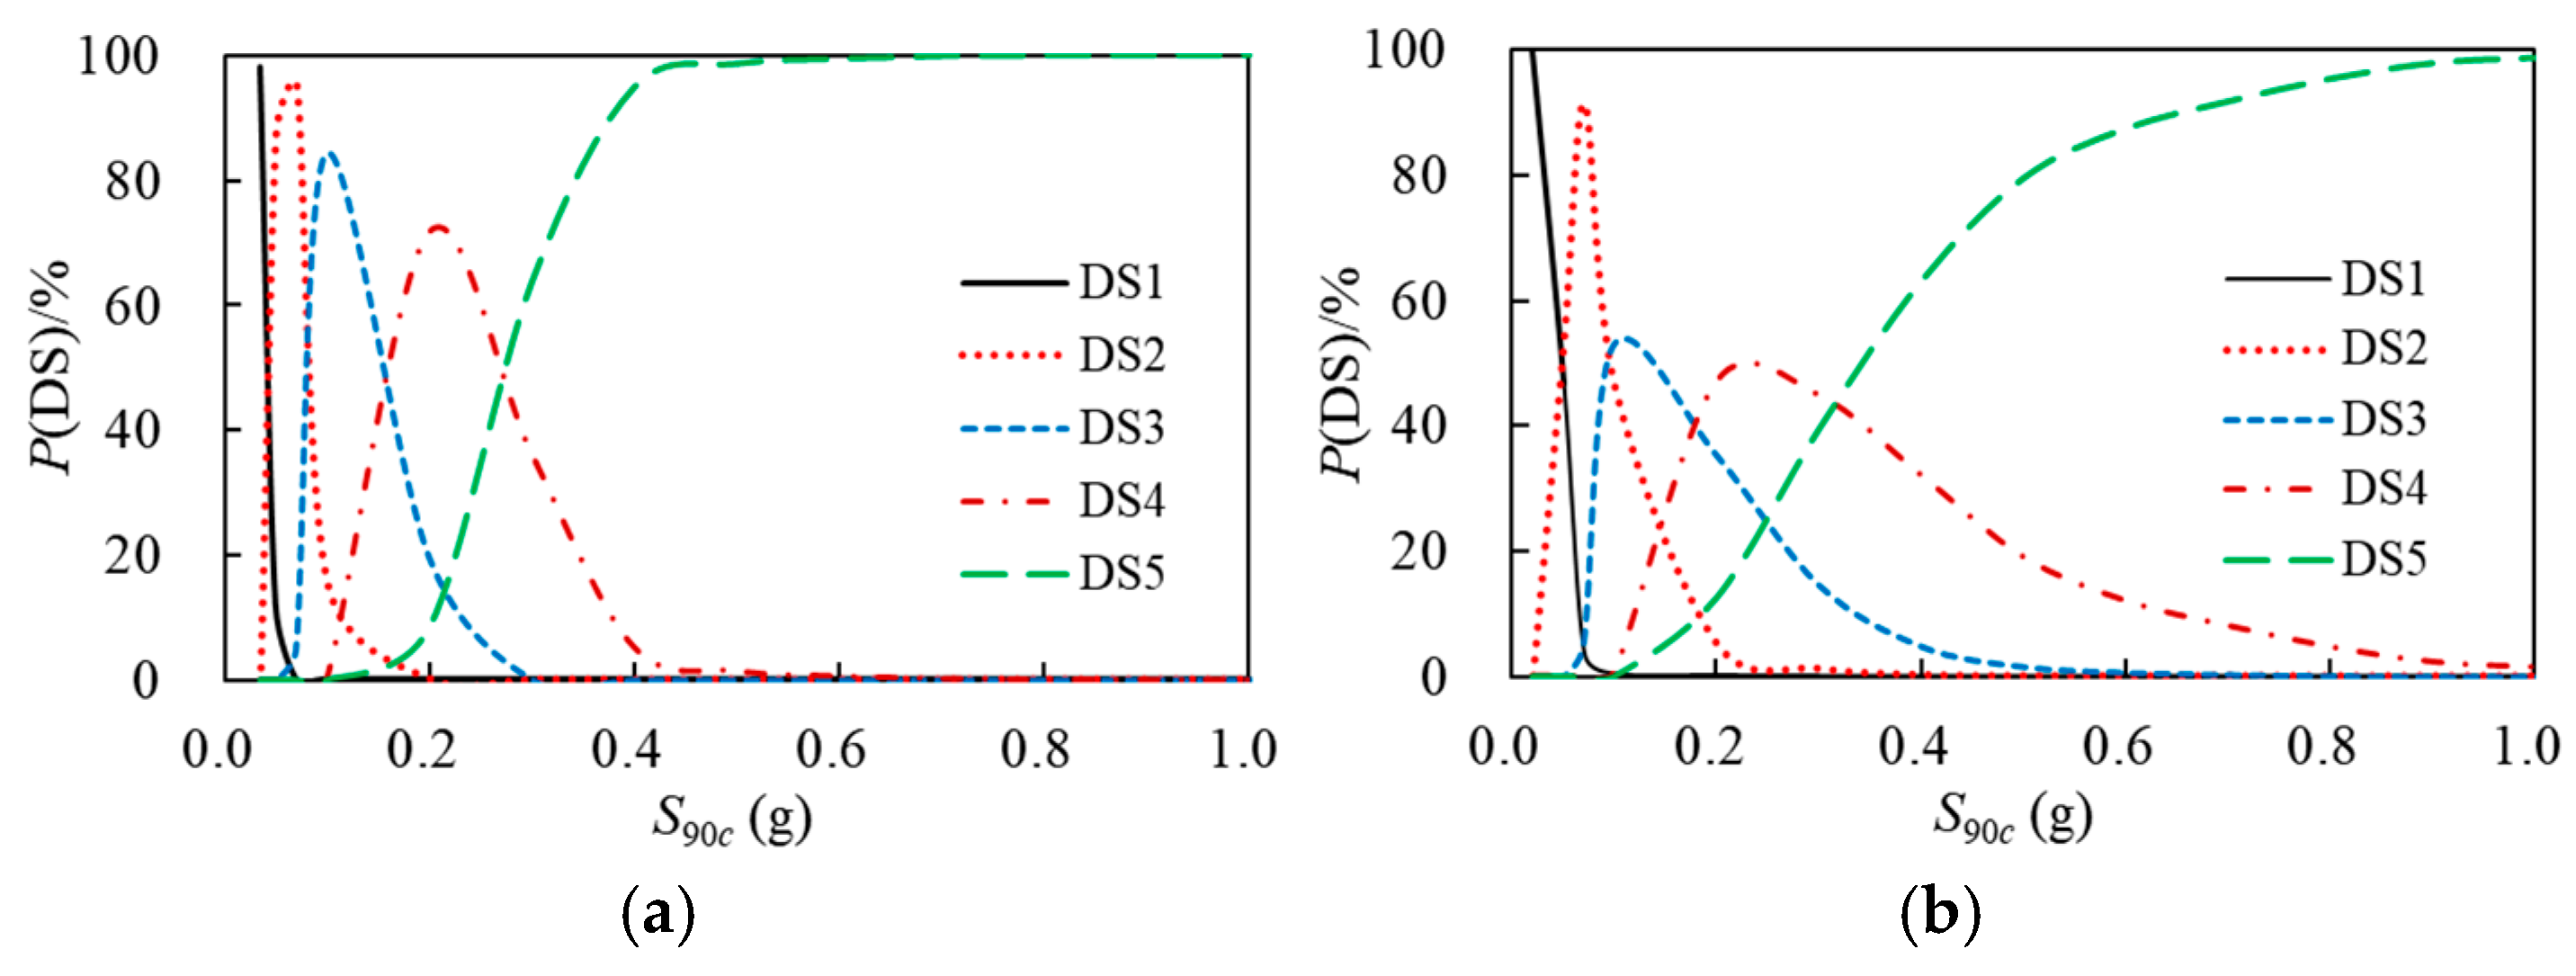
The probabilities of damage states of the high-rise structure under LPGMs and OGMs were calculated based on Equation (7), and the probability curves of the damage states of the structure were plotted taking
S90c as the horizontal axis and
P(DS
i|
S90c) as the vertical axis, as shown in
Figure 6. It can be observed that under two types of ground motions, as
S90c increases, the probability of remaining basically intact decreases rapidly, while the probability of being in a near-collapse state gradually increases. Meanwhile, the probabilities of being in slight damage, moderate damage, and severe damage states first increase and then decrease, reaching the peak exceeding probability at
S90c of 0.07 g, 0.1 g, and 0.2 g, respectively. In addition, the probability of different damage states varies across different seismic intensities.
The vulnerability index (VI), drawing on the concept of the average damage index in the seismic damage assessment of group structures and combining the probabilities of damage states of the structures, is defined as the mathematical expectation of DI, calculated by multiplying the probability of each damage state by the corresponding DI and then summing the results [
35]. The mathematical expression is as follows:
where DF
i (
i = 1, 2, 3, 4, 5) is the damage index corresponding to the five damage states of basically intact, slight damage, moderate damage, severe damage, and near collapse, respectively, as listed in
Table 8.
By substituting the probabilities of damage states of the high-rise structure under LPGMs and OGMs, along with the damage index limit values from
Table 8, into Equation (8), the lower-limit values, average values, and upper-limit values of the vulnerability index of the structure under the two types of ground motions were obtained. Taking
S90c as the horizontal axis and the vulnerability index as the vertical axis, the corresponding vulnerability index curves were plotted, as shown in
Figure 7. Furthermore, the vulnerability index curves were compared, as shown in
Figure 8. The vulnerability index curves provide the interval range of vulnerability index of the structure under ground motions of different intensities. For any given ground motion intensity, the corresponding vulnerability index can be calculated and compared with the damage index in
Table 8 to determine the damage state grade and seismic damage of the structure.
From
Figure 7 to
Figure 8, it can be observed that as
S90c increases, the vulnerability index of the structure increases rapidly, which ceases to increase at approximately 0.4 g and 0.5 g under LPGMs and OGMs, respectively. Within the range of ground motion intensity, the structure sequentially experiences basically intact, slight damage, moderate damage, severe damage, and ultimately overall instability, leading to collapse. The vulnerability index of the structure under LPGMs is generally greater than that under OGMs, indicating that LPGMs cause more severe damage to the structure. This is because, compared to OGMs, the pronounced low-frequency characteristics of LPGMs significantly amplify the internal forces, deformations, and energy responses of the high-rise structure [
26], leading to more severe damage and failure.
To more comprehensively assess the structural damage and whether the expected seismic fortification target can be achieved, the vulnerability index of the structure under two types of ground motions during an 8-degree frequent earthquake, design earthquake, and rare earthquake was calculated. The results are detailed in
Table 9.
Based on the damage index in
Table 8 and the vulnerability index in
Table 9, the following judgements can be made:
When subjected to an 8-degree frequent earthquake, the structure is in a moderate damage or severe damage state under LPGMs, while the structure is basically intact or the damage is controlled at a slight damage level under OGMs, with the basic functions unaffected and normal operation resumable after minor repairs.
When subjected to an 8-degree design earthquake, the structure enters the severe damage or near-collapse state under LPGMs, endangering human life, while the structural damage under OGMs is controlled at a moderate damage level, and the structure remains stable, which can still be used after appropriate repairs or reinforcement.
When subjected to an 8-degree rare earthquake, the structure is in the near-collapse state under LPGMs, while the structure suffers severe damage and is in a relatively dangerous state but will not collapse under OGMs.
The above analysis results indicate that under OGMs, the SRC frame-RC core tube high-rise structure can meet the seismic fortification target of “no damage in minor earthquake, repairable damage in moderate earthquake, and no collapse in major earthquake”. However, the structural seismic damage under major earthquakes is very severe, and the structure can only continue to be used after extensive risk elimination and major repairs. Under LPGMs, the damage degree of the structure is significantly aggravated. The structure suffers moderate or even severe damage under frequent earthquakes and is in the near-collapse state under the design earthquake and rare earthquake, failing to meet the seismic design objectives required by the codes. This also indicates that the current Chinese design codes cannot fully consider the impact of LPGMs on the seismic performance of SRC frame-RC core tube high-rise structures and still need to be further improved.
Research shows that significant differences in seismic damage assessment results of structures can arise from the selection of different calculation methods for the probabilities of damage states and damage index [
36]. Therefore, to reliably evaluate the seismic damage of high-rise structures, it is necessary to adopt appropriate methods that account for the uncertainties of the calculation methods for the probability of damage states and the damage index.
