Article

Investigation of Screw Layout and Hole Geometry on Cold-Formed Steel Bending Performance Using Finite Element Model and Statistical Methods

1
Department of Civil Engineering, Faculty of Engineering, Sakarya University, 54200 Sakarya, Turkey
2
Maali Çelik Ar-Ge Danışmanlık, Müh. Ins. Taah. Tarım ve Hayvancılık Company, Atateknokent, 25010 Erzurum, Turkey
3
Department of Civil Engineering, Erzurum Technical University, 25010 Erzurum, Turkey
4
Department of Electrical-Electronics Engineering, Faculty of Engineering, Sakarya University, 54200 Sakarya, Turkey
5
Erkay Technology Development Services Co., Ltd., Sakarya University, Technopark Campus, 54200 Sakarya, Turkey
*
Author to whom correspondence should be addressed.
Buildings 2025, 15(17), 3101; https://doi.org/10.3390/buildings15173101
Submission received: 11 June 2025 / Revised: 7 July 2025 / Accepted: 25 July 2025 / Published: 29 August 2025
(This article belongs to the Special Issue Cold-Formed Steel Structures)

Abstract

The affordability, ease of manufacturing, and assembly efficiency of cold-formed steel profiles have contributed to their widespread use in structural applications. However, the presence of holes in these profile webs is likely to reduce their mechanical resistance. This study explores the bending behavior of a built-up box section constructed using lipped and unlipped C-profiles, which are commonly utilized in the construction industry. The investigation focuses on the influence of self-drilling screw layout density and hole distribution within the section. A total of 30 different models were analyzed, considering three primary variables: the spacing of self-drilling screws, hole diameter, and the number of holes. The steel profiles were connected using self-drilling screws with spacing intervals of 100, 200, and 400 mm. Key parameters, such as moment capacity, effects on elastic zones, shear forces on screws, and ductility, were examined in relation to these variables. The findings indicate that reducing screw spacing and increasing the number of holes are crucial design factors for improving joint strength. However, while greater screw spacing enhances ductility, it leads to lower plastic deformation rates. Additionally, optimizing the number of holes in the section proved to be an effective strategy for improving ductility in the analyzed models. Mathematical evaluation confirmed that hole number and screw spacing significantly affect moment capacity and estimation stability, highlighting the need for their joint optimization in structural design.

1. Introduction

Cold-formed elements stand out due to their advantages, such as low production costs, easy and quick assembly, and high load-bearing capacities relative to their thickness. These features make them a preferred choice in the construction sector, providing both economic and practical solutions. Various types of cold-formed elements with different cross-sections are used in building construction. Depending on the purpose of the structure and its usage requirements, a built-up section can be created by bringing together two or more profiles with the same or different cross-sections [1,2]. This method is preferred for enhancing the performance and durability of structures. To ensure the effective cooperation of the profiles used in the built-up section, different joining elements are employed to hold these cross-sections together. One of these joining tools, smart screws, is widely used due to their rapid fastening and ease of assembly.
The strengths of smart screws and connection regions have been evaluated in research studies. Some studies have also examined the mechanical behavior of built-up section cold-formed steel (CFS) structural elements created with smart screws. Cold-formed steel plates joined with smart screws were subjected to axial tension for shear stress [1]. Their experimental studies using G300 steel considered the distance of the screw hole from the plate edge, screw spacing, screw layout arrangement, and the number of screws as variables, investigating the effects of these parameters on the shear strength of bolted connections [2]. The study systematically analyzed the impact of different connection configurations on shear strength. Shear tests on bolted connections with a single shear surface using different steel sheet thicknesses were conducted, and the effects of variations in the distance of the screw hole from the connection edges on shear behavior were examined [3]. Additionally, they conducted their studies at different constant temperatures to investigate the effects of temperature on the shear behavior of bolted connections. Shear experiments were conducted using a single connection screw to thoroughly examine the development of deformation conditions in the screw and the connected plates, with the experimental results compared with the limit states specified in the AISI-S100-12 standards [4]. A finite element (FE) model of bolted connection elements was developed using ABAQUS software 2017 to better understand complex bolted connections, examining the shear strength, stiffness, and ductility of the connection elements [5,6]. They investigated the effects of temperature variation on the shear tests of bolted connections in cold-formed steel [7]. They applied temperature changes as a function of time with increasing temperature variations, and compared their results with the design conditions outlined in AISI S240-15 [8].
An experimental study was conducted on the structural performance of cold-formed steel (CFS) elements with smart screw moment connections, investigating the lateral buckling of built-up section compression members, moment capacity, and bending failure conditions [9]. Bending tests were performed on cold-formed, unreinforced C-beams with holes in their web to examine the bending performance of these elements, proposing strength equations for connection elements with a single shear surface [4]. The bending behavior of CFS-C beams with web holes was experimentally investigated, determining that the AISI standards provided non-conservative estimates for this type of C-beam [10]. In addition to these studies, the moment capacities of CFS-C beams with web holes were compared, demonstrating that beams with web holes offered higher moment capacities compared to flat C-beams [11]. Expanding on this work, ref. [12] analyzed the bending and shear interaction of cold-formed stainless steel lipped C-beams using the finite element method, proposing design equations for this interaction. Three-point bending tests were conducted on circular web-holed cold-formed stainless-steel C-profiles, examining the web buckling strength of these elements and presenting design equations for both holed and non-holed profiles [13]. These studies provide various design suggestions aimed at improving the bending and shear strength of cold-formed steel elements, while comparatively evaluating the effects of factors such as web holes and edge reinforcements on their mechanical performance. The shear capacity of cold-formed C-section steel with web holes was investigated, observing that as the shear-to-opening ratio increased, the rigidity of the C-profile decreased [14]. The structural behavior of cold-formed C-beams under axial loading and bending effects was examined experimentally and analytically [15].
Based on the literature review, it is understood that the cross-section shapes actively used in light steel structures are lipped and unlipped C-sections. This study has been conducted on box sections formed by joining two cross-sections with smart screws. The aim of this study is to investigate the bending behavior of built-up box sections created by joining lipped and unlipped C-profiles, which are commonly used in the construction sector (industrial buildings, warehouses, lightweight steel residential structures, and roof systems), using smart screws (Table 1). The primary objective is to examine the effects of parameters, such as the number of smart screws, their arrangement in the specimens, and the number and diameter of web holes, on the bending strength and structural performance of the built-up box sections. For this purpose, 30 different variable models have been created. In the study, nonlinear analyses were performed using the finite element method (FEM). In this context, the result data from the prepared models were compared and evaluated.
The main contribution of this study to the literature is the comprehensive investigation of the bending behavior of built-up box sections formed by combining lipped and unlipped C-profiles with smart screws, a topic that has not been extensively addressed in previous research. While existing studies have primarily focused on individual cold-formed steel sections or standard connection methods [9,10,11,12,13], this study systematically examines the effects of critical parameters, including the number and arrangement of smart screws, as well as the number and diameter of web holes, on the flexural performance of cold-formed steel sections. By analyzing 30 different configurations through nonlinear finite element analyses, the study provides new insights into optimizing screw placement and web perforations to enhance structural performance. Furthermore, the integration of practical profiles commonly used in industrial buildings and lightweight steel structures highlights the practical relevance of the findings and contributes to the development of more efficient design strategies in light steel construction.

2. Experimental Studies in the Literature

In this study, the material modeling and finite element type of the built-up box section to be used have been accurately represented based on existing studies in the literature. The creation of the finite element model for the experimental study in the literature is made possible by accurately defining the material properties, element type, boundary conditions, and structural behavior. In this context, the assumptions made in the finite element analysis were selected based on approaches proposed in previous studies in the literature. The validated study utilized a four-point bending test on 16 cold-formed steel beams [11]. During the experiment, rigid plates were placed in the loading areas and support points to prevent out-of-plane behavior and facilitate load transfer. The setup of the experimental study is illustrated in Figure 1.

3. Finite Element Study

For successful finite element modeling, it is essential to select the mechanical properties of the material, fracture hypotheses, system geometry, boundary conditions, mesh density, the type of finite element to be used, and the solution methods in a way that yields the most accurate results.

3.1. Material Properties

Tensile tests were conducted to obtain the material properties of the test specimens [11]. To account for the effects of cold forming, specimens were taken from both the flat web portion and the corner sections. The material properties were tested in accordance with British Standard and material regimes, as shown in Table 1 [16].
In the parametric study, the built-up box section was assembled using the G500 smart screw as the connector. The mechanical properties of the G500 smart screw were adopted from the study [6], and the values used in the finite element analysis are provided in Table 1.

3.2. Model Verification

The S4R shell element type was selected in the finite element model. To investigate the bending behavior of the steel beam under vertical loading types, finite element meshes of different sizes were utilized to observe the impact of mesh density on performance. Three different mesh densities were analyzed: 10 × 10 mm, 20 × 20 mm, and 30 × 30 mm. The intervals were determined based on previous studies in the literature. The geometry of the finite element mesh can be triangular or quadrilateral, based on the dimensions of the divided elements. The density of the finite element mesh directly affects both solution accuracy and computation time. Higher mesh density in finite element solutions implies more elements and more nodes, consequently increasing solution time and computational costs. Therefore, while high mesh density is expected to be used in critical areas, lower mesh density is recommended in less critical regions. When creating models, the mesh density was selected at different rates based on stress concentration distributions in the beam cross-section. Small mesh elements were used in areas with high stress concentrations, while larger mesh elements were employed in regions with lower concentrations. In the validation study, high mesh density was preferred around the smart bolt joint holes and the body holes. In the model, the mesh was created with sizes of 5 × 5 mm around the holes, 25 × 25 mm for the C profiles, 1 × 1 mm for the smart bolts, and 20 × 20 mm for the rigid parts. A displacement-controlled load of 30 mm was applied to the C profiles along the y-axis. Displacement-controlled loading is particularly used to investigate the material’s deformation behavior after fracture, allowing for clearer observation of the material’s elastic limit, yield stress, and stages of plastic deformation. The analyses indicated that the beams exhibited a high moment-carrying capacity within a displacement range of 14–16 mm. Therefore, a displacement control of 30 mm was deemed sufficient for analysis. In the validated model, the distance between two fixed supports was defined as 3200 mm, and the distance between loading points was set at 1200 mm. The loading visual defined in the program is shown in Figure 2.
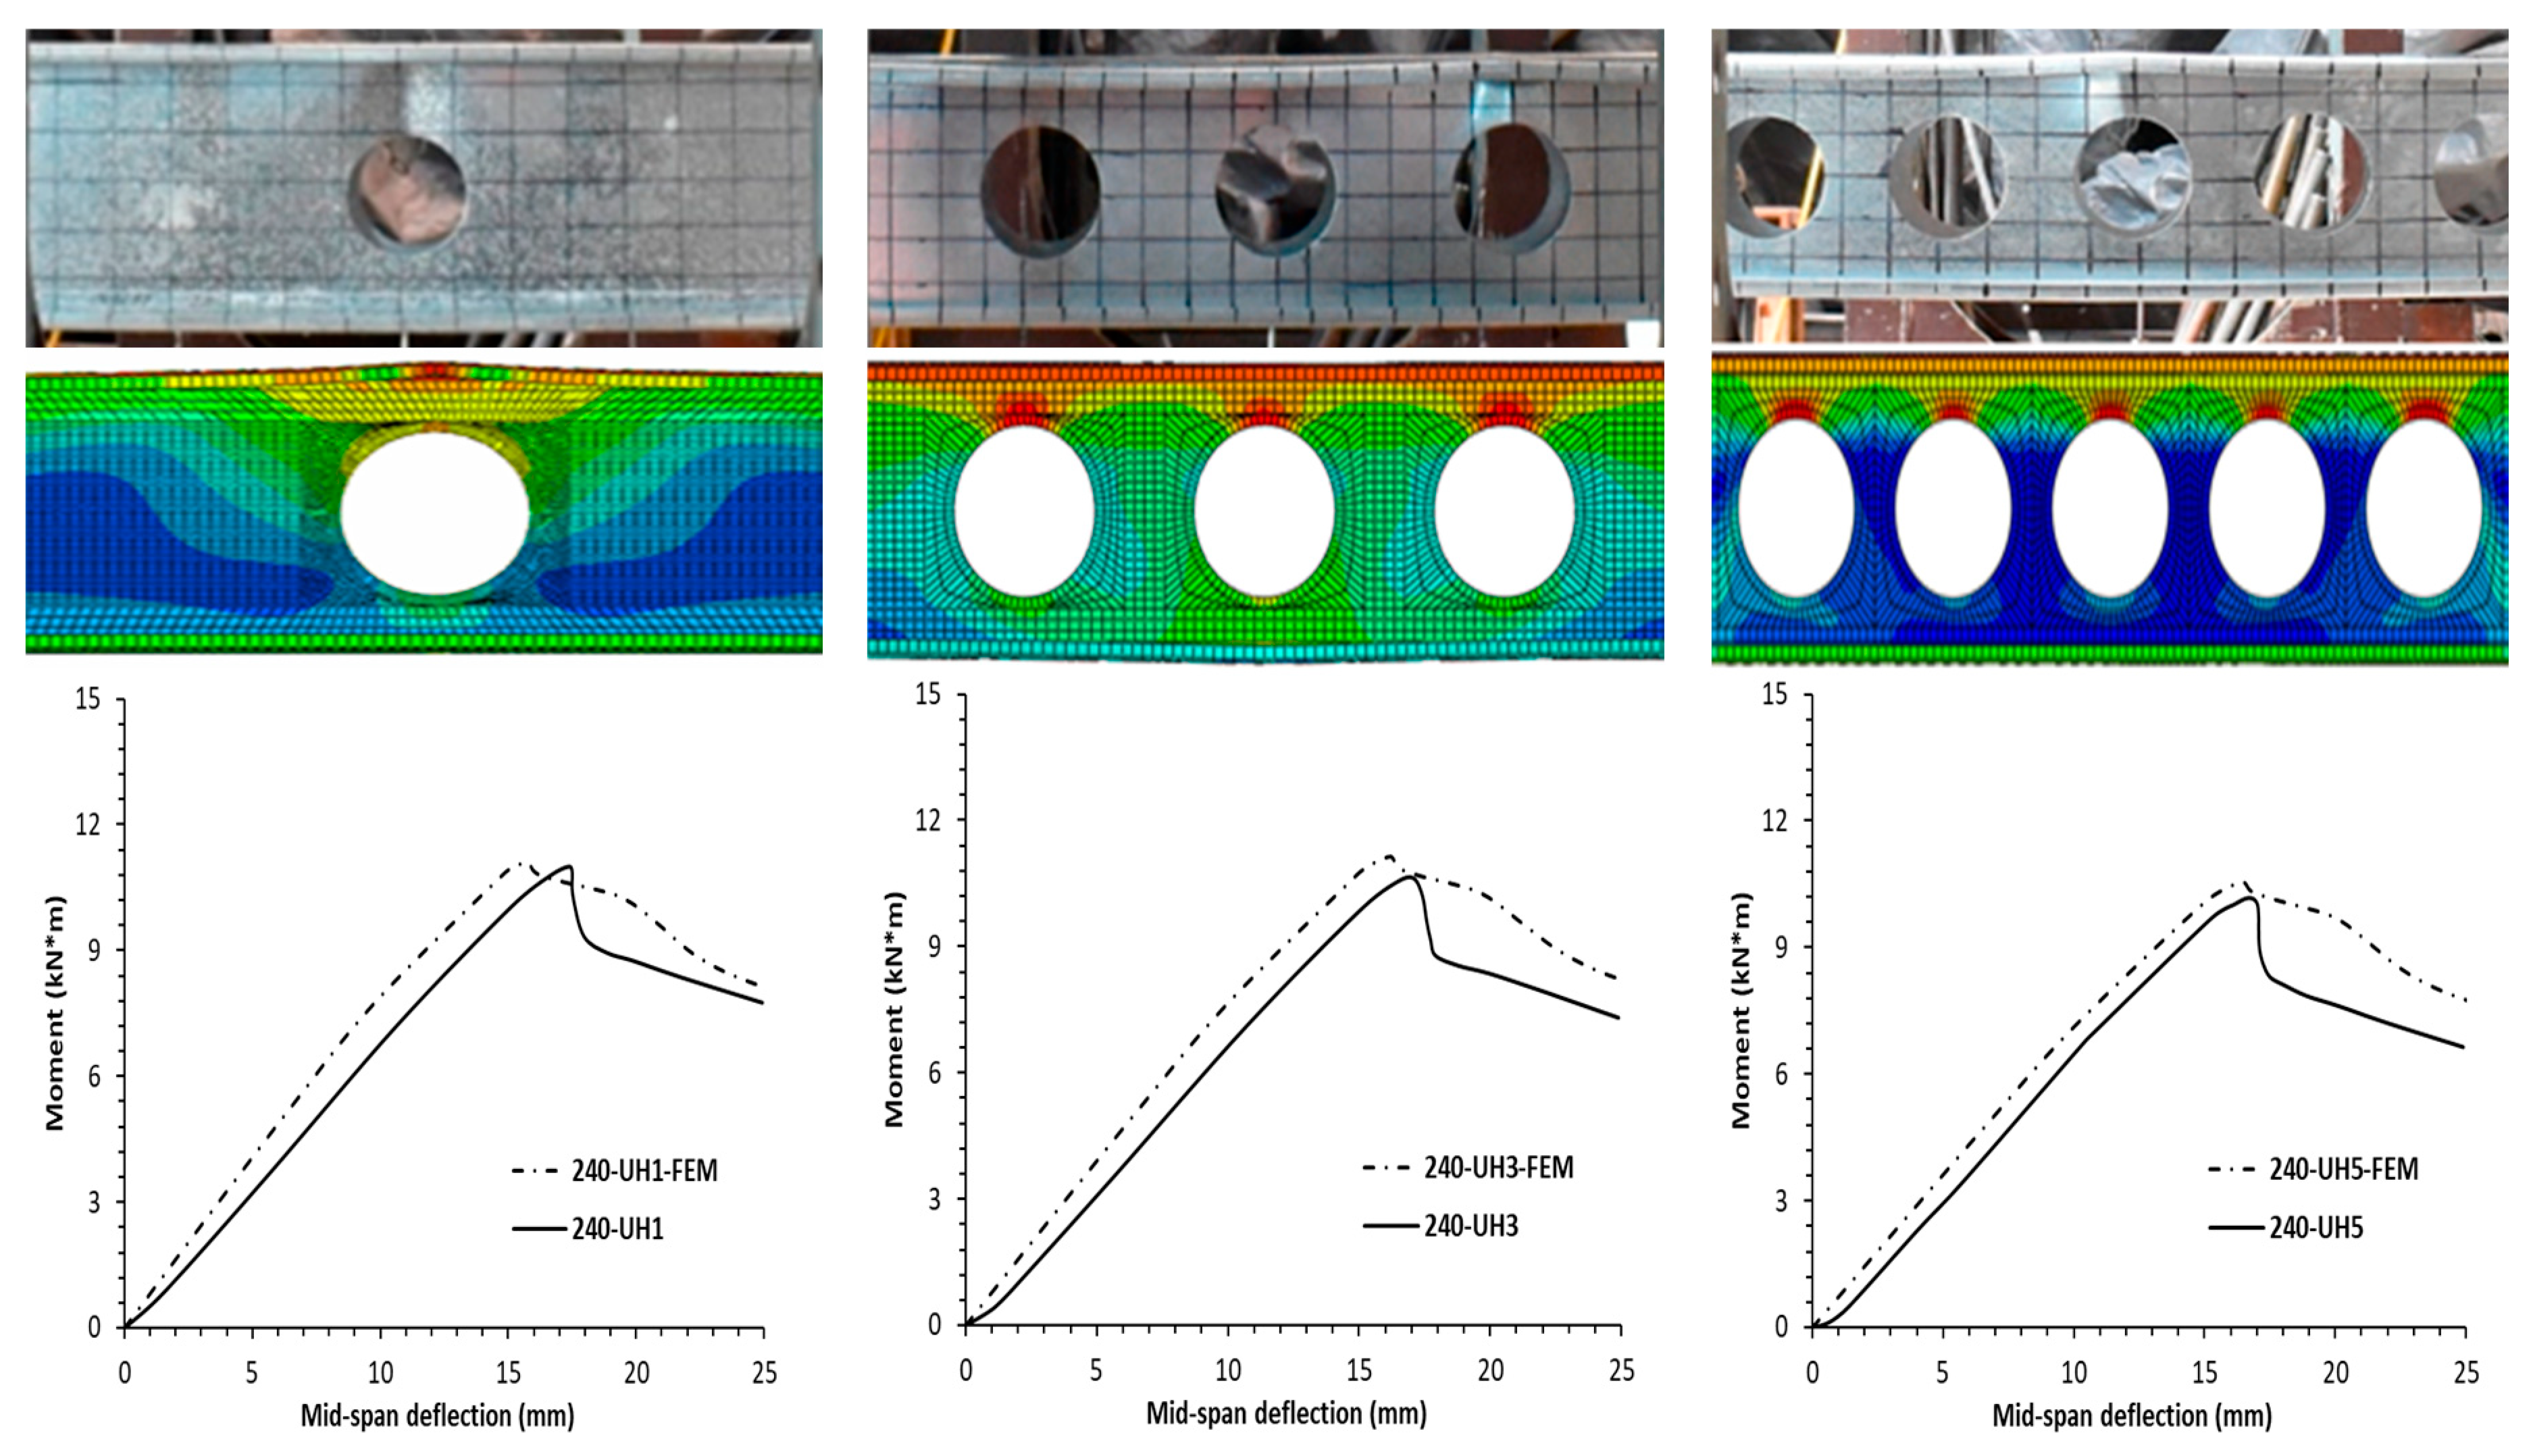
The FEM models of the specimens named 240-UH1, 240-UH3, and 240-UH5, derived from experimental studies in the literature, were created and validated. Based on the P measurements reported in the reference study, the moment values were mathematically derived using fundamental principles of structural mechanics. Specifically, the applied load (P) was used to calculate the bending moment through the relationship M = P × L, where L represents the effective lever arm from the test configuration. Comparative visuals of the deformed specimen from the experiment and the model obtained using the finite element method, along with the moment–displacement curves, are presented in Figure 3. As a result of the three validated modeling studies conducted in this work, a convergence rate exceeding 90% was observed in the moment–displacement curves of both experiments and models. By accurately modeling the existing experimental setup using the finite element method, values were obtained that closely approximate the actual experimental results. The solution results obtained for the profile sections modeled with finite elements were compared with the existing experimental results, demonstrating the accuracy and validity of the finite element model. It should be noted that the differences observed in the post-yield region stem from the simplified material model and boundary conditions used in the FE analysis. While the FE model captures the elastic behavior accurately, the plastic deformation range is more complex due to factors such as local buckling, residual stresses, and geometric imperfections that are not fully replicated in the model. This results in deviation in the softening region after peak load.

3.3. Initial Geometric Imperfections

Cold-formed steel profiles are structural elements that are susceptible to local and global buckling, necessitating the need for nonlinear geometric analyses. In these analyses, it is essential to incorporate initial geometric imperfections into finite element models, reflecting the reality that actual structural elements are not perfect. These imperfections can be defined as deviations resulting from manufacturing errors or residual stresses [17,18,19,20]. The effects of imperfections on the behavior of cold-formed steel elements were investigated to determine how geometric imperfections influence buckling resistance [21,22,23,24,25]. Additionally, it was noted that the post-buckling behavior of thin-walled steel elements is complex and unpredictable, emphasizing that integrating imperfections into computational models through precise experiments can improve the accuracy of these models [26]. In finite element software like ABAQUS 2017, including these imperfections in the model is crucial for accurately predicting the stability, load-bearing capacity, and performance of structures under experimental conditions [27]. Initial imperfections have a significant impact on the loading limits of structures and can substantially alter the capacity of structural elements under applied force cases. Thus, considering these imperfections in finite element analyses is vital for enhancing the accuracy of the analysis and ensuring the reliability of designs. Various methods for modeling geometric imperfections are available in the literature. The scaling method for buckling modes was employed in this study (Figure 4). In this approach, the structural element is modeled perfectly, and a linear buckling analysis is conducted to obtain the desired number of buckling modes [28]. The smallest of these buckling modes is then scaled by a factor and accepted as the geometry of the perfect system, which is subsequently incorporated into the numerical model. The analysis is then performed on this modified geometry to obtain the final results. The element is solved in this derived geometry to reach the final result. The moment–displacement curve obtained from the experimental studies conducted was successfully validated with a geometric imperfection of 10% defined in the finite element model [11].

4. Parametric Study

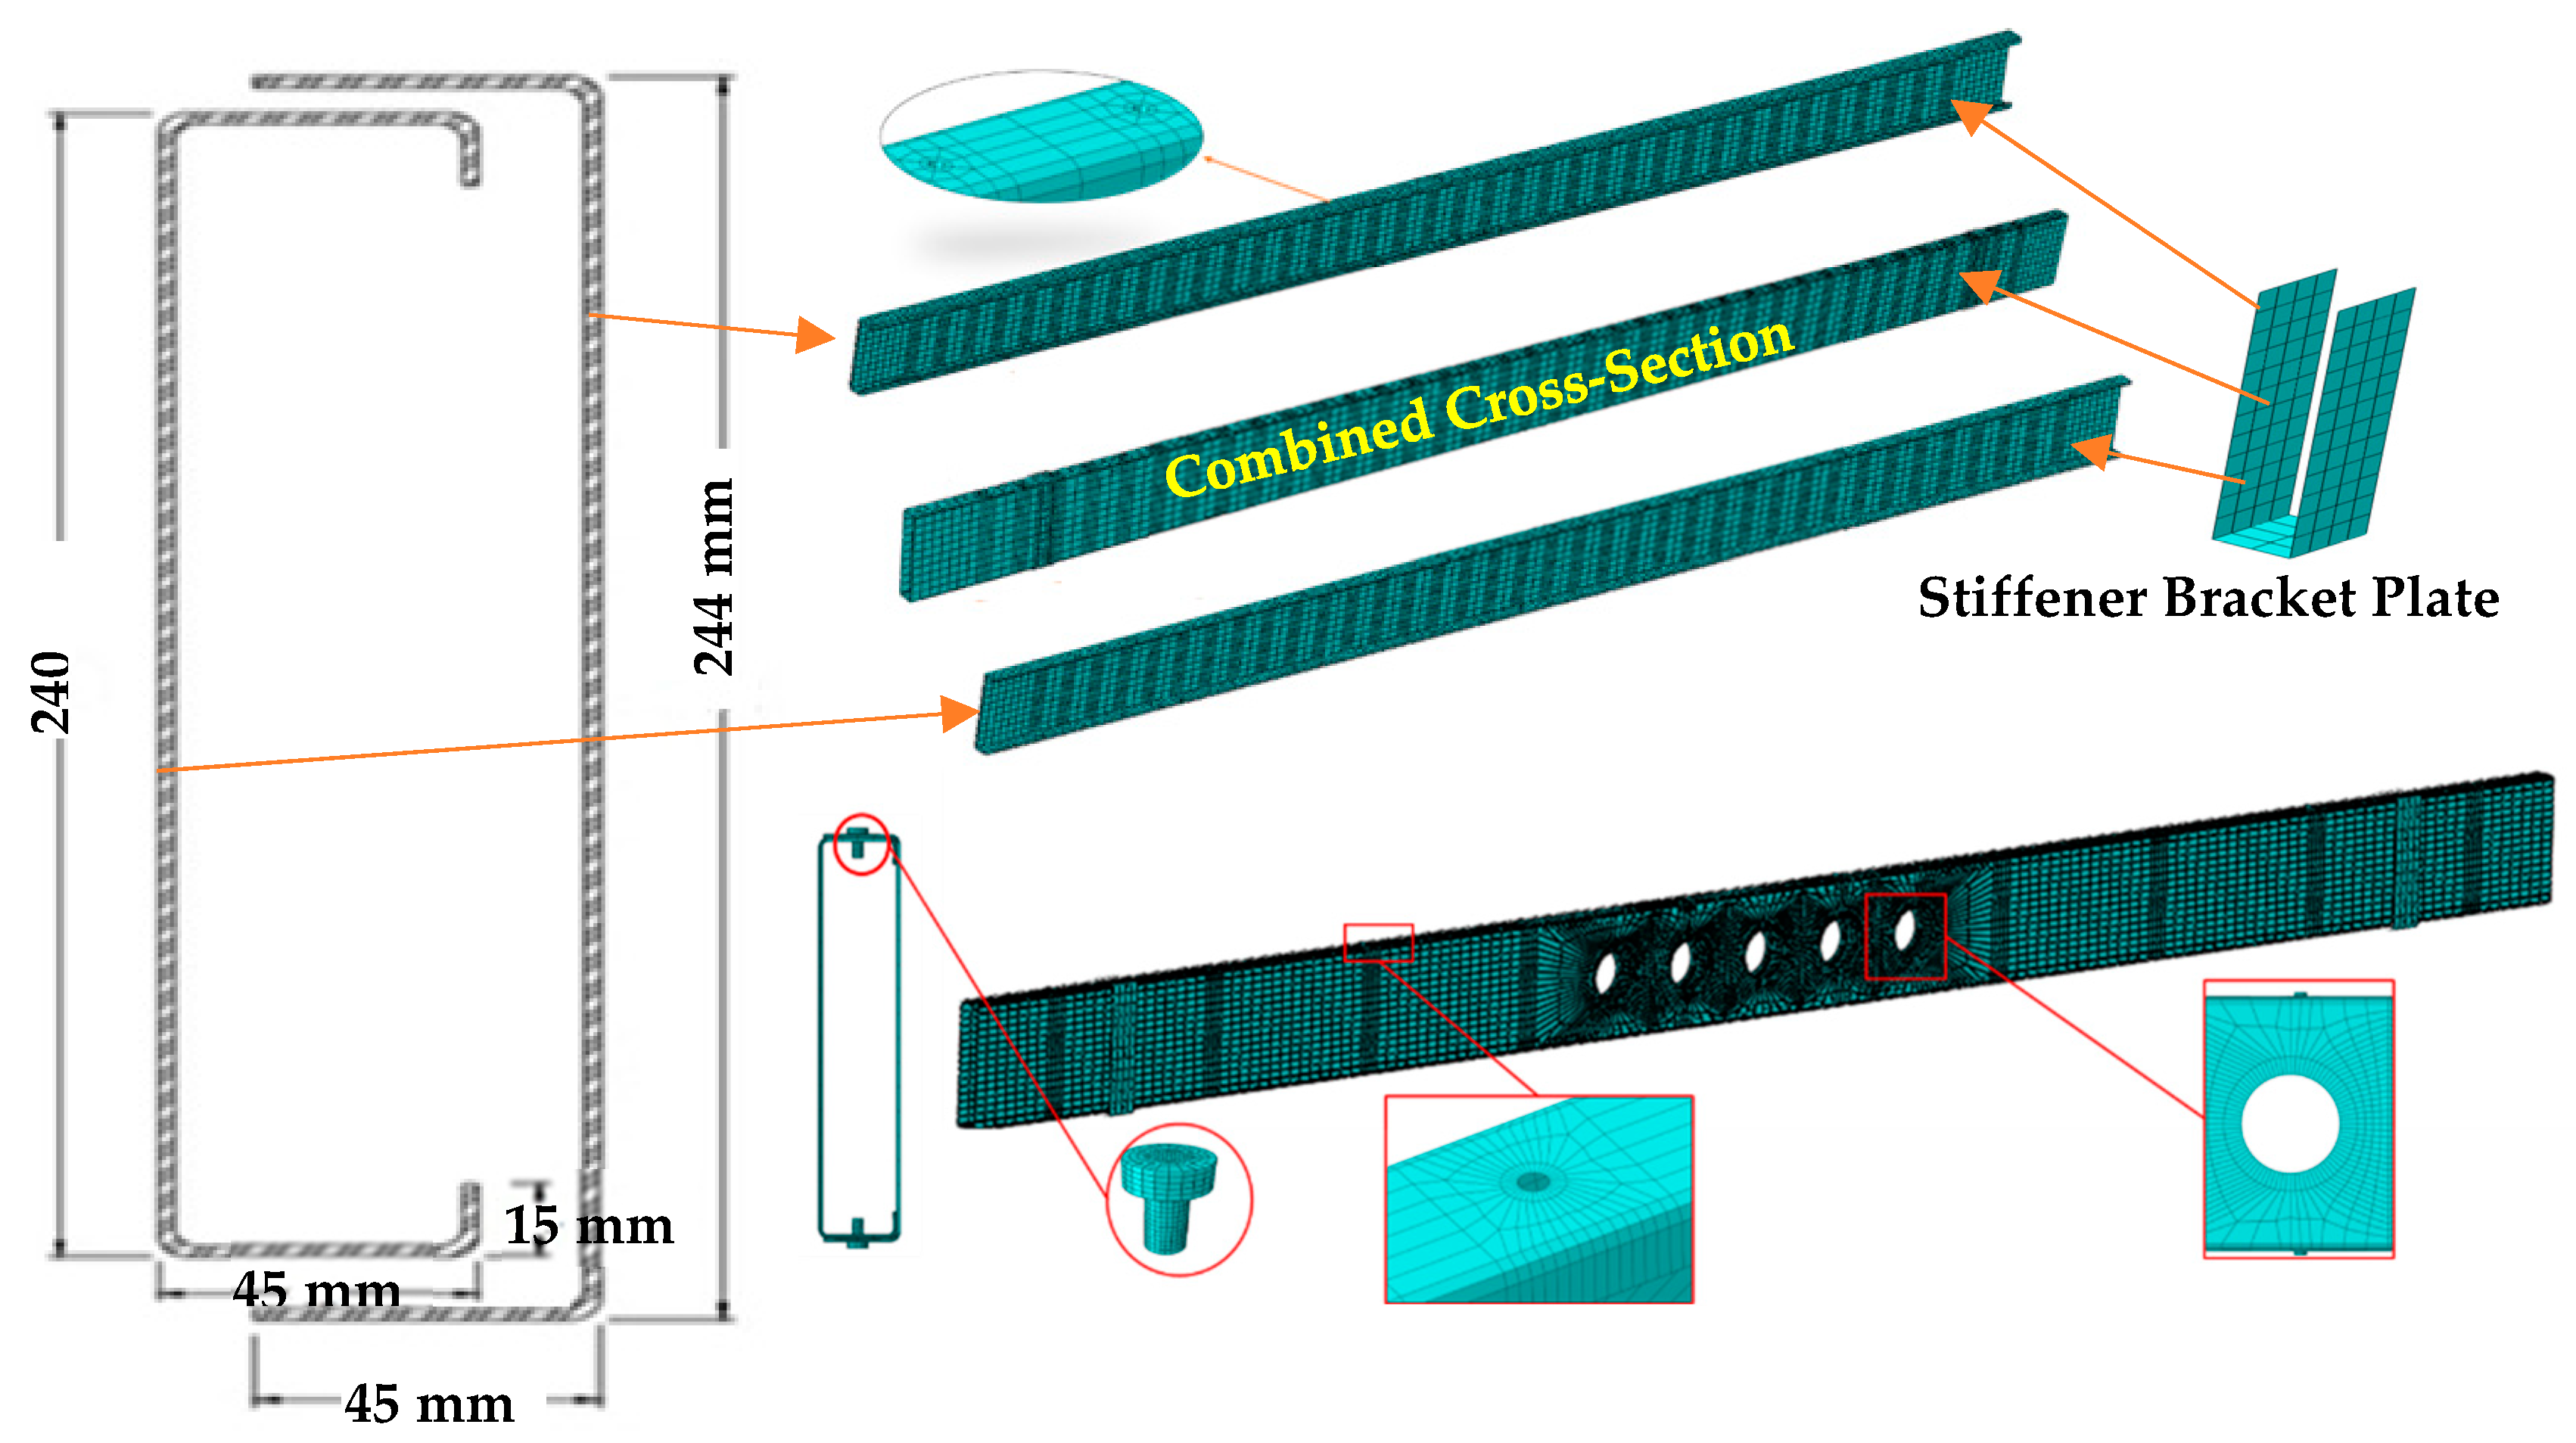
In this study, a finite element (FE) model was developed to validate the four-point bending test results [11,29]. Based on the assumptions of material models and boundary conditions, a built-up box section was created using lip and non-lip C profiles to corroborate the experimental results. Smart screws were employed as the joining mechanism during the formation of the built-up box section [27]. The ABAQUS 2017 software was utilized for finite element modeling and analysis, and a parametric study was conducted (Figure 5). In creating the built-up box sections for the parametric study, smart screws were preferred because the thickness of the steel element was less than 4 mm. This choice minimizes the risk of cutting or weakening the material and ensures secure connections.
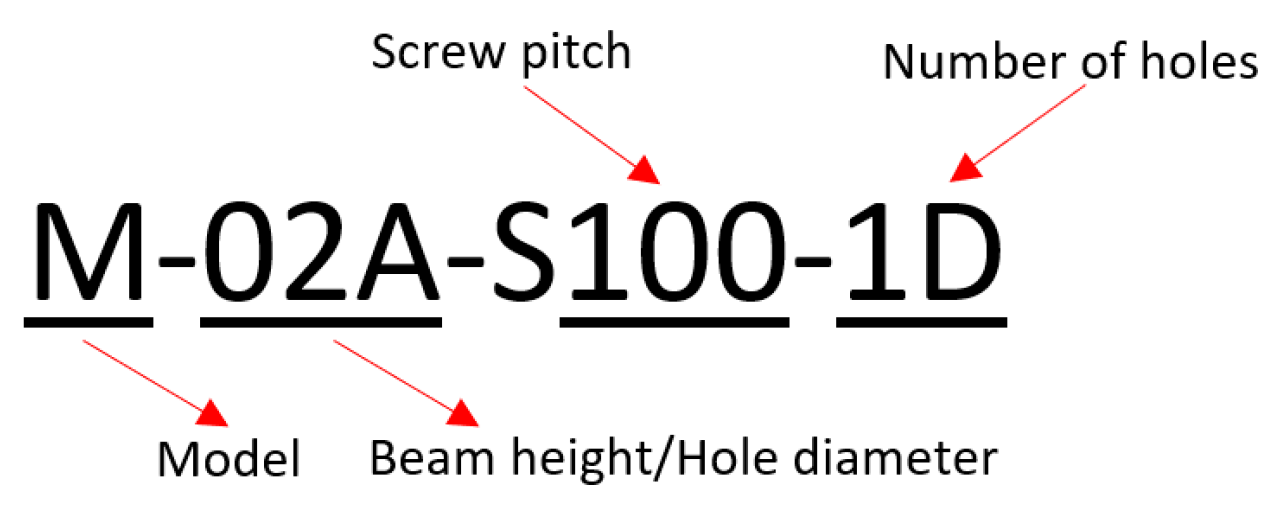
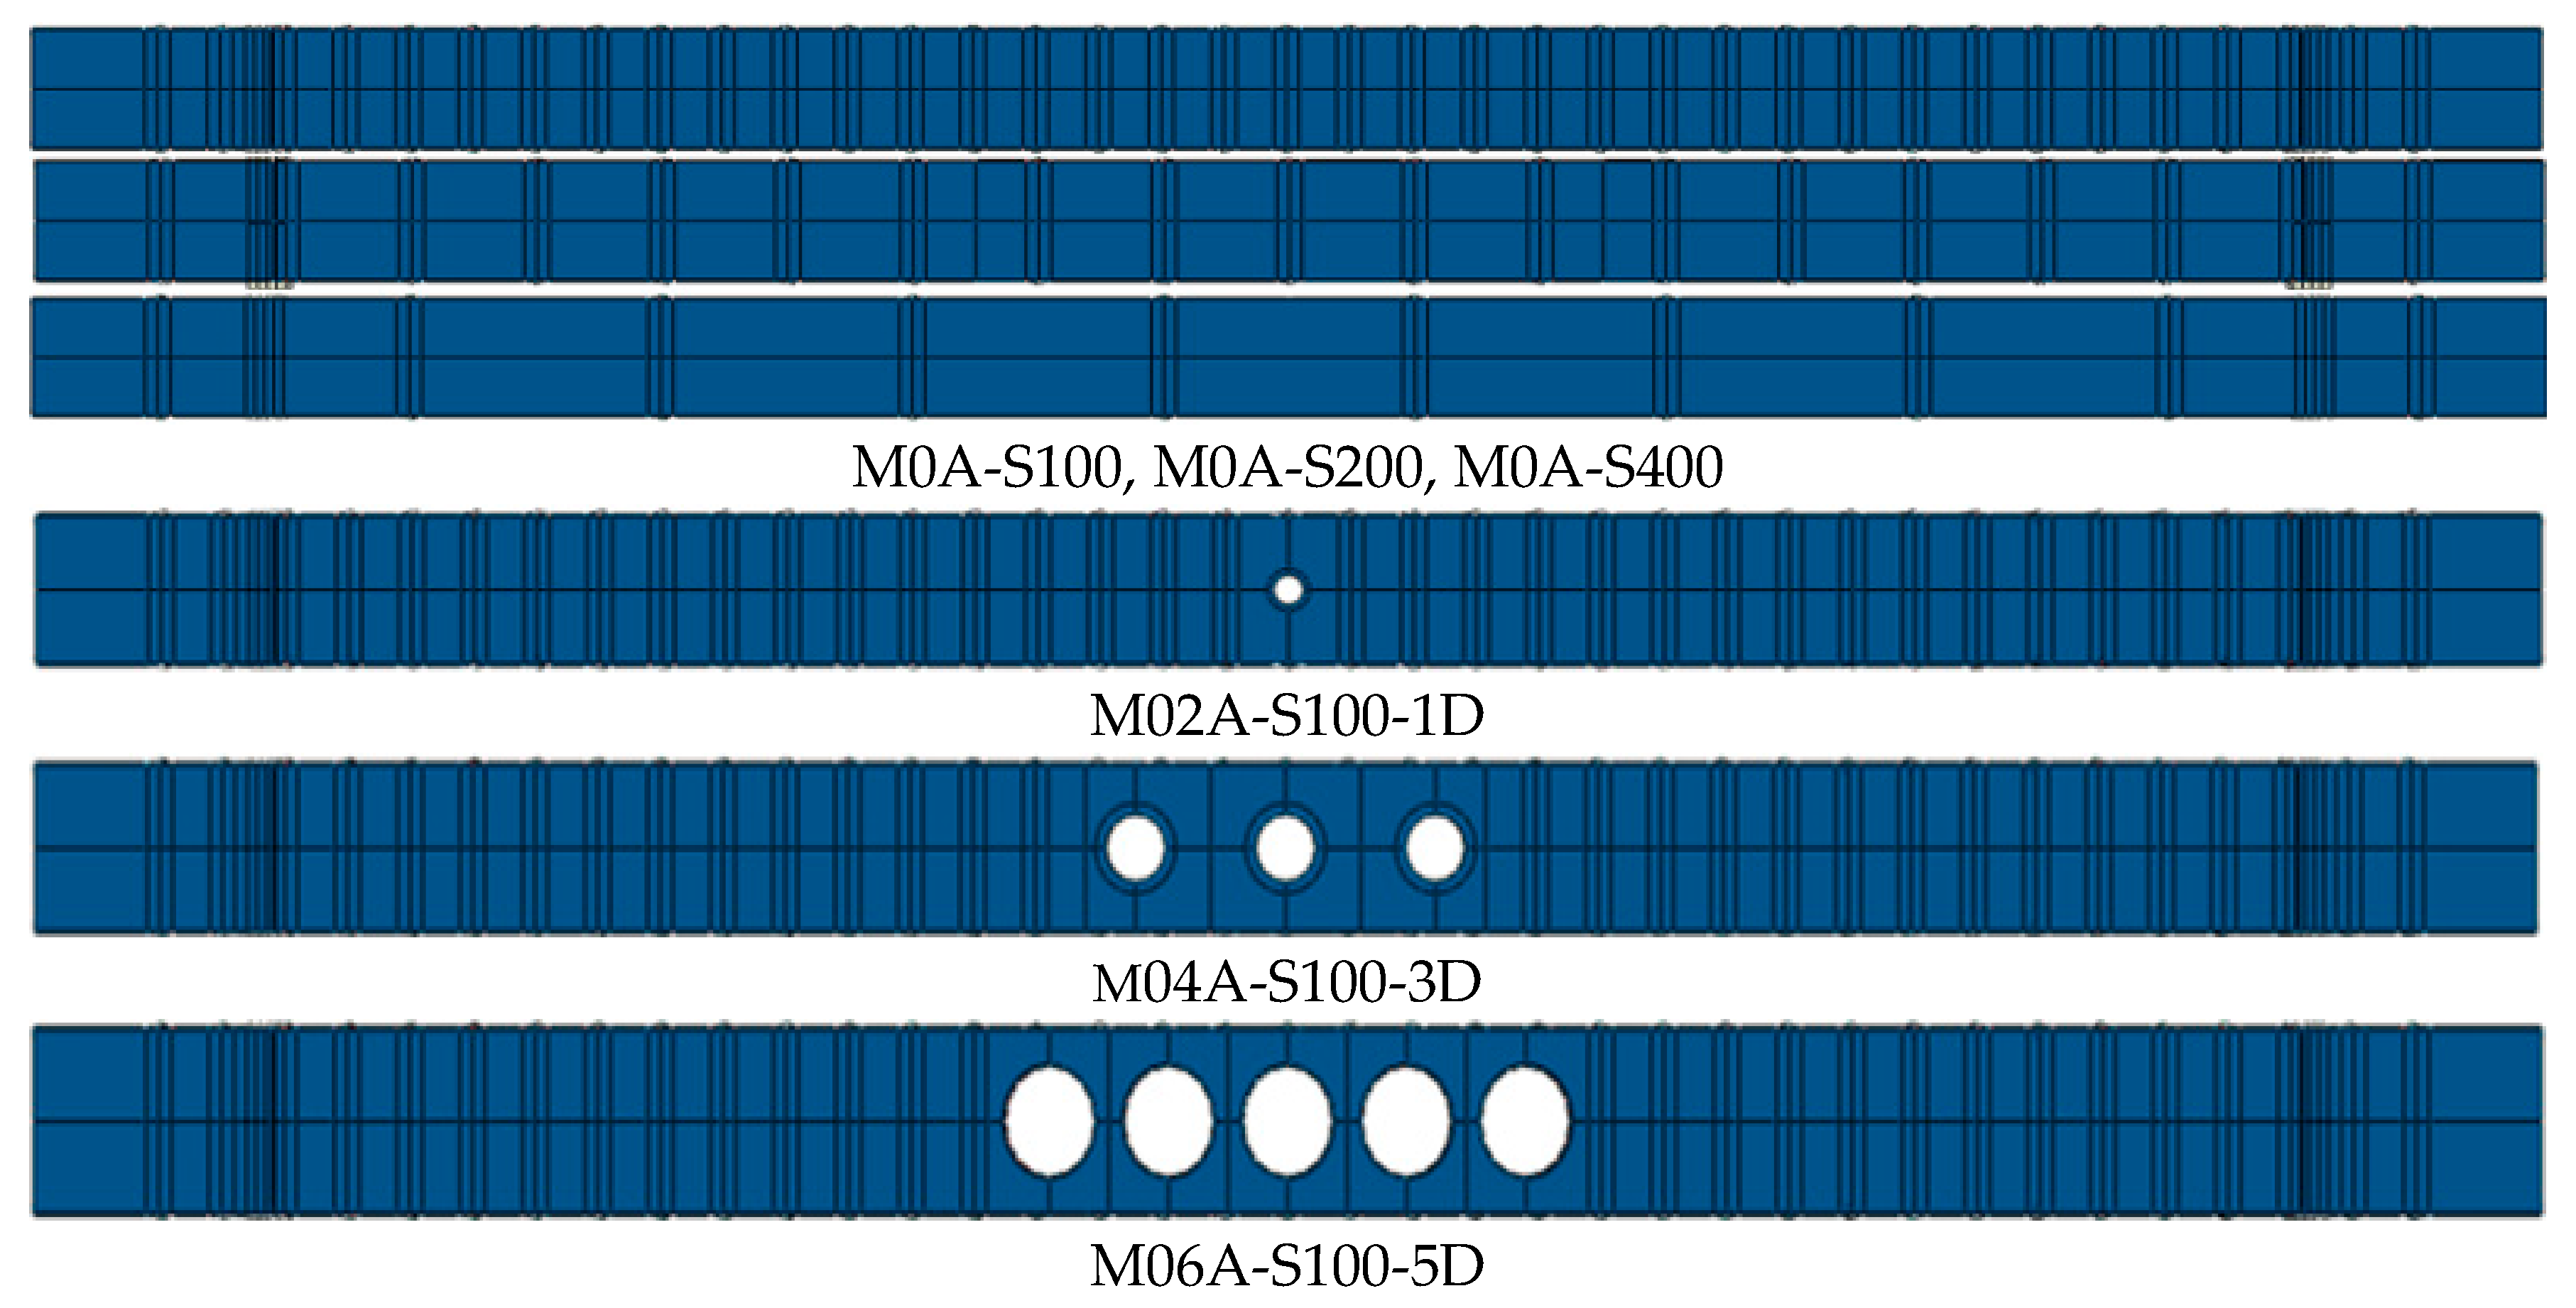
While investigating the strength effects of cold-formed lip and non-lip beams, the variables in the created models are summarized in Table 2 as a study matrix. In the study, 30 different models were created by varying the smart screw spacing, body hole diameter, and number of holes. The model beam length was designated as 4000 mm. The height of the lip profile constituting the built-up section was set at 240 mm, while the height of the non-lip profile was designated as 244 mm. In both profiles, the body and header thicknesses were determined to be 2 mm (Figure 5). The corner rotation region of the elements was designed with a radius of 2 mm. The test specimens were labelled so that the depth of the web, the length of the beam, and the type of hole were defined (Figure 6). For example, the label “M02A-S100-1D” can be explained as follows: “M02A” represents the ratio of beam height/hole diameter, “S100” represents the screw pitch distance, and “1D” represents the number of holes. Finite element sample images of the test samples created for the parametric study are given in Figure 7.

5. Findings and Discussions

The data obtained as a result of the study were evaluated separately in terms of Von Mises, Plastic Equivalent Strain (PEEQ), yield stress, S23 stress, ductility, and moment–displacement, and each was presented under separate headings.

5.1. Von Mises Stress

The ABAQUS finite element program enables the use of different types of plasticity and fracture theories. In the literature, the Von Mises or Tresca criteria are generally used for ductile material. According to the Tresca Yield Criterion, the material passes from an elastic state to a plastic state when τmax reaches a critical value. Its general expression is given by Equation (1):
Maximum {|σ1 − σ2|, |σ2 − σ3|, |σ3 − σ1|} = σa
Here, σ1, σ2, and σ3 are the principal stresses as defined in Equation (1). Σ1 > σ2 > σ3. If σ3 = 0 is taken for the plane deformation case, in the above equation, Max.{|σ1 − σ2|,|σ2|,|σ1|} = σa. The Von Mises criterion was preferred in this study. According to this criterion, hydrostatic pressure does not cause the material to yield. Only the distortion energy is effective in transitioning the material from the elastic state to the plastic state. Yielding begins if the elastic distortion energy reaches a critical value. The general formula is given in Equation (2).
σ a = 1 6 σ 1 σ 2 2 + ( σ 2 σ 3 ) 2 + σ 3 σ 1 2
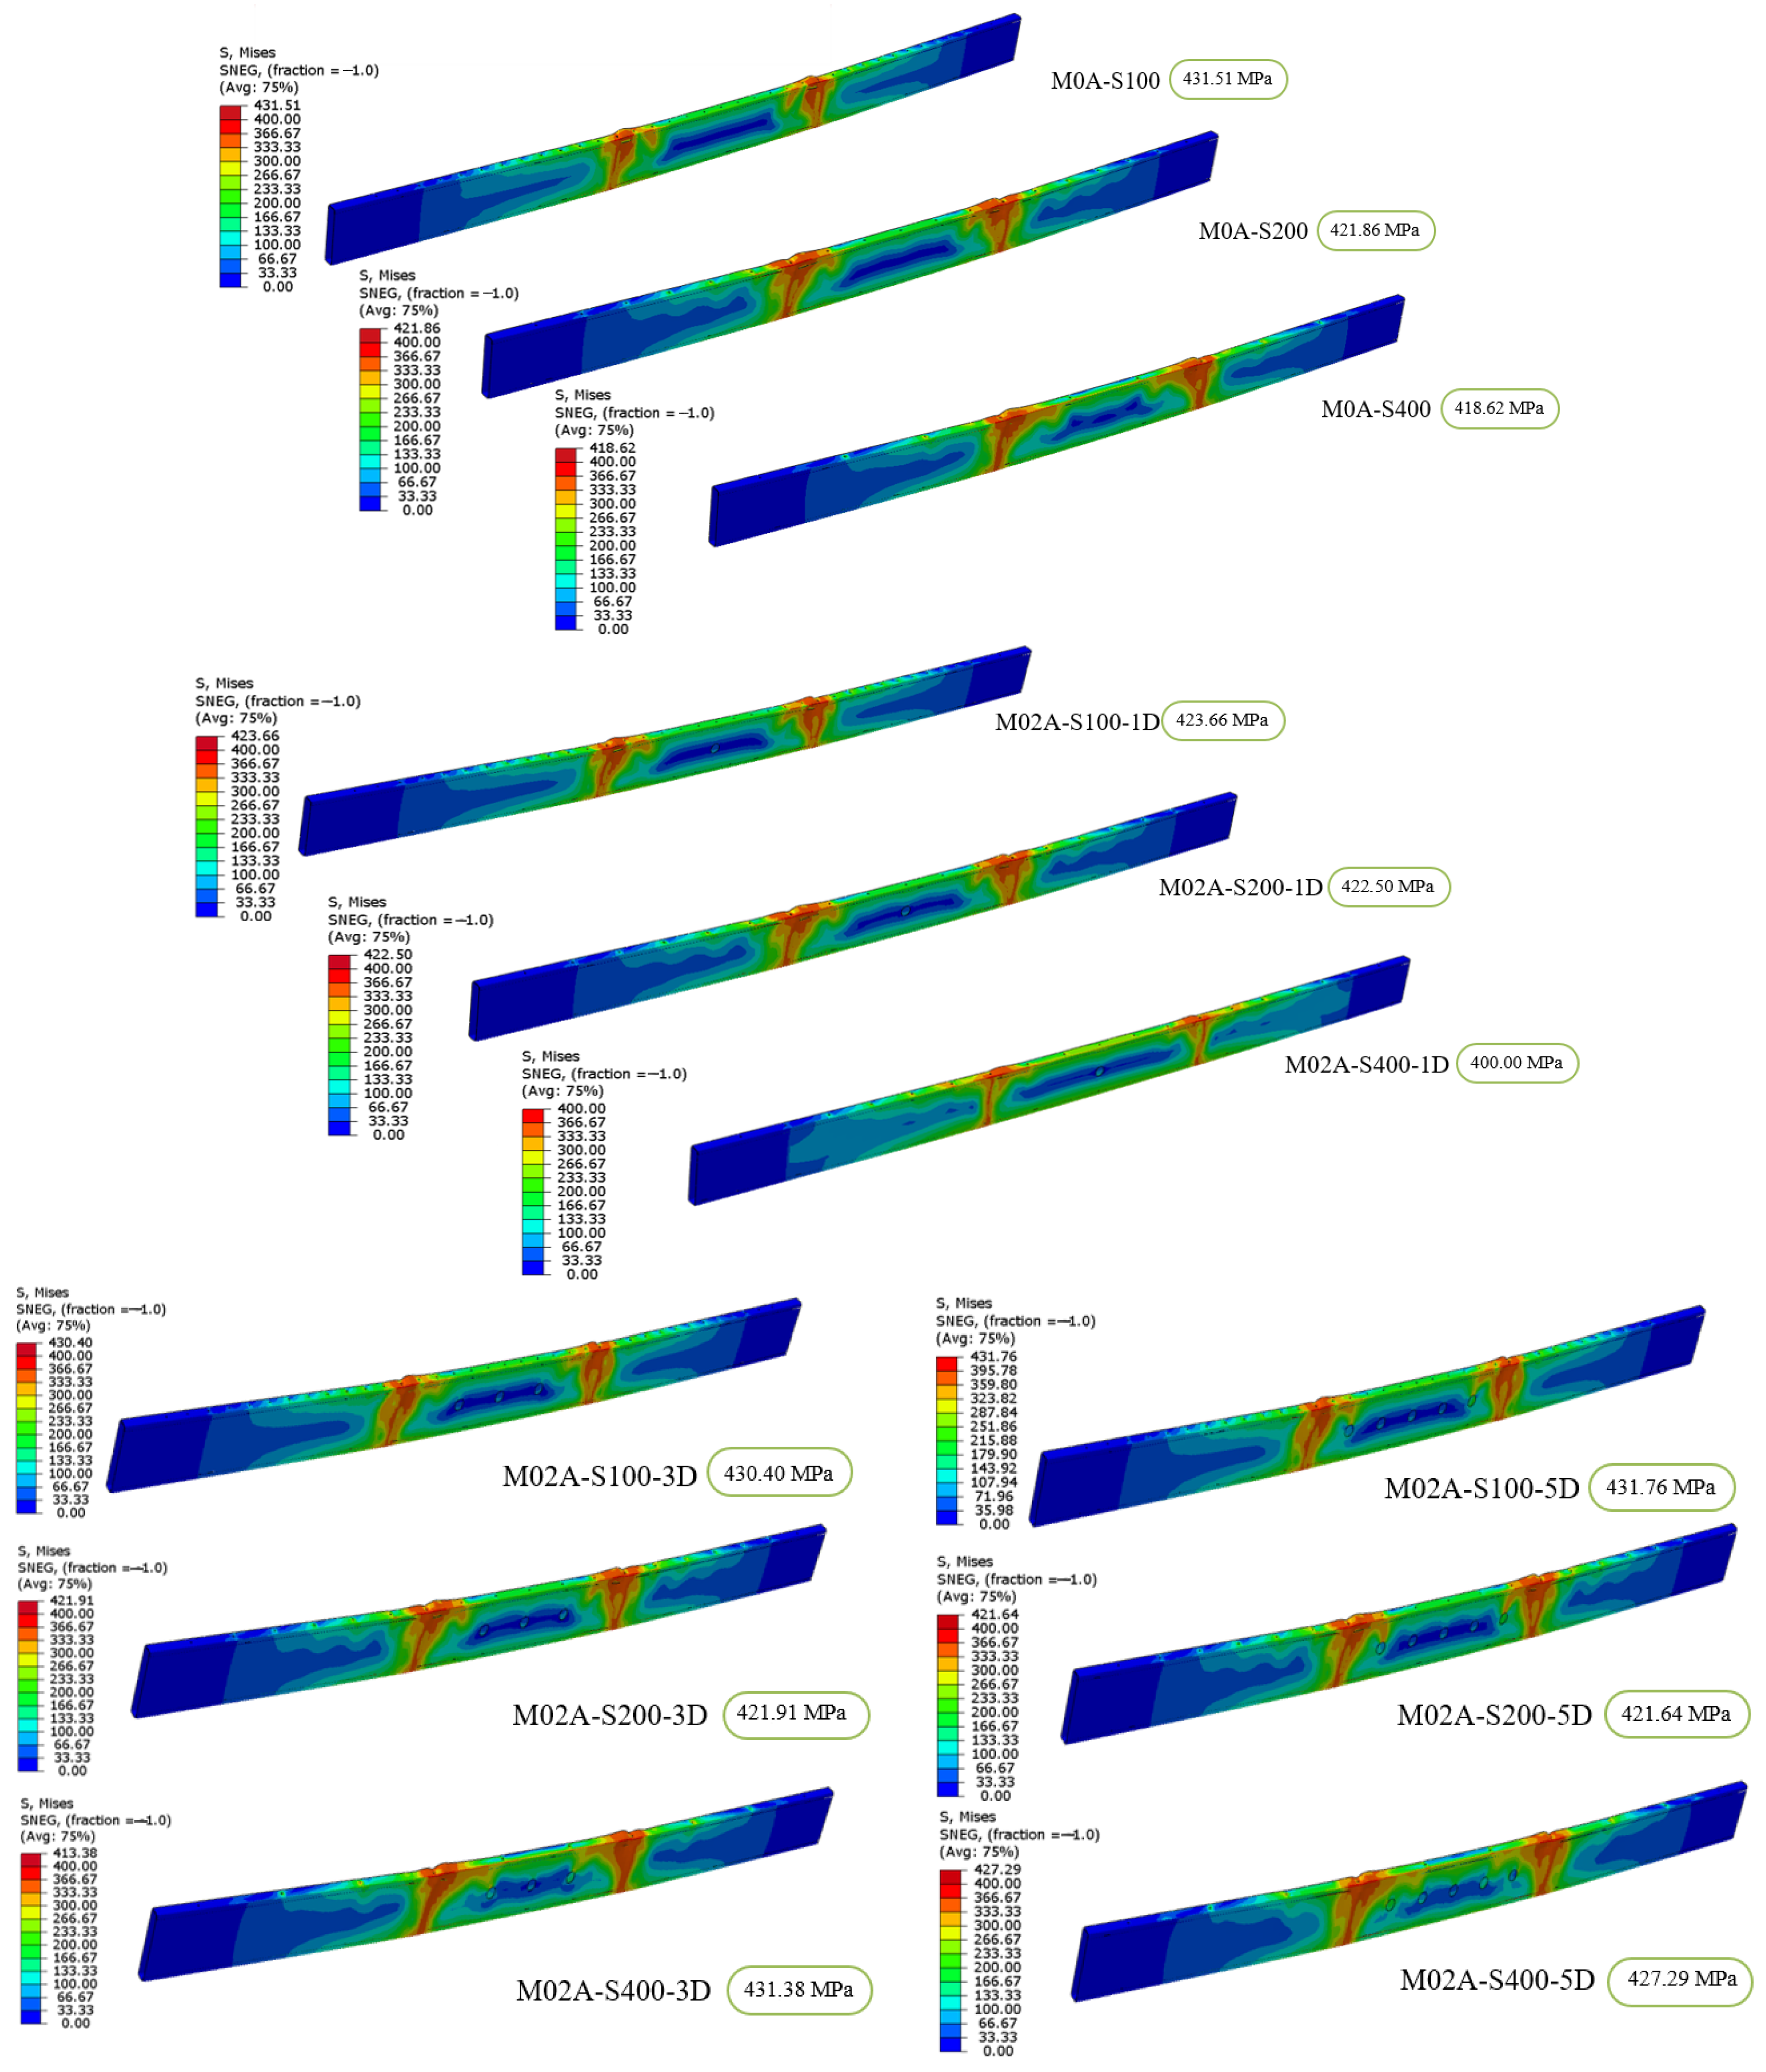
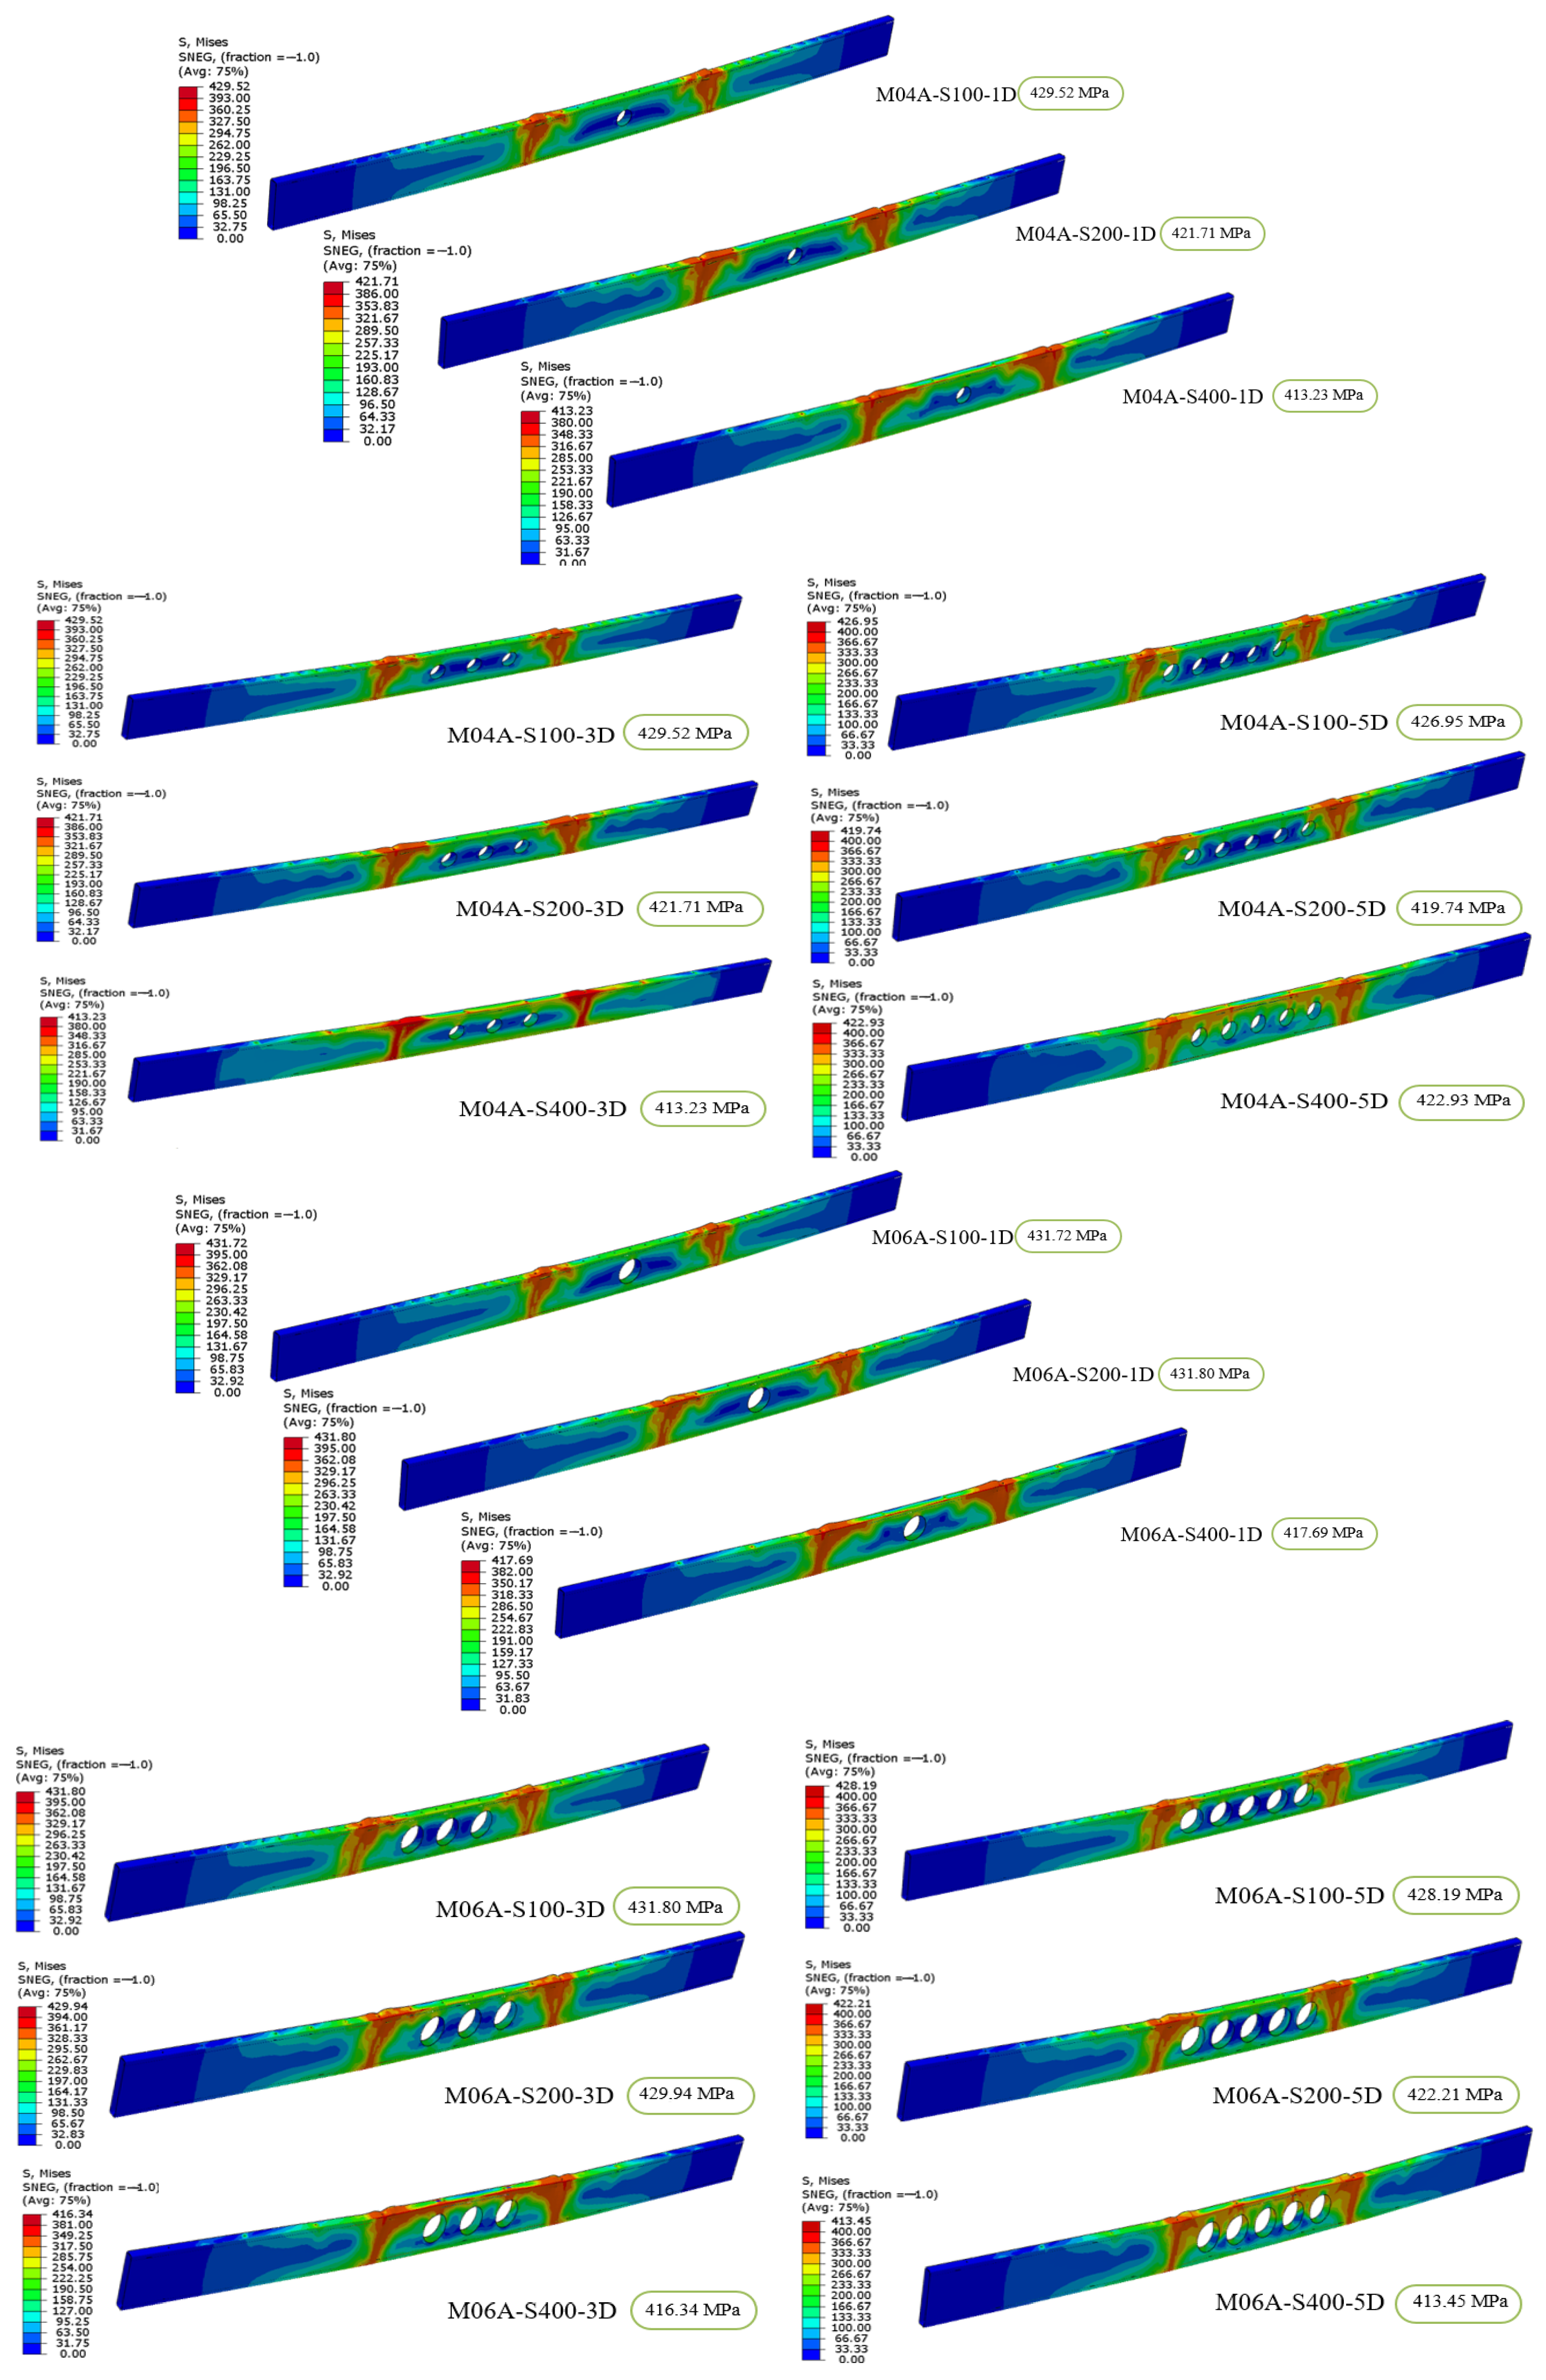
Von Mises stress is a criterion used to determine the onset of plastic deformation behavior of materials under complex stress conditions. This stress reduces complex stress states to a single value, allowing for the prediction of whether deformation will occur in the element. Therefore, it is one of the critical parameters to consider when designing specimens. In this study, the analyses conducted on the built-up box sections reveal that the Von Mises stress distributions observed in the beam cross-section during a four-point bending test are compared in Figure 8, while the maximum stress values within the cross-section are presented in Table 3. Variations in parameters such as the a/d ratio, number of body holes, body diameter, bolt spacing, and the number of bolts were examined for their influence on the stress behavior of the specimens. For the M0A series without body holes, an increase in bolt spacing was associated with a decrease in the maximum Von Mises stress value. The M0A-S100 specimen exhibited a stress of 431.51 MPa, while the M0A-S400 specimen had a stress value of 418.62 MPa. This indicates a 3% reduction in stress value, with a fourfold increase in bolt spacing. In the M02A-1D series, this change was observed as a 6% decrease, while the M02A-3D series showed a 4% reduction, and the M02A-5D series experienced a 3% decrease. The reduction was 4% for the M04A-1D series, 14% for the M04A-3D series, and 2% for the M04A-5D series. In the M06A series (1D, 2D, and 3D elements), this change averaged about 3.5%. In the M02A, M04A, and M06A series, variations in the number of holes for elements with S100, S200, and S400 bolt spacing produced an average change of about 2% in the Von Mises stress values. The changes in the a/d ratio showed less than 2% effect on the stress distribution in the cross-section. These results indicate that bolt spacing has a more significant effect on the stress values in the element compared to the a/d ratio.
The mechanical properties utilized in this study were directly obtained from tensile coupon tests, as presented in Table 1. The yield strengths of the corner and web coupons were measured as 363.4 MPa and 332.8 MPa, respectively, with corresponding ultimate strengths of 431.8 MPa and 420.5 MPa. These experimentally determined values are consistent with the general mechanical properties of cold-formed steel C-sections used in similar structural applications, which typically exhibit yield strengths ranging from 320 MPa to 370 MPa and ultimate strengths between 400 MPa and 450 MPa [6,11]. In the finite element analyses performed, the maximum Von Mises stresses recorded for the models ranged from approximately 375 MPa to 432 MPa, as shown in Table 3. These peak Von Mises stress values closely correspond to the experimentally measured ultimate strength of the material, confirming that the developed finite element model accurately captured the material behavior under bending loads. Considering typical safety factors of 1.5 to 2.0 used in design, these results suggest that the sections reached yield under maximum loading, which is acceptable for ultimate limit state design, allowing controlled plastic deformation without sudden failure. Additionally, the PEEQ results confirmed that plastic deformations were concentrated in limited regions near loading zones and connections, maintaining overall structural integrity. This demonstrates that the built-up box sections have sufficient load-carrying capacity while providing ductile behavior under bending. Moreover, the plastic equivalent strain (PEEQ) values observed in the parametric analyses are within the typical strain limits reported for cold-formed steel members undergoing flexural deformation, aligning with the findings of [4,6]. Therefore, it can be concluded that the simulation results obtained for stress distribution, plastic deformation, and yield behavior are in good agreement with the mechanical properties of the considered material. This confirms the reliability and validity of the finite element model, supporting the conclusions regarding the influence of screw spacing, hole number, and hole diameter on the bending performance of built-up cold-formed steel sections.

5.2. PEEQ Values and Yield Behavior

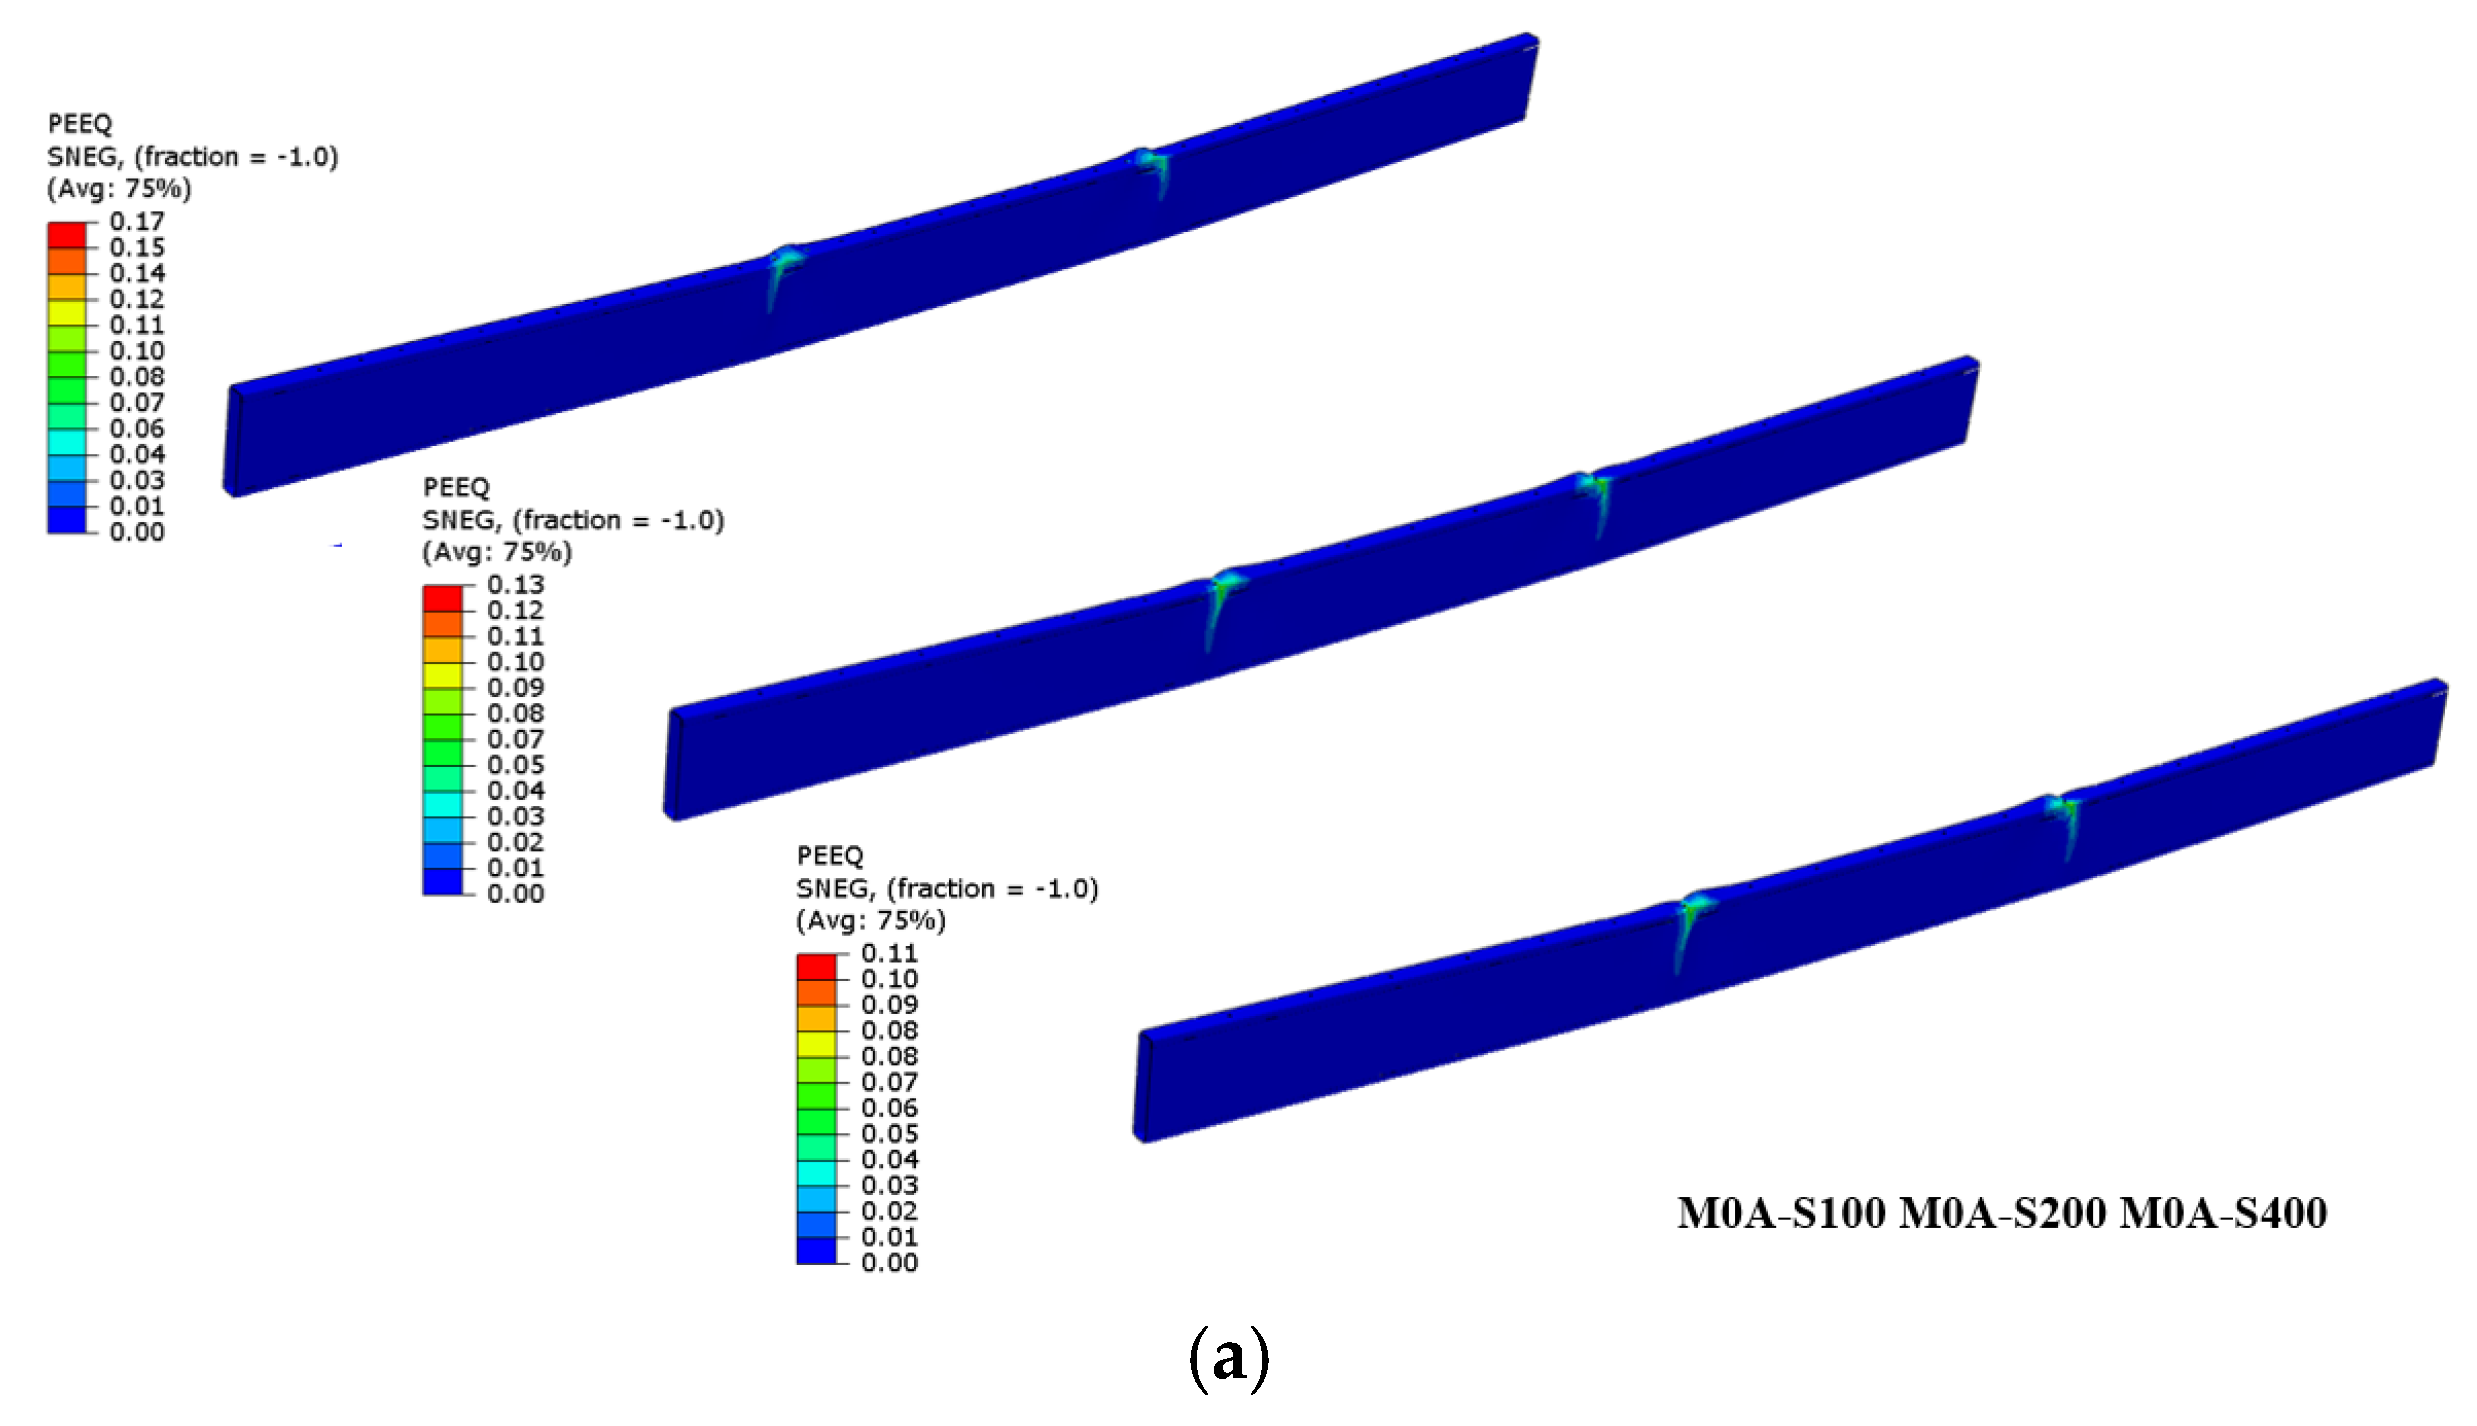
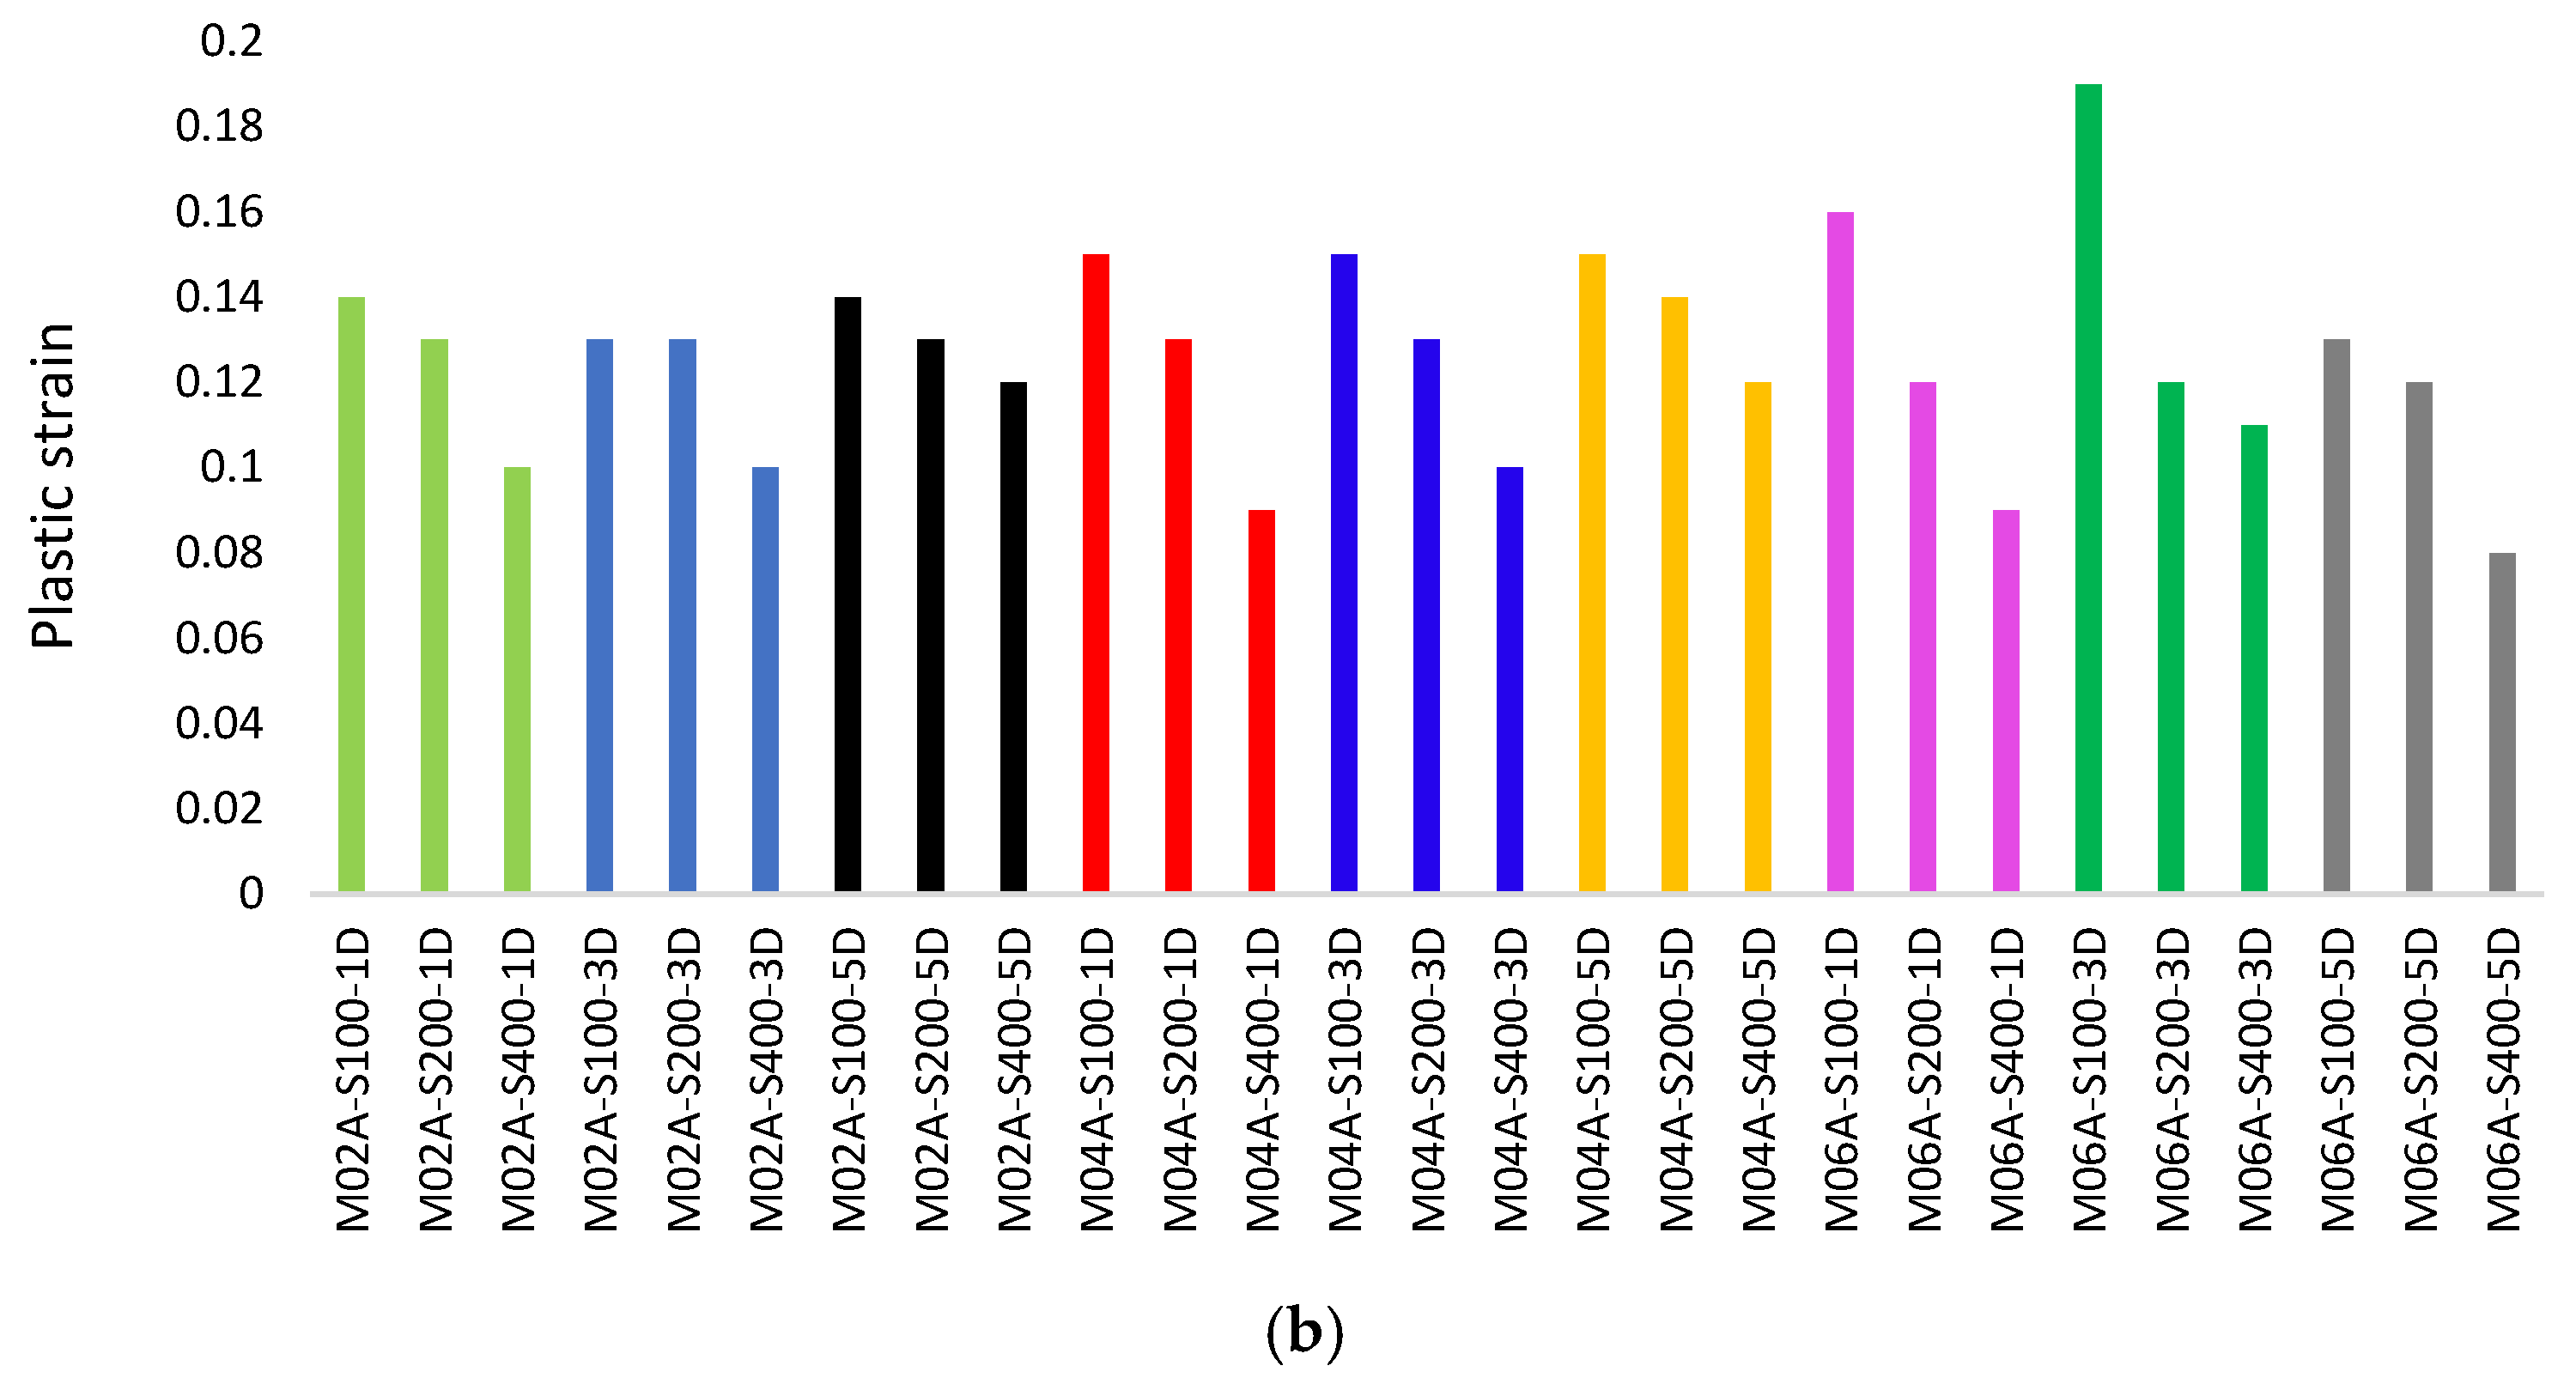
In finite element analysis (FEA), PEEQ (Plastic Equivalent Strain) is a commonly used metric that describes the total amount of plastic deformation occurring in a material. PEEQ quantitatively evaluates the plastic deformations at various points in the material, helping to determine how close these points are to critical stress levels. When examining the parametric study in terms of screw spacing, a peak change of 55% was observed in the M0A series. This change was noted to be a decrease of 40% in the M02A-1D series, a decrease of 30% in the M02A-3D series, and a decrease of 17% in the M02A-5D series. Similarly, for the M04A series, changes of 67%, 50%, and 25% were noted in the M04A-1D, M04A-3D, and M04A-5D series, respectively. The M06A-1D series exhibited changes of 78%, 73%, and 63% in the M06A-3D and M06A-5D series, respectively. The change in the number of holes for elements with S100 and S200 screw spacings did not significantly affect the PEEQ values, whereas for elements with S400 screw spacing, variations ranged from 10% to 33%. In all S100-1D elements, as the a/d ratio increased, the change in PEEQ value was approximately 14%, while in S200-1D and S400-1D elements, this change was around 9%. For S100-3D elements, the change was about 30%, while S200-3D and S400-3D elements showed a change of around 9%. In the S100-5D and S200-5D series, the change in PEEQ value with increasing a/d ratio was approximately 7%, whereas for the S400-5D elements, this change was around 33% (Figure 9a,b). Table 3 indicates that as the distance between smart screws increases, the rates of plastic deformation decrease. The PEEQ values observed in the elements correlate well with the previously examined Von Mises stress values, suggesting consistent behavior across different configurations.
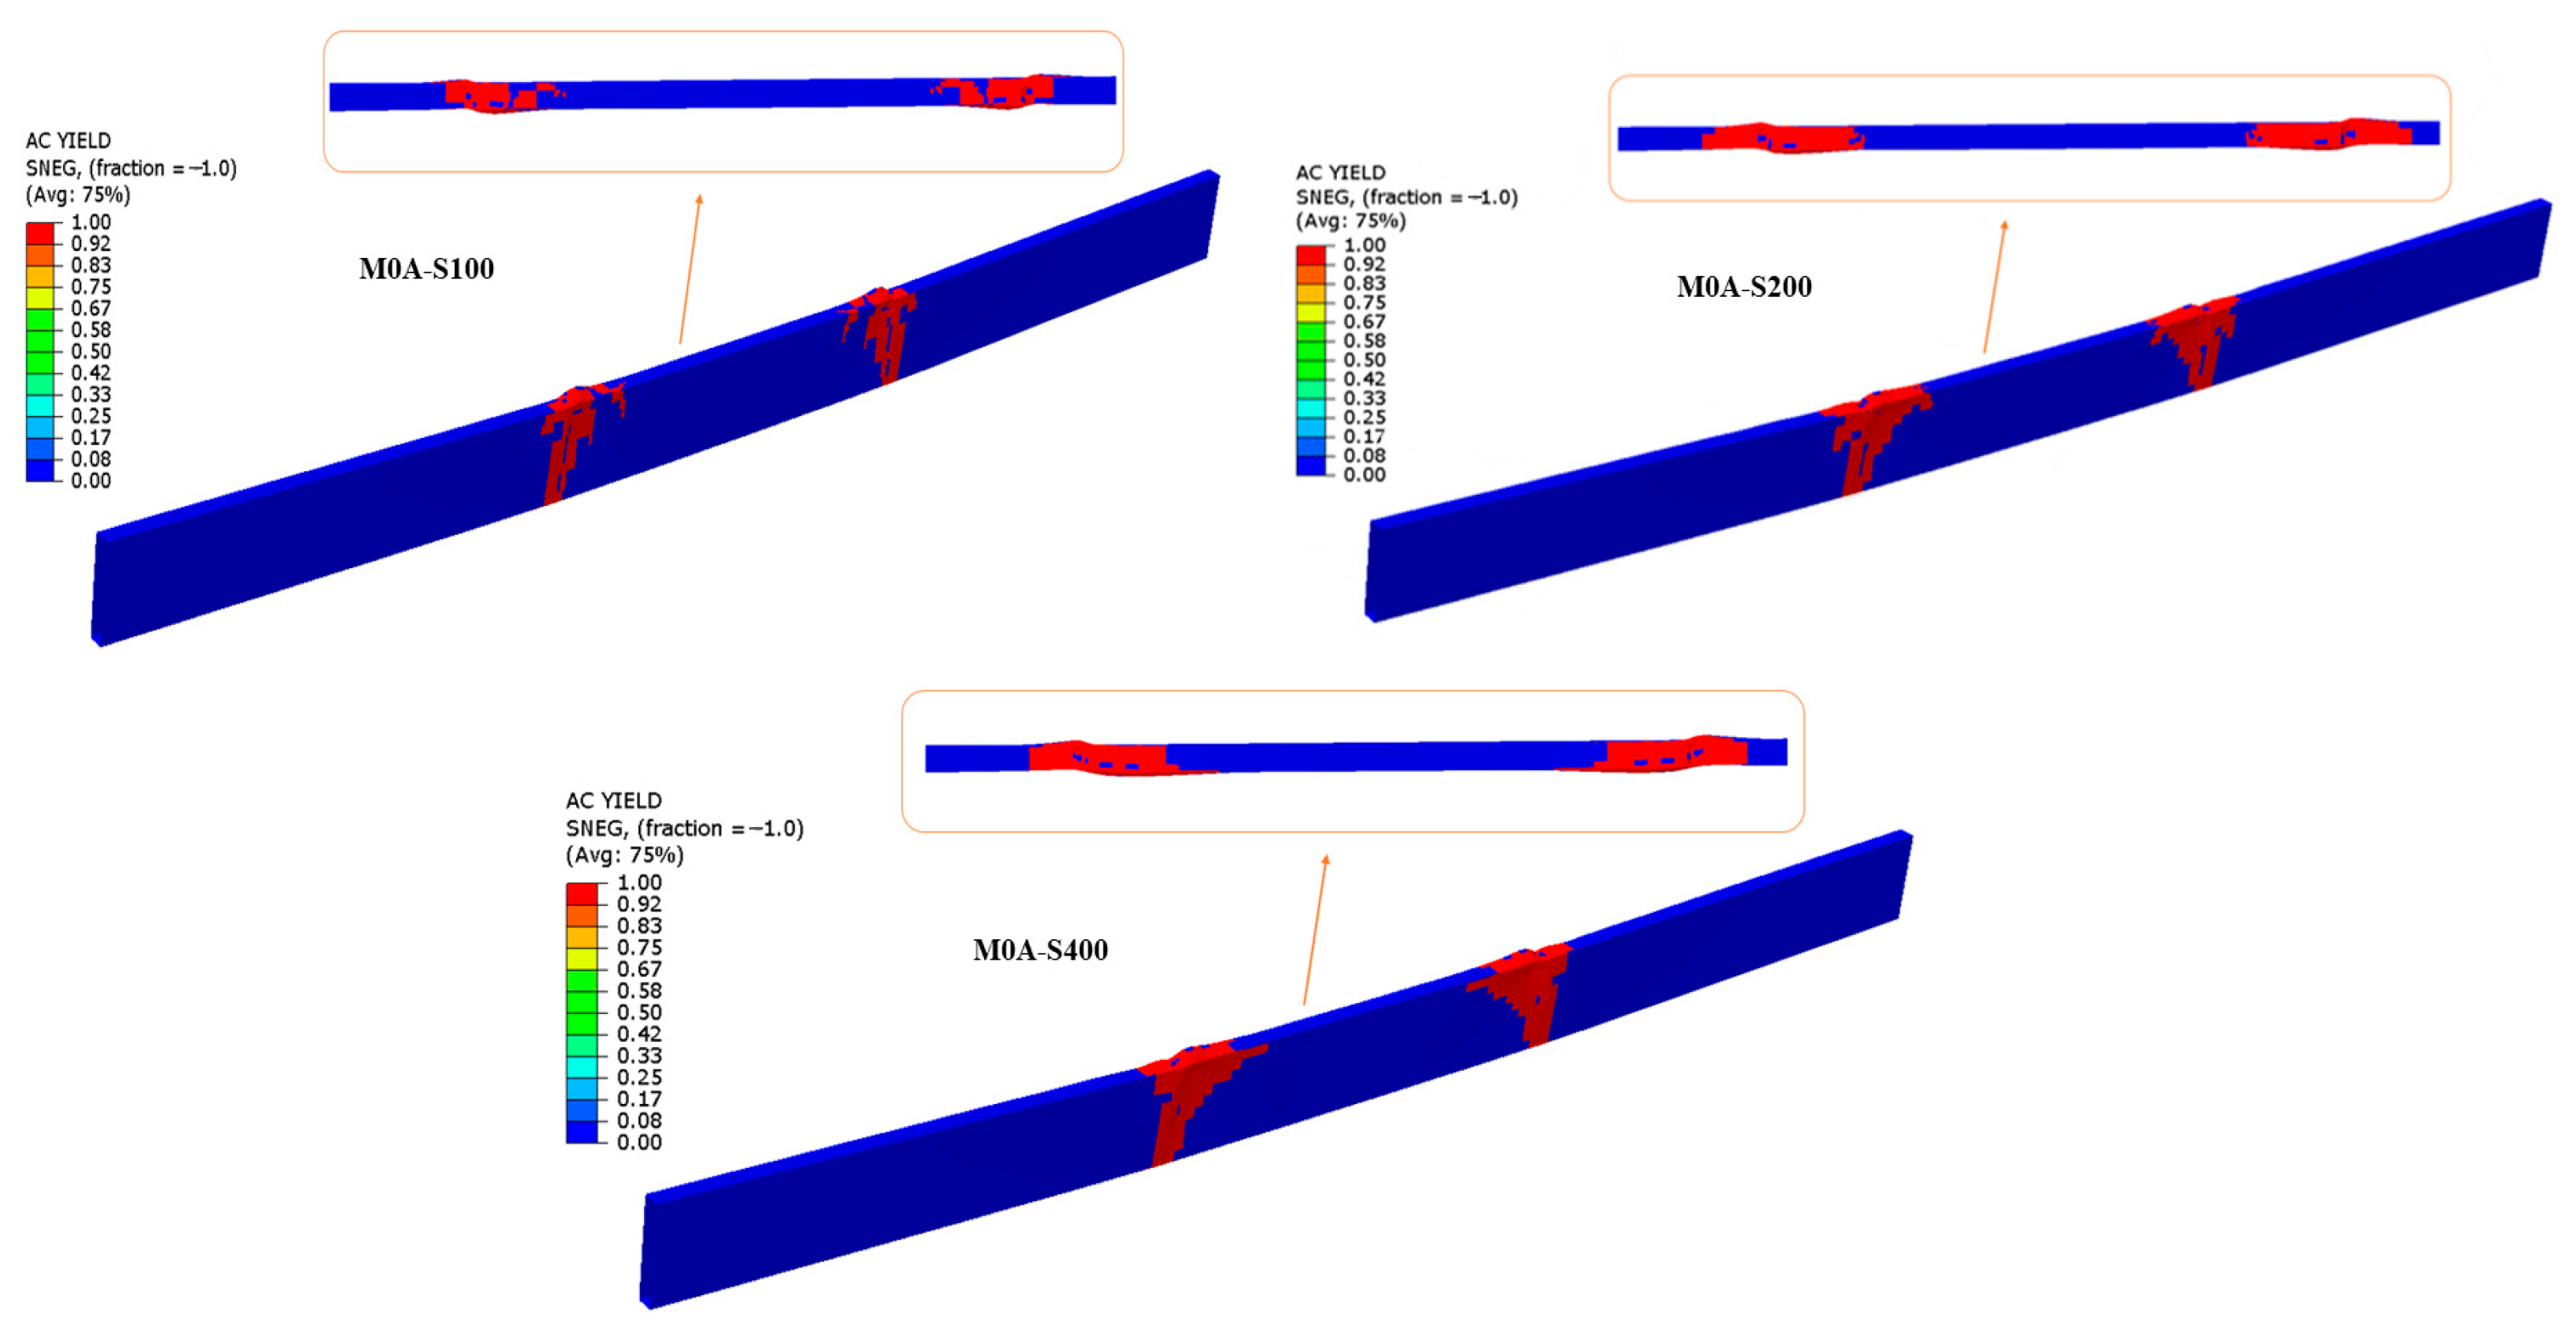
Yield stress represents a threshold value for the elastic behavior of materials, and surpassing this limit indicates that the element has transitioned into the plastic deformation region. Upon examining the M0A, M02A, M04A, and M06A series, it was observed that the points in the loading region are the first locations within the beam’s cross-section to reach the yield strength (Figure 10).

5.3. Shear Stress

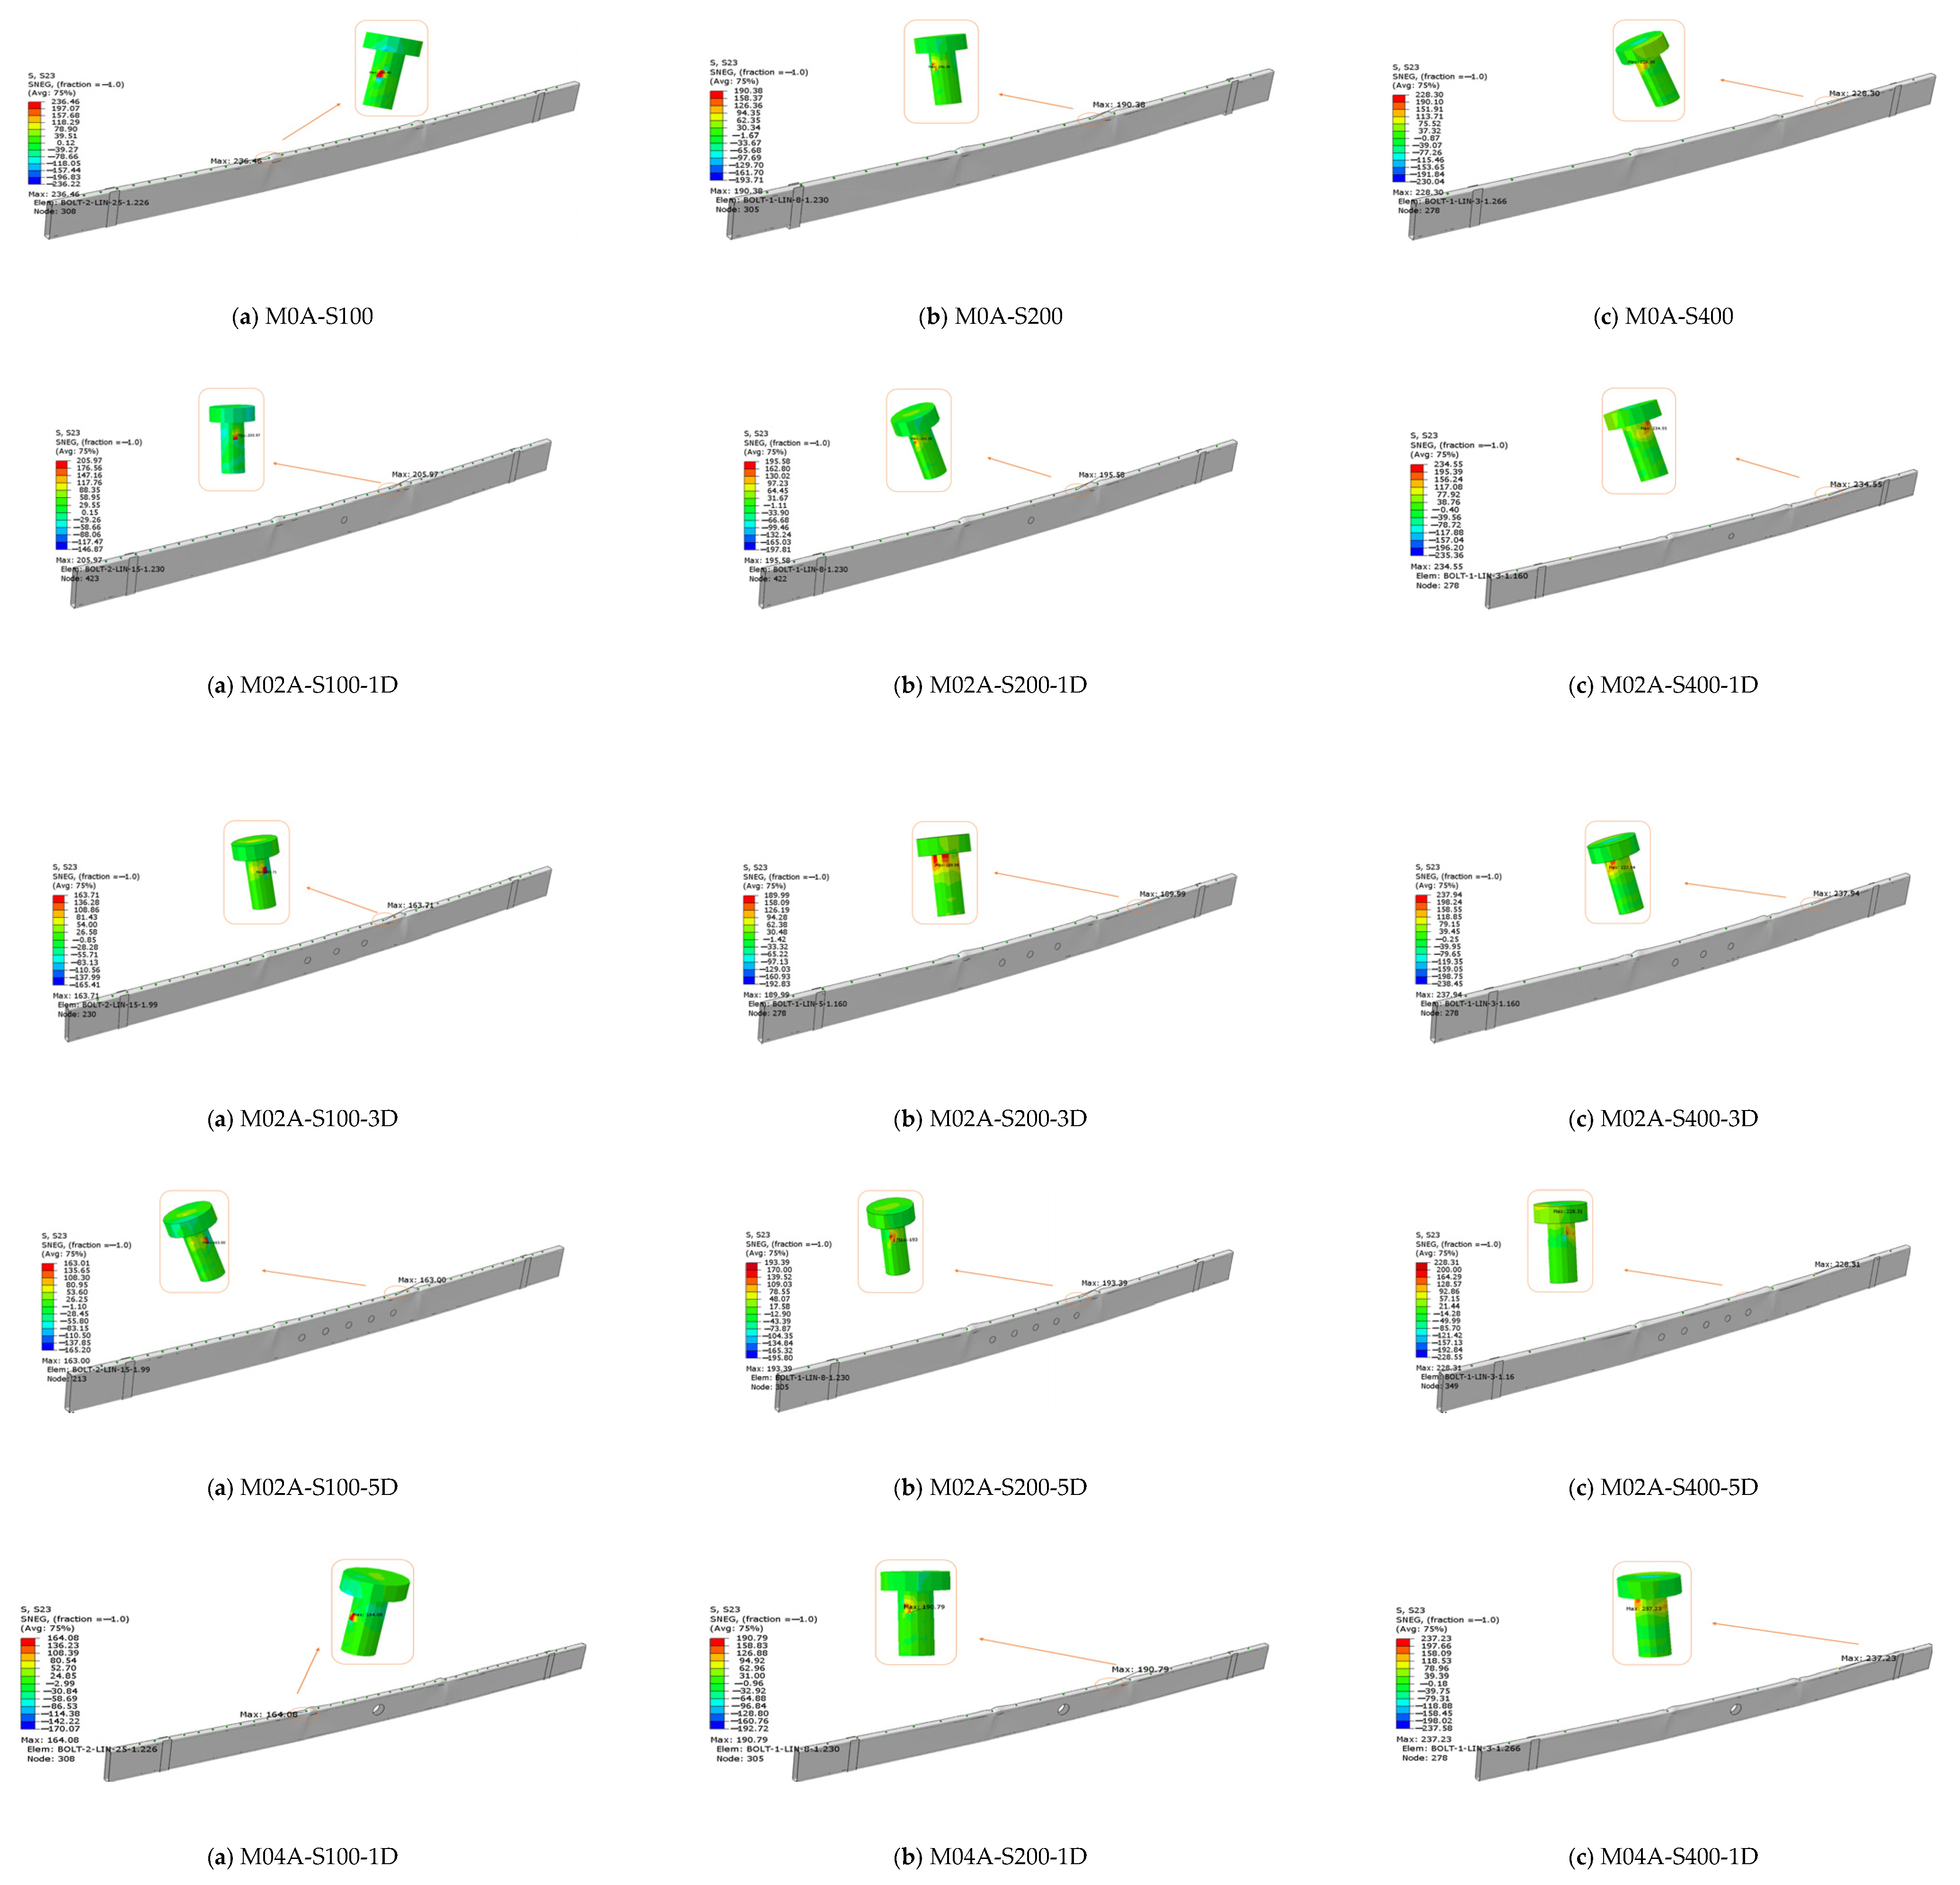
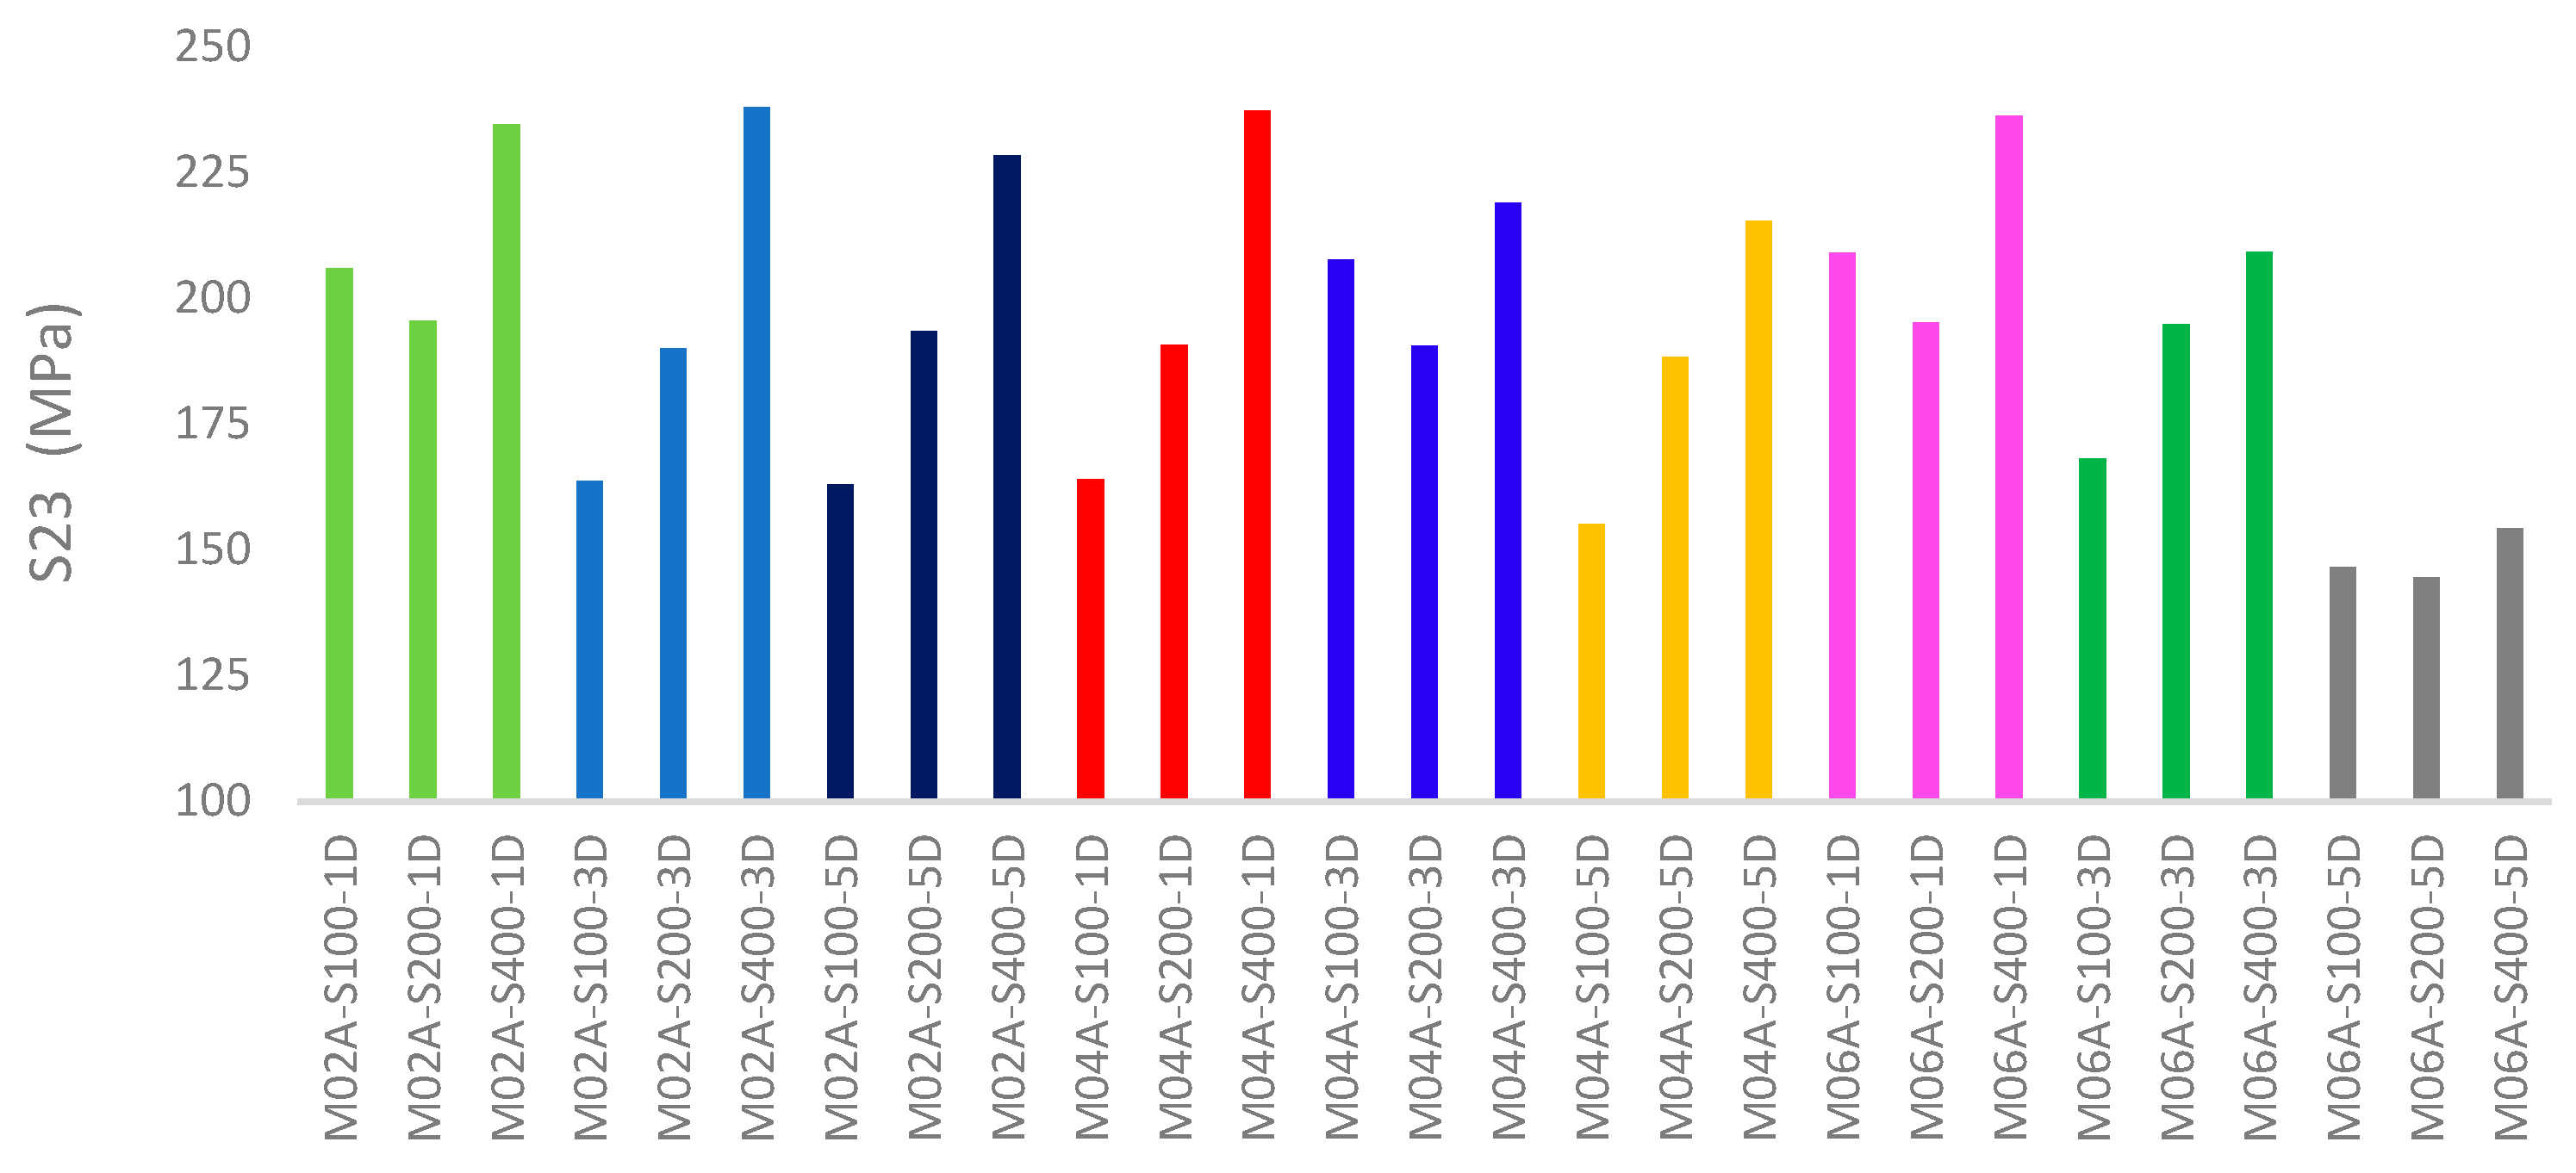
S23 shear stress is examined to determine the magnitude of shear deformations within the material and the distribution of these stresses. Finite Element Method (FEM) analyses play a crucial role, particularly in identifying critical areas subjected to shear stresses [30,31]. The S23 shear stress studied in this work represents the stress component arising from shear forces occurring between two different planes within the self-drilling screws. The bending behavior affects the normal stresses in the compression zone of the beam cross-section, leading to shear effects in the screw body. In examining the model series within the study, it was observed that as the spacing between screws in the M0A series increased, there was an average reduction of approximately 3.5% in shear stress values. Specifically, for the M02A-1D series, these changes manifested as a 12% increase, while the M02A-3D and M02A-5D series showed increases of 31% and 29%, respectively. In the M04A-1D series, there was a 31% reduction, with the M04A-3D and M04A-5D series reflecting decreases of 5% and 28%, respectively (Figure 11). For the M06A series, increases of 12%, 19%, and 5% were noted for the M06A-1D, M06A-3D, and M06A-5D series, respectively. As the screw spacing increases, a notable increase in the S23 shear stress values per unit area of screw occurs due to the reduction in the number of screws. The S23 shear stress values generated in the self-drilling screws of the samples used in the parametric study are illustrated in the bar chart in Figure 12. Additionally, stress and mechanical parameters of the screw type supporting the structural system confirmed, through finite element analyses, that the maximum S23 shear stress values in the self-drilling screws remained well below their yield stress capacity of 500 MPa (maximum observed S23 shear stress was 237.94 MPa). Moreover, plastic equivalent strain (PEEQ) results indicated minimal plastic deformation in the screws. These findings demonstrate that the mechanical properties and equivalent stress capacity of the G500 self-drilling screws are sufficient to support the applied loads in all modeled configurations. It was noted that the obtained S23 shear stress values developed inversely with both Von Mises and PEEQ values. This analysis highlights the complex interactions between screw configurations, shear stresses, and their implications for structural integrity in cold-formed steel profiles. Further reading and detailed methodologies can be found in the relevant literature on FEM applications in structural engineering [30,31].

5.4. Ductility

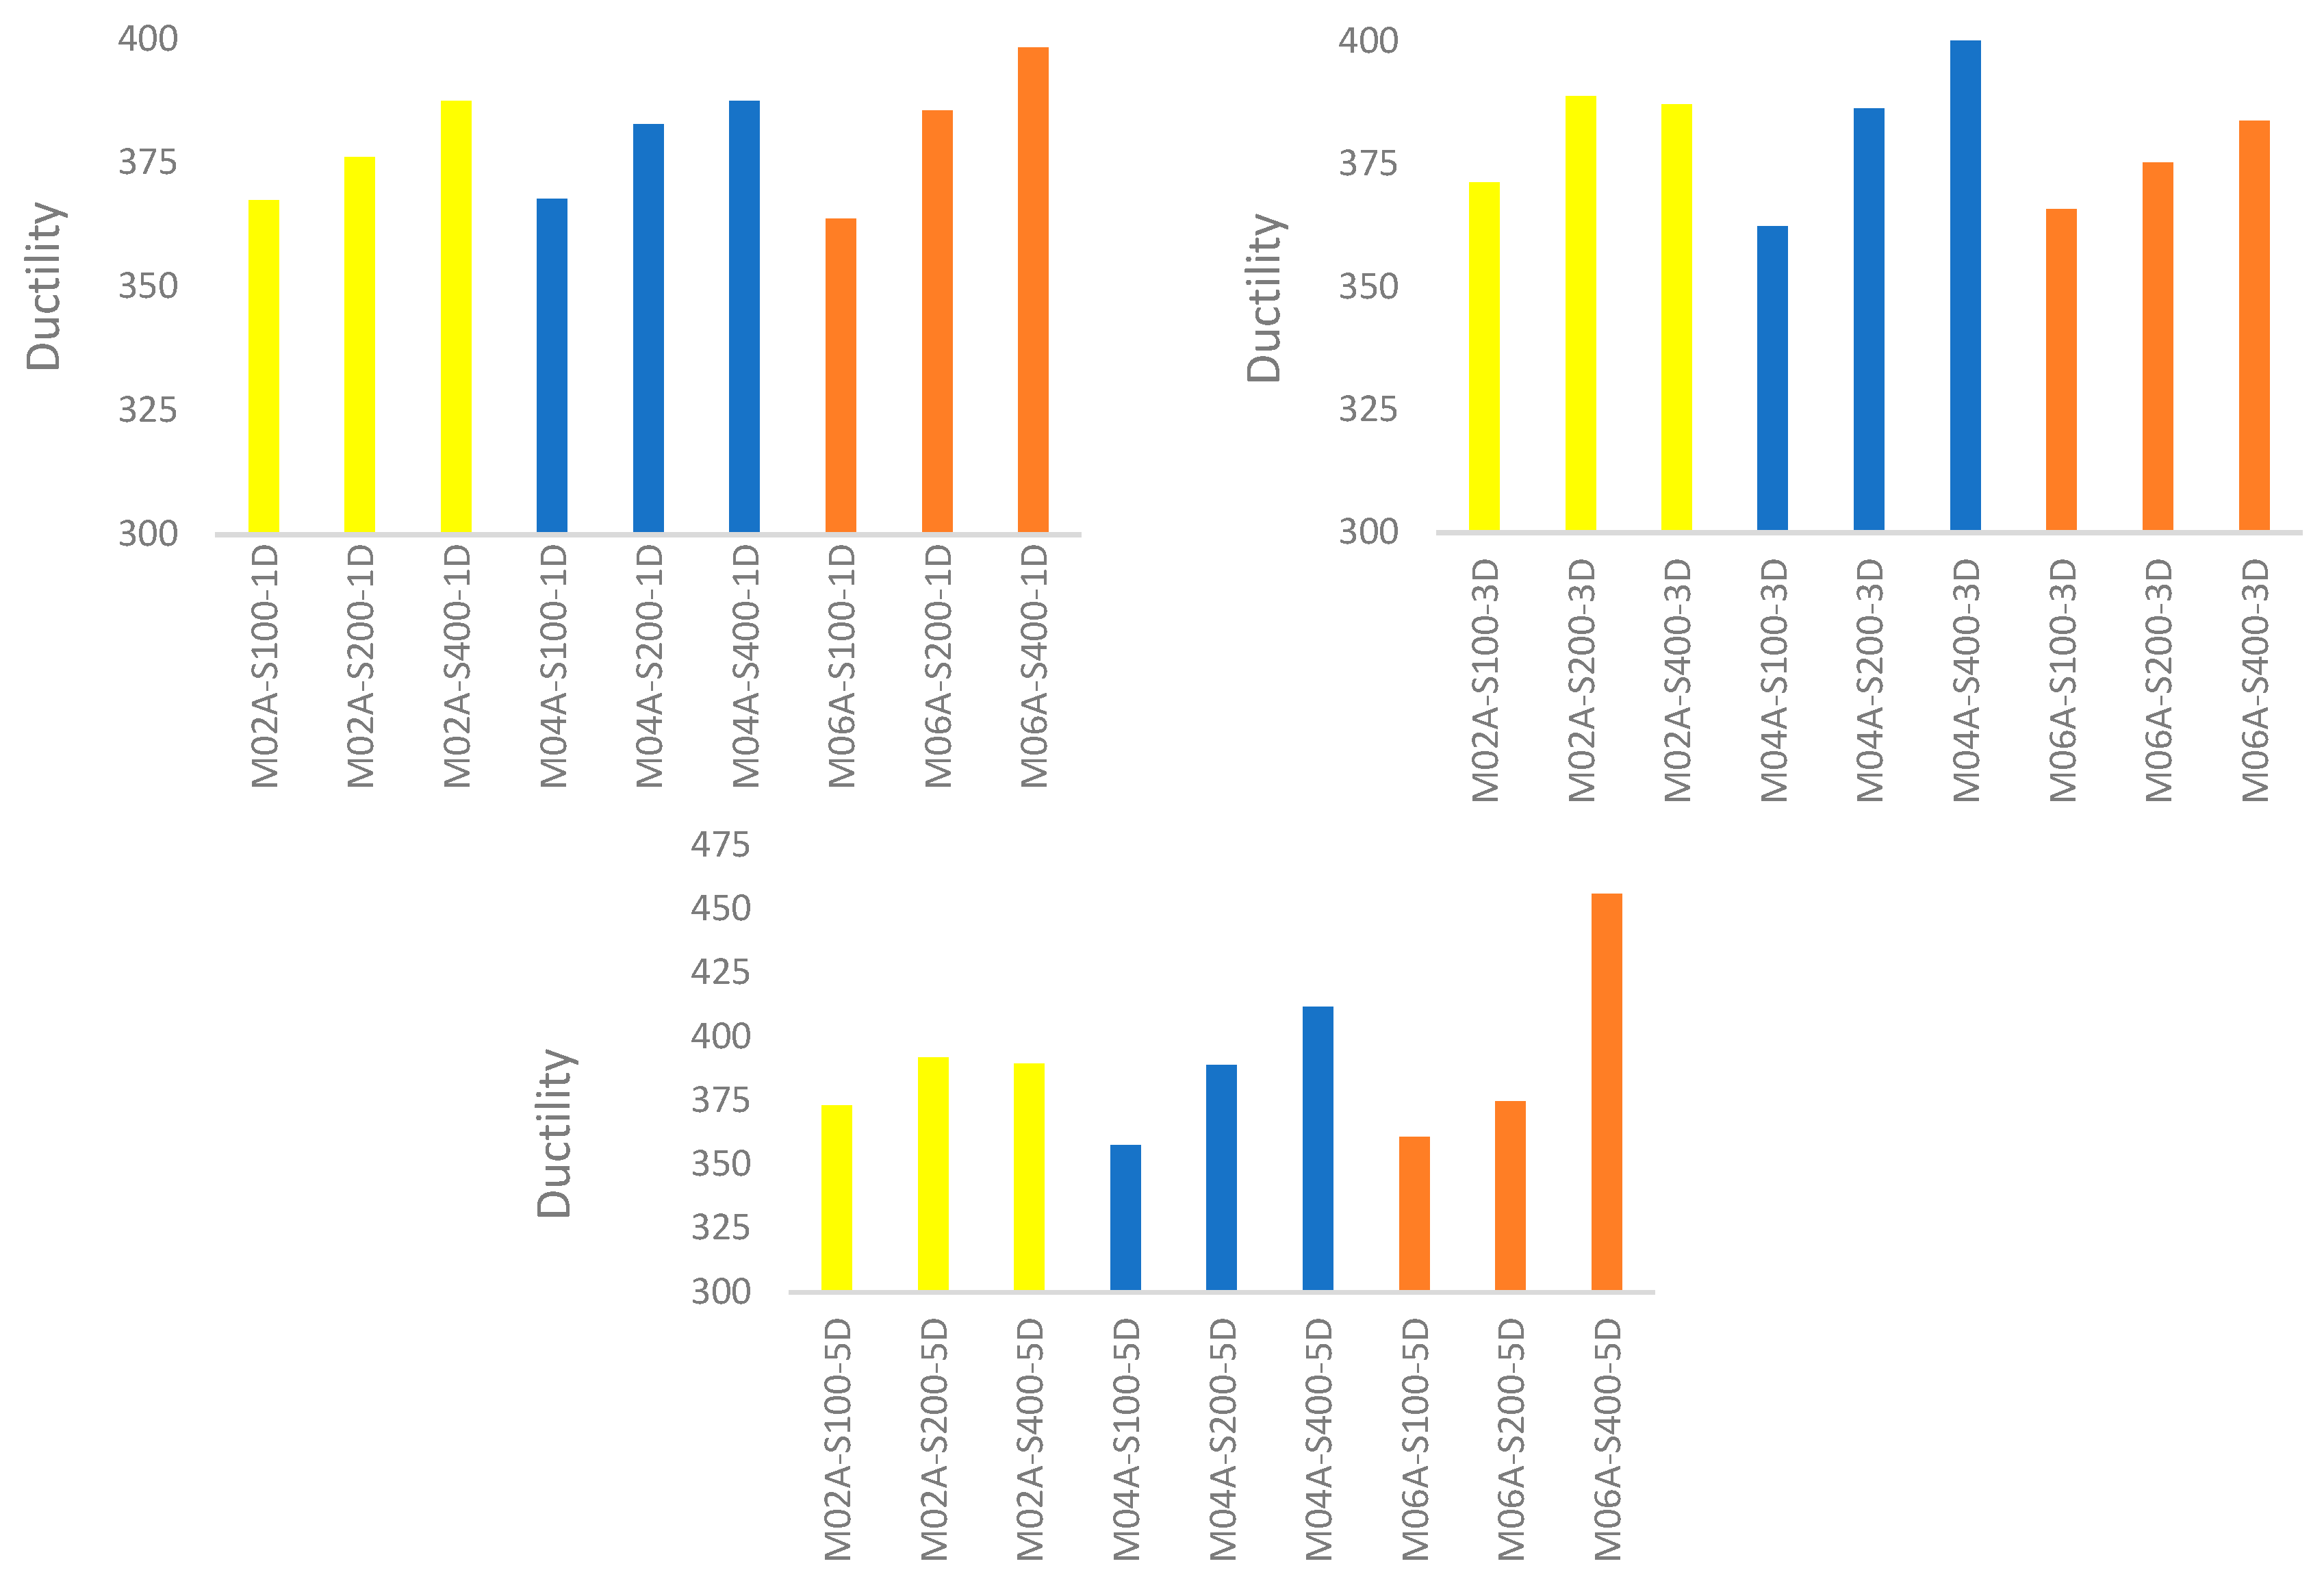
In structural engineering, ductility is a critical parameter that characterizes the ability of a structural element or system to undergo significant plastic deformation before failure. The calculated ductility values enable the evaluation of the deformation capacity of built-up cold-formed steel sections and provide insight into the effects of design parameters such as screw spacing and web perforations on structural performance. The graphs depicting the variations in ductility values, which describe the plastic deformation characteristics of all series modeled in the study, are presented in Figure 13. It was observed that as the spacing between self-drilling screws increased, the level of ductility also increased in all series (M02A, M04A, and M06A). Examination of the model series in the study revealed that in the M0A series without web holes, an increase in screw spacing resulted in a decrease of 3.5% in ductility values. In the M02A-1D series with one web hole, this change was observed as an increase of 5%, while in the M02A-3D series and the M02A-5D series, it was 4%. For the M04A series, the M04A-1D showed a 5% increase, the M04A-3D a 10% increase, and the M04A-5D a 13% increase in ductility. In the M06A series, the changes were 9% for M06A-1D, 5% for M06A-3D, and a significant 20% increase for M06A-5D. Overall, it was observed that an increase in the number of web holes increased ductility.

5.5. Moment–Displacement Graphs

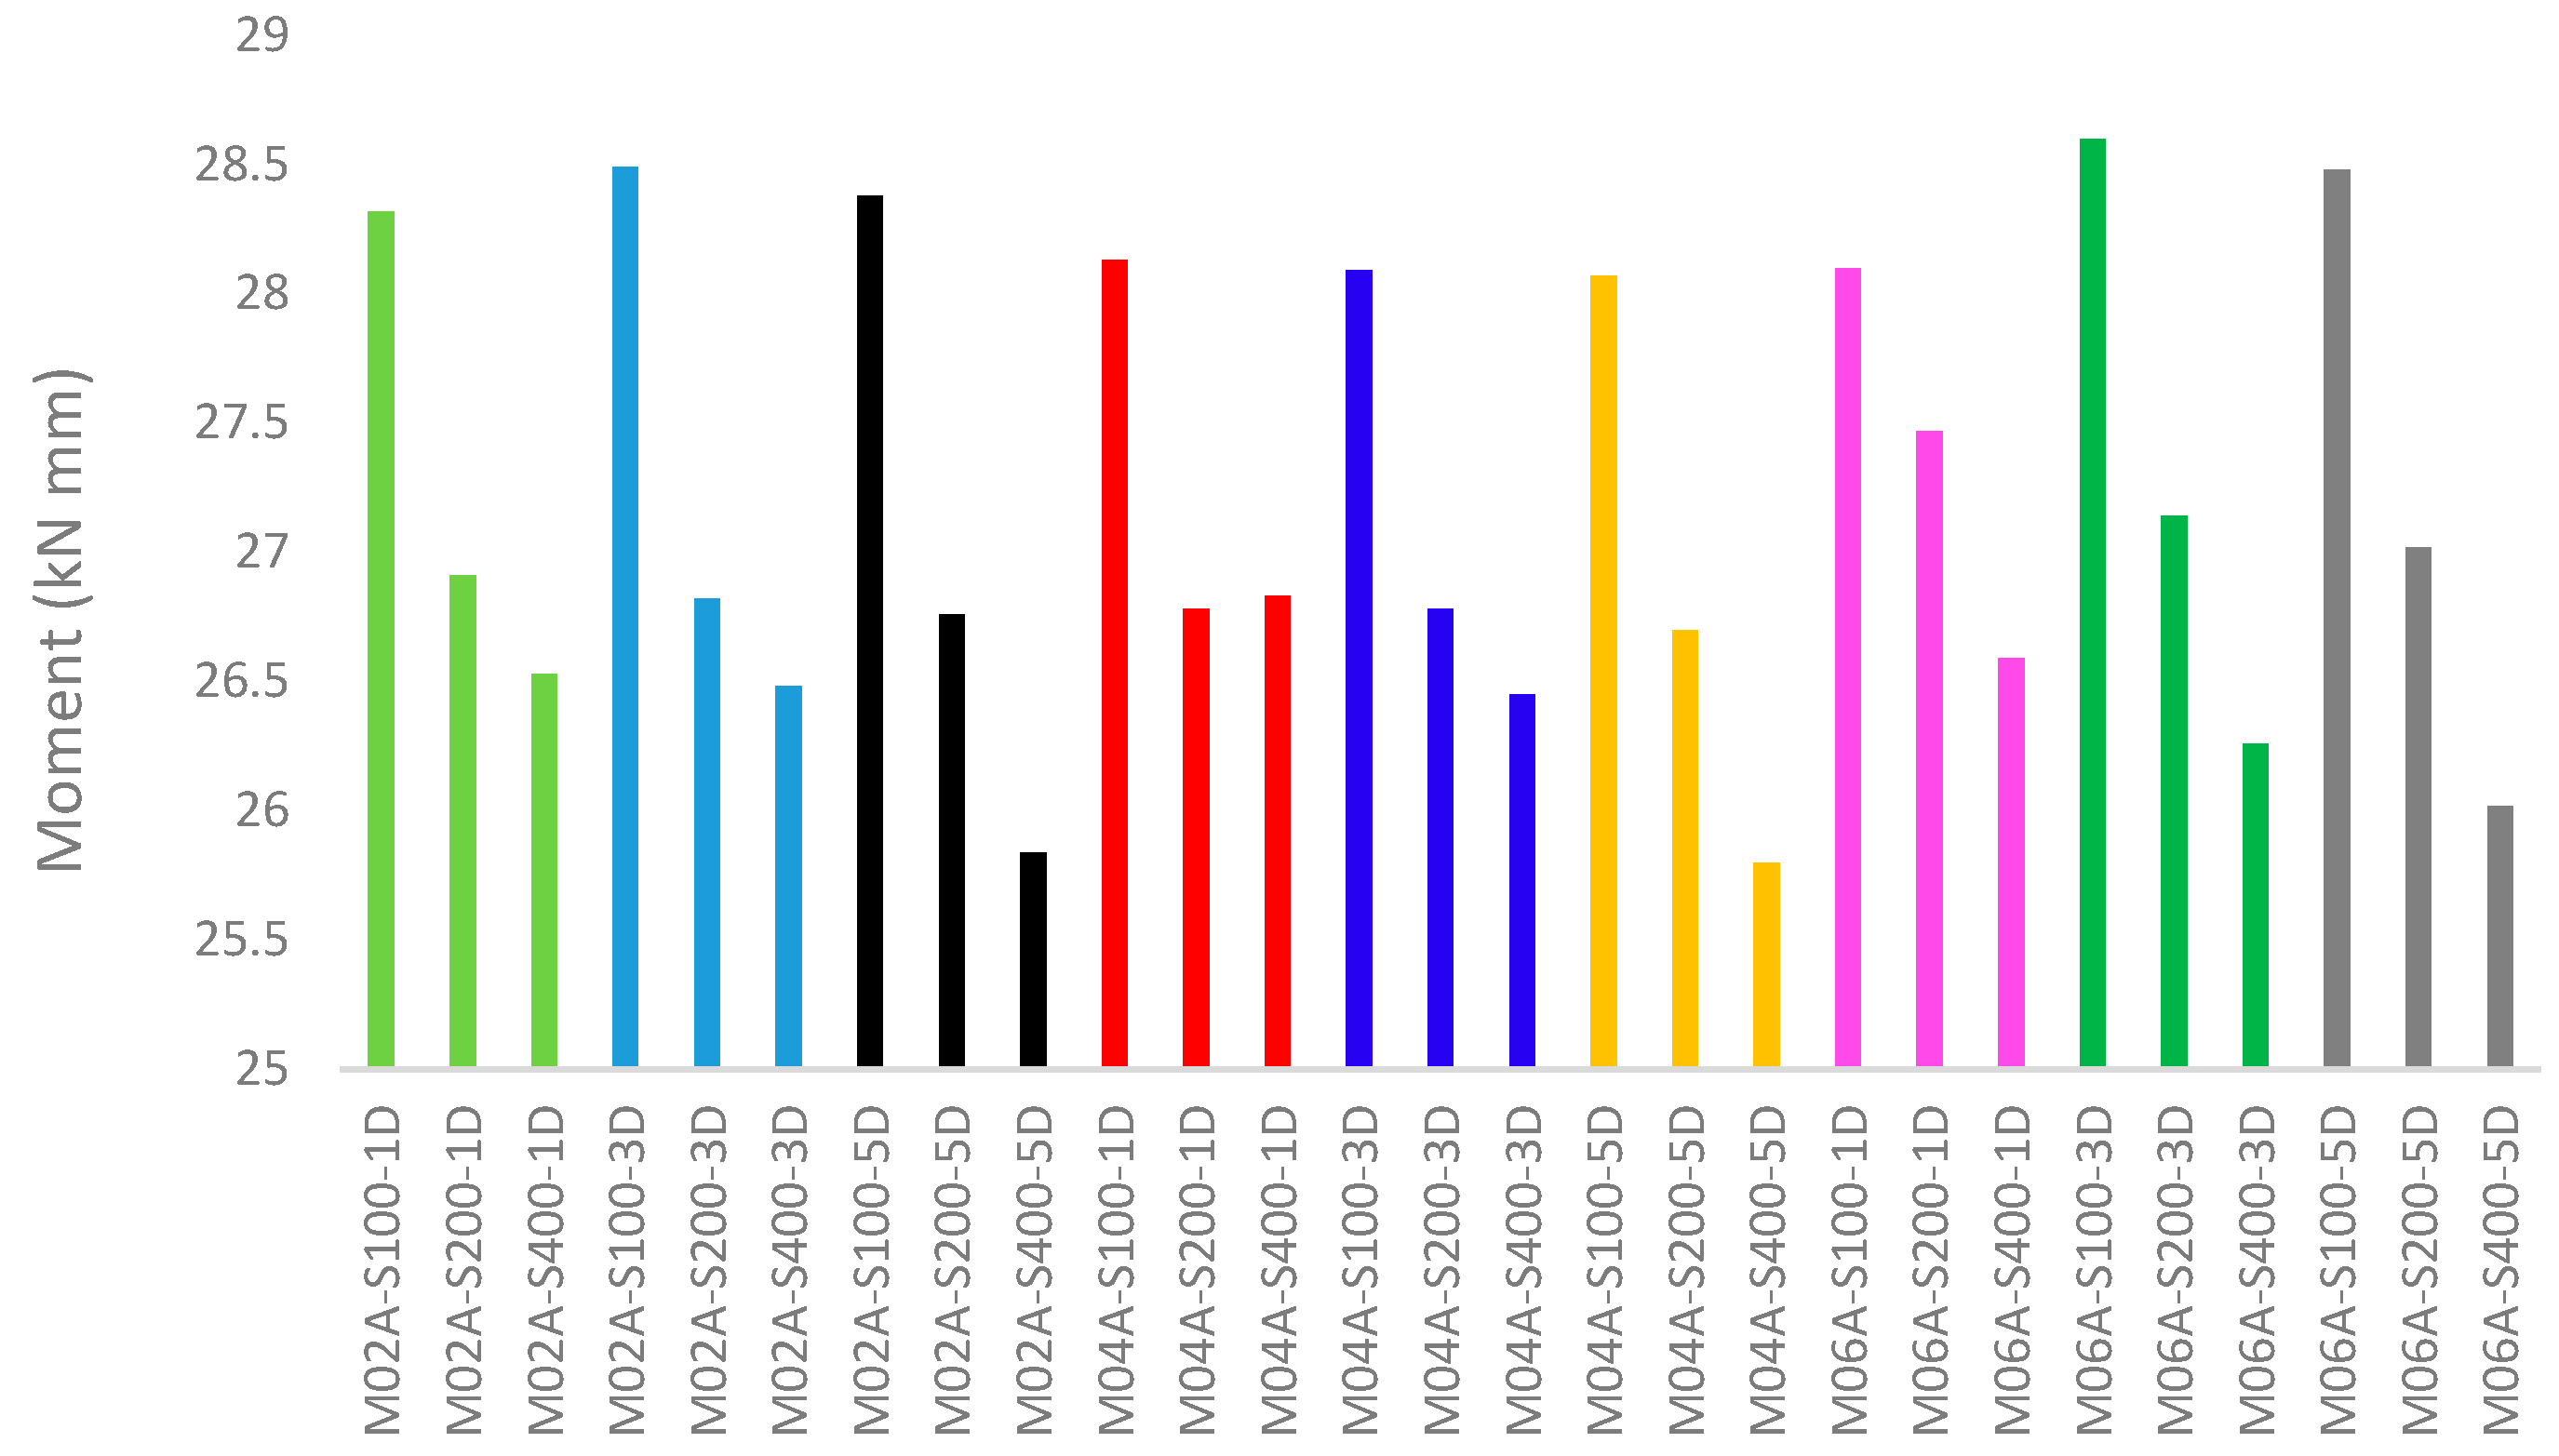
In the models without web holes, an average increase of 4% in moment values was observed when transitioning from self-drilling screw connections spaced at 100 mm to those spaced at 400 mm. For the M02A series, models with one web hole experienced a 4% decrease, while those with three and five web holes showed reductions of 3%. In the M04A models, a decrease of 4% was measured for models with one and three web holes, and a 10% reduction for those with five holes. Similarly, for the M06A models, a decrease of 6% was noted for models with one web hole, 3% for those with three holes, and 10% for those with five holes. Overall, it is evident that the number of web holes has a significant impact on ductility (Figure 14 and Figure 15).

6. Moment Estimation of Statistical Evaluation

In this study, the effect of increasing the number of bolt holes (1, 3, and 5) on the structural moment capacity of the M02A connection profile was comparatively investigated for different screw spacings (100 mm, 200 mm, and 400 mm) in Table 4. The obtained results indicate a systematic decrease in both calculated and estimated moment values with the increase in the number of holes across all screw spacing configurations. This reduction clearly demonstrates that an increase in the number of holes weakens the structural stiffness and adversely affects the moment-bearing capacity, consistent with reported findings [32], which emphasized that discontinuities such as holes significantly reduce the effective cross-sectional area and stiffness of connection elements. Moreover, the small magnitude of error values and the proximity of the average error to zero indicate that the estimated moment values were obtained with high overall accuracy. However, it was observed that the error deviation increased with the number of holes at the 200 mm screw spacing, suggesting that the connection behavior in this configuration is more variable and that the estimation is less stable, a phenomenon also noted in previous parametric studies on bolted joints [33].
Regarding the effect of screw spacing, it was observed that for the same number of holes, wider spacings generally resulted in lower moment values and reduced joint stiffness, aligning with experimental and numerical studies [34], which highlighted the detrimental impact of increased fastener spacing on joint rigidity. Nevertheless, the low standard deviation and narrow confidence interval obtained at the 400 mm screw spacing indicate that this configuration yields more stable results in terms of modeling. In particular, the limited variation in errors at the 400 mm spacing suggests that this configuration is more tolerant to changes in the number of holes. In contrast, the noticeable increase in error deviations with increasing hole numbers at the 200 mm spacing indicates that this configuration exhibits more sensitive and variable structural behavior. Overall, it is concluded that both the number of holes and screw spacing play a significant role in structural performance; thus, these parameters should be jointly optimized to enhance both load-bearing capacity and modeling accuracy [35,36]

7. Conclusions

Built-up box-section beams, created with lipped and unlipped C-sections, were analyzed using the ABAQUS finite element program. The influence of the spacing of smart screw connectors, the number of web holes, and the size of the web holes on the structural behavior was investigated; the results are summarized below.
  • An increase in the spacing of the self-drilling screw resulted in significant changes in the Von Mises stress values within the element, whereas an increase in the number of holes in the web led to relatively minor variations in stress.
  • In the M0A, M02A, M04A, and M06A series, it was observed that variations in the a/d ratio had an impact of less than 2% on the stress distribution within the cross-section. These results indicate that screw spacing has a more pronounced effect on the stress values in the element compared to the a/d ratio.
  • Changes in PEEQ values based on screw spacing and hole configurations were minimal in elements with S100 and S200 screw spacing, whereas variations ranged from 10% to 33% for the S400 spacing. Additionally, as the a/d ratio increased, the PEEQ ratio exhibited an average variation of approximately 10% across the S100, S200, and S400 series.
  • An examination of the models used in this study reveals that plastic hinges tend to concentrate in the regions subjected to loading.
  • In the M02A, M04A, and M06A series, as the spacing between the smart screws increases, the S23 stress value in the smart screws also increases. Conversely, as the a/d ratio increases in these series, the S23 stress values decrease. An examination of the models used in the study indicates that S23 stress values vary inversely with the Von Mises and PEEQ values.
  • In the model series analyzed in the study, an increase in screw spacing led to a 3.5% reduction in ductility in the M0A series, while the M02A series exhibited an increase in ductility ranging from 4% to 5%. The M04A series showed increases between 5% and 13%, and the M06A series demonstrated increases ranging from 5% to 20%.
  • In the M02A, M04A, and M06A series, as the spacing between the smart screws increases, the maximum moment capacity decreases by varying amounts in the range of 5% to 10%. It was observed that changes in the a/d ratio had an impact of less than 2% on the maximum moment values in the M02A, M04A, and M06A series. Similarly, increases in the number of web holes in these series resulted in a variation of less than 2% in the maximum moment values within the elements.
  • Increasing screw spacings led to a reduction in estimated moment capacity across all screw spacing configurations, with the most significant error deviations observed at the 200 mm spacing. This indicates reduced structural stiffness and decreased prediction accuracy. In contrast, the 400 mm spacing provided more stable estimations with lower variance.
  • Increasing the number of holes from 1 to 3 results in an approximate reduction of 7% to 10% in the numerical moment capacity. This decrease is primarily attributed to the loss of effective cross-sectional area and the stress concentrations around the holes, clearly demonstrating the negative impact of higher hole numbers on flexural performance.
  • The numerical results demonstrate that increasing the number of holes leads to a decrease in moment capacity due to the reduction in effective cross-sectional area and an increase in local stress concentrations. Additionally, a smaller screw distance generally results in higher moment capacities, as closer screw spacing enhances the composite action and stiffness of the built-up sections. Conversely, larger screw distances slightly reduce the moment capacity, especially when combined with a higher number of holes. These findings highlight the combined effect of connection detailing and web perforations on the flexural behavior of the sections.
  • Considering the design conditions, it was found that a screw spacing of 200 mm provides an optimal design. In lightweight steel beam elements, the number of holes in the web was not identified as a highly influential parameter on the bending behavior; however, it is recommended that such modifications be made as necessary.

8. Recommendations

Future researchers can evaluate the seismic performance of the built-up box sections with different screw configurations and web hole geometries by examining their cyclic loading behavior. In addition, experimental verifications, including full-scale physical tests, can be conducted to further validate the numerical findings and improve design recommendations. Furthermore, the effects of other geometric imperfections, such as corrosion or temperature changes, on the strength of the joint in this study can be investigated experimentally and via FEM analysis.

Author Contributions

Z.Y. contributed to conceptualization, data curation, investigation, methodology, project administration, writing—original draft, writing—review & editing, and visualization. M.M. contributed to conceptualization, data curation, investigation, methodology, project administration, writing—original draft, writing—review & editing, and visualization. E.A. (Ekin Abanoz) contributed to software development, investigation, project administration, and validation. E.A. (Elif Ağcakoca) contributed to conceptualization, data curation, investigation, methodology, project administration, writing—original draft, writing—review & editing, and visualization. M.S.S. contributed to software development, project administration, writing—review & editing, and validation. T.F.Ç. contributed to software development, data curation, formal analysis, investigation, project administration, writing—original draft, and writing—review & editing. All authors have read and agreed to the published version of the manuscript.

Funding

This research received no external funding.

Data Availability Statement

The data that support the findings of this study are available from the corresponding author upon reasonable request.

Acknowledgments

The authors would like to express their sincere gratitude to Maali Çelik Ar-Ge Danışmanlık, Mühendislik, İnşaat Taahhüt, and Tarım ve Hayvancılık Company, located at Atateknokent, Erzurum, Turkey, for their valuable support and contribution to this study. The authors would like to express their sincere gratitude to Erkay Teknoloji Geliştirme Hizmetleri Ltd. Şti, located at Teknokent Yerleşkesi A Blok No:118, Sakarya, Turkey, for their valuable support and contribution to this study.

Conflicts of Interest

Author Mahyar Maali was employed by the company Maali Çelik Ar-Ge Danışmanlık, Müh. Ins. Taah. Tarım ve Hayvancılık Company. Author Türker Fedai Çavuş was employed by the company Erkay Technology Development Services Co., Ltd. The remaining authors declare that the research was conducted in the absence of any commercial or financial relationships that could be construed as a potential conflict of interest.

References

  1. Wu, H.; Sui, L.; Liu, X.; Liang, S.; Zhou, T. Shear-slip constitutive model of screw-fastened connections and application in numerical analysis of built-up back-to-back cold-formed steel columns. Thin-Walled Struct. 2023, 186, 110710. [Google Scholar] [CrossRef]
  2. Li, Y.; Yao, X. Shear behavior of screw connections for cold-formed thin-walled steel structures. Thin-Walled Struct. 2010, 48, 897–906. [Google Scholar]
  3. Yan, S.; Young, B. Screwed connections of thin sheet steels at elevated temperatures—Part I: Steady state tests. Eng. Struct. 2012, 35, 234–243. [Google Scholar] [CrossRef]
  4. Moen, C.D.; Padilla-Llano, D.A.; Corner, S.; Ding, C. Towards Load-Deformation Models for Screw-Fastened Cold-Formed Steel-to-Steel Shear Connections. In Proceedings of the International Specialty Conference on Cold-Formed Steel Structures, St. Louis, MO, USA, 5–6 November 2014; p. 6. Available online: https://scholarsmine.mst.edu/isccss/22iccfss/session10/6 (accessed on 1 June 2024).
  5. Huynh, M.T.; Pham, C.H.; Hancock, G.J. On the finite element modeling of the screwed connections of cold-formed steel. In Congrès International de Géotechnique-Ouvrages-Structures; Springer: Singapore, 2017; pp. 224–232. [Google Scholar] [CrossRef]
  6. Roy, K.; Lau, H.H.; Ting, T.C.H.; Masood, R.; Kumar, A.; Lim, J.B. Experiments and finite element modelling of screw pattern of self-drilling screw connections for high strength cold-formed steel. Thin-Walled Struct. 2019, 145, 106393. [Google Scholar] [CrossRef]
  7. Chen, W.; Ye, J.; Zhao, M. Steady- and transient-state response of cold-formed steel-to-steel screwed connections at elevated temperatures. J. Constr. Steel Res. 2018, 144, 13–20. [Google Scholar] [CrossRef]
  8. American Iron and Steel Institute (AISI). AISI S240, North American Standard for Cold-Formed Steel Structural Framing; AISI: Washington, DC, USA, 2015. [Google Scholar]
  9. Chung, K.F.; Lau, L. Experimental investigation on bolted moment connections among cold-formed steel members. Eng. Struct. 1999, 21, 898–911. [Google Scholar] [CrossRef]
  10. Zhao, J.; Sun, K.; Yu, C.; Wang, J. Tests and direct strength design on cold-formed steel channel beams with web holes. Eng. Struct. 2019, 184, 434–446. [Google Scholar] [CrossRef]
  11. Chen, B.; Roy, K.; Uzzaman, A.; Lim, J.B. Moment capacity of cold-formed channel beams with edge-stiffened web holes, un-stiffened web holes and plain webs. Thin-Walled Struct. 2020, 157, 107070. [Google Scholar] [CrossRef]
  12. Dissanayake, D.M.M.P.; Poologanathan, K.; Gunalan, S.; Tsavdaridis, K.D.; Wanniarachchi, K.S.; Nagaratnam, B. Bending-shear interaction of cold-formed stainless steel lipped channel sections. Structures 2021, 30, 1042–1055. [Google Scholar] [CrossRef]
  13. Fang, Z.; Roy, K.; Uzzaman, A.; Lim, J.B. Numerical simulation and proposed design rules of cold-formed stainless steel channels with web holes under interior-one-flange loading. Eng. Struct. 2022, 252, 113566. [Google Scholar] [CrossRef]
  14. Wang, L.; Li, J.; Luo, C.; Cao, X.; Wang, H. Experimental and numerical study on the shear behavior of web perforated cold-formed steel beams. Structures 2022, 45, 2117–2136. [Google Scholar] [CrossRef]
  15. Öztürk, F.; Mojtabaei, S.M.; Şentürk, M.; Pul, S.; Hajirasouliha, I. Buckling behaviour of cold-formed steel sigma and lipped channel beam–column members. Thin-Walled Struct. 2022, 173, 108963. [Google Scholar] [CrossRef]
  16. British Standards Institution. BS EN 10002-1:2001 Tensile Testing of Metallic Materials—Method of Test at Ambient Temperature; BSI: London, UK, 2001. [Google Scholar]
  17. Aktepe, R.; Erkal, B.G. State-of-the-art review on measurement techniques and numerical modeling of geometric imperfections in cold-formed steel members. J. Constr. Steel Res. 2023, 207, 107942. [Google Scholar] [CrossRef]
  18. Aktepe, R.; Erkal, B.G. Prediction of the initial geometric imperfection magnitudes for numerical modeling of cold-formed steel channel sections. Structures 2024, 60, 105869. [Google Scholar] [CrossRef]
  19. Mei, Y.; Cui, Y.; Ma, C.; Sun, Y.; Su, A. Tests, numerical simulations and design of G550 high strength cold-formed steel lipped channel section columns failing by interactive buckling. Thin-Walled Struct. 2023, 192, 111172. [Google Scholar] [CrossRef]
  20. Selvam, J.; Vajravelu, A.; Nagapan, S.; Arumugham, B.K. Analyzing the Flexural Performance of Cold-Formed Steel Sigma Section Using ABAQUS Software. Sustainability 2023, 15, 4085. [Google Scholar] [CrossRef]
  21. Samuel, J.; Nair, S.R.; Joanna, P.S.; Gurupatham, B.G.A.; Roy, K.; Lim, J.B.P. Composite Cold-Formed Steel Beams with Diagonal Rebars for Earthquake-Resistant Buildings. Materials 2023, 16, 3002. [Google Scholar] [CrossRef]
  22. Liu, R.-G.; Xu, B.; Zhang, F.; Peng, S.-N.; Yang, C.; Chen, M.-W.; Chen, S.-H.; Xie, M.-Z. Experimental Study of the Bending Performance of Cold-Formed Steel Channel Beams Considering the Corner Hardening Effect. Buildings 2023, 13, 2149. [Google Scholar] [CrossRef]
  23. Chen, T.; Chen, Z.; Liu, J.; Zhang, A. Bending Properties of Cold-Formed Thin-Walled Steel/Fast-Growing Timber Composite I-Beams. Forests 2024, 15, 857. [Google Scholar] [CrossRef]
  24. Sato, A.; Kitagawa, H. Seismic Design Procedure for Low-Rise Cold-Formed Steel–Special Bolted Moment Frames. Appl. Sci. 2024, 14, 4520. [Google Scholar] [CrossRef]
  25. Dubina, D.; Ungureanu, V. Effect of imperfections on numerical simulation of instability behaviour of cold-formed steel members. Thin-Walled Struct. 2002, 40, 239–262. [Google Scholar] [CrossRef]
  26. Peköz, T.; Schafer, B.W. Computational Modeling of Cold-Formed Steel: Characterizing Geometric Imperfections and Residual Stresses. J. Constr. Steel Res. 1998, 47, 193–210. [Google Scholar] [CrossRef]
  27. Dassault Systèmes Simulia Corp. ABAQUS/CAE, version 6.12; Dassault Systèmes: Providence, RI, USA, 2016. [Google Scholar]
  28. Wang, W.; Roy, K.; Rezaeian, H.; Fang, Z.; Lim, J.B. Experimental and numerical investigation of cold-formed steel telescopic studs under compression. J. Constr. Steel Res. 2024, 212, 108279. [Google Scholar] [CrossRef]
  29. Abanoz, E. Effect of Flexural Behavior of Circular Holes Opened in the Body of Cold-Formed Beams: Finite Element Analyzes. Master’s Thesis, Science Institute-Sakarya University, Sakarya, Turkiye, 2024. [Google Scholar]
  30. Sayed, A.M. Numerical study of the effects of web openings on the load capacity of steel beams with corrugated webs. J. Constr. Steel Res. 2022, 196, 107418. [Google Scholar] [CrossRef]
  31. Sayed, A.M.; Aljarbou, M.H. Numerical study of the effect of circular openings in the upper surface of rectangular hollow flange steel beams on the sectional moment capacity. Results Eng. 2024, 24, 103620. [Google Scholar] [CrossRef]
  32. Chen, W.F.; Lui, E.M. Principles of Structural Design; CRC Press: Boca Raton, FL, USA, 2005. [Google Scholar] [CrossRef]
  33. Ding, B.; Zhao, Y.; Huang, Z.; Cai, L.; Wang, N. Tensile bearing capacity for bolted spherical joints with different screwing depths of high-strength bolts. Eng. Struct. 2020, 225, 111255. [Google Scholar] [CrossRef]
  34. Coelho, A.M.G.; Bijlaard, F.S. Experimental behaviour of high strength steel end-plate connections. J. Constr. Steel Res. 2007, 63, 1228–1240. [Google Scholar] [CrossRef]
  35. EN 1993-1-8; Eurocode 3: Design of Steel Structures—Part 1–8: Design of Joints. European Committee for Standardization: Brussels, Belgium, 2005.
  36. Federal Emergency Management Agency (FEMA). FEMA 350, Recommended Seismic Design Criteria for New Steel Moment-Frame Buildings; FEMA: Washington, DC, USA, 2000.
Figure 1. Abaqus validation model experimental setup and cross-sectional details [11].
Buildings 15 03101 g001
Figure 2. FEM model of the test specimen and boundary conditions.
Buildings 15 03101 g002
Figure 3. Verified experiments and validation graphs.
Buildings 15 03101 g003
Figure 4. Buckling modes defined as imperfections.
Buildings 15 03101 g004
Figure 5. FEM model of the developed built-up box section for the parametric study.
Buildings 15 03101 g005
Figure 6. Label details of the test specimens.
Buildings 15 03101 g006
Figure 7. Finite element models of the test specimens.
Buildings 15 03101 g007
Figure 8. Von Mises stress distributions for all models.
Buildings 15 03101 g008aBuildings 15 03101 g008b
Figure 9. Images of equivalent plastic strains (PEEQ) for the M0A series (a), PEEQ chart for all series (b).
Buildings 15 03101 g009aBuildings 15 03101 g009b
Figure 10. Yield stress results in the M0A series.
Buildings 15 03101 g010
Figure 11. Distribution of shear stress of the self-drilling screws in the parametric study.
Buildings 15 03101 g011aBuildings 15 03101 g011b
Figure 12. Distribution of S23 stress values for all samples in the parametric study.
Buildings 15 03101 g012
Figure 13. Ductility changes in the samples used in the parametric study.
Buildings 15 03101 g013
Figure 14. Moment–displacement graphs of all specimens used in the parametric study.
Buildings 15 03101 g014
Figure 15. Moment variation in all samples.
Buildings 15 03101 g015
Table 1. Details of mechanical properties of cold-formed and G500 self-tapping screws [6,11].
Buildings 15 03101 i001Buildings 15 03101 i002CouponYoung’s Modulus (MPa)Yield Stress
(MPa)
Ultimate Strength
(MPa)
Poisson’s
Ratio
Corner Coupon210,052363.4431.80.3
Web Coupon192,057332.8420.50.3
G500-
Self-drilling screws
208,000500520
Table 2. Details of the parametric study model.
Modela/dNumber of Web HolesWeb Diameter (mm)Diameter
(mm)
Spacing (mm)Number of Screws
(For a Single Head of a Built-Up Box Profile)
M0A-S100---3.1410037
M0A-S200---20019
M0A-S400---40010
M02A-S100-1D0.214810037
M02A-S200-1D0.214820019
M02A-S400-1D0.214840010
M02A-S100-3D0.234810037
M02A-S200-3D0.234820019
M02A-S400-3D0.234840010
M02A-S100-5D0.254810037
M02A-S200-5D0.254820019
M02A-S400-5D0.254840010
M04A-S100-1D0.419610037
M04A-S200-1D0.419620019
M04A-S400-1D0.419640010
M04A-S100-3D0.439610037
M04A-S200-3D0.439620019
M04A-S400-3D0.439640010
M04A-S100-5D0.459610037
M04A-S200-5D0.459620019
M04A-S400-5D0.459640010
M06A-S100-1D0.619610037
M06A-S200-1D0.619620019
M06A-S400-1D0.619640010
M06A-S100-3D0.639610037
M06A-S200-3D0.639620019
M06A-S400-3D0.639640010
M06A-S100-5D0.659610037
M06A-S200-5D0.659620019
M06A-S400-5D0.659640010
Table 3. Analysis results for all samples.
ModelVon Mises Stress
(MPa)
Equivalent Plastic DeformationS23 Stress at Self-Drilling Screws—
(MPa)
ToughnessDuctilityMoment
(kN.mm)
M0A-S100431.510.17236.46637.37378.2428.29
M0A-S200421.860.13190.38617.65388.2426.77
M0A-S400418.620.11228.3607.62392.1126.48
M02A-S100-1D423.660.14205.97628.46367.4328.32
M02A-S200-1D422.50.13195.58620.5376.1526.91
M02A-S400-1D4000.1234.55613.3387.4926.53
M02A-S100-3D430.40.13163.71634.76371.2128.49
M02A-S200-3D421.910.13189.99616.23388.8326.82
M02A-S400-3D413.380.1237.94609.44387.1926.48
M02A-S100-5D431.760.14163637.38372.9728.38
M02A-S200-5D427.290.13193.39617.68391.7526.76
M02A-S400-5D421.640.12228.31607.89389.4225.84
M04A-S100-1D429.520.15164.08624.46367.6828.13
M04A-S200-1D421.710.13190.79618.68382.7226.78
M04A-S400-1D413.230.09237.23613.71387.4526.83
M04A-S100-3D429.670.15207.68627.17362.3728.09
M04A-S200-3D421.820.13190.52618.38386.3226.78
M04A-S400-3D375.490.1219.04285.39403.4726.45
M04A-S100-5D426.950.15155.13617.15357.5428.07
M04A-S200-5D422.930.14188.26616.15388.8826.7
M04A-S400-5D419.740.12215.45632.12411.7625.8
M06A-S100-1D431.720.16209.02625.17363.7128.1
M06A-S200-1D431.80.12195.24620.87385.627.47
M06A-S400-1D417.690.09236.21613.71398.3226.59
M06A-S100-3D431.80.19168.21646.06365.8128.6
M06A-S200-3D429.940.12194.78619.37375.3427.14
M06A-S400-3D416.340.11209.27620.18383.7626.26
M06A-S100-5D428.190.13146.58639.59360.7728.48
M06A-S200-5D422.210.12144.53618.95374.6227.02
M06A-S400-5D413.450.08154.27672.25455.8526.02
Table 4. Statistical evaluation of moment estimation for varying screw spacing and hole numbers.
M02AScrew DistanceHole NumberNumerical MomentEstimated MomentError
(e)
Mean
Error
Standard DeviationE.Q. Distribution Standard DeviationT TableLower LimitUpper Limit
100128.6228.6170.003−1.18E-155.77E-034.08E-039.92E+00−4.05E-024.05E-02
228.4928.497−0.007
328.3828.3770.003
200129.6126.9050.005−2.38E-158.66E-036.12E-039.92E+00−6.08E-026.08E-02
226.8226.830−0.01
326.7626.7550.005
400126.5326.5280.002−1.18E-152.89E-032.04E-039.92E+00−2.03E-022.03E-02
226.1826.183−0.003
325.8425.8380.002
M04AScrew DistanceHole NumberNumerical MomentEstimated MomentError (e)Mean ErrorStandard DeviationE.Q. Distribution Standard DeviationT TableLower LimitUpper Limit
100128.1328.1270.003−3.55E-155.77E-034.08E-039.92E+00−4.05E-024.05E-02
228.0928.097−0.007
328.0728.0670.003
200126.7826.783−0.003−3.55E-155.77E-034.08E-039.92E+00−4.05E-024.05E-02
226.7526.7430.007
326.7026.703−0.003
400126.8326.858−0.0280.00E+004.91E-023.47E-029.92E+00−3.44E-013.44E-01
226.4026.3430.057
325.8025.8280.028
M06AScrew DistanceHole NumberNumerical MomentEstimated MomentError (e)Mean ErrorStandard DeviationE.Q. Distribution Standard DeviationT TableLower LimitUpper Limit
100129.1029.0730.0270.00E+004.62E-023.27E-029.92E+00−3.24E-013.24E-01
228.7128.763−0.053
328.4828.4530.027
200127.4727.488−0.018−2.37E-153.18E-022.25E-029.92E+00−2.23E-012.23E-01
227.3027.2630.037
327.0227.038−0.018
400126.5926.5750.015−1.18E-152.60E-021.84E-029.92E+00−1.82E-011.82E-01
226.2626.290−0.030
326.0226.0050.015
Disclaimer/Publisher’s Note: The statements, opinions and data contained in all publications are solely those of the individual author(s) and contributor(s) and not of MDPI and/or the editor(s). MDPI and/or the editor(s) disclaim responsibility for any injury to people or property resulting from any ideas, methods, instructions or products referred to in the content.