Article

Random Wind Vibration Control of Transmission Tower-Line Systems Using Shape Memory Alloy Damper

School of Civil Engineering and Architecture, Wuhan University of Technology, Wuhan 430070, China
*
Author to whom correspondence should be addressed.
Buildings 2025, 15(17), 3091; https://doi.org/10.3390/buildings15173091
Submission received: 16 July 2025 / Revised: 12 August 2025 / Accepted: 26 August 2025 / Published: 28 August 2025
(This article belongs to the Special Issue Dynamic Response Analysis of Structures Under Wind and Seismic Loads)

Abstract

Shape memory alloy dampers (SMADs) are widely applied in structural vibration control due to their excellent superelastic properties. However, there has been no research on the random wind-induced vibration control of transmission tower-line (TTL) systems with added SMADs. To address this gap, this paper proposes an analytical framework for the wind-induced vibration control of TTL systems with SMADs under random wind loads. An analytical model for the coupled TTL system is developed. The constitutive relationship of the SMAD is derived using the statistical linearization method, and a vibration control approach for the TTL-coupled system with SMADs is proposed. The vibration response of the TTL–SMAD system under random wind loads is derived, and an extreme response analysis framework based on the first exceedance failure criterion is established. The results show that the optimal installation scheme for the SMAD achieves a vibration reduction of more than 30%. When the damper’s stiffness coefficient is approximately 1, the SMAD effectively controls the vibrations. Moreover, a service temperature of 0 °C is found to be the optimal control temperature for the SMAD. These findings provide important references for the application of SMADs in the vibration control of TTL systems.

1. Introduction

Transmission tower-line (TTL) systems serve as the primary channel for electrical power transmission and are critical to the normal operation and development of modern society. Due to their high flexibility and low damping characteristics, transmission towers are sensitive to strong wind loads, which may cause excessive vibrations, leading to the risk of damage and collapse [1,2,3,4]. To enhance the wind resistance of transmission towers, active control dampers have been applied to control the vibrations of transmission towers [5,6,7], but these dampers encounter limitations, such as the need for a power supply to provide current and high maintenance costs. To meet more practical application needs, passive devices have been widely used. Sheng et al. [8] and Zeng et al. [9] studied the installation of viscoelastic dampers in TTL systems, effectively suppressing the wind-induced vibration response of transmission towers. Chen et al. [10] used friction dampers for the vibration control and performance evaluation of TTL systems under wind excitation, finding that the optimal parameters significantly reduced the wind-induced vibrations of the transmission towers. Zhang et al. [11] applied a pounding tuned mass damper (TMD) to control the structural vibrations of transmission towers. Although these dampers have achieved good results to some extent, they still face some drawbacks. For instance, viscoelastic dampers have poor fatigue resistance and are prone to aging; friction dampers have poor reset characteristics; TMD requires a large additional mass, occupies space, and can only alleviate vibrations at the tuned mode, unable to mitigate the global dynamic response [12]. Moreover, metal yielding dampers tend to exhibit large residual deformations [13].
Shape memory alloy (SMA) is a metal alloy material with special shape memory capabilities and superelastic properties [14,15]. Based on the excellent performance of SMA, many researchers have developed SMA-based devices such as SMA dampers (SMADs) [16] and SMA braces [17,18] for vibration control. SMADs, with SMA as the primary energy dissipation element, can effectively operate in extremely harsh environments, and compared to other dampers, they have a relatively long service life. They have been widely applied in vibration control for various types of structures. Huang and Chang [19,20] used SMA-TMD in structures, significantly improving the effectiveness of vibration control. A substantial amount of research has also been conducted on the application of SMADs in the vibration control of transmission tower structures. Chen et al. [21] explored wind-induced vibration control based on SMADs, considering the dynamic interaction between transmission lines and transmission towers. Wu et al. [22] studied the seismic response of a tall truss tower controlled by SMADs. Tian et al. [3] developed an SMA-TMD to reduce wind-induced vibrations in large-span TTL systems. These studies indicate that the application of SMA dampers for wind vibration control in TTL systems holds promising potential. However, most research has focused on vibration control of TTL–SMAD systems under one or a few deterministic wind load time histories.
Owing to the highly stochastic nature of wind loads, wind-induced responses obtained through random vibration theory carry clear statistical significance. Accordingly, parameter studies on the control performance of dampers under stochastic wind loading are of greater engineering relevance than those conducted under deterministic wind loading. For structural random dynamic response problems, Lin et al. [23,24] proposed an efficient Pseudo Excitation Method (PEM), which transforms the analysis of random vibrations into harmonic or transient analysis. This method has been widely applied in the random wind vibration response analysis of structures and bridges. Hu et al. [25] systematically studied the buffeting response of large-span bridges under the influence of typhoons in complex terrain, based on the PEM framework. Zhao et al. [26] combined PEM with Fast Fourier Transform to calculate the wind-induced buffeting response of bridges. Some researchers have also developed frequency-domain response calculation formulas for transmission towers under downburst wind loads using modal analysis methods [27]. However, their research mainly focuses on individual transmission towers, overlooking the coupling effects within the tower-line systems.
SMAD exhibits nonlinear behavior and introduces non-orthogonality in the damping of the TTL–SMAD system, making the modal superposition method unsuitable for solving the vibration equations of the TTL–SMAD system. Therefore, this paper proposes an analytical framework for the wind-induced vibration control of TTL–SMAD systems under random wind loads. An analytical model for the coupled TTL system is developed, and the nonlinear constitutive relationship of the SMAD is modeled as a linear system using the statistical linearization method. A vibration control approach for the TTL-coupled system using SMADs is proposed. An analysis framework is established to solve the random wind-induced vibration response of the TTL–SMAD system and assess the extreme response of the system in a probabilistic sense. A detailed parametric study is conducted to determine the optimal installation scheme for the SMAD, and the effects of damper stiffness and service temperature on the random wind-induced vibration response of the TTL system are also examined.

2. TTL–SMAD System Model

2.1. TTL-Coupled System Model

Modern finite element software is capable of a detailed three-dimensional modeling of the TTL system model, as shown in Figure 1a. However, a random wind-induced vibration analysis of a refined TTL model is inherently computationally intensive. To address this, an efficient dynamic analysis model for transmission lines has been developed based on Hamilton’s principle and Lagrange’s equations [28]. This efficient model takes the form of a simplified multi-degree-of-freedom (MDOF) representation. This model is sufficient to capture the primary dynamic characteristics of the TTL-coupled system. It also facilitates extensive comparisons of damper control schemes and parameter studies. The dynamic response of transmission towers is typically analyzed using a two-dimensional MDOF model, as shown in Figure 1b.
In the in-plane direction, the transmission line is discretized into an MDOF system consisting of lumped mass units and elastic components. The system’s kinetic and potential energy are described using Lagrange’s equation, which is then used to compute the mass matrix, M l i n , and the stiffness matrix, K l i n , for the transmission line in the plane direction [28]. The MDOF model for the coupled system of the transmission tower and transmission line in the in-plane direction is shown in Figure 1c. By applying Lagrange’s equations, the mass and stiffness matrices of the entire coupled system can be obtained [6,28]:
M i n = M l i n M l c T M l c M t i n M r c M r c T M l in ;   K i n = diag K l i n K t i n K l i n
where the superscript T denotes the transpose, the subscripts lc and rc denote left coupling and right coupling, respectively, the subscript t denotes the tower, and the subscript l denotes the line.
In the out-of-plane direction, the coupled TTL system is shown in Figure 1d. The calculation model of the transmission line is simplified to a vertical chain system. The mass matrix, M l o u t , and the stiffness matrix, K l o u t , of the vertical chain are given as follows:
M l o u t = diag m 1 m 2 m 3 m 4
K l o u t = m 1 g l 1 m 1 g l 1 m 1 g l 1 m 1 g l 1 + m 1 + m 2 g l 2 m 1 + m 2 g l 2 m 1 + m 2 g l 2 m 1 + m 2 g l 2 + m 1 + m 2 + m 3 g l 3 m 1 + m 2 + m 3 g l 3 m 1 + m 2 + m 3 g l 3 m 1 + m 2 + m 3 g l 3 + m 1 + m 2 + m 3 + m 4 g l 4
where m1, m2, m3, and m4 denote the masses of the vertical chain, l1, l2, l3, and l4 denote the lengths of the vertical chain, and g denotes the gravitational acceleration.
The mass matrix, Mout, and the stiffness matrix, Kout, of the coupled TTL system are as follows:
M o u t = diag M l o u t M t o u t M l o u t ;   K o u t = K l o u t K l c T K l c K t o u t K r c K r c T K l o u t

2.2. Constitutive Relationship of SMAD

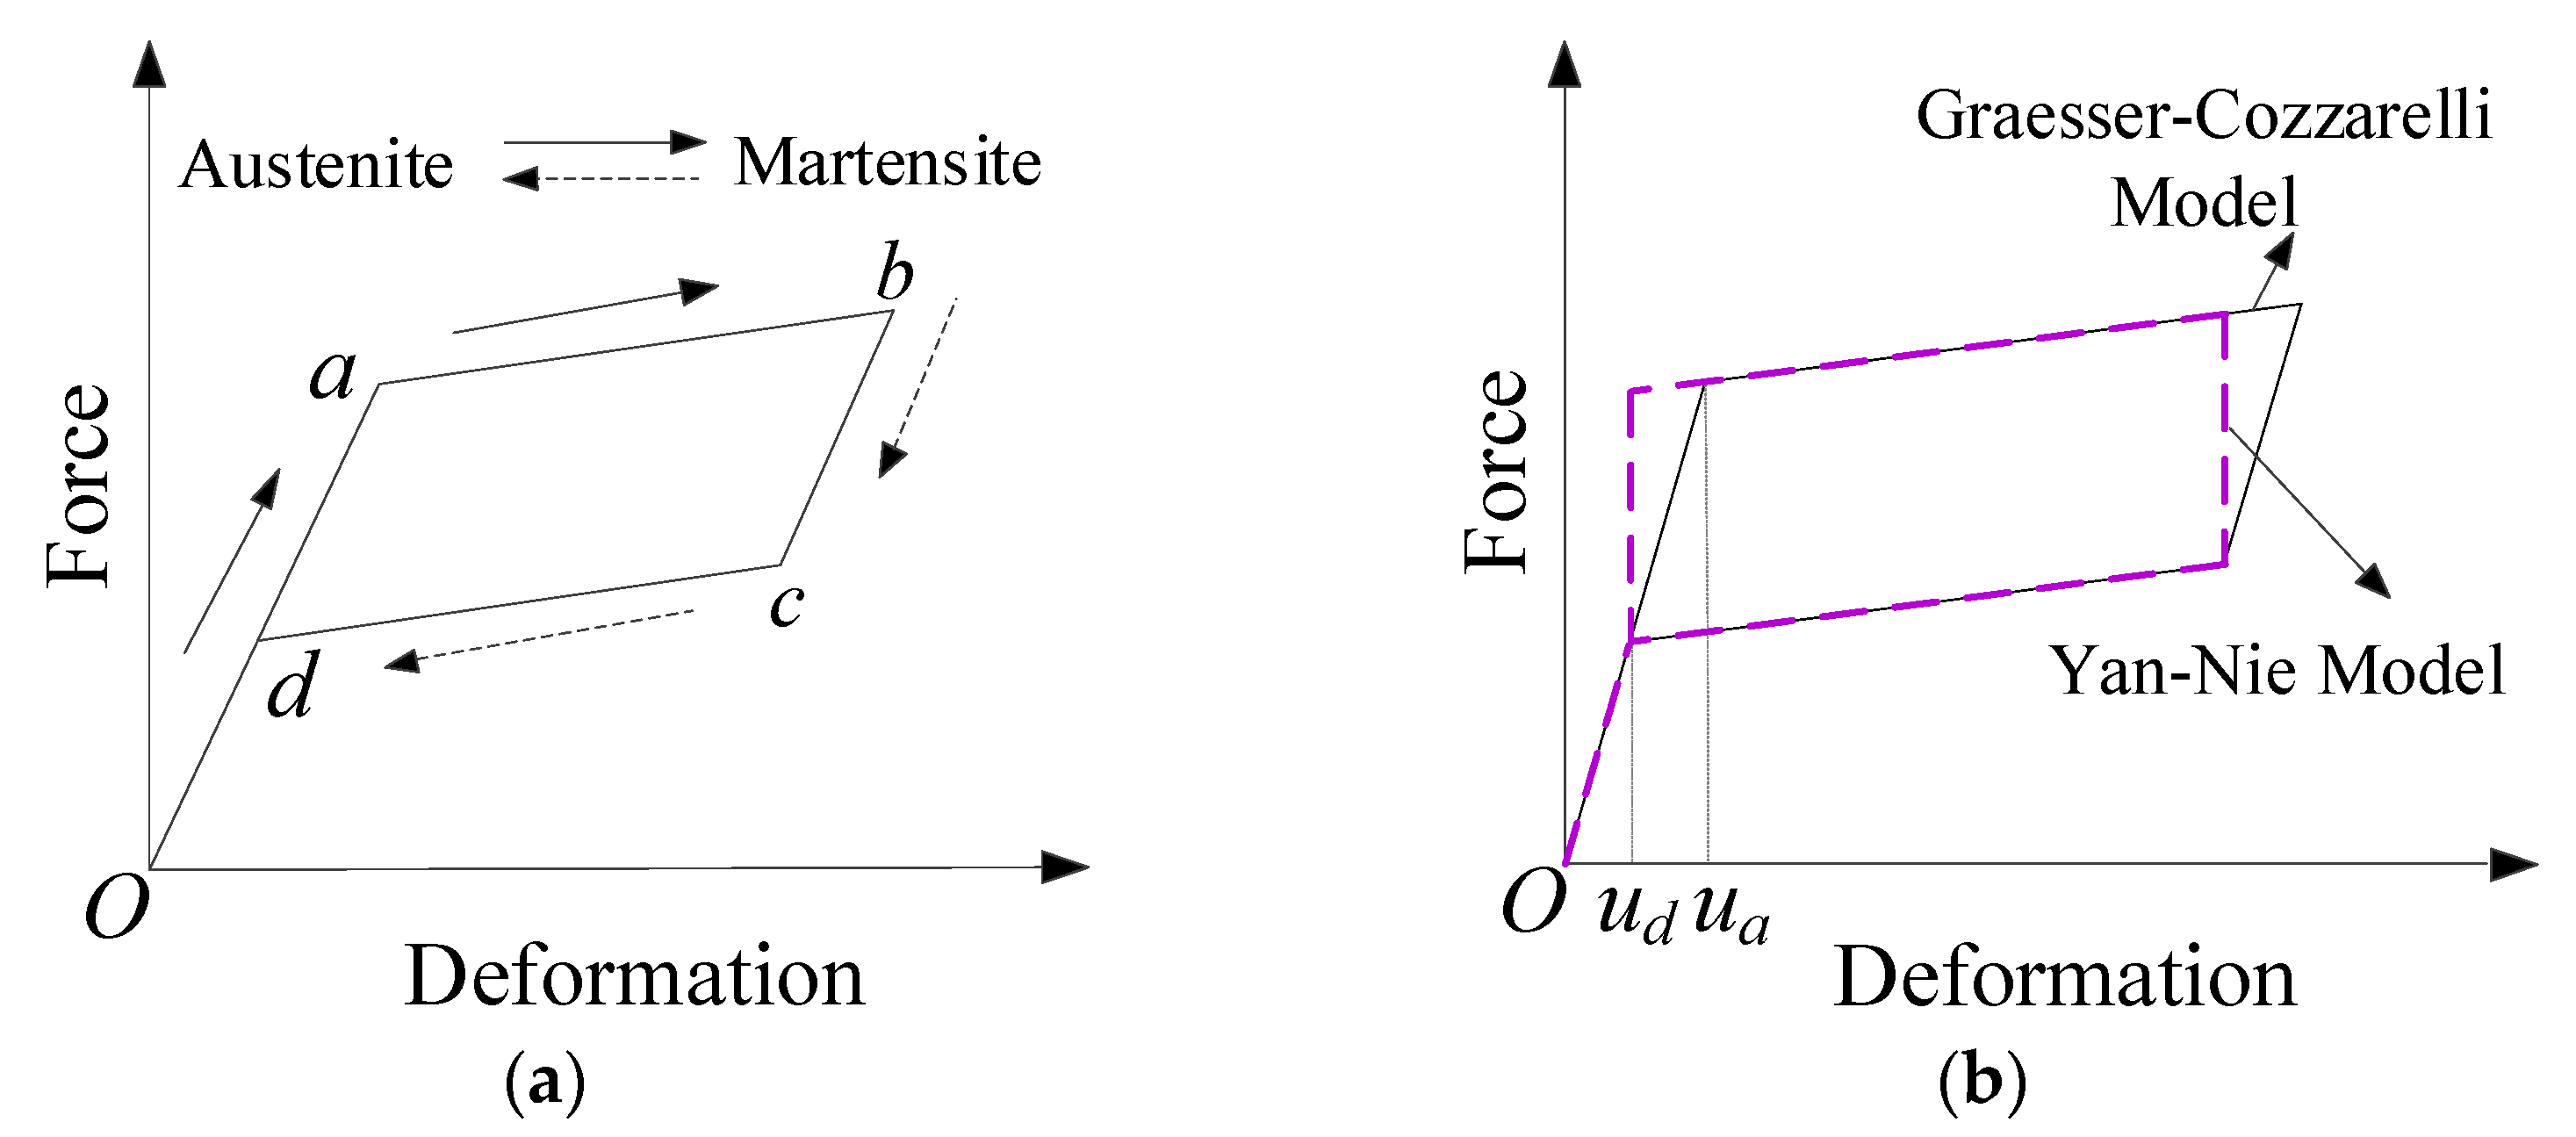
SMA is a metal alloy material with shape memory capability and superelastic properties. Figure 2a shows the force-displacement relationship of SMA at temperatures above the austenite transition temperature. In segment Oa, the SMA is in the austenite phase under stress levels below the martensitic start transformation stress, exhibiting linear elasticity. Segment ab begins when the applied stress exceeds the martensitic start transformation stress, triggering the transformation from austenite to martensite. This stage is characterized by a large increase in deformation with only a slight increase in stress. Segments bc and cd correspond to unloading, during which the SMA undergoes reverse transformation from martensite back to austenite. After unloading, no residual deformation is observed [29,30]. Various models can simulate the hysteretic behavior of SMA, such as the Graesser–Cozzarelli model [31,32], the Bouc–Wen model, etc. [33]. However, these models are expressed in complex, nonlinear, and differential forms, making them unsuitable for the random dynamic analysis of SMA systems.
Table 1 presents the expressions for the force, deformation, and stiffness of temperature-dependent SMA wires [34]. σ s c r is the start stress for the transition from temperature-induced martensite to stress-induced martensite, and σ f c r is the finish stress for the same transition; CM is the critical stress coefficient for the martensite-to-austenite transformation, and CA is the critical stress coefficient for the austenite-to-martensite transformation. DA and DM denote the elastic moduli corresponding to the austenite and martensite phases, respectively. εl represents the maximum residual strain. T denotes temperature, S is the cross-sectional area of the SMA wire, and L is the wire length.
A piecewise linear model is used in this study to describe the force-deformation relationship of SMA [35]. The hysteresis curve of the piecewise linear model is shown in Figure 2b. The force applied to the SMA, denoted as fs, can be expressed as follows:
f s = α d k d x + ( 1 α d ) k d z
where kd denotes the initial stiffness of the SMA, αd denotes the ratio of the stiffness before and after yielding, x denotes the displacement of the SMA, and z denotes the hysteretic displacement of the SMA, which can be expressed as follows:
z = 1 sign sign | x | u d + 1 x + sign | x | u d + 1 2 sign x + sign x ˙ 2 u a u d + u d sign x
where sign(·) denotes the sign function, which can be expressed as follows:
sign = 1 0 1 , x > 0 , x = 0 , x < 0
Equations (5)–(7) provide expressions for the applied force, which remain nonlinear and are not convenient for direct use in random dynamic analysis. Yan and Nie applied the statistical linearization method, where the hysteretic displacement z in Equation (5) can be expressed as ze [35]:
z e = c e x ˙ + k e x
where ce and ke are constants. The error generated by replacing Equation (6) with Equation (8) is expressed as follows:
e = z z e
The standard criterion for the statistical linearization method is to minimize the expected value of the square of the error process E[e2], i.e.,
E e 2 c e = 0 ;   E e 2 k e = 0
This allows the constants ke and ce to be determined [36].
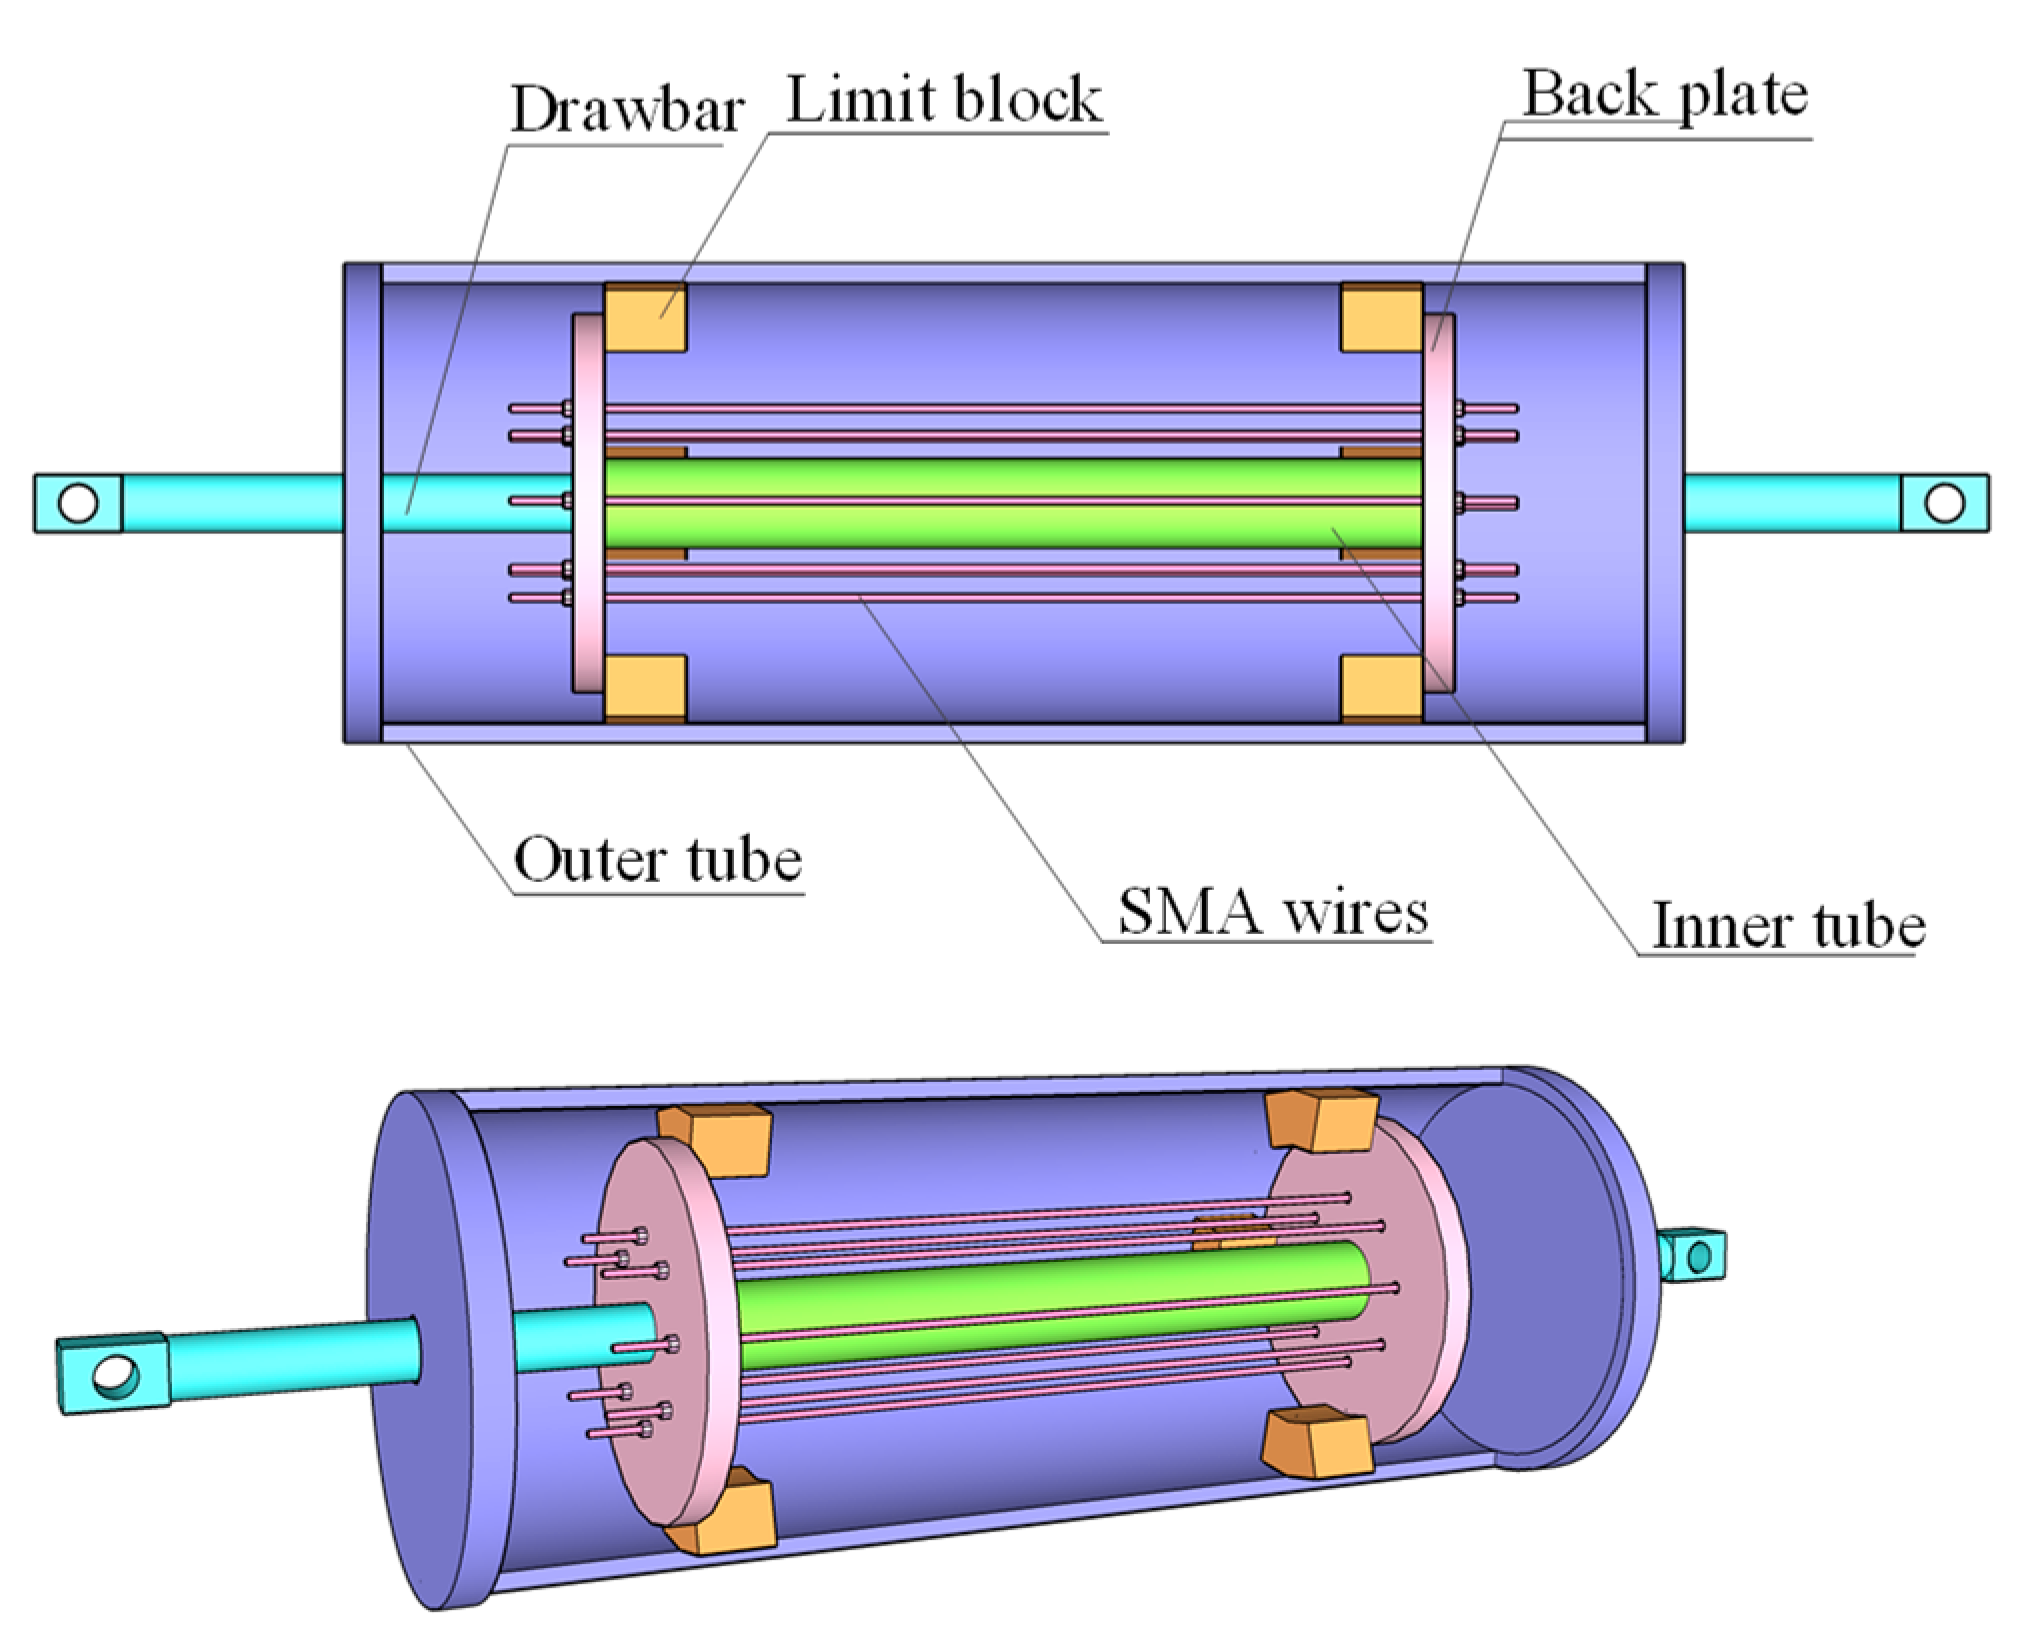
The SMAD is composed of components such as SMA wires, an outer tube, an inner tube, a limit block, a back plate, and a drawbar. The structural diagram is shown in Figure 3. These components work together to ensure that the SMA wires are only subjected to tension, not compression, during operation. Under the influence of wind loads, the damper primarily dissipates energy through the stretching of several SMA wires, thereby reducing the structural vibrations.
The force Fs applied to the SMAD is related to the force fs applied to the SMA wires and is dependent on the number of SMA wires. The explicit expression for the force Fs applied to the SMAD can be expressed as follows:
F s = N α d k d x + 1 α k d k e x + c e x ˙ = k ¯ e x + c ¯ e x ˙
where N denotes the number of SMA wires, c ¯ e and k ¯ e can be expressed as follows:
c ¯ e = 1 α d k d N ( u a u d ) 2 π σ x ˙ 1 Erf u d 2 σ x
k ¯ e = α d k d N + 1 α d k d N ( u a + u d ) 2 π σ x e u a 2 2 σ x 2
In the statistical linearization method, the complex nonlinear equations are approximated using linearized equations by minimizing the residuals between the nonlinear and linear terms [36]. The equivalent system parameters (stiffness k ¯ e and damping c ¯ e ) are functions of the root mean square of the response. As a result, the SMAD constitutive relationship is linearized while retaining its nonlinear characteristics. This approach will facilitate the study of the random response of the TTL–SMAD system.

3. The TTL–SMAD System’s Motion Equation

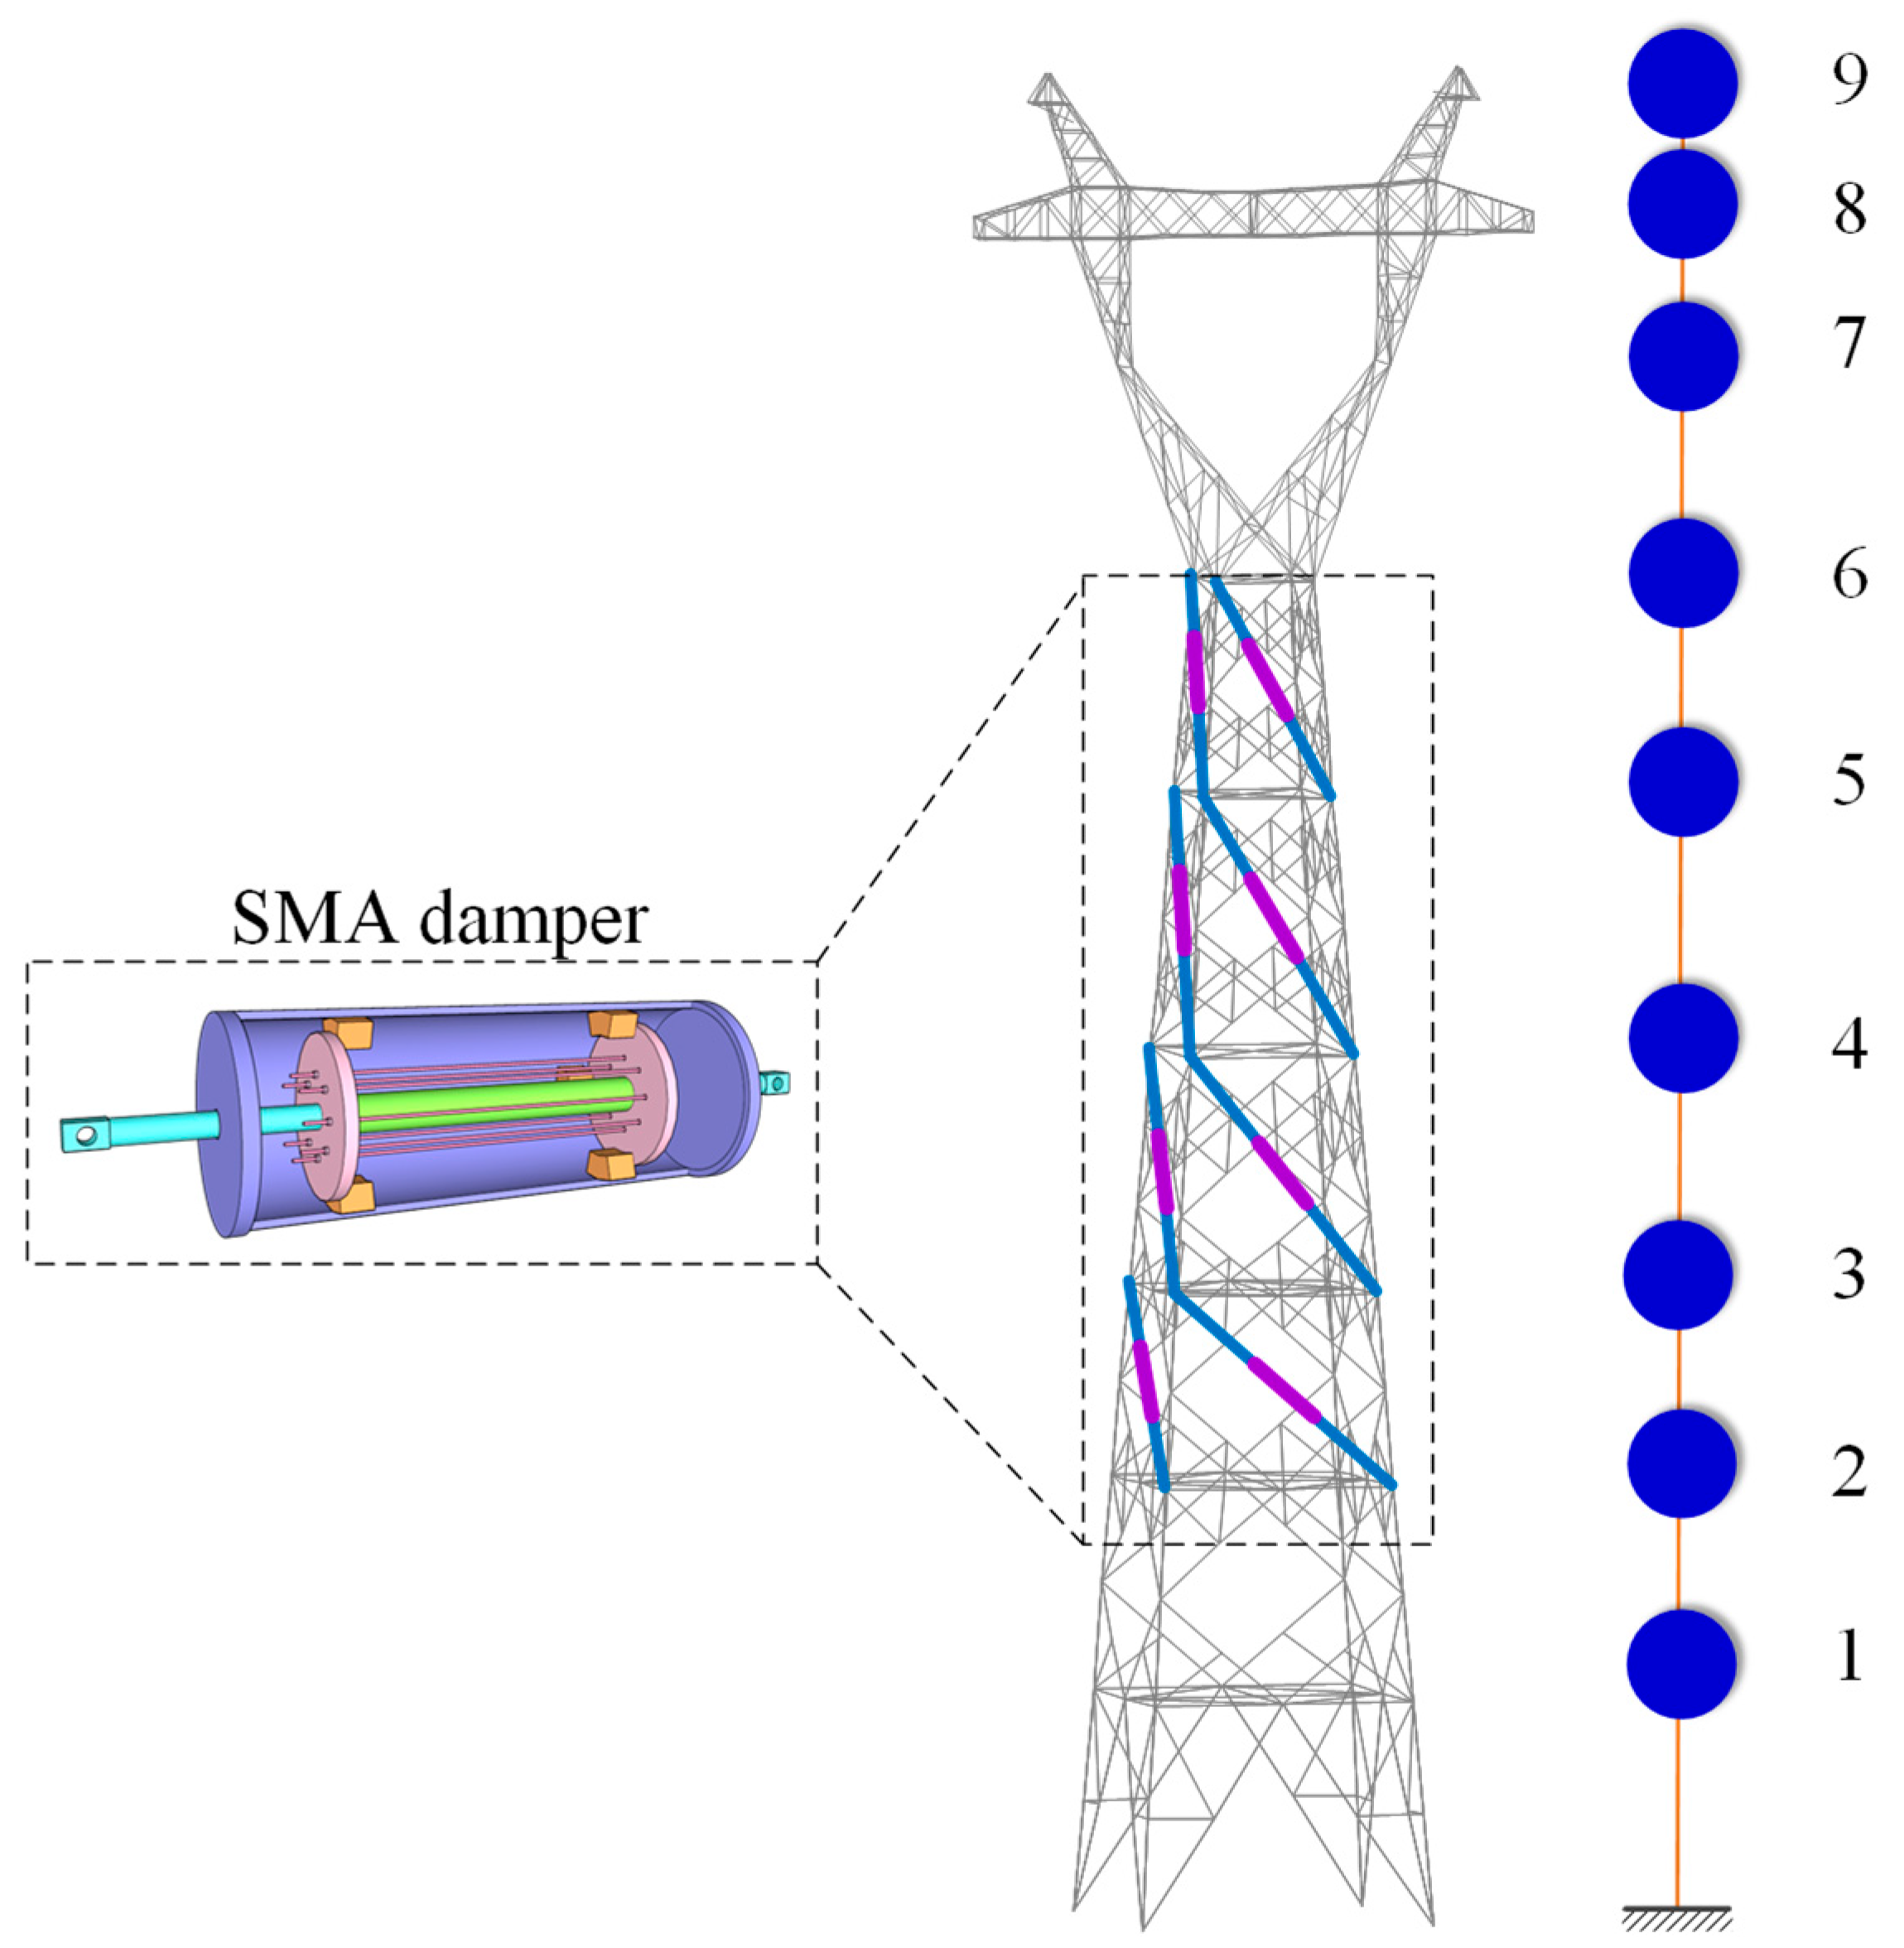
When the TTL–SMAD system is subjected to wind load excitation, the SMAD can dissipate vibrational energy and effectively reduce the vibration response of the TTL system [21]. A schematic diagram of the damper installed in the transmission tower structure is shown in Figure 4. The equation of motion for the TTL–SMAD system can be expressed as follows:
M x ¨ t + C x ˙ t + K x t + F s t = F t
In the equation,
M = M i n 0 0 M o u t ;   C = C i n 0 0 C o u t ;   K = K i n 0 0 K o u t
F t = F i n t F o u t t T
F s t = F s i n t F s o u t t T
where x t , x ˙ t , and x ¨ t denote the displacement, velocity, and acceleration column vectors of the TTL system, respectively. t denotes the time variable. M and K denote the mass matrix and stiffness matrix of the TTL system, respectively. C denotes the damping matrix of the TTL system, determined using Rayleigh damping. Min and Mout denote the mass matrices of the TTL system in the in-plane and out-of-plane directions, respectively; similarly, Kin and Kout denote the stiffness matrices of the TTL system in the in-plane and out-of-plane directions, respectively. Cin and Cout denote the damping matrices of the TTL system in the in-plane and out-of-plane directions, respectively. Fs denotes the damper force matrix provided via the damper. F s i n t and F s o u t t denote the damper force matrices in the in-plane and out-of-plane directions, respectively, which can be expressed as follows:
F s q x ˙ t = C ¯ e x ˙ t + K ¯ e x t
where the superscript q denotes the in-plane (in) or out-of-plane (out) direction. The equivalent SMAD damping matrix C ¯ e and stiffness matrix K ¯ e are as follows:
C ¯ e = Π T c ¯ e Π ;   K ¯ e = Π T k ¯ e Π
c ¯ e = diag c ¯ e , 1 , c ¯ e , 2 , , c ¯ e , l ;   k ¯ e = diag k ¯ e , 1 , k ¯ e , 2 , , k ¯ e , l
where l denotes the number of dampers, and Π denotes the position matrix of the SMAD.

4. Random Wind-Induced Vibration Response of TTL–SMAD System

This section establishes the stochastic wind-induced vibration control model for the TTL–SMAD system based on random vibration theory, from which the response parameters obtained have statistical significance.

4.1. Random Wind Load

Given the stochastic nature of wind loads, control studies based on a single or several wind load time histories lack statistical significance and offer limited generality for evaluating damper performance. In this section, a stochastic wind load model is established for the TTL–SMAD system. The fluctuating wind load applied to the TTL–SMAD system is a stationary random process, and the corresponding random wind load spectrum can be expressed as follows [37,38]:
S F F ω = S 11 ω S 12 ω S 1 n ω S 21 ω S 22 ω S 2 n ω S n 1 ω S n 2 ω S n n ω
Each element can be expressed as follows:
S i j ω = A i A j S w i ω S w j ω γ i j ω i , j = 1 , 2 , , n
S w ω = 4 μ s 2 μ z 2 w 0 2 I u 2 S ω
where n denotes the number of mass layers in the MDOF model of the TTL system, and ω = 2πf, and f denotes the frequency of wind load. Ai denotes the wind surface area of the i-th mass in the TTL system. γij denotes the coherence function of the fluctuating wind speed between any two masses in space. μz denotes the wind pressure height variation coefficient of the TTL system. μs denotes the shape coefficient of the TTL system. w0 denotes the basic wind pressure. Iu denotes the turbulence intensity, and S(ω) denotes the wind speed spectrum.
The wind load power spectral matrix SFF(ω) is a positive–definite Hermitian matrix, and the Cholesky decomposition is performed as follows:
S F F ω = L ω L T ω
where L(ω) denotes a lower triangular matrix, and the superscript * denotes the matrix conjugate.

4.2. Random Wind-Induced Vibration Response

PEM provides an accurate and effective solution for the random wind vibration response analysis of engineering structures [38,39]. Based on the PEM, a pseudo-excitation is constructed, f ˜ k ω , t :
f ˜ k ω , t = L k ω exp ( i ω t )
where L k ω denotes the k-th column of L ω (k = 1, 2, …, n); i = 1 . The system’s pseudo-response, x ˜ k , can be obtained from the following equation:
M x ˜ ¨ k + C + C ¯ e x ˜ ˙ k + K + K ¯ e x ˜ k = f ˜ k
Due to the effect of the SMAD, the TTL–SMAD system does not satisfy the orthogonality of stiffness and damping, and thus, the modal superposition method cannot be used for decoupling. Since the pseudo-load and pseudo-response are harmonic, the excitation, f ˜ k , and the response, x ˜ k , can be expressed as the sum of their real and imaginary parts:
f ˜ k = f ˜ k R + i f ˜ k I ;   x ˜ k = x ˜ k R + i x ˜ k I
where the superscripts R and I represent the real and imaginary parts, respectively. By substituting Equation (27) into Equation (26) and comparing the real and imaginary parts, the following equations are obtained:
E x ˜ k R + D x ˜ k I = f ˜ k R D x ˜ k R + E x ˜ k I = f ˜ k I
In the equation,
E = K + K ¯ e ω 2 M D = ω C + C ¯ e ;   f R = L k cos ω t f I = L k sin ω t
Further derivation leads to the pseudo-response x ˜ k as follows:
x ˜ k = E D 1 E + D 1 E D 1 + i I f ˜ k
The power spectral density (PSD) matrix of the random wind-induced vibration response is then given as follows:
S x x = k = 1 n x ˜ k x ˜ k T
The root mean square displacement of any given mass layer is expressed as
σ x = 2 0 + S x x ω d ω ;   σ x ˙ = 2 0 + ω 2 S x x ω d ω
where S x x ω denotes any diagonal element of the PSD matrix, S x x .
During the random wind-induced vibration analysis of the TTL–SMAD system, an iterative procedure is performed to update the equivalent stiffness matrix, K ¯ e , and equivalent damping matrix, C ¯ e , of the SMADs until stable values are achieved [36]. This ensures the convergence of the calculation and yields steady stochastic responses under random wind loading.

4.3. Extreme Response of the Control System

The extreme response of structures based on probabilistic significance is crucial in engineering design and safety assessment [40]. In the random wind vibration control analysis of the TTL–SMAD system, the extreme response based on the first exceedance failure criterion is used to evaluate the control performance of the damper.
For a zero-mean stationary random response process, x(t), let xe and σx represent the extreme value and standard deviation of the response, respectively. The dimensionless parameter is defined as ε = x e / σ x . When the threshold is sufficiently high, the extreme values exceeding the threshold can be considered independent events, following the characteristics of a Poisson process [41,42]. The probability distribution of the extreme response is given by the following equation:
P η = exp ν T d exp ε 2 2 ;   ν = 1 π λ 2 λ 0 ;   λ p = 2 0 + ω p S x x ω d ω
where Td denotes the response duration, and v denotes the mean up-crossing rate; λp (p = 0, 2) denotes the p-th spectral moment of the random response process.
Based on the probability distribution in Equation (33), the expected value of the dimensionless parameter ε and the extreme response xe can be approximated as follows:
E ε 2 ln ν T d + χ 2 ln ν T d ;   x e E ε σ x
where χ denotes Euler’s constant, with a value of 0.5772.
To quantify the control performance of the SMAD under random wind loads, the reduction ratio, R, of the random wind-induced vibration response is defined as follows:
R = x e u x e c x e o × 100 %
where x e u and x e c denote the extreme responses of the uncontrolled and controlled towers, respectively.

5. Case Study

5.1. Structural and Wind Field Parameters

A long-span TTL system located in southern China is selected as the case study for the random wind-induced vibration control analysis. The transmission tower has a height of 110 m, and the span of the transmission line is 832 m. A three-dimensional finite element model of the TTL system, consisting of one tower and two lines, is established using ABAQUS software (version 6.14), as illustrated in Figure 1. The transmission tower is modeled using beam elements. The structural components are made of Q235 angle steel with L-shaped cross-sections. The material properties are defined with an elastic modulus of 2.06 × 10¹¹ N/m2 and a density of 7.85 × 10³ kg/m3. The transmission lines are modeled using truss elements, with an axial stiffness of 4.85 × 10⁷ N/m, a cross-sectional area of 71.25 mm2, and a linear density of 1.4 kg/m. The damping ratio is set to 0.01.
The transmission tower consists of the tower body, tower head, and cross arms. Figure 5 shows the mode shapes of the TTL-coupled system corresponding to the first two modes of the transmission tower in both directions. The first two natural frequencies of the transmission tower in the in-plane direction are 0.57 Hz and 2.29 Hz, while the natural frequencies in the out-of-plane direction are 0.65 Hz and 2.25 Hz.
The wind profile is modeled using the exponential law, which characterizes the distribution of mean wind speed. The site is classified as Terrain Category B [43]. The wind speed spectrum is defined using the Davenport model. The basic wind pressure is set to 0.35 kPa. The wind loading considered in this study corresponds to typical service-level conditions, under which the structural components are expected to remain within the elastic range without undergoing significant nonlinear deformation. The maximum frequency selected is 60 rad/s, with a frequency step of 0.1 rad/s.

5.2. Damper Parameters and Installation

The diameter of the SMA wire used in the damper is 0.002 m, and the length is 1 m. The number of SMA wires is 8. Table 2 lists the values of the basic physical parameters of the SMA wires [33].
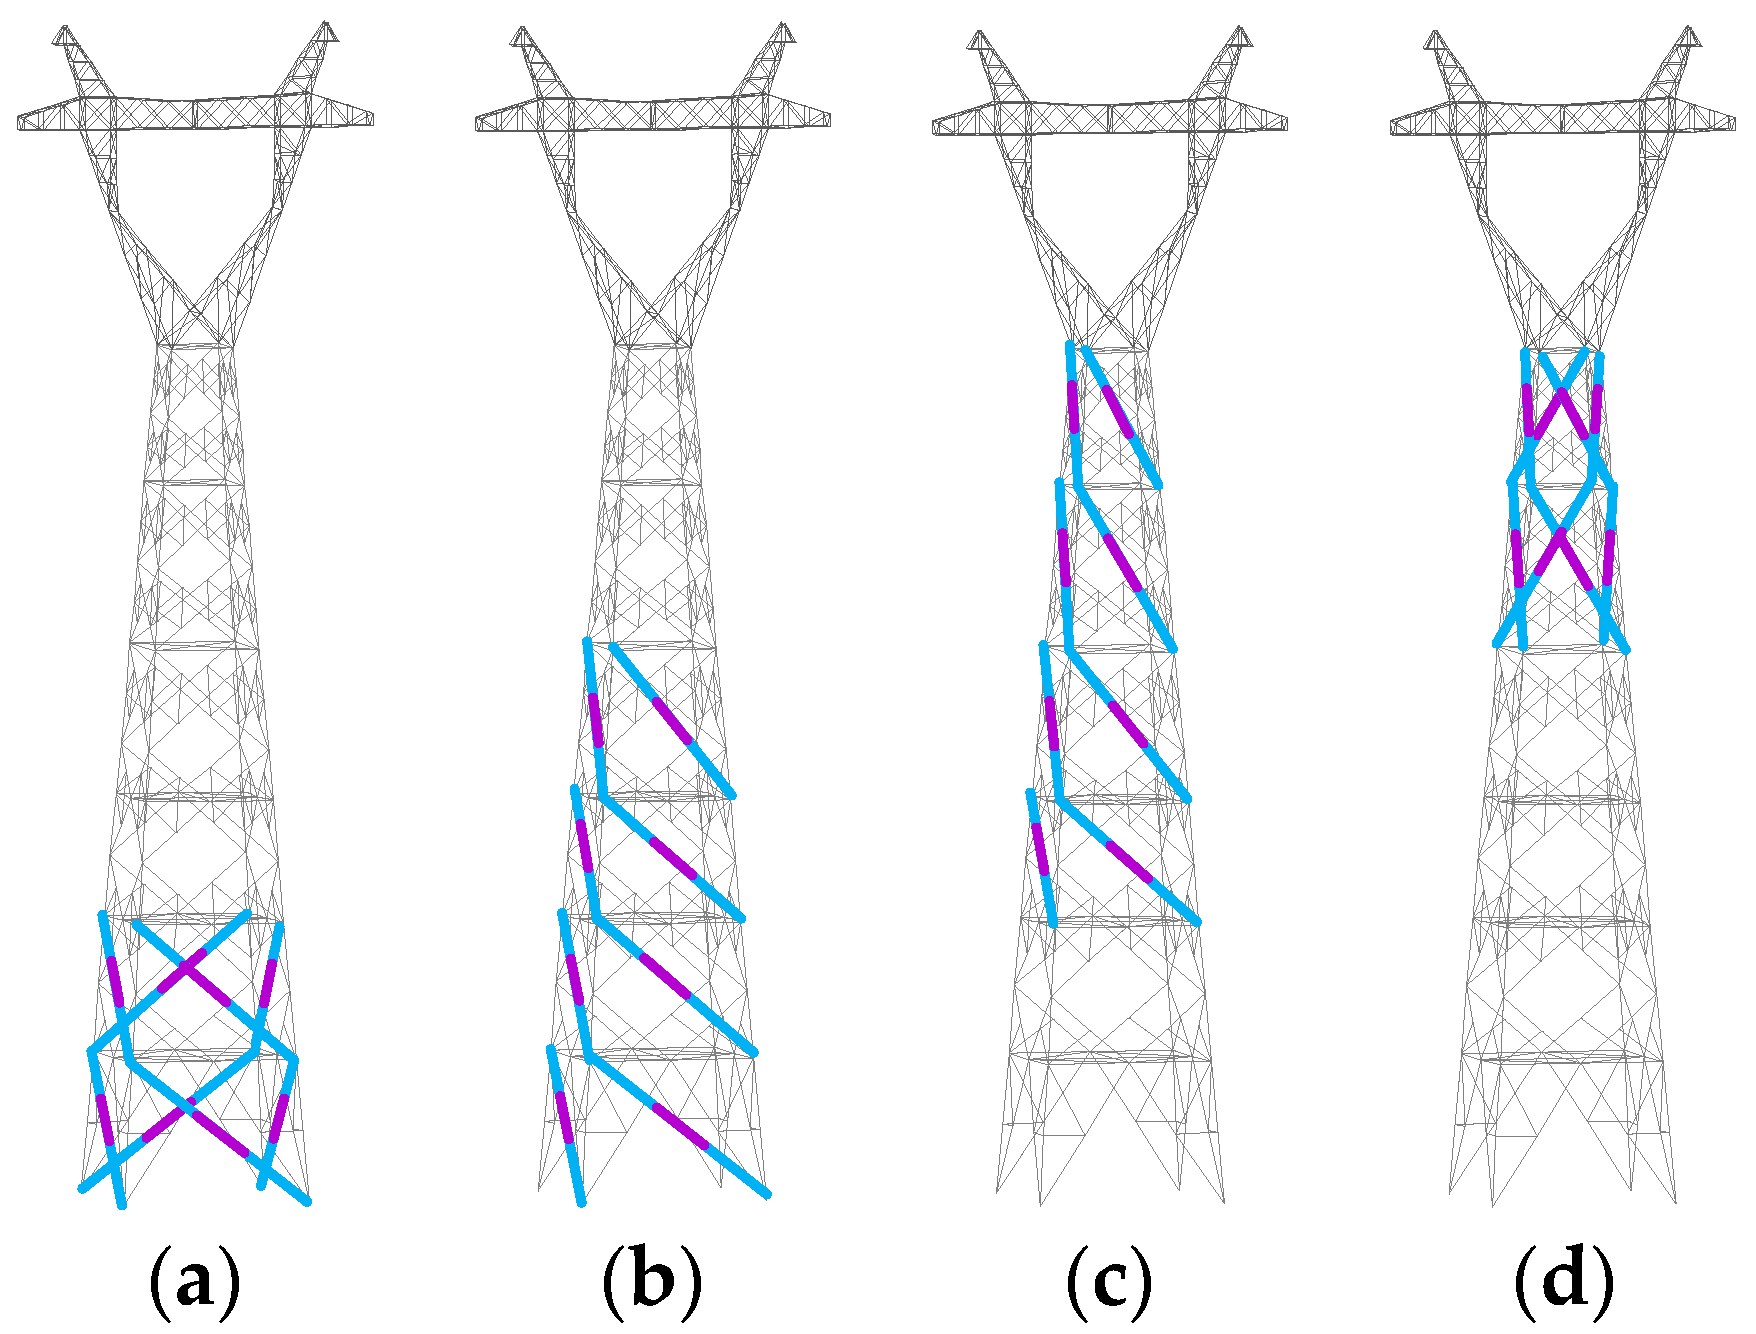
Transmission lines need to be installed between the 7th and 9th mass layer of the transmission tower, making it inconvenient to install dampers. Therefore, the dampers are primarily arranged between the 1st and 6th layers of the tower body. The SMADs are diagonally connected between two adjacent mass layers of the transmission tower in both the in-plane and out-of-plane directions. To ensure a fair comparison of the control effectiveness among different installation schemes, a total of 8 dampers are installed, with 4 in the in-plane direction and 4 in the out-of-plane direction. Four representative installation schemes are designed to examine the influence of damper placement on vibration control performance. The specific installation schemes are shown in Table 3 and Figure 6. This setup maintains a consistent number of dampers across all cases, while also reflecting practical engineering constraints related to cost and available installation space.
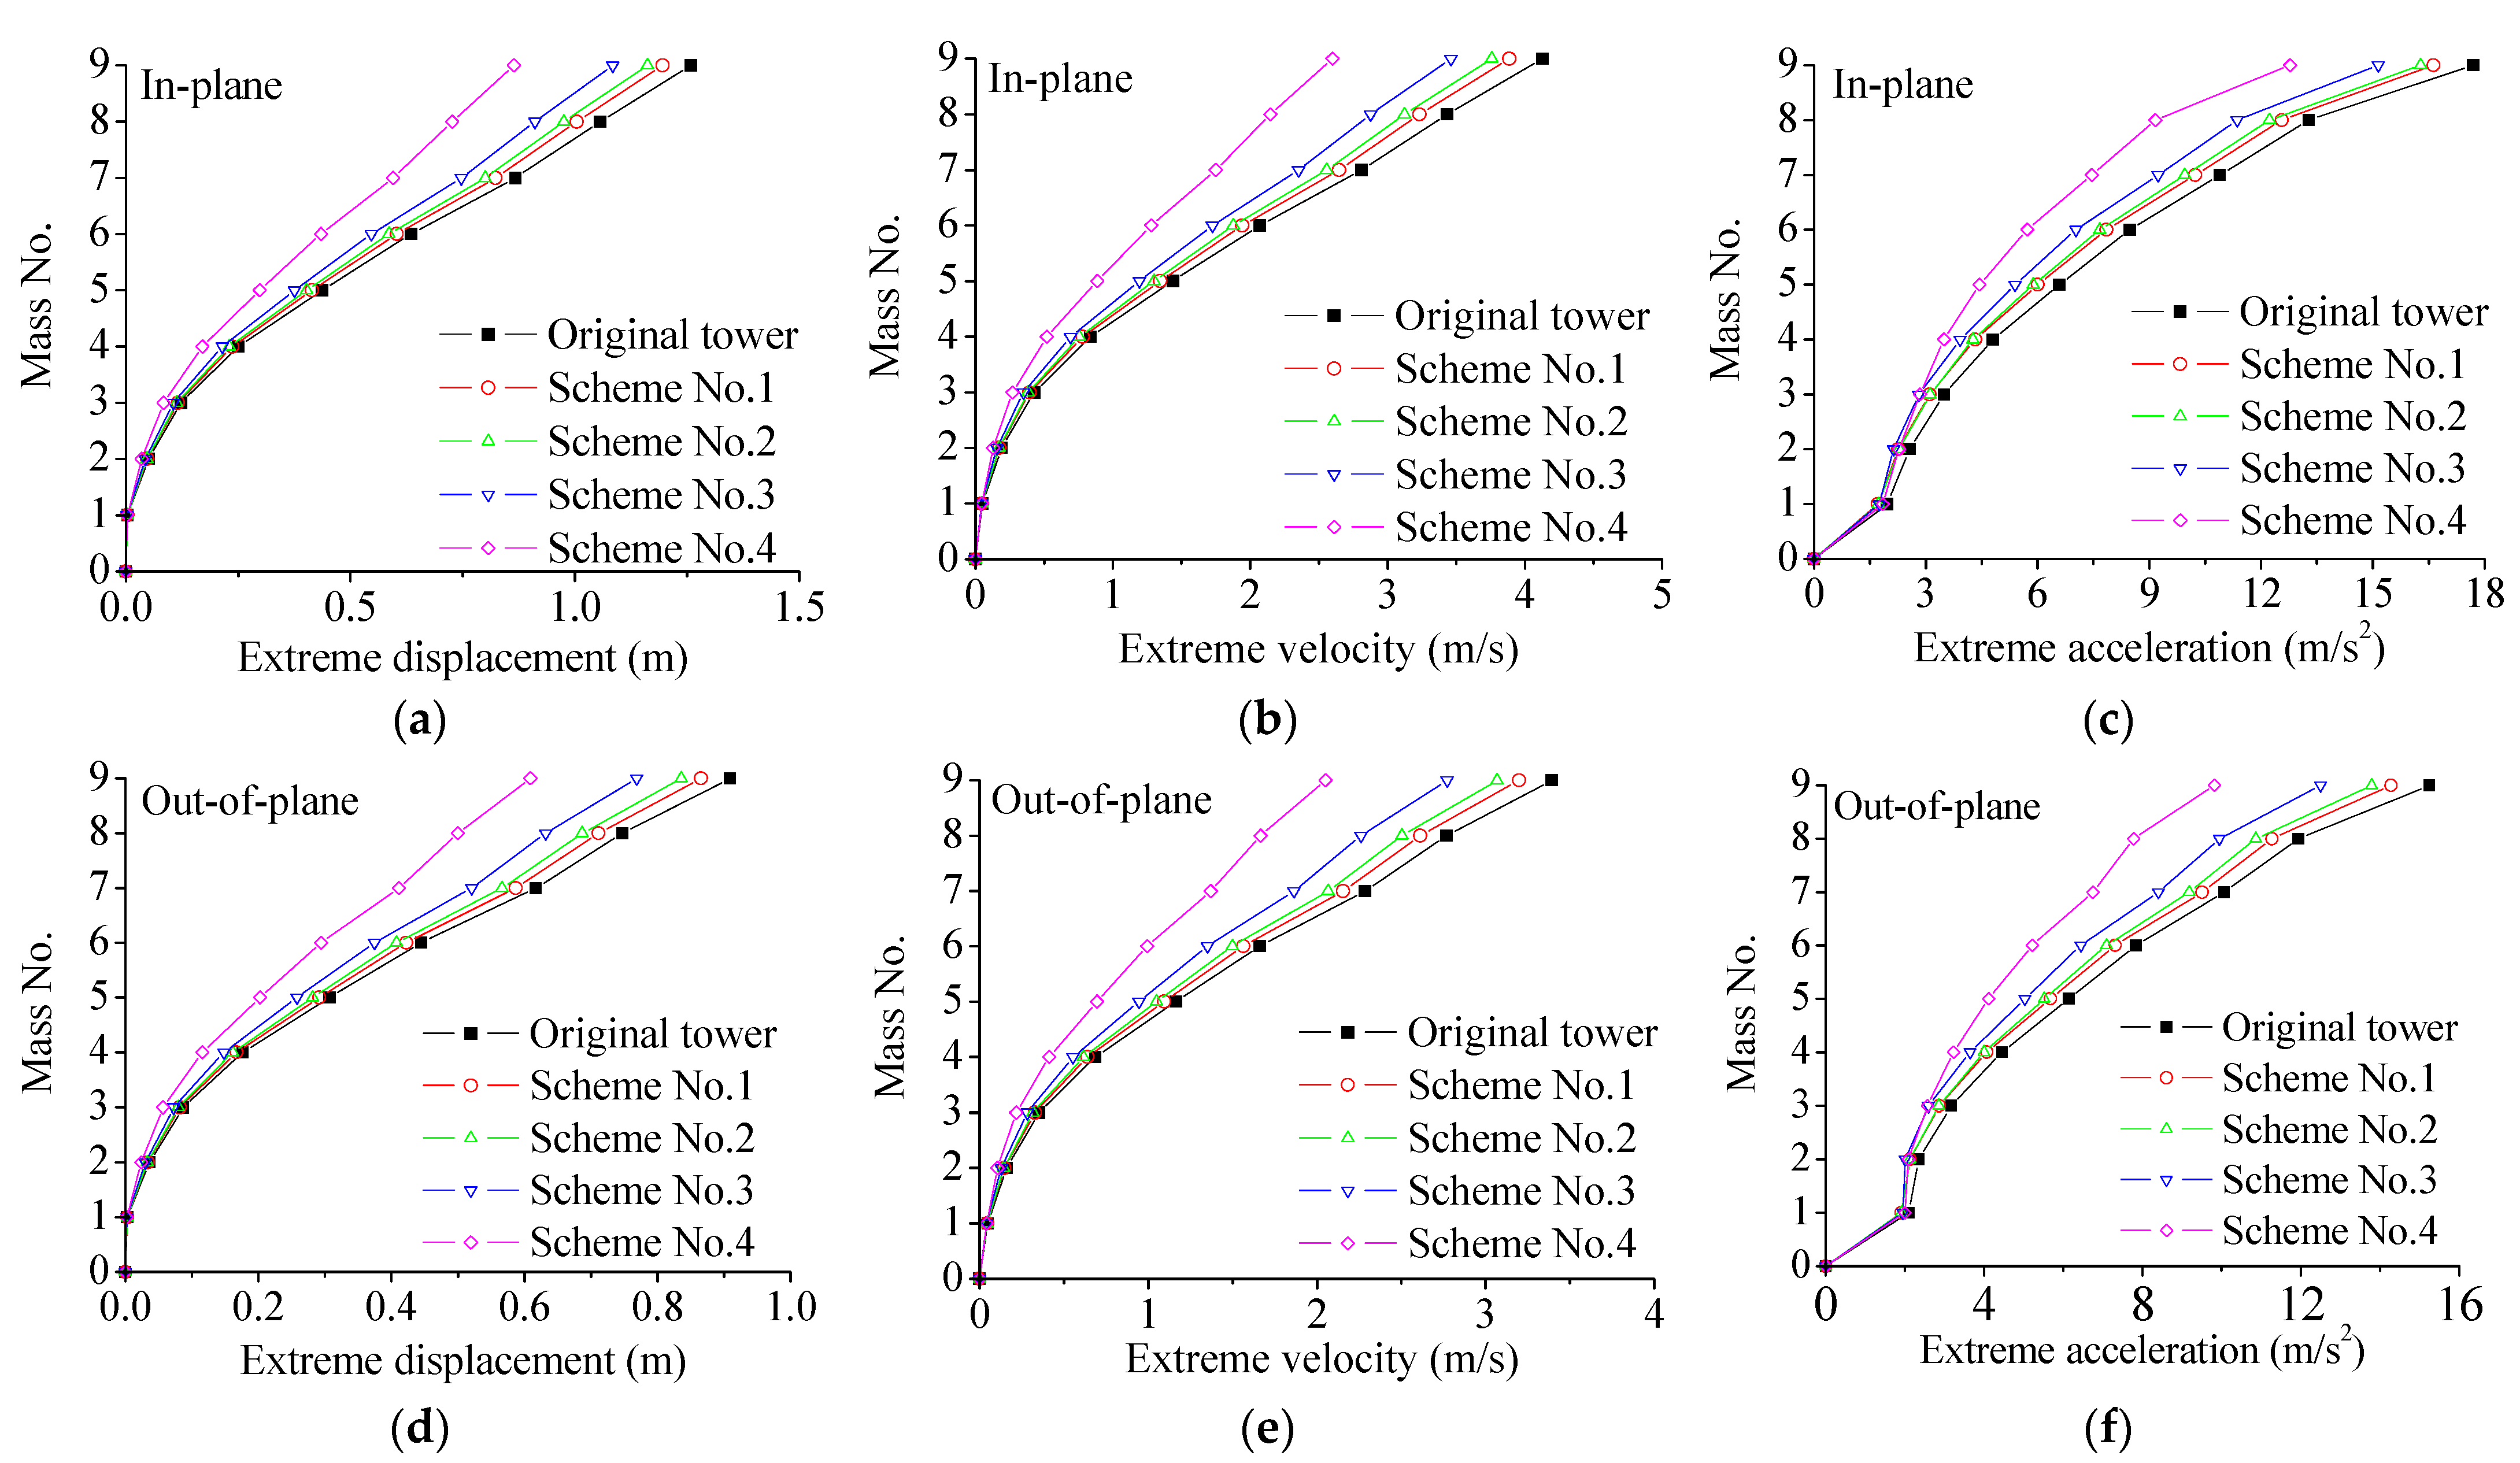
The extreme responses for different installation schemes are shown in Figure 7. The extreme responses in the in-plane and out-of-plane directions are similar, with the in-plane response being slightly larger. This is due to the comparable stiffness in both directions, while the wind surface area in the in-plane direction is larger than that in the out-of-plane direction, resulting in a higher wind load in the in-plane direction. After the installation of the SMAD, the extreme responses in all four schemes are reduced, indicating that the dampers provide a certain level of control. The control effects of the four schemes are similar in both directions. Scheme No. 4 shows better control performance than the other three schemes, while Scheme No. 1 exhibits the poorest control performance. Scheme No. 3 performs slightly better than Scheme No. 2. In Scheme No. 4, the dampers are concentrated in the middle-upper part of the tower, showing the best control performance. The dampers in Schemes No. 2 and No. 3 are more dispersed, which leads to weaker control effects. In Scheme No. 1, the dampers are concentrated at the bottom of the tower, showing a conflicting control effect.
Table 4 presents the reduction rates of the extreme responses for the different installation schemes. It can be observed that the reduction rate for Scheme No. 1 is only about 5%, while the reduction rate for Scheme No. 2 ranges from 7 to 9%, the reduction rate for Scheme No. 3 ranges from 13 to 18%, and for Scheme No. 4, the reduction rate is consistently above 30%. Additionally, the reduction rates of extreme velocity in the two directions are 38.09% and 39.55%, which are significantly higher than the reduction rates for displacement and acceleration. In conclusion, all four installation schemes effectively reduce the wind-induced vibration response of the structure. It is noteworthy that these results were obtained at 0 °C, and similar results can be expected at other operating temperatures. A comprehensive evaluation indicates that the damper arrangement in Scheme No. 4 performs the best, and thus, Scheme No. 4 is selected for subsequent parameter studies.

5.3. PSD Analysis

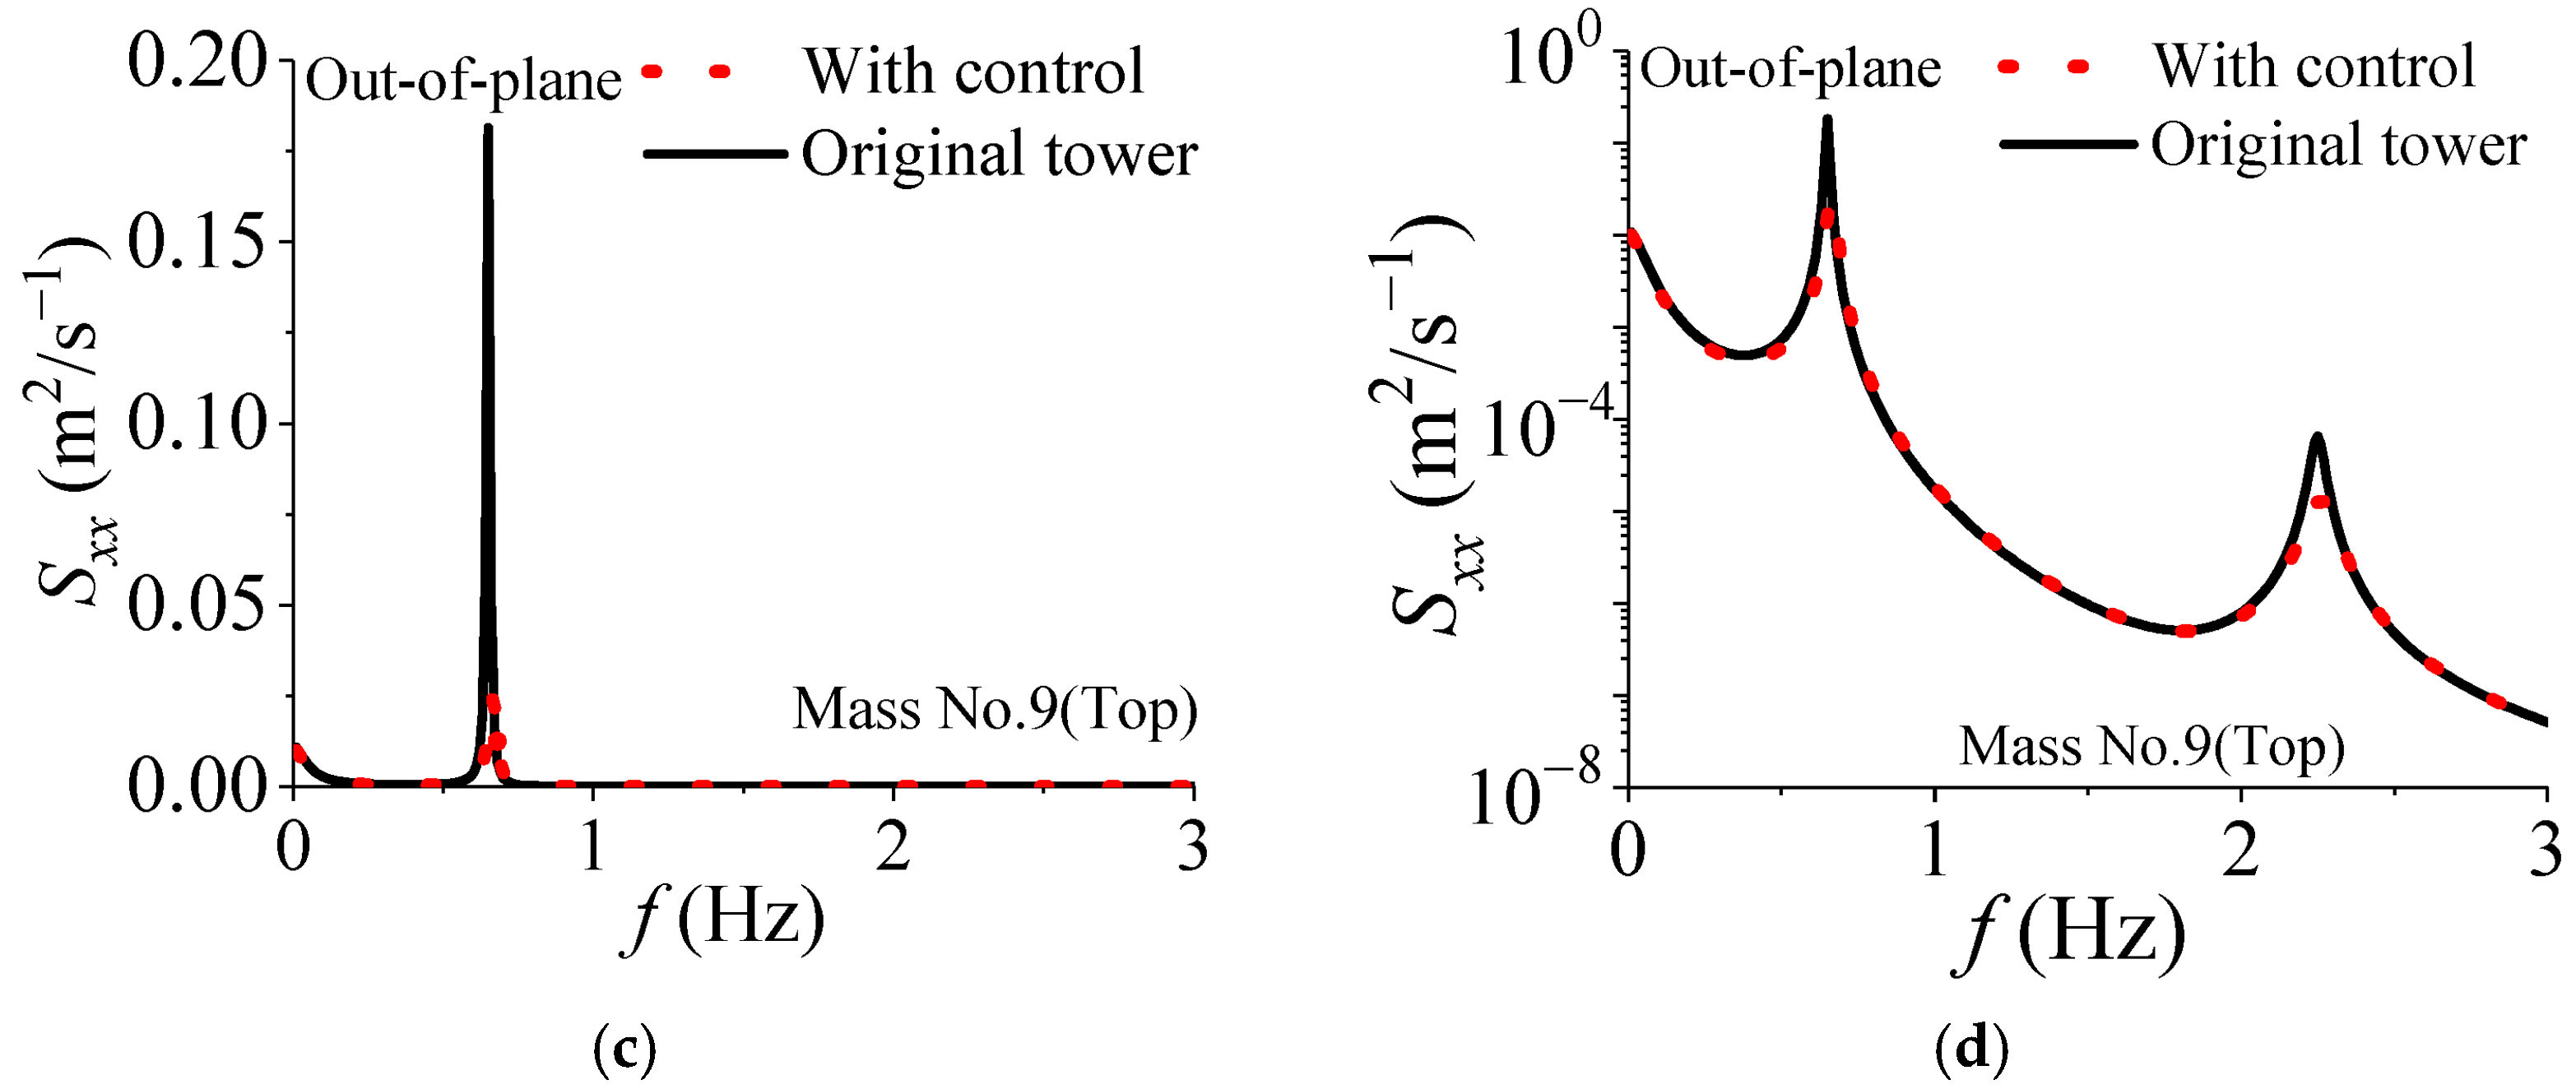
The response PSD of the TTL system without dampers and the TTL–SMAD system with SMAD are calculated. Figure 8 shows the displacement response PSD at the top of the tower (Mass No. 9). The results indicate that the overall vibration response is primarily contributed by the first two modes, with the first mode contributing the most. The peaks of the response PSD occur at frequencies of 0.57 Hz and 2.29 Hz in the in-plane direction, and at frequencies of 0.65 Hz and 2.25 Hz in the out-of-plane direction. These frequencies closely match the first two natural frequencies of the transmission tower, indicating that the system’s vibration is primarily excited at these frequencies. After the SMAD control, there is no significant change in the natural frequencies of the structure, suggesting that SMAD has a minimal impact on the inherent vibration characteristics of the TTL system. However, after SMAD control, a significant reduction in the response PSD peaks is observed at the first two natural frequencies in the in-plane direction, and a similar trend is seen in the out-of-plane direction. Specifically, the amplitude reduction rates of the response PSD at the first mode in both directions are 84.98% and 86.32%, respectively. In the second mode, the reduction rates are slightly smaller, with 83.24% in the in-plane direction and 79.76% in the out-of-plane direction. This indicates that SMAD effectively reduces the response PSD peaks near the natural frequencies, thereby significantly lowering the overall vibration energy of the structure.

6. Parametric Study

6.1. Influence of Stiffness

The stiffness of the damper is an important physical parameter of the SMAD. To evaluate the effect of different damper stiffnesses on the control performance of the SMAD in the TTL system, the stiffness coefficient ( C s = k d / k d ), where kd denotes the initial stiffness of the damper, and k d denotes the stiffness in the parametric study.
The influence of damper stiffness on the extreme response of the structure is shown in Figure 9. In both directions, as the damper stiffness coefficient Cs increases from 0 to 3.0, the extreme response of the transmission tower gradually decreases. When Cs is less than 1.0, the extreme displacement decreases significantly with a clear decreasing trend. However, when Cs exceeds 1.0, the decreasing trend of the extreme displacement weakens and gradually levels off. The trends for extreme velocity and acceleration are similar. This indicates that further increasing the damper stiffness does not significantly improve the damping effect, while also leading to an increase in the cost of the damper.
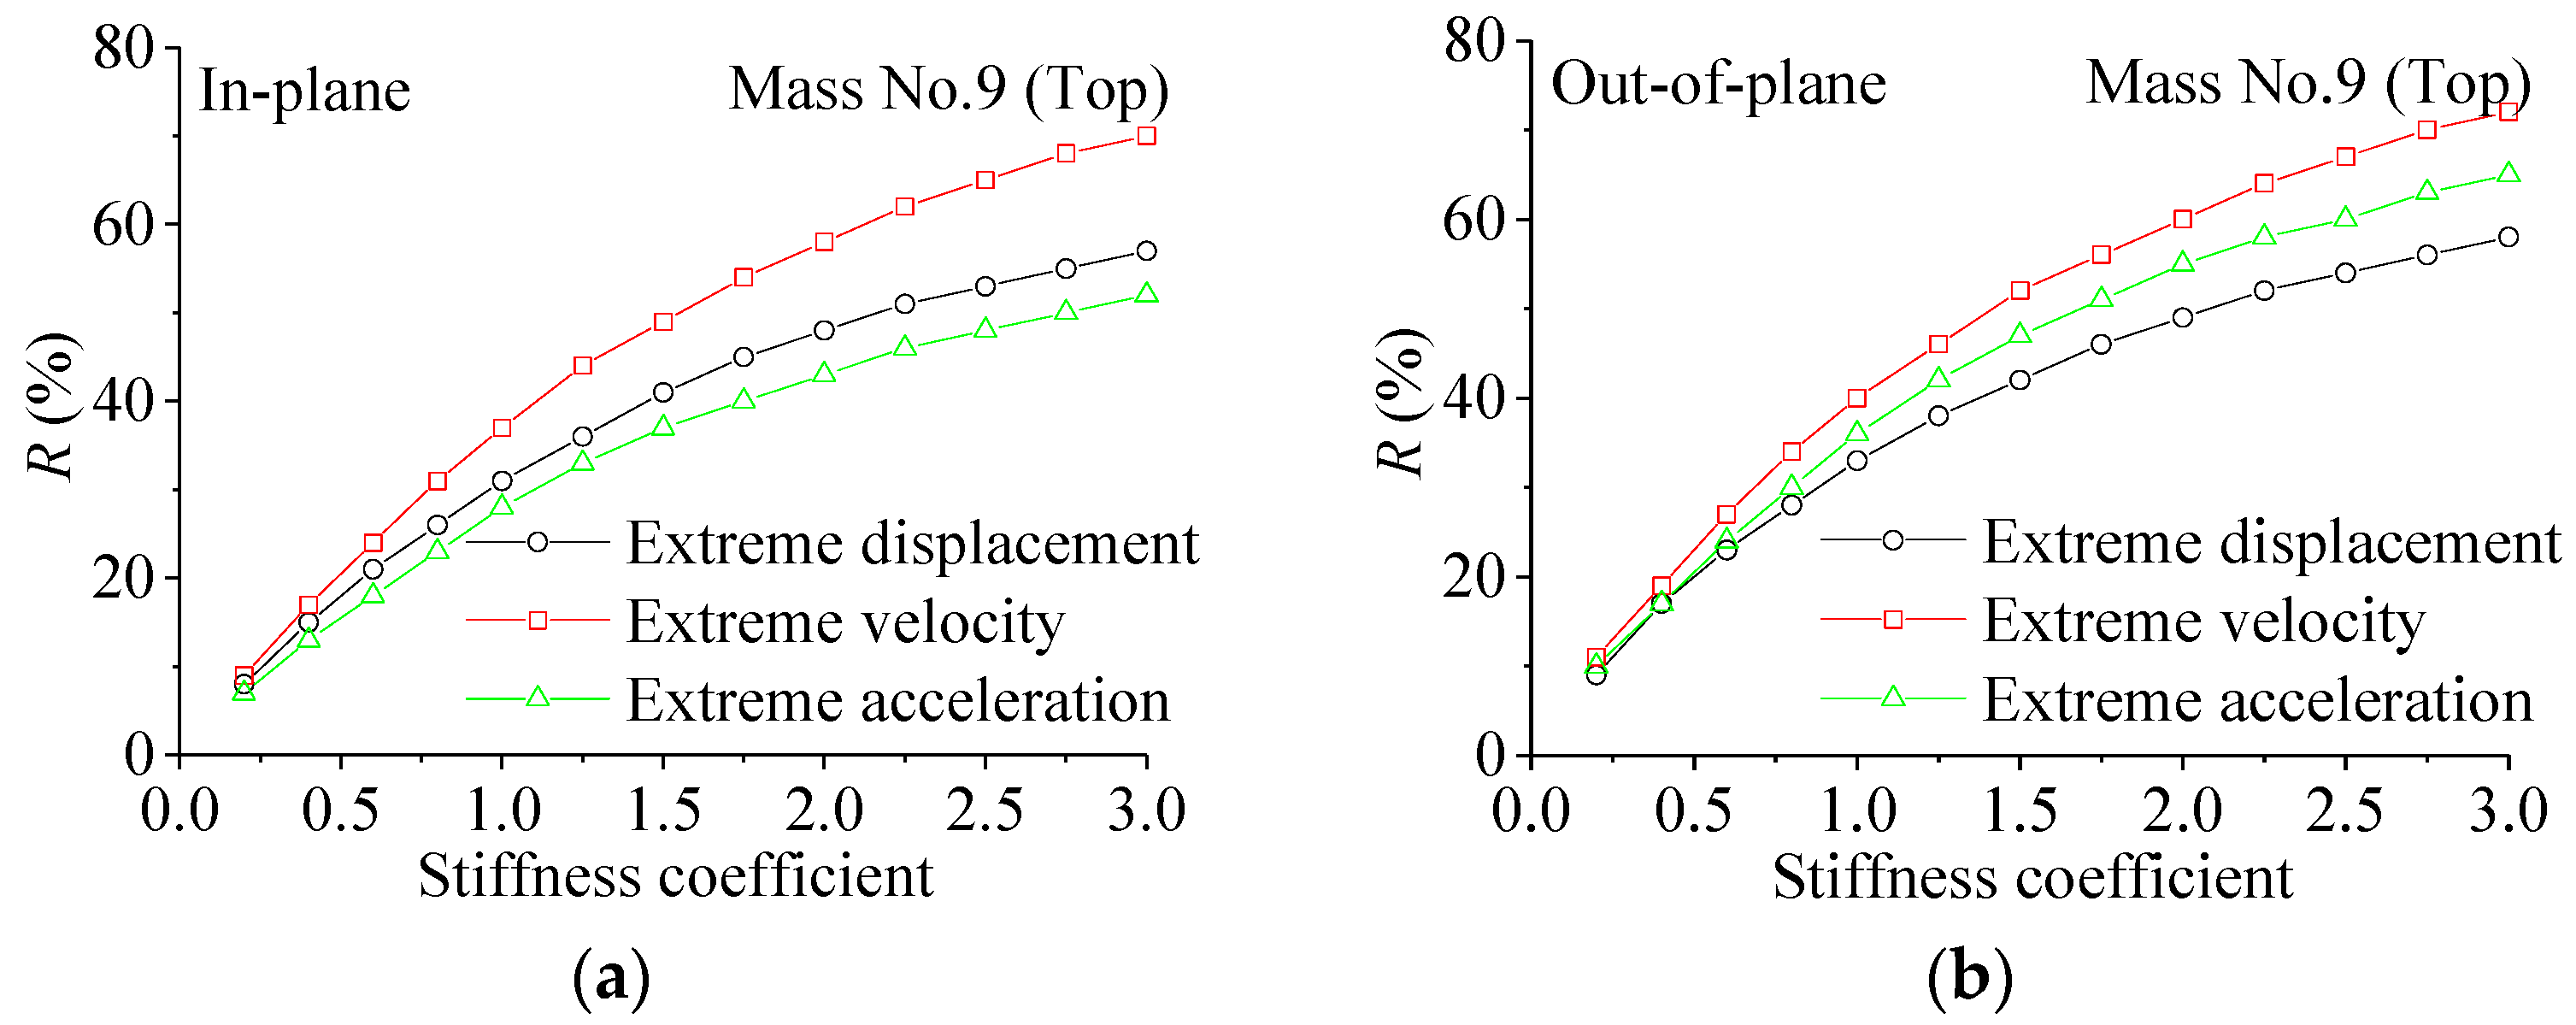
Figure 10 shows the variation in the reduction rate of extreme response with Cs. Overall, the reduction rate of extreme velocity is the largest in both directions. In both directions, when Cs is between 0.2 and 1.0, the reduction rate of extreme displacement increases significantly and nearly linearly. When Cs is 1.0, the reduction rates of extreme displacement are 31.29% and 32.99% in the in-plane and out-of-plane directions, respectively. After Cs exceeds 1.0, the reduction rate of extreme response continues to increase, but the rate of increase slows down. The reduction rates of extreme velocity and acceleration follow the same trend. This indicates that excessive increases in Cs do not significantly improve the control performance.
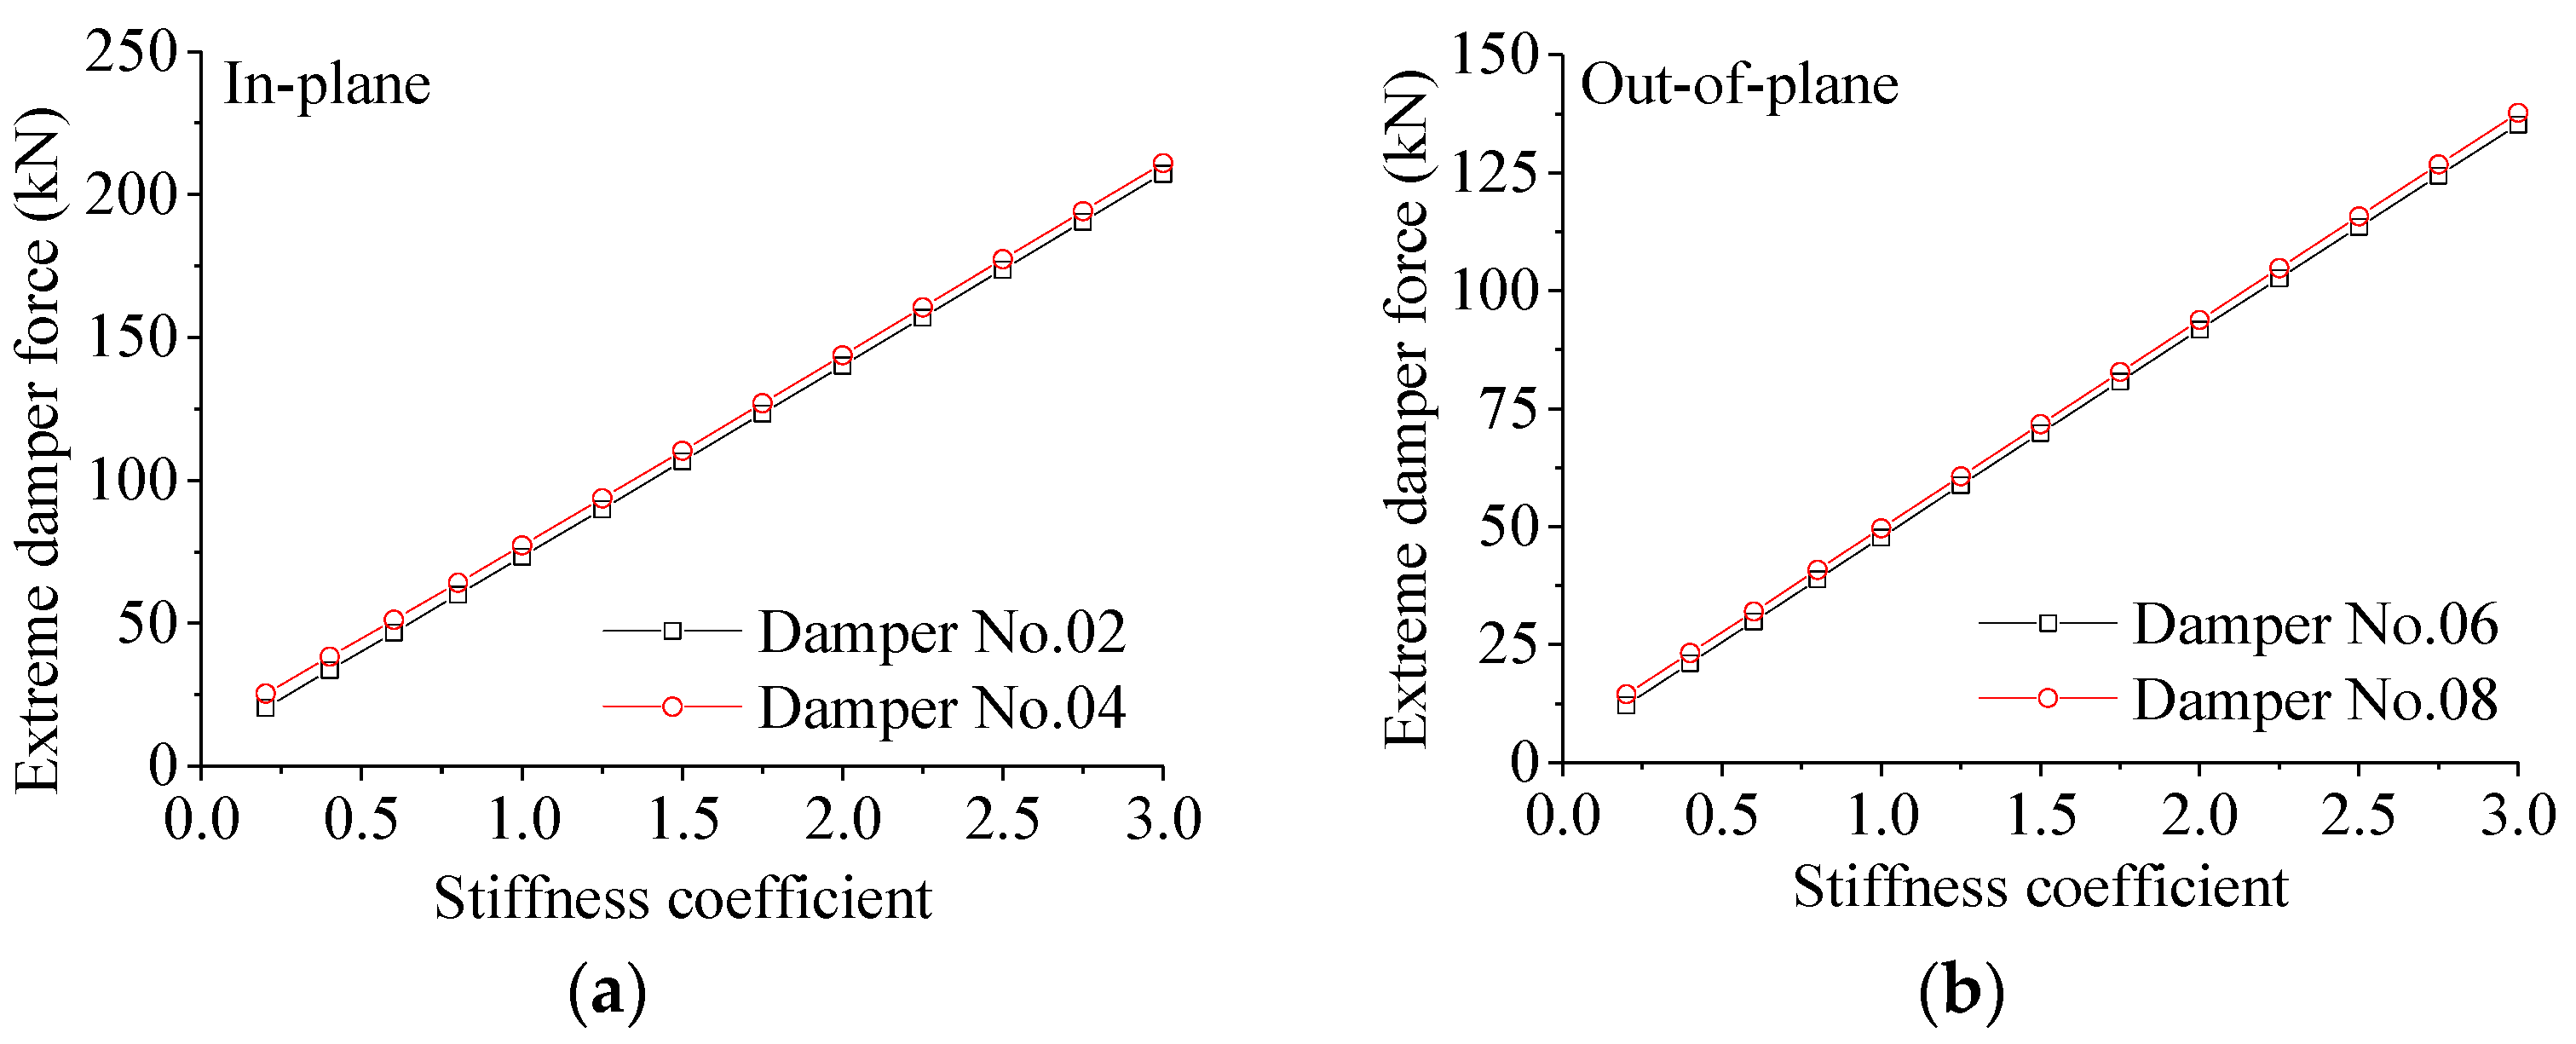
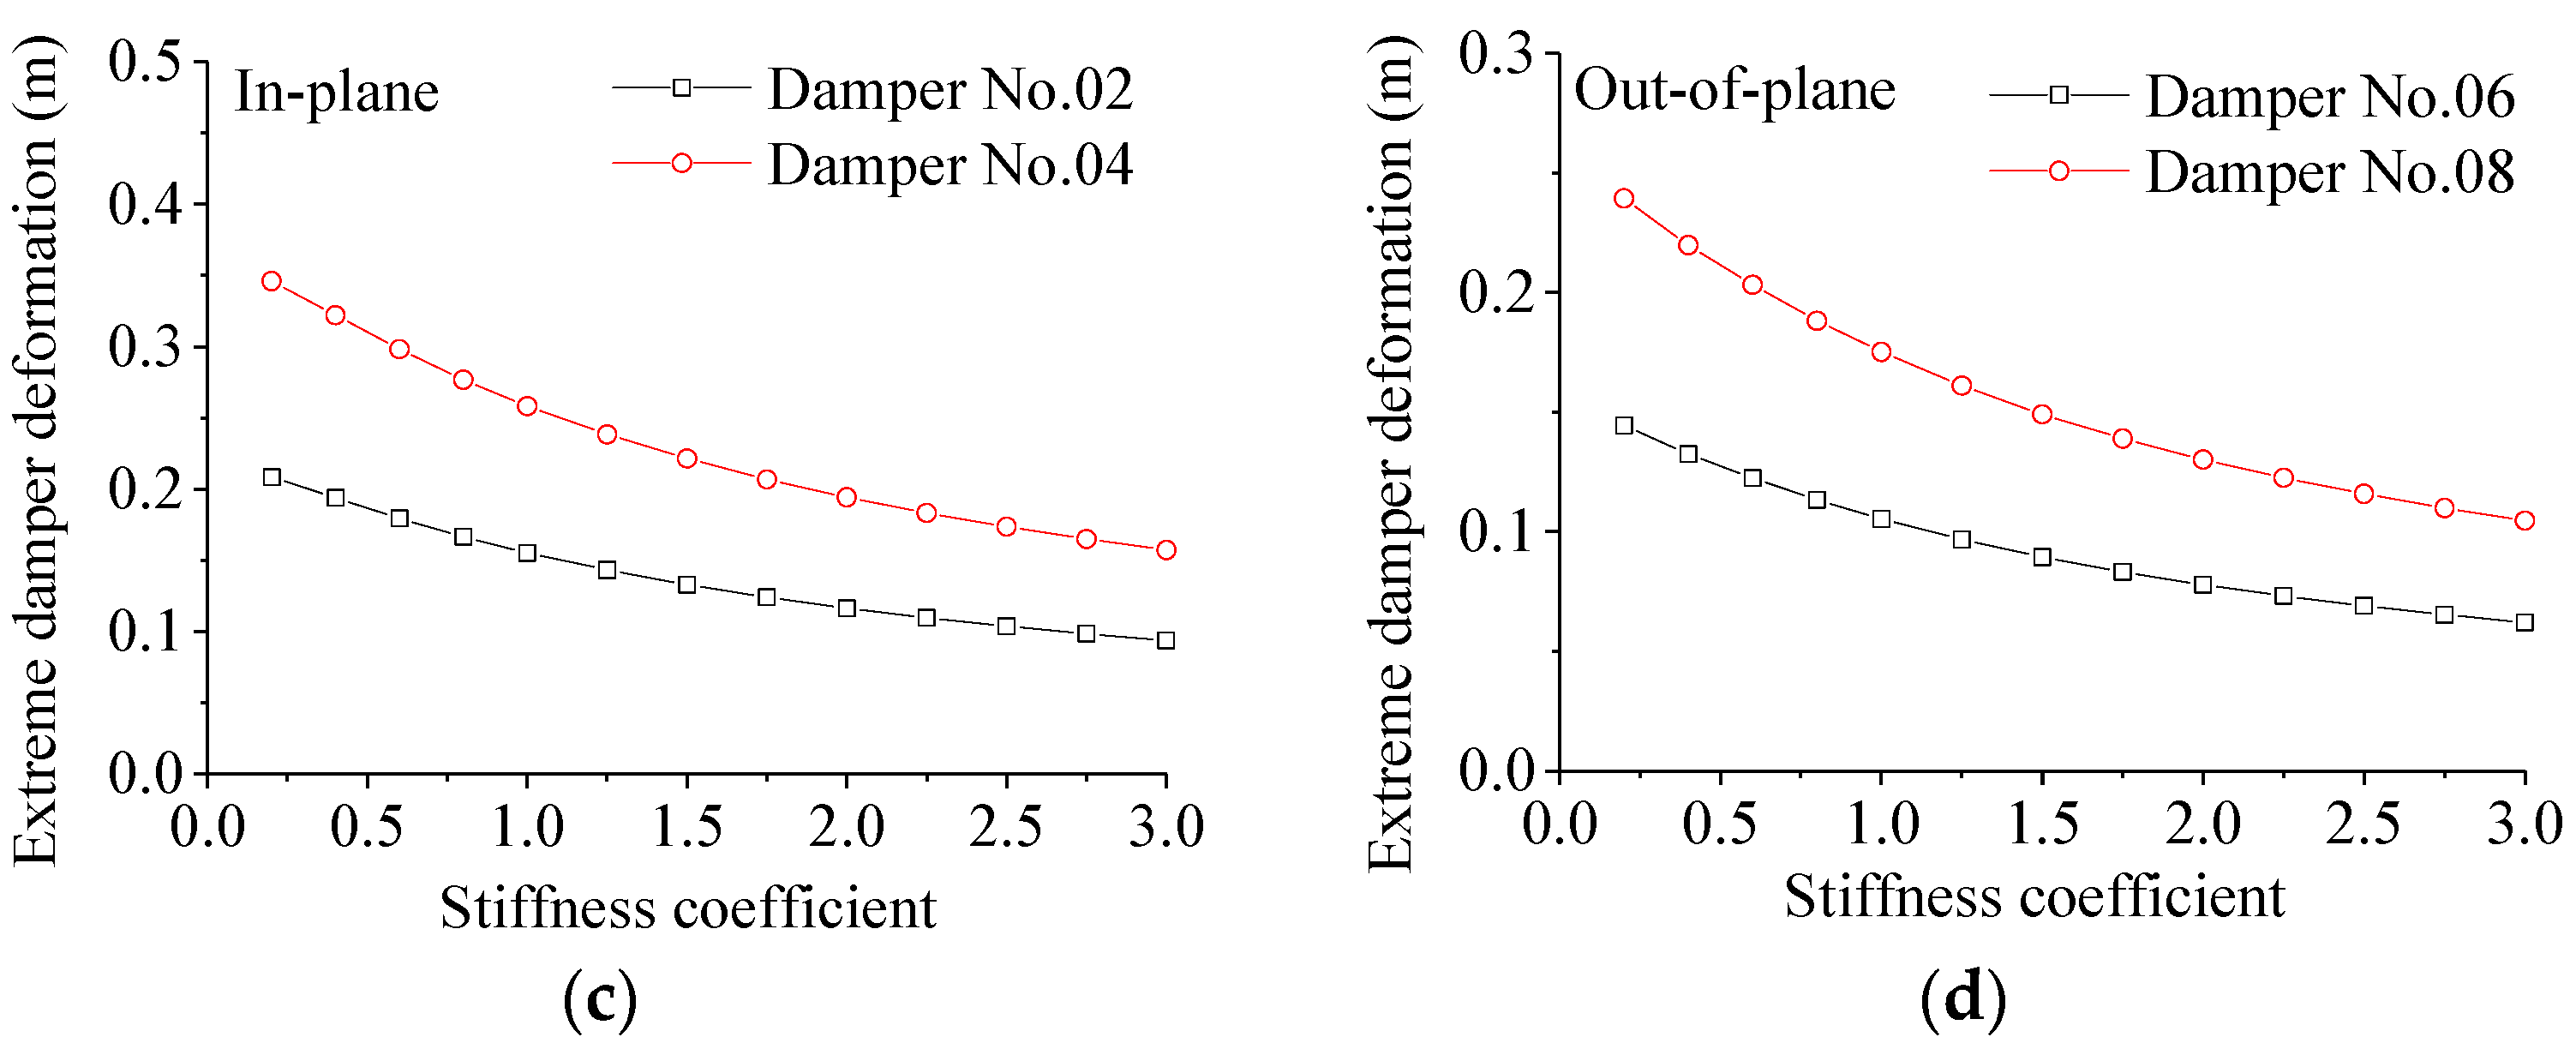
Figure 11 shows the variation in the extreme damper force and extreme damper deformation with Cs. The extreme damper force and extreme damper deformation are greater in the in-plane direction than in the out-of-plane direction. As Cs increases, the extreme damper force of the SMAD increases linearly. The relative change in the extreme damper force is greater than the relative change in extreme damper deformation. The larger the damper force, the higher the associated control cost. Excessive damper forces can hinder the movement and energy dissipation of the damper, causing it to behave like a steel support. This result has also been validated in the study of deterministic wind-induced vibration control [21]. Therefore, the recommended optimal value of Cs is approximately 1.0, as it provides effective control performance without incurring excessively high control costs.

6.2. Influence of Service Temperature

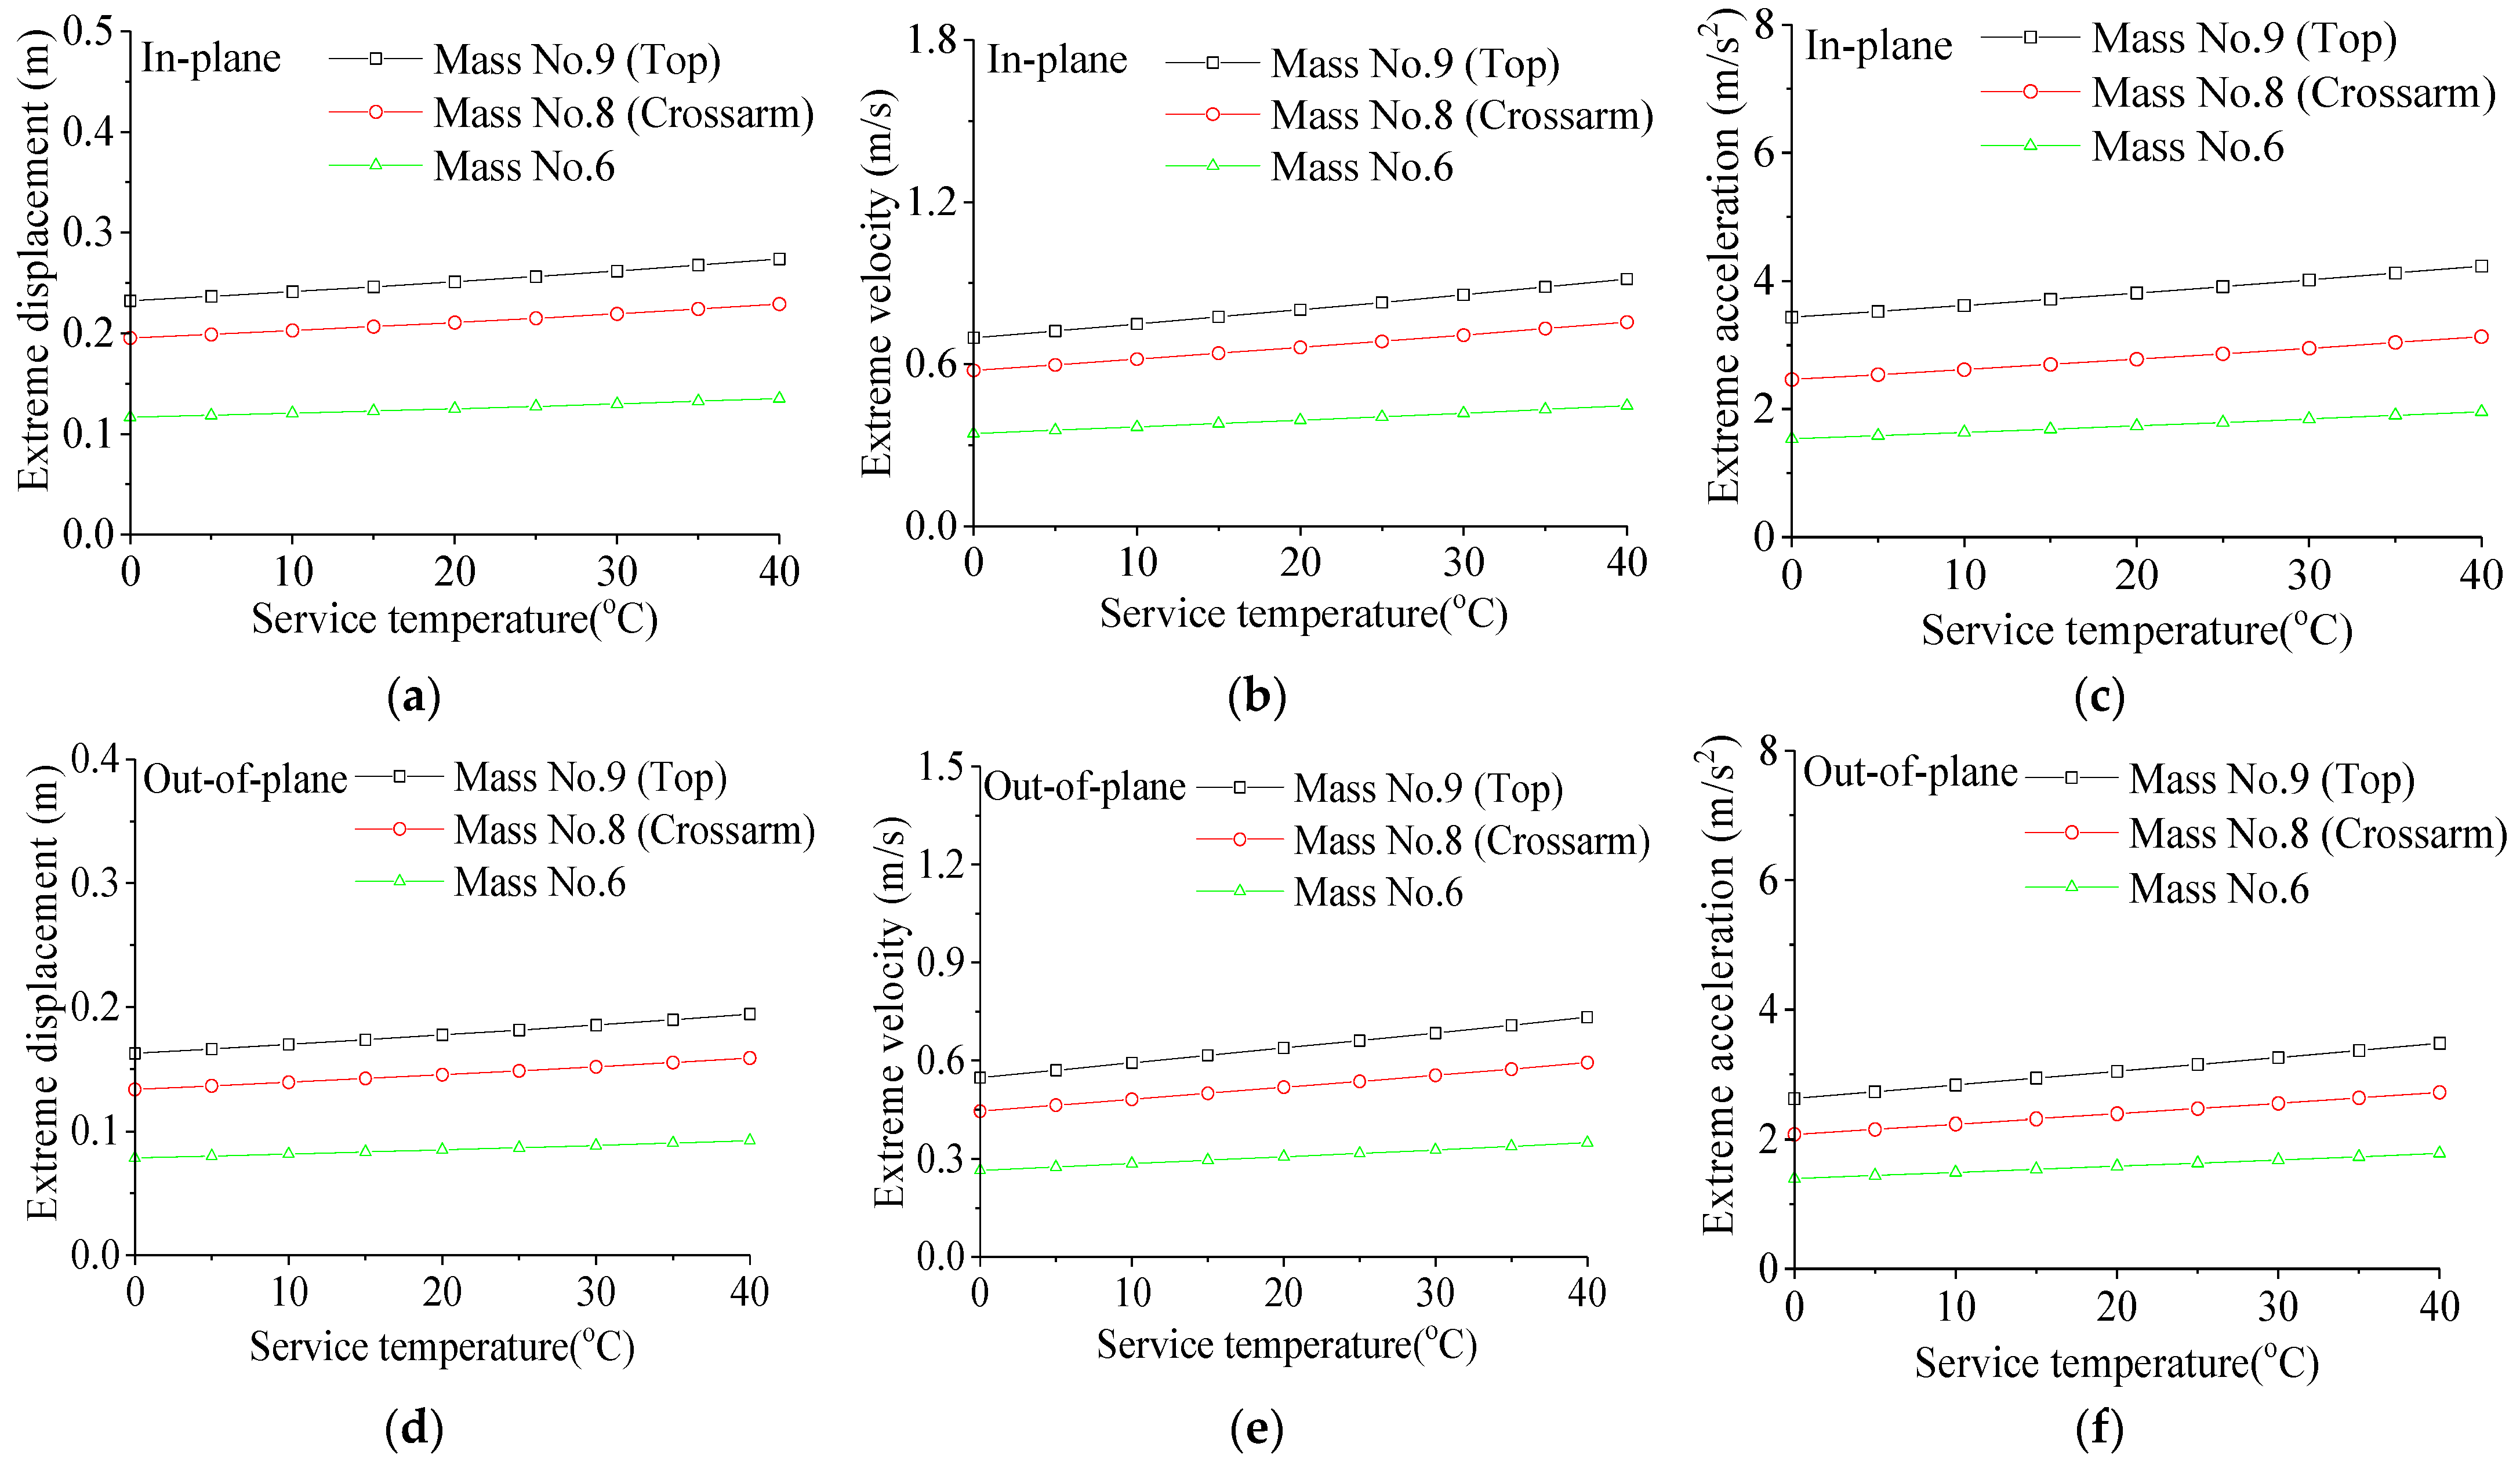
Studies have shown that the properties of SMA wires change at different service temperatures, resulting in changes in the damper’s control performance [33,34]. Figure 12 illustrates the variation of the extreme response with service temperature in the range of 0–40 °C. It can be observed that the service temperature affects the extreme response of the structure. However, compared to the effect of stiffness on the extreme response, the influence of service temperature is relatively small. In the in-plane direction, as the temperature increases, the extreme displacement, extreme velocity, and extreme acceleration all show a slight increasing trend with the rising service temperature. A similar trend is observed in the out-of-plane direction.
Table 5 shows the trend in the reduction rate of extreme response with temperature. As the temperature increases, the reduction rate of the extreme response in the transmission tower gradually decreases. When the temperature is between 0 °C and 30 °C, the reduction rate of extreme velocity is greater than that of extreme displacement and extreme acceleration. At 0 °C, the reduction rates of velocity in the in-plane and out-of-plane directions are 37.09% and 39.55%, respectively. As the temperature increases to 40 °C, the reduction rates of displacement and velocity become similar. The reduction rates of extreme acceleration in both directions are the smallest, at 10.73% and 13.94%, respectively. Overall, the control effect on extreme velocity is relatively better at different service temperatures.
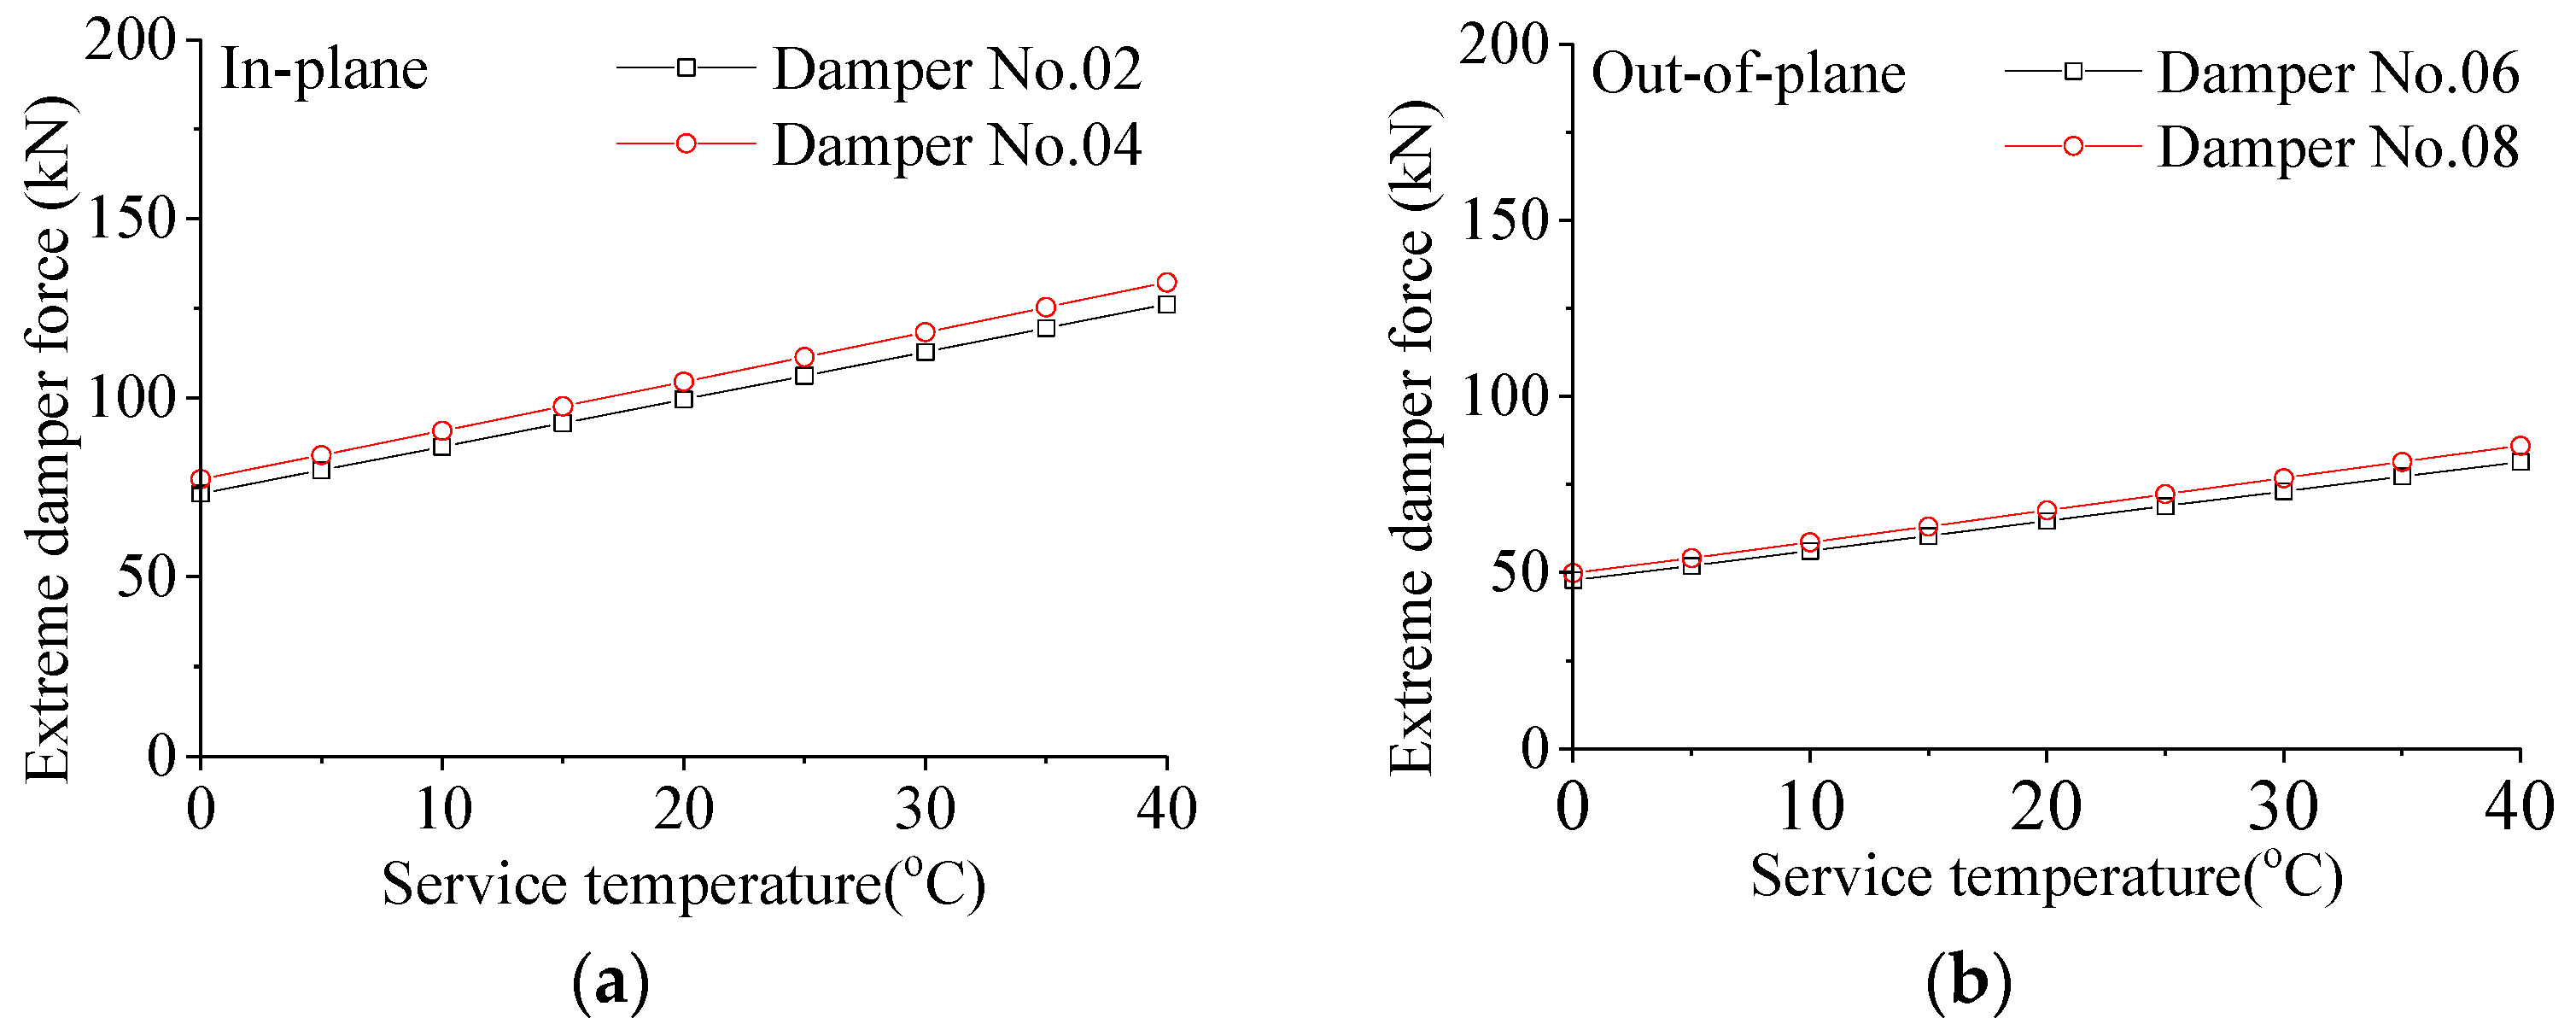
Figure 13 shows the variation of extreme damper force and extreme damper deformation with temperature. It can be observed that, as the temperature increases, the extreme damper force increases in both directions. The extreme damper force and extreme damper displacement in the in-plane direction are greater than those in the out-of-plane direction. The variation in extreme damper force in the out-of-plane direction is slower than that in the in-plane direction, and the extreme damper deformation increases slightly in both directions. This indicates that, as the service temperature rises, the effect of temperature on the damper force is greater than its effect on damper deformation.

7. Conclusions

This paper has presented an analytical framework for the control of random wind-induced vibration in TTL systems with the SMAD. The optimal installation scheme for the SMAD was determined through a real case study, and the effects of damper stiffness and service temperature on the random wind-induced vibration response and control performance were discussed. The conclusions drawn from the case study are as follows:
(1)
All four installation schemes effectively mitigate the random wind-induced vibration response of the TTL system. However, Scheme No. 4, where the SMA damper is installed concentrically at the upper part of the tower body, demonstrates the best control performance, with a damping rate exceeding 30%, significantly outperforming the other schemes. In comparison, the damping effects of the other schemes, particularly those using distributed installation or lower tower placements, are relatively lower, and the control performance is less effective than that of Scheme No. 4.
(2)
The first two modes contribute mainly to the system’s response, with the first mode contributing the most. The PSD peak corresponding to the first mode of the control system is reduced by approximately 80%. SMAD does not change the inherent vibration characteristics of the system.
(3)
Damper stiffness significantly affects the damper’s control performance. Increasing the damper stiffness leads to a significant reduction in the extreme response of the transmission tower. A recommended value of Cs is 1.0. For different damper stiffness values, the control effect on extreme velocity is relatively better.
(4)
Service temperature affects the damper’s control performance. As the temperature increases, the control performance of the transmission tower decreases. At 0 °C, the control performance of SMAD is the best in both the in-plane and out-of-plane directions, with velocity reduction rates of 37.09% and 39.55%, respectively. The control effect on extreme velocity is relatively better at different service temperatures.

Author Contributions

Conceptualization, M.C.; methodology, M.C. and X.F.; software, M.C. and D.X.; validation, M.C. and S.Z.; formal analysis, M.C.; investigation, M.C. and D.X.; resources, M.C. and X.F.; data curation, M.C. and S.Z.; writing—original draft preparation, M.C.; writing—review and editing, M.C., X.F. and S.Z.; visualization, M.C. and D.X.; supervision, M.C.; project administration, M.C.; funding acquisition, M.C.; All authors have read and agreed to the published version of the manuscript.

Funding

This research received no external funding.

Data Availability Statement

The data generated and/or analyzed during this study are not publicly available due to privacy and our ongoing research.

Acknowledgments

The authors sincerely appreciate the selfless support provided by the Wuhan University of Technology during the progress of this study.

Conflicts of Interest

The authors declare no conflicts of interest.

Abbreviations

The following abbreviations are used in this manuscript:
SMAShape memory alloy
SMADShape memory alloy damper
TTLTransmission tower-line
TTL–SMADTransmission tower-line with shape memory alloy damper
TMDTuned mass damper
MDOFMulti-degree-of-freedom
PEMPseudo Excitation Method
PSDPower spectral density

References

  1. Li, J.-X.; Yang, T.; Zhang, C.; Sun, L.; Qu, C.-X. Typhoon fragility analysis of transmission tower-line system considering wind-induced fatigue. Eng. Struct. 2025, 338, 120572. [Google Scholar] [CrossRef]
  2. Jin, Q.; Liu, J.; Rong, K.; Zhang, R.; Tian, L.; Meng, X. Enhancing the wind-resistant performance of transmission towers with cross-shield non-destructive continuous strengthening measure. Thin-Walled Struct. 2025, 216, 113703. [Google Scholar] [CrossRef]
  3. Tian, L.; Luo, J.Y.; Zhou, M.Y.; Bi, W.Z.; Liu, Y.P. Research on vibration control of a transmission tower-line system using SMA-BTMD subjected to wind load. Struct. Eng. Mech. 2022, 82, 571–585. [Google Scholar]
  4. Xue, J.; Xiang, Z.; Ou, G. Predicting single freestanding transmission tower time history response during complex wind input through a convolutional neural network based surrogate model. Eng. Struct. 2021, 233, 111859. [Google Scholar] [CrossRef]
  5. Roy, S.; Kundu, C.K. State of the art review of wind induced vibration and its control on transmission towers. Structures 2021, 29, 254–264. [Google Scholar] [CrossRef]
  6. Chen, B.; Guo, W.H.; Li, P.Y.; Xie, W.P. Dynamic responses and vibration control of the transmission tower-line system: A state-of-the-art review. Sci. World J. 2014, 2014, 538457. [Google Scholar] [CrossRef]
  7. Chen, B.; Zheng, J.; Qu, W.L. Control of wind-induced response of transmission tower-line system by using magnetorheological dampers. Int. J. Struct. Stab. Dyn. 2009, 9, 661–685. [Google Scholar] [CrossRef]
  8. Sheng, Z.Y.; Xia, C.; Xu, W.P.; Li, P.Y. Analytical study on wind-induced vibration and its control of transmission towers in mountainous area. Appl. Mech. Mater. 2011, 105–107, 635–639. [Google Scholar] [CrossRef]
  9. Zeng, C.; Hao, D.X.; Hou, L.Q. Research on calculation of equivalent damping ratio of electrical transmission tower-line system with viscoelastic dampers. Adv. Mater. Res. 2014, 1064, 115–119. [Google Scholar] [CrossRef]
  10. Chen, B.; Weng, S.; Zhi, L.H.; Li, D.M. Response control of a large transmission tower-line system under seismic excitations using friction dampers. Adv. Struct. Eng. 2016, 20, 1155–1173. [Google Scholar] [CrossRef]
  11. Zhang, P.; Song, G.; Li, H.N.; Lin, Y.X. Seismic control of power transmission tower using pounding TMD. J. Eng. Mech. 2013, 139, 1395–1406. [Google Scholar] [CrossRef]
  12. Koutsoloukas, L.; Nikitas, N.; Aristidou, P. Passive, semi-active, active and hybrid mass dampers: A literature review with associated applications on building-like structures. Dev. Built Environ. 2022, 12, 100094. [Google Scholar] [CrossRef]
  13. An, Z.; Wang, W.; Wang, H.; Li, Z.; Wang, D.; Xie, G. Seismic performance research on a graded-yielding metal brace with self-centering functions. Buildings 2024, 14, 3940. [Google Scholar] [CrossRef]
  14. Song, G.; Ma, N.; Li, H.N. Applications of shape memory alloys in civil structures. Eng. Struct. 2006, 28, 1266–1274. [Google Scholar] [CrossRef]
  15. Tabrizikahou, A.; Kuczma, M.; Łasecka-Plura, M. Application and modelling of shape-memory alloys for structural vibration control: State-of-the-art review. Constr. Build. Mater. 2022, 342, 127975. [Google Scholar] [CrossRef]
  16. Zuo, X.B.; Li, A.Q. Numerical and experimental investigation on cable vibration mitigation using shape memory alloy damper. Struct. Control Health Monit. 2011, 18, 20–39. [Google Scholar] [CrossRef]
  17. Casciati, F.; Faravelli, L. A passive control device with SMA components: From the prototype to the model. Struct. Control Health Monit. 2009, 16, 751–765. [Google Scholar] [CrossRef]
  18. Shi, F.; Zhou, Y.; Ozbulut, O.E.; Ren, F.M. Hysteretic response and failure behavior of an SMA cable-based self-centering brace. Struct. Control Health Monit. 2022, 29, e2847. [Google Scholar] [CrossRef]
  19. Huang, H.Y.; Chang, W.S. Application of pre-stressed SMA-based tuned mass damper to a timber floor system. Eng. Struct. 2018, 167, 143–150. [Google Scholar] [CrossRef]
  20. Huang, H.Y.; Chang, W.S. Re-tuning an off-tuned tuned mass damper by adjusting temperature of shape memory alloy: Exposed to wind action. Structures 2020, 25, 180–189. [Google Scholar] [CrossRef]
  21. Chen, B.; Song, X.X.; Li, W.B.; Wu, J.B. Vibration control of a wind-excited transmission tower-line system by shape memory alloy dampers. Materials 2022, 15, 1790. [Google Scholar] [CrossRef]
  22. Wu, J.B.; Chen, B.; Zhi, L.H.; Song, X.X. Seismic response mitigation of a television transmission tower by shape memory alloy dampers. Materials 2021, 14, 6987. [Google Scholar] [CrossRef]
  23. Lin, J.H.; Zhang, Y.H.; Zhao, Y. Pseudo Excitation Method and Some Recent Developments. Procedia Eng. 2011, 14, 2453–2458. [Google Scholar] [CrossRef]
  24. Zhang, Z.; Zhang, Y.; Lin, J.; Zhao, Y.; Howson, W.P.; Williams, F.W. Random vibration of a train traversing a bridge subjected to traveling seismic waves. Eng. Struct. 2011, 33, 3546–3558. [Google Scholar] [CrossRef]
  25. Hu, L.; Xu, Y.L.; Huang, W.F. Typhoon-induced nonstationary buffeting response of long-span bridges in complex terrain. Eng. Struct. 2013, 57, 406–415. [Google Scholar] [CrossRef]
  26. Zhao, Y.; Si, L.T.; Ouyang, H. Frequency domain analysis method of nonstationary random vibration based on evolutionary spectral representation. Eng. Comput. 2018, 35, 1098–1127. [Google Scholar] [CrossRef]
  27. Zhong, Y.L.; Li, S.; Jin, W.C.; Yan, Z.T.; Liu, X.P.; Li, Y. Frequency domain analysis of along-wind response and study of windloads for transmision tower subjected to downbursts. Buildings 2022, 12, 148. [Google Scholar] [CrossRef]
  28. Li, H.N.; Shi, W.L.; Wang, G.X.; Jia, L.G. Simplified models and experimental verification for coupled transmission tower-line system to seismic excitations. J. Sound Vib. 2005, 286, 569–585. [Google Scholar] [CrossRef]
  29. Andrawes, B.; Desroches, R. Effect of ambient temperature on the hinge opening in bridges with shape memory alloy seismic restrainers. Eng. Struct. 2007, 29, 2294–2301. [Google Scholar] [CrossRef]
  30. Araya, R.; Marivil, M.; Mir, C.; Moroni, O.; Sepulveda, A. Temperature and grain size effects on the behavior of CuAlBe SMA wires under cyclic loading. Mater. Sci. Eng. A 2008, 496, 209–213. [Google Scholar] [CrossRef]
  31. Graesser, E.J.; Cozzarelli, F.A. Shape-memory alloys as new materials for aseismic isolation. J. Eng. Mech. (ASCE) 1991, 117, 2590–2608. [Google Scholar] [CrossRef]
  32. Graesser, E.J.; Cozzarelli, F.A. A proposed three-dimensional constitutive model for shape memory alloys. J. Intell. Mater. Syst. Struct. 1994, 5, 78–89. [Google Scholar] [CrossRef]
  33. Jia, Y.Q.; Wang, C.; Zhang, R.F.; Li, L.Z.; Lu, Z.D. A double shape memory alloy damper for structural vibration control. Int. J. Struct. Stab. Dyn. 2021, 21, 2150098. [Google Scholar] [CrossRef]
  34. Du, X.W.; Sun, G.; Sun, S.S. Piecewise linear constitutive relation for pseudo-elasticity of shape memory alloy (SMA). Mater. Sci. Eng. A 2005, 393, 332–337. [Google Scholar] [CrossRef]
  35. Yan, X.; Nie, J. Response of SMA superelastic systems under random excitation. J. Sound Vib. 2000, 238, 893–901. [Google Scholar] [CrossRef]
  36. Wen, Y.K. Equivalent linearization for hysteretic systems under random excitation. J. Appl. Mech. 1980, 47, 150–154. [Google Scholar] [CrossRef]
  37. Guo, Z.; Hou, W.; Yao, H.; Liu, Y.; Zhang, Y. Dynamic responses of monopile offshore wind turbines under different wind-wave misalignment angles. Structures 2024, 69, 107454. [Google Scholar] [CrossRef]
  38. Yang, H.; Yang, M.; Lu, X.; Song, M. Analysis of the dynamic characteristics of corroded offshore wind turbine steel piles under extreme wind, wave, and current loads. Ocean Eng. 2025, 332, 121298. [Google Scholar] [CrossRef]
  39. Tang, J.; Cai, Q.; Dai, K.; Liu, Y.; Heng, J.; Luo, Y. A cable-based tuned inerter damper for edgewise vibration control of the wind turbine blade. Eng. Struct. 2025, 323, 119248. [Google Scholar] [CrossRef]
  40. Xing, L.; Gardoni, P.; Zhou, Y.; Zhang, P. Optimal models of outrigger locations and damping parameters for combined energy dissipation outrigger systems subject to seismic and wind loads. J. Build. Eng. 2023, 76, 107209. [Google Scholar] [CrossRef]
  41. Miao, Q.; Low, Y.M. Efficient long-term extreme response and fatigue analysis of offshore structures under stochastic wave, current, and wind loads. Mar. Struct. 2025, 103, 103815. [Google Scholar] [CrossRef]
  42. Zhao, Z.; Low, Y.M. Extreme value analysis of multivariate gaussian processes with wave-passage effects. J. Sound Vib. 2025, 596, 118703. [Google Scholar] [CrossRef]
  43. China Ministry of Construction. GB 50009-2012; Load Code for the Design of Building Structures. Chinese Architectural Industry Press: Beijing, China, 2012. (In Chinese)
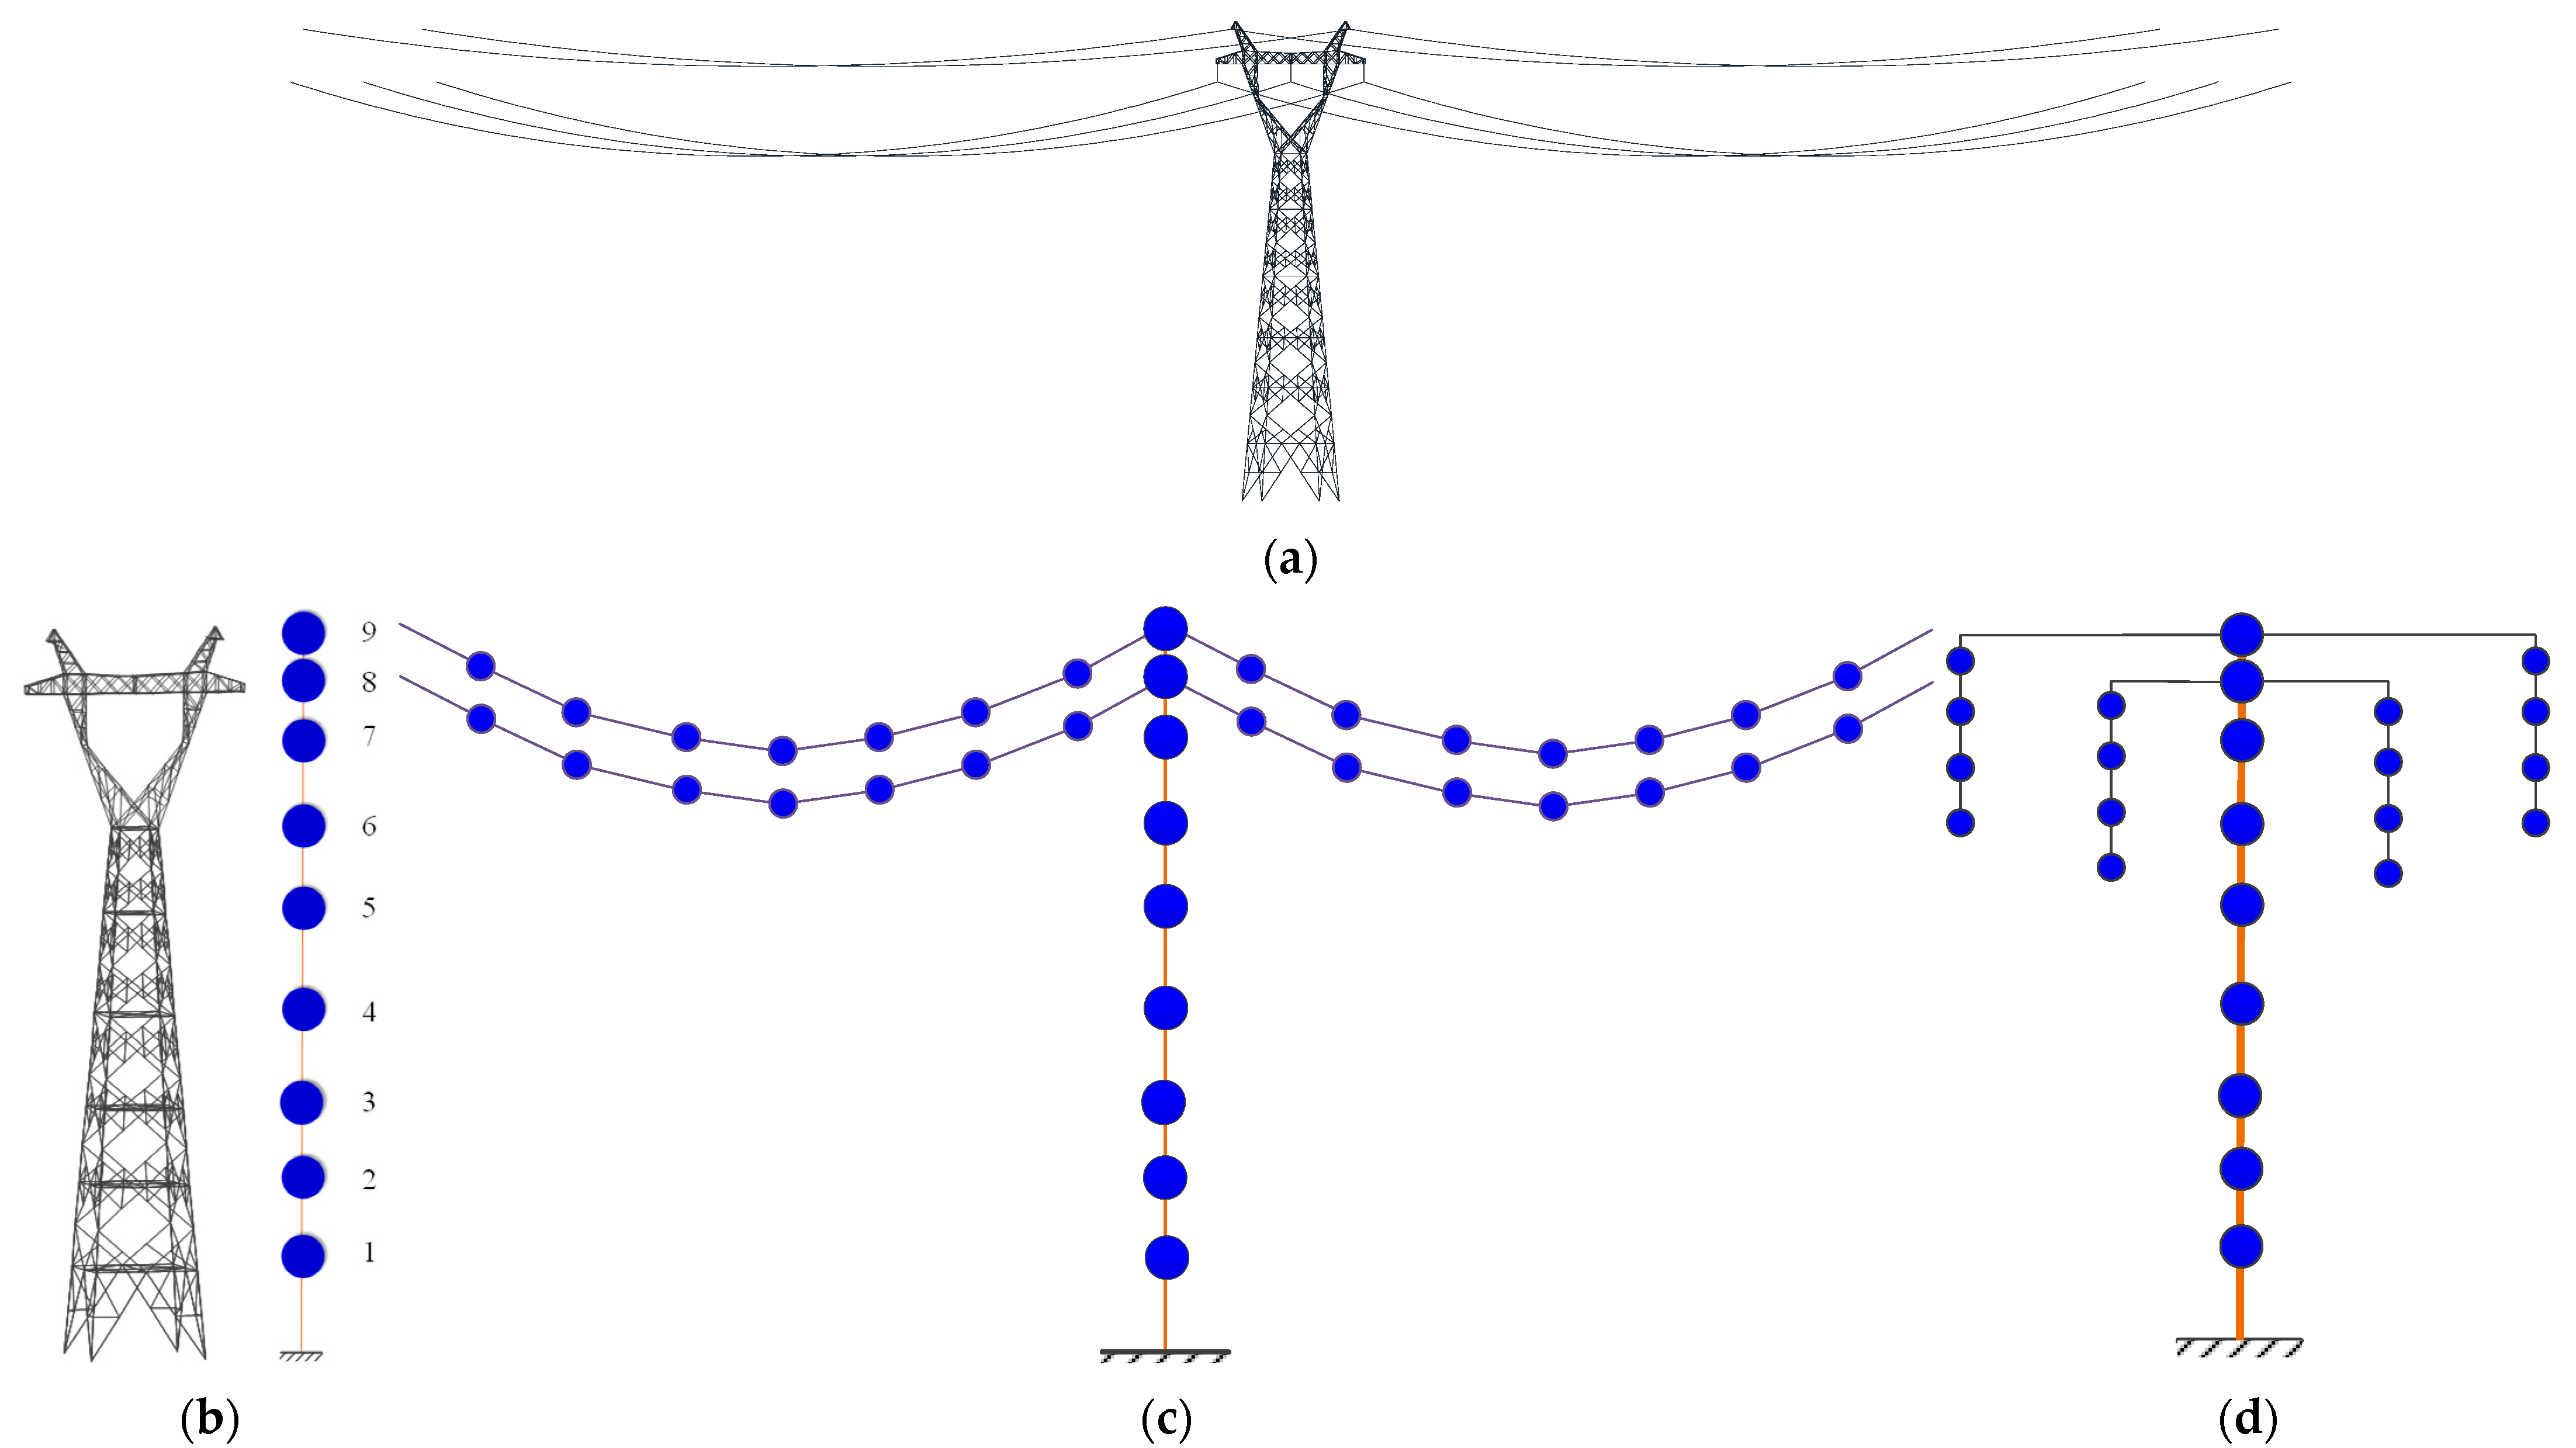
Figure 1. TTL system model: (a) finite element model of the TTL system; (b) MDOF model of the transmission tower; (c) MDOF model of the TTL system in the in-plane direction; (d) MDOF model of the TTL system in the out-of-plane direction.
Buildings 15 03091 g001
Figure 2. Force-deformation relationship of SMA: (a) phase transition diagram; (b) piecewise linear model.
Buildings 15 03091 g002
Figure 3. SMAD structure diagram.
Buildings 15 03091 g003
Figure 4. Schematic diagram of the transmission tower with the SMAD system.
Buildings 15 03091 g004
Figure 5. Mode shape diagram of the TTL system.
Buildings 15 03091 g005
Figure 6. Schematic illustration of the four SMAD installation schemes. (a) Scheme No. 1; (b) Scheme No. 2; (c) Scheme No. 3; (d) Scheme No. 4.
Buildings 15 03091 g006
Figure 7. Extreme responses for different installation schemes: (a) extreme displacement; (b) extreme velocity; (c) extreme acceleration; (d) extreme displacement; (e) extreme velocity; (f) extreme acceleration.
Buildings 15 03091 g007
Figure 8. Response PSD: (a) in-plane response PSD (linear scale); (b) in-plane response PSD (logarithmic scale); (c) out-of-plane response PSD (linear scale); (d) out-of-plane response PSD (logarithmic scale).
Buildings 15 03091 g008aBuildings 15 03091 g008b
Figure 9. Variation of extreme response with Cs: (a) extreme displacement; (b) extreme velocity; (c) extreme acceleration; (d) extreme displacement; (e) extreme velocity; (f) extreme acceleration.
Buildings 15 03091 g009
Figure 10. Variation of the reduction rate of extreme response with Cs: (a) in-plane; (b) out-of-plane.
Buildings 15 03091 g010
Figure 11. Variation of extreme damper force and damper deformation with Cs: (a) damper force; (b) damper force; (c) damper deformation; (d) damper deformation. (Note: In the in-plane direction, two dampers (No. 1–2) are installed in the fifth mass layer and two (No. 3–4) in the sixth mass layer. In the out-of-plane direction, two (No. 5–6) are in the fifth mass layer, and two (No. 7–8) are in the sixth mass layer.).
Buildings 15 03091 g011aBuildings 15 03091 g011b
Figure 12. Variation in extreme response with service temperature: (a) extreme displacement; (b) extreme velocity; (c) extreme acceleration; (d) extreme displacement; (e) extreme velocity; (f) extreme acceleration.
Buildings 15 03091 g012
Figure 13. Variation in extreme damper force and damper deformation with service temperature: (a) damper force; (b) damper force; (c) damper deformation; (d) damper deformation. (Note: In the in-plane direction, two dampers (No. 1–2) are installed in the fifth mass layer and two (No. 3–4) in the sixth mass layer. In the out-of-plane direction, two (No. 5–6) are in the fifth mass layer, and two (No. 7–8) are in the sixth mass layer.).
Buildings 15 03091 g013aBuildings 15 03091 g013b
Table 1. Relationships between the force, deformation, and stiffness of the SMA.
ForceDisplacementStiffness
F a = σ s c r + C M ( T M s ) S u a = F a L D A S k O a = D A S L
F b = σ f c r + C M ( T M s ) S u b = F b D M S + ε l L k a b = F b F a u b u a
F c = C A ( T A s ) S u c = u b ( F b F c ) L D M S k b c = D M S L
F d = C A ( T A f ) S u d = F d L D A S k c d = F c F d u c u d
Table 2. Basic physical parameters of SMA wires.
ParameterValueParameterValueParameterValue
Mf−46 °CCM10 MPa/°C σ s c r 120 MPa
As−18.5 °CCA15.8 MPa/°C σ f c r 190 MPa
Ms−37.4 °CDA75,000 MPaεL0.079
Af−6 °CDM29,300 MPa
Table 3. SMAD installation schemes in the in-plane and out-of-plane directions.
SchemeInstallation LayersDampers per LayerTotal DampersInstallation Type
No. 1Mass No. 1, 22 per mass layer4Lower part, concentrated
No. 2Mass No. 1, 2, 3, 41 per mass layer4Lower half, uniform
No. 3Mass No. 3, 4, 5, 61 per mass layer4Upper half, uniform
No. 4Mass No. 5, 62 per mass layer4Upper part, concentrated
Table 4. Reduction rate of extreme responses for different installation schemes (%).
DirectionLocationExtreme
Response
Scheme
No. 1
Scheme
No. 2
Scheme
No. 3
Scheme
No. 4
In-planeMass No. 6
(Top of tower body)
Displacement5.077.7813.9531.62
Velocity6.059.2316.5838.09
Acceleration7.319.5117.0632.50
Mass No. 8
(Cross arm)
Displacement4.987.6513.7631.18
Velocity5.838.9916.1937.46
Acceleration5.437.9314.4530.99
Mass No. 9
(Tower top)
Displacement4.997.6713.8031.29
Velocity5.868.9716.1537.09
Acceleration6.057.9914.4227.82
Out-of-planeMass No. 6
(Top of tower body)
Displacement4.958.2915.7533.76
Velocity5.869.7518.6240.21
Acceleration6.689.5017.7933.39
Mass No. 8
(Cross arm)
Displacement4.828.1115.4633.08
Velocity5.659.5518.3139.83
Acceleration5.589.0316.6934.86
Mass No. 9
(Tower top)
Displacement4.818.0915.4332.99
Velocity5.699.5518.2839.55
Acceleration6.359.5718.0235.62
Table 5. Variation in reduction rate of extreme response with service temperature (%).
DirectionResponseService Temperature
0 °C10 °C20 °C30 °C40 °C
In-planeDisplacement31.2928.5325.5622.3218.73
Velocity37.0932.4227.6122.6017.26
Acceleration27.8223.8519.7215.3610.73
Out-of-planeDisplacement32.9929.8326.5023.1219.31
Velocity39.5534.3929.1924.0518.52
Acceleration35.6230.3024.9219.5913.94
Disclaimer/Publisher’s Note: The statements, opinions and data contained in all publications are solely those of the individual author(s) and contributor(s) and not of MDPI and/or the editor(s). MDPI and/or the editor(s) disclaim responsibility for any injury to people or property resulting from any ideas, methods, instructions or products referred to in the content.