Article

Dual-Branch EfficientNet Model with Hybrid Triplet Loss for Architectural Era Classification of Traditional Dwellings in Longzhong Region, Gansu Province

1
School of Architecture and Urban Planning, Shenyang Jianzhu University, Shenyang 110168, China
2
School of Printing, Packaging and Digital Media, Xi’an University of Technology, Xi’an 710048, China
3
School of Mechanical Engineering, Southwest Jiaotong University, Chengdu 610031, China
*
Authors to whom correspondence should be addressed.
Buildings 2025, 15(17), 3086; https://doi.org/10.3390/buildings15173086
Submission received: 7 July 2025 / Revised: 16 August 2025 / Accepted: 26 August 2025 / Published: 28 August 2025
(This article belongs to the Section Architectural Design, Urban Science, and Real Estate)

Abstract

Traditional vernacular architecture is an important component of historical and cultural heritage, and the accurate identification of its construction period is of great significance for architectural heritage conservation, historical research, and urban–rural planning. However, traditional methods for period identification are labor-intensive, potentially damaging to buildings, and lack sufficient accuracy. To address these issues, this study proposes a deep learning-based method for classifying the construction periods of traditional vernacular architecture. A dataset of traditional vernacular architecture images from the Longzhong region of Gansu Province was constructed, covering four periods: before 1911, 1912–1949, 1950–1980, and from 1981 to the present, with a total of 1181 images. Through comparative analysis of three mainstream models—ResNet50, EfficientNet-b4, and Vision Transformer—we found that EfficientNet demonstrated optimal performance in the classification task, achieving Accuracy, Precision, Recall, and F1-scores of 85.1%, 81.6%, 81.0%, and 81.1%, respectively. These metrics surpassed ResNet50 by 1.4%, 1.3%, 0.5%, and 1.2%, and outperformed Vision Transformer by 8.1%, 9.1%, 9.5%, and 9.1%, respectively. To further improve feature extraction and classification accuracy, we propose the “local–global feature joint learning network architecture” (DualBranchEfficientNet). This dual-branch design, comprising a global feature branch and a local feature branch, effectively integrates global structure with local details and significantly enhances classification performance. The proposed architecture achieved Accuracy, Precision, Recall, and F1-scores of 89.6%, 87.7%, 86.0%, and 86.7%, respectively, with DualBranchEfficientNet exhibiting a 2.0% higher Accuracy than DualBranchResNet. To address sample imbalance, a hybrid triplet loss function (Focal Loss + Triplet Loss) was introduced, and its effectiveness in identifying minority class samples was validated through ablation experiments. Experimental results show that the DualBranchEfficientNet model with the hybrid triplet loss outperforms traditional models across all evaluation metrics, particularly in the data-scarce 1950–1980 period, where Recall increased by 7.3% and F1-score by 4.1%. Finally, interpretability analysis via Grad-CAM heat maps demonstrates that the DualBranchEfficientNet model incorporating hybrid triplet loss accurately pinpoints the key discriminative regions of traditional dwellings across different eras, and its focus closely aligns with those identified by conventional methods. This study provides an efficient, accurate, and scalable deep learning solution for the period identification of traditional vernacular architecture.

1. Introduction

As humanity’s fundamental living carrier, vernacular dwellings embody rich historical and cultural information; they are material witnesses that reflect social change, technological evolution, and shifting aesthetics [1,2]. Over millennia, traditional dwellings have developed an integrated system that combines technical norms with artistic creation. Their construction techniques, spatial forms, and decorative features crystallize the social structures, cultural concepts, and ecological wisdom of specific historical periods [3]. Such “living heritage” possesses not only the material value of the buildings themselves, but also serves as a spiritual anchor for regional cultural identity. Yet, amid rapid urbanization, the spread of modern building technologies has marginalized traditional crafting skills, triggering severe problems such as architectural homogenization and the rupture of craft transmission [4,5,6]. In particular, the dating of traditional dwellings—the foundational step in heritage protection and research—directly affects the interpretation of historical information, the selection of restoration techniques, and the formulation of planning decisions.
Although determining the construction period of traditional vernacular dwellings is of multiple value—encompassing historical research, craft transmission, and planning management—it remains constrained by severe methodological limitations.
Historical research and cultural heritage: accurate dating helps reconstruct the social structure, household forms, and lifestyles of specific periods. Architectural heritage protection and technology: In cultural heritage conservation, the period label can be matched to contemporary techniques and materials. For example, the label can call up a typical material library of the corresponding period (such as late-Qing blue bricks or Republican cement mosaics) to provide a basis for restoration material selection and prevent chronological dissonance. Urban and rural planning: Understanding the architectural features of different periods avoids conflicts between new construction and the historical environment. For example, overlaying the period layer onto the national spatial-planning “one map” automatically generates a three-tier zoning of “historical-character core protection zone—coordination zone—modern zone”; governments can then prioritize the repair of high-risk, low-scarcity precincts and postpone intervention in high-density, well-preserved areas, thus reducing wholesale demolition and reconstruction. The list of scarce-era buildings output by the model can also be directly incorporated into the traditional dwelling restoration subsidy catalogue, increasing subsidy amounts.
However, existing identification methods exhibit significant shortcomings: documentary methods rely on scarce written records; typological analyses are constrained by the subjectivity of expert experience; and techniques such as 14C dating are costly and damage samples [7,8]. These limitations severely hinder large-scale vernacular-dwelling surveys and conservation efforts. In recent years, although deep learning has demonstrated strong potential in architectural-feature recognition [9,10], the international community has begun to explore its application in architectural heritage for tasks such as component extraction [11], defect diagnosis [12], style identification [13] and period dating [14], thus offering new research perspectives for dating traditional dwellings. Nevertheless, three deficiencies remain in studies on Chinese vernacular dwellings: (1) the absence of multi-scale analytical methods that integrate global morphology with local detail features; (2) insufficient consideration of the impact of imbalanced temporal-class distributions on model performance; and (3) the difficulty of directly applying existing international findings [11,12,13,14] to the characteristics of China’s timber-frame vernacular system. Therefore, developing an accurate and practical intelligent dating method for vernacular dwellings is both a technological imperative in the digital humanities era and an urgent need to solve key issues such as “chronological dissonance” in conservation practice. Thus, researching a deep learning model for classifying and visually analyzing traditional vernacular dwellings has an important value for historical research and cultural transmission, cultural-relic protection and restoration, urban and rural planning and heritage management, architectural science and technological history, and cultural tourism and public education.
This study presents a novel deep learning-based model for chronological classification of traditional vernacular architecture. The key contributions are as follows:
  • Through the survey of traditional residential buildings in the Longzhong region of Gansu Province, we classified and summarized the construction era of each dwelling, establishing an image dataset of traditional residential buildings from different eras in the Longzhong region of Gansu Province;
  • Through comparison of Accuracy, Precision, Recall, and F1-score metrics, we selected models more suitable for our classification task from the three models—EfficientNet, ResNet50, and Vision Transformer—namely, the EfficientNet and ResNet50 models;
  • To verify the advantage of our proposed “Local-Global Feature Joint Learning” model in classification tasks, we evaluated the enhanced DualBranchEfficientNet and DualBranchResNet50 models;
  • To solve the sample imbalance problem, we introduced the mixed triplet loss model based on the DualBranchEfficientNet and DualBranchResNet50 models and conducted comparative ablation experiments.
  • To verify the performance of the DualBranchEfficientNet model incorporating mixed triplet loss, we conducted per-era evaluation of various metrics for it and simultaneously conducted a comparison of its confusion matrix.
  • Using Grad-CAM to generate heat maps, we analyzed the features extracted by the DualBranchEfficientNet model with hybrid triplet loss from traditional dwellings of different eras. The results confirm that the model’s focus aligns closely with that of traditional methods, further validating its credibility.
The structure for the remaining sections of the paper is outlined as follows: Section 2 reviews prior work on traditional dating methodologies, machine learning approaches for architectural age prediction, multi-feature fusion techniques, and strategies for addressing class imbalance. Section 3 details the construction of our dataset and presents the proposed classification model—DualBranchEfficientNet integrated with a hybrid triplet loss function. Section 4 describes the experimental setup, reports quantitative results, and provides a comparative analysis. Finally, the paper concludes by presenting the findings and summarizing the key insights obtained.

2. Review of Literature

We established the following standards for selecting previous research. For research on architectural chronological classification, we selected representative studies employing traditional methodologies. Regarding machine learning-based approaches, we focused on recent advances (within the past five years) in predictive and classification models for architectural dating. For multi-scale feature fusion research, we prioritized studies from the last five years that utilized multi-scale techniques for feature recognition and classification. Concerning class imbalance, we reviewed recent literature (within the past three years) proposing algorithmic improvements to convolutional neural networks to mitigate this issue.

2.1. Research on Architectural Chronological Classification Using Traditional Methods

2.1.1. Documentary Evidence Dating Method

Documentary evidence constitutes a robust approach for dating historic architecture, encompassing inscriptions on buildings, epigraphic materials, and textual records [12]. For instance, the Nanchan Temple Hall in Wutai County, Shanxi Province, was verified as a Tang Dynasty reconstruction based on an inscription on its western beam [15]. Similarly, Toshōdai-ji Temple in Japan was confirmed to have been founded in 759 CE through records in the Shoku Nihongi [16].

2.1.2. Architectural Typology Dating Method

Historic architecture in China exhibits distinct stylistic characteristics across dynasties [17], primarily manifested in overall stylistic traits, bracket-set (dou-gong) configurations, beam-frame structures, column-base designs, decorative patterns, roof slopes and ridge ornaments, column proportions, and stairway forms. Feng Jiren conducted comparative analyses of Tang, Five Dynasties, Song, Yuan, Ming, and Qing structures through bracket-set and beam-frame typologies, establishing foundational reference frameworks for subsequent chronological studies [12]. Bai Lixia et al. [18] identified the Yunnlin Temple Mahavira Hall as Ming dynasty architecture based on its plan layout, bracket-sets, component features, beam-frame structure, and roof slope. Fen et al. [19] investigated Ming-Qing Datong vernacular dwellings using morphological characteristics including structural forms, roofing materials, and fenestration. Gu et al. [20] applied Chinese wooden-structural typological dating methods to analyze bracket-set features along the Gansu Silk Road, proposing five chronological phases: Late Tang-Northern Song, Northern-Southern Song, Ming Hongwu-Mid Jiajing, Late Jiajing-Kangxi, and Qianlong-Xuantong. Qiu et al. [21] classified Fuzhou vernacular dwellings into mid/late Ming, early/mid/late Qing, and Republican periods through systematic analysis of plinths, beam-frames, roof structures, and gable walls. Xu [22] proposed the “principle of synchronicity of original structural forms within a single building,” using the intersection of date ranges from multiple components to lock in the construction date. Wang [23], by cross-verifying bracket-set typochronology with documentary evidence, has essentially clarified the historical imprints left on the dougong of the Ming Changling Shenggong Shengde Stele Pavilion during the Xuande reign of the Ming dynasty, the mid-to-late Ming period, the Qianlong reign of the Qing dynasty, and the Republic of China period.

2.1.3. Radiocarbon (14C) Dating Technique

Radiocarbon dating is a chronometric method that determines the age of organic materials by measuring the residual 14C content, which decays exponentially with a half-life of 5730 years [24]. In wooden architectural components, the 14C concentration decreases predictably after tree felling; quantifying the remaining 14C enables estimation of the timber’s cutting date. When architectural typology or documentary evidence yields ambiguous or conflicting chronological data—such as the case of Jiwang Temple Hall [25], initially classified as Jin dynasty via typology but later dated to Yuan through inscriptions—complementary techniques become essential. To resolve this discrepancy, Xu Yitao et al. [24] collected 21 samples (including brackets, arches, beams, purlins, and columns) and applied radiocarbon dating, conclusively determining the hall’s construction to the early Northern Song period, no later than 1068 CE.

2.1.4. Dendrochronological Dating Method

Tree rings represent annual growth increments; within the same climatic zone, ring-width patterns of conspecific trees exhibit high synchronicity during any given period, enabling the construction of a regional master chronology from appropriately selected samples [11]. Developed in the early 20th century as a tool for archaeological dating and paleoclimate reconstruction [26], dendrochronology captures high-resolution environmental proxies that can be quantified through multiple metrics to achieve annual-level dating precision [27]. Given that most historic Chinese architecture is timber-framed, dendrochronology offers a robust solution: by extracting wooden elements from ancient structures and cross-dating them against established reference sequences, the felling dates of construction timbers can be accurately determined. For instance, Xu Yitao [28] integrated dendrochronological calibration data to constrain the construction period of Huilong Temple Hall—establishing a terminus post quem in the early Northern Song, a terminus ante quem no later than the Jin dynasty, and identifying the most probable interval as late Northern Song to early Jin (early-to-mid 12th century CE).

2.2. Machine Learning Approaches for Architectural Chronological Classification

In recent years, propelled by rapid advances in deep learning-based image recognition and classification, researchers have increasingly turned to neural-network architectures to tackle the problem of building-age estimation.
Zeppelzauer et al. [29] obtained images of buildings from the 1960s to 2010s in Austria through real estate appraisal reports and online images, and classified them into six periods. They used the AlexNet [30] model to classify these images. On the test set excluding renovated buildings, the accuracy was 61.35%. However, when renovated buildings were included, the accuracy dropped to only 34.94%. Sun et al. [31] employed a DenseNet121 [32] architecture to partition the Basisregistraties Adressen Gebouwen (BAG) dataset into nine distinct periods: pre-1652, 1653–1705, 1706–1764, 1765–1845, 1846–1910, 1911–1943, 1944–1977, 1978–1994, and 1995–2020, achieving a classification accuracy of 81%. However, when the same model—trained exclusively on Amsterdam buildings—was applied to Stockholm’s architectural stock, its accuracy sharply declined to 24%, demonstrating significant domain-shift limitations. Lee et al. [31] analyzed Paris street-view imagery to classify buildings into ten chronological periods, employing mid-level visual feature representation and discriminative element discovery techniques. Their analysis revealed that numerous identified patches effectively captured period-specific architectural elements characteristic of their respective eras. Whereas prior studies approached architectural dating as a classification task, Li et al. [33] investigated the problem from a regression perspective, estimating building ages through continuous value prediction. Li et al. integrated a convolutional neural network (CNN) with support vector regression (SVR) to predict building ages across Victoria, Australia, achieving a mean absolute error (MAE) of 11 years and a root-mean-square error (RMSE) of 12 years. Some scholars have combined TLS with UAV photogrammetry to produce detailed 3D models of the historic Jeddah district; while the method yields high accuracy, its high cost limits widespread adoption.
The above literature shows that AI applications in heritage architecture are currently concentrated in Europe and Australia. The intelligent dating of China’s rural timber-and-rammed-earth dwellings remains a blank area; moreover, existing studies mainly address stone-built structures. Direct application to China’s timber-and-earthen dwellings could therefore yield significant errors.

2.3. Multi-Scale Feature Fusion and Class-Imbalance Handling

Although machine learning-based architectural dating has made progress, current accuracies remain sub-optimal, mainly because (1) temporal differences manifest at both macro-structural and micro-decorative scales, and (2) the dataset is highly imbalanced across time periods. Recent work addresses these issues through a joint “multi-scale feature fusion + class-imbalance mitigation” strategy to enhance fine-grained temporal discrimination.
(a) Multi-scale feature fusion
Zhao et al. [34] introduced the Multi-Scale Subtraction Network (M2SNet), which employs a differential module to capture inter-layer discrepancies, boosting segmentation accuracy for lesions and fine structures; it outperforms prior methods on several medical datasets. Zhao et al. [17] proposed CDDFuse, leveraging Restormer to extract shallow cross-modal features and a dual-branch Transformer-CNN architecture to process global–local information simultaneously. Combined with invertible neural networks (INNs) and correlation-driven losses, CDDFuse achieves a 4.2% mIoU gain in semantic segmentation and a 3.1% AP gain in object detection on infrared-visible fusion tasks. Li et al. [35] constructed a hierarchical feature-fusion framework that first transforms and fuses multi-scale representations from a feature pyramid, then selects the three most discriminative region maps and merges them with global image features to determine subordinate classes. Evaluated on CUB-200-2011 and Stanford Dogs, the method attains 85.7% and 83.5% fine-grained classification accuracy, respectively. Qin et al. [36] presented MSViT, whose encoder incorporates a Multi-Scale Feed-Forward Network (MSFFN) to jointly capture spatial and channel-wise multi-scale features, complemented by a Cross-Scale Feature Fusion Decoder (CFFD). On ImageNet, MSViT achieves 87.58% Top-1 accuracy, outperforming EdgeViT-XXS by 2.27%, validating the effectiveness of multi-scale fusion in general image classification.
(b) Class-imbalance handling
Class imbalance denotes large disparities in sample sizes among classes, causing models to bias toward the majority and neglect minorities. Solutions fall into data-level and algorithmic-level approaches. Data-level methods include oversampling [37], undersampling [38], and data augmentation [39]. Zhang et al. [40] introduced Random Walk Oversampling (RWO), generating synthetic samples that preserve the minority class mean and variance. Barnan et al. [41] proposed probabilistic RACOG and wRACOG. Lin et al. [42] apply K-means clustering to the majority class and select a subset whose size equals the minority count for undersampling. Zhang et al. [39] used rotation, translation, and mirroring to augment 1620 apple images, effectively preventing overfitting.
Algorithmic solutions center on loss functions or generative models. Li et al. [43] designed a cost-sensitive CNN for vehicle localization and classification in high-resolution imagery. Lin et al. [44] introduced focal loss, whose modulation factor focuses learning on hard minority samples, significantly improving accuracy. Dong et al. [45] appended a class-rebalancing regularizer to cross-entropy, incrementally enlarging the margin of minority classes. Information augmentation leverages transfer learning [46,47] or GAN/VAE-generated minority samples [48] to further alleviate imbalance.
Together, multi-scale feature fusion strengthens the characterization of cross-era macro- and micro-differences, while class-imbalance handling prevents minority periods from being overwhelmed, jointly providing a robust foundation for high-precision architectural dating.
Table 1 summarizes the aforementioned prior work on deep-learning performance enhancement.

3. Materials and Methods

3.1. Data Collection

3.1.1. Introduction of Object Area

Gansu Province, situated in the upper reaches of the Yellow River, borders Xinjiang, Shaanxi, Sichuan, Qinghai, Ningxia, Inner Mongolia, and Mongolia. It occupies a narrow transitional zone at the convergence of the Inner Mongolian Plateau, the Loess Plateau, and the Qinghai-Tibet Plateau [49]. Topography slopes from southwest to northeast, presenting a complex mosaic of mountains, plateaus, plains, valleys, deserts, and gobi. The region falls within the temperate monsoon climatic zone, exhibiting systematic northward transitions through tropical monsoon, temperate monsoon, temperate continental, and plateau alpine subtypes [50]. Annual precipitation ranges from 36 to 735 mm, giving rise to five distinct physiographic subregions: the Hexi Corridor, the Longzhong Loess Plateau, the Longdong Loess Plateau, the Gannan Plateau, and the Longnan Mountains [51].
Gansu’s diverse economies, cultures, topography, ethnicities, and religions have fostered vernacular architecture marked by pronounced ethnic and regional identities [49,52]. Traditional dwellings are predominantly earthen, encompassing cave dwellings (yaodong), rammed-earth courtyard compounds, plank houses, and earthen fortresses (tubaozi) [53,54,55]. Most extant structures date from the Qing dynasty, the Republican era, or the early People’s Republic (up to 1980). However, these heritage assets face severe threats from natural disasters, socio-political upheavals, urban expansion, and technological modernization, rendering their preservation an urgent imperative.
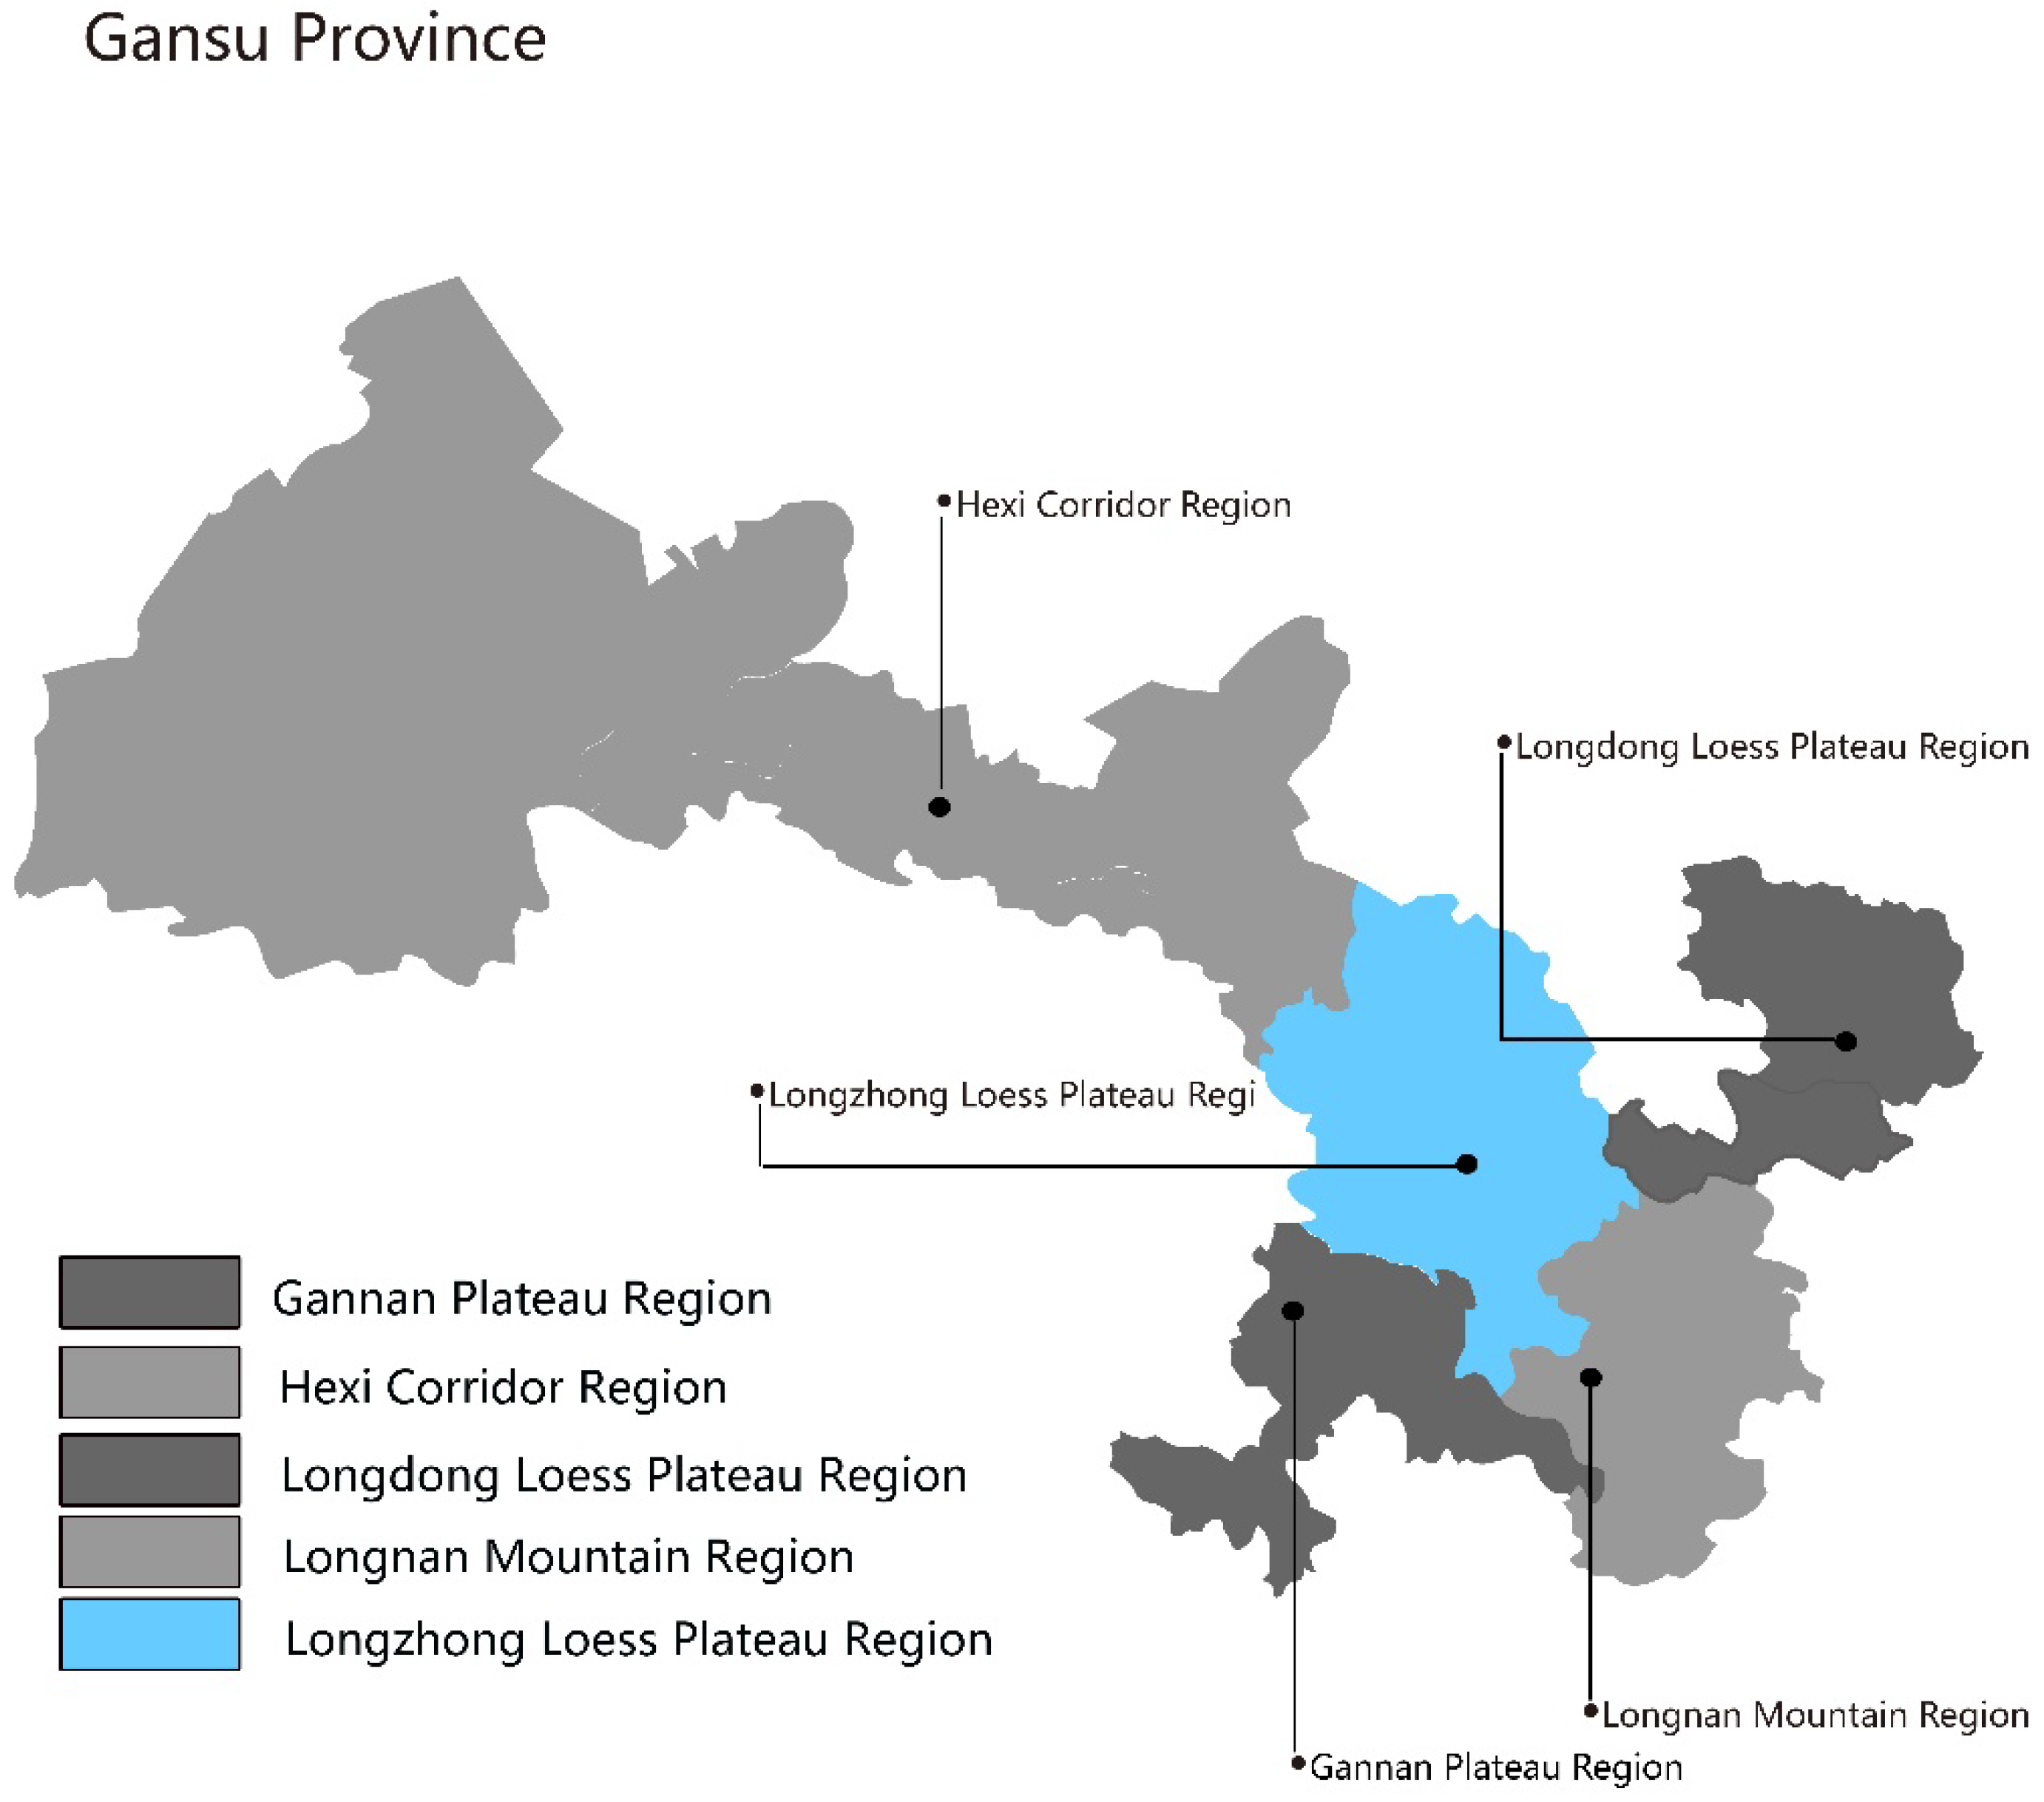
As shown in Figure 1, the Central Gansu Loess Plateau region is situated in central Gansu Province, bordering all four other geographical divisions of the province. Serving as a convergence zone for diverse residential architectural cultures, this area simultaneously features traditional dwellings that span a wider range of construction periods compared to other regions. Therefore, we selected the Central Gansu Loess Plateau as our study area.

3.1.2. Architectural Characteristics of Vernacular Dwellings in the Longzhong Loess Plateau

The Longzhong Loess Plateau encompasses Lanzhou City, Baiyin City, parts of Dingxi City (including Anding, Tongwei, Weiyuan, Lintao, and Longxi Counties), and the Linxia Hui Autonomous Prefecture [50]. Despite minor local variations, these areas share broadly comparable physiographic and cultural settings, giving rise to a coherent vernacular tradition dominated by cave dwellings (yaodong), fortified villages (baozhai), and rammed-earth/brick-wood courtyard compounds. Construction systems, building materials, and craft techniques are largely homogeneous, with courtyard walls typically formed by rammed earth or adobe bricks and roofs pitched as either single- or double-sloped structures [52].
(1)
Similarities
  • Architectural Configuration
Prototypical Configuration of Siheyuan: Across all historical periods, the fundamental layout consistently employs courtyard complexes (either quadrangular siheyuan or tri-wing compounds), emphasizing central axial symmetry and hierarchical protocols. Within this configuration, the principal residence (Zhengfang, central hall) maintains a position of architectural dominance [52].
Defensive Design: Reflecting the historical prevalence of warfare in Central Gansu, residential architecture across various periods consistently incorporates fortification features such as high perimeter walls, narrow windows, and reinforced gatehouses [56].
  • Material Selection
From the Qing Dynasty through the pre-1980 period, structures predominantly utilized timber-earth or brick-wood construction systems. These relied on locally sourced materials—including loess soil, gray bricks, and timber—with roofs typically designed in single-sloped or gentle-pitched configurations to accommodate the arid climate [57].
  • Plan Layout
The “Front Hall, Rear Chamber” Spatial Logic: Throughout historical periods, the central hall (Tangwu) consistently functioned as the familial communal space for ancestral worship and collective decision-making, while wing-rooms (Xiangfang) served as residential quarters [58].
  • Decorative Motifs
The Continuity of Auspicious Culture: Brick and timber carvings predominantly feature Confucian cultural signifiers such as “Three Auspicious Stars” (Fu-Lu-Shou) and “Four Scholarly Pursuits” (Qin-Qi-Shu-Hua). Gatehouse inscriptions—like “Poetry and Propriety Herald the Family” (Shi Li Chuan Jia)—visibly embody ancestral values [49,51].
(2)
Differences
As shown in Table 2, the differences among traditional dwellings in the Longzhong region of Gansu across different periods are summarized with respect to architectural configuration, material selection, plan layout, structural features, and decorative motifs.

3.2. Construction of a Traditional Vernacular Architecture Chronological Dataset

At present, no image dataset exists for traditional vernacular architecture of different eras in the Longzhong Loess Plateau, Gansu. Therefore, we must construct our own image dataset for this research. First, we collect images from field surveys of traditional dwellings conducted by our team in Gansu; next, we select the required images from those collected according to our needs; finally, to facilitate model training, we increase the number of images four-fold using random rotation and noise addition.

3.2.1. Data Selection

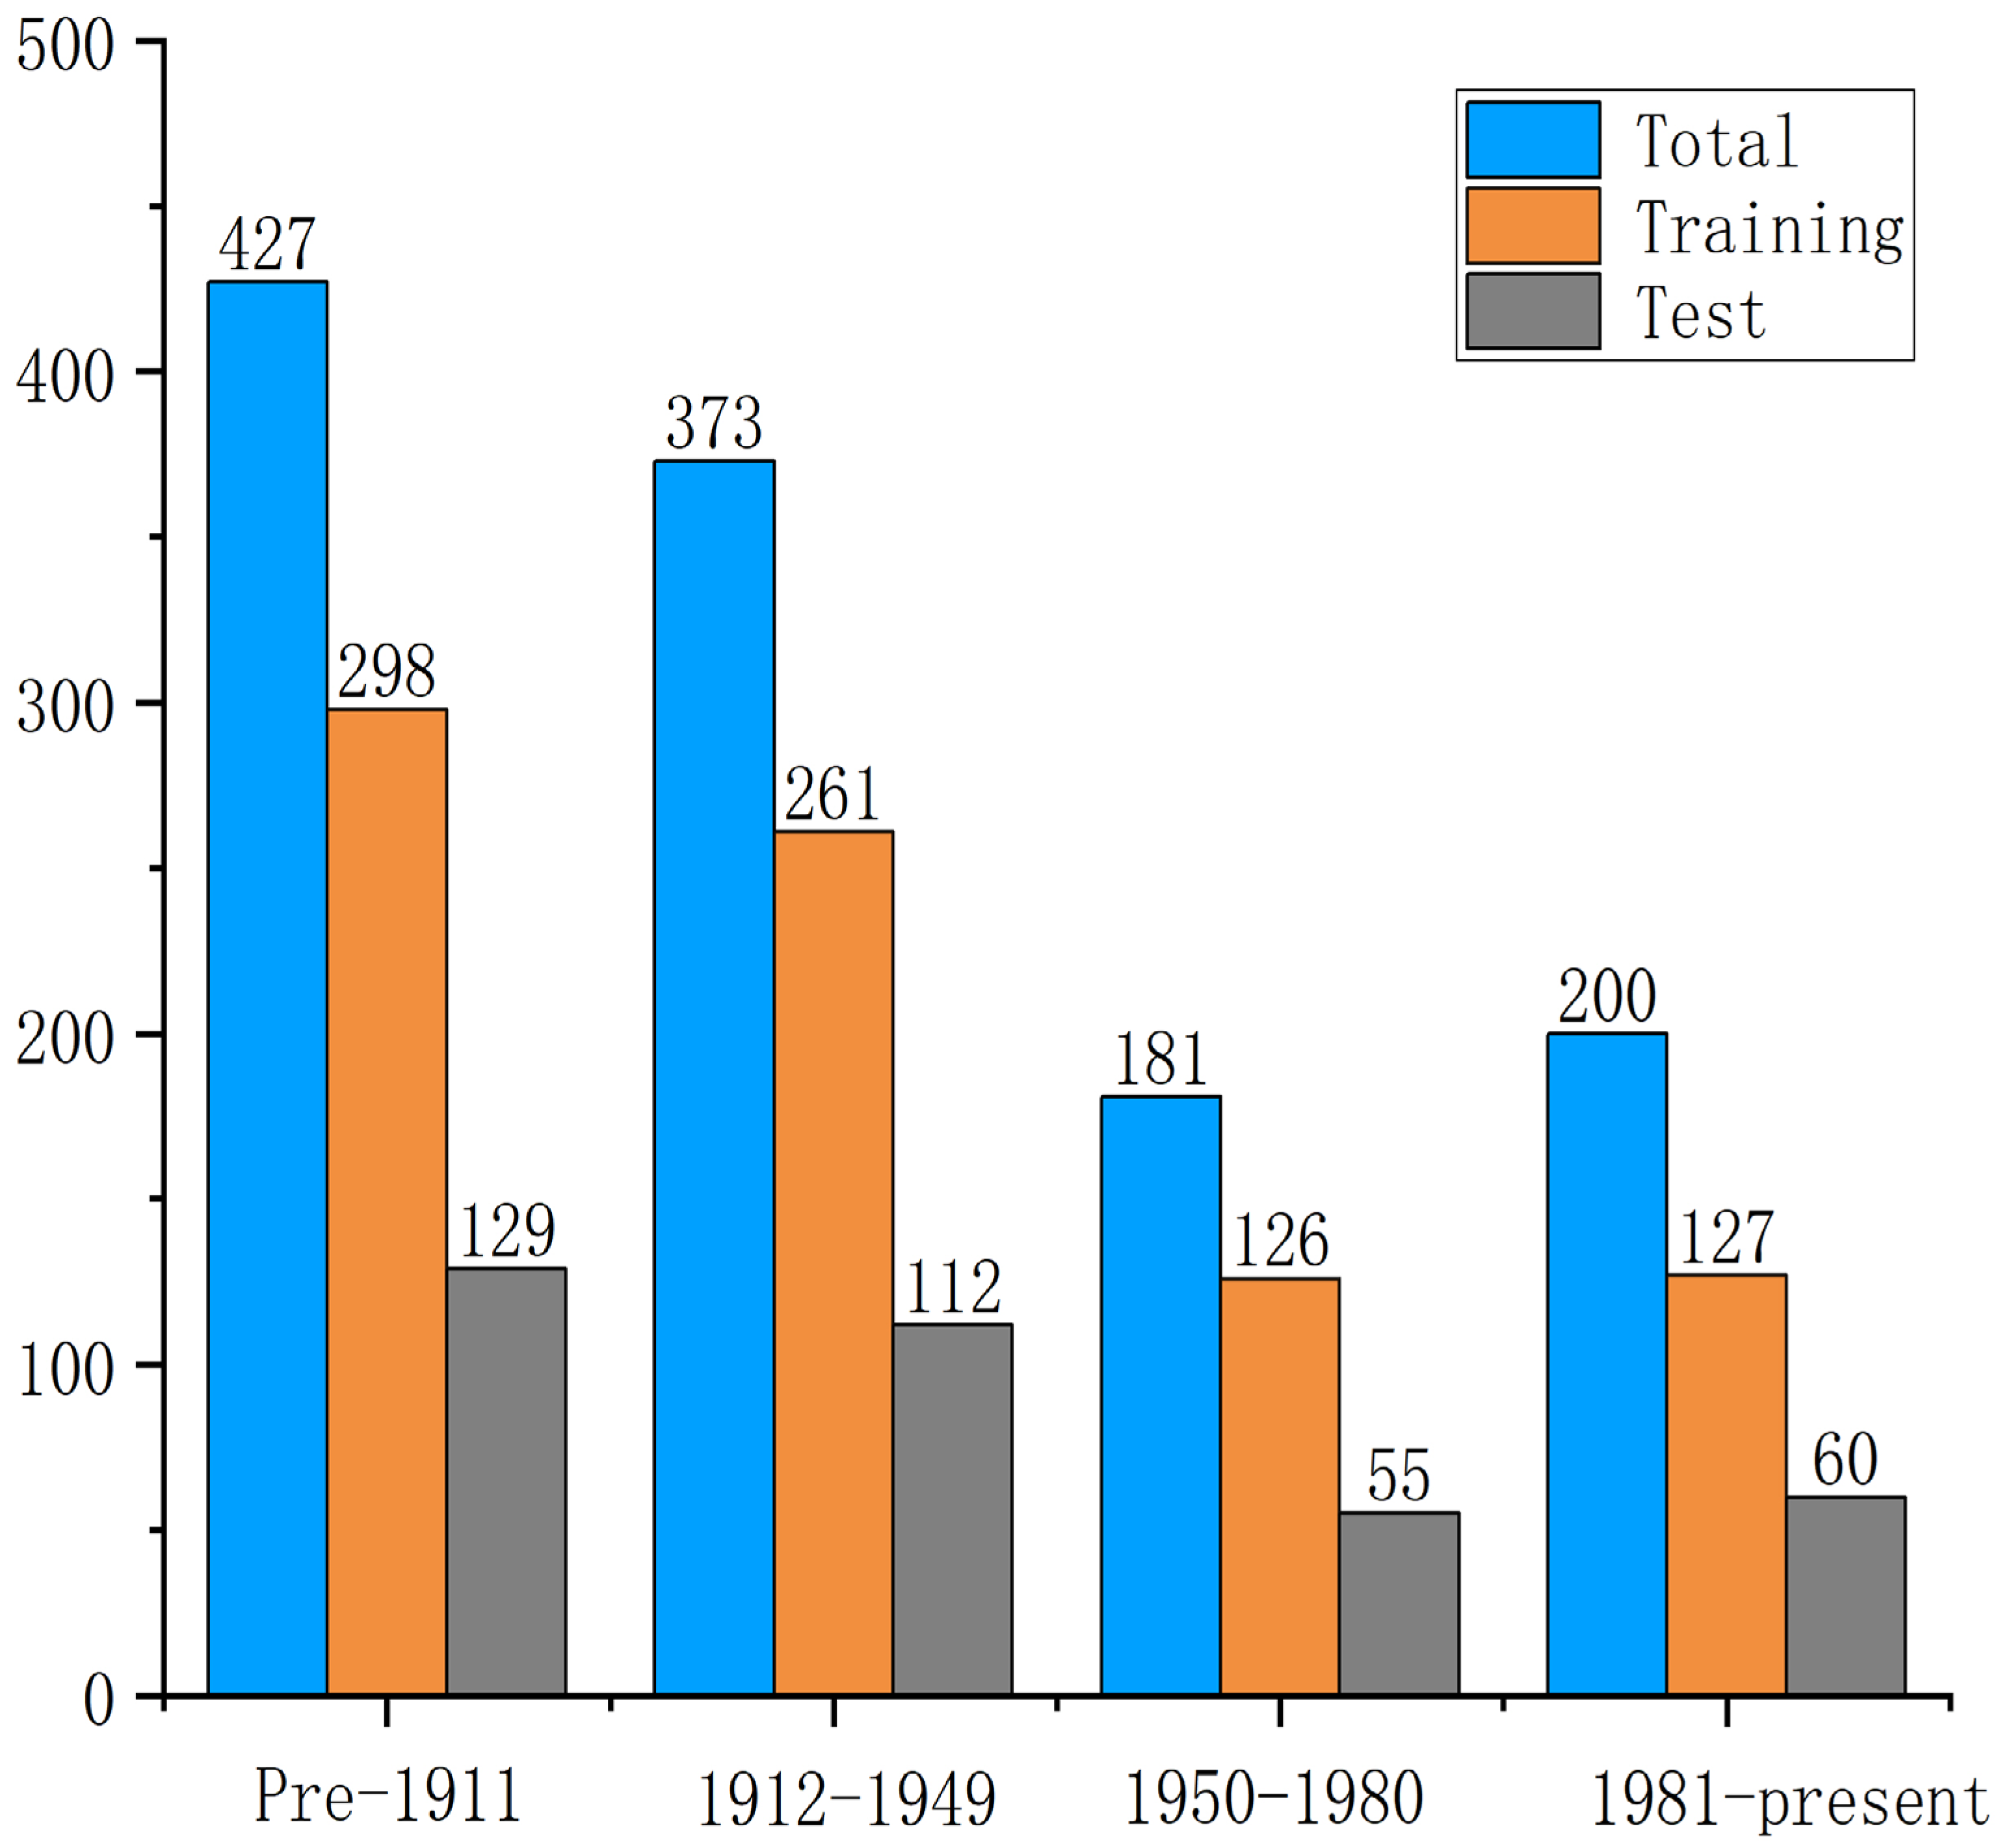
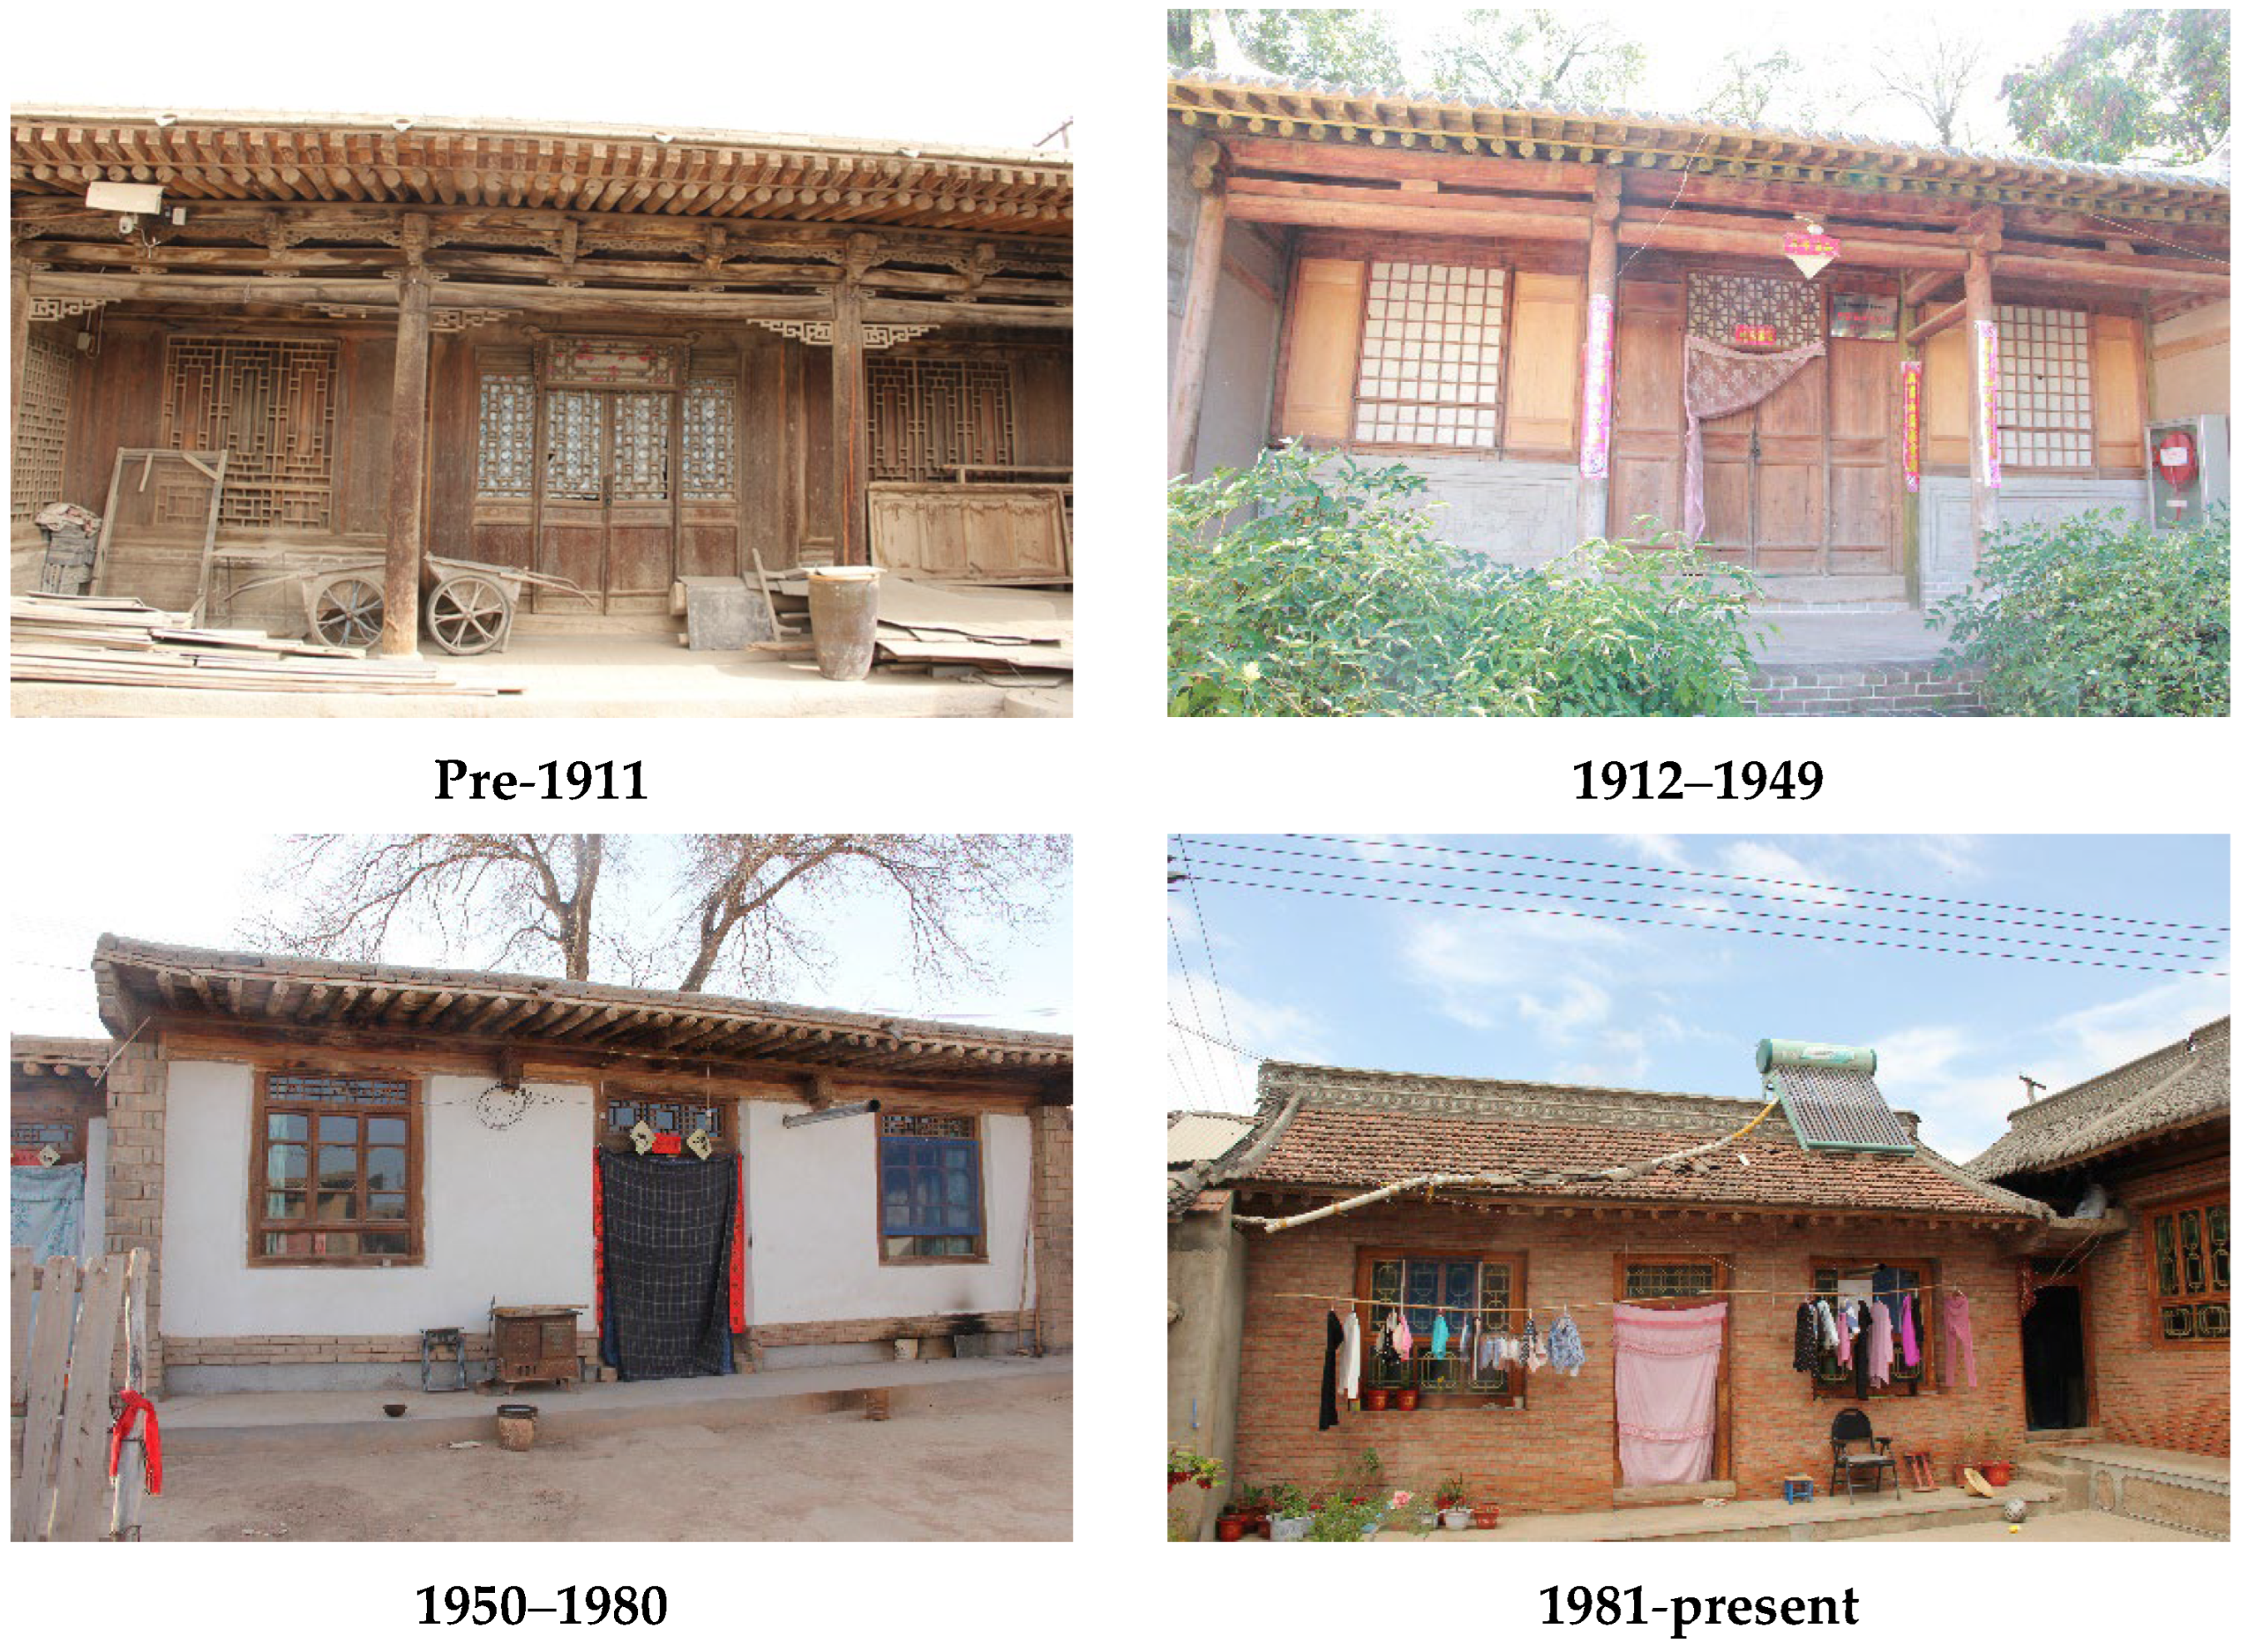
First, because the data are readily available, facade features are sufficient, the technology is mature, and costs are low, this study employs 2D imagery instead of 3D or point-cloud methods. Second, to ensure data validity and representativeness, we selected vernacular dwellings that meet the following criteria: located within national- or provincial-level traditional villages, national- or provincial-level historical-cultural cities/towns; possessing intact main structures; still used for traditional production/living; and reflecting period-specific characteristics. As shown in Table 3 and Figure 2, a total of 1181 images were selected. Their construction dates were determined through a synthesis of three sources: archival submissions, typological analysis, and oral testimony from occupants. Owing to the scarcity of historical buildings, and after considering both diachronic and synchronic factors, certain periods or regions exhibit severe sample imbalance or complete absence. Consequently, our classification follows the historical-evaluation criteria used for traditional villages and is divided into four time periods: pre-1911 (427 images), 1912–1949 (373 images), 1950–1980 (181 images), and 1981-present (200 images). We hereby confirm that all data were photographed by our team during on-site field investigations conducted between 2021 and 2024, and explicit permission was obtained from the homeowner(s) prior to each photo session. As the study is still ongoing, the dataset will not be released publicly at this time.

3.2.2. Data Preprocessing

For improved model training, we processed the selected images as follows: First, due to varying image sizes, we resized all selected images to 256 × 256 pixels. Second, we randomly split the selected images into training and testing sets at a 7:3 ratio. Finally, we increased the dataset size four-fold using methods such as random rotation and noise addition. Table 4 and Figure 3 show the number and distribution of images in the training and testing sets for different time periods.

3.3. Framework of the Model

3.3.1. Local–Global Feature Joint Learning Network Architecture

In architectural dating, macro-scale global features encompass overall structure, roof form, and courtyard layout, while micro-scale local features include door/window carvings, brick/tile details, and decorative motifs. Although global styles may appear similar across eras (e.g., Qing and Republican periods both feature siheyuan), local elements such as window-lattice patterns often exhibit stronger temporal signatures. Conventional single-branch models struggle to simultaneously capture both scales: global-focused architectures overlook critical details, local-centric models lack contextual awareness, and real-world images frequently suffer from occlusion and viewpoint variations.
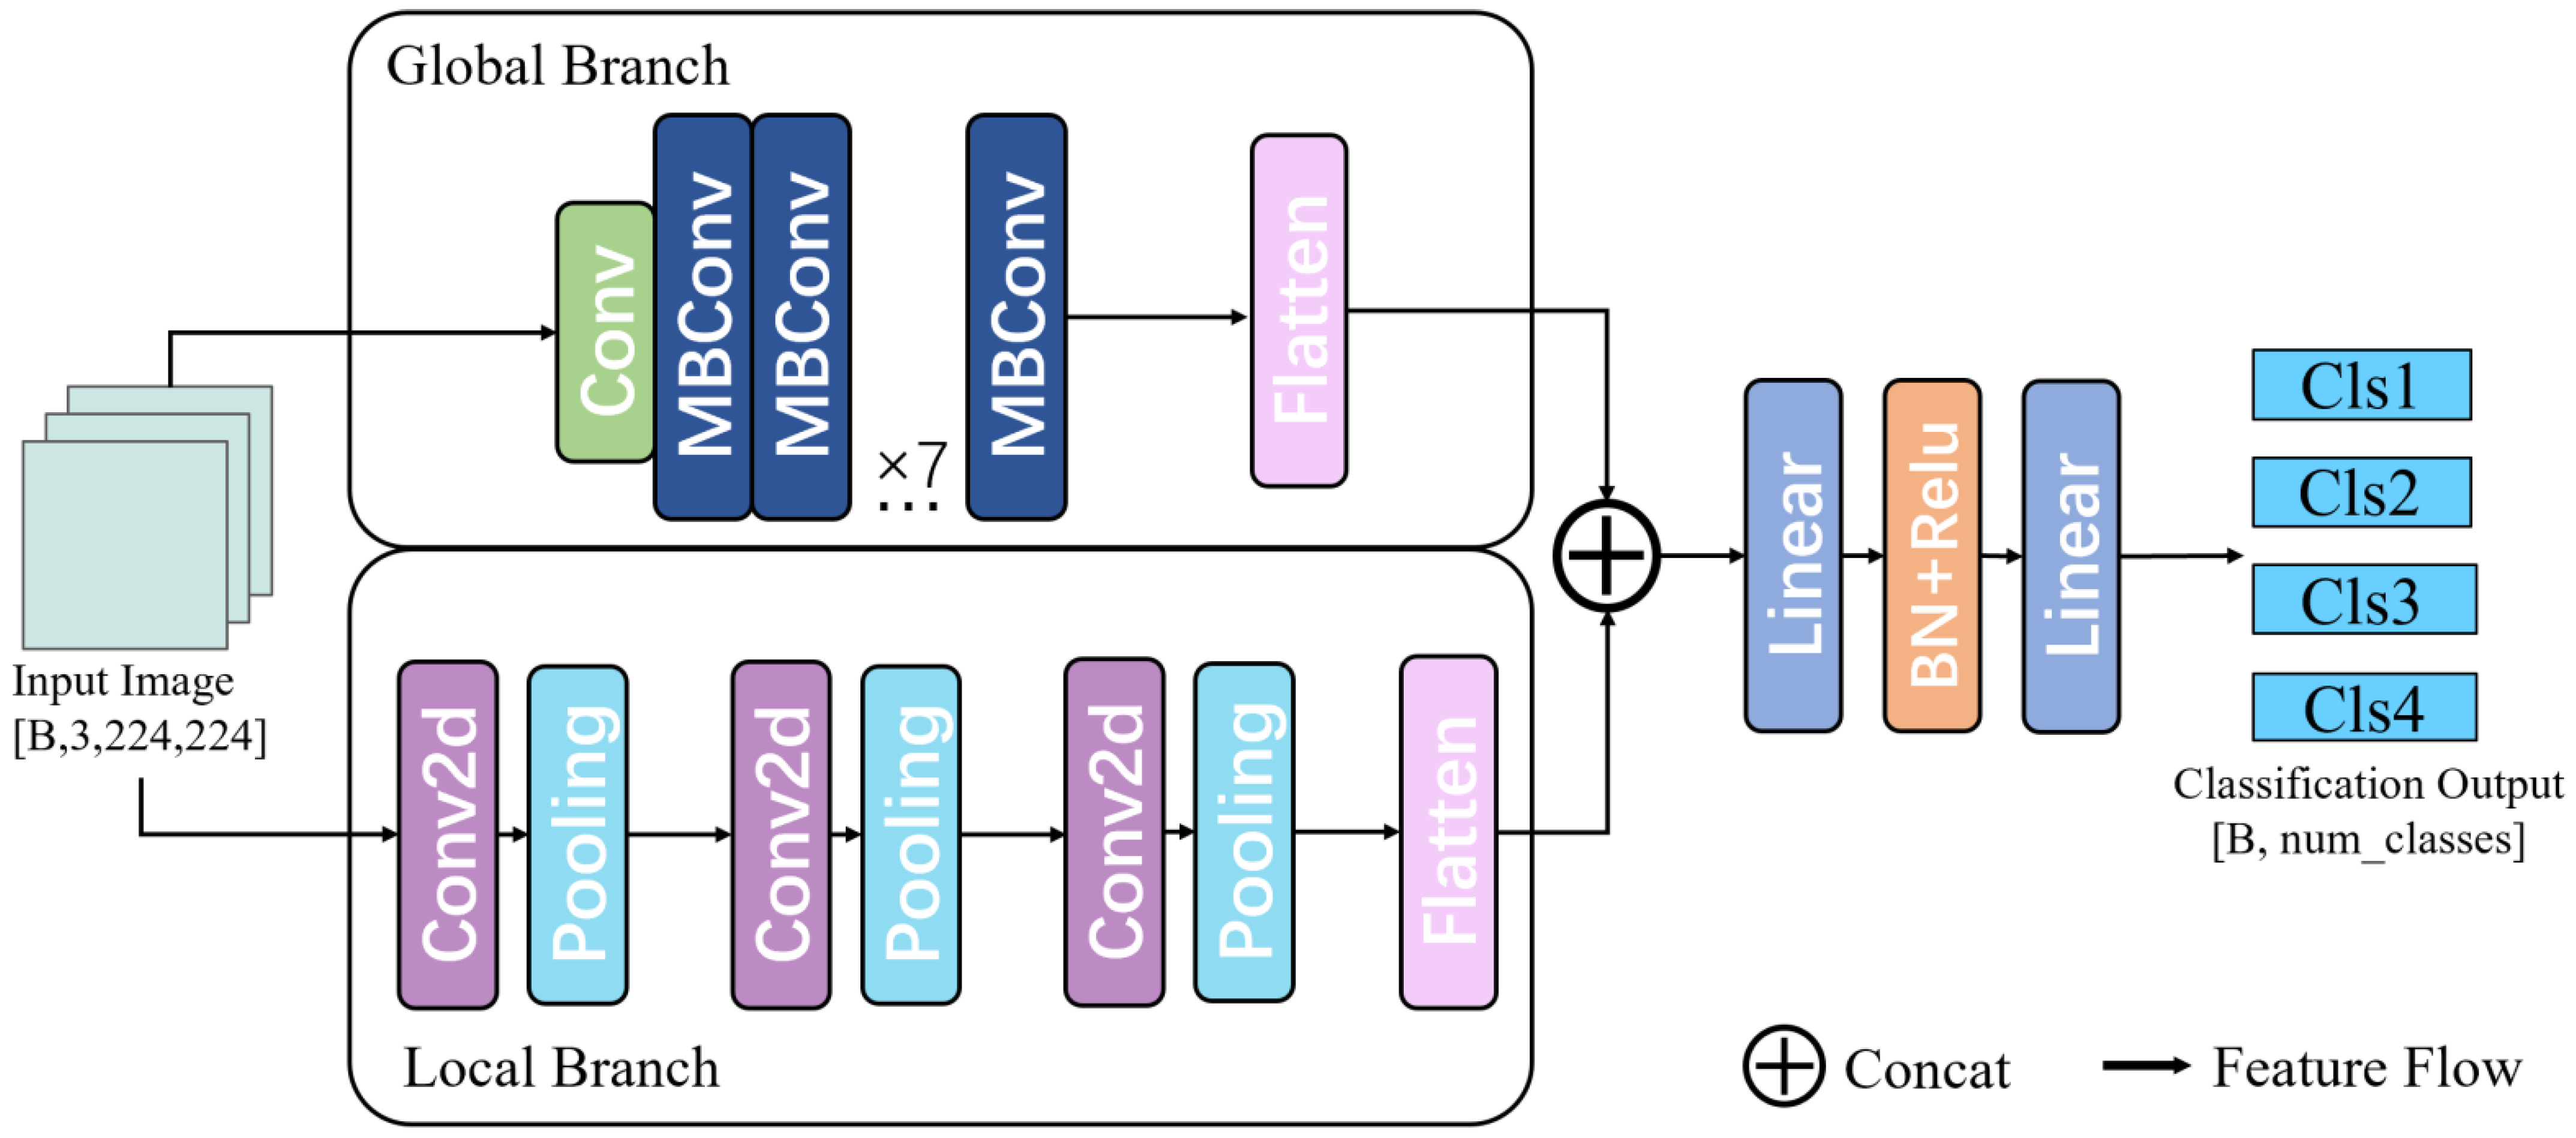
A dual-branch network is constructed on the foundation of DualBranchEfficientNet-b4, with the architectural layout illustrated in Figure 4.
DualBranchEfficientNet employs a shallow convolutional stream to capture fine-grained details and a deep convolutional stream to model global context. Global branch (EfficientNet backbone): Deep architecture with multiple downsampling steps (stride-2 convolutions or pooling) yields a final receptive field spanning the entire input, effectively encoding overall architectural style and layout. Local branch (lightweight CNN): Shallow structure with limited receptive fields preserves spatial detail, concentrating on local regions such as doors, windows, and carvings. Prior to fusion, both feature sets undergo standardization, followed by channel-wise concatenation to integrate macro- and micro-level evidence.

3.3.2. Hybrid Triplet Loss Strategy

In architectural chronological classification, severe class imbalance—where certain periods are heavily under-represented—causes conventional loss functions to over-emphasize majority classes while neglecting minority ones. Standard cross-entropy (CE) assigns substantial loss even to easily classified samples, allowing these low-difficulty instances to dominate gradient updates. Focal loss mitigates this imbalance by introducing a modulating factor that dynamically down-weighs the contribution of easy samples, thereby concentrating gradient flow on hard-to-classify instances—particularly those from minority classes.
F L ( p t ) = α ( 1 p t ) γ l o g ( p t )
Among them:
p t = p                                           i f   y = 1                                                   1 p               o t h e r w i s e                                                              
p t represents the probability that the model predicts a sample belongs to its true class.
At denotes the class weight factor, balancing positive and negative samples; γ denotes the focus parameter, controlling the weight of easy and hard samples, with a value range of [0, 5] that is positively correlated with the degree of class imbalance.
For the subtle differences between buildings of different eras, traditional cross-entropy loss can only learn the absolute boundaries of classes, while triplet loss enforces learning relative distance relationships. Global features may mask details, automatically focusing on discriminative local features.
Triplet loss is a loss function used in metric learning aimed at making samples of the same class closer and those of different classes further apart in the embedding space by comparing their distances. This helps the model learn more discriminative feature representations, indirectly assisting the model in better capturing the features of minority classes.
Each training sample consists of three elements:
(1) Anchor: The reference sample.
(2) Positive: A sample of the same class as the anchor.
(3) Negative: A sample of a different class from the anchor.
The formula for calculating triplet loss is as follows:
T L = m a x ( d ( A , P ) d ( A , N ) + m a r g i n , 0
Among them:
d(A,P): The feature distance between the anchor and the positive sample (typically using Euclidean distance);
d(A,N): The feature distance between the anchor and the negative sample;
Margin: The preset margin of safety.
Optimization objective: Ensure that the distance between same-class samples is at least margin units closer than the distance between different-class samples. Margin is a hyperparameter, empirically found to be optimally set at 0.5 in this study.
Combining focal loss with triplet loss to form a hybrid loss strategy, especially suitable for the chronological classification of Gansu architecture. This combination has a synergistic effect in addressing class imbalance and feature discrimination issues. Specifically, focal loss addresses class imbalance by increasing the focus on minority class samples (such as Republican era buildings), optimizing at the prediction probability level to ensure that minority classes are not overlooked. Triplet loss tackles the issue of insufficient feature discrimination, enhancing the separability of features from different eras of architecture, optimizing at the feature space level to ensure that feature clusters of different eras are well separated. The combined use of these two methods comprehensively optimizes classification performance, improving both accuracy and recall rates. The final loss function is as follows:
T o t a l   L o s s = F L + ε T L
where FL stands for Focal Loss, TL for Triplet Loss, and ε (epsilon) is the weight adjustment factor for the triplet loss; in this study, ε is taken to be 0.3.

4. Results and Discussion

In this section, we analyze and introduce the experimental data obtained from the methods proposed in this paper, namely, the use of deep learning methods for chronological classification of traditional dwellings in the Longzhong Loess Plateau region of Gansu. First, our study of traditional dwellings in the Longzhong Loess Plateau region of Gansu is divided by different eras, utilizing five different deep learning models: ResNet-50 [61], EfficientNet [62], Vision Transformer [63], DualBranchResNet, and DualBranchEfficientNet, to classify traditional dwellings from different eras. This allows us to determine the differences in performance among various deep learning models for classifying traditional dwellings from different eras in the Longzhong region of Gansu Province.
Secondly, to better address class imbalance and enhance the model’s ability to recognize and extract image features, we employed a hybrid triplet loss strategy to conduct ablation experiments on the model’s chronological classification task for architectural dating.
Lastly, to further verify the classification performance of the proposed model, we compared the DualBranchEfficientNet model with the hybrid triplet loss function against the traditional cross-entropy model in terms of classification metrics and confusion matrices across different eras.

4.1. Experimental Environment

To ensure the fairness and accuracy of the experiments, all input image data resolutions were adjusted to 224 × 224 pixels, and the batch size was set to 64. All models underwent training for 200 epochs. As shown in Table 5, the system used in this study is Ubuntu 20.04, with Python 3.8 as the programming language and PyTorch 2.1.0 as the environment. The graphics card is a NVIDIA RTX 4090D using CUDA 12.1, and the CPU is an Intel i9-14900k. The AdamW optimizer was used, with the initial learning rate set to 1 × 10⁻², and the final learning rate set to 0.01 times the maximum learning rate. The learning rate was reduced using a cosine annealing schedule.

4.2. Model Evaluation Metrics

In order to accurately and objectively evaluate the model’s performance on the classification task, a confusion matrix was first established to visually present the classification results. Secondly, we adopted four metrics—Accuracy, Precision, Recall, and F1-score—as criteria for judging the quality of classification, with each metric summarized as follows:
Confusion Matrix: It is the basis for evaluating the performance of classification models, intuitively showing the relationship between the model’s predictions and the actual labels in a tabular form, especially for binary classification problems. For binary classification tasks, the confusion matrix is a 2 × 2 matrix, as shown in Table 6, where each row represents the actual class and each column represents the predicted class.
  • TP (True Positive): Correctly predicted positive cases (correct identification);
  • FP (False Positive): Negative cases incorrectly predicted as positive (Type I Error, false alarm);
  • FN (False Negative): Positive cases incorrectly predicted as negative (Type II Error, missed detection);
  • TN (True Negative): Correctly predicted negative cases (correct rejection).
Accuracy: It is the most intuitive classification model evaluation metric, measuring the proportion of overall correct predictions and serving as a preliminary indicator of global model performance. Its calculation formula is expressed as follows:
Accuracy = TP TP + FP + FN + TN × 100 % ,
Precision: It is a critical evaluation metric for classification models, quantifying the proportion of true positive predictions among all positive predictions (i.e., the accuracy of positive predictions). It specifically emphasizes minimizing false alarms (False Positives, FP) and is computed as follows:
Precision = TP TP + FN × 100 % ,
Recall: Also known as sensitivity or true positive rate (TPR), it is a core performance metric for classification models. It quantifies the model’s ability to identify all actual positive instances, with its primary focus on minimizing missed detections (False Negative, FN). It is computed as follows:
Recall = TP TP + FN × 100 % ,
F1-score: It is one of the most critical composite metrics in classification model evaluation, defined as the harmonic mean of Precision and Recall. It is particularly suitable for imbalanced datasets or scenarios requiring simultaneous minimization of both false positive (FP) and false negative (FN). It is computed as follows:
F 1 - score = 2 × Precision × Recall Precision + Recall × 100 %

4.3. Baseline Model Evaluation and Selection

We conducted comparative experiments using three representative deep learning classification models: ResNet50, EfficientNet-b4 (which has a comparable number of parameters to ResNet50 and is hereafter referred to as EfficientNet in this paper), and Vision Transformer—a Transformer-based architecture suitable for classification tasks.
The results are presented in Table 7. The EfficientNet model achieved Accuracy, Precision, Recall, and F1-scores of 85.1%, 81.6%, 81.0%, and 81.1%, respectively. The ResNet50 model performed slightly below EfficientNet across all metrics, with scores of 83.7%, 80.3%, 79.5%, and 79.9%. The Vision Transformer model yielded the lowest scores among the three models at 77.0%, 72.5%, 71.5%, and 72.0%, respectively.
The results above indicate that Vision Transformer (ViT) delivered the weakest classification performance. This is primarily attributed to its core Transformer encoder architecture, which relies on self-attention mechanisms, contrasting with the CNN-based frameworks of EfficientNet and ResNet50. Regarding image input processing: EfficientNet and ResNet50 utilize local convolutional operations, whereas ViT employs linear embedding of image patches (lacking local inductive bias). Although ViT showcases powerful global modeling capacity for image classification, it exhibits high dependency on large-scale datasets—typically requiring over a million labeled samples to fully leverage its self-attention advantages. Conversely, EfficientNet and ResNet50 demonstrate superior performance on small-to-medium-sized datasets. These factors collectively explain the performance differences observed in the table. Our task involves classifying buildings from different eras, where distinguishing features between adjacent periods are often subtle. These differences primarily manifest in architectural details such as windows, roofs, eaves, materials, and structural elements.
In summary, given the specific classification task characteristics and dataset constraints, EfficientNet and ResNet50 models are better suited for the traditional residential building classification task in the Longzhong region of Gansu Province.

4.4. Improved Model Evaluation

The architectural characteristics across different eras manifest not only in macro-feature differences such as building structures, roof typologies, and courtyard layouts, but more significantly in micro-level local feature distinctions including carved patterns on doors/windows, brick/tile detailing, decorative motifs, building materials, and door/window proportions. Therefore, to better extract era-specific architectural features and enhance model classification accuracy, as established in Section 4.3, we selected EfficientNet and ResNet50 as backbone networks. Upon these, we constructed a dual-branch network, namely, the “Local-Global Feature Joint Learning Network Architecture.” Under identical experimental conditions, we compared the backbone networks with the improved network, with the results presented in Table 8.
In Table 8, the DualBranchResNet model achieved an Accuracy of 87.6%, Precision of 85.0%, Recall of 84.5%, and F1-score of 84.8%, which are 3.9%, 4.7%, 5.0%, and 4.9% higher than those of the ResNet50 model, respectively; the DualBranchEfficientNet-b4 model achieved an Accuracy of 89.6%, Precision of 87.7%, Recall of 86.0%, and F1-score of 86.7%, which are 4.5%, 6.1%, 5.0%, and 5.7% higher than those of the EfficientNet-b4 model, respectively; compared to the DualBranchResNet model, the DualBranchEfficientNet model achieved 2.0%, 2.7%, 1.6%, and 1.9% higher Accuracy, Precision, Recall, and F1-score, respectively. This is because the improved dual-branch network model adopts the “Local-Global Feature Joint Learning Network Architecture,” which for traditional residential buildings of different eras can extract not only macro-level differences in building structures, roof forms, and spatial layouts, but also accurately capture micro-level local features such as building materials, carved decorations, door/window styles, and building materials. Simultaneously, as evidenced by the table, our proposed DualBranchEfficientNet model achieved optimal performance across Accuracy, Precision, Recall, and F1-scores for classifying traditional residential buildings in the Longzhong region of Gansu Province across different eras.

4.5. Ablation Experiment

In the era classification task for traditional residential buildings in the Longzhong region of Gansu Province, the collected data from different periods exhibited a class imbalance problem, as shown in Table 3 and Figure 3. This imbalance primarily occurred because our data collection originated from the purpose of cultural heritage preservation; thus, during the collection process, greater emphasis was placed on traditional residential buildings from the pre-1911 era and the 1912–1949 period. For post-1949 buildings, due to social transformations and economic development, representative traditional residential structures are relatively scarce. Consequently, the data for the 1949–1980 and post-1981 periods became imbalanced compared to the pre-1911 and 1912–1949 periods. To address this, we employed a mixed triplet loss strategy to mitigate the class imbalance issue.
First, to determine the triplet loss weight adjustment coefficient ε, we experimented with different ε values; the classification results corresponding to each ε are presented in Table 9.
Based on the above pattern, focal loss contributes the most within the hybrid loss, while triplet loss also provides a noticeable contribution; therefore, we set ε to 0.3.
To validate our proposed method for addressing class imbalance, we conducted ablation studies on the DualBranchResNet and DualBranchEfficientNet models, with the results shown in Table 10.
As shown in Table 10, compared to the traditional cross-entropy (ce) model, the DualBranchResNet and DualBranchEfficientNet models with mixed triplet loss achieved significant improvements in Accuracy and F1-score. The DualBranchResNet model with mixed triplet loss attained Accuracy, Precision, Recall, and F1-scores of 88.8%, 87.0%, 85.5%, and 86.2%, respectively, representing increases of 1.2%, 2.0%, 1.0%, and 1.4% over the traditional cross-entropy (ce) model across these metrics. The DualBranchEfficientNet model achieved metrics of 90.5%, 88.9%, 87.6%, and 88.2%, outperforming the traditional cross-entropy (ce) model by 0.9%, 1.2%, 1.6%, and 1.5%, respectively. When comparing the DualBranchResNet and DualBranchEfficientNet models both incorporating mixed triplet loss, all four metrics of the DualBranchEfficientNet model are higher than those of the DualBranchResNet model. Consequently, the DualBranchResNet model with mixed triplet loss is better suited for our classification task.

4.6. DualBranchEfficientNet Model Per-Class and Confusion Matrix Comparison

4.6.1. Per-Class Comparison

To validate the classification performance of the improved model across different eras, as shown in Table 11, we conducted a comparative analysis of classification metrics between the traditional cross-entropy model and the model incorporating mixed triplet loss.
As shown in Table 11, for the pre-1911 era, both methods achieved exceptionally high performance, indicating that with sufficient data volume, models can stably learn features. However, the model with mixed triplet loss exhibited a slight 1.3% decrease in Precision, potentially due to diminished marginal optimization effects of triplet loss on abundant samples.
For the 1912–1949 era, the F1-score increased from 92.5% to 93.6% with minor performance fluctuations, suggesting stable classification for this period.
In the 1950–1980 era (with the fewest samples), Recall improved from 72.7% to 80.0% for the mixed triplet loss model, demonstrating that triplet loss enhances discriminability for minority classes through feature contrast when samples are scarce. However, Precision decreased by 1.8% (83.3→81.5) for this model, necessitating a trade-off between Recall and Precision (i.e., F1-score). The F1-score of the mixed triplet loss model was 4.1% higher than that of the traditional cross-entropy model (77.6%→81.7%).
For the post-1981 era, the mixed triplet loss model outperformed the cross-entropy model with a 4.5% Precision gain (82.8%→87.3%) and a 2.1% F1-score improvement (0.814→0.835), indicating effective suppression of misclassification for modern buildings.
The above demonstrates that the mixed triplet loss model delivers optimal performance compared to other classification models.

4.6.2. Confusion Matrix

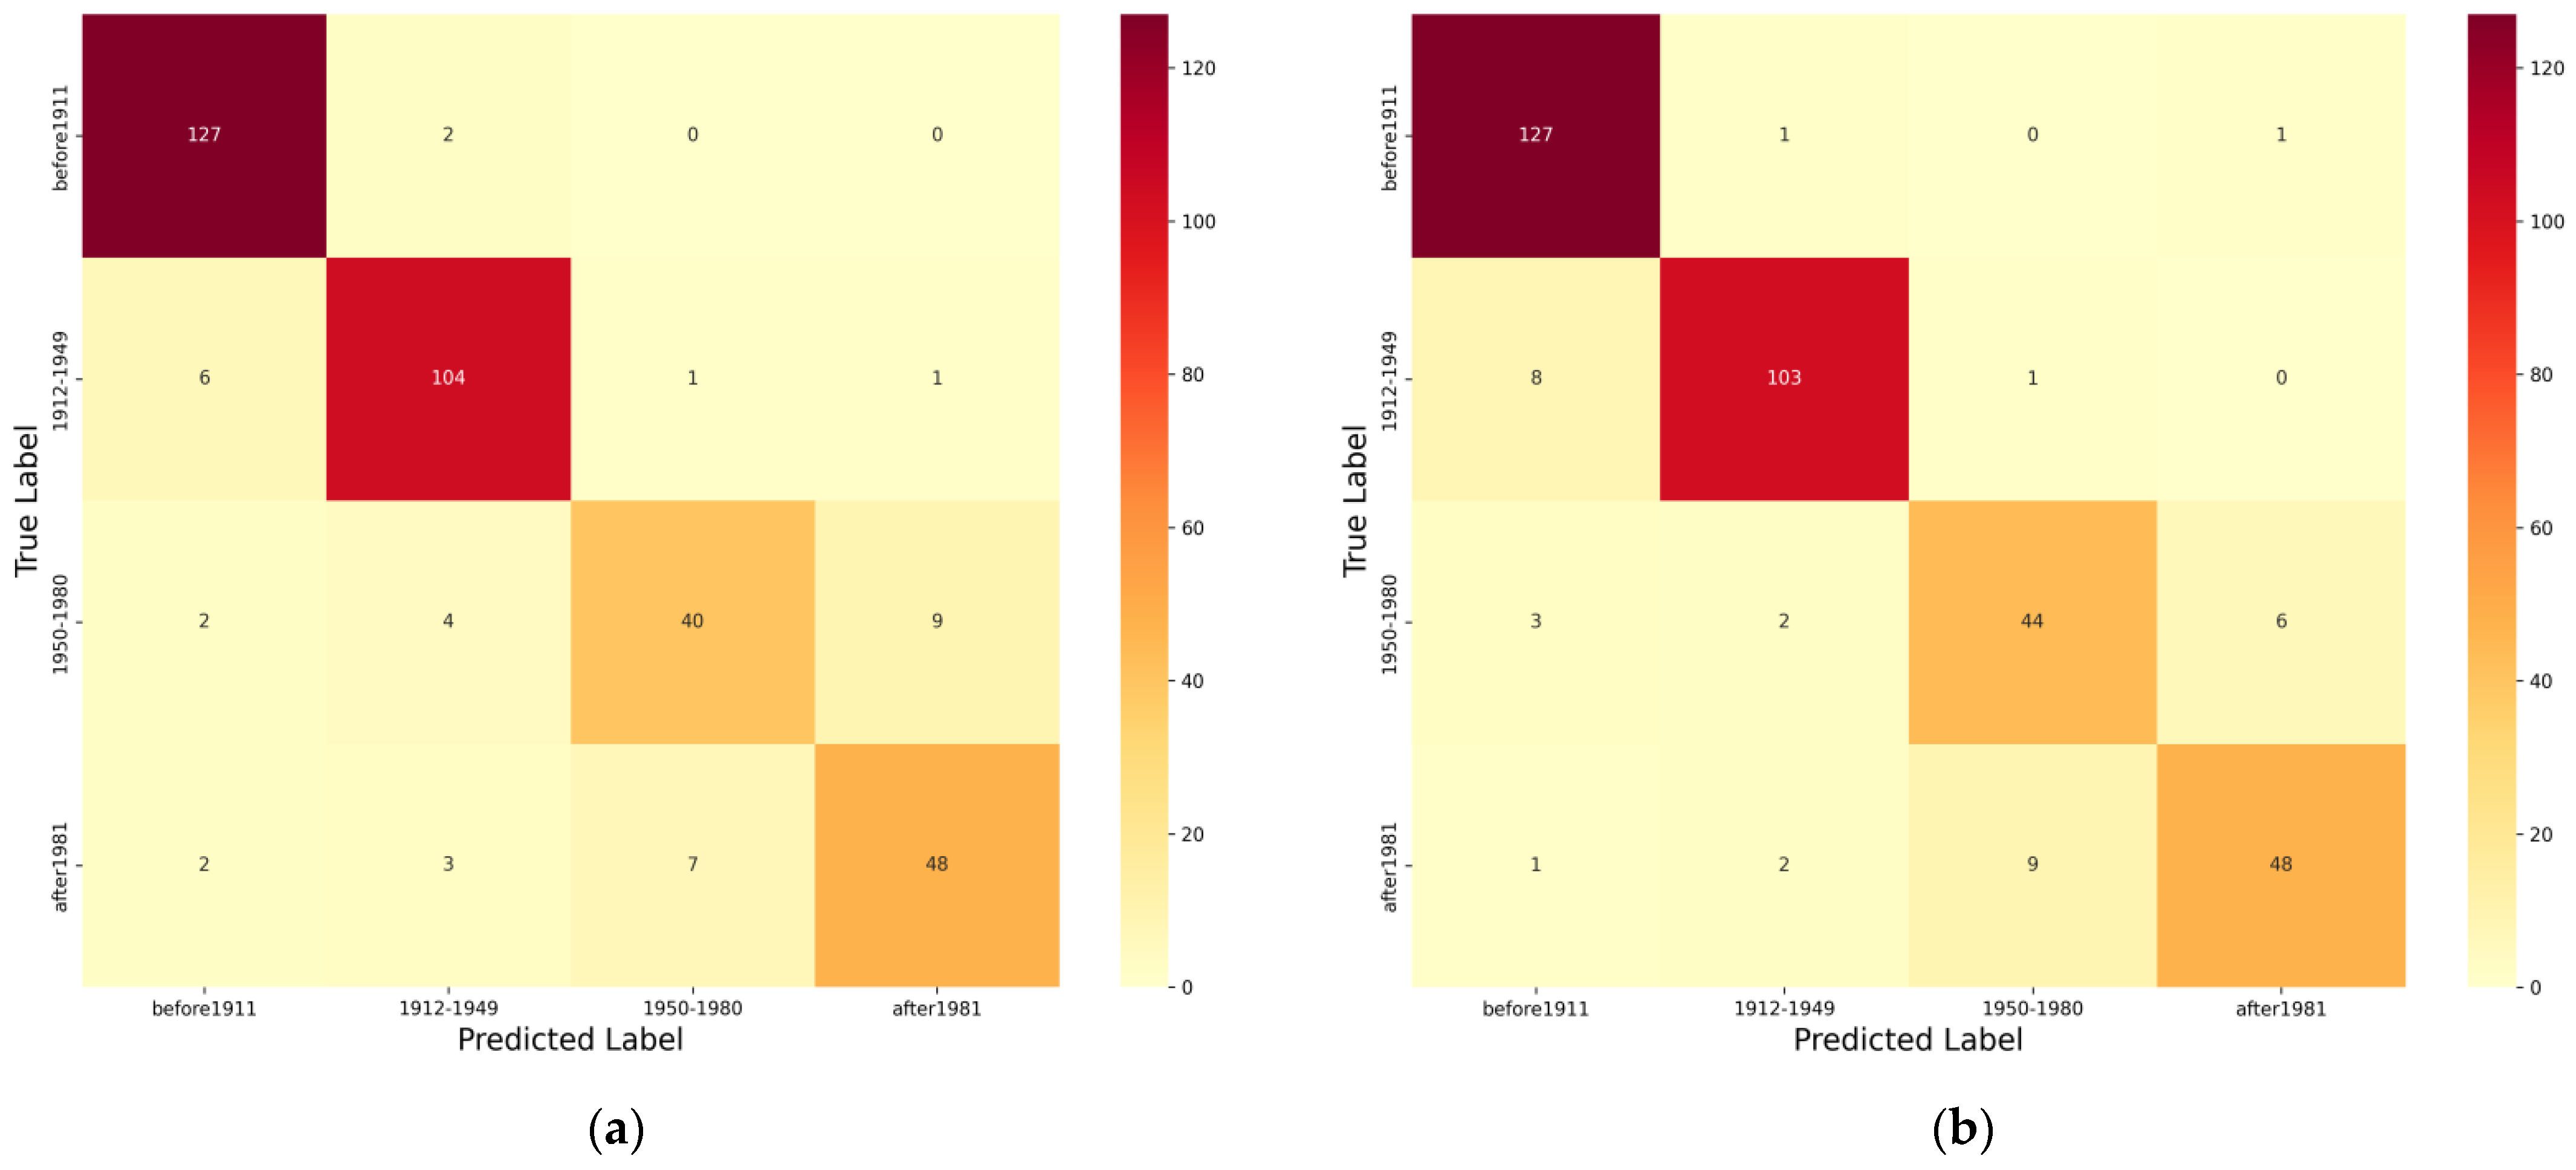
To better understand the classification performance of the improved model across different eras, as shown in Figure 5, we generated confusion matrices for both the traditional cross-entropy model and the model incorporating mixed triplet loss, further validating the improvement in handling class imbalance. The figure displays confusion matrices for both models, revealing that for the pre-1911 and post-1981 eras, the number of correctly classified images remained unchanged at 127 and 48 images, respectively. For the 1912–1949 era, correctly classified images decreased from 104 to 103—a reduction in one image—which does not reflect meaningful changes in model performance. Conversely, for the smallest sample era (1950–1980), correctly classified images increased from 40 to 44, demonstrating that the mixed triplet loss model moderately improves performance under class imbalance.
As shown in Figure 5b, the highest misclassification rate occurs between 1912 and 1949 dwellings and pre-1911 dwellings. This stems from several factors. First, early Republican-period houses inherited almost all Qing era practices in floor plans, structures, roof pitches, and timber systems, resulting in minimal macroscopic differences. Only subtle distinctions—such as window-frame patterns, brick-carving motifs, column diameters, bracket-set proportions, or ridge-beast counts—require high-resolution images to be discerned, yet the model operating on 224 × 224 inputs often overlooks these fine cues, leading to errors. Second, although the two periods appear numerically balanced, most surviving pre-1911 buildings were erected near the turn of the century, and many underwent partial renovations after 1912 (e.g., replacing window sashes, adding canopies), creating “temporally mixed” samples whose outward features closely resemble those of 1912–1919, further aggravating misclassification.
For 1950–1980 versus post-1981 dwellings, the hybrid triplet loss model raises accuracy, yet a residual error remains. The 1950–1980 period already produced simplified quadrangles and brick-concrete bungalows; after 1981, numerous houses retained the same layout. Moreover, cement, red brick, and machine-made tiles introduced in the late 1950–1980 period continued to be used after 1981, merely in brighter colors, causing texture and color overlap in the extracted features. Additional renovations—tile cladding, aluminum window replacements—post-1981 make 1950–1980 buildings visually closer to post-1981 ones, sustaining the error rate.
Conversely, dwellings from pre-1911 and 1912–1949 differ markedly from the 1950–1980 and post-1981 cohorts in floor plans, materials, and overall morphology; consequently, the model extracts distinctive features and achieves low misclassification.
In conclusion, through comparative analysis of Accuracy, Precision, Recall, F1-score, and confusion matrices across different models, the DualBranchEfficientNet model incorporating mixed triplet loss outperforms other models in classifying traditional residential buildings from different eras.

4.7. Grad-CAM Analysis

As stated above, although the model demonstrates outstanding performance in the classification of vernacular building periods, the inherent opacity of deep learning means that the model offers limited transparency during sample learning. Heat maps generated via Grad-CAM not only reveal the model’s ability to extract and learn architectural features—thereby enhancing its robustness and reliability—but also bolster user trust in the model’s decisions.
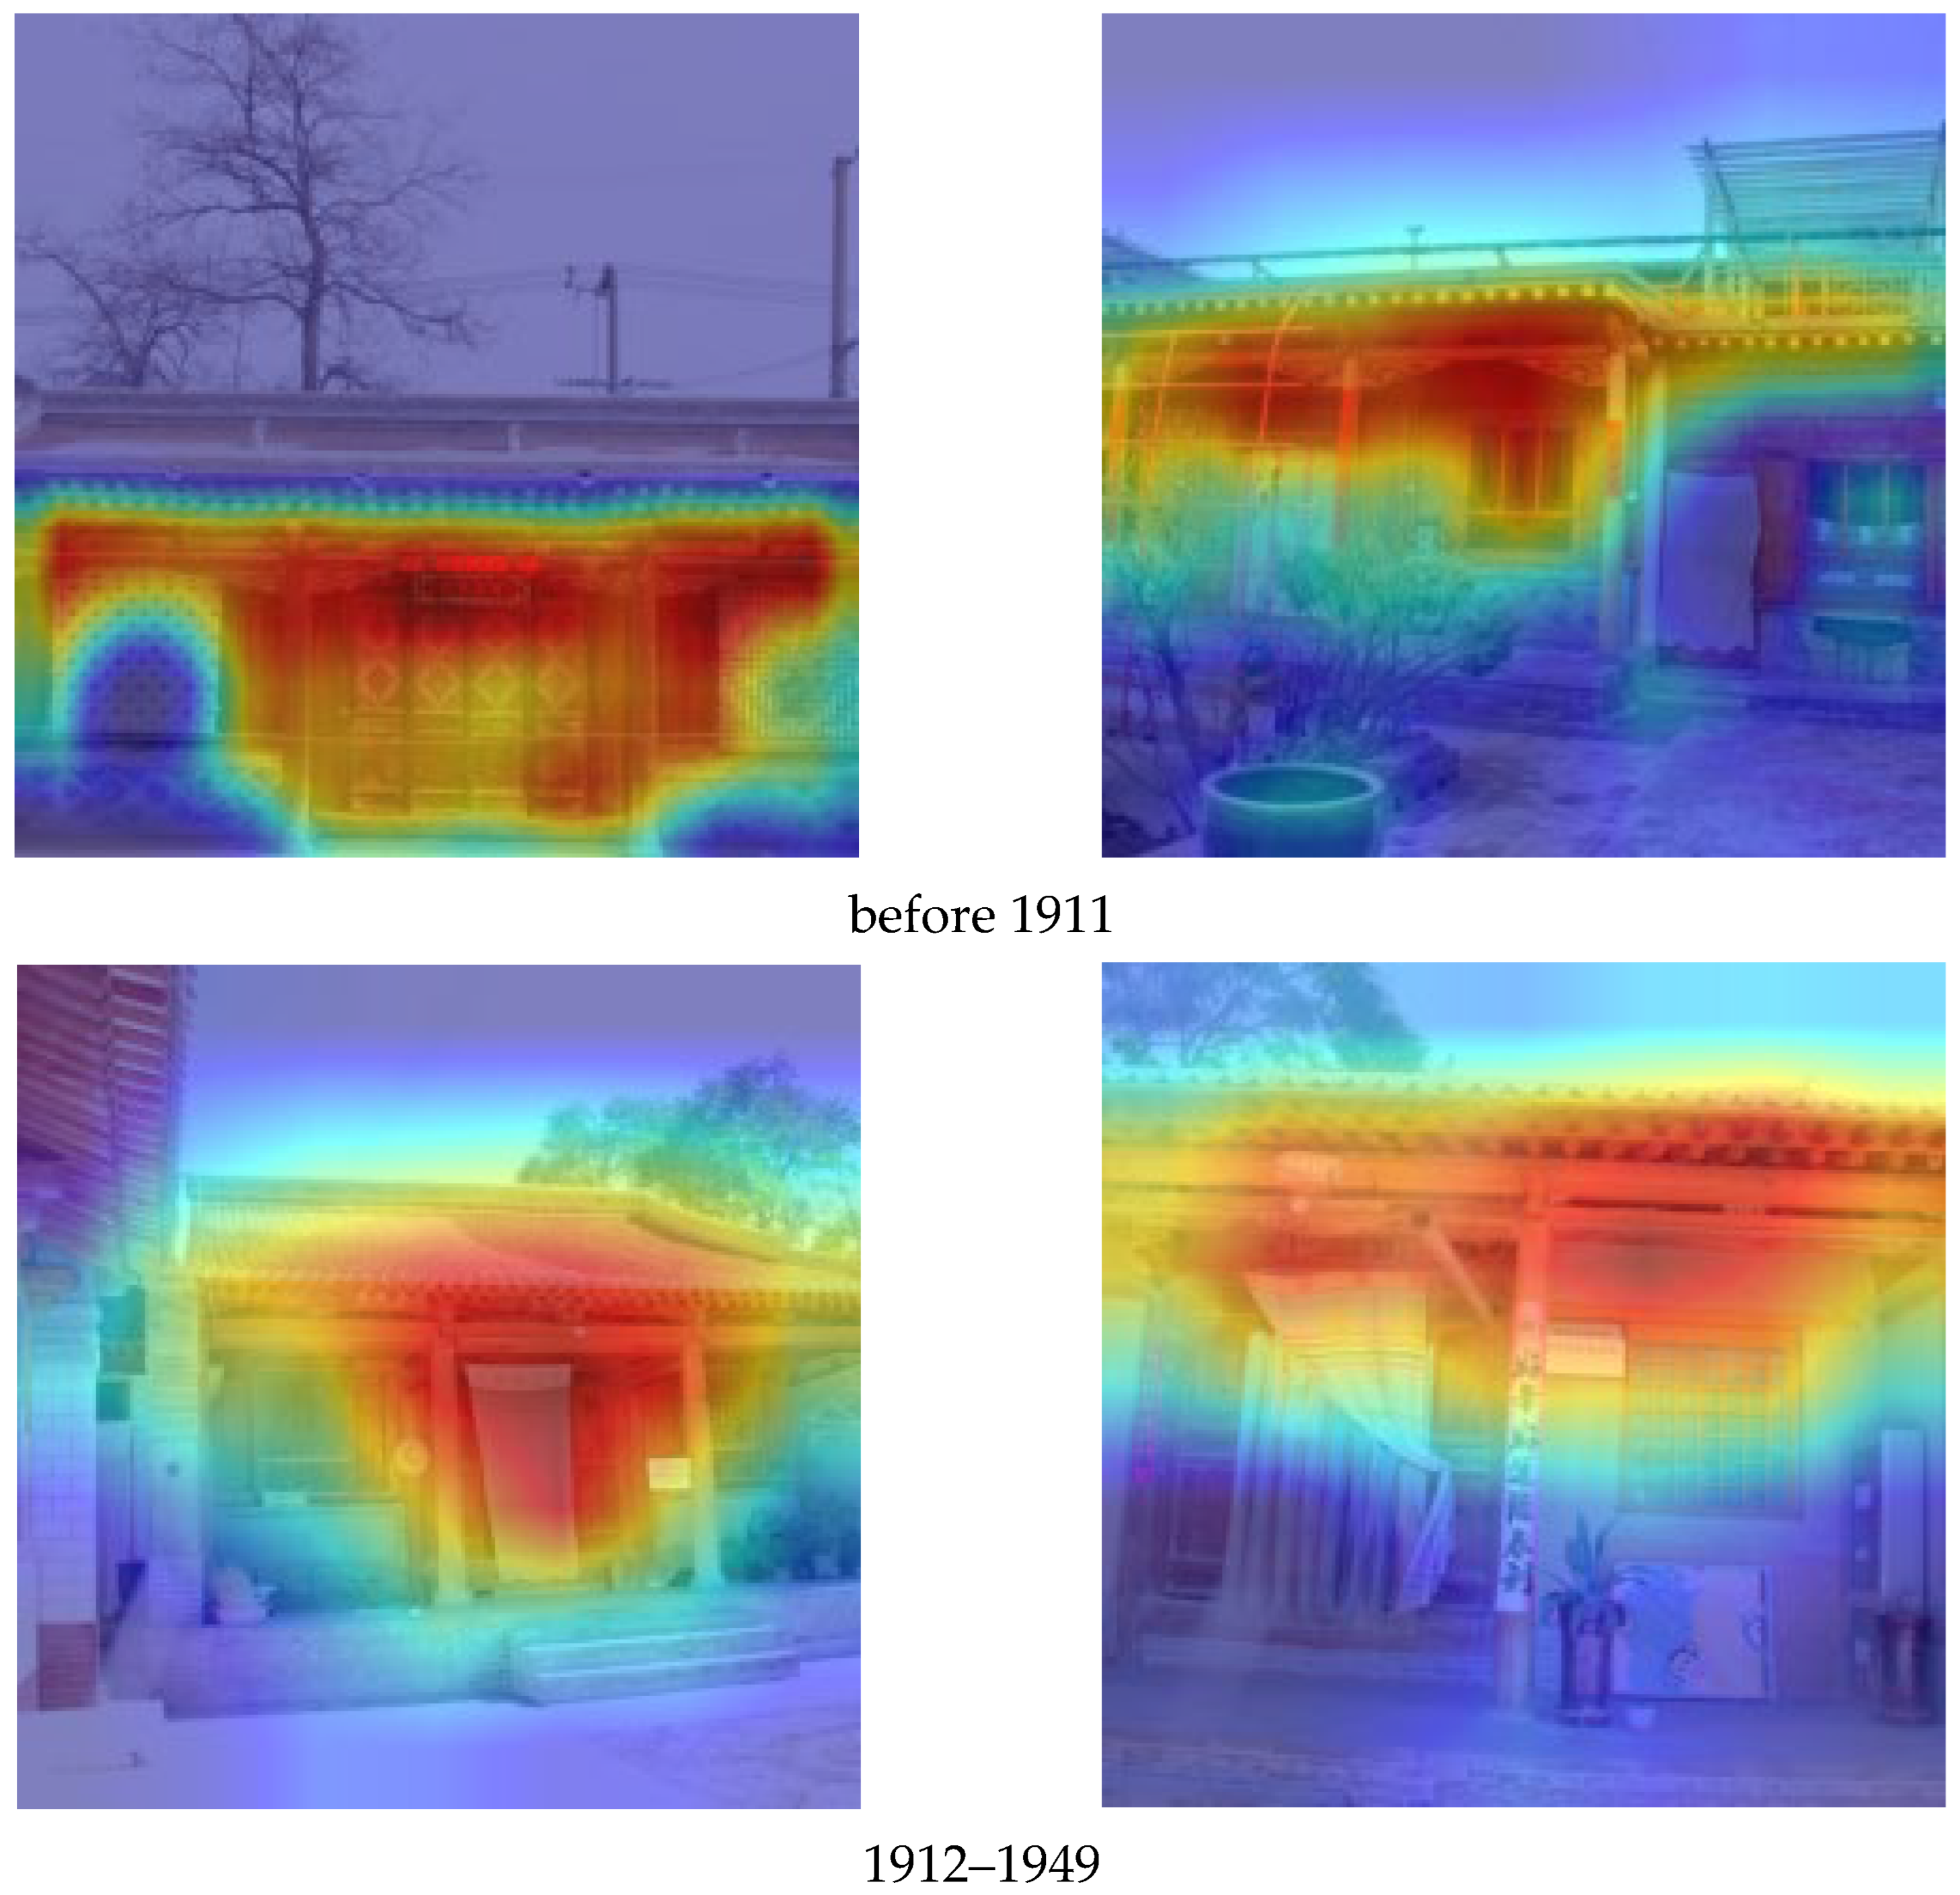
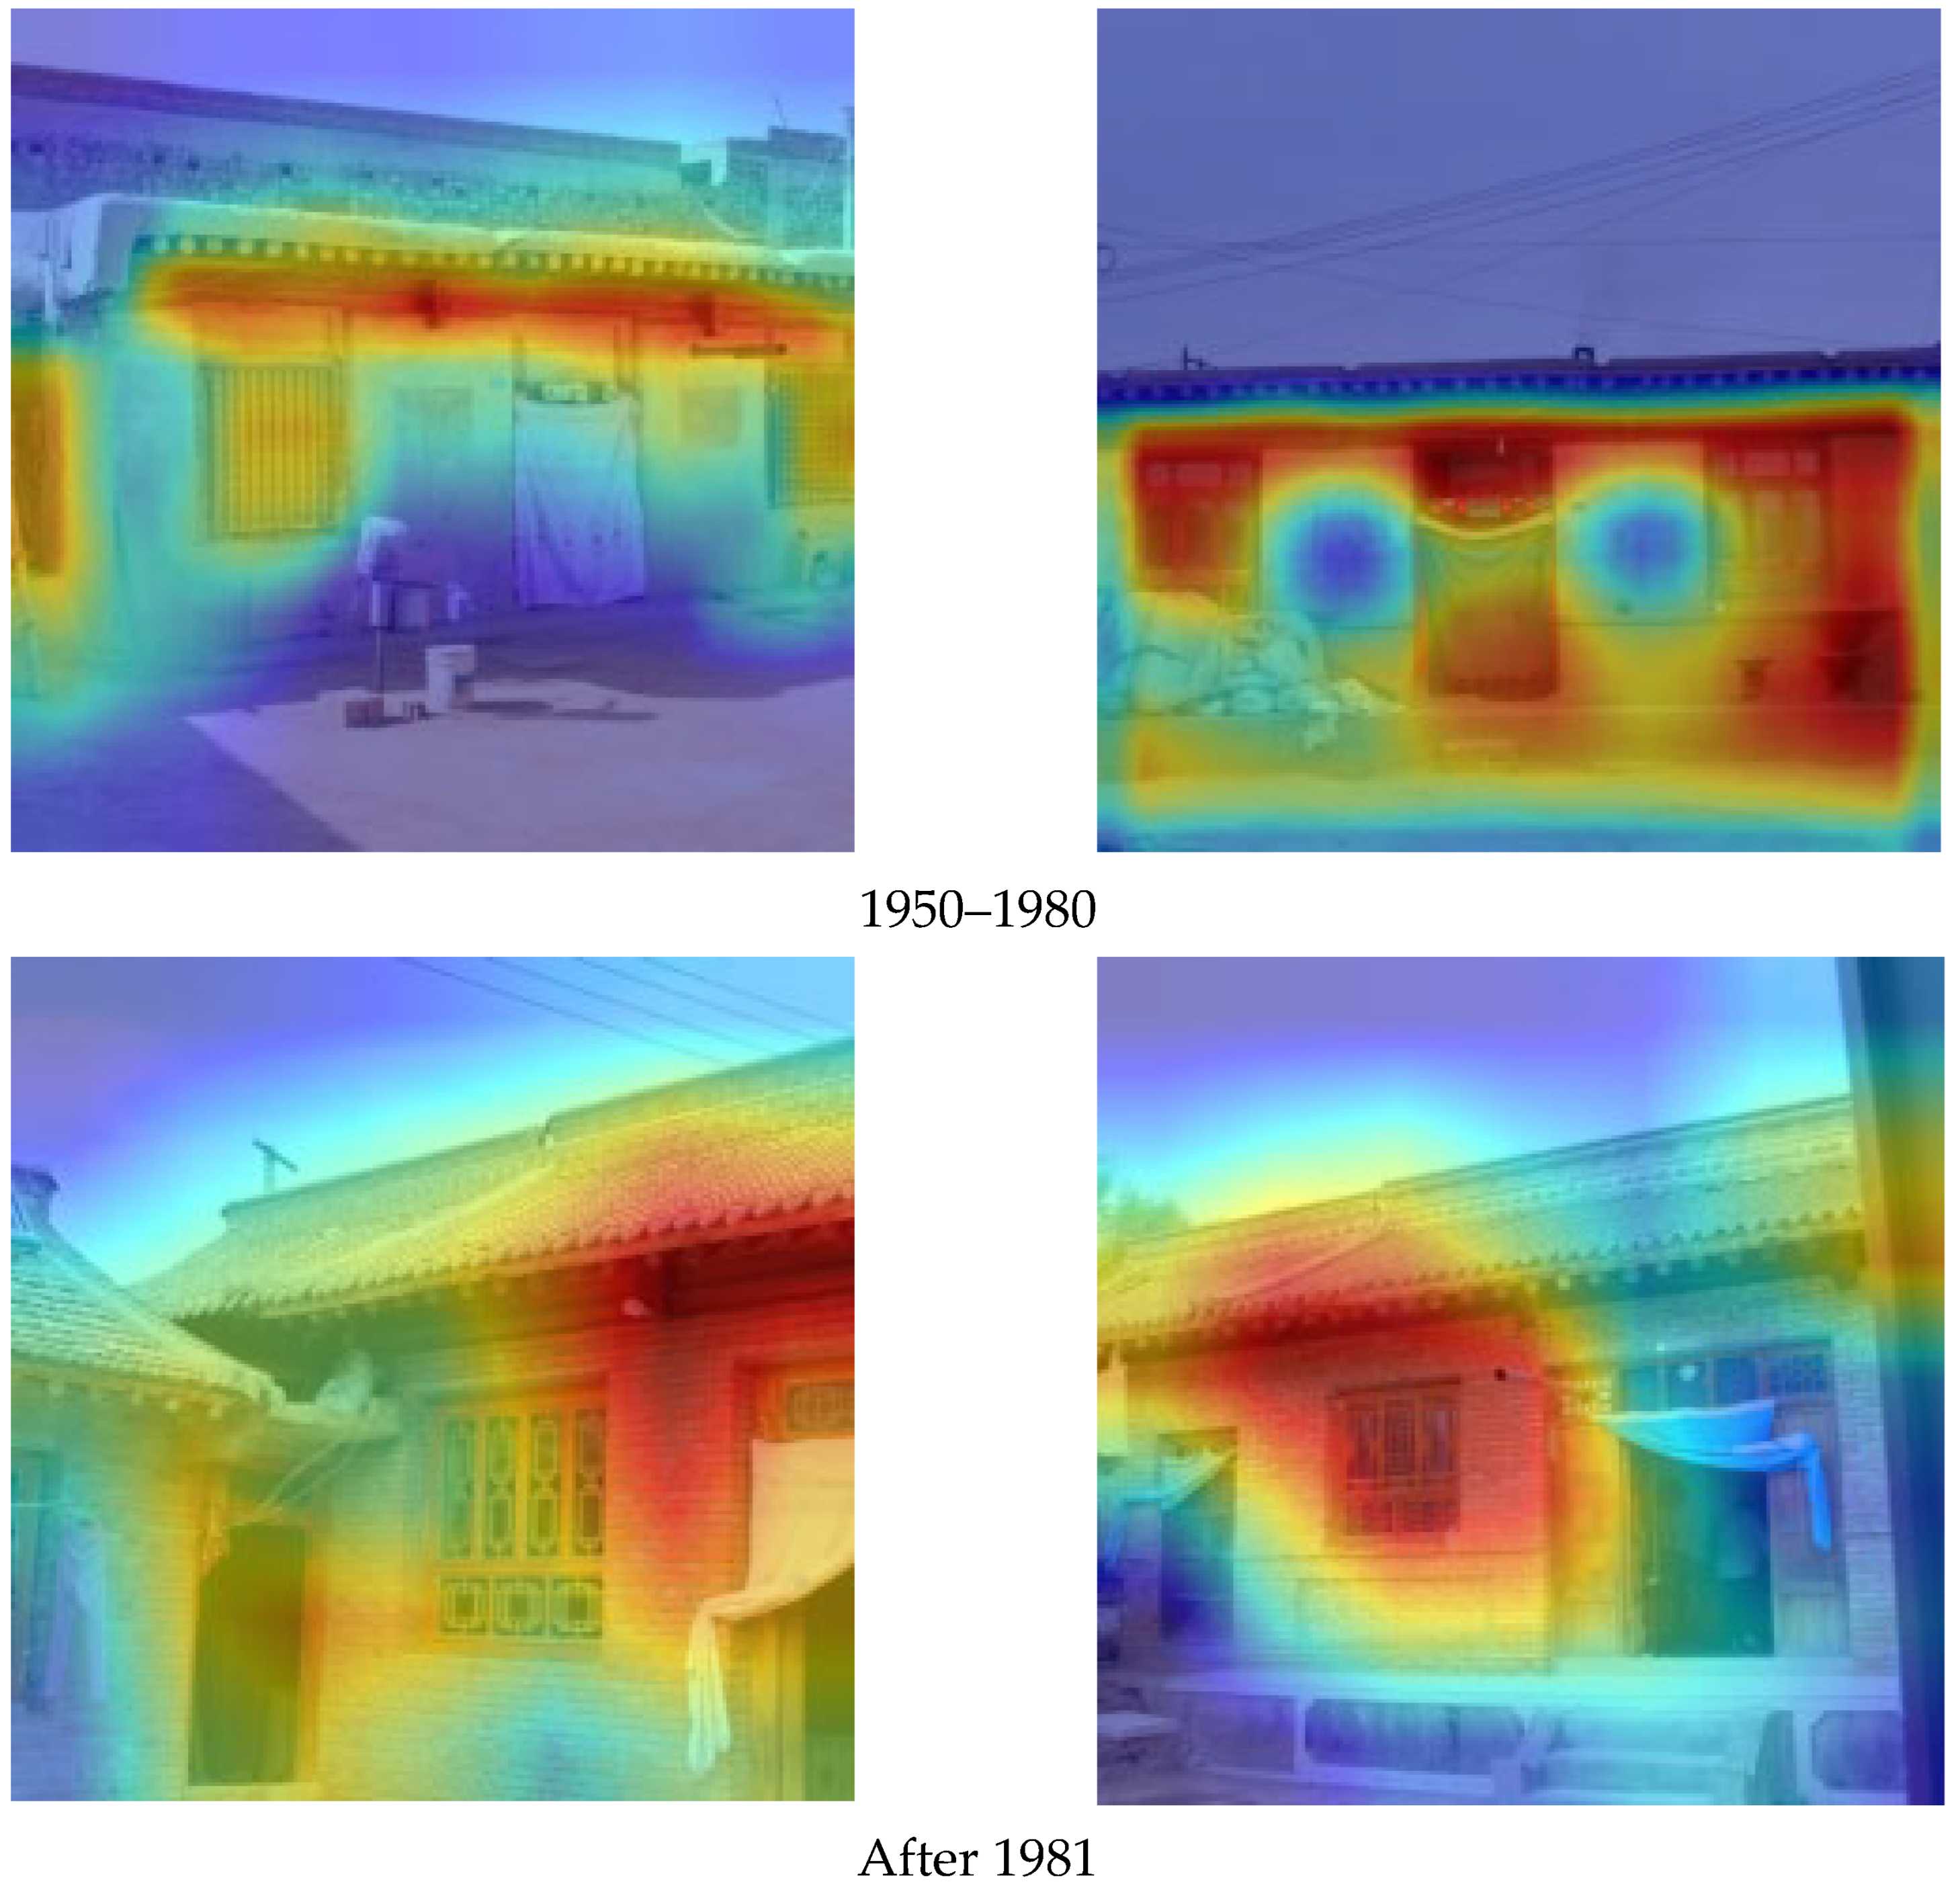
Figure 6 presents the Grad-CAM heat maps generated by the DualBranchEfficientNet model with hybrid triplet loss for traditional dwellings of different periods. The heat maps use red-yellow-blue to indicate model weights from strong to weak. Across all periods, architectural features are mainly concentrated on the eaves, walls, and windows, which consistently appear as red high-response regions, showing that the model first relies on overall contours to distinguish chronological levels. (1) For dwellings built before 1911, the local-branch heat maps focus on the eaves, with orange-yellow high weights on dougong (bracket sets) and queti (sparrow braces), indicating that the model captures the intricate wood carvings characteristic of the late Qing period. (2) In the 1912–1949 period, weights concentrate on the eaves and column diameters; due to social and economic factors, dwellings of the Republican era simplified dougong and omitted queti. (3) During 1950–1980, the local-branch heat maps attend not only to the eaves, but also to the windows and walls. In this period, the junction between the wall and the roof retains the chengliang fang (purlin plate), yet the rest of the wall shifts from timber to brick-and-earth, the window area decreases, the columns disappear, and the once-deep eaves vanish. (4) After 1981, the red highlights move to the brick-wall exterior and glass windows.
Although the model demonstrates strong feature extraction and classification capabilities, misclassification still occurs. To intuitively reveal the underlying causes of these errors, we visualized typical misclassified samples using Grad-CAM.
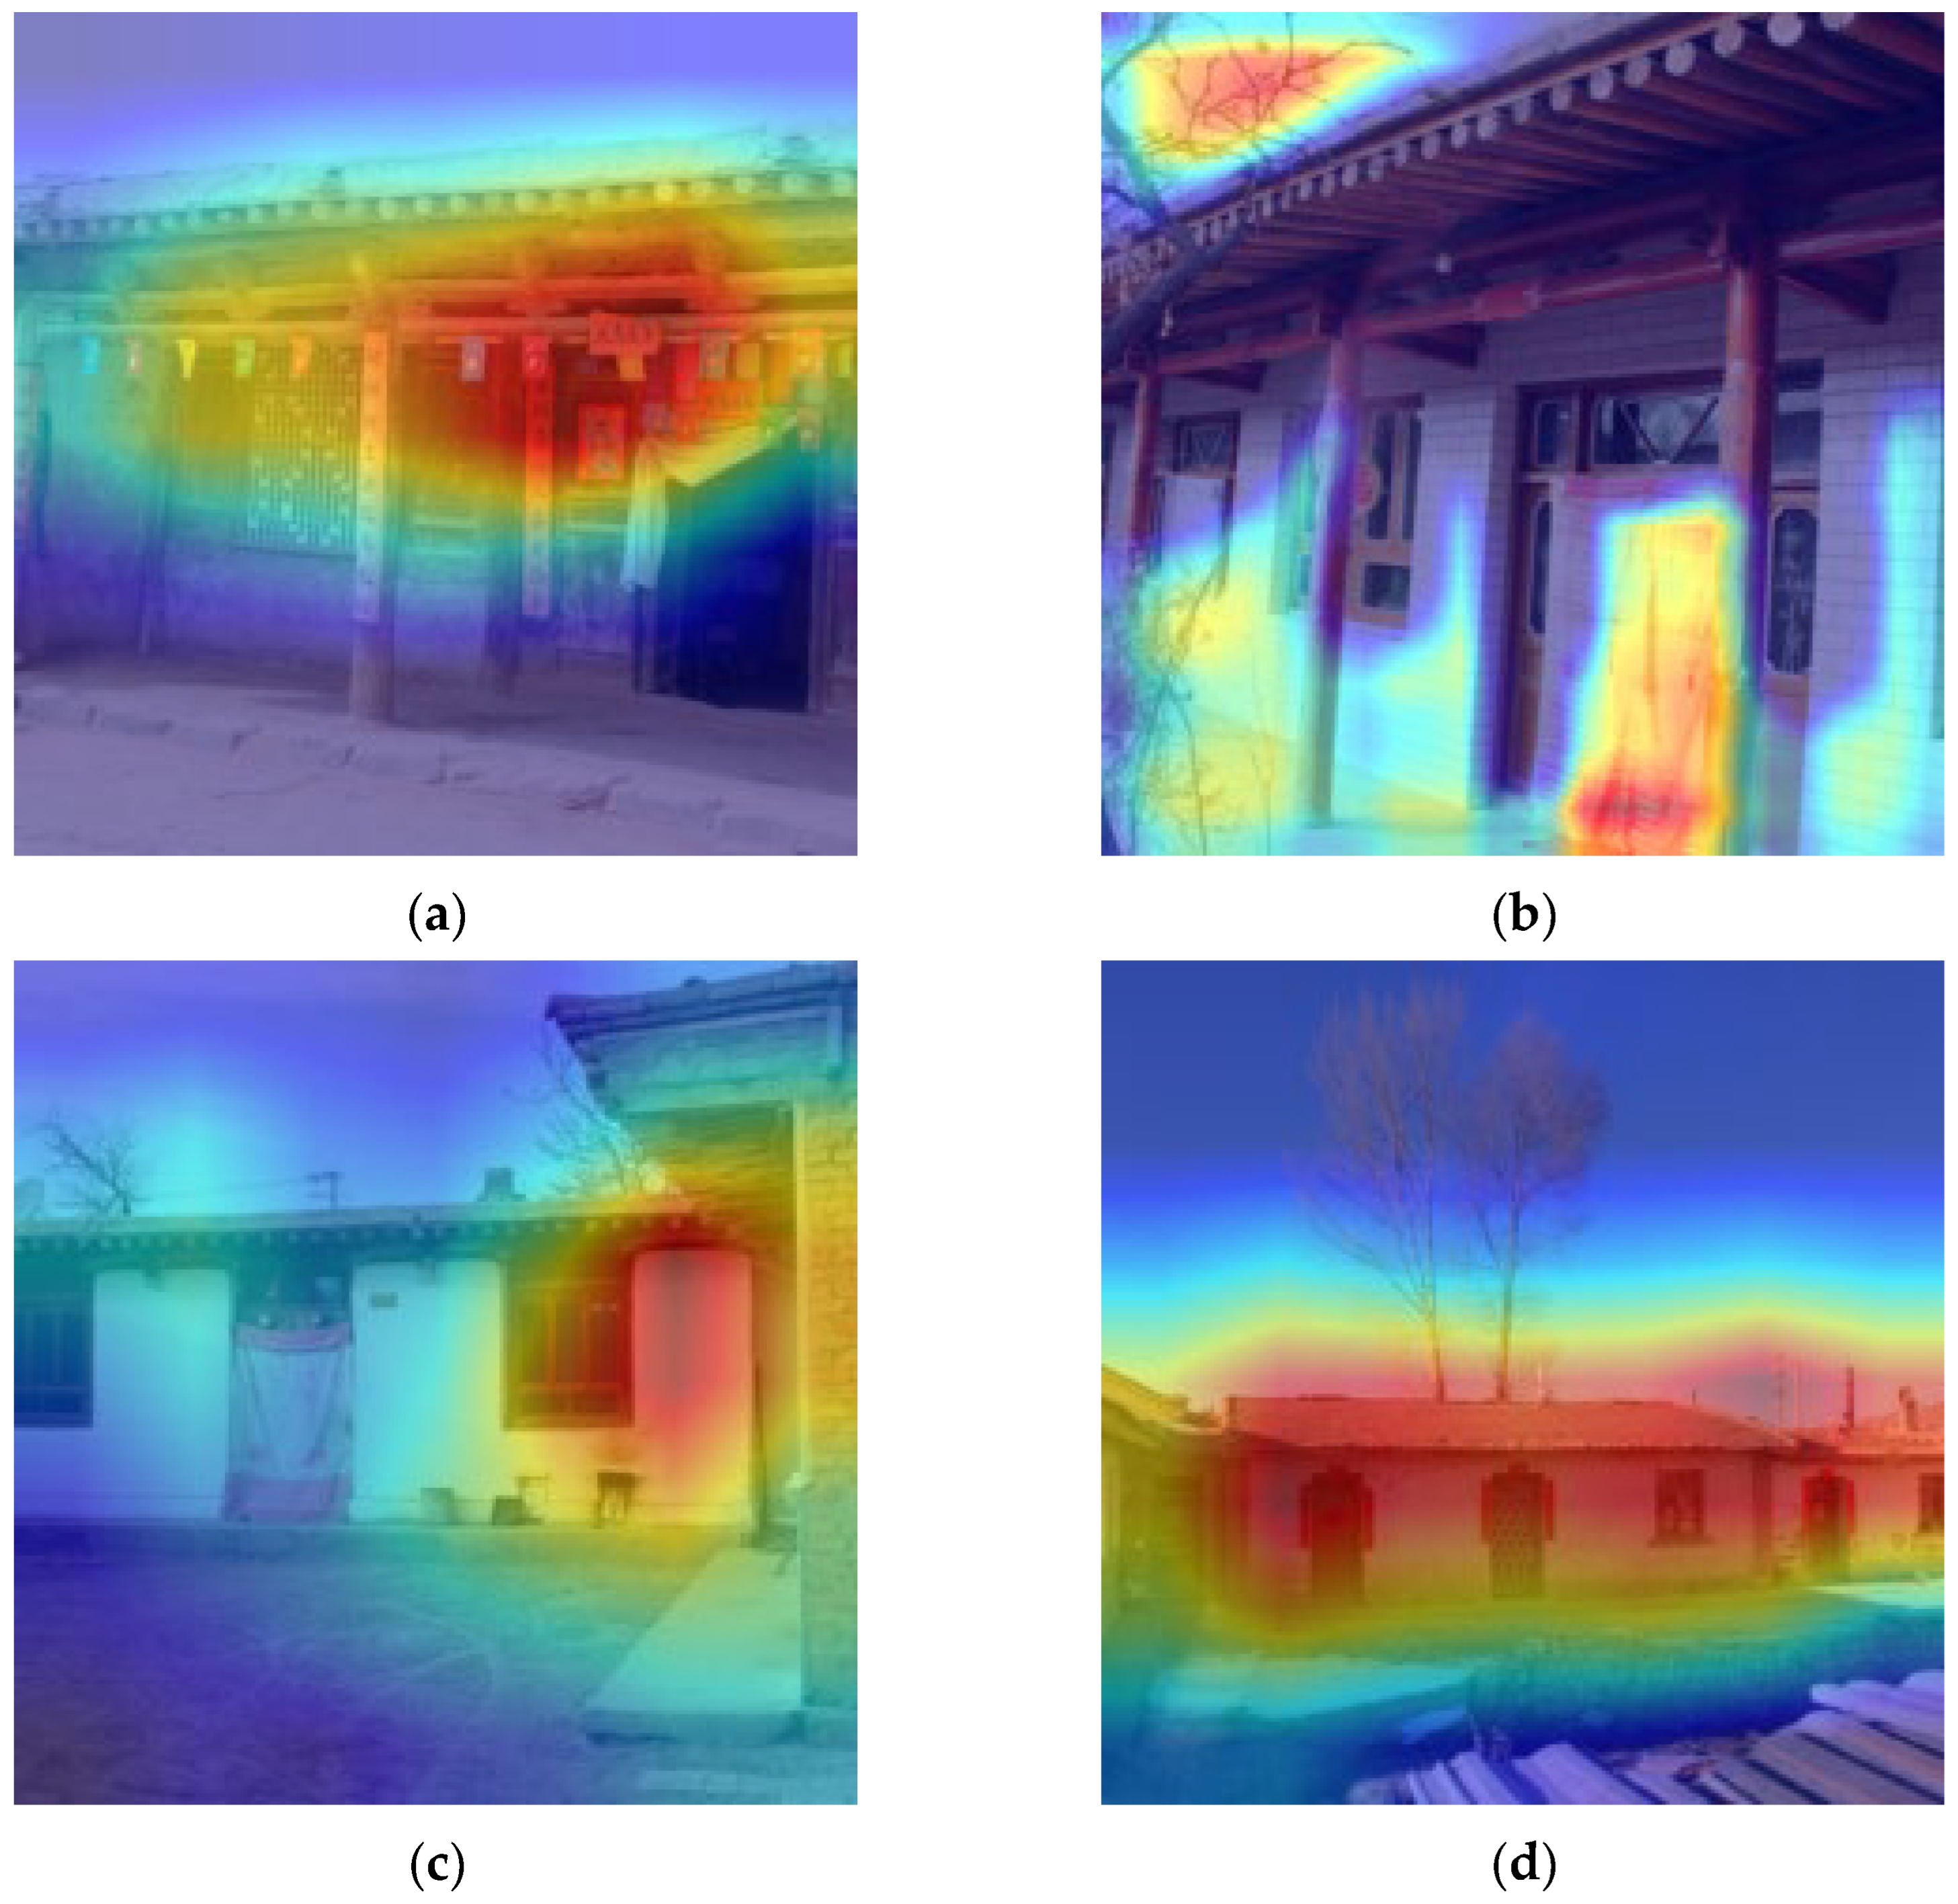
As shown in Figure 7a, the presence of colorful decorative bands under the eaves led the model to mistakenly assign a 1912–1949 building to the pre-1911 period. In Figure 7b, post-renovation tiling over the original timber façade caused the model to misclassify a pre-1911 building as post-1981. Figure 7c illustrates that a neighboring post-1981 brick wall on the right side of the image biased the model, resulting in a 1950–1980 building being labeled as post-1981. Figure 7d shows that the long shooting distance misled the model into classifying a post-1981 building as belonging to the 1950–1980 period.
The foregoing shows that, although deep learning models perform well on architectural classification and recognition tasks, they still exhibit clear limitations relative to humans: (1) strong data dependence—requiring large training sets and being sensitive to data distribution, with marked performance drops when confronted with unseen building types; (2) limited spatial understanding—sensitive to scale changes, so that the same building photographed from different distances can yield different classifications; (3) poor adaptability—variations in lighting, weather, or viewing angle significantly affect performance; (4) difficulty in fine-grained discrimination—confusing buildings with similar styles or local features (e.g., Baroque vs. Rococo) and over-attending to certain local cues, leading to misclassification of the entire style; (5) interpretability deficits—unable to provide transparent rationales for learning and decisions; even with Grad-CAM and similar tools, heat maps may highlight irrelevant features yet still produce correct labels; (6) inability to distinguish originals from imitations—unable, for instance, to differentiate authentic ancient buildings from modern replicas. Therefore, AI systems should serve as “auxiliary tools,” and any restoration or planning decision must ultimately rely on human verification.

5. Conclusions

To address challenges including feature extraction difficulties in era classification of traditional architecture, cumbersome traditional methods, and erratic classification outcomes, we propose a DualBranchEfficientNet model incorporating mixed triplet loss for era classification of traditional residential buildings in the Longzhong region of Gansu Province.
First, due to the scarcity of datasets in the study area, we constructed a dataset of traditional buildings from different eras in the Longzhong region of Gansu Province. This dataset comprises 1181 photos of traditional residential buildings across eras: 427 from the pre-1911 period, 373 from 1912–1949, 181 from 1951–1980, and 200 from the post-1981 period to present.
Second, we selected three representative deep learning classification models—EfficientNet, ResNet50, and Vision Transformer—for comparative experiments. Experimental results show that the EfficientNet model achieved Accuracy, Precision, Recall, and F1-scores of 85.1%, 81.6%, 81.0%, and 81.1%, respectively, outperforming the ResNet50 model by 1.4%, 1.3%, 0.5%, and 1.2%, and surpassing the Vision Transformer model by 8.1%, 9.1%, 9.5%, and 9.1% across these metrics. Through comparative evaluation, EfficientNet and ResNet50 are better suited for our classification task than Vision Transformer.
Third, to enhance feature extraction capability and classification accuracy for traditional residential buildings across eras, we propose a “Local-Global Feature Joint Learning Network Architecture” based on the selected EfficientNet and ResNet50 models, namely, the DualBranchEfficientNet and DualBranchResNet models. Comparative results against the EfficientNet and ResNet50 models show that the DualBranchResNet model achieved Accuracy of 87.6%, Precision of 85.0%, Recall of 84.5%, and F1-score of 84.8%, outperforming ResNet50 by 3.9%, 4.7%, 5.0%, and 4.9%, respectively; the DualBranchEfficientNet model attained Accuracy of 89.6%, Precision of 87.7%, Recall of 86.0%, and F1-score of 86.7%, surpassing EfficientNet by 4.5%, 6.1%, 5.0%, and 5.7%, respectively. Thus, our proposed DualBranchEfficientNet model delivers optimal performance across Accuracy, Precision, Recall, and F1-scores for classifying traditional residential buildings in the Longzhong region of Gansu Province across different eras.
Fourth, to solve the sample imbalance problem, we improved the DualBranchEfficientNet and DualBranchResNet models by introducing mixed triplet loss and conducted comparative ablation experiments. Compared with the traditional cross-entropy model, the DualBranchResNet and DualBranchEfficientNet models incorporating mixed triplet loss achieved good results in Accuracy and F1-scores. Comparing the DualBranchResNet and DualBranchEfficientNet models both incorporating mixed triplet loss, the DualBranchEfficientNet model attained Accuracy, Precision, Recall, and F1-scores of 90.5%, 88.9%, 87.6%, and 88.2%, respectively, outperforming the DualBranchResNet model by 1.7%, 1.9%, 2.1%, and 2.0% across these metrics. It is concluded that our proposed DualBranchEfficientNet model incorporating mixed triplet loss is better suited for our classification task.
Fifth, to better understand our proposed model, we compared the classification metrics per category and confusion matrices of the DualBranchEfficientNet model and the DualBranchEfficientNet model incorporating mixed triplet loss. For the 1950–1980 era with the fewest samples, Recall improved from 72.7% to 80.0% for the mixed triplet loss model, and correctly classified images increased from 40 to 44. This reflects that the model incorporating mixed triplet loss has achieved certain improvement in performance under sample imbalance.
Finally, by analyzing the heat maps produced by the DualBranchEfficientNet model with the hybrid triplet loss function, we confirmed that the extracted features of traditional dwellings from different historical periods are consistent with those obtained by conventional methods, further attesting to the model’s reliability. Moreover, examination of the heat maps corresponding to misclassified instances demonstrated that the model exhibits strong robustness against overfitting.
Through this study, the proposed DualBranchEfficientNet model incorporating mixed triplet loss demonstrates good effect on feature extraction and classification of traditional residential buildings across eras in the Longzhong region of Gansu Province. It can serve as a new method for building era classification and identification, and when combined with traditional methods, enables more accurate era recognition. Simultaneously, it may provide reference for rural revitalization and rural landscape character control. Although this study demonstrates strong results in the Longzhong region of Gansu Province, the model’s generalizability to other regions has not yet been verified due to a lack of external data; in the future, we plan to conduct cross-regional collaborations to expand validation and assess its universality.
In the future, we will further investigate multi-scale fusion strategies that integrate deep learning with multi-source data—such as hyperspectral imagery, LiDAR point clouds, and historical archives—by incorporating attention mechanisms and spatio-temporal feature coupling to enhance the accuracy and robustness of building-age classification. Concurrently, we plan to construct a standardized, cross-regional test set to evaluate the model’s transferability and generalizability across buildings from diverse cultural contexts, ultimately establishing an intelligent classification framework adaptable to varied heritage scenarios and providing a scientific foundation for the digital preservation and monitoring of architectural heritage.
Author Contributions

Conceptualization, S.M. and C.Z.; methodology, Y.P. and S.M.; software, S.M.; validation, S.M. and C.Z.; formal analysis, S.M.; investigation, S.M. and C.Z.; resources, S.M.; data curation, S.M.; writing—original draft preparation, S.M.; writing—review and editing, Y.P., Y.M. and C.Z.; visualization, S.M.; supervision, Y.P. and Y.M.; project administration, Y.M.; funding acquisition, Y.M. All authors have read and agreed to the published version of the manuscript.

Funding

This research was funded by the National Natural Science Foundation of China (grant number 62076200) and by the Key Research and Development Project of Shaanxi Province (grant number 2023-YBGY-149).

Data Availability Statement

The data presented in this study are available on request from the corresponding authors. The raw data required to reproduce these findings cannot be shared at this time as the data also forms part of an ongoing study.

Acknowledgments

Thanks to the School of Printing, Packaging and Digital Media, Xi’an University of Technology for providing model training and data analysis.

Conflicts of Interest

The authors declare no conflicts of interest.

References

  1. Hu, Y.; Chen, S.; Cao, W.; Cao, C.Z. The Concept and Cultural Connotation of Traditional Villages. Urban Dev. Stud. 2014, 21, 10–13. [Google Scholar]
  2. Wang, Z.L. Introduction to Chinese Traditional Dwellings (Part 1). Architect 1994, 11, 52–59. [Google Scholar]
  3. Liang, X. Re-understanding and Evaluation of vernacular Architecture: Interpreting Architecture Without an Architect. Architect 2005, 3, 105–107. [Google Scholar]
  4. San, D.Q. From Traditional Houses to Regional Buildings; China Building Materials Industry Press: Beijing, China, 2004; pp. 106–108. ISBN 978-7-80159-604-8. [Google Scholar]
  5. He, X.X.; Mo, X.F.; Pan, Y.N.; Pei, Y.; Zhang, L. Analysis of Traditional Dong Ethnic Dwellings and Regional Culture Based on Spatial Syntax. Ind. Archit. 2023, 53, 105–114. [Google Scholar] [CrossRef]
  6. Li, L. Research on the Protection of the Residential Buildings in Traditional Village from the Cultural Prespective: A Case of Wanjian Village in Anhui. Urban Archit. 2023, 20, 94–98+167. [Google Scholar]
  7. Ma, R.H. Analysis of Spatial Construction and Exploration of Experience Inheritance of Traditional Villages in the Northern Zhejiang Plain. Master’s Thesis, Xi’an University of Architecture and Technology, Xi’an, China, 2021. [Google Scholar]
  8. Zeng, Y.; Tao, J.; He, D.D.; Xiao, D.W. The Research on Traditional Dwelling Culture Geography. South Archit. 2013, 1, 83–87. [Google Scholar]
  9. Meng, H. An Analysis of the Development Characteristics of Chinese Building Materials Based on the Ancient Characters for “brick” and “tile”. Archit. Cult. 2025, 5, 243–246. [Google Scholar]
  10. Liu, Q.Q.; Xu, R.L.; Chen, X.Y.; Li, W. The Nonlinear Impact of Urban Context Protection on Residents’ Historical Perception: An Empirical Study Based on Urban Physical Examination Data of Nanjing City. Geogr. Res. 2025, 44, 1245–1262. [Google Scholar]
  11. Pei, X.S. Several Methods for Determining the Age of Ancient Buildings. Pop. Archaeol. 2023, 1, 67–72. [Google Scholar]
  12. Zhang, J.F.; Xu, M.; Yu, X.Y.; Cai, N.; Liu, X.S.; Gan, F.F. A Deep Learning Intelligent Interpretation Method for Radar Images of Abnormal Bodies in Retaining Walls. J. Geophys. 2025, 68, 1970–1983. [Google Scholar]
  13. Xia, B.; Xin, L.; Shi, H.; Chen, J.; Chen, S. Style Classification and Prediction of Residential Buildings Based on Machine Learning. J. Asian Archit. Build. Eng. 2020, 19, 714–730. [Google Scholar] [CrossRef]
  14. Wu, Y.L. Classification of Ancient Buddhist Architecture in Multi-Cultural Context Based on Local Feature Learning. Mob. Inf. Syst. 2022, 2022, 8952381. [Google Scholar] [CrossRef]
  15. Gao, T. The Renovation of the Main Hall of Nan Chan Temple and the Development of the Concept of Protecting Cultural Relics Buildings in the Early Days of the People’s Republic of China. Tradit. Chin. Archit. Gard. 2011, 2, 15–19. [Google Scholar]
  16. Hao, Y.N.; Zhou, X.Y. A Preliminary Study on the Restoration of Traditional Chinese and Japanese Wooden Structures from the Perspective of Archaeology. Chin. Cult. Herit. 2023, 1, 38–45. [Google Scholar]
  17. Zhao, Z.X.; Bai, H.W.; Zhang, J.S.; Zhang, Y.L.; Xu, S.; Lin, Z.D.; Timofte, R.; Van Gool, L. CDDFuse: Correlation-Driven Dual-Branch Feature Decomposition for Multi-Modality Image Fusion. In Proceedings of the 2023 IEEE/Cvf Conference on Computer Vision and Pattern Recognition, Cvpr, Vancouver, BC, Canada, 17–24 June 2023; pp. 5906–5916. [Google Scholar]
  18. Bai, L.X.; Wang, C.E.; Hu, C.J. A Study on the Origin of the Construction Characteristics of the Great Buddha Hall of Yunlin Temple in Yanggao, Datong During the Ming Dynasty. Tradit. Chin. Archit. Ga Rdens 2024, 4, 65–69. [Google Scholar]
  19. Fen, J.R. Archaeological Dating of Ancient Chinese Wooden Structures. Cult. Relics 1995, 10, 43–68. [Google Scholar]
  20. Gu, G.Q. Research on the Periodization of the Dougong Form System in Traditional Architecture Along the Gansu Section of the Silk Road. Master’s Thesis, Lanzhou University of Technology, Lanzhou, China, 2022. [Google Scholar]
  21. Qiu, S.L. Analysis of the Dating of Ancient Residential Buildings in Fuzhou. Fujian Cult. Relics Mus. 2010, 2, 19–25. [Google Scholar]
  22. Xu, Y.T. The Research Principles of the Form and Chronology of Cultural Relic Buildings and the Methods for Dating Individual Buildings. J. Hist. Theory Chin. Archit. 2009, 487–494. [Google Scholar]
  23. Wang, Z.B. Analysis of the Form and Age of the Dougong brackets in the Ming Changling Shenggong Shengde Stele Tower. Jzsxk 2022, 3, 70–80. [Google Scholar] [CrossRef]
  24. Xu, Y.T. On the Basic Method of Determining the Construction Age of Ancient Chinese Buildings Using Carbon-14 Dating Technology: A Case Study of the Age of the Main Hall of the Jiwang Temple in Wanrong, Shanxi Province. Cult. Relics 2014, 9, 91–96. [Google Scholar]
  25. Yu, N.; Shen, Y.; Zhou, X.L. Research and Analysis on the Existing Jiwang Temple in Southern Shanxi. Hua Zhong Archit. 2009, 27, 129–133. [Google Scholar]
  26. Wimmer, R. Arthur Freiherr von Seckendorff-Gudent and the early history of tree-ring crossdating. Dendrochronologia 2001, 19, 153–158. [Google Scholar]
  27. Speer, J.H. Fundamentals of Tree-Ring Research; University of Arizona Press: Tucson, AZ, USA, 2010; p. 15. [Google Scholar]
  28. Xu, Y.T. Survey and Research Report on Huilong Temple in Pingshun Shanxi Province. Cult. Relics 2003, 1, 52–60. [Google Scholar]
  29. Zeppelzauer, M.; Despotovic, M.; Sakeena, M.; Koch, D.; Doeller, M. Automatic Prediction of Building Age from Photographs. In Proceedings of the ICMR ’18: Proceedings of the 2018 ACM International Conference on Multimedia Retrieval, Yokohama, Japan, 11–14 June 2018; pp. 126–134. [Google Scholar]
  30. Krizhevsky, A.; Sutskever, I.; Hinton, G.E. ImageNet Classification with Deep Convolutional Neural Networks. Commun. ACM 2017, 60, 84–90. [Google Scholar] [CrossRef]
  31. Sun, M.; Zhang, F.; Duarte, F.; Ratti, C. Understanding Architecture Age and Style through Deep Learning. Cities 2022, 128, 103787. [Google Scholar] [CrossRef]
  32. Huang, G.; Liu, Z.; van der Maaten, L.; Weinberger, K.Q. Densely Connected Convolutional Networks. In Proceedings of the 30TH IEEE Conference on Computer Vision and Pattern Recognition (CVPR 2017); IEEE: New York, NY, USA, 2017; pp. 2261–2269. [Google Scholar]
  33. Li, Y.; Chen, Y.Q.; Rajabifard, A.; Khoshelham, K.; Aleksandrov, M. Estimating Building Age from Google Street View Images Using Deep Learning. In Proceedings of the 10th International Conference on Geographic Information Science (GIScience 2018), Melbourne, Australia, 28–31 August 2018; Volume 114, pp. 40:1–40:7. [Google Scholar]
  34. Zhao, X.Q.; Jia, H.P.; Pang, Y.W.; Lv, L.; Fen, T.; Zhang, L.H. M2SNet: Multi-Scale in Multi-Scale Subtraction Network for Medical Image Segmentation. arXiv 2023, arXiv:2303.10894. [Google Scholar]
  35. Si, Y.L.; Yu, H.L.; Rong, F.Z. Fine-Grained Image Classification Based on Multi-Scale Feature Fusion. Laser Optoelectron. Prog. 2020, 57, 121002. [Google Scholar]
  36. Qin, X.; Peng, L.; Liao, H.X.; Yuan, C.A.; Zhao, J.B.; Deng, C.; Qian, Q.M.; Lu, H.F.; Gong, Y.X. MSViT: A Lightweight Image Classification Hybrid Model Integrating Multi-Scale Features. Guangxi Sci. 2024, 31, 912–924. [Google Scholar]
  37. Ji, C.P.; Shang, J.Q.; Dai, W. DC-SMOTE oversampling method for imbalanced datasets. J. Intell. Syst. 2024, 19, 525–533. [Google Scholar]
  38. Leng, X. Research on Integrated Under-sampling Method for Imbalanced Data. Master’s Thesis, Harbin University of Science and Technology, Harbin, China, 2021. [Google Scholar]
  39. Zhang, C.X.; Kang, F.; Wang, Y. An Improved Apple Object Detection Method Based on Lightweight YOLOv4 in Complex Backgrounds. Remote Sens. 2022, 14, 4150. [Google Scholar] [CrossRef]
  40. Zhang, H.X.; Li, M.F. RWO-Sampling: A Random Walk Over-Sampling Approach to Imbalanced Data Classification. Inf. Fusion 2014, 20, 99–116. [Google Scholar] [CrossRef]
  41. Das, B.; Krishnan, N.C.; Cook, D.J. RACOG and wRACOG: Two Probabilistic Oversampling Techniques. IEEE Trans. Knowl. Data Eng. 2015, 27, 222–234. [Google Scholar] [CrossRef]
  42. Lin, W.C.; Tsai, C.F.; Hu, Y.H.; Jhang, J.-S. Clustering-Based Undersampling in Class-Imbalanced Data. Inf. Sci. 2017, 409, 17–26. [Google Scholar] [CrossRef]
  43. Li, F.; Li, S.; Zhu, C.; Lan, X.; Chang, H. Cost-Effective Class-Imbalance Aware CNN for Vehicle Localization and Categorization in High Resolution Aerial Images. Remote Sens. 2017, 9, 494. [Google Scholar] [CrossRef]
  44. Lin, T.Y.; Goyal, P.; Girshick, R.; He, K.; Dollar, P. Focal Loss for Dense Object Detection. IEEE Trans. Pattern Anal. Mach. Intell. 2020, 42, 318–327. [Google Scholar] [CrossRef] [PubMed]
  45. Dong, Q.; Gong, S.; Zhu, X. Imbalanced Deep Learning by Minority Class Incremental Rectification. IEEE Trans. Pattern Anal. Mach. Intell. 2019, 41, 1367–1381. [Google Scholar] [CrossRef]
  46. Yin, X.; Yu, X.; Sohn, K.; Liu, X.; Chandraker, M. Feature Transfer Learning for Face Recognition with Under-Represented Data. In Proceedings of the 2019 IEEE/CVF Conference on Computer Vision and Pattern Recognition (CVPR 2019), Long Beach, CA, USA, 15–20 June 2019; pp. 5697–5706. [Google Scholar]
  47. Liu, J.; Sun, Y.; Han, C.; Dou, Z.; Li, W. Deep Representation Learning on Long-Tailed Data: A Learnable Embedding Augmentation Perspective. In Proceedings of the 2020 IEEE/CVF Conference on Computer Vision and Pattern Recognition (CVPR), Seattle, WA, USA, 13–19 June 2020; pp. 2967–2976. [Google Scholar]
  48. Shorten, C.; Khoshgoftaar, T.M. A Survey on Image Data Augmentation for Deep Learning. J. Big Data 2019, 6, 60. [Google Scholar] [CrossRef]
  49. Zhao, Z.B.; Hu, G.X. Gansu Folklore Overview; Nationalities Publishing House: Beijing, China, 2006; ISBN 978-7-105-07577-5. [Google Scholar]
  50. Sun, Y.Q.; Zhen, B.X. Geography of Gansu Province; Gansu Education Press: Lanzhou, China, 1990; ISBN 978-7-5423-0164-2. [Google Scholar]
  51. Liu, B.T.; Zhang, X.J.; Li, Q.J. Traditional Village in Gansu; Southeast University Press: Nanjing, China, 2018; pp. 5–6. [Google Scholar]
  52. Pang, Y.; Zhang, W.F.; Zhang, Y.J.; Xue, D. Regional Differentiation of the Construction Monomer Plane Shape of Traditional Dwellings in Gansu Province. Areal Res. Dev. 2019, 38, 158–164. [Google Scholar]
  53. Gao, X.Q. A Geographical Study of Traditional Folk Houses in Ganqing. Ph.D. Thesis, Shaanxi Normal University, Xi’an, China, 2018. [Google Scholar]
  54. Wang, W. Fort Building in Hexi Corridor Area. Master’s Thesis, Xi’an University of Architecture and Technology, Xi’an, China, 2010. [Google Scholar]
  55. Ye, M.H.; Lei, X.Y.; Meng, X.W. Study on the Geographical Differentiation of Plane Form of Traditional Dwellings in Longnan Area. J. Gansu Sci. 2022, 34, 81–89. [Google Scholar]
  56. Meng, X.W.; Ye, M.H.; Shi, H.R. Analysis on the status quo and characteristics of traditional residential houses in Lanzhou. Dev. Small Cities Towns 2012, 3, 88–92. [Google Scholar]
  57. Meng, X.W.; Ye, M.H. The Living Fossil of Ancient Vernacular Architecture in Northwest of China: Study on the Dwelling Architecture in Qingcheng Town, Lanzhou City in Gansu Province. Hua Zhong Archit. 2009, 27, 106–109. [Google Scholar]
  58. Wang, D.G.; Lv, Q.Y.; Wu, Y.F.; Fan, Z.Q. The characteristic of regional differentiation and impact mechanism of architecture style of traditional residence. J. Nat. Resour. 2019, 34, 1864–1885. [Google Scholar] [CrossRef]
  59. Li, Y. Study on Rural Human Settlement Environment in Shaanxi-Gansu-Ningxia Ecologically Fragile Area. Ph.D. Thesis, Xi’an University of Architecture and Technology, Xi’an, China, 2010. [Google Scholar]
  60. Liang, X. The localism of Chinese regional culture and architecture. J. Tianjin Univ. (Sci. Technol.) 1997, 30, 548–554. [Google Scholar]
  61. He, K.; Zhang, X.; Ren, S.; Sun, J. Deep Residual Learning for Image Recognition. In Proceedings of the IEEE Conference on Computer Vision and Pattern Recognition, Las Vegas, NV, USA, 27–30 June 2016; pp. 770–778. [Google Scholar]
  62. Tan, M.; Le, Q. Efficientnet: Rethinking Model Scaling for Convolutional Neural Networks. In Proceedings of the International Conference on Machine Learning, Long Beach, CA, USA, 9–15 June 2019; pp. 6105–6114. [Google Scholar]
  63. Dosovitskiy, A.; Beyer, L.; Kolesnikov, A.; Weissenborn, D.; Zhai, X.; Unterthiner, T.; Dehghani, M.; Minderer, M.; Heigold, G.; Gelly, S.; et al. An Image Is Worth 16 × 16 Words: Transformers for Image Recognition at Scale. arXiv 2020, arXiv:2010.11929. [Google Scholar]
Figure 1. Geographic location of the Longzhong Loess Plateau in Gansu Province.
Buildings 15 03086 g001
Figure 2. Traditional dwelling samples from the Longzhong Loess Plateau by the historical period.
Buildings 15 03086 g002
Figure 3. Image counts by a 7:3 split ratio: total, training, and test sets.
Buildings 15 03086 g003
Figure 4. Schematic diagram of dual-branch network built on DualBranchEfficientNet-b4.
Buildings 15 03086 g004
Figure 5. Confusion matrices of (a) traditional cross-entropy model; (b) mixed triplet loss model.
Buildings 15 03086 g005
Figure 6. Grad-CAM heat maps across different periods.
Buildings 15 03086 g006aBuildings 15 03086 g006b
Figure 7. Misclassified Grad-CAM heat maps. (a) Buildings constructed between 1912 and 1949 were incorrectly identified as pre-1911. (b) Buildings constructed pre-1911 were incorrectly identified as after 1981. (c) Buildings constructed between 1950 and 1980 were incorrectly identified as after 1981. (d) Buildings constructed after 1981 were incorrectly identified as between 1950 and 1980.
Buildings 15 03086 g007
Table 1. Existing work on performance enhancement for deep learning.
ClassReferencesMethodCore MechanismDataResults/Goal
Multi-scale feature fusionZhao et al. [34]Multi-Scale Subtraction Network (M2SNet)Extract cross-layer difference features to enhance lesion details.Medical imaging datasetsSuperior to the existing methods
Zhao et al. [17]Restormer + Transformer-CNN dual-branch + INNCross-modal global–local fusion, correlation driving lossInfrared-visible light image mIoU has increased by 4.2%, and the detection AP has increased by 3.1%
Li et al. [35]Feature pyramid + region selectionMulti-scale transformation + top-3 region maps + global featuresCUB-200-2011/Stanford DogsThe accuracy rate is 85.7%/83.5%
Qin et al. [36]MSFFN + CFFDLightweight cross-scale interaction and integrationImageNetTop-1 was 87.58%, which was 2.27% higher than EdgeViT-XXS
Class-imbalance handlingZhang et al. [40]RWO (Random Walk Oversampling)Random walk that preserves the mean and variance to generate minority-class samplesGeneral unbalanced dataClassification accuracy improves by 2.4%
Barnan et al. [41]RACOG and wRACOGSample synthesis based on probability distributionGeneral unbalanced dataClassification accuracy improves by 2.4%
Lin et al. [42]K-means clustering undersamplingAfter clustering the majority of classes, subsets are drawn according to the number of minority classesGeneral unbalanced dataReduce most types of noise
Zhang et al. [39]Random rotation + translation + mirroringGeometric transformation expands the sample1620 pictures of apple diseasesPrevent overfitting
Li et al. [43]Cost-sensitive CNNWeight/loss reweightingHigh-resolution vehicle imagesThe mAP has increased by 3%
Lin et al. [44]Focal LossFocus on difficult samples and reduce the weight of easily distinguishable samplesGeneral unbalanced dataImprove the accuracy of the model classification task
Dong et al. [45]Class-rebalancing regularizerAdd a category correction term to the cross-entropyGeneral unbalanced dataImprove the discriminability of a small number of samples
[46,47,48]Transfer + GAN/VAE generationMigrate or synthesize minority class samplesGeneral unbalanced dataIncrease the number of small-class samples
Table 2. Selection of villages in the study area and the number of images in the training and test datasets.
Before 19111912–19491950–1980After 1981
Architectural ConfigurationSiheyuan exhibits spatial grandeur, quadrilateral symmetry in layout, and architectural integration of ritual elements [57]Western-style buildings have emerged in the city [56]This is a stage that bridges the past and the future. In cities, brick-concrete flat roofs are predominant, while in rural areas, single-slope brick-concrete roofs have emergedThe newly-built residences draw on the symbols of traditional quadrangle courtyards, but the interior spaces are modernized [51]
Material Selection Mainly rammed earth walls and wooden structures [57,59]Brick-concrete structures have emerged but are not widely used, and in rural areas, civil engineering structures still dominate [56]Brick-concrete structures began to emerge in rural areasBrick-concrete structures are gradually replacing traditional civil engineering structure
Plan LayoutThe principle of “strict demarcation between interior and exterior domains” is scrupulously observed [60]The central hall (Tangwu) has transitioned into a living space, while its ancestral worship function has progressively fadedSpatial functionality is now primarily driven by practical applicability, no longer constrained by traditional ritual protocolsThere is not much change compared to the previous period
Structural FeaturesThe wooden structure is exquisitely crafted and the roof slope is relatively gentleSimplified timber framing; the initial emergence of brick load-bearing wallsBrick-concrete construction proliferated extensively while timber framing systems underwent gradual obsolescenceTimber framing systems reached complete obsolescence
Decorative MotifsThe decoration is elaborate and magnificent, with the brick carvings and wood carvings centered on Confucian cultureDecorative schemes underwent increasing simplification while Western ornamental elements emerged in localized applicationsCraftsmanship in carving techniques waned significantly, with walls predominantly finished in plain lime plaster and ornamental carvings on fenestrations adopting an increasingly minimalist aestheticWindows and doors are devoid of ornamental carvings
Table 3. Image count by era.
Pre-19111912–19491950–19801981-PresentTotal
Quantity4273731812001181
Table 4. Training and test set counts by time period.
EraTraining Set CountTest Set CountTotal
Pre-1911298129427
1912–1949261112373
1951–198012655181
1981-present14060200
Total8253561181
Table 5. Experimental environment.
EnvironmentVersions or Model Number
CPUIntel i9-14900k
GPUNVIDIA RTX 4090D, 24 GB memory
OSUbuntu 20.04
CUDA12.1
PyTorch2.1.0
Python3.8
Table 6. Confusion matrix.
Actual Positive (P)Actual Negative (N)
Predicted Positive (P)TP (True Positive)FP (False Positive)
Predicted Negative (N)FN (False Negative)TN (True Negative)
Table 7. Comparative experimental results of the baseline model.
ModelsAccuracy/%Recall/%Precision/%F1-Score/%
EfficientNet85.181.681.081.1
ResNet5083.7 (+1.4)80.3 (+1.3)79.5 (+0.5)79.9 (+1.2)
Vision Transformer77.0 (+8.1)72.5 (+9.1)71.5 (+9.5)72.0 (+9.1)
Note: In Table 7, the plus or minus signs within the table parentheses indicate the difference of the value from the value of the EfficientNet model. A negative value indicates it is less than the value of the EfficientNet model, while a positive value indicates it is greater than the value of the EfficientNet model.
Table 8. Comparative experimental results of the improved model.
ModelsAccuracy/%Recall/%Precision/%F1-Score/%
EfficientNet85.1 (+4.5)81.6 (+6.1)81.0 (+5.0)81.1 (+5.7)
DualBranchEfficientNet89.687.786.086.7
ResNet5083.7 (+3.9)80.3 (+4.7)79.5 (+5.0)79.9 (+4.9)
DualBranchResNet87.687.786.086.7
Note: In Table 8, the plus or minus signs in parentheses indicate the difference between the value of the improved model and the corresponding value of the original model. A negative value indicates it is lower than the original model’s value, while a positive value indicates it is higher than the original model’s value.
Table 9. Experimental results for different ε values.
ƐAccuracy/%Recall/%Precision/%F1-Score/%
089.687.588.387.8
0.3090.588.987.688.2
0.6088.685.185.785.4
1.0088.184.585.685.0
1.6787.984.685.384.9
3.3387.083.384.383.7
Table 10. Ablation experiment results.
ModelceHybrid LossAccuracy (%)Precision (%)Recall (%)F1-Score (%)
DualBranchResNet 87.685.084.584.8
88.8 (+1.2)87.0 (+2.0)85.5 (+1.0)86.2 (+1.4)
DualBranchEfficientNet 89.687.786.086.7
90.5 (+0.9)88.9 (+1.2)87.6 (+1.6)88.2 (+1.5)
Note: In Table 10, the plus or minus signs in parentheses indicate the difference between the value of the improved model with mixed triplet loss and the corresponding value of the cross-entropy model. A negative value indicates it is lower than the cross-entropy model’s value, while a positive value indicates it is higher than the cross-entropy model’s value.
Table 11. Per-class results.
ceHybrid LossBefore 1911 (443)1912–1949 (373)1950–1980 (181)After 1981 (200)
P(%)R(%)F1(%)P(%)R(%)F1(%)P(%)R(%)F1(%)P(%)R(%)F1(%)
92.798.595.595.492.992.583.372.777.682.880.081.4
91.498.594.595.492.093.681.580.081.787.380.083.5
Disclaimer/Publisher’s Note: The statements, opinions and data contained in all publications are solely those of the individual author(s) and contributor(s) and not of MDPI and/or the editor(s). MDPI and/or the editor(s) disclaim responsibility for any injury to people or property resulting from any ideas, methods, instructions or products referred to in the content.