Article

Field Study of Relationships Between Indoor Thermal Conditions and Two Major Causes of Allergies—Dust Mites and Mould—In New Zealand Houses

1
School of Architecture, Unitec Te Pūkenga, Mt Albert Campus, 139 Carrington Road, Mt Albert, Auckland 1025, New Zealand
2
School of Healthcare and Social Practice, Unitec Te Pūkenga, Waitakere Campus, 7 Ratanui Street, Henderson, Auckland 0612, New Zealand
*
Author to whom correspondence should be addressed.
Buildings 2025, 15(17), 3074; https://doi.org/10.3390/buildings15173074
Submission received: 22 July 2025 / Revised: 17 August 2025 / Accepted: 26 August 2025 / Published: 27 August 2025
(This article belongs to the Special Issue Development of Indoor Environment Comfort)

Abstract

Based on field studies, this study contributes the new physical data of winter indoor thermal conditions of the indoor spaces with four different dust mite allergen levels in New Zealand houses. This study provides a new method to identify the relationships between indoor thermal conditions and indoor dust mite allergen levels. This study found that the indoor mean relative humidity (RH) close to the floor must be controlled below 70%, and there must be less than 30% of time in winter when indoor RH close to the floor is higher than or equal to 75% to maintain indoor dust mite allergens at an undetectable level; and the indoor mean RH close to the floor must be controlled below 75%, and there must be less than 50% of time in winter when indoor RH close to the floor is higher than or equal to 75% to maintain indoor dust mite allergens at a low (acceptable) level. This study also identified the relationship between indoor thermal conditions for dust mites to thrive and for mould spores to germinate. This study provides a strategy or guideline for preventing indoor allergies related to dust mites and mould under the temperate climate zone; the winter is mild and humid.

1. Introduction

Auckland, New Zealand, has a temperate climate with warm, dry summers and mild, wet winters [1]. Most of the factors that contribute to poor health, for example, bacteria, viruses, fungi, mites, etc., have increases associated with high indoor RH [2]. Indoor dust mite allergens in New Zealand houses are deemed to be the world’s highest levels [3]. Visible mould on indoor surfaces is common in local homes [4]. In New Zealand houses, the main indoor allergens from mould and dust mites are related to the high indoor RH. For optimum indoor air quality, RH should be below 60% [5,6,7]. Indirect adverse health effects can be minimised by maintaining indoor RH between 40% and 60% [2].
Most Auckland houses with internal insulation and external cladding are designed for temporary heating, and their structures are light-frame construction. There are only a small percentage of local homes that have a permanent heating system [8]. For an Auckland house with recommended insulation in its envelope and a permanent heating system, the minimum indoor temperature must be higher than 20 °C to control indoor mean RH below 50% for minimising indirect adverse health effects [2,9]. Since 2007, double-glazed windows and the higher insulation (R2.9 for roofs, R1.9 for walls, R1.3 for floors, and R0.26 for glazing) for the local houses have been required by the building codes [10,11]. According to the thermal insulation history of New Zealand houses, there is a large percentage of Auckland houses that do not meet these requirements of the current building codes [10,11]. For those houses without the recommended insulation and double-glazed windows, it is difficult and energy inefficient, and also very expensive for the occupants to maintain the minimum indoor temperature above 20 °C for controlling indoor mean RH below 50%. Based on the field study, this study identified the relationship between indoor thermal conditions and the two major indoor allergens in New Zealand houses—dust mites and mould. This study focuses on the minimum indoor thermal conditions required to maintain the major indoor allergens at acceptable levels.
Previous studies in other countries found dust mites cannot survive when indoor RH is lower than 50% [12,13]. The presence of dust mites and their allergens can be reduced by maintaining indoor RH below 50%, and when indoor RH is maintained within a range of 40–50%, dust mites can be minimised [14,15,16,17]. Indoor RH within 60% to 80% are optimal conditions for dust mites’ reproduction. Dust mites need indoor RH within 75% to 80% or higher indoor RH to thrive. They prefer temperatures in the range of 18–25 °C [2,14,15,18,19,20]. Both high ambient temperature and RH could occur during the hot and humid summer of a temperate climate or a tropical climate. The local climate for this study has a high ambient RH and low temperature during the winter and a comfortably warm, dry summer.
The previous study of lab mite cultures showed that the environmental RH for dust mite population at the peak was at about 85% at 28 °C [21]. Except for indoor RH and temperature, indoor ventilation can also impact the dust mite allergen; high indoor ventilation potentials or high indoor air change rates can reduce indoor dust mite allergen levels [22,23]; indoor dust mite allergen levels can also be impacted by occupants’ numbers and daily activities [24,25]. Based on the field study data, this study identified four different indoor dust mite allergen levels and their associated indoor thermal conditions. The four different dust mite allergen levels are as follows: undetectable and low (acceptable indoor dust mite allergen levels) and medium and high (unacceptable indoor dust mite allergen levels).
Previous studies in New Zealand have shown that the local homes had generally much higher levels of house dust mite (HDM) allergens than nurseries, kindergartens, and elementary schools [26,27,28]. Home environments had significantly higher dust mite allergens than indoor spaces of public buildings and were primarily affected by floor coverings [29]. The recent study in another country also showed that dust mite populations in home environments were higher than hotel and school indoor environments [30]. Those studies did not provide indoor thermal conditions. There are limited data and studies on measurements of indoor thermal environments in New Zealand houses; in particular, information on the relationships between indoor thermal environments, indoor air quality and health is sorely limited regarding New Zealand buildings [31,32]. The local previous studies showed that occupants’ poor health conditions were closely related to the poor living conditions of the houses with serious dust mite allergy problems [33,34]. This study focused on New Zealand houses and identified indoor thermal conditions related to different indoor dust mite allergen levels. This field study not only tested indoor thermal conditions in sample houses with dust mite allergen problems (unacceptable dust mite allergen levels) but also tested indoor thermal conditions in sample houses without dust mite allergen problems (acceptable dust mite allergen levels). Those thermal conditions of indoor spaces with acceptable dust mite allergen levels can be used as the threshold for keeping indoor allergens at acceptable levels. If the indoor thermal conditions of New Zealand houses can be maintained below the threshold for keeping indoor allergens at acceptable levels, there will be no indoor dust mite allergen problems.
Previous studies showed that mould cannot survive when indoor RH is lower than 60%. Mould can grow on most building materials when indoor RH exceeds 75–80% [35,36,37]. For mould spores to germinate, they require both higher indoor RH than mould survival does and the required time to germinate (Table 1) [38]. If indoor thermal conditions can be controlled to prevent mould spores’ germination, the mould hardly grows on the indoor surfaces [39,40]. The recent study of mould growths on different building materials in the laboratory environment showed that there is no mould growth on the materials’ surfaces when the RH was lower than 75% and the temperature was at 25 °C [41]. Those studies found that there are correlations between surface moisture content of the building materials and mould growth under different RH and temperature [42,43]. The other recent studies found that the short wavelength light can limit the formation and production of mould spores [44]; the optimum indoor ventilation condition in a building with an HVAC system can reduce mould growth [45]. This study focused on the thresholds of indoor thermal conditions for mould germination—not its survival or growth conditions—for preventing mould growth on indoor surfaces. This study also identified the relationships between indoor dust mites and mould under the local climate.
The healthy minimum indoor temperature recommended by WHO is 18 °C for houses and 20–21 °C for older people and young children’s living environments during the winter [46]. There are 1150 heating degree days for the Auckland climate (the base temperature: 18 °C) [47]. Previous studies showed that for minimising infections of the respiratory system during the winter, the required minimum indoor temperature is 16 °C [48,49]. Previous studies have revealed that winter indoor temperatures of local houses are quite lower than the health minimum indoor temperature recommended by WHO [50,51]. Based on data gathered from about 400 sample houses throughout New Zealand, mean winter living room and bedroom temperatures are below 18 °C. Mean living room and bedroom temperatures are 12.6–13.5 °C during the morning, 14.2–15.8 °C during the day, 15.0–17.8 °C during the evening, and 13.6–14.8 °C during the night [11]. As indoor temperature decreases, this is associated with an increase in indoor RH; very low indoor temperature can result in very high indoor RH. As occupants only use temporary heating in their living rooms and bedrooms when they are occupied during the winter or as needed, it is difficult to maintain winter indoor temperature above the healthy minimum indoor temperature recommended by WHO for 24 h a day in winter. This study tried to identify the minimum requirement of indoor temperature for maintaining the two major indoor allergens from dust mites and mould at the acceptable levels in New Zealand housing.

2. Materials and Methods

According to the instructions on how to use the Ventia Rapid Allergen Test, dust samples in the carpets of indoor spaces were collected by a vacuum cleaner with a DUSTREAM® collector (InBio, Charlottesville, VA, USA). In a bedroom, the area of carpet sampled was beside the bed. In a living room, the areas of carpet sampled were in front of the sofa or in the centre of a living room. The total testing area in a bedroom or a living room is about 1 m2. The continued vacuuming time for the sampling area of each room is 2 min. The Ventia Rapid Test cassettes were used for testing dust samples. The four different dust mite allergen levels—(1) undetectable; (2) low (less than 0.2 micrograms of dust mite allergens per gram of dust); (3) medium (0.2–1.0 micrograms of dust mite allergens per gram of dust); (4) high (≥1 microgram of dust mite allergens per gram of dust)—can be identified. According to the instructions of the Ventia Rapid Test cassettes, for Levels 1 and 2, no action is needed to reduce indoor levels of dust mite allergens (acceptable levels); for Levels 3 and 4, action should be taken to reduce indoor levels of dust mite allergens to protect occupants’ health (unacceptable levels). Undetectable and low dust mite allergens are considered acceptable; medium and high dust mite allergens are considered unacceptable for this study.
In accordance with the instructions of consulting industrial microbiologists Biodet Services Ltd. (Auckland, New Zealand), mould samples were collected by the researchers, using clear, standard Sellotape, from the indoor surface areas with visible mould in the indoor spaces. The mould samples on the Sellotape were then wrapped in the baking paper and put in the plastic bags; the samples were examined both macroscopically and microscopically by a local testing laboratory.
HOBO UX100 Temp/RH Data Loggers (Onset, Bourne, MA, USA) were used for the field studies of indoor thermal conditions (tested indoor thermal environment: −20 to 70 °C; for the temperature range of 0–50 °C, the accuracy is ±0.21 °C; for RH, the range is 15–95%, the accuracy is ±3.5%; the maximum data memory is 84,650; and the testing intervals can be set from 1 s to 18 h). Air temperatures and RH close to ceilings and floors in the indoor spaces (living rooms or bedrooms) and in the outdoor spaces under the roof eaves on the south sides of sample houses were continuously tested during the winter (15 min intervals and 24 h per day). The indoor measuring points adjacent to the ceilings and the floors were generally located at the room centres. Indoor measuring points adjacent to the floors of the north living room or bedroom could be located close to the south internal walls for avoiding direct sunlight. The outdoor measuring points under the roof eaves were on the south sides of houses, which can minimise the impact of solar gain during the daytime. There are about 635,904 raw data of indoor and outdoor temperatures and RH from the field studies of the 16 sample houses. Based on the field study data, winter indoor mean temperatures and RH, and winter indoor mean temperatures and RH close to the ceilings and the floors of the indoor spaces with different dust mite allergen levels in the new and old sample houses were calculated. Average outdoor temperature and RH for the new sample houses or the old sample were calculated and used for the outdoor reference data. All field study data of indoor and outdoor air temperatures (mean, close to ceiling and close to floor) have been converted into percentages of time in winter when air temperatures are greater than or equal to 16 °C, 17 °C, 18 °C, 20 °C, and 22 °C; all field study data of indoor and outdoor RH have been converted into percentages of time in winter when RH is greater than or equal to 40%, 50%, 60%, 70%, 75%, 80%, and 90% for the purposes of comparing indoor thermal conditions of indoor spaces with different dust mite allergen levels and mould growths in the new and old sample houses.
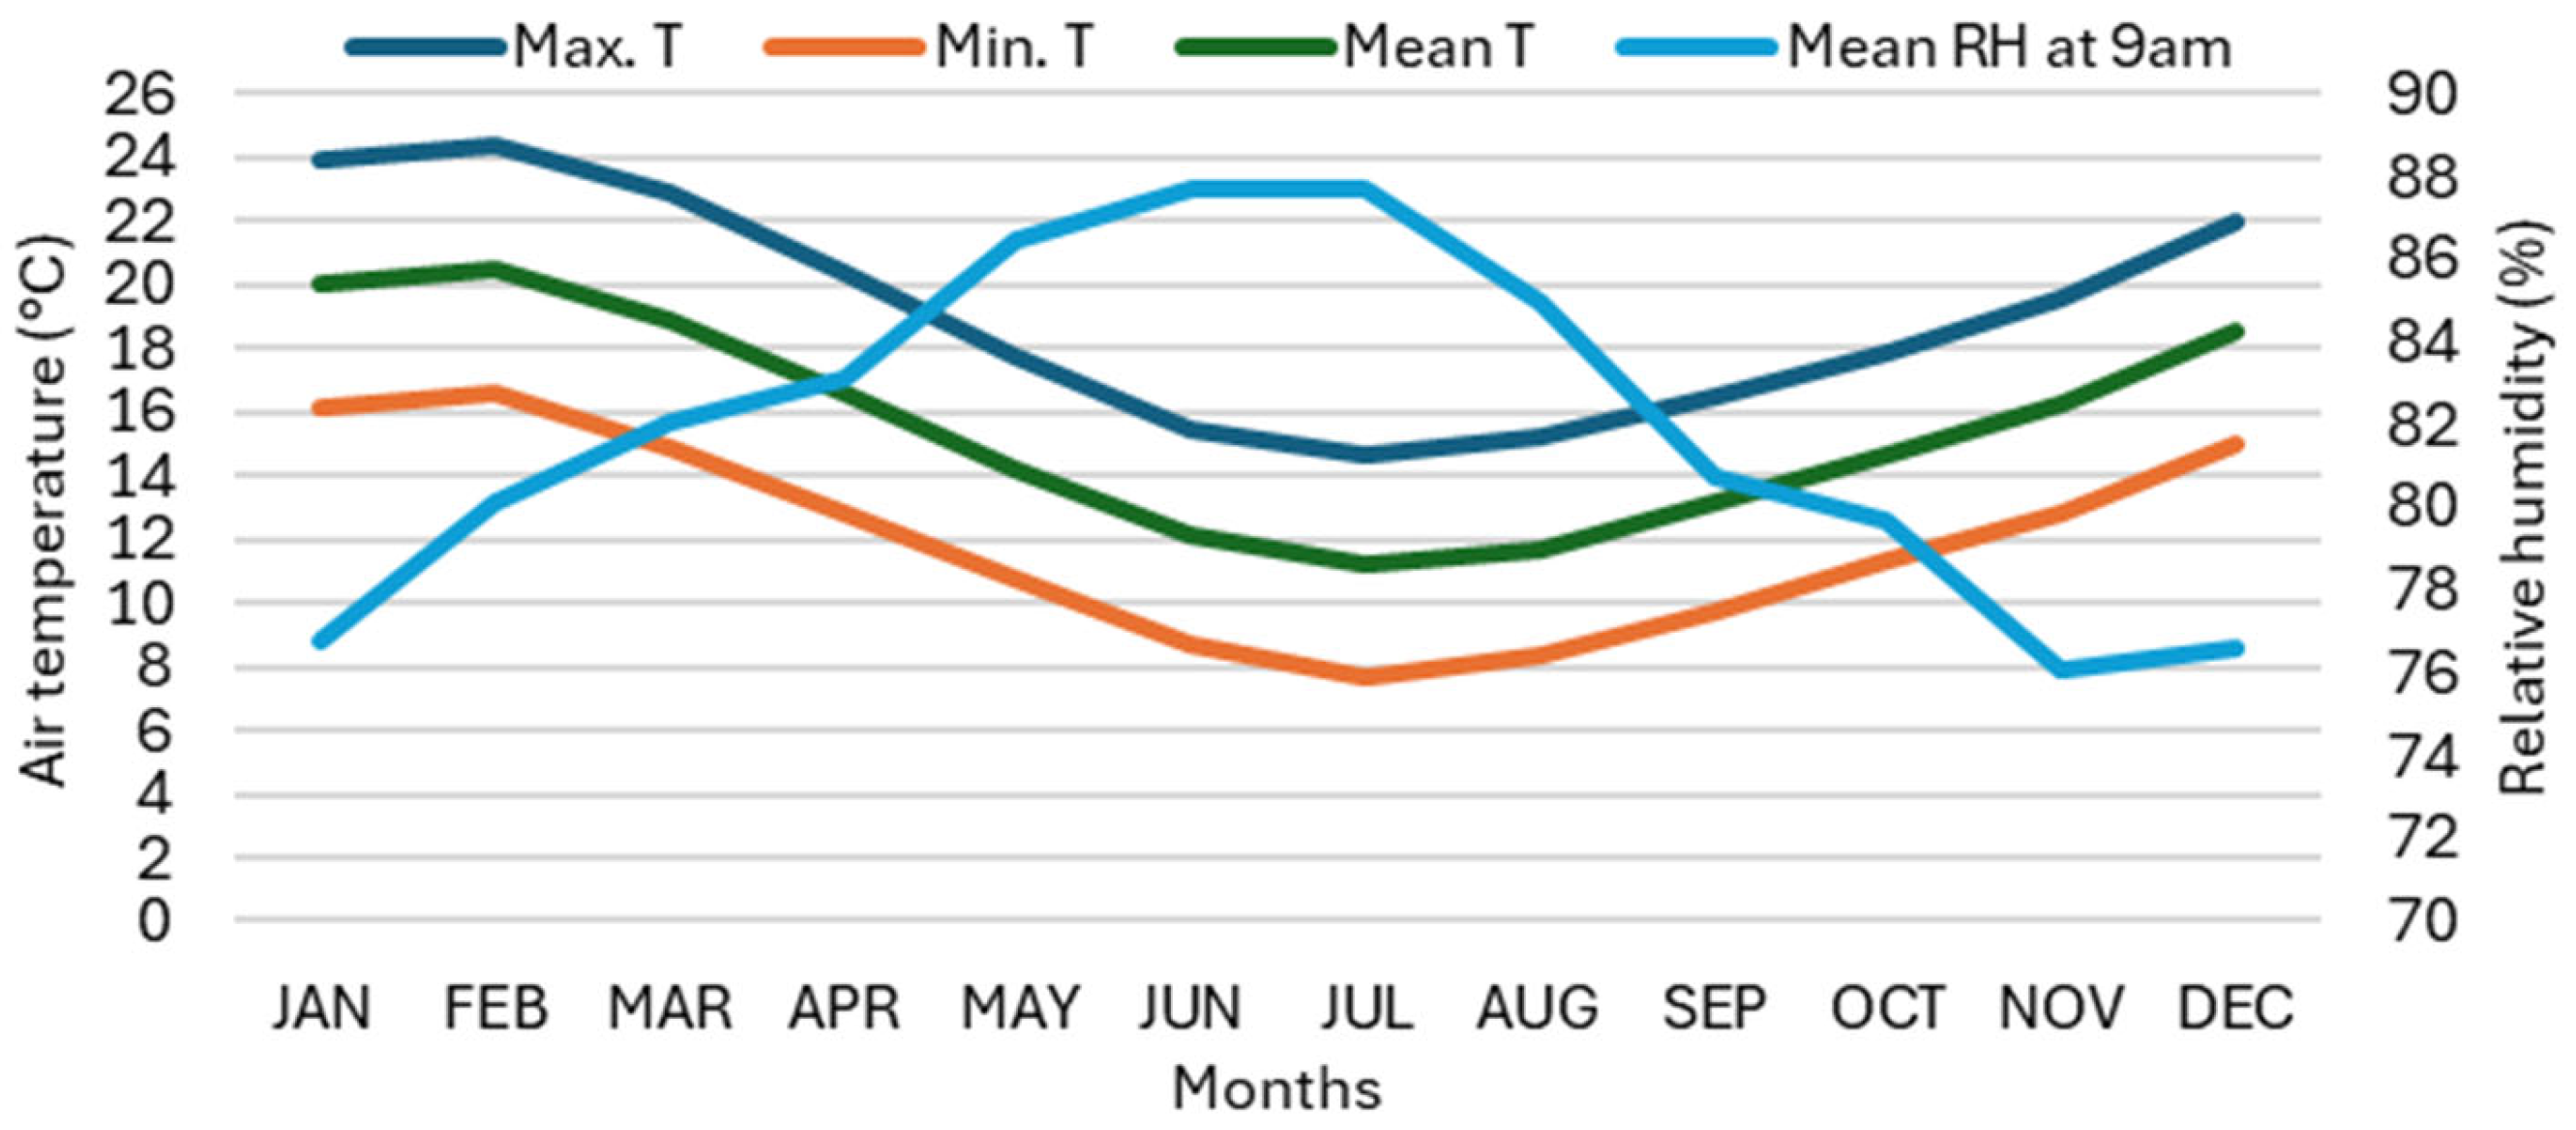
Indoor thermal environmental data of 17 indoor spaces (living rooms or bedrooms) in 11 old sample houses (floor areas from 51 m2 to 106 m2) with unacceptable dust mite allergen levels (medium and high levels) and mould growth present on internal surfaces in the remote sites of Minginui, Te Whaiti, and Murupara areas were used for the study. Dust mite allergen tested results in all the 7 indoor spaces of the five old sample houses were high levels; dust mite allergen tested results in all the 10 indoor spaces of the six old sample houses were medium levels. Indoor thermal environmental data in 15 indoor spaces (living rooms or bedrooms) of five new houses with acceptable dust mite allergen levels (undetectable and low levels) in Auckland city were used for the study. Dust mite allergen tested results in the 9 indoor spaces of the five new sample houses were undetectable levels; dust mite allergen tested results in the 6 indoor spaces of the four new sample houses were low levels. Dust mite tested results in all the indoor spaces of one new sample house were undetectable levels only; dust mite tested results in the indoor spaces of the other four new sample houses were both undetectable and low levels. Figure 1 and Figure 2 illustrate Auckland and Rotorua climate data. The remote field study sites in Minginui are near Rotorua.
The 11 old sample houses built from the 1920s to the 1970s have light timber structures and single-glazed windows. Roofing materials are old asbestos cement sheets (one house), old, corrugated iron (four houses) and old roof tin shingles (six houses). Wall materials are old brick (one house) and old weatherboard (ten houses). The 11 old sample houses do not have sufficient insulation (eight houses without any insulation and three houses with limited insulation). One house used an electric heater and a fireplace for space heating. Two sample houses used stoves for both cooking and space heating. Eight houses used fireplaces for space heating.
The five new sample houses (floor areas from 210 m2 to 256 m2) in Auckland, with a light timber structure, were built in the 2000s (2000–2018). Roofing materials are tile (four houses) and felt (one house). Wall materials are brick veneer and weatherboard (three houses) and polystyrene insulation board (two houses). Three houses have basic insulation (R1.9 for roofs, R1.5 for walls, and R1.3 for floors) [52] and single-glazed windows. Two houses have sufficient insulation (R2.9 for roofs, R1.9 for walls, R1.3 for floors, and R0.26 for glazing) [8,9] and double-glazed windows. For space heating, three sample houses used portable electric heaters, and two sample houses temporarily used heat pumps. The field studies of measuring indoor thermal conditions and testing for dust mite allergens in the old sample houses and new sample houses were carried out in the winter months (June, July, and August) in 2018 [34] and 2022, respectively, by the authors.

3. Results and Discussion

3.1. Mean Indoor RH and Different Dust Mite Allergen Levels

Table 2, Table 3, Table 4 and Table 5 list percentages of time in winter at different ranges of RH and mean indoor RH in the indoor spaces with different dust mite allergen levels. Although there was 99% and 86%, respectively, of time in winter when indoor RH was higher than or equal to 50% and 60%, dust mite survival conditions and ideal growth conditions, respectively [12,13,14,15,16,17], there were no allergens of dust mites being detected in carpets of the indoor spaces (Table 2). The mean RH of indoor spaces with undetectable dust mite allergens was 67%, with a range of 64–69% (Table 2). The mean RH of indoor spaces with low dust mite allergens was 72%, with a range of 70–75% (Table 3). For maintaining dust mite allergens at acceptable levels, the mean indoor RH does not have to be controlled below dust mite survival conditions (≥50%) or ideal growth conditions (≥60%). There were clear differences of mean indoor RH between the indoor spaces with acceptable dust mite allergen levels and the indoor spaces with unacceptable dust mite allergen levels (Table 2, Table 3, Table 4 and Table 5).
There were not many differences in percentages of time in winter when the indoor RH was higher than or equal to 50% and 60% (the conditions for dust mites to survive and the ideal conditions for dust mites to grow, respectively) between the indoor spaces with acceptable dust mite allergen levels (Table 2 and Table 3) and the indoor spaces with unacceptable dust mite allergen levels (Table 4 and Table 5). There were clear differences in percentages of time in winter between the indoor spaces with acceptable dust mite allergen levels and the indoor spaces with unacceptable dust mite allergen levels when the indoor RH was equal to or higher than 70% (the ideal conditions for dust mites to grow). There were significant differences in percentages of time in winter between the indoor spaces with acceptable dust mite allergen levels and the indoor spaces with unacceptable dust mite allergen levels when the indoor RH was higher than or equal to 75–80% (the conditions for dust mites to thrive [2,14,15,18,19,20]).
Percentages of time in winter associated with different RH ranges, especially for the threshold for dust mites to thrive (≥75–80%), and the mean indoor RH can be used to identify the different indoor thermal conditions that cause different indoor dust mite allergens. Previous studies have mainly focused on indoor RH related to the threshold for dust mite survival (50%) and maintaining indoor RH below the threshold for dust mite survival (50%) to reduce dust mite populations or eliminate dust mites [12,13,14,15,16,17]. The study mainly focused on indoor RH related to the conditions for dust mites to thrive (≥75–80%) [2,14,15,18,19,20]. If indoor thermal environmental conditions can be maintained below the conditions for dust mites to thrive, indoor dust mite allergens can be maintained at the acceptable levels (i.e., low or undetectable).

3.2. Mean Indoor Air Temperatures and Different Dust Mite Allergens

Table 6, Table 7, Table 8 and Table 9 list percentages of time related to different ranges of air temperatures and mean indoor air temperatures in the indoor spaces (living rooms or bedrooms) with different dust mite allergens. There were significant differences of mean indoor temperatures between the indoor spaces with acceptable dust mite allergen levels (undetectable and low) and the indoor spaces with unacceptable dust mite allergen levels (medium and high). In the indoor spaces with undetectable dust mite allergens, the mean indoor air temperatures were all higher than 17 °C; the mean indoor temperature was 19 °C with a range of 17–20 °C, which maintained mean indoor RH below 70%. In the indoor spaces with low dust mite allergens (Table 7), the mean indoor temperatures were higher than 15 °C; the mean indoor temperature was 16 °C with a range of 15–19 °C, which maintained mean indoor RH below 75%. Previous studies found that indoor temperatures above 16 °C can limit respiratory infections [48,49]. Sixteen °C can be considered as the minimum indoor temperature required to keep indoor dust mite allergens at the acceptable levels. If the mean indoor temperature in winter can be kept at the higher levels, such as 17–20 °C, this will ensure a better indoor thermal environment for occupants’ thermal comfort and health and prevent dust mite allergen problems. It is shown in previous studies that winter indoor temperatures of New Zealand homes are significantly lower than the requirements of thermal comfort or health for occupants [50,51]. A study of about 400 sample houses with different building envelope designs and temporary space-heating methods throughout New Zealand found that mean winter living room and bedroom temperatures were significantly below 18 °C, the health minimum indoor temperature recommended by the WHO [46]. Indoor temperatures of those sample houses were below 16 °C for most of the winter [11,50,51]. Maintaining the indoor air temperature above 16 °C should be the first step for New Zealand houses to phase in the reduction of indoor allergens from dust mites.
In the indoor spaces with medium or high dust mite allergens, the mean indoor temperatures were all significantly below 16 °C (Table 8 and Table 9). In indoor spaces with high dust mite allergens, the mean indoor air temperature was 11 °C, with a range of 9–13 °C. In indoor spaces with medium dust mite allergens, the mean indoor temperature was 10 °C, with a range of 7–11 °C. The mean indoor temperature (11 °C with a range of 9–13 °C) of indoor spaces with high dust mite allergens was slightly higher than the indoor spaces with medium dust mite allergens (10 °C with a range of 7–11 °C). Dust mites prefer warm and humid indoor environments [2,14,15,18,19,20]. Environmental temperature increase (the range from 10 °C to 25 °C) can cause higher dust mite populations [14,15,18,19,20]. If indoor temperatures of an indoor space cannot be maintained above 16 °C by temporary space heating, a small increase (a couple of degrees) of indoor temperature can provide a better thermal environment for dust mites to thrive.

3.3. Indoor RH Close to the Floors

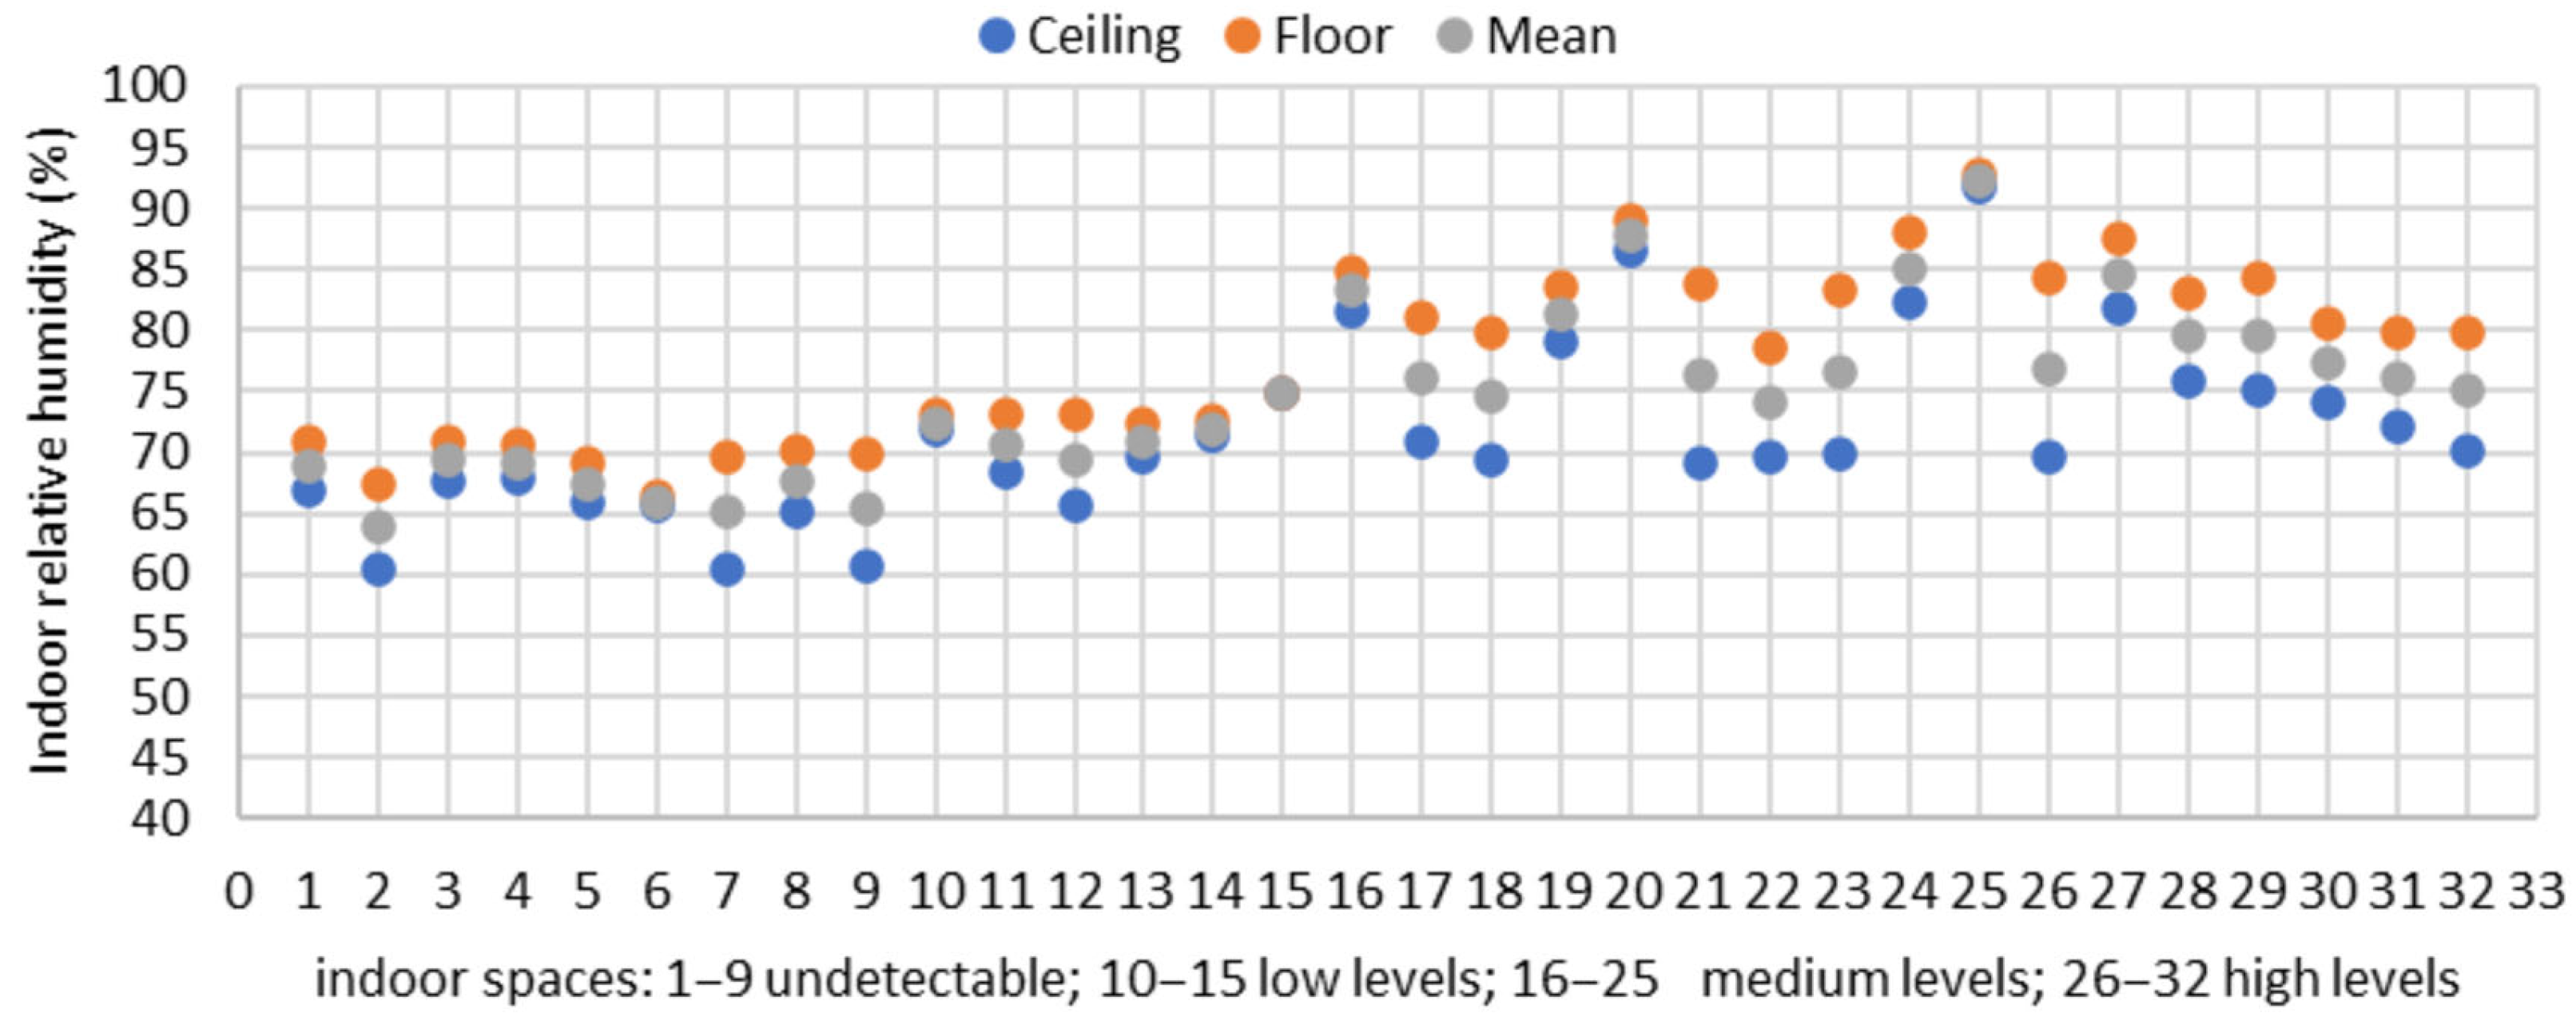
Figure 3 and Figure 4 show indoor mean air temperatures and RH in the indoor spaces with different dust mite allergen levels. The mean air temperature is normally higher next to the ceiling than the floor (Figure 3), and the mean RH is higher close to the floor than the ceiling (Figure 4). Dust mite development in carpets is more directly impacted by the RH of the air close to the floor than the mean indoor RH.
Figure 5 illustrates the mean RH close to the floors in indoor spaces with different dust mite allergen levels. The mean RH close to the floors is generally higher than the mean indoor RH. In the indoor spaces with undetectable dust mite allergens, the mean RH close to the floors was 69.4%, with a range of 66.3–70.9%, which was below or close to 70%. In the indoor spaces with low dust mite allergens, the mean RH close to the floors was 73.2%, with a range of 72.3–74.9%, which was higher than 70% and below 75% (the conditions for dust mites to thrive). In the indoor spaces with medium dust mite allergens, the mean RH close to the floors was 84.5%, with a range of 78.6–92.8%, which was significantly higher than the conditions for dust mites to thrive (≥75–80%). In the indoor spaces with high dust mite allergens, the mean RH close to the floors was 82.7%, with a range of 80.0–87.5%, which was significantly higher than the conditions for dust mites to thrive (≥75–80%). The main difference in mean RH close to the floors between indoor spaces with acceptable and unacceptable dust mite allergen levels was whether the mean indoor RH was higher than 75% (the conditions for dust mites to thrive).
Figure 6 illustrates percentages of time in winter when RH close to the floors was higher than or equal to 75%. In the indoor spaces with undetectable dust mite allergens, the percentages of time in winter when RH close to the floors was higher than or equal to 75% were all below 30%; the mean percentage was 15.8%, with a range of 3.0–28.7%. In the indoor spaces with low dust mite allergens, the percentages of time in winter when RH close to the floors was higher than or equal to 75% were all below 50%; the mean percentage was 39.9%, with a range of 29.2–48.7%. In the indoor spaces with medium dust mite allergens, the percentages of time in winter when RH close to the floors was higher than or equal to 75% were all higher than 70%; the mean percentage was 92.3%, with a range of 73.3–99.6%. In the indoor spaces with high dust mite allergens, the percentages of time in winter when RH close to the floors was higher than or equal to 75% were all higher than 80%; the mean percentage was 92.5%, with a range of 81.8–98.8%. The main differences between indoor spaces with acceptable and unacceptable dust mite allergen levels were the time in winter when RH close to the floors was higher than or equal to 75%, the conditions for dust mites to thrive.
Figure 7 illustrates average time (h) per day in winter when RH next to the floors was below 75% in the indoor spaces with different dust mite allergen levels. In the indoor spaces with undetectable dust mite allergens, the average time (h) per day in winter when RH close to the floors was below 75% was in all cases more than 17 h; the average time was 20 h, with a range of 17–23 h. In the indoor spaces with low dust mite allergens, the average time (h) per day in winter when RH close to the floors was below 75% was in all cases more than 12 h; the average time was 14 h, with a range of 12–17 h. The study compared and identified the differences of indoor RH in the indoor spaces with different dust mite allergen levels and identified the thresholds of RH to maintain the indoor dust mite allergens at acceptable levels.
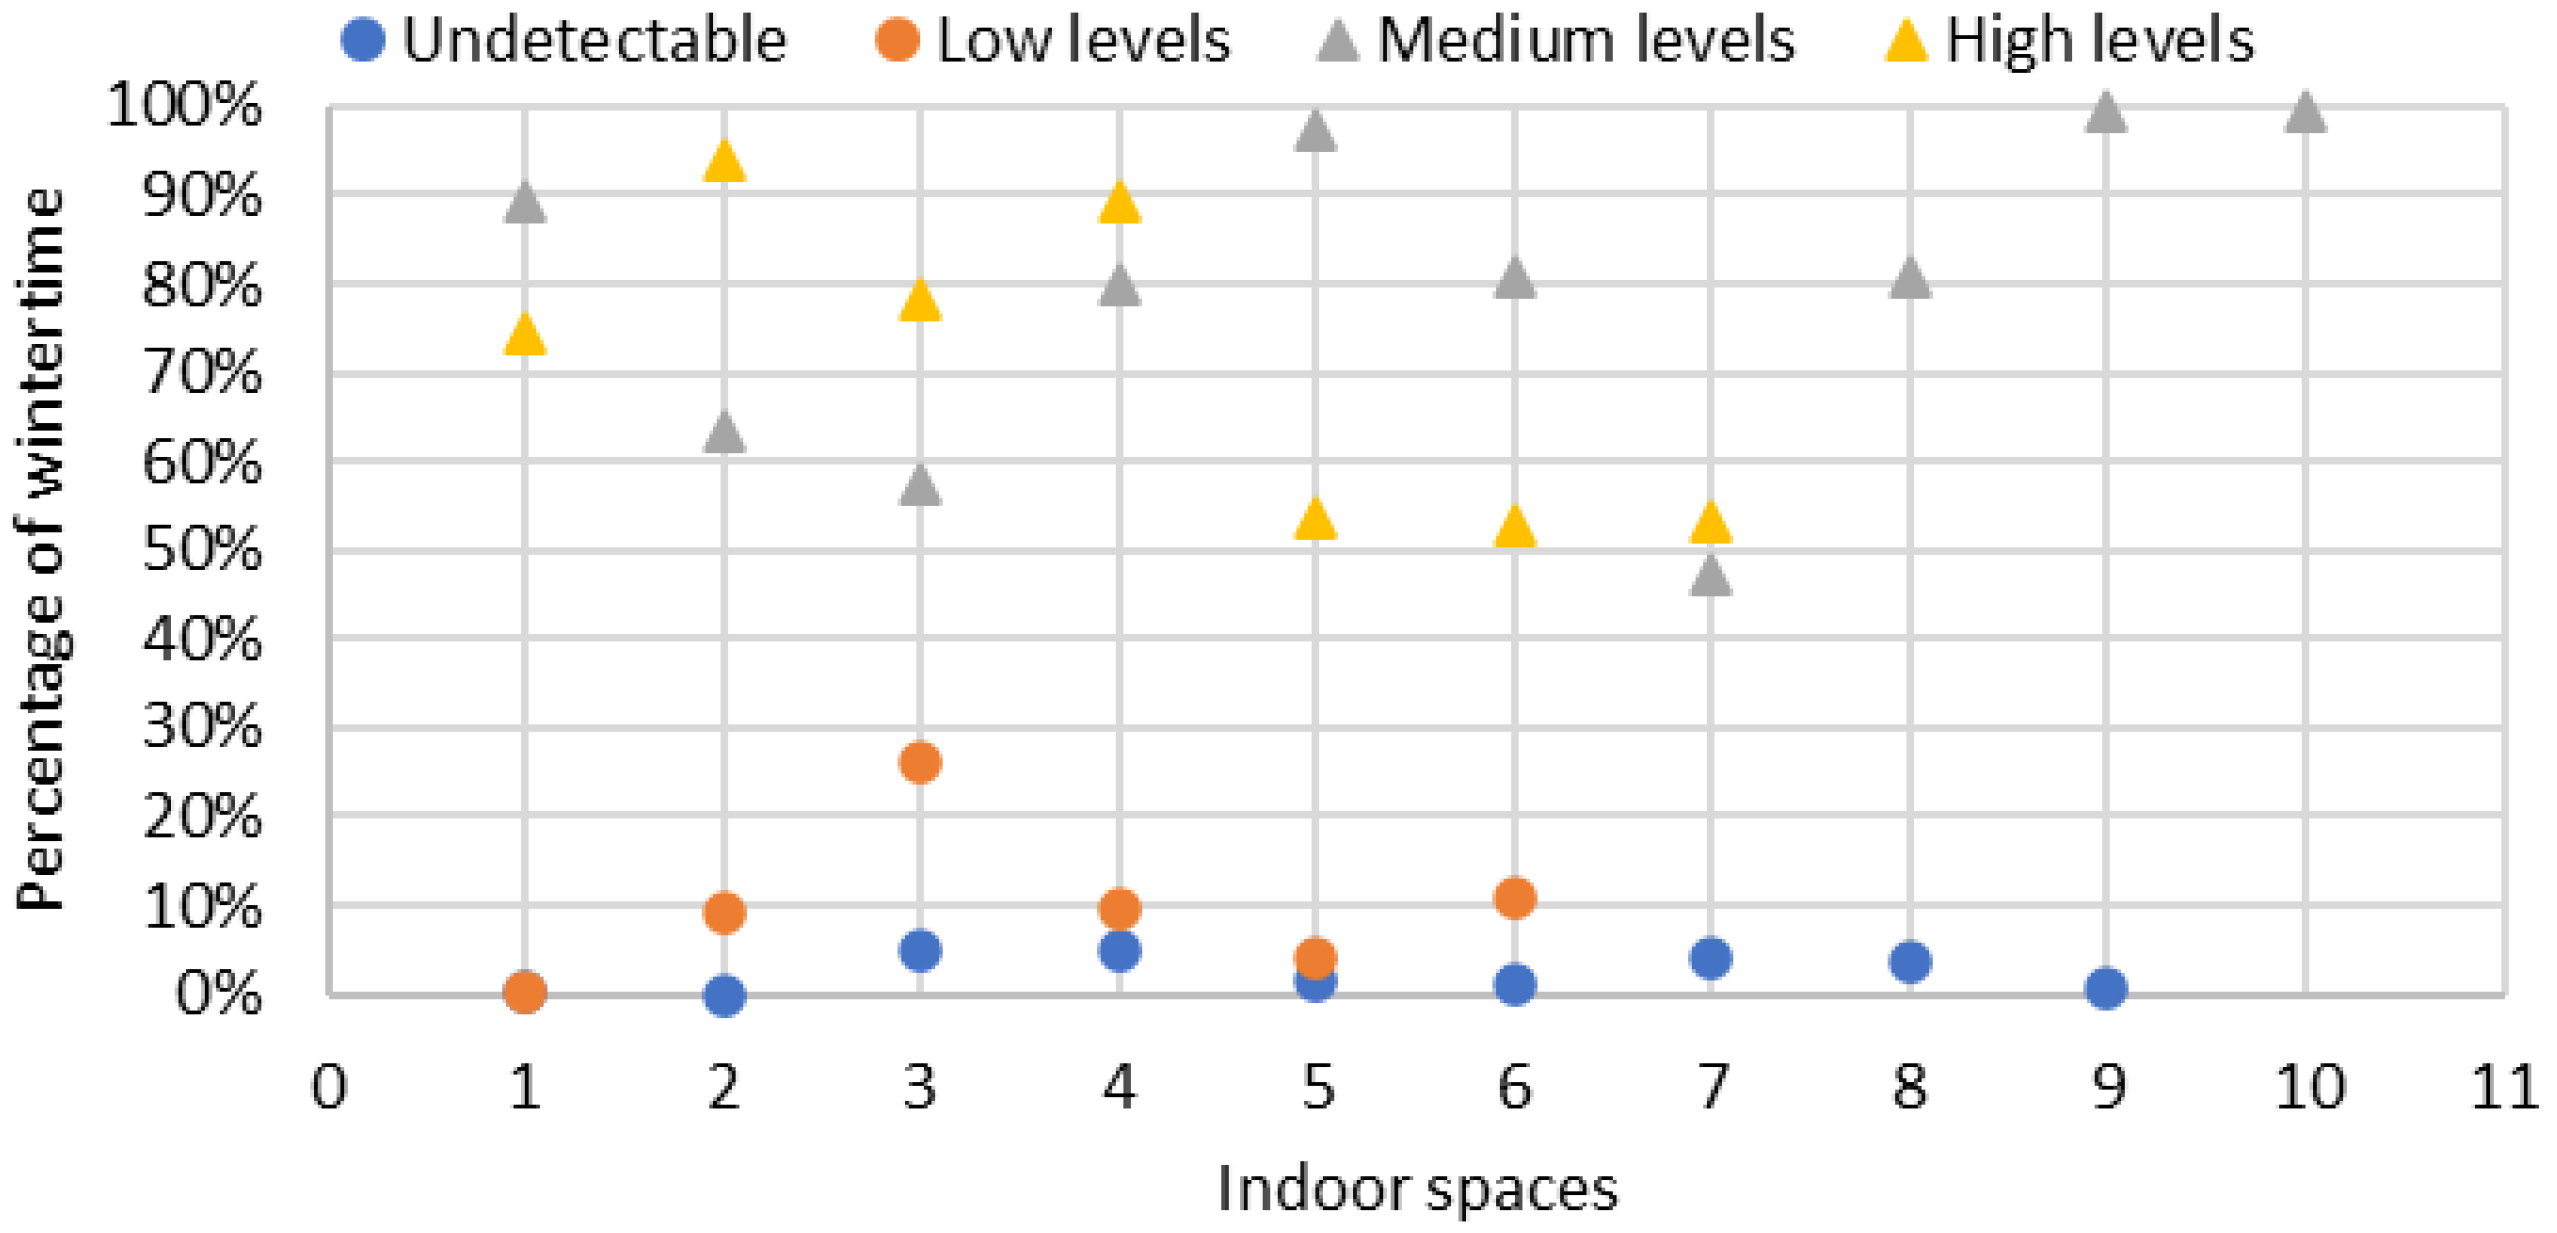
Figure 8 illustrates percentages of time in winter when RH close to the floors was higher than or equal to 80%, the conditions for mould spores to germinate (Table 1) [38]. In the indoor spaces with undetectable dust mite allergens, the percentage of time in winter when RH close to the floors was higher than or equal to 80% was in all cases below 5%; the mean percentage of time was 2%, with a range of 0–5%. In the indoor spaces with low dust mite allergens, the percentage of time in winter when RH close to the floors was higher than or equal to 80% was in all cases below 26%; the mean percentage of time was 10%, with a range of 0–26%. In the indoor spaces with medium dust mite allergens, the percentage of time in winter when RH close to the floors was higher than or equal to 80% was in all cases higher than 47%; the mean percentage of time was 80%, with a range of 47–100%. In the indoor spaces with high dust mite allergens, the percentage of time in winter when RH close to the floors was higher than or equal to 80% was in all cases higher than 50%; the mean percentage of time was 71%, with a range of 53–94%.
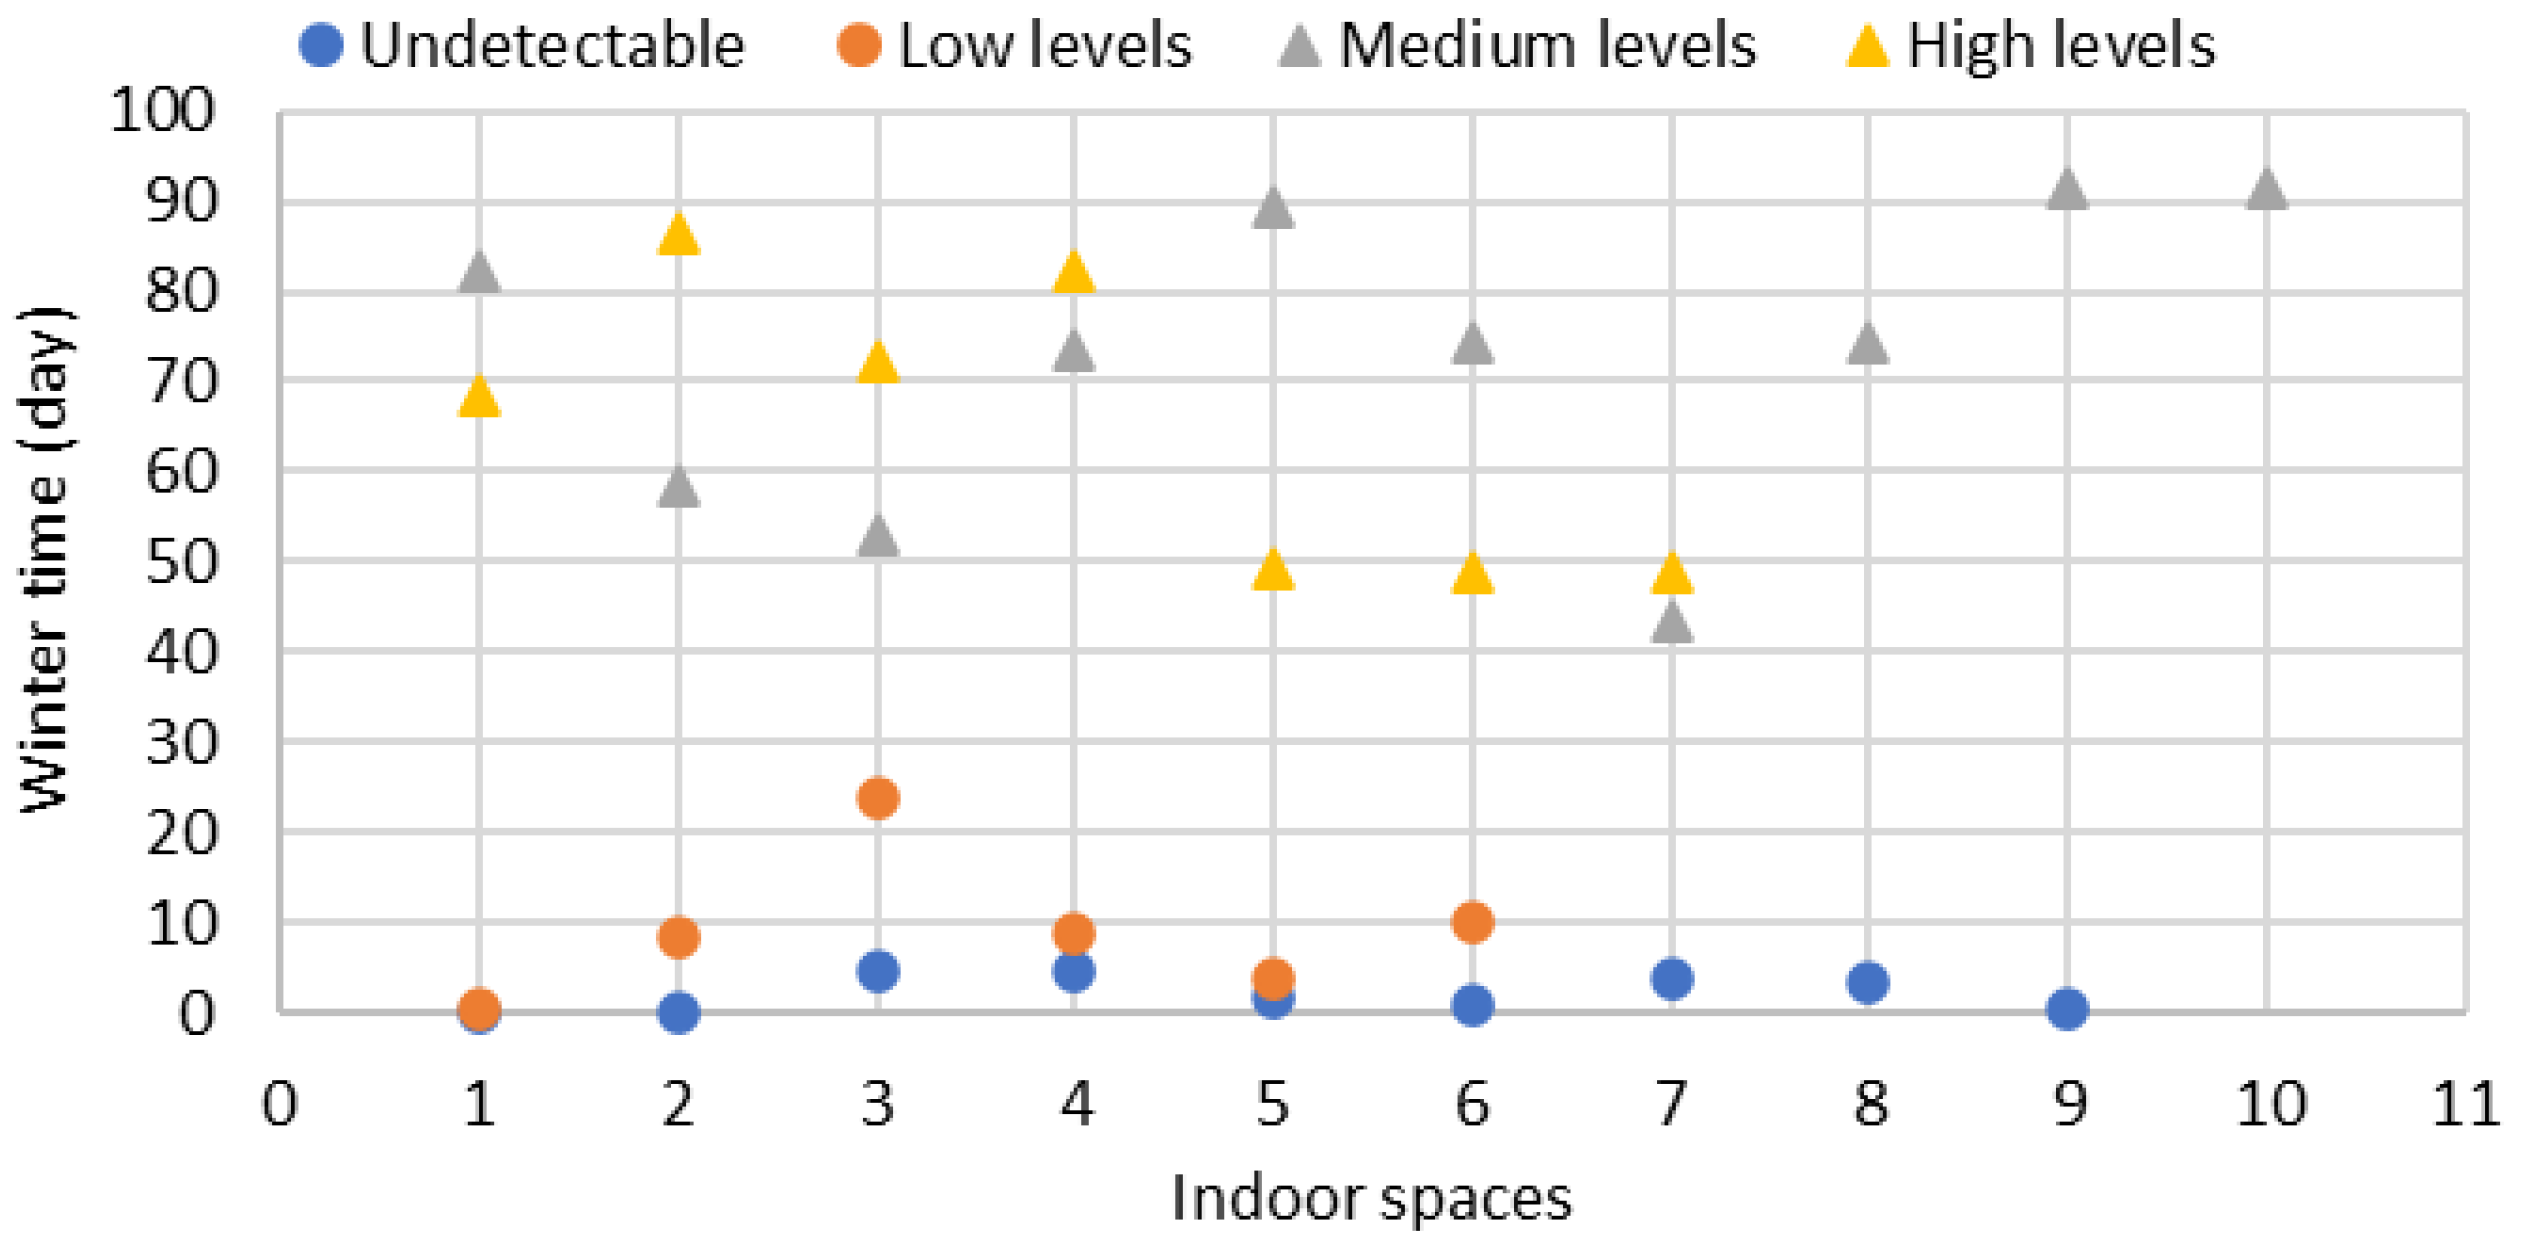
Figure 9 illustrates the time in winter (days) when RH close to the floors was higher than or equal to 80%, the conditions for mould spores to germinate (Table 1). In the indoor spaces with undetectable dust mite allergens, the time in winter when RH close to the floors was higher than or equal to 80% was in all cases less than 4.7 days. In the indoor spaces with low dust mite allergens, the time in winter when RH close to the floors was higher than or equal to 80% was in all cases less than 24 days. In the indoor spaces with undetectable and low dust mite allergens, the total time in winter when RH close to the floors was higher than or equal to 80% was less than 30 days, the threshold of time required for mould spores to germinate. If indoor mould spore germination can be prevented, there will be no mould allergens in that indoor space [39]. The RH close to the floor is the highest RH in an indoor space. If the RH of the air close to the floor does not meet the conditions for mould spores to germinate, the RH of the air above the floor, close to the walls and ceiling, will never reach the conditions for mould spores to germinate. An indoor space with acceptable dust mite allergen levels is unlikely to have mould allergen problems. In the indoor spaces with medium dust mite allergens, the total time in winter when RH close to the floors was higher than or equal to 80% was in all cases more than 43 days. In the indoor spaces with high dust mite allergens, the time in winter when RH close to the floors was higher than or equal to 80% was in all cases more than 48 days. In the indoor spaces with medium or high dust mite allergens, the time in winter when RH close to the floors was higher than or equal to 80% was in all cases significantly more than 30 days, and indoor RH met the thresholds for mould survival, growth and development conditions for most of the time in winter (Table 4 and Table 5); there were likely to be mould growth problems in those spaces.
Table 10 lists the indoor spaces with unacceptable dust mite allergen levels and identified mould growths. As mould samples were mainly collected from the limited indoor surfaces with visible mould, mould growth on other surfaces could have been missed, and the accuracy of mould test results could have been influenced. Mould test results also could have been influenced by occupants’ daily life and could depend on how often the occupants cleaned the indoor surfaces, especially areas with visible mould. Based on the field study data of the sample houses with unacceptable levels of dust mite allergens, the general relationships between dust mite allergens and mould in test results can be identified. Most of the sample houses with high levels of dust mite allergens also had an abundant or moderate level of Cladosporium, and most of the sample houses with a medium level of dust mite allergens also had low to moderate levels of Cladosporium. If a house has medium or high levels of dust mite allergens, it is likely to have a mould growth problem, and vice versa.
Figure 10 illustrates the time in winter (days) of indoor spaces with different dust mite allergen levels when RH close to the ceilings was higher than or equal to 80%, the conditions for mould spores to germinate. In some indoor spaces with medium or high dust mite allergens, the total time in winter (days) when the indoor RH close to the ceilings was higher than or equal to 80%, the conditions for mould spore germination, was significantly more than 30 days. If visible mould on the ceilings or walls can be identified, there must be serious dust mite allergens and serious mould growth on hidden indoor surfaces, especially the areas close to the floor. New Zealand asthma prevalence remains at one of the highest rates in the world [53]. About 13% of adults and 14% of children have asthma in New Zealand [54,55]. The previous studies showed that sensitisation to HDM was an important factor for children developing asthma [56]. High indoor dust mite allergens could contribute to the severity of asthma and the significant high rate of asthma prevalence in New Zealand [57]. Young children living in the house with a severe mould allergy could develop asthma and allergic rhinitis [58,59]. Chronic respiratory diseases developed in early years can negatively impact life expectancy [60]. The ability of mould spores to germinate and dust mites to thrive is solely related to high indoor RH; therefore, indoor RH should be controlled to prevent dust mites from thriving and mould from germinating at the same time.

3.4. Mean Indoor Air Temperatures Close to the Floors and Different Dust Mite Allergen Levels

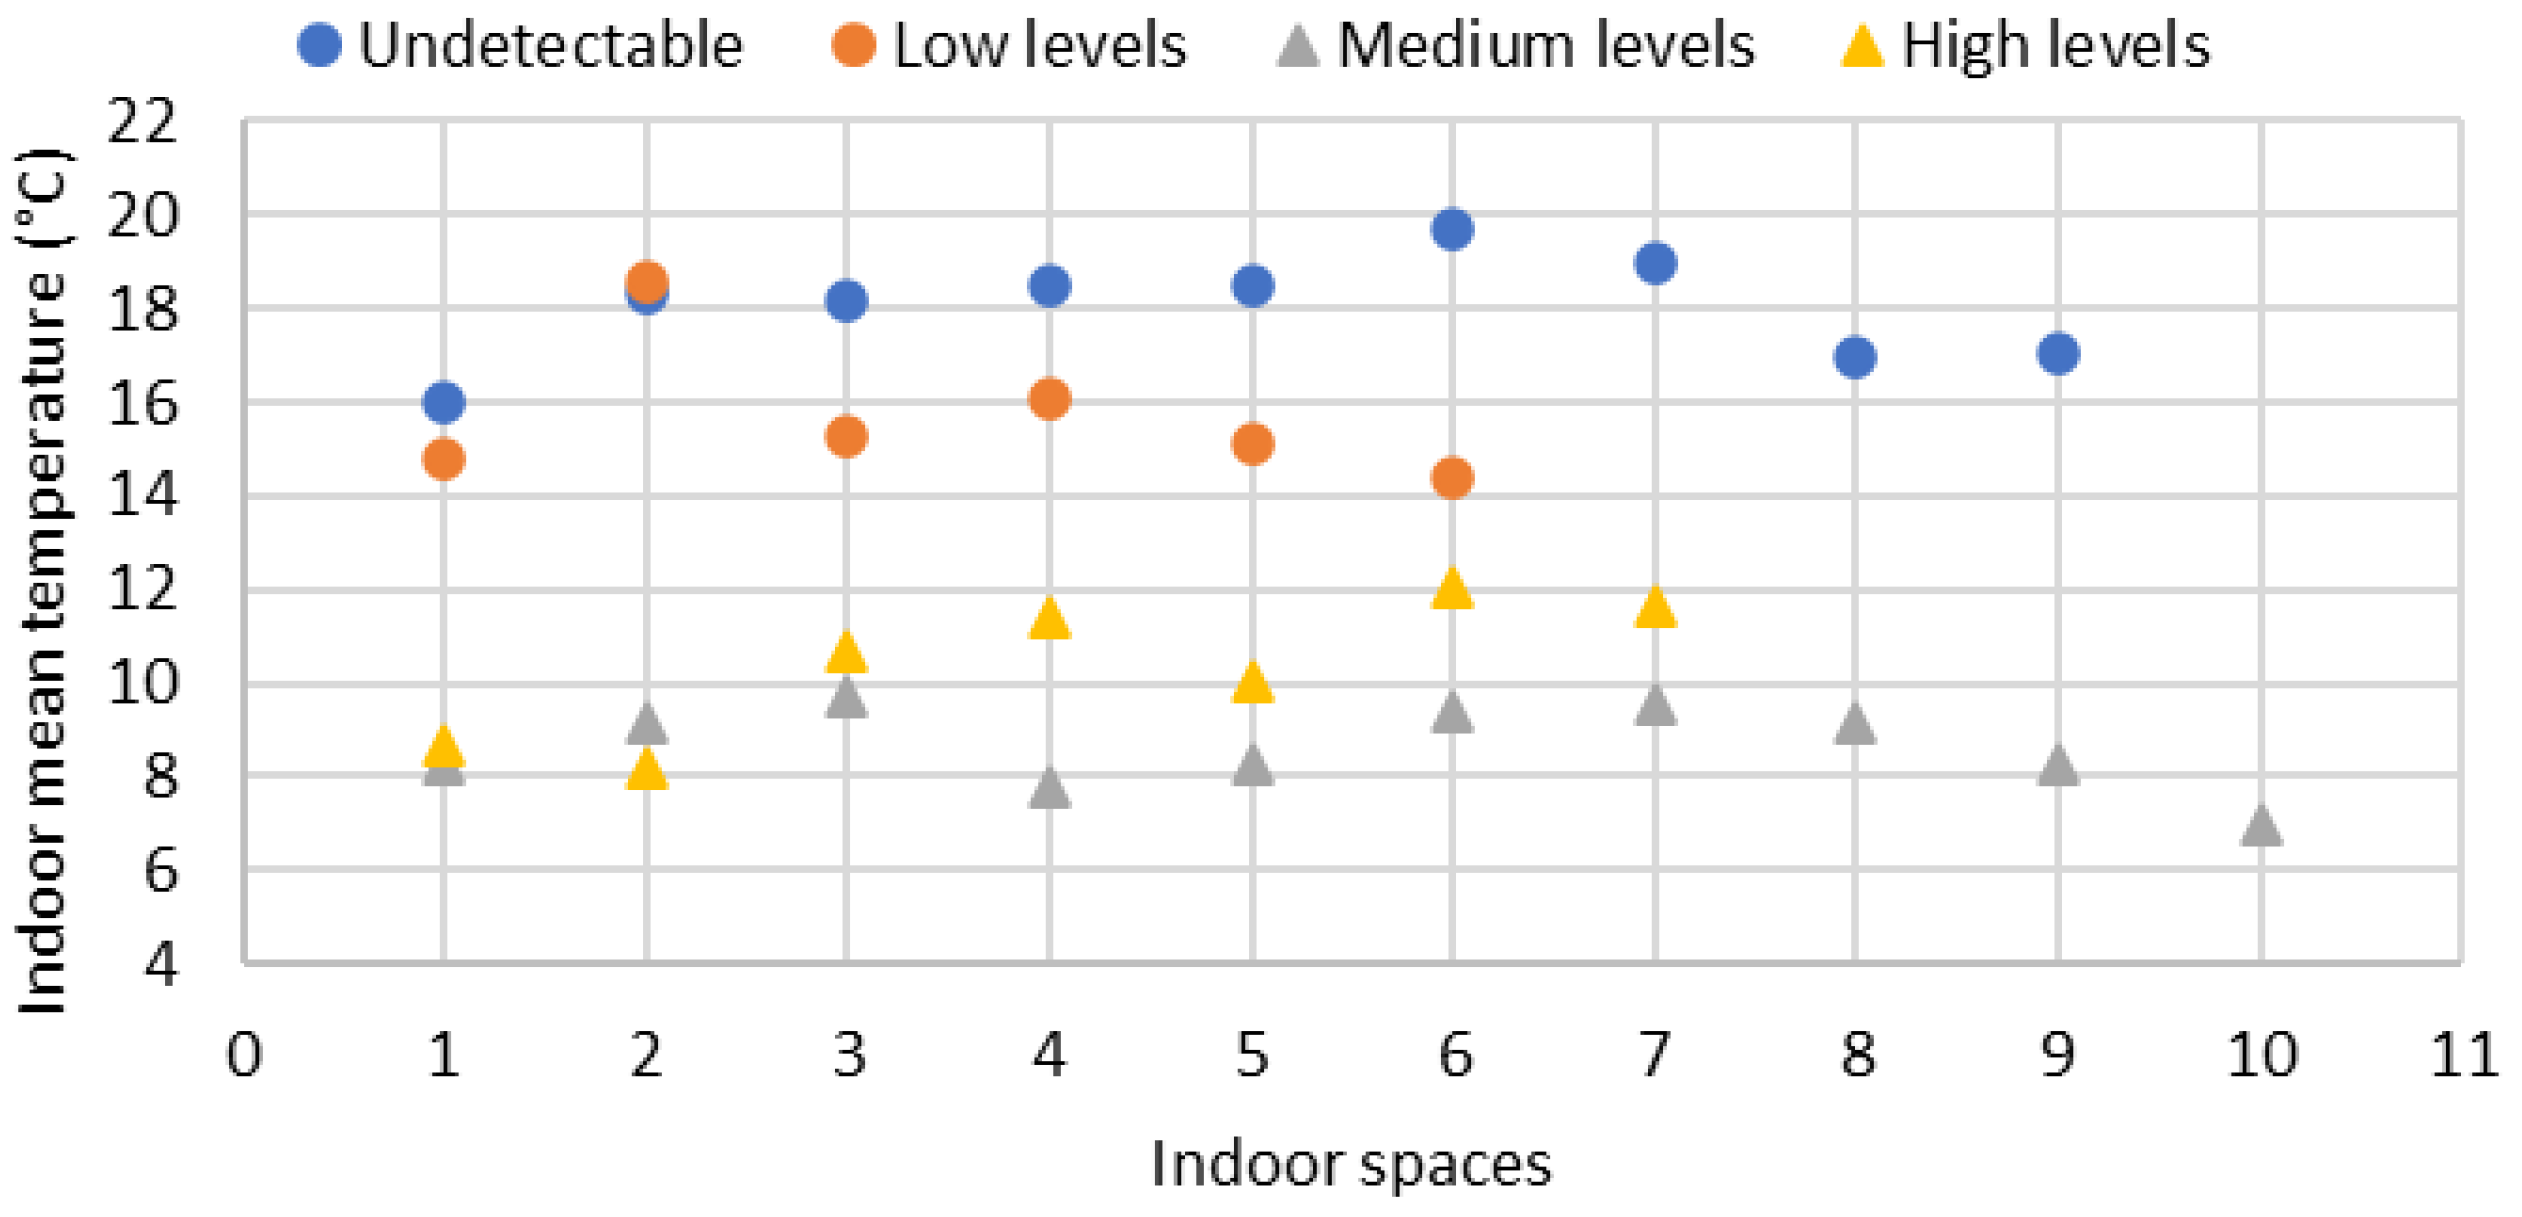
Figure 11 illustrates mean indoor temperatures close to the floors of indoor spaces with different dust mite allergen levels. The mean indoor temperatures close to the floors were slightly lower than the mean indoor air temperatures of the spaces. In the indoor spaces with undetectable dust mite allergens, the mean indoor temperatures close to the floors were all higher than or equal to 16.0 °C; the mean indoor temperature close to the floors of these spaces was 18.0 °C, with a range of 16.0–19.7 °C. In the indoor spaces with low dust mite allergens, the mean air temperatures close to the floors were higher than or close to 15.0 °C; the mean air temperature close to the floors of these spaces was 15.7 °C, with a range of 14.4–18.6 °C. In the indoor spaces with medium dust mite allergens, the mean air temperatures close to the floors were all below 10.0 °C; the mean air temperature close to the floors of these spaces was 8.7 °C, with a range of 7.0–9.8 °C. In the indoor spaces with high dust mite allergens, the mean air temperatures close to the floors were all below 13.0 °C; the mean air temperature close to the floors of these spaces was 10.5 °C, with a range of 8.2–12.1 °C. In the indoor spaces with medium and high dust mite allergens, the mean indoor temperatures of those spaces (Table 8 and Table 9) and the mean indoor temperatures close to the floors were very low. When winter indoor temperatures are lower than 12 °C, occupants’ blood pressure and blood viscosity can be temporarily increased, which could lead to heart attacks or strokes. When winter indoor temperatures are lower than 9 °C, elderly occupants’ core temperature can decrease [61,62,63]. Those low indoor temperatures can not only increase indoor allergens but also can negatively impact occupants’ health [33,34].
The sample houses in this study having medium or high dust mite allergens in their indoor spaces were built from the 1920s to the 1970s. Before 1977, there was no insulation in the building envelopes of New Zealand houses. The R-value requirements for building elements in Climate Zone 1 (R1.9 for roofs, R1.5 for walls, and R0.9 for floors) were in accordance with the New Zealand standard in 1977 [64,65]. The R-value requirements for building elements in Climate Zone 1 (R1.9 for roofs, R1.5 for walls, and R1.3 for floors) were updated in accordance with the revised standard in 1996 [52,66]. After 1996, the R-value requirements for building elements in Climate Zone 1 were continuously updated. There were no requirements for double glazing until 2004 [67]. The R-value requirements for building elements in Climate Zone 1 (R2.9 for roofs, R1.9 for walls, R1.3 for floors, and R0.26 for glazing) were updated in accordance with the standard in 2009 [8,9]. However, there are still many New Zealand houses without adequate insulation. It is difficult or not energy efficient for those houses without insulation or with limited insulation to be heated up to and maintained at the minimum indoor temperature required for maintaining indoor dust mite allergens at acceptable levels. The low indoor temperature can result in high indoor RH, which can negatively impact indoor air quality. It is widely acknowledged that poor-quality living conditions can negatively impact occupants’ health and wellbeing [34,68,69]. The new sample houses with acceptable dust mite allergen levels had sufficient insulation (R2.9 for roofs, R1.9 for walls, R1.3 for floors, and R0.26 for glazing) or basic insulation (R1.9 for roofs, R1.5 for walls, and R1.3 for floors) in their building envelopes. Retrofitting existing houses with adequate insulation in their envelopes, in accordance with the new building standards, should be the first step to improving indoor health conditions. These measures can raise the baseline of winter indoor temperatures, which can make temporary space heating more efficient to maintain the indoor temperatures for controlling the indoor allergens at the acceptable levels.
A limitation of this study is the lack of survey data on occupant behaviour in houses, for example, how occupants used space heating, especially for the indoor spaces with acceptable dust mite allergen levels, and how much space heating energy was needed for maintaining indoor thermal conditions required to control dust mite allergens at acceptable levels. Further study on indoor dust mite allergens could include the area of beds, sofas, upholstered furniture, etc.

4. Conclusions

Based on the field studies, this study contributes the new physical data of winter indoor thermal conditions of the indoor spaces with four different dust mite allergen levels in New Zealand houses under a temperate climate with mild and wet winters. For maintaining indoor dust mite allergens at acceptable levels, the mean indoor RH does not have to be controlled below the conditions for dust mites to survive (50%) or the ideal conditions for dust mites to grow (60%). There were clear differences of mean indoor RH between the indoor spaces with acceptable and unacceptable dust mite allergen levels. There were significant differences in percentages of time in winter between the indoor spaces with acceptable and unacceptable dust mite allergen levels when the indoor RH was higher than or equal to 75–80% (the conditions for dust mites to thrive).
This study identified thresholds of indoor mean temperatures and percentages of time in winter when indoor RH is higher than or equal to 70% and 75% to maintain indoor dust mite allergens at the acceptable levels (undetectable and low dust mite allergen levels). This study provides a new method to identify the relationships between indoor thermal conditions and indoor dust mite allergen levels. The relationships can serve as guidelines to maintain indoor dust mite allergens at acceptable levels.
If the RH close to the floor can be maintained to keep dust mite allergens in the carpet at the acceptable levels, and the indoor RH never meets the conditions for mould spores to germinate, there will be no mould growth or allergy problems. The main indoor allergens from dust mites and mould can be prevented at the same time in New Zealand housing. Maintaining the indoor air temperature above 16 °C should be the starting point for New Zealand houses to phase in the reduction of indoor allergens from dust mites and mould.
Author Contributions

Conceptualization, B.S.; Methodology, B.S.; Validation, B.S. and L.W.; Formal analysis, B.S.; Investigation, B.S.; Resources, B.S., P.M., R.J.M. and L.W.; Data curation, B.S., L.W. and P.M.; Writing—original draft, B.S.; Writing—review and editing, B.S., P.M., R.J.M. and L.W.; Supervision, B.S.; Project administration, B.S. and P.M.; Funding acquisition, B.S. and L.W.; All authors have read and agreed to the published version of the manuscript.

Funding

This research was partially funded by National Science Challenges (Ministry of Business, Innovation & Employment, New Zealand), grant number SRA5-KTKR-Toi Ohomai.

Data Availability Statement

Data is contained within the article.

Conflicts of Interest

The authors declare that the research was conducted in the absence of any commercial or financial relationships that could be construed as a potential conflict of interest. This research was partially funded by National Science Challenges (Ministry of Business, Innovation & Employment, New Zealand), grant number SRA5-KTKR-Toi Ohomai. The funders were not involved in the study design, collection, analysis, interpretation of data, the writing of this article or the decision to submit it for publication.

References

  1. Hessell, J.W.D. The Climate and Weather of Auckland; New Zealand Meteorological Service: Wellington, New Zealand, 1988.
  2. Arundel, A.B.; Sterling, E.M.; Biggin, J.H.; Sterling, T.D. Indirect health effects of relative humidity in indoor environments. Environ. Health Perspect. 1986, 65, 351–361. [Google Scholar]
  3. Siebers, R.; Wickens, K.; Crane, J. House dust mite allergens and allergic diseases—The Wellington Asthma Research Group studies. N. Z. J. Med. Lab. Sci. 2006, 60, 49–58. [Google Scholar]
  4. Howden-Chapman, P.; Saville-Smith, K.; Crane, J.; Wilson, N. Risk factors for mould in housing: A national survey indoor air. Indoor Air 2005, 15, 469–476. [Google Scholar] [CrossRef]
  5. ASHRAE Standard 62:2000; Ventilation for Acceptable Indoor Air Quality. American Society of Heating, Refrigeration and Air-Conditioning: Atlanta, GA, USA, 2000.
  6. DBH. Compliance Document for New Zealand Building Code—Clause G5 Interior Environment; Department of Building and Housing: Wellington, New Zealand, 2001.
  7. NZS 4303:1990; Ventilation for Acceptable Indoor Air Quality. Standards New Zealand: Wellington, New Zealand, 1990.
  8. French, L.J.; Camilleri, M.J.; Isaacs, N.P.; Pollard, A.R. Temperatures and heating energy in New Zealand houses from a nationally representative study-HEEP. Energy Build. 2007, 39, 770–782. [Google Scholar] [CrossRef]
  9. Su, B. Field study of Auckland housing winter indoor health conditions associated with insulation, heating and energy. In Proceedings of the 51st International Conference of the Architectural Science Association (ANZAScA), Wellington, New Zealand, 29 November–2 December 2017; Schnabel, M.A., Ed.; Victoria University of Wellington: Wellington, New Zealand, 2017. [Google Scholar]
  10. DBH. Compliance Document for New Zealand Building Code, Clause H1, Energy Efficiency, 3rd ed.; Department of Building and Housing: Wellington, New Zealand, 2007.
  11. NZS 4218:2009; Thermal Insulation—Housing and Small Buildings. Standards New Zealand: Wellington, New Zealand, 2009.
  12. Crowther, D.; Horwood, J.; Baker, N.; Thomson, D.; Pretlove, S.; Ridley, I.; Oreszczyn, T. House Dust Mites and the Built Environment: A Literature Review; University College London: London, UK, 2000. [Google Scholar]
  13. Milián, E.; Díaz, A.M. Allergy to house dust mites and asthma. P. R. Health Sci. J. 2004, 23, 47–57. [Google Scholar]
  14. Hart, B.J. Life cycle and reproduction of house-dust mites: Environmental factors influencing mite populations. Allergy 1998, 53, 13–17. [Google Scholar] [CrossRef] [PubMed]
  15. Arlian, L.G.; Bernstein, I.L.; Gallagher, J.S. The prevalence of house dust mites, Dermatophagoides spp., and associated environmental conditions in homes in Ohio. J. Allergy Clin. Immunol. 1982, 69, 527–532. [Google Scholar] [CrossRef] [PubMed]
  16. Korsgaard, J. Preventive measures in house-dust allergy. Am. Rev. Respir. Dis. 1982, 125, 80–84. [Google Scholar]
  17. Murray, A.B.; Zuk, P. The seasonal variation in a population of house dust mites in a North American city. J. Allergy Clin. Immunol. 1979, 64, 266–269. [Google Scholar] [CrossRef]
  18. Arlian, L.G.; Yella, L.; Morgan, M.S. House dust mite population growth and allergen production in cultures maintained at different temperatures. J. Allergy Clin. Immunol. 2010, 125, AB17. [Google Scholar] [CrossRef]
  19. Arlian, L.G.; Neal, J.S.; Vyszenski-Moher, D.L. Reducing relative humidity to control the house dust mite Dermatophagoides farina. J. Allergy Clin. Immunol. 1999, 104, 852–856. [Google Scholar] [CrossRef]
  20. Arlian, L.G.; Rapp, C.M.; Ahmed, S.G. Development of Dermatophagoides pteronyssinus (Acari: Pyroglyphidae). J. Med. Entomol. 1990, 27, 1035–1040. [Google Scholar] [CrossRef] [PubMed]
  21. Vackova, T.; Pekar, S.; Klimov, P.B.; Hubert, J. Population growth and respiration in the dust mite Dermatophagoides farinae under different temperature and humidity regimes. Appl. Acarol. 2023, 89, 157–169. [Google Scholar] [CrossRef] [PubMed]
  22. Sun, Y.X.; Cui, L.W.; Hou, J.; Luo, S.G.; Dan, N.; Sundell, J. Role of ventilation and cleaning for controlling house dust mite allergen infestation: A study on associations of house dust mite allergen concentrations with home environment and lifestyles in Tianjin area, China. Indoor Air 2022, 32, e13084. [Google Scholar] [CrossRef] [PubMed]
  23. Hwang, S.H.; Lee, S.W.; Won, J.U.; Park, W.M. Indoor exposure assessment for levels of dust mite and total volatile organic compounds (TVOCs) in living houses. Int. J. Environ. Health Res. 2023, 33, 723–731. [Google Scholar] [CrossRef] [PubMed]
  24. Zare, M.; Hassani-Azad, M.; Soleimani-Ahmadi, M.; Majnoon, R. The Influence of Indoor Environmental Factors on the Prevalence of House Dust Mites as Aeroallergens in Bandar Abbas Student Dormitories, South of Iran. J. Med. Entomol. 2021, 58, 1865–1873. [Google Scholar] [CrossRef]
  25. Xu, F.; Tian, J.Y.; Yang, F.X. House dust mite allergens and nitrated products: Identification and risk assessment in indoor dust. J. Environ. Sci. 2023, 124, 198–204. [Google Scholar] [CrossRef]
  26. Oldfield, K.; Siebers, R.; Crane, J. Endotoxin and indoor allergen levels in kindergartens and day-care centres in Wellington. N. Z. Med. J. 2007, 120, U2400. [Google Scholar]
  27. Salo, P.M.; Sever, M.L.; Zeldin, D.C. Indoor allergens in school and day care environments. J. Allergy Clin. Immunol. 2009, 124, 185–192. [Google Scholar] [CrossRef]
  28. Siebers, R.; Jones, B.; Bailey, L.; Aldridge, D.; Draper, J.; Ingham, T. Indoor allergen exposure in primary school classrooms in New Zealand. N. Z. Med. J. 2019, 132, 42–47. [Google Scholar]
  29. Wickens, K.; Martin, I.; Pearce, N.; Fitzharris, P.; Kent, R.; Holbrook, N.; Siebers, R.; Smith, S.; Trethowen, H.; Lewis, S.; et al. House dust mite allergen levels in public places in New Zealand. J. Allergy Clin. Immunol. 1997, 99, 587–593. [Google Scholar] [CrossRef]
  30. Xue, Q.Q.; Zou, M.H.; Guo, J.J.; Teng, Q.; Zhang, Q.Q.; Sheng, L.W.; Xu, S.J.; Fang, C.; Yao, N.; Li, Y.Y.; et al. Detection and assessment of dust mite allergens in an indoor environment in Anhui, China. Environ. Sci. Pollut. Res. 2023, 30, 3045–3055. [Google Scholar] [CrossRef]
  31. BRANZ. Indoor Air Quality in New Zealand Homes and Schools: A literature Review of Healthy Homes and Schools with Emphasis on the Issues Pertinent to New Zealand; Taptiklis, P., Phipps, R., Eds.; Building Research Association of New Zealand: Porirua, New Zealand, 2017. [Google Scholar]
  32. Loh, J.Y.S.; Andamon, M.M. A review of IAQ standards and guidelines for Australian and New Zealand school classrooms. In Back to the Future: The Next 50 Years (51st International Conference of the Architectural Science Association [ANZAScA]); Schnabel, M.A., Ed.; Victoria University of Wellington: Wellington, New Zealand, 2017; pp. 695–702. [Google Scholar]
  33. Su, B.; Wu, L. Occupants’ health and their living conditions of remote Indigenous communities in New Zealand. Int. J. Environ. Res. Public Health 2020, 17, 8340. [Google Scholar] [CrossRef]
  34. Su, B.; Wu, L. Chapter Two: House occupants’ health conditions and their living conditions. In Toitū Te Kāinga, Toitū Te Ora, Toitū Te Tangata: Healthy Homes, Healthy People. Report for Building Better Homes, Towns and Cities Kāinga Tahi, Kāinga Rua; Emery, T., McLean, I., Eds.; Kāinga Tahi, Kāinga Rua Publications: Porirua, New Zealand, 2019; pp. 28–46. [Google Scholar]
  35. Coppock, J.B.M.; Cookson, E.D. The effect of humidity on mould growth on constructional materials. J. Sci. Food Agric. 1951, 2, 534–537. [Google Scholar] [CrossRef]
  36. Block, S.S. Humidity requirements for mould growth. Appl. Microbiol. 1953, 1, 287–293. [Google Scholar] [CrossRef] [PubMed]
  37. Pasanen, A.L.; Juutinen, T.; Jantunen, M.J.; Kalliokoski, P. Occurrence and moisture requirements of microbial growth in building materials. Int. Biodeterior. Biodegrad. 1992, 30, 273–283. [Google Scholar] [CrossRef]
  38. Hens, H.L.S.C. Minimizing fungal defacement. ASHRAE J. 2000, 40, 30–44. [Google Scholar]
  39. Su, B. Prevention of winter mould growth in housing. Archit. Sci. Rev. 2006, 49, 385–390. [Google Scholar] [CrossRef]
  40. ASHRAE. Thermal insulation and vapour retarders applications. In ASHRAE Handbook—Fundamentals; American Society of Heating, Refrigeration and Air-Conditioning: Atlanta, GA, USA, 1993; pp. 20-1–20-16. [Google Scholar]
  41. Qiao, J.; Zhang, X.Y.; Xiao, F.; Li, Y.X.; Gao, W.J. Experimental investigation of mold growth risk among typical residential indoor materials: Case study in coastal city, China. Energy Build. 2024, 304, 113885. [Google Scholar] [CrossRef]
  42. Kuka, E.; Cirule, D.; Andersone, I.; Andersons, B.; Fridrihsone, V. Conditions influencing mould growth for effective prevention of wood deterioration indoors. Appl. Sci. 2022, 12, 975. [Google Scholar] [CrossRef]
  43. Paralkar, V.; Damle, R. Moisture buffering and mould growth characteristics of naturally ventilated lime plastered houses. UCL Open Environ. 2024, 6, e1988. [Google Scholar] [CrossRef]
  44. Tunahan, G.I.; Hetherington, E.; Barrett, E.; Altamirano, H. Exploring the impact of light wavelength on indoor mould growth. Front. Built Environ. 2025, 11, 1602552. [Google Scholar] [CrossRef]
  45. Alaidroos, A.; Mosly, I.  Preventing mold growth and maintaining acceptable indoor air quality for educational buildings operating with high mechanical ventilation rates in hot and humid climates. Air Qual. Atmos. Health 2023, 16, 341–361. [Google Scholar] [CrossRef]
  46. WHO. Health Impact of Low Indoor Temperatures; World Health Organization, Regional Office for Europe: Copenhagen, Denmark, 1987. [Google Scholar]
  47. New Zealand Meteorological Service. Average Degree-Day Tables Selected New Zealand Stations; Miscellaneous publication 159; Ministry of Transport, Government Printer: Wellington, New Zealand, 1978. [Google Scholar]
  48. Collins, K.J. Low indoor temperatures and morbidity in the elderly. Age Ageing 1986, 15, 211–220. [Google Scholar] [CrossRef]
  49. WHO. Environmental Burden of Disease Associated with Inadequate Housing: A Method Guide to the Quantification of Health Effects of Selected Housing Risks in the WHO European Region; Braubach, M., Jacobs, D.E., Ormandy, D., Eds.; World Health Organization, WHO Regional Office for Europe: Copenhagen, Denmark, 2003. [Google Scholar]
  50. Boulic, M.; Fjällström, P.; Phipps, R.; Cunningham, M.; Cleland, D.; Pierse, N.; Howden Chapman, P.; Chapman, R.; Viggers, H.; Pollard, A. Cold homes in New Zealand—Does increasing the heater capacity improve indoor temperatures? Clean Air Environ. Qual. 2008, 42, 22–29. [Google Scholar]
  51. Lloyd, C.R.; Callau, M.F.; Bishop, T.; Smith, I.J. The efficacy of an energy efficient upgrade program in New Zealand. Energy Build. 2008, 40, 1228–1239. [Google Scholar] [CrossRef]
  52. NZS 4218:1996; Energy Efficiency: Housing and Small Building Envelope. Standards New Zealand: Wellington, New Zealand, 1996.
  53. Asher, M.I.; Montefort, S.; Björkstén, B.; Lai, C.K.W.; Strachan, D.P.; Weiland, S.K.; Williams, H.; ISAAC Phase Three Study Group. Worldwide time trends in the prevalence of symptoms of asthma, allergic rhinoconjunctivitis, and eczema in childhood: ISAAC Phases One and Three repeat multicountry cross-sectional surveys. Lancet 2006, 368, 733–743. [Google Scholar] [CrossRef] [PubMed]
  54. Ministry of Health. New Zealand Health Survey 2017/18; Ministry of Health: Wellington, New Zealand, 2018.
  55. Barnard, L.T.; Zhang, J. The Impact of Respiratory Disease in New Zealand: 2018 Update; University of Otago: Dunedin, New Zealand, 2018. [Google Scholar]
  56. Sears, M.R.; Herbison, G.P.; Holdaway, M.D.; Hewitt, C.J.; Flannery, E.M.; Silva, P.A. The relative risks of sensitivity to grass pollen, house dust mite and cat dander in the development of childhood asthma. Clin. Exp. Allergy 1989, 19, 419–424. [Google Scholar] [CrossRef] [PubMed]
  57. Erwin, E.A.; Wickens, K.; Custis, N.J.; Siebers, R.; Woodfolk, J.; Barry, D.; Crane, J.; Platts-Mills, T.A.E. Cat and dust mite sensitivity and tolerance in relation to wheezing among children raised with high exposure to both allergens. J. Allergy Clin. Immunol. 2005, 115, 74–79. [Google Scholar] [CrossRef]
  58. Varga, M.K.; Moshammer, H.; Atanyazova, O. Childhood asthma and mould in homes—A meta-analysis. Wien. Klin. Wochenschr. 2025, 137, 79–88. [Google Scholar] [CrossRef]
  59. Tischer, C.G.; Hohmann, C.; Thiering, E.; Herbarth, O.; Müller, A.; Henderson, J.; Granell, R.; Fantini, M.P.; Luciano, L.; Bergström, A.; et al. Meta-analysis of mould and dampness exposure on asthma and allergy in eight European birth cohorts: An ENRIECO initiative. Allergy 2011, 66, 1570–1579. [Google Scholar] [CrossRef]
  60. Nielsen, K.G.; Bisgaard, H. Hyperventilation with cold versus dry air in 2- to 5-year-old children with asthma. Am. J. Respir. Crit. Care Med. 2005, 171, 238–241. [Google Scholar] [CrossRef]
  61. Lloyd, E.L. Hypothesis: Temperature recommendations for elderly people: Are we wrong? Age Ageing 1990, 19, 264–267. [Google Scholar] [CrossRef]
  62. Hunt, S. Housing-related disorders. In The Health of Adult Britain; Charlton, J., Murphy, M., Eds.; The Stationery Office: London, UK, 1997; pp. 156–170. [Google Scholar]
  63. Goodwin, J. Cold stress, circulatory illness and the elderly. In Cutting the Cost of Cold: Affordable Warmth for Healthier Homes; Nicol, F., Rudge, J., Eds.; E&FN Spon Ltd.: London, UK, 2000; pp. 48–61. [Google Scholar]
  64. NZS 4218:1977; Minimum Insulation Requirements for Residential Buildings. Standards New Zealand: Wellington, New Zealand, 1977.
  65. BIA. New Zealand Building Code, Approved Document H1, Energy Efficiency; Building Industry Authority: Wellington, New Zealand, 1992.
  66. DBH. Compliance Document for New Zealand Building Code, Clause H1, Energy Efficiency, 2nd ed.; Department of Building and Housing: Wellington, New Zealand, 2000.
  67. NZS 4218:2004; Energy Efficiency: Small Building Envelope. Standards New Zealand: Wellington, New Zealand, 2004.
  68. WHO. WHO Second Technical Meeting on Quantifying Disease from Inadequate Housing; World Health Organization, Regional Office for Europe: Bonn, Germany, 2006. [Google Scholar]
  69. Bailie, R.S.; Wayte, K.J. Housing and health in Indigenous communities: Key issues for housing and health improvements in remote Aboriginal and Torres Strait Islander Communities. Aust. J. Rural Health 2006, 14, 178–183. [Google Scholar] [CrossRef]
Figure 1. Climate data in Auckland for the 1991–2020 period (Source: National Institute of Water and Atmospheric Research).
Buildings 15 03074 g001
Figure 2. Climate data in Rotorua for the 1991–2020 period (Source: National Institute of Water and Atmospheric Research).
Buildings 15 03074 g002
Figure 3. Winter indoor mean temperatures and indoor mean temperatures close to the ceilings and the floors of indoor spaces with different dust mite allergens in the new and old sample houses.
Buildings 15 03074 g003
Figure 4. Winter indoor mean RH and indoor mean RH close to the ceilings and the floors of indoor spaces with different dust mite allergens in the new and old sample houses.
Buildings 15 03074 g004
Figure 5. Winter indoor mean RH close to the floors in the indoor spaces with different dust mite allergen levels in the new and old sample houses.
Buildings 15 03074 g005
Figure 6. Percentages of time in winter when RH close to the floors was higher than or equal to 75% in the indoor spaces with different dust mite allergen levels in the new and old sample houses.
Buildings 15 03074 g006
Figure 7. Average time (h) per day in winter when RH close to the floors was below 75% in the indoor spaces with different dust mite allergen levels in the new and old sample houses.
Buildings 15 03074 g007
Figure 8. Percentages of time in winter when RH close to the floors was higher than or equal to 80% in the indoor spaces with different dust mite allergen levels in the new and old sample houses.
Buildings 15 03074 g008
Figure 9. Time in winter (days) when RH close to the floors was higher than or equal to 80% in the indoor spaces with different dust mite allergen levels in the new and old sample houses.
Buildings 15 03074 g009
Figure 10. Time in winter (days) when RH close to the ceilings was higher than or equal to 80% in the indoor spaces with different dust mite allergen levels in the new and old sample houses.
Buildings 15 03074 g010
Figure 11. Mean indoor temperatures close to the floors of indoor spaces with different dust mite allergen levels in the indoor spaces with different dust mite allergen levels in the new and old sample houses.
Buildings 15 03074 g011
Table 1. Required RH and time for mould spores to germinate [38].
SurfacesIndoor RHTime Required (d)
The majority of building internal surface materials=100%1
≥89%7
≥80%30
Table 2. RH of the 9 indoor spaces with undetectable dust mite allergens in the five new sample houses in Auckland city.
House NumbersNo. 1No. 1No. 2No. 2No. 2No. 3No. 3No. 4No. 5
Indoor SpacesN LivingN Bed.N Bed.N 2nd Bed.S Bed.N LivingS Bed.N Bed.N Bed.Outdoor
Mean RH (%)69646969676665686584
% Time when RH ≥ 40%100%100%100%100%100%100%100%100%100%100%
% Time when RH ≥ 50%100%100%99%98%99%96%99%100%100%100%
% Time when RH ≥ 60%98%83%90%86%85%79%77%88%87%98%
% Time when RH ≥ 70%39%8%50%54%35%35%25%34%17%89%
% Time when RH ≥ 75%6%0%25%24%11%11%7%13%3%81%
% Time when RH ≥ 80%0%0%6%4%2%1%1%4%0%69%
Table 3. RH of the 6 indoor spaces with low dust mite allergens in the four new sample houses in Auckland city.
House NumbersNo. 1No. 3No. 4No. 4No. 5No. 5
Indoor SpacesS Bed.N Bed.N LivingS Bed.N LivingS Bed.Outdoor
Mean RH (%)72717071727584
% Time when RH ≥ 40%100%100%100%100%100%100%100%
% Time when RH ≥ 50%100%100%98%100%100%100%100%
% Time when RH ≥ 60%100%94%84%91%100%100%98%
% Time when RH ≥ 70%77%57%53%60%66%89%89%
% Time when RH ≥ 75%27%23%31%33%24%48%81%
% Time when RH ≥ 80%0%6%9%8%3%14%69%
Table 4. RH of the 10 indoor spaces with medium dust mite allergens in the six old sample houses in the remote sites.
House NumbersNo. 1No. 2No. 2No. 3No. 4No. 4No. 5No. 5No. 6No. 6
Indoor SpacesN LivingN LivingS Bed.N Bed.S LivingN Bed.N LivingS Bed.N LivingS Bed.Outdoor
Mean RH (%)8376758188767477859285
% Time when RH ≥ 40%100%100%98%100%100%100%99%100%100%100%100%
% Time when RH ≥ 50%100%98%96%100%99%99%96%99%100%100%100%
% Time when RH ≥ 60%99%94%93%98%99%95%90%97%100%100%98%
% Time when RH ≥ 70%98%78%77%92%99%71%73%77%100%100%90%
% Time when RH ≥ 75%95%62%59%84%97%55%57%57%99%100%82%
% Time when RH ≥ 80%81%37%33%67%90%42%32%41%85%99%70%
% Time when RH ≥ 85%40%14%6%36%69%24%7%18%55%98%55%
% Time when RH ≥ 90%2%0%0%3%37%3%0%1%13%83%35%
Table 5. RH of the 7 indoor spaces with high dust mite allergens in the five old sample houses in the remote sites.
House No.No. 7No. 7No. 8No. 9No. 9No. 10No. 11
Indoor SpacesN LivingS Bed.S BedN LivingS Bed.S Bed.S Bed.Outdoor
Mean RH (%)7785808077767585
% Time when RH ≥ 40%98%100%99%99%99%100%100%100%
% Time when RH ≥ 50%95%100%99%99%99%98%98%100%
% Time when RH ≥ 60%90%99%99%97%98%95%94%98%
% Time when RH ≥ 70%78%98%95%90%89%86%76%90%
% Time when RH ≥ 75%64%92%79%80%67%68%55%82%
% Time when RH ≥ 80%45%79%46%57%33%34%30%70%
% Time when RH ≥ 85%28%54%16%21%6%2%8%55%
% Time when RH ≥ 90%9%15%1%2%1%0%0%35%
Table 6. Temperatures of the 9 indoor spaces with undetectable dust mite allergens in the five new sample houses in Auckland city.
House NumbersNo. 1No. 1No. 2No. 2No. 2No. 3No. 3No. 4No. 5
Indoor SpacesN LivingN Bed.N Bed.N 2nd Bed.S Bed.N LivingS Bed.N Bed.N Bed.Outdoor
Mean temperature (°C)17191919192020181812
% Time when T ≥ 16 °C65%98%97%98%99%100%100%88%92%4%
% Time when T ≥ 17 °C39%90%91%93%93%96%98%67%81%1%
% Time when T ≥ 18 °C18%76%70%72%74%87%92%41%60%0%
% Time when T ≥ 20 °C0%40%6%20%27%48%56%14%15%0%
% Time when T ≥ 22 °C0%2%0%1%2%8%21%3%2%0%
Table 7. Temperatures of the 6 indoor spaces with low dust mite allergens in the nine new sample houses in Auckland city.
House NumbersNo. 1No. 3No. 4No. 4No. 5No. 5
Indoor SpacesS Bed.N Bed.N LivingS Bed.N LivingS Bed.Outdoor
Mean temperature (° C)15191617151512
% Time when T ≥ 16 °C17%100%52%64%26%11%4%
% Time when T ≥ 17 °C1%98%38%40%9%2%1%
% Time when T ≥ 18 °C0%90%27%22%2%0%0%
% Time when T ≥ 20 °C0%25%8%3%0%0%0%
% Time when T ≥ 22 °C0%0%0%0%0%0%0%
Table 8. Temperatures of the 10 indoor spaces with medium dust mite allergens in the six old sample houses in the remote sites.
House NumbersNo. 1No. 2No. 2No. 3No. 4No. 4No. 5No. 5No. 6No. 6
Indoor SpacesN LivingN LivingS Bed.N Bed.S LivingN Bed.N LivingS Bed.N LivingS Bed.Outdoor
Mean temperature (° C)9101189111111979
% Time when T ≥ 16 °C1%4%7%1%0%8%7%1%0%0%1%
% Time when T ≥ 18 °C0%2%4%0%0%3%4%0%0%0%0%
% Time when T ≥ 20 °C0%1%3%0%0%1%2%0%0%0%0%
% Time when T ≥ 22 °C0%0%3%0%0%0%1%0%0%0%0%
Table 9. Temperatures of the 7 indoor spaces with high dust mite allergens in the five old sample houses in the remote sites.
House No.No. 7No. 7No. 8No. 9No. 9No. 10No. 11
Indoor SpacesN LivingS Bed.S BedN LivingS Bed.S Bed.S Bed.Outdoor
Mean temperature (° C)10912131113139
% Time when T ≥ 16 °C5%0%5%14%3%17%15%1%
% Time when T ≥ 18 °C2%0%0%6%1%8%5%0%
% Time when T ≥ 20 °C1%0%0%3%0%4%1%0%
% Time when T ≥ 22 °C1%0%0%1%0%1%0%0%
Table 10. The 17 indoor spaces with unacceptable dust mite allergen levels and identified mould growths in the 11 old sample houses.
Indoor SpacesDust Mite AllergensMould or Spores FoundCladosporiumUnidentified FungusMiscellaneous or Other Spores
1MediumYesModerateLow-
2MediumYes-Moderate-
3MediumYesLowLow to moderate-
4MediumYesLowLow to moderate-
5MediumYes-Moderate to abundantLow
6MediumYes-Moderate to abundantLow
7MediumYesModerateModerate to abundant-
8MediumYesModerateModerate to abundant-
9MediumYes-Moderate to abundantLow
10MediumYesLow to moderateLow-
11HighYesAbundant--
12HighYesAbundant--
13HighYes-LowLow
14HighYesAbundant--
15HighYes-Low to moderateLow
16HighYes-Low to moderate-
17HighYesModerate--
Disclaimer/Publisher’s Note: The statements, opinions and data contained in all publications are solely those of the individual author(s) and contributor(s) and not of MDPI and/or the editor(s). MDPI and/or the editor(s) disclaim responsibility for any injury to people or property resulting from any ideas, methods, instructions or products referred to in the content.