Abstract
With the increasing global demand for sustainable building materials, coal gangue, as a potential supplementary cementitious material (SCM), has attracted widespread attention. Coal gangue is primarily composed of clay minerals, among which the kaolinite content can significantly enhance its cementitious properties after activation. However, there are various grades of coal gangues, which restrain their application, especially for the low kaolinite content coal gangue. This paper investigates the feasibility of using iron-rich coal gangue with low kaolinite content as a cement substitute through high-temperature activation treatment. In the current study, activated coal gangue replaced cement clinker at proportions of 10%, 15%, and 20%, which was further mixed with limestone powder to form a new cementitious material system. The mechanical attributes of the systems were assessed using compressive strength and microhardness tests. The influence of hydration products and microstructural changes on system performance was further explored through electrochemical impedance spectroscopy (EIS) and quantitative X-ray diffraction (XRD) analysis. The findings suggest that a well-balanced addition of coal gangue can effectively substitute for cement clinker, thereby enhancing both the mechanical properties and microstructure of the systems. These results demonstrate that through appropriate activation treatments, coal gangue can be utilized as an effective SCM. While traditional SCMs like fly ash (FA) and ground granulated blast-furnace slag (GGBFS) have near-zero allocated carbon footprints, their global supply is diminishing and increasingly unreliable. In contrast, our approach valorizes a vast industrial waste stream, aligning with circular economy principles and offering a scalable, sustainable, and low-carbon alternative for the construction industry.
1. Introduction
For a long time, coal has served as the main source of energy in China [1]. In 2015, China produced 3.8 billion tons of coal, which constituted approximately 47% of the total coal output worldwide [2]. During the mining, processing, and washing of coal, approximately 100–150 kg of coal gangue are produced per ton of coal. The coal gangue is usually disposed of locally, causing environmental issues, including geological disasters, spontaneous combustion, soil, and air pollution [3,4]. Therefore, recycling and utilizing coal gangue across various industries becomes crucial in reducing waste management problems. Currently, applications in power generation and brick manufacturing have achieved effective utilization of coal gangue, handling about 60% of China’s waste annually. Yet, it is believed that each year, between 200 and 400 million tons of coal gangue remain untreated and are simply discarded [1]. In the cement sector, using supplementary cementitious materials (SCMs) to replace part of the cement is an effective strategy to reduce environmental impacts [5,6]. Worldwide, granulated blast furnace slag, fly ash, and limestone powder rank as the most prevalent SCMs [7]. Nevertheless, the combined availability of granulated blast furnace slag and fly ash comprises only about 15% of the total global cement production [8,9], which restricts their extensive application. Moreover, with the global energy transition and the development of clean energy technologies, the production of granulated blast furnace slag and fly ash is expected to significantly decrease [10]. This uncertainty in supply underscores the need to explore and develop new types of SCMs to meet the construction industry’s demand for low-carbon, environmentally friendly materials [11,12,13].
Limestone calcined clay cement (LC3) represents a promising alternative to conventional cement, primarily due to its potential to significantly reduce the carbon footprint of the cement industry. This low-carbon cement is produced by blending limestone with calcined clay, a clay that has been thermally treated at high temperatures. The key to its performance lies in the synergistic reaction between the alumina from the calcined clay and the carbonate from the limestone, which forms carboaluminate phases that impart strength and durability to the cement. However, the efficacy of LC3 systems typically relies on the high reactivity of the calcined clay component, which is often conventional metakaolin. Consequently, materials with lower reactivity are not readily suitable for application in LC3 technology.
In this context, coal gangue has attracted widespread attention from researchers as a potential SCM resource. The conversion of coal gangue into an efficient SCM mitigates its environmental impact while offering a sustainable alternative to conventional cement components. As a result, there is a growing interest in conducting comprehensive studies on the chemical and physical characteristics of coal gangue, including methods to improve its effectiveness as an SCM through advanced scientific activation processes [14,15]. This research direction not only supports the sustainable evolution of the construction materials sector but also contributes to the advancement of circular economic practices, enabling the potential reuse of waste materials [16,17].
Coal gangue primarily consists of clay minerals [18]. Among these, the kaolinite component imparts certain potential cementitious properties to coal gangue [19,20], especially after activation treatment. Typically, the activation process encompasses methods such as mechanical activation, thermal activation, chemical activation, microwave activation, and composite activation [21,22,23,24]. Typically, thermal treatment facilitates the dehydroxylation process, converting the inert kaolin into amorphous, highly active metakaolin. On the other hand, mechanical activation achieves this by significantly increasing the specific surface area and reducing particle size, thereby maximizing the exposure of active surfaces. This accelerates the hydration reaction kinetics and enhances the physical effects as a micro-filler. During the hydration of cement, these reactive agents engage in the pozzolanic reaction, where they consume calcium hydroxide and lead to the formation of calcium silicate hydrate (C-S-H) gel [25,26]. Additionally, the activation process increases the specific surface area of coal gangue, providing more nucleation sites for cement hydration [27], which also promotes the formation of C-S-H, thereby improving the microstructure and performance of cement-based materials. However, the composition of coal gangue varies by region and type, with some coal gangues having a high content of silicates and aluminates [28]. Previous research has explored activation methods and their impact on the cement hydration process, finding that coal gangue with a higher alumina content has higher reactivity and can partially replace cement without affecting performance [29,30].
Furthermore, limestone powder shows a significant synergistic effect in cement-based materials rich in alumina phases, reacting with aluminates to form monocarboaluminate (Mc) and hemicarboaluminate (Hc), thus optimizing the material’s performance [31,32]. Studies show that the compressive strength of blended cementitious materials is directly proportional to the kaolinite content in the coal gangue used, indicating that materials with higher kaolinite content can achieve higher substitution rates [33,34,35]. However, at this stage, some coal gangue still contains high levels of iron oxides, whose activity is difficult to stimulate, posing significant challenges to related research. There is also limited research on blended cement-based materials made from iron-rich coal gangue with low kaolinite content (less than 10–15%) and limestone [36], thus restricting further research and use of various grades of coal gangue.
In this study, iron-rich coal gangue with low kaolinite content was subjected to high-temperature activation treatment. Subsequently, the activated coal gangue was used to replace part of the cement clinker, mixed with limestone powder to form a new blended system. The effects of activated coal gangue on mechanical properties were investigated using methods such as the compressive strength test and microhardness test. Additionally, the impact of hydration products and microstructure on the properties was thoroughly examined using electrochemical impedance spectroscopy (EIS) and X-ray diffraction (XRD) quantitative analysis.
2. Materials and Methods
2.1. Material Characterization
The cement used in this study is P·I 42.5 Portland cement (OPC) produced by Fushun Cement Co., Ltd. in Fushun, China. Coal gangue (CG) was sourced from Shandong HP Gangue Power Co., Ltd. in Tai’an, China. Limestone powder (LS) and standard sand were purchased from retail markets in China. Furthermore, the water-reducer used was a polycarboxylate-based superplasticizer, while the gypsum was sourced from Sinopharm Chemical Reagent Co., Ltd. (Shanghai, Chinai). For the preparation of the cement pastes and mortars, deionized water and laboratory tap water were utilized, respectively. The particle size distributions for OPC, CG, and LS were analyzed using a laser particle size analyzer, the results of which are depicted in Figure 1. The chemical compositions of the materials employed in this research are detailed in Table 1.
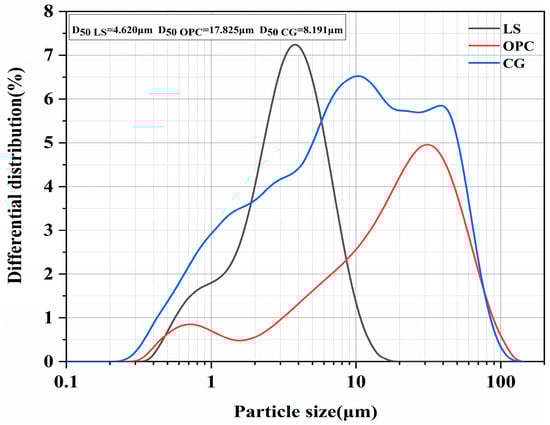
Figure 1.
Particle size distribution of OPC, CG, and LS.

Table 1.
Chemical composition of raw materials (wt.%).
2.2. Mix Design and Specimen Preparation
2.2.1. Mix Design
In this study, the specific mix proportion of the paste is shown in Table 2. The mortar system is based on the paste with an additional 300 g of standard sand added.
Table 2.
Mixed proportions of paste.
2.2.2. Specimen Preparation
In this study, mortar and paste were prepared for all systems, as listed in Table 2, for strength or microstructure tests.
The method for preparing mortar involves the following steps: Initially, cement, SCMs, and standard sand are mixed for three minutes. Subsequently, tap water is added, and the mixture is blended for an additional two minutes to achieve a uniform consistency. The resulting mixture was then cast into molds with dimensions of 40 mm × 40 mm × 160 mm. The vibrator was used for 30–60 s to eliminate air bubbles in the samples, followed by the covering of plastic film on the surface of the mold. After 24 h of curing, the specimens were demolded and transferred to a controlled environment maintained at 20 ± 1 °C and >95% relative humidity (RH) for further curing. Upon reaching the designated curing ages, the samples were extracted for the compressive strength test and EIS analysis.
For paste preparation, raw material powders were precisely weighed and homogenously dry-mixed. Subsequently, deionized water was incorporated, and the mixture was stirred at 1600 rpm for three minutes using a high-speed mixer to achieve thorough homogenization. The homogenized paste was then poured into cylindrical plastic molds measuring 30 mm in diameter and 50 mm in height. It was manually vibrated for 30 s to remove any trapped air. The molds were subsequently sealed with plastic film to prevent environmental interaction. Upon reaching the designated curing age, specimens were demolded and subjected to experimental testing.
2.2.3. Paste Sample Preparation for the Microscopic Test
Following fragmentation into 1–2 mm particles, the samples were immersed in isopropanol for 5 d. During this period, the isopropanol was replaced at intervals of 1 h, 24 h, and 72 h to ensure continuous solvent exchange. Subsequently, the samples were removed from the solution, and surface isopropanol residues were blotted with filter paper. The specimens were then transferred to a vacuum oven at 40 °C for solvent evaporation. After a minimum drying duration of 48 h under these conditions, the samples were prepared for subsequent experimental analyses.
2.3. Experimental Method
2.3.1. Thermogravimetric Analysis (TGA)
TGA was performed using a TA Instruments TGA55 from the Newcastle, Delaware, USA on paste samples that had undergone solvent exchange and vacuum drying. Before analysis, the specimens were standardized by grinding to ensure a consistent particle size. The TGA measurements took place in a nitrogen environment, maintaining a flow rate of 30 mL/min, and the temperature was raised at a rate of 10 °C/min from room temperature up to 1000 °C. The percentage of weight loss was then calculated based on the initial dry mass at room temperature.
2.3.2. XRD
The transformation of coal gangue upon calcination and the hydration products in pastes at various stages were evaluated using the internal standard technique. Specimens for XRD examination were prepared by replacing the solvent with isopropanol and then drying under vacuum at 40 °C. Corundum (α-Al2O3) was utilized as an internal standard in a 9:1 mass ratio (sample to corundum) for quantitative phase determination. The samples, after drying, were initially ground dry, mixed thoroughly with corundum powder, and then ground wet in isopropanol for optimal homogenization. X-ray diffraction analysis was executed on a high-resolution diffractometer (Rigaku SmartLab SE, Tokyo, Japan) at a scanning speed of 4°per minute across a 2θ range of 5° to 70°. The Rietveld refinement of XRD data using HighScore Plus 3.0 software enables the determination of the proportion of the standard material within all crystalline phases. Subsequently, by comparing the “added amount” to the “refinement calculated amount,” the total content of the amorphous phase is established. The difference between these values represents the content of the amorphous phase, thus determining the relative contents of the original materials and hydration products.
2.3.3. Scanning Electron Microscope (SEM)
Coal gangue and calcined coal gangue morphology were characterized by SEM (ZEISS GeminiSEM 300, Carl Zeiss AG, Oberkochen, Germany) operated in secondary electron (SE) imaging mode to examine microstructural evolution. Prior to analysis, all specimens were sputter-coated with a 10-nanometer gold layer to enhance surface conductivity and minimize charging effects.
2.3.4. Assessment of Pozzolanic Activity
The pozzolanic activity of coal gangue under various calcination conditions was evaluated using three complementary methods: (1) the Chapelle test to quantify calcium hydroxide consumption; (2) electrical conductivity measurements to assess reaction kinetics; (3) the strength activity index (SAI) to determine compressive strength development in blended cementitious systems.
For the Chapelle test, approximately 1.000 g of coal gangue powder and 2.000 g of CaO powder were precisely weighed using an analytical balance (±0.001 g) and transferred to a 500 mL conical flask. A magnetic stir bar and 250 mL of deionized water were added, and the mixture was equipped with a reflux condenser. The suspension was maintained at 85 ± 1 °C with continuous stirring for 16 h. After cooling to ambient temperature (25 ± 2 °C), 60 g of sucrose dissolved in 250 mL of deionized water was introduced into the flask and stirred for 15 min. The resulting solution was vacuum-filtered through quantitative filter paper. The filtrate was titrated against a standardized 0.1 mol/L HCl solution using phenolphthalein indicator (1% ethanol solution). The titration endpoint was identified by the disappearance of the pink coloration. The HCl consumption volume was recorded after triplicate measurements, with the mean value used for subsequent calculations. The Ca(OH)2 consumption was determined according to Equation (1):
Ca(OH)2 + HCl→CaCl2 + H2O
A blank test was performed following identical procedures using uncalcined coal gangue powder as reference material.
The filtrate, which was not subjected to titration, was analyzed for ionic concentration using a conductivity meter (DDS-11A) under different calcination regimes, which were used for the electrical conductivity measurements.
For the SAI test, cement paste specimens were prepared with a constant water-to-cement ratio of 0.5, incorporating 20% cement replacement by either calcined or uncalcined coal gangue. All specimens underwent standard moist curing (20 ± 1 °C, RH > 95%) for 28 d prior to test. Compressive strength was determined following EN 196-1 [37] specifications, with results expressed as the SAI according to the Equation of SAI = A/B, where A is the compressive strength (MPa) of the cement paste containing calcined or uncalcined coal gangue, and B is the compressive strength (MPa) of the control mortar.
2.3.5. Compressive Strength
The compressive strength test was conducted in accordance with the European Standard EN 196-1 [37]. When the specimens reached the designated hydration time, they were removed from the curing chamber and tested for compressive strength on the machine with a loading rate of 2.4 kN/s.
2.3.6. Microhardness
The 90 d cement paste specimens were subjected to the Vickers microhardness test following standardized sample preparation procedures. The solvent exchange method was applied to stop the materials’ hydration. Then the specimen was treated by vacuum impregnation with epoxy resin and 24-h curing. After demolding, samples were sequentially ground and polished using a BullerEco-30 automated system (Shanghai Jiuyan Technology Co., Ltd., Shanghai, China), with intermediate 5-min isopropanol ultrasonic cleaning between polishing stages. Microhardness measurements were performed using a Vickers indenter under 200 g load with 10 s dwell time. To ensure the representativeness of the microhardness test results and avoid the influence of agglomerates or unreacted particles, a systematic 4 × 4 indentation matrix (Figure 2) was employed, with diagonal lengths recorded for hardness calculation according to ASTM E384 [38] standards. Microhardness was calculated using Equation (2) [39] and the arithmetic mean of 16 test points was taken as the final microhardness of the sample.
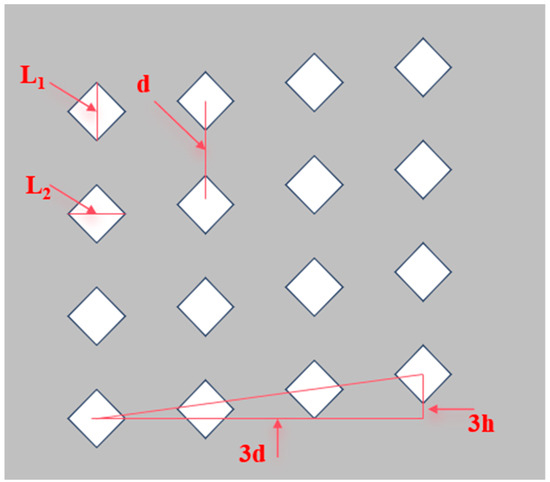
Figure 2.
Distribution diagram of sixteen microhardness test points, which is the white diamond area in the figure. (The conditions should also satisfy L1 > L2 > 20 μm, d > 2 L1, and h = 10 μm to minimize reading errors).
In the given equation, HV denotes the Vickers hardness measured in megapascals (MPa); F stands for the applied test load in Newtons; S refers to the area of the indentation in square millimeters; d is the arithmetic mean of the diagonals of the indentation, measured in millimeters; and θ represents the angle at the tip of the diamond indenter.
2.3.7. EIS
As shown in Figure 3, the Rs(Q1Rct1)(Q2(Rct2W2)) circuit model was employed, abbreviated as R(QR)(Q(RW)), to investigate the microstructural characteristics of cementitious materials [40]. The circuit model is composed of several key elements: Rs, which signifies the resistance of the pore solution in the mortar; Q1, which represents the double-layer capacitance at the solid–liquid interface within the mortar; Rct1, which is indicative of the resistance to ionic transfer in the mortar; Q2, which denotes the double-layer capacitance at the interface between the mortar and the electrode plate; Rct2, which reflects the resistance to charge transfer at the electrode surface; and W2, which describes the Warburg impedance related to electron diffusion at the electrode interface. This model is particularly useful for calculating the continuous connection micropore resistance Rccp (Rccp = Rs + Rct1), which effectively allows for the analysis of microstructural changes in blended systems [41].
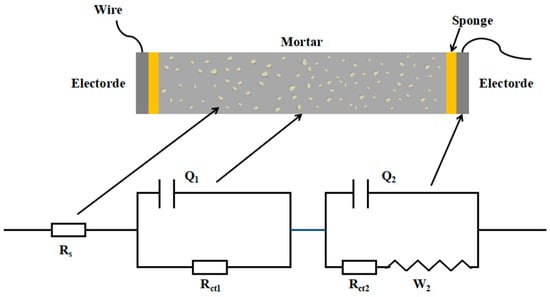
Figure 3.
The schematic diagram of the new circuit model Rs(Q1Rct1)(Q2(Rct2W2)) during the EIS test of cementitious materials.
EIS was employed to assess mortar specimens after 1 d, 3 d, 7 d, 28 d, and 90 d of curing using the CS2350 instrument from Wuhan Koster Instrument Co., Ltd. (Wuhan, China). The EIS measurements were conducted within a frequency range of 0.01 Hz to 1 MHz, while maintaining the open circuit potential at around 20 mV. The data collected from these tests were subsequently analyzed and interpreted using the Zsimpwin 1.0.0.0 software to fit the electrochemical models.
2.4. Activation Treatment of Coal Gangue
Coal gangue was crushed in a crusher (FTT-4500A, Dongguan Fangtai Electric Appliance Co., Ltd., Dongguan, China) for 20 s per run, with a total of three runs. Afterwards, the crushed coal gangue powder was sieved through a 200-mesh screen, with the particle size distribution shown in Figure 1. Subsequently, the coal gangue powder underwent thermogravimetric (TA TGA55, Newcastle, DE, USA) test. Figure 4 illustrates the thermogravimetric analysis of coal gangue, which shows a significant mass loss from 400 °C to 600 °C. This loss is attributed to the dehydroxylation of kaolinite and the decomposition of ferrous carbonate. In the temperature range of 600–750 °C, there is an accelerated mass loss, likely due to the decomposition of muscovite/illite, as corroborated by XRD findings.
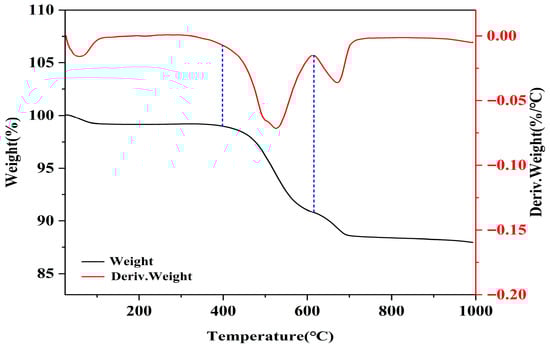
Figure 4.
TG-DTG results of CG (The blue area is the main weightlessness zone).
XRD studies were performed on both raw coal gangue and coal gangue calcined at 800 °C for four hours (CCG), depicted in Figure 5. These studies reveal that the raw coal gangue is predominantly composed of minerals like kaolinite, illite, muscovite, siderite, and quartz. Table 3 presents the quantitative analysis, showing a relatively low content of kaolinite. Under the high temperature of 800 °C, kaolinite transforms into metakaolin. Then the characteristic structure is disrupted, forming an amorphous silica–alumina structure, which leads to the disappearance of its XRD peaks. The peaks of Muscovite/illite also slightly decrease, possibly due to partial activation of Muscovite/illite at this temperature. Additionally, the peaks of iron-rich sederite also exhibit a reduction. These changes indicate that, despite the low content of kaolinite, CCG still possesses some activity.
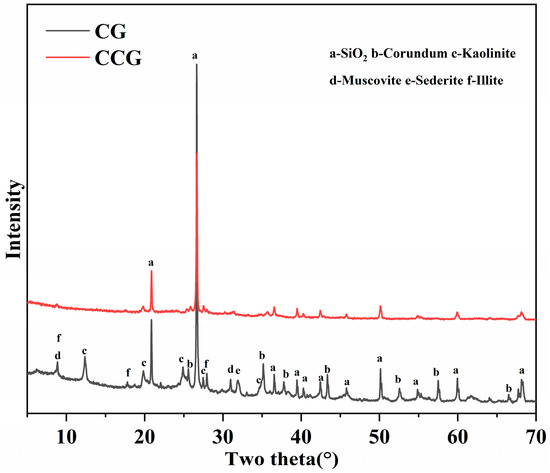
Figure 5.
XRD results of CG and CCG.
Table 3.
The content of main interesting phases in the coal gangues.
As shown in Figure 6, by comparing the SEM images of CG and CCG, it was observed that only a few layered structures are altered, which demonstrates that the characteristic structure of kaolinite is lost.
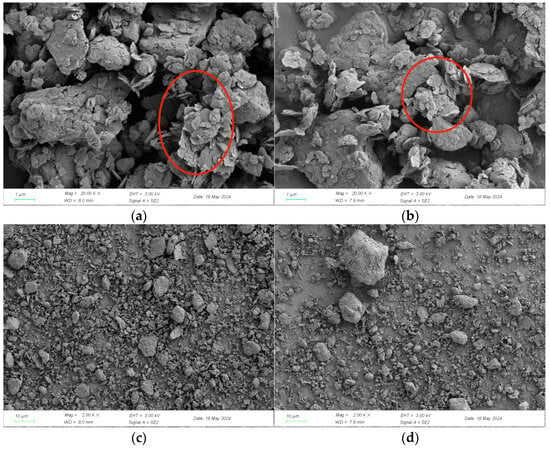
Figure 6.
SEM images of CG (a,c) and CCG (b,d). The destruction of the layered structure of kaolinite (The structural changes can be clearly seen in the red circle).
Subsequently, the coal gangue powder was placed on a corundum tray and calcined in a muffle furnace at 600 °C, 700 °C, and 800 °C for 2 h and 4 h (the samples are labelled as “temperature-duration”), with both heating and cooling rates of 5 °C/min. Considering that the coal gangue powder contained a significant amount of iron-rich sederite and illite, further calcination was also performed at 900 °C and 1000 °C for 4 h to activate the coal gangue.
3. Results and Discussion
3.1. Pozzolanic Activity of the Calcined Coal Gangue
In the mineral composition of coal gangue, kaolinite and muscovite/illite are key active components, with their Al2O3 content potentially being the main source of activity in the coal gangue. Due to the high activation temperature required for illite [42], this study selected a calcination temperature range of 600–1000 °C to fully explore the optimal conditions for calcination activation. Figure 7 displays the outcomes of applying the Chapelle method to assess the pozzolanic activity of coal gangue subjected to various calcination temperatures and durations. Typically, a greater retention of Ca(OH)2 suggests enhanced pozzolanic activity in the calcined samples. The findings demonstrate an improvement in the activity of the coal gangue following calcination. Moreover, it was observed that the calcination temperature and duration generally have a negligible effect on the activity levels, with the notable exception of the 600-2 sample, which showed comparatively lower activity than other treated samples. Furthermore, the activity of coal gangue calcined at 1000 °C is lower compared to that at 800 °C for the same duration. This can be attributed to the recrystallization of kaolinite when the activation temperature exceeds 900 °C, thus reducing the activity of the coal gangue. Additionally, the activation efficiency of illite at higher temperatures is not sufficient to offset the reduction in activity caused by the recrystallization of kaolinite. Therefore, the Chapelle method can determine that reasonably high-temperature calcination can enhance the activity of the coal gangue.
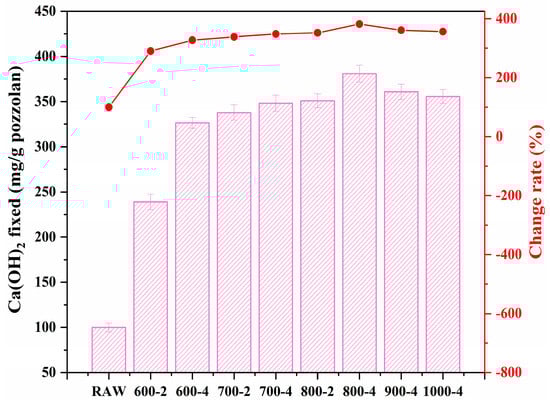
Figure 7.
CH fixation for CG and CCG.
Furthermore, conductivity and SAI tests are utilized to verify the activity reliability. Figure 8 presents the results of the conductivity experiment, where a higher conductivity value indicates lower pozzolanic activity. The results exhibit similar results as seen in Figure 7, which means the pozzolanic activity of calcined coal gangue increases before decreasing with the temperature, with the 800-4 sample presenting the highest pozzolanic activity.
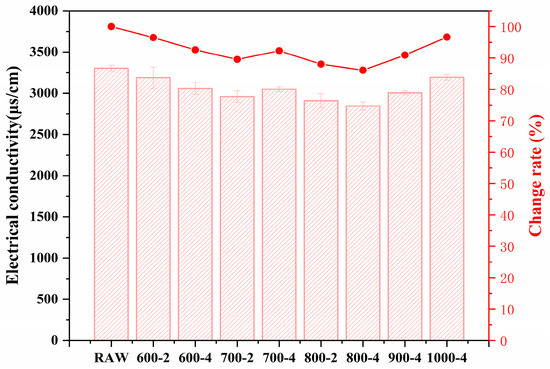
Figure 8.
Conductivity values of CCG.
Additionally, Figure 9, which displays the strength activity index, shows a slight increase in the strength activity index of CCG with increasing calcination time and temperature (in the range of 600–800 °C). It indicates that the calcination process is beneficial for the activity increase of the coal gangue, which means the CCG can be used to produce the low-carbon cementitious materials.
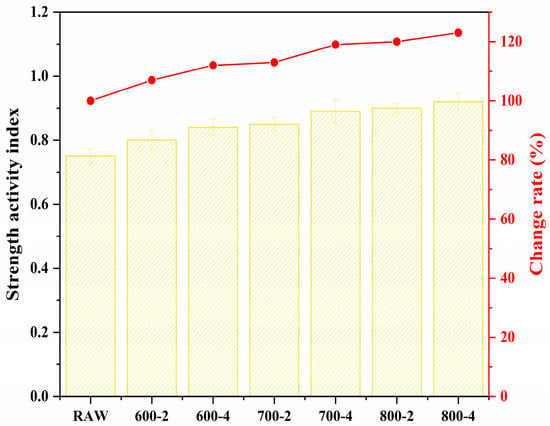
Figure 9.
Strength activity index of CCG.
Therefore, given the changes in pozzolanic activity observed between 600 °C and 800 °C, it is evident that elevated calcination temperatures and extended periods tend to improve the activation of coal gangue. Consequently, future research will focus primarily on coal gangue that has been calcined at 800 °C for four hours, integrating it into cement-based materials to examine its effects on their mechanical properties and microstructure.
3.2. The Effect of Activated Coal Gangue on the Compressive Strength of Cement-Based Materials
Figure 10 displays the compressive strength of the coal gangue and limestone powder blended cement-based materials with different mix proportions, measured at 1 d, 3 d, 7 d, 28 d, and 90 d of curing. Overall, the compressive strength of all systems gradually increases with the curing age, while simultaneously showing a decreasing trend as the proportion of activated coal gangue increases. Specifically, in the early stages of hydration, at 1 d and 3 d of curing, the strength of the OPC system remains higher than that of systems containing CCG. Notably, at 1 day of curing, the strength of the OPC system is significantly higher than that of the CCG-containing systems. By the 3rd d, although the strength of the CCG-containing systems has increased, it still does not surpass the OPC system. However, in the later stages of hydration, a comparison of the compressive strengths of the OPC and CCG systems at 7 d, 28 d, and 90 d shows that the compressive strength of the blended cement-based materials containing CCG gradually approaches and even exceeds that of the OPC system. Particularly, the compressive strengths of the CCG-10 and CCG-15 systems begin to exceed the OPC system from the 7 d and continue to do so up to the 90 d. Additionally, for the systems with limestone, they exhibit similar compressive strength as the corresponding binary systems at 1 d to 7 d, except for the CCG-20 and SC-30 systems. It is noteworthy that at 3 days, the compressive strength of SC-30 exceeded that of CCG-20. This was due to the potential promotional effect of the limestone in the SC-30 system, an effect that becomes more pronounced only at higher limestone concentrations. Additionally, the limestone particles can act as nucleation sites, attracting cement hydration products to precipitate on their surfaces. This acceleration of hydration product formation contributes to the superior early strength development of SC-30, despite the fact that CCG-20 contains a relatively higher amount of cement; overall, its early strength remains lower than that of SC-30. At later ages (28 d and 90 d), it is obvious that the binary systems with only CCG display higher compressive strength than the ternary systems with CCG and LS. This can be attributed, on one hand, to limestone acting as a nucleation site and promoting hydration in the early stages, while the dilution effect surpasses the nucleation effect in the later stages. On the other hand, for the CCG-15 and SC-15 systems, the fine limestone powder can react with coal gangue, but this reaction only occurs during the early stages of hydration. In the later stages, the pozzolanic reaction of the activated coal gangue comes into play, leading to higher strength in the binary system. Therefore, it can be concluded that coal gangue with a content lower than 15% is beneficial for compressive strength, while limestone shows only a little synergistic effect with this type of coal gangue, and the pozzolanic reaction plays a more significant role in the later stages.
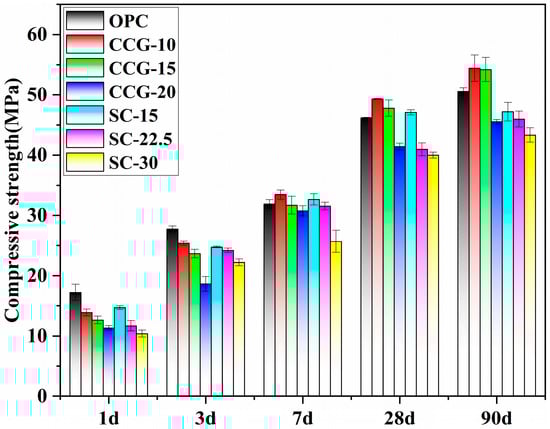
Figure 10.
Compressive strength of the investigated systems at different ages.
3.3. The Influence of Activated Coal Gangue on the Microhardness of Cement-Based Materials
In addition to macroscopic performance evaluation, micro-mechanical characterization is critical for assessing coal gangue utilization efficacy. Microhardness measurements were performed on 90-day mortar specimens, employing a standardized 4 × 4 indentation matrix (Figure 2). The resulting hardness distribution profiles are presented in Figure 11a. Overall, as the substitution rate of CCG increases, the microhardness of the blended cement-based materials shows a decreasing trend. Additionally, systems containing limestone powder also exhibit a continuous decline in microhardness with increasing content of activated coal gangue. Among these systems, only the CCG-10 and CCG-15 groups present a microhardness slightly higher than the OPC group, while the microhardness of other systems is lower than that of the OPC group. Furthermore, the relationship between microhardness and compressive strength, as depicted in Figure 11b, clearly shows that the patterns of microhardness and compressive strength are consistent.
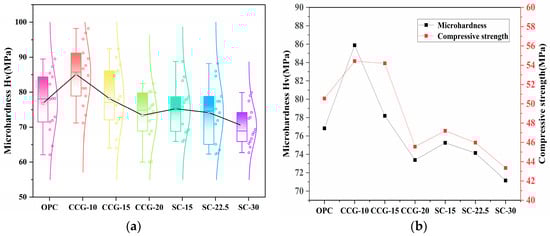
Figure 11.
(a) Microhardness of different systems at 90 d and (b) relationship between microhardness and compressive strength.
3.4. The Effect of Activated Coal Gangue on the EIS Parameter
Figure 12 presents a comparison of the Nyquist plots for different groups at 28 d and 90 d of curing age, where the diameter of the semicircle qualitatively reflects the magnitude of the material’s resistance. Typically, a larger semicircle diameter indicates higher resistance. As shown in Figure 12a, at 28 d of hydration, the CCG-10 group exhibits the largest semicircle diameter, while the semicircles for the CCG-15 and SC-15 groups are also significantly larger than that of the OPC system. This difference is primarily due to the pozzolanic reactions occurring in the groups that partially substituted cement clinker in the later stages of hydration, which consumed CH from the hydration products and generated more C-S-H, effectively filling the pores. Quantitative XRD analysis also confirmed that the CH content in the CCG and SC systems is much lower than that in the OPC group at later stages of hydration (Figure 16), leading to the significant differences observed in the Nyquist plots. Figure 12b shows that after 90 d of curing, the semicircles for the CCG-10 and CCG-15 groups remain larger than those of the OPC group, and the gap between all systems gradually narrows. Overall, the electrical resistance performance of the CCG system is superior to that of the SC system.
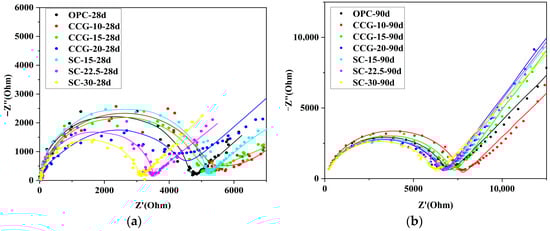
Figure 12.
Nyquist curves for different systems. Point average refers to experimental data; the solid line is an equivalent circuit simulation using R (QR) (Q(RW)). (a) 28 d; (b) 90 d.
Figure 13 displays the continuous connection micropore resistance (Rccp) values for different systems at various ages, calculated using the equivalent circuit. The graph shows that the Rccp values for all systems exhibit an increasing trend as the hydration time extends. In the early stages (1 d and 3 d), since the particle sizes of CCG and LS are smaller compared to cement, they primarily act as fillers in the initial phase without significant pozzolanic reaction, hence the OPC system shows higher Rccp values. Starting from 3 d, the CCG and SC systems begin to undergo pozzolanic reactions, and their Rccp values gradually approach those of the OPC group. As hydration progresses, by 7 d, the groups with lower substitution rates in the CCG and SC systems (such as CCG-10 and SC-15) start to exhibit higher resistance values than the OPC group. By 28 d and 90 d of hydration, both the CCG and SC systems continue to narrow the gap in Rccp values with the OPC, and the CCG-15 group even surpasses the OPC in terms of Rccp values. Moreover, this change in Rccp values in both the CCG and SC systems continues to decrease with increasing substitution rates.

Figure 13.
Rccp values of different systems at different ages.
Figure 14 illustrates the correlation between the compressive strength and Rccp values of different systems at various ages. This figure shows a clear linear relationship between the compressive strength and Rccp value of coal gangue-containing cement-based materials and their composite materials with limestone powder, indicating that the increase in Rccp value directly improves the compressive strength of these materials and more fundamentally reflects the characteristics of the internal microstructure (such as micro-crack density and porosity) of the materials. It is precisely the state of these microscopic defects that ultimately determines the improvement of the compressive strength of the materials. In the early stages of hydration (from 1 d to 7 d), area “a” in Figure 14 exhibits a slow increase in Rccp values, primarily due to the hydration of cement and the limited participation of activated coal gangue. As cement hydration progresses and the marked pozzolanic reaction of the activated coal gangue intensifies, a more rapid rise is noted in area “b”. The growth of Rccp values in Area “c” in Figure 14 then becomes more gradual, a phenomenon that can be attributed to the transition to the slow hydration of cement alone by 90 d.
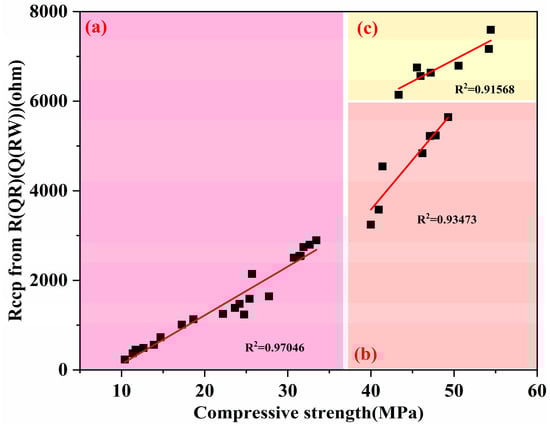
Figure 14.
Relationship between compressive strength and Rccp values of various systems at different ages. (a) 1 d, 3 d, 7 d; (b) 28 d; (c) 90 d.
3.5. The Effect of Activated Coal Gangue on the Phase Assemblage
3.5.1. Analysis of Ettringite and AFm Phases in Different Systems
Figure 15 presents the XRD spectra from 0 to 20° for different systems at 1 d, 3 d, 7 d, 28 d, and 90 d. The spectra reveal the presence of ettringite (AFt) but not AFm in systems containing coal gangue powder at 1 d and 3 d. As the age progresses to 7 d, 28 d, and 90 d, characteristic peaks of both AFt and monosulfoaluminate (Ms) appear in the CCG system, whereas only AFt and Mc/Hc are maintained in the SC system, with no formation of Ms observed. This may be due to the formation of AFt and Ms during the cement hydration process, depending on the availability of sulfate and aluminate phases. The presence of aluminate phases in coal gangue cement-based materials facilitates the transformation from AFt to Ms. However, in the system comprising coal gangue and limestone powder, the presence of calcium carbonate may affect the availability of aluminum ions, limiting the formation of Ms and forming Mc and Hc phases.
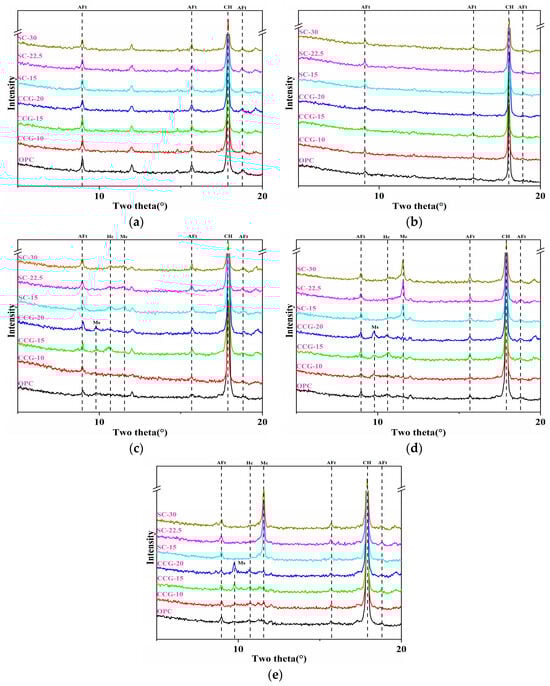
Figure 15.
XRD patterns of different systems, 1 d (a), 3 d (b), 7 d (c), 28 d (d), 90 d (e).
3.5.2. Changes in Portlandite and Carboaluminate (Mc + Hc) Content in Different Systems
In the presence of CCG and LS, reactions occur between the raw materials, forming C-S-H and carboaluminate. The former one is mainly from the hydration of cement, while it is also a hydration product of the pozzolanic reaction occurring between CCG and CH. Besides, the latter one typically forms due to reactions between the aluminate phase and limestone powder. To compare the extent of the CCG reactions, a quantitative XRD analysis was performed. Figure 16 shows the CH content at different curing ages for all systems, while Figure 17 displays the content of carboaluminate and Ms.
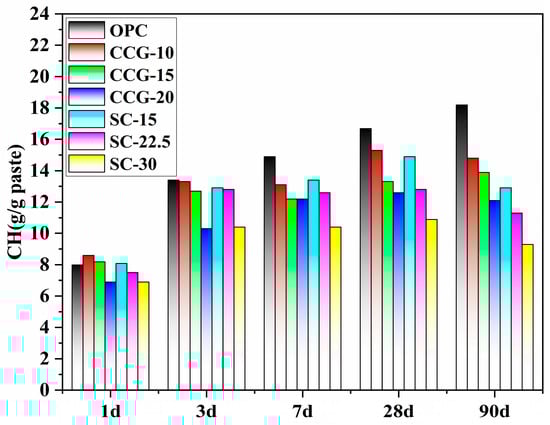
Figure 16.
Changes in Ca(OH)2 content over time in different systems.
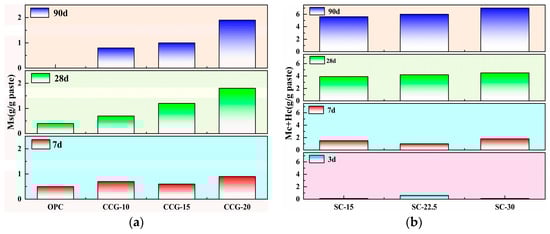
Figure 17.
Changes in the content of (a) Ms and (b) carboaluminate over time in different systems.
From Figure 16, in the OPC system, which lacks pozzolanic materials, the CH content increases as the hydration of cement progresses. However, as hydration progresses from 28 d to 90 d, the reduction in CH content in the CCG-10 system indicates that the pozzolanic reaction rate between the CCG and CH exceeds the generation of CH from cement hydration. In the early stages of hydration (1 d and 3 d), due to the limited pozzolanic reaction, there is little difference in the CH content between the OPC system and the system containing CCG. Additionally, since the added CCG and LS particles are finer, they initially act as fillers to occupy voids without undergoing significant pozzolanic reaction. As the hydration progresses to the intermediate stage (7 d), the CCG gradually undergoes a pozzolanic reaction, consuming some of the CH and forming C-S-H, which increases the density and strength of the material. By the later stages of hydration (28 d and 90 d), the CH content does not continue to increase due to the pozzolanic reaction and even shows some reduction. Data from 7 d, 28 d, and 90 d further indicate that the CH content in the systems containing CCG is significantly lower than that in the OPC system, yet there is still some CH present, indicating sufficient CH for reaction with CCG.
Figure 17 displays the content of Ms and Hc in the studied systems. On one hand, it can be seen from the figure that both the OPC and CCG systems are primarily characterized by Ms, with Ms beginning to form gradually after 3 d, while the SC system is mainly composed of carboaluminate. Moreover, from the analysis of strength, it can be deduced that the Mc and Hc formed in the SC system have a significant impact on strength at 7 d (where the strength of binary and ternary systems is comparable). However, by 28 d and 90 d, due to the pozzolanic reaction, the impact of Mc and Hc on strength is not significant. On the other hand, according to Figure 17b, on the first day of hydration, none of the systems produced Mc and Hc. This may be because in the early stages of hydration, despite the presence of aluminate phases and calcium carbonate, the hydration reactions are primarily focused on the hydration of silicates. Therefore, the reaction rate of calcium carbonate with aluminate phases to form carboaluminate is relatively slow, resulting in no formation of Mc and Hc in any system within the first day. As the hydration process progresses, the SC system produces a large amount of Mc and Hc, which is mainly attributed to the addition of limestone powder, not only providing the necessary calcium carbonate but also possibly enhancing the solubility of the aluminate phases. Besides, Figure 15 exhibits that the CCG system also contains a small amount of Hc, possibly due to the carbonation during the sample preparation.
3.6. The Action Mechanism of Low-Activity Coal Gangue in Cement
The optimal activation conditions for coal gangue with a low kaolinite content were investigated by calcining at temperatures ranging from 600 °C to 1000 °C. As seen in Figure 5, kaolinite is the key active component. Calcination activation, by altering the physical and chemical structure of the coal gangue, especially at appropriate temperatures, can promote the transformation of kaolinite into amorphous substances, thereby enhancing the reactivity of the coal gangue. Moreover, as observed in Figure 4, Figure 7, Figure 8 and Figure 9, the coal gangue is fully activated at 800 °C, and calcining for 4 h at 800 °C is identified as the optimal activation condition.
Compressive strength and microhardness tests were conducted on the blended systems, revealing that as the curing time extended, the hydration levels of cement and various SCMs gradually increased. The reaction products effectively fill the pores within the specimens, thereby continuously enhancing their strength. Nevertheless, the pozzolanic reaction of CCG predominantly functions during the middle to late hydration stages. Consequently, in the initial stages, the filler effects of LS and CCG are insufficient to offset the dilution effect brought about by substituting some of the cement with CCG and LS. This leads to strength levels that consistently fall below those of the OPC group. As hydration progresses to later stages, due to the pozzolanic reaction, the compressive strengths of CCG-10 and CCG-15 exceed those of OPC and remain higher up to 90 d. Additionally, the systems incorporating LS show significantly lower strengths compared to the systems with CCG alone. This could be attributed to the lower kaolinite content in the coal gangue (as shown in Table 3) and the stable structure of illite, which is difficult to fully activate by heating, resulting in lower reactivity of the coal gangue and insufficient alumina to react with the limestone powder. Therefore, as hydration continues, less C-S-H is formed in the SC systems, and the increased replacement of cement by LS leads to a more pronounced dilution effect, thereby reducing the strength. It is noteworthy that in both the CCG-15 and SC-15 systems, where the amount of cement replaced is 15% and the limestone powder has a smaller particle size, the former achieves higher strength. This is primarily because the pozzolanic activity of the coal gangue is more beneficial in enhancing strength than the products derived from the reaction of coal gangue and limestone powder. By comparing the compressive strengths of CCG-10, CCG-15, and CCG-20, it was observed that as the cement replacement level increases, the strength correspondingly decreases, indicating that lower replacement levels are beneficial for improving the strength of cement-based materials. This is consistent with the results from EIS tests, suggesting that the C-S-H gel formed by the pozzolanic reaction enhances the structural density of the materials, thus improving their compressive strength.
The changes in CH observed in the XRD patterns of both CCG and SC systems further confirm that the pozzolanic reaction involving activated coal gangue primarily occurs in the mid to late stages, aligning with the patterns of strength changes. Additionally, the systems incorporating LS exhibit no phase transition from AFt to Ms, in the presence of aluminate phases and calcium carbonate. The presence of calcium carbonate may have influenced the availability of aluminum ions, limiting this conversion process, resulting in only a minimal amount of AFt formation in the SC system. Regarding the content of carboaluminates across all systems, the SC system contains significantly more carboaluminates than the CCG system. However, this increase in carboaluminates does not compensate for the strength reduction caused by higher cement replacement levels, resulting in higher strength in the CCG system compared to the SC system. As a result, activated coal gangue only achieves strength comparable to the control group at low replacement levels.
4. Conclusions
This study activated coal gangue with a low kaolinite content through calcination and investigated the mechanical properties of the blended cement-based materials. The relationships between macroscopic performance and microstructure were studied using compressive strength, microhardness, XRD, and EIS tests, leading to the following conclusions:
- According to the pozzolanic activity test, coal gangue with a low kaolinite content exhibits optimal activity when calcined at 800 °C for 4 h. Increasing the calcination temperature further could deactivate the active substances, worsening the activity.
- The binary systems with only CCG exhibit better mechanical properties than the corresponding ternary systems with CCG and LS. When limestone powder is added, it does not significantly enhance performance, possibly attributed to the fact that carboaluminates formed from the low-activity coal gangue and limestone powder could not effectively compensate for the performance decline caused by the reduced cement.
- The pozzolanic reaction in the mid to late stages, by consuming CH, generates a large amount of C-S-H gel, enhancing the compactness of the material structure. EIS demonstrated the highest Rccp values, characterizing the microstructure of the cementitious materials based on activated coal gangue with low kaolinite content. The microhardness tests further reflect the mechanical properties of the materials from a microscopic perspective, especially showing optimal performance at substitution rates of 10% to 15%.
Author Contributions
Resources, Y.G.; Data curation, D.L.; Writing—original draft, X.K.; Writing—review and editing, S.S., S.L., S.G. and X.C.; Funding acquisition, H.W. and J.C.; Conceptualization, S.S.; Methodology, S.S.; Formal analysis, X.K. and D.L.; Investigation, X.K.; Supervision, S.L. and S.G.; Project administration, H.W. and J.C.; Validation, Y.G. and X.C. All authors have read and agreed to the published version of the manuscript.
Funding
The study was funded by the National Natural Science Foundation of China (52293431, 52478258), the Special Fund for Carbon Peak and Carbon Neutrality Science and Technology Innovation of Jiangsu Province (BE2023851), Shandong Province Higher Education “Youth Innovation and Technology Entrepreneurship Program” (2022KJ160), Shandong Provincial Youth Science Foundation (ZR2024QE533), Open Fund Project of the Engineering Research Center of Safety and Protection of Explosion & Impact of Ministry of Education, Southeast University (2024-SPEIKF-004).
Data Availability Statement
The original contributions presented in this study are included in the article. Further inquiries can be directed to the corresponding author.
Conflicts of Interest
Hui Wang was employed by Beijing Building Materials Academy of Sciences Research. Jie Chen was employed by Poly Changda Engineering Co., Ltd. The remaining authors declare that the research was conducted in the absence of any commercial or financial relationships that could be construed as a potential conflict of interest.
Correction Statement
This article has been republished with a minor correction to the Data Availability Statement. This change does not affect the scientific content of the article.
References
- Yang, J.; Su, Y.; He, X.; Tan, H.; Jiang, Y.; Zeng, L.; Strnadel, B. Pore structure evaluation of cementing composites blended with coal by-products: Calcined coal gangue and coal fly ash. Fuel Process. Technol. 2018, 181, 75–90. [Google Scholar] [CrossRef]
- National Bureau of Statistics of China. National Bureau of Statistics of China (National Data). 2012. Available online: https://www.stats.gov.cn/search/english/s?qt=coal (accessed on 22 July 2025).
- Spencer, D. BP Statistical Review of World Energy; World Energy: London, UK, 2019; Volume 68, pp. 1–69. [Google Scholar]
- Haibin, L.; Zhenling, L. Recycling utilization patterns of coal mining waste in China. Resour. Conserv. Recycl. 2010, 54, 1331–1340. [Google Scholar] [CrossRef]
- Scrivener, K.; Martirena, F.; Bishnoi, S.; Maity, S. Calcined clay limestone cements (LC3). Cem. Concr. Res. 2018, 114, 49–56. [Google Scholar] [CrossRef]
- Zhu, X.; Kang, X.; Deng, J.; Yang, K.; Jiang, S.; Yang, C. Chemical and physical effects of high-volume limestone powder on sodium silicate-activated slag cement (AASC). Constr. Build. Mater. 2021, 292, 123257. [Google Scholar] [CrossRef]
- Zhu, X.; Zhang, M.; Yang, K.; Yu, L.; Yang, C. Setting behaviours and early-age microstructures of alkali-activated ground granulated blast furnace slag (GGBS) from different regions in China. Cem. Concr. Compos. 2020, 114, 103782. [Google Scholar] [CrossRef]
- Zunino, F.; Scrivener, K. The reaction between metakaolin and limestone and its effect in porosity refinement and mechanical properties. Cem. Concr. Res. 2021, 140, 106307. [Google Scholar] [CrossRef]
- Yu, K.; Liu, Y.; Yang, Y. Review on form-stable inorganic hydrated salt phase change materials: Preparation, characterization and effect on the thermophysical properties. Appl. Energy 2021, 292, 116845. [Google Scholar] [CrossRef]
- Zhang, J.; Gao, X.; Su, Y. Influence of poker vibration on aggregate settlement in fresh concrete with variable rheological properties. J. Mater. Civ. Eng. 2019, 31, 04019128. [Google Scholar] [CrossRef]
- Gettu, R.; Patel, A.; Rathi, V.; Prakasan, S.; Basavaraj, A.S.; Palaniappan, S.; Maity, S. Influence of supplementary cementitious materials on the sustainability parameters of cements and concretes in the Indian context. Mater. Struct. 2019, 52, 10. [Google Scholar] [CrossRef]
- Berriel, S.S.; Favier, A.; Domínguez, E.R.; Machado, I.S.; Heierli, U.; Scrivener, K.; Hernández, F.M.; Habert, G. Assessing the environmental and economic potential of Limestone Calcined Clay Cement in Cuba. J. Clean. Prod. 2016, 124, 361–369. [Google Scholar] [CrossRef]
- Khedher, K.M. Experimental Behavior of Self Compacting Concrete Using Red Mud. Mesopotamian J. Civ. Eng. 2023, 2023, 10–17. [Google Scholar] [CrossRef]
- Liu, Y.; Lei, S.; Huang, T.; Ji, M.; Li, Y.; Fan, Y. Research on mineralogy and flotation for coal-series kaolin. Appl. Clay Sci. 2017, 136, 37–42. [Google Scholar] [CrossRef]
- Qin, L.; Gao, X. Properties of coal gangue-Portland cement mixture with carbonation. Fuel 2019, 245, 1–12. [Google Scholar] [CrossRef]
- Sharma, M.; Bishnoi, S.; Martirena, F.; Scrivener, K. Limestone calcined clay cement and concrete: A state-of-the-art review. Cem. Concr. Res. 2021, 149, 106564. [Google Scholar] [CrossRef]
- Ijaz, N.; Ye, W.M.; ur Rehman, Z.; Ijaz, Z.; Junaid, M.F. Global insights into micro-macro mechanisms and environmental implications of limestone calcined clay cement (LC3) for sustainable construction applications. Sci. Total Environ. 2024, 907, 167794. [Google Scholar] [CrossRef]
- Luo, K.; Li, J.; Zeng, J.; Ding, Q.; Shen, A.; Luo, Z. Study on the Performance of Activated Coal Gangue-Limestone Composite Cement. J. Wuhan Univ. Technol. 2022, 44, 10–15. [Google Scholar]
- Frías, M.; Sanchez de Rojas, M.I.; García, R.; Valdés, A.J.; Medina, C. Effect of activated coal mining wastes on the properties of blended cement. Cem. Concr. Compos. 2012, 34, 678–683. [Google Scholar] [CrossRef]
- Zhang, Y.; Ling, T.C. Reactivity activation of waste coal gangue and its impact on the properties of cement-based materials–A review. Constr. Build. Mater. 2020, 234, 117424. [Google Scholar] [CrossRef]
- Sun, J.; Chen, Y.; Hou, P.; Ma, J.; Zhou, H. Feasibility study on the preparation of ternary blended cements with low-kaolinite calcined coal gangue and limestone. Constr. Build. Mater. 2024, 449, 138478. [Google Scholar] [CrossRef]
- Ma, H.; Zhu, H.; Wu, C.; Chen, H.; Sun, J.; Liu, J. Study on compressive strength and durability of alkali-activated coal gangue-slag concrete and its mechanism. Powder Technol. 2020, 368, 112–124. [Google Scholar] [CrossRef]
- Huo, X.; Jia, X.; Song, C.; Hao, S.; Zhang, D.; Ding, Y.; Liu, S.; Zhang, W. Investigation of co-pyrolysis characteristics of modified coal gangue and biomass. Thermochim. Acta 2021, 705, 179033. [Google Scholar] [CrossRef]
- Souri, A.; Kazemi-Kamyab, H.; Snellings, R.; Naghizadeh, R.; Golestani-Fard, F.; Scrivener, K. Pozzolanic activity of mechanochemically and thermally activated kaolins in cement. Cem. Concr. Res. 2015, 77, 47–59. [Google Scholar] [CrossRef]
- Zhang, M.; Li, L.; Yang, F.; Zhang, S.; Zhang, H.; Zhu, Y.; An, J. Thermal activation of high-alumina coal gangue auxiliary cementitious admixture: Thermal transformation, calcining product formation and mechanical properties. Materials 2024, 17, 415. [Google Scholar] [CrossRef] [PubMed]
- Li, Y.; Yao, Y.; Liu, X.; Sun, H.; Ni, W. Improvement on pozzolanic reactivity of coal gangue by integrated thermal and chemical activation. Fuel 2013, 109, 527–533. [Google Scholar] [CrossRef]
- Hu, Y.; Han, X.; Sun, Z.; Jin, P.; Li, K.; Wang, F.; Gong, J. Study on the reactivity activation of coal gangue for efficient utilization. Materials 2023, 16, 6321. [Google Scholar] [CrossRef]
- Li, Y.; Zhang, J.; Yan, C.; Bold, T.; Wang, J.; Cui, K. Effect of activated coal gangue on the hydration and hardening of Portland cement. Constr. Build. Mater. 2024, 422, 135740. [Google Scholar] [CrossRef]
- Shao, Z.; Cao, M. Hydration mechanism of limestone calcined clay cement containing calcined coal gangue. Constr. Build. Mater. 2024, 438, 136906. [Google Scholar] [CrossRef]
- Zhang, W.; Zhou, H.; Hu, Y.; Wang, J.; Ma, J.; Jiang, R.; Sun, J. Influence of Curing Temperature on the Performance of Calcined Coal Gangue–Limestone Blended Cements. Materials 2024, 17, 1721. [Google Scholar] [CrossRef]
- Lothenbach, B.; Le Saout, G.; Gallucci, E.; Scrivener, K. Influence of limestone on the hydration of Portland cements. Cem. Concr. Res. 2008, 38, 848–860. [Google Scholar] [CrossRef]
- Wang, D.H.; Shi, C.J.; Farzadnia, N.; Shi, Z.G.; Jia, H.F.; Ou, Z.H. A review on use of limestone powder in cement-based materials: Mechanism, hydration and microstructures. Constr. Build. Mater. 2018, 181, 659–672. [Google Scholar] [CrossRef]
- Liu, X.; Wang, P.; Ding, M. Hydration process in Portland cement blended with activated coal gangue. J. Zhejiang Univ. A 2011, 12, 503–510. [Google Scholar] [CrossRef]
- Arikan, M.; Sobolev, K.; Ertün, T.; Yeğinobali, A.; Turker, P. Properties of blended cements with thermally activated kaolin. Constr. Build. Mater. 2009, 23, 62–70. [Google Scholar] [CrossRef]
- Kuliffayová, M.; Krajči, L.; Janotka, I.; Šmatko, V. Thermal behaviour and characterization of cement composites with burnt kaolin sand. J. Therm. Anal. Calorim. 2011, 108, 425–432. [Google Scholar] [CrossRef]
- Krishnan, S.; Bishnoi, S. A numerical approach for designing composite cements with calcined clay and limestone. Cem. Concr. Res. 2020, 138, 106232. [Google Scholar] [CrossRef]
- BS EN 196-1:2016; Methods of Testing Cement Part 1: Determination of Strength. European Standards: Plzen, Czech Republic, 2016. Available online: https://store.accuristech.com/standards/bs-en-196-1-2016?product_id=1915781 (accessed on 22 July 2025).
- Hetzner, D.W. Microindentation hardness testing of materials using ASTM E384. Microsc. Microanal. 2003, 9, 708–709. [Google Scholar] [CrossRef]
- Mukhopadhyay, N.K.; Paufler, P. Micro- and nanoindentation techniques for mechanical characterisation of materials. Int. Mater. Rev. 2006, 51, 209–245. [Google Scholar] [CrossRef]
- Sui, S.; Jiang, C.; He, G.; Shan, Y.; Li, S.; Wang, F.; Wang, X.; Wu, M.; Jiang, J. Investigation on the compressive strength, chloride migration of MK-FA-LS blended cementitious materials with electrochemical techniques. J. Build. Eng. 2024, 95, 110287. [Google Scholar] [CrossRef]
- Song, G. Equivalent circuit model for AC electrochemical impedance spectroscopy of concrete. Cem. Concr. Res. 2000, 30, 1723–1730. [Google Scholar] [CrossRef]
- Jiang, T.; Li, G.; Qiu, G.; Fan, X.; Huang, Z. Thermal activation and alkali dissolution of silicon from illite. Appl. Clay Sci. 2008, 40, 81–89. [Google Scholar] [CrossRef]
Disclaimer/Publisher’s Note: The statements, opinions and data contained in all publications are solely those of the individual author(s) and contributor(s) and not of MDPI and/or the editor(s). MDPI and/or the editor(s) disclaim responsibility for any injury to people or property resulting from any ideas, methods, instructions or products referred to in the content. |
© 2025 by the authors. Licensee MDPI, Basel, Switzerland. This article is an open access article distributed under the terms and conditions of the Creative Commons Attribution (CC BY) license (https://creativecommons.org/licenses/by/4.0/).