Climate Adaptability and Energy Performance in the Greater Bay Area of China: Analysis of Carbon Neutrality Through Green Building Practices
Abstract
1. Introduction
2. Study Area
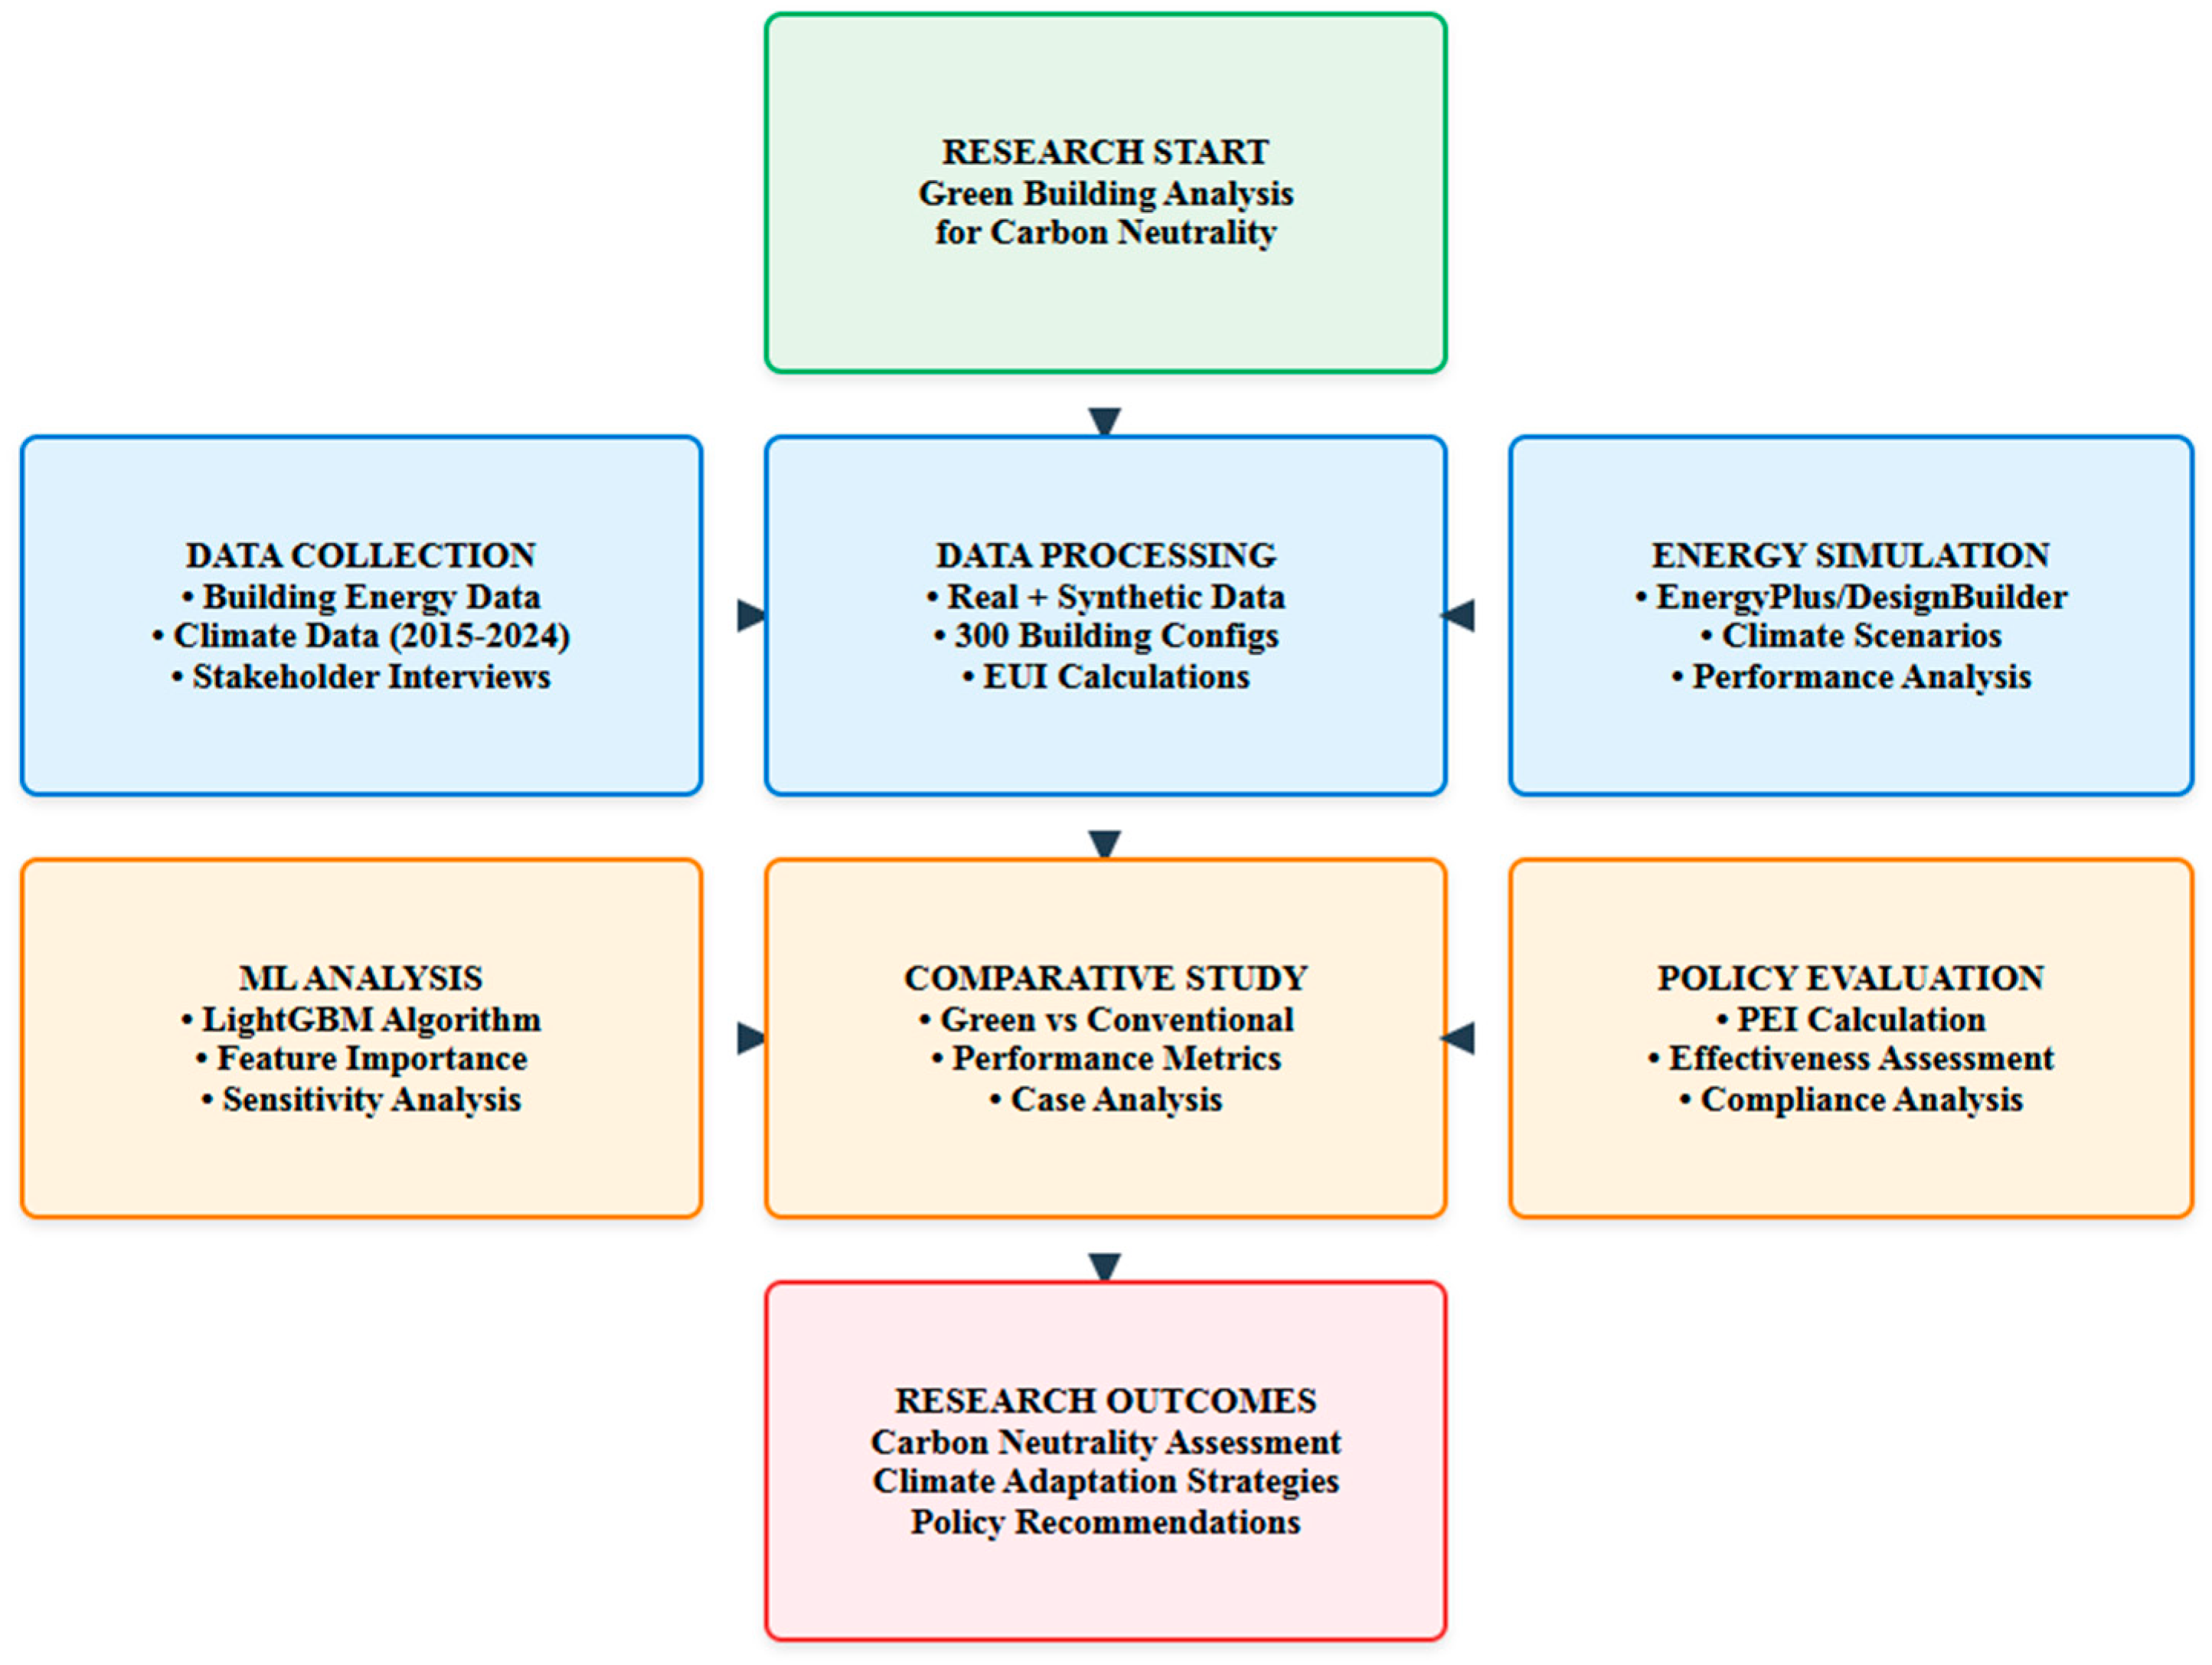
3. Methodology
3.1. Data Collection and Fabrication
3.1.1. Definition of Green Buildings and Sample Selection
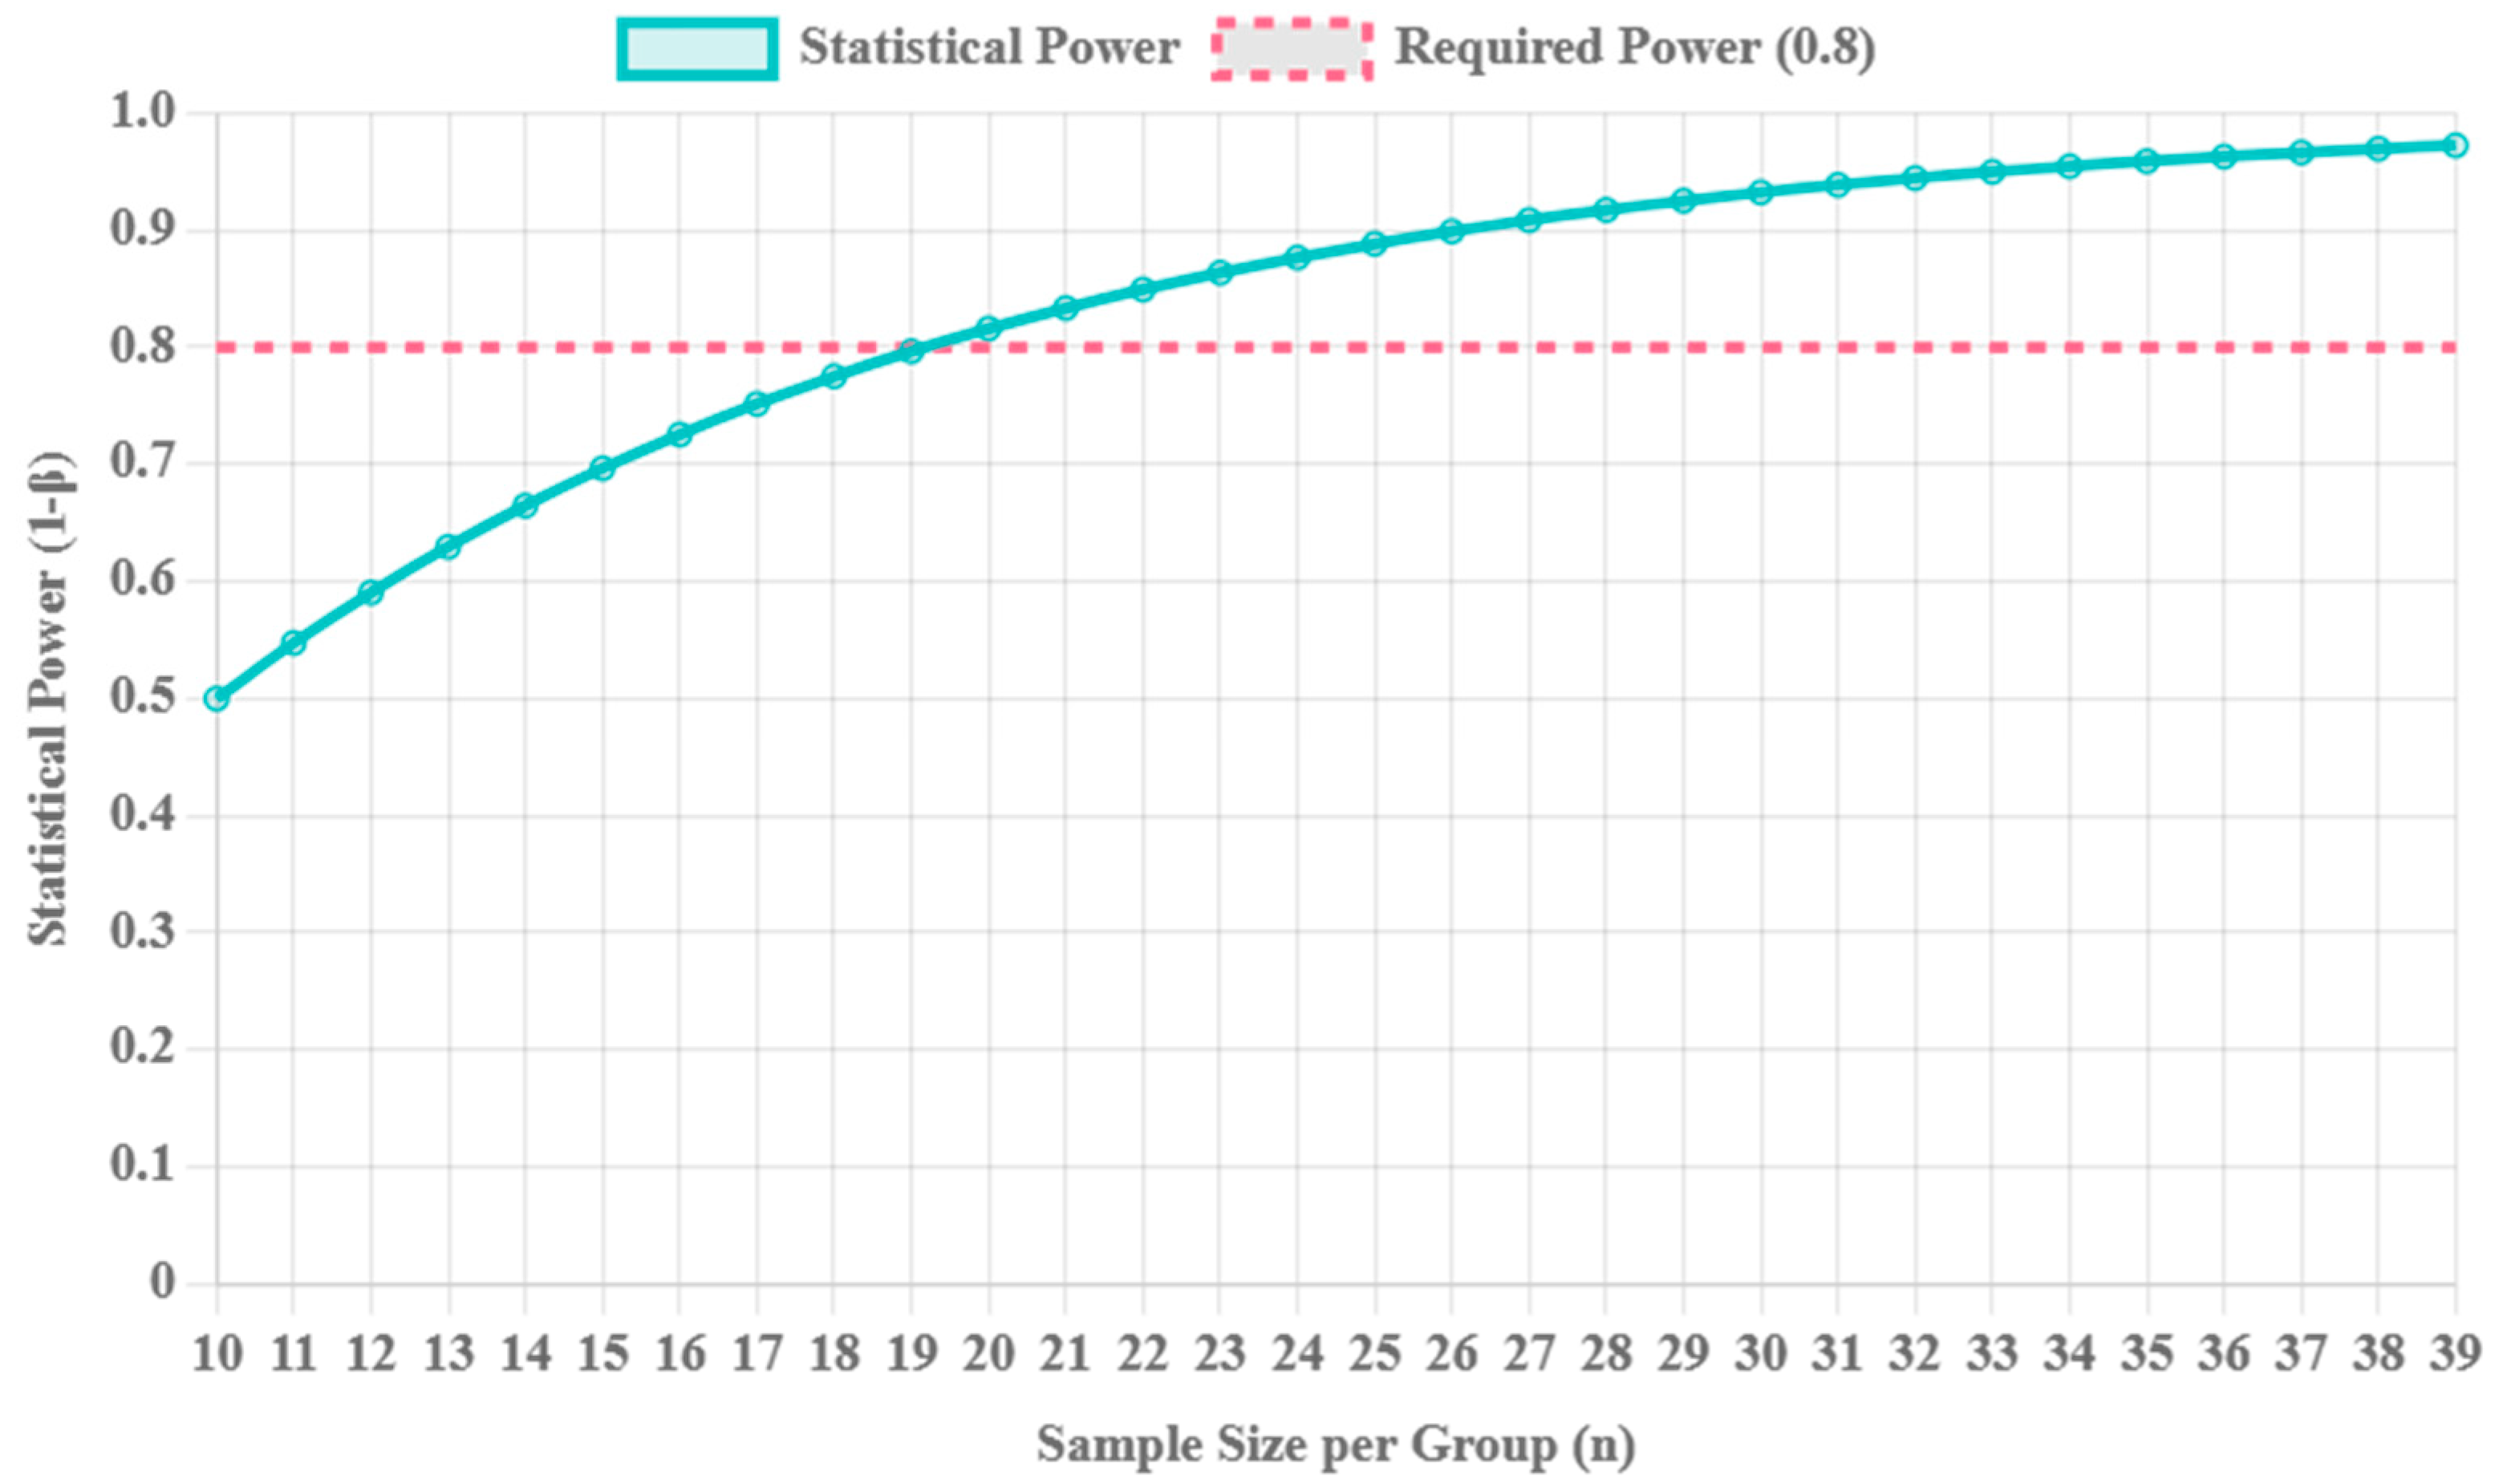
3.1.2. Statistical Power Analysis
- Effect size (Cohen’s d) = 0.8 (large effect expected based on pilot data)
- Statistical power (1 − β) = 0.80
- Significance level (α) = 0.05
- Two-tailed test
3.1.3. Detailed Building Classification and Stratification
3.1.4. Geographic Distribution
- Shenzhen: 12 buildings (6 green, 6 conventional)
- Hong Kong: 10 buildings (5 green, 5 conventional)
- Guangzhou: 10 buildings (5 green, 5 conventional)
3.1.5. Cross-City Building Type Distribution Reflects Urbanization Patterns
- Shenzhen (high-density commercial hub): 60% office buildings, 25% residential towers, 15% mixed-use
- Hong Kong (mature dense urban): 50% office buildings, 35% residential towers, 15% institutional/mixed-use
- Guangzhou (balanced metropolitan): 45% office buildings, 30% residential towers, 25% mixed-use/institutional
3.1.6. Sampling Methodology
- Building typology (proportional to GBA building stock)
- Construction vintage (post-2010 green building standards)
- Size categories (representative of commercial/institutional buildings)
- Geographic distribution (proportional to urban development patterns)
3.2. Building Energy Simulation with Climate Models
3.2.1. Simulation Dataset for Machine Learning
- i.
- Parameter Distribution Analysis: Statistical distributions of key parameters (envelope properties, HVAC efficiency, window-to-wall ratios) were derived from the 32 empirical buildings
- ii.
- Monte Carlo Sampling: Latin Hypercube Sampling was used to create 300 artificial structures in order to guarantee representative coverage of the parameter space.
- iii.
- Validation: A subset of synthetic buildings was validated using empirical data to confirm realistic performance characteristics.
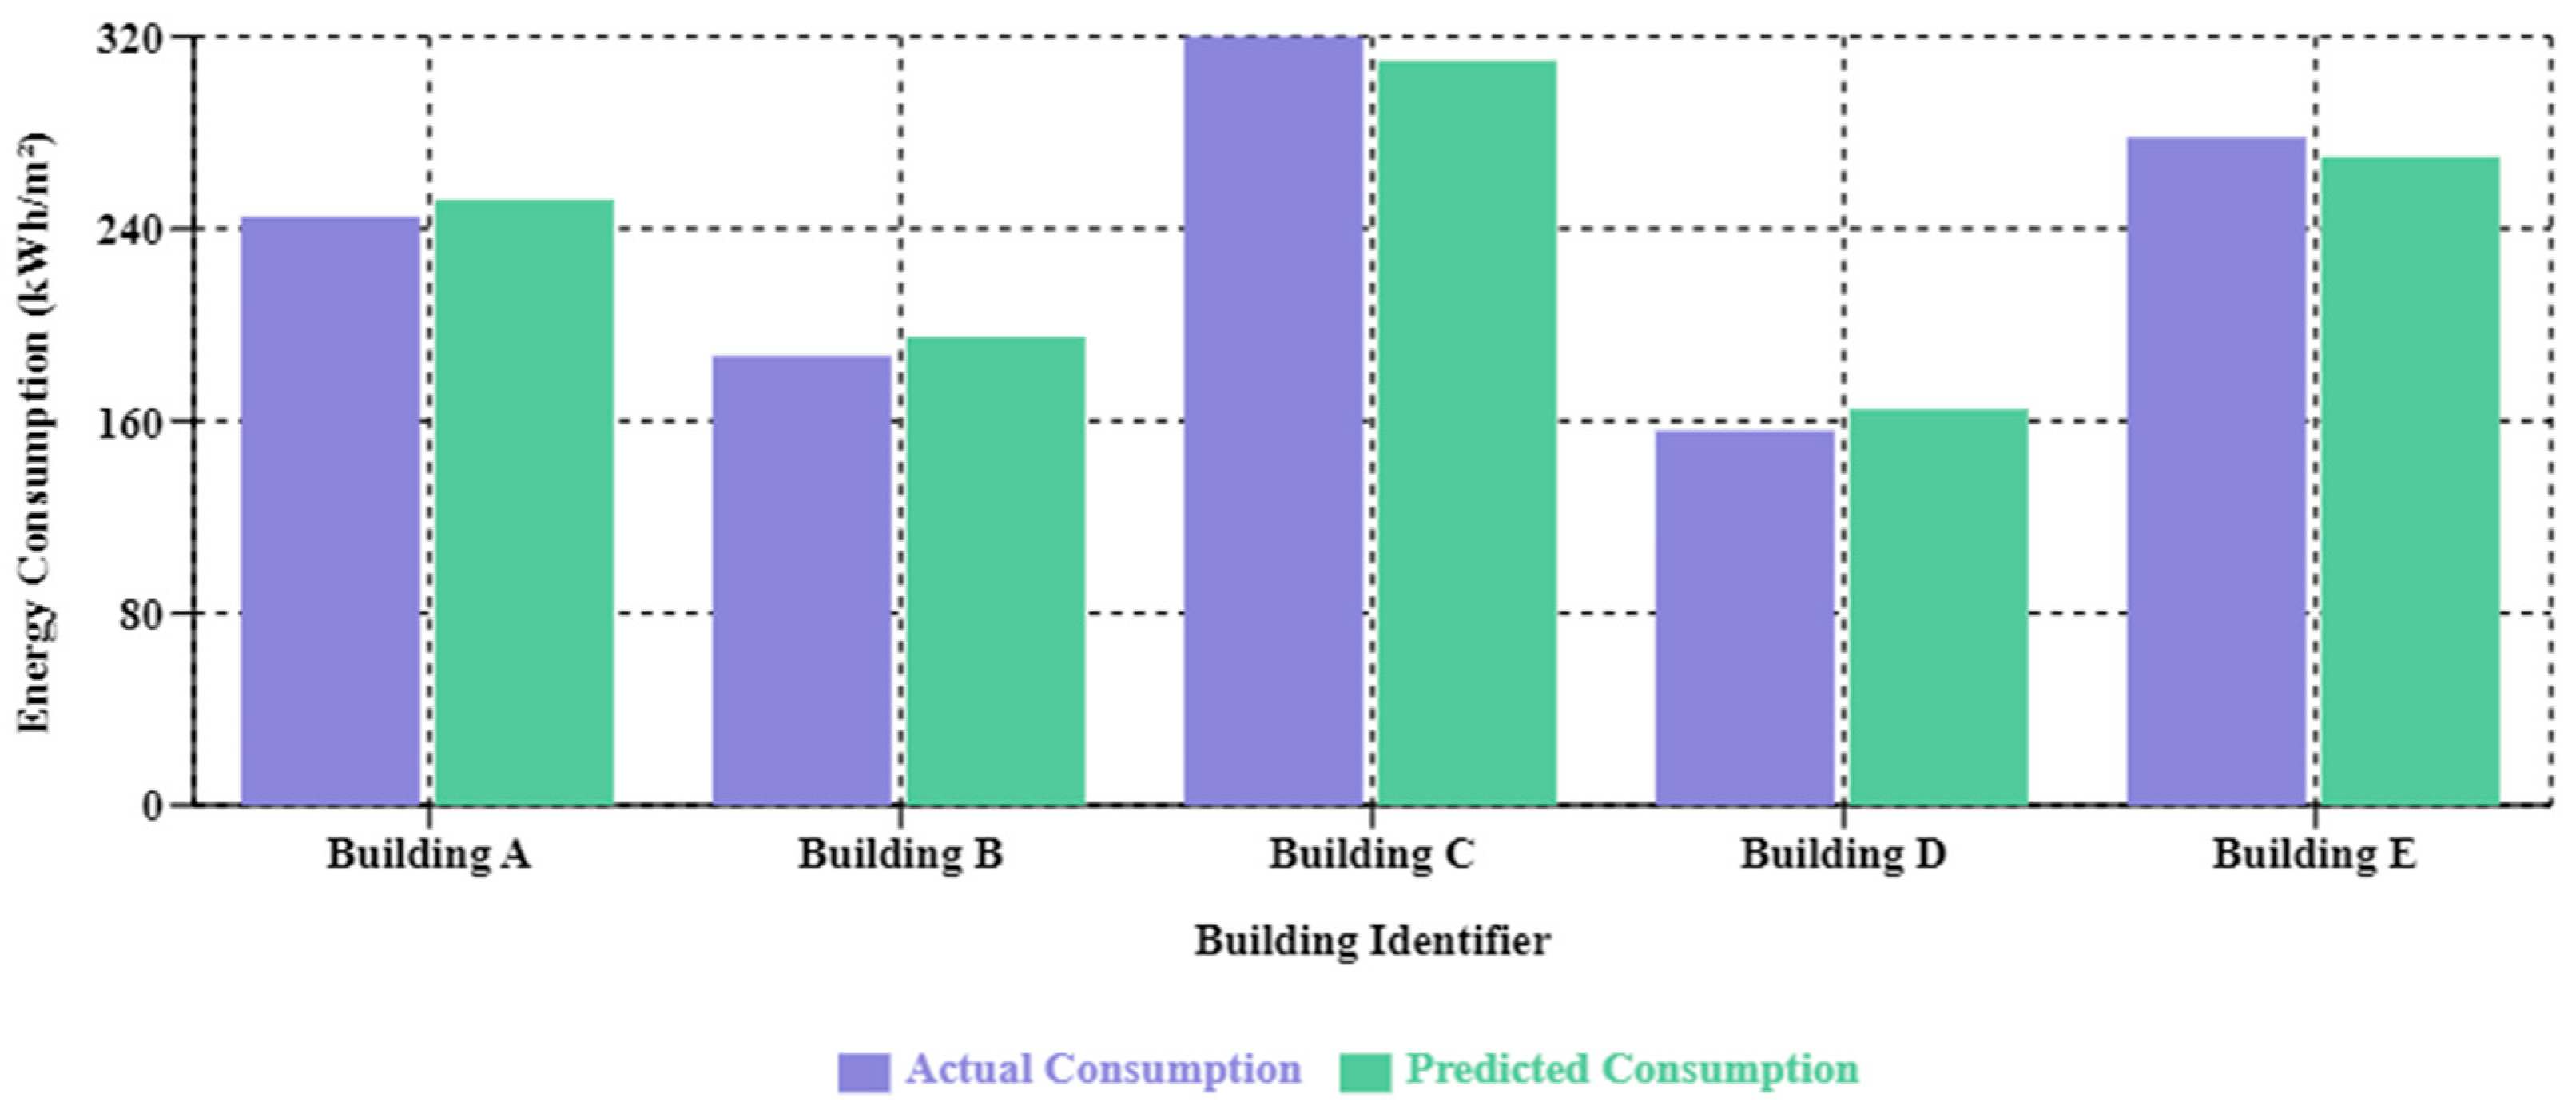
3.2.2. Synthetic Data Validation
3.2.3. Spatial Downscaling Methodology for Climate Projections
- Urban Core Zones: Applied +1.2 °C urban heat island correction to base RCP 8.5 projections
- Coastal Areas: Incorporated maritime temperature moderation (−0.8 °C summer, +0.3 °C winter)
- Suburban Periphery: Used unmodified downscaled projections as baseline reference
3.3. Machine Learning-Based Statistical Analysis
3.3.1. Statistical Validation and Cross-Validation Framework:
- Training: 240 buildings (80%)
- Validation: 30 buildings (10%)
- Testing: 30 buildings (10%)
- 5-fold stratified cross-validation
- Stratification based on building type and size to ensure balanced representation
- Bootstrap sampling (n = 1000) for confidence interval estimation
- R2 (coefficient of determination)
- RMSE (Root Mean Square Error)
- MAE (Mean Absolute Error)
- MAPE (Mean Absolute Percentage Error)
- Permutation tests for feature importance significance
- Bootstrap confidence intervals for model predictions
- Paired t-tests for comparing model performance across building types
3.3.2. Hyperparameter Tuning and Model Optimization
3.3.3. Dataset Integration and Training Protocol
3.4. Comparative Case Analysis of Green and Conventional Buildings
3.5. Policy Effectiveness Evaluation
- Nc = Number of new buildings achieving green certification standards (minimum LEED Gold, BREEAM Very Good, or equivalent local certification) within the assessment period (2020–2024)
- Nt = Total number of newly constructed structures that must adhere to green building regulations and have a gross floor area of more than 2000 m2
- emission reduction rate (%)
- cost-effectiveness (energy saved per monetary unit)
- compliance rate (% of new constructions certified green)
- respective weights assigned based on expert consultation
3.6. Validation and Quality Control
3.6.1. Enhanced Quality Control Measures
3.6.2. Synthetic Data Limitations and Potential Biases
4. Results
4.1. Energy Performance Analysis
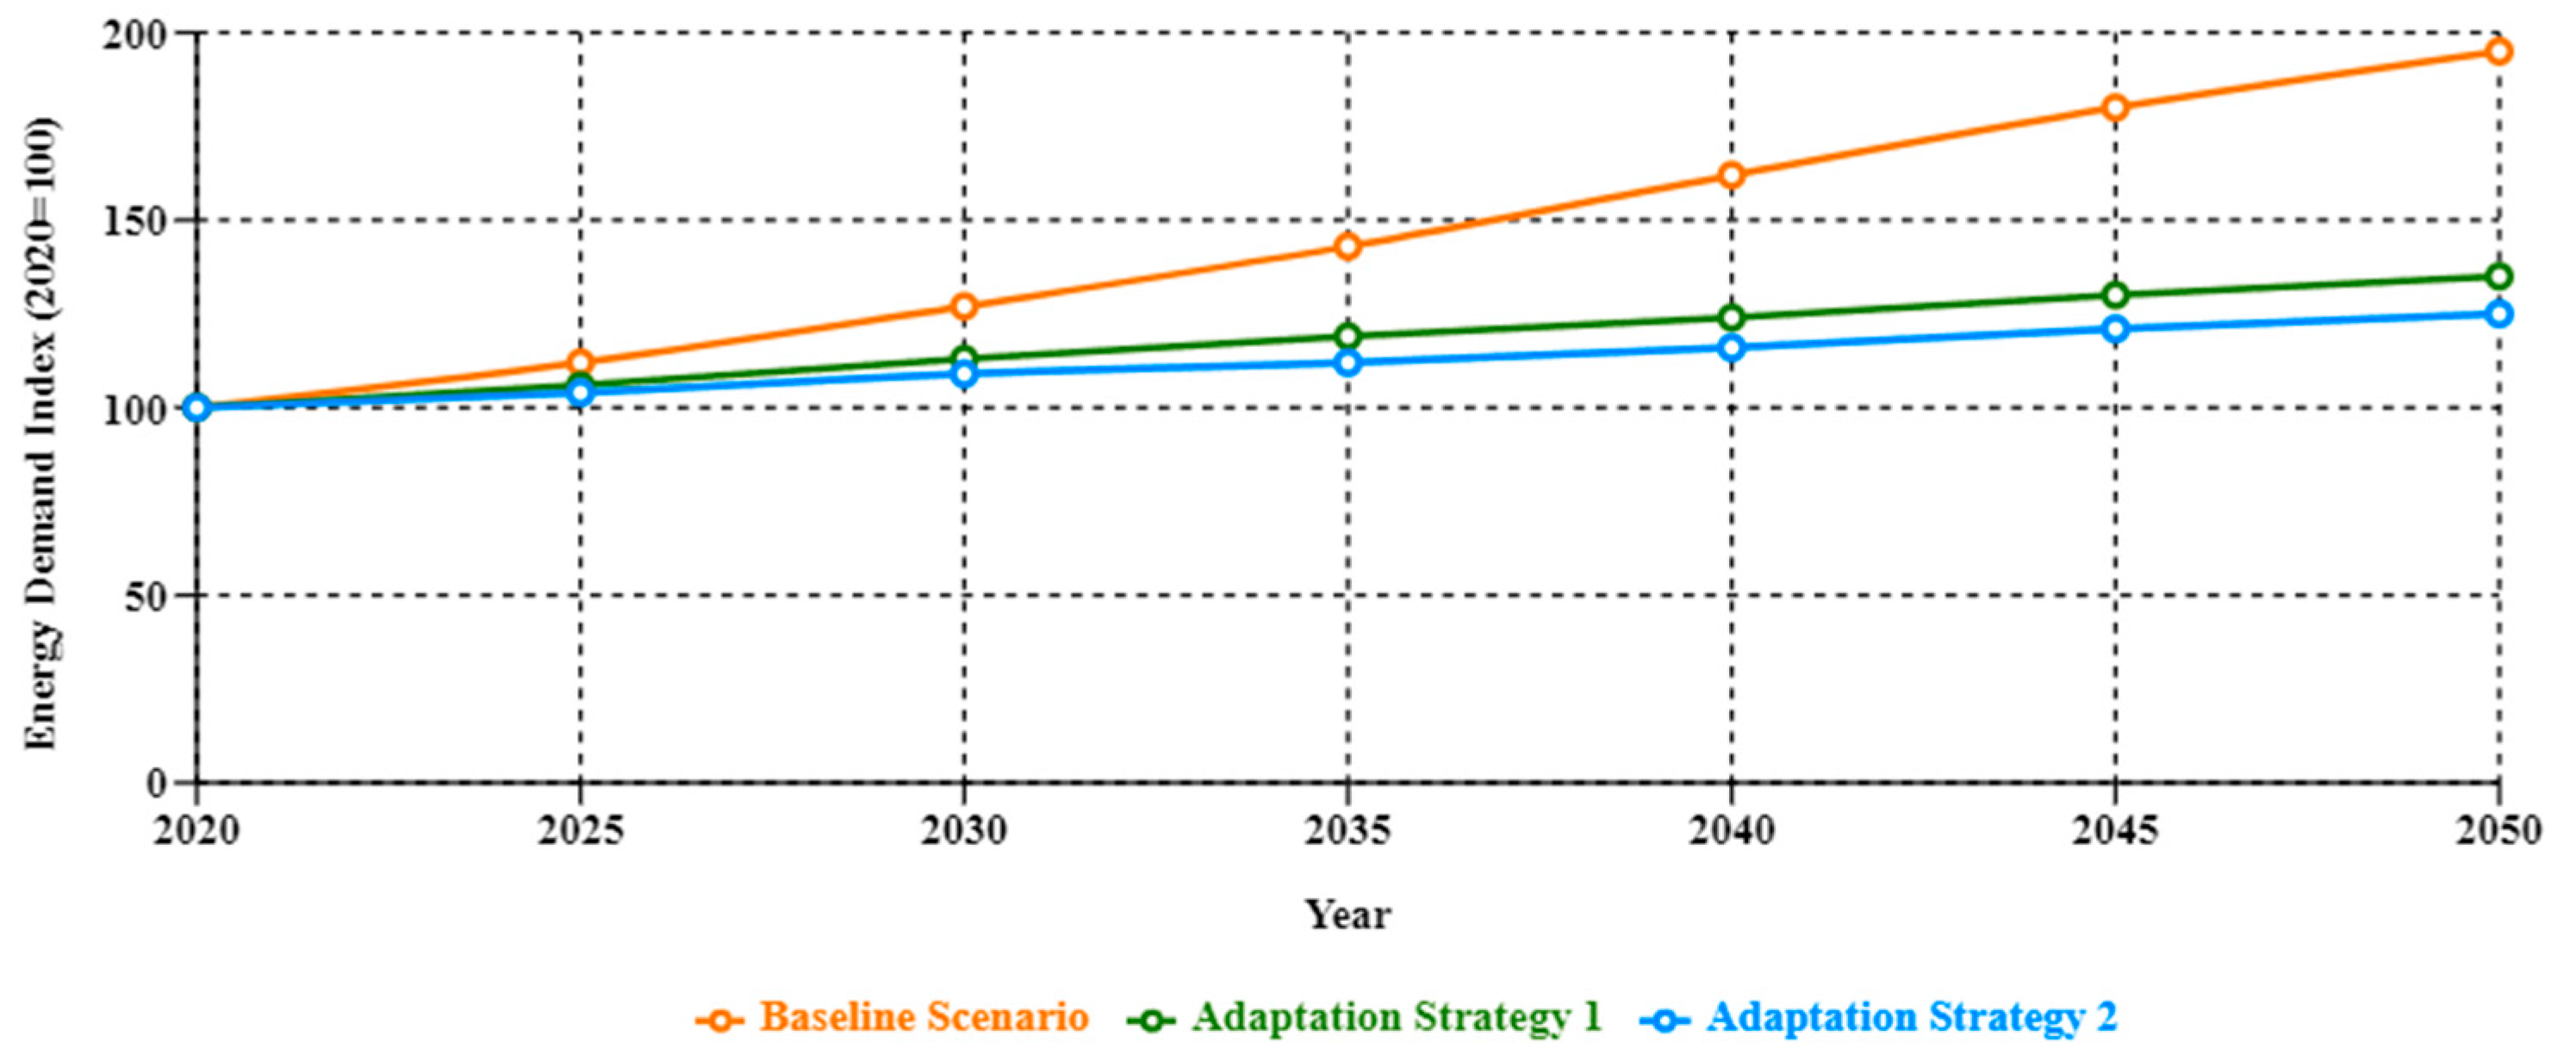
4.2. Climate Adaptability Assessment
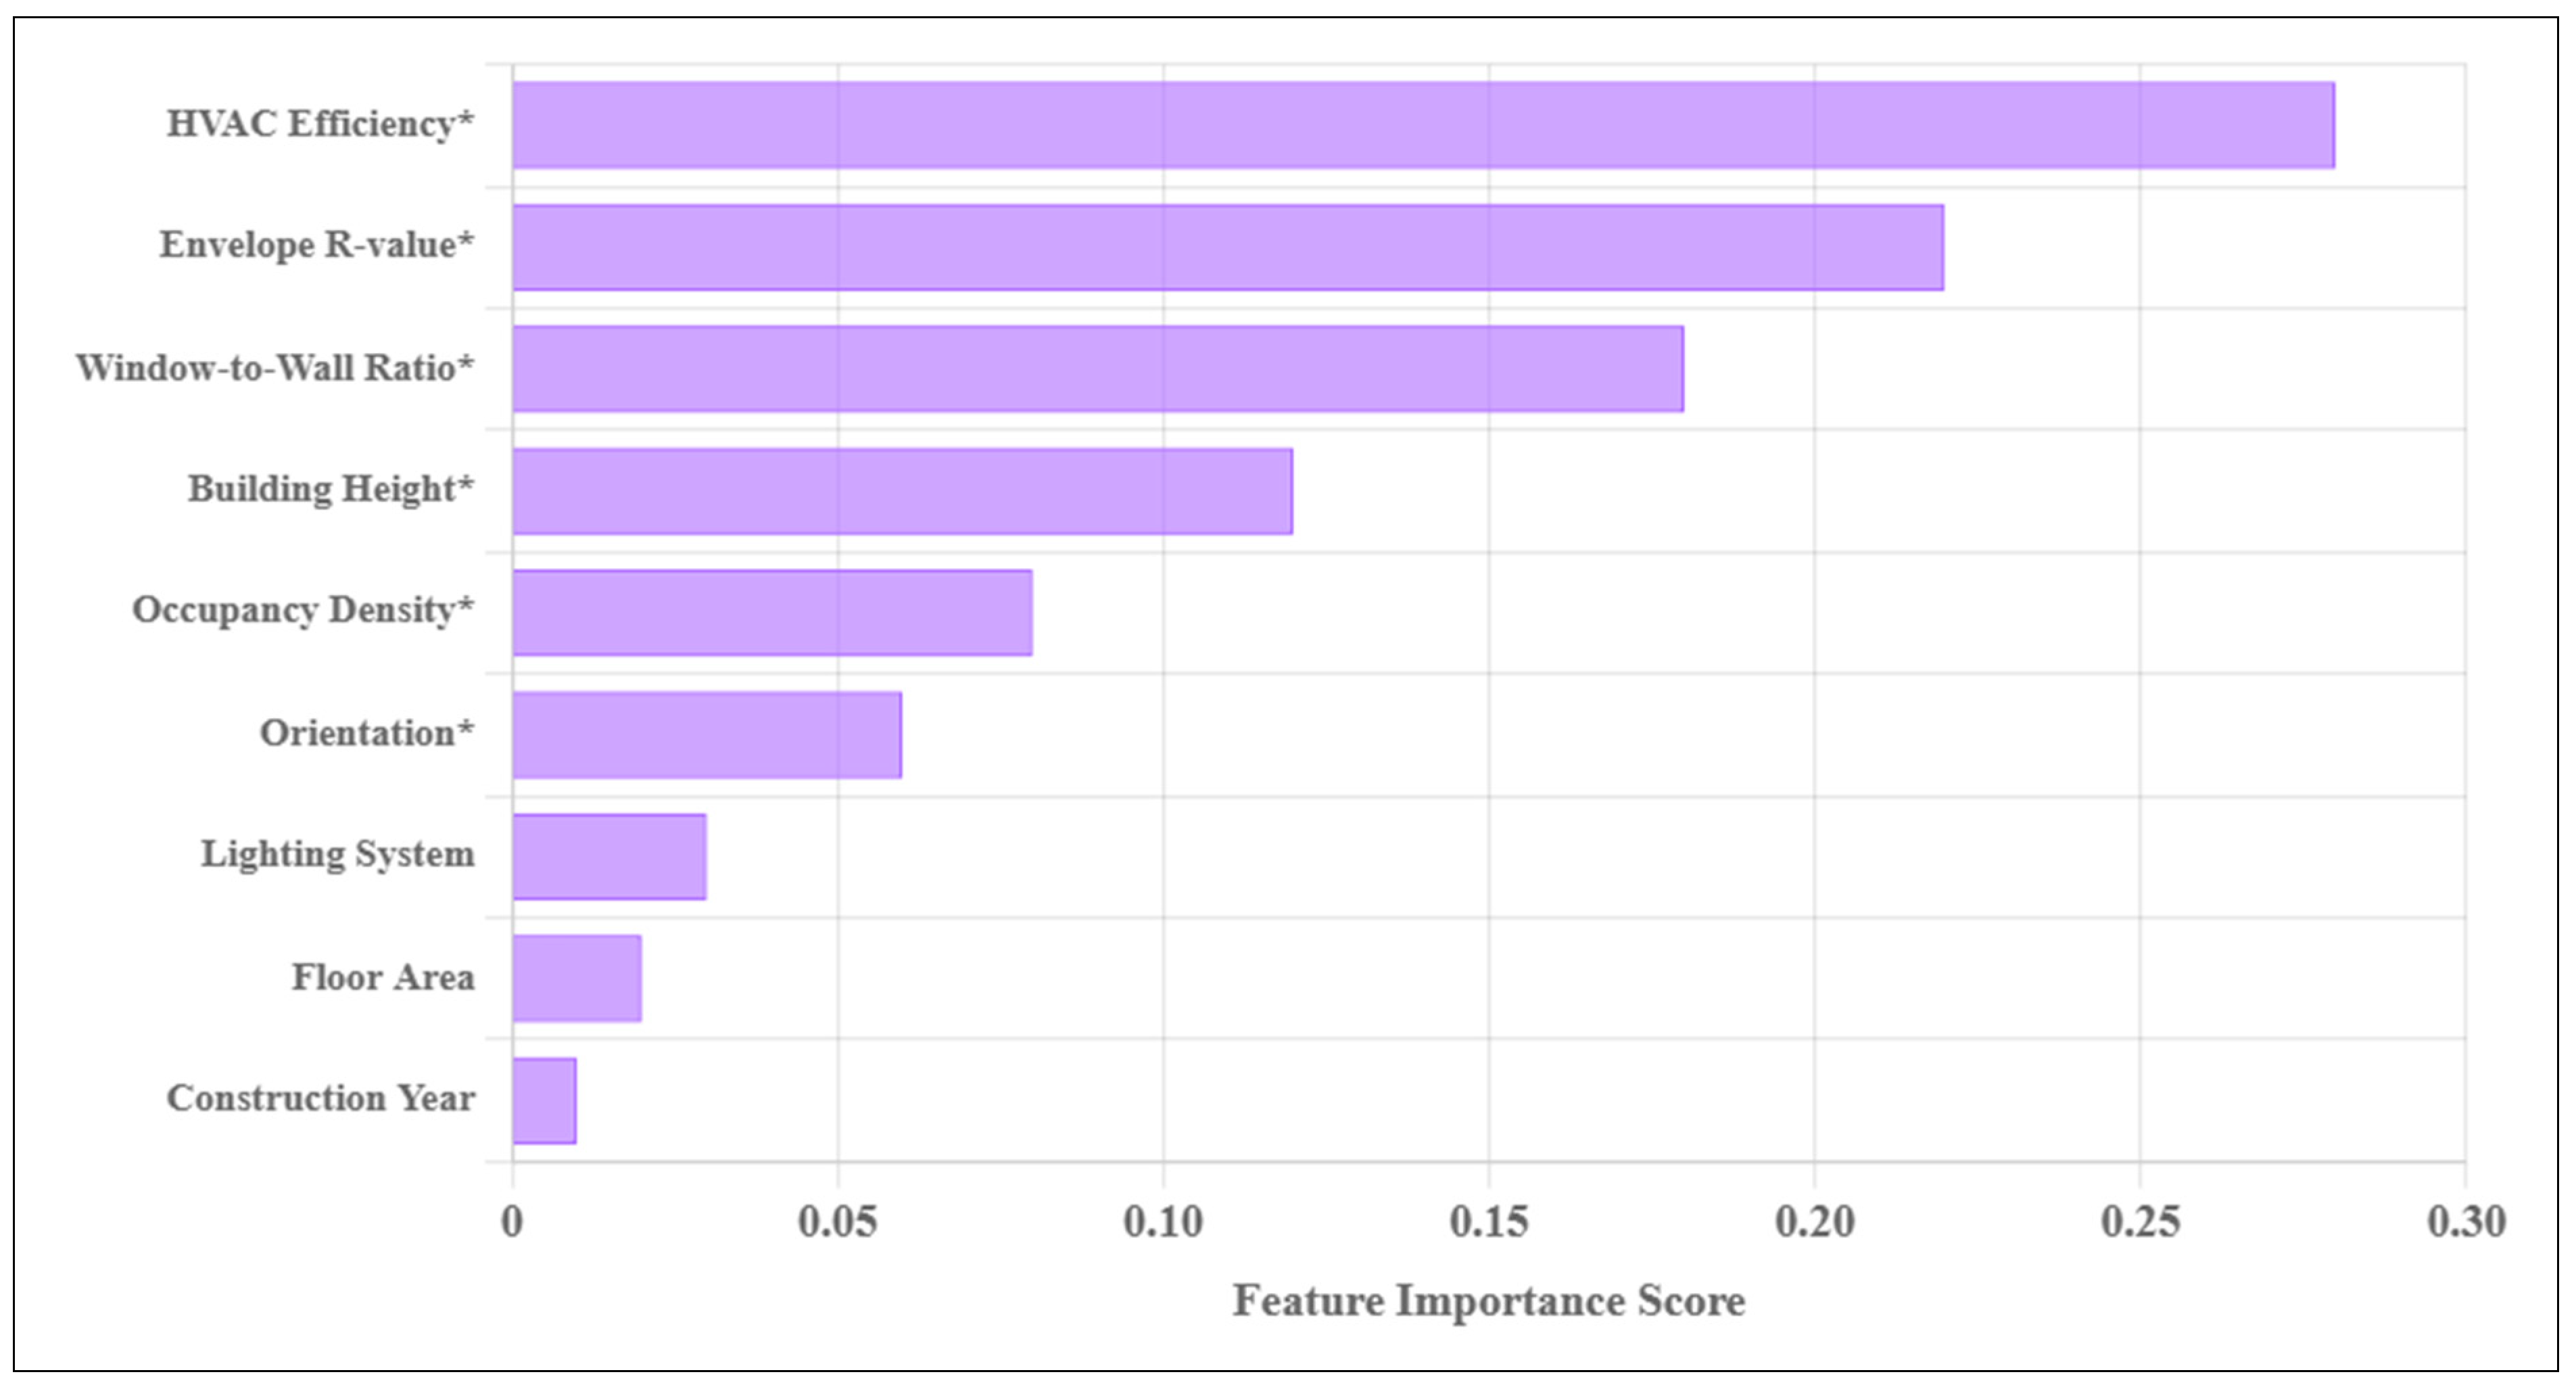
4.3. Machine Learning Model Insights
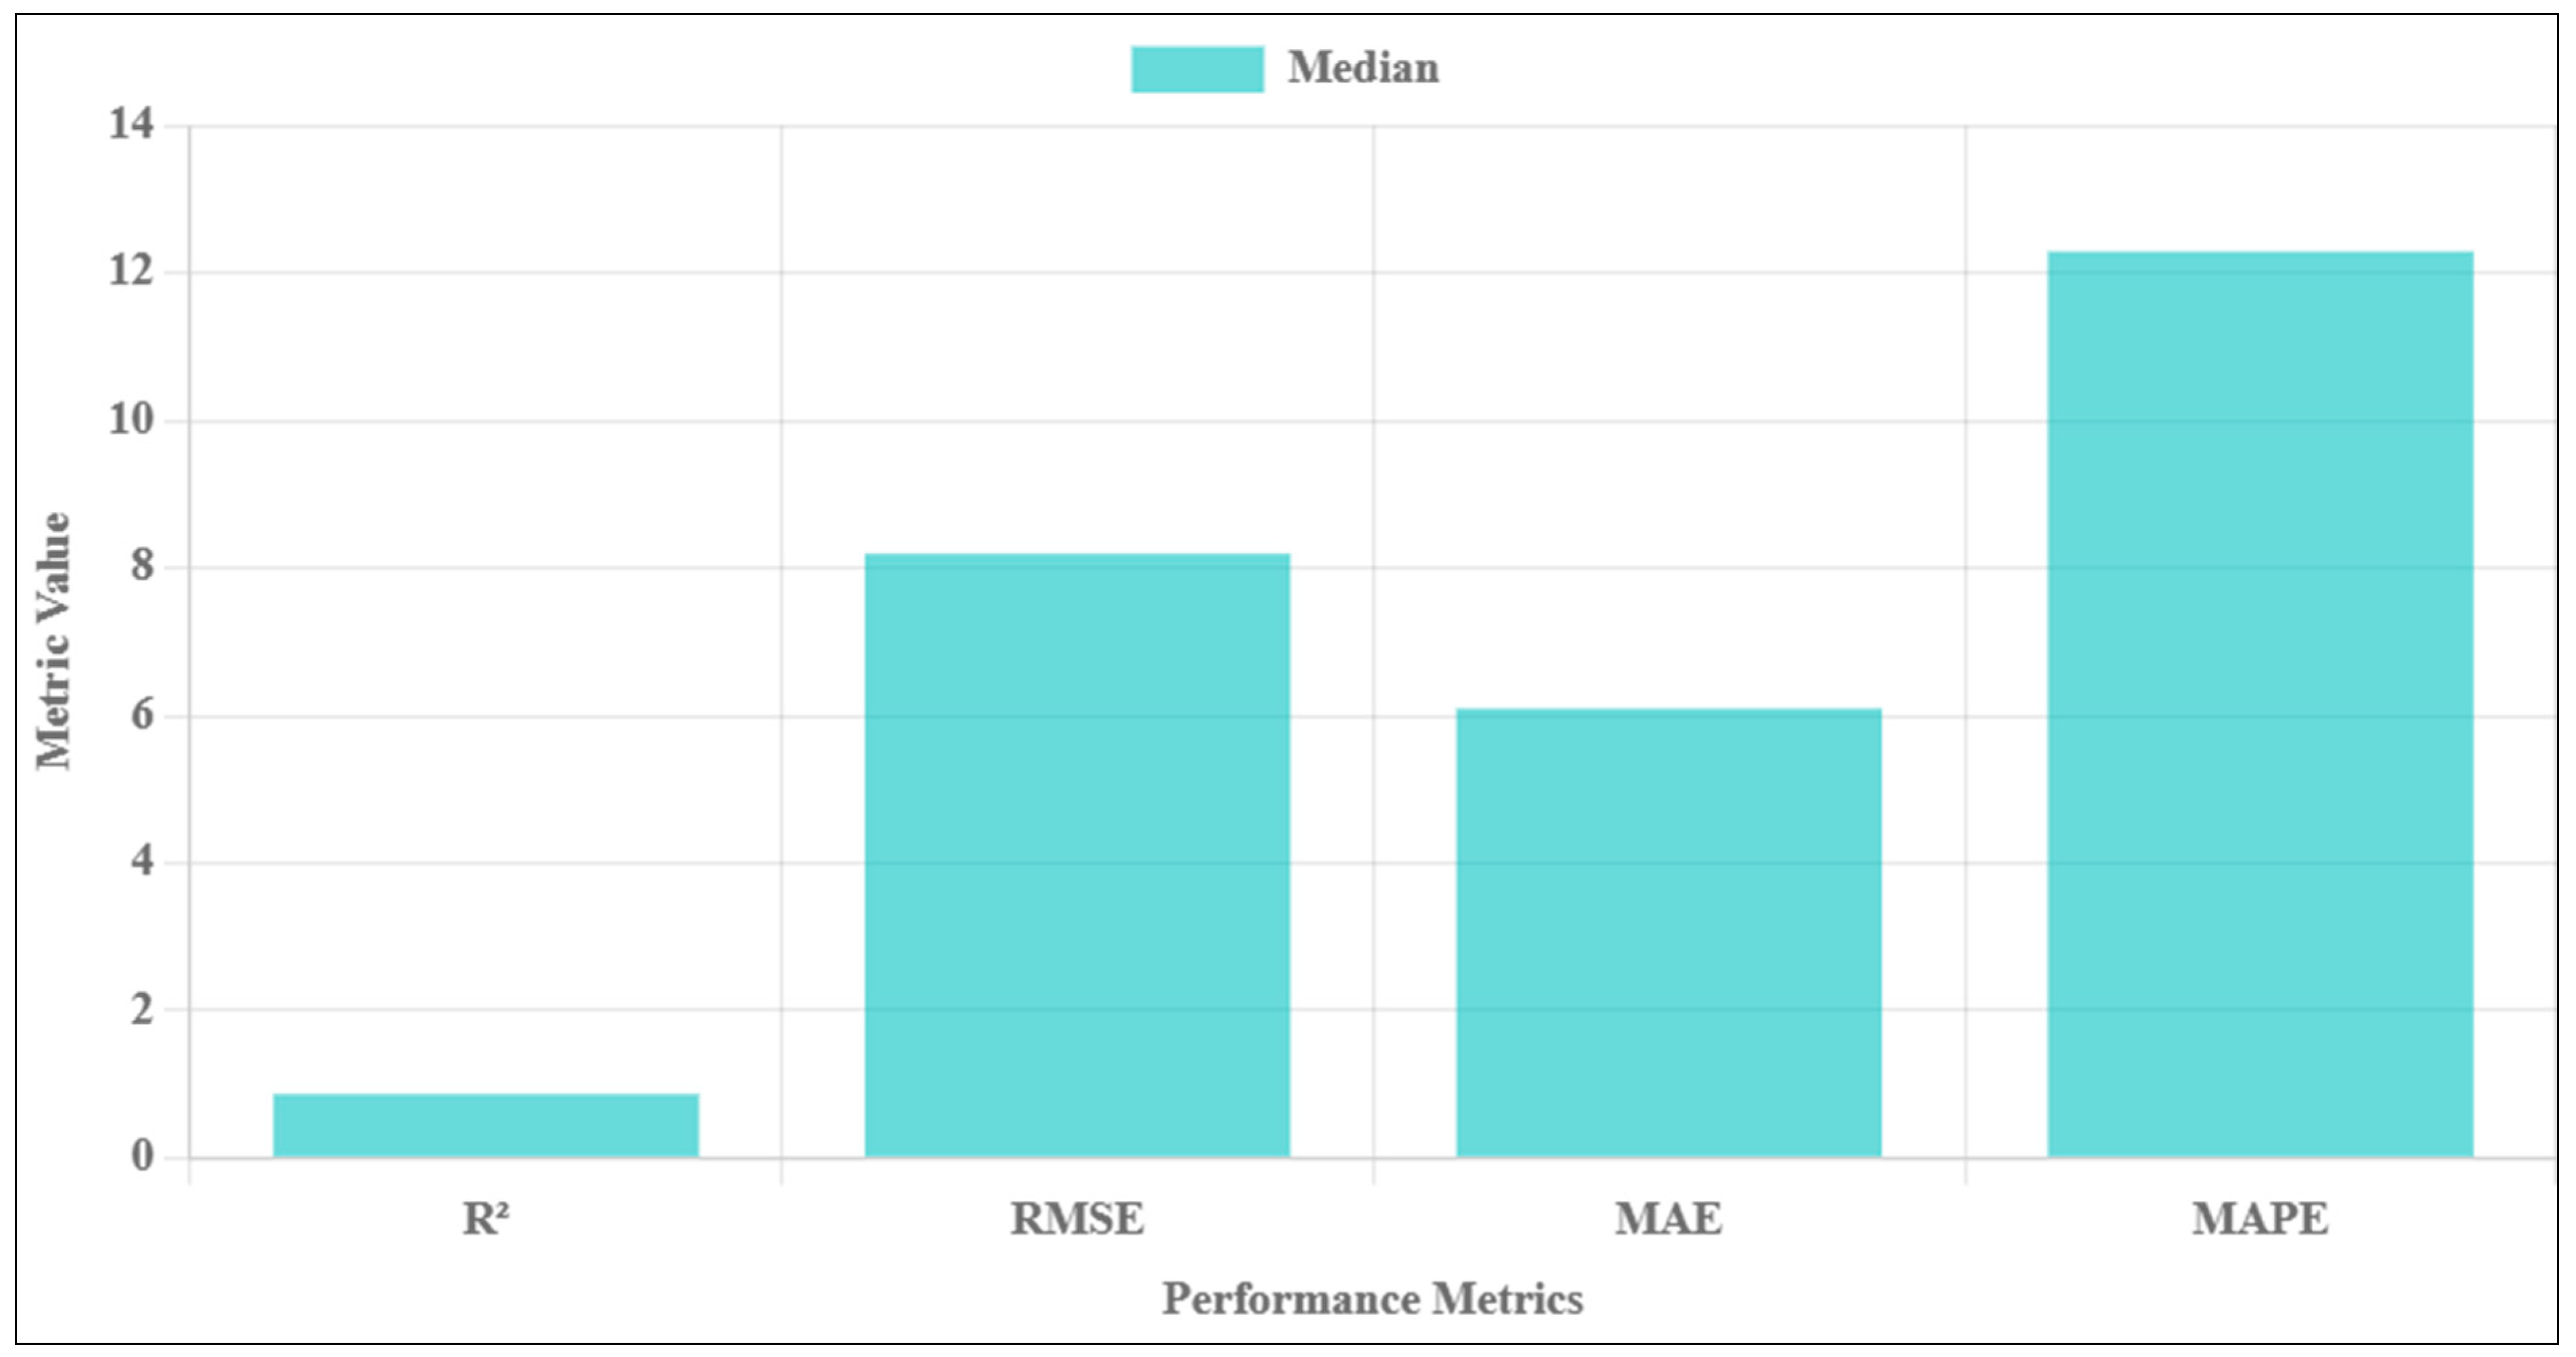
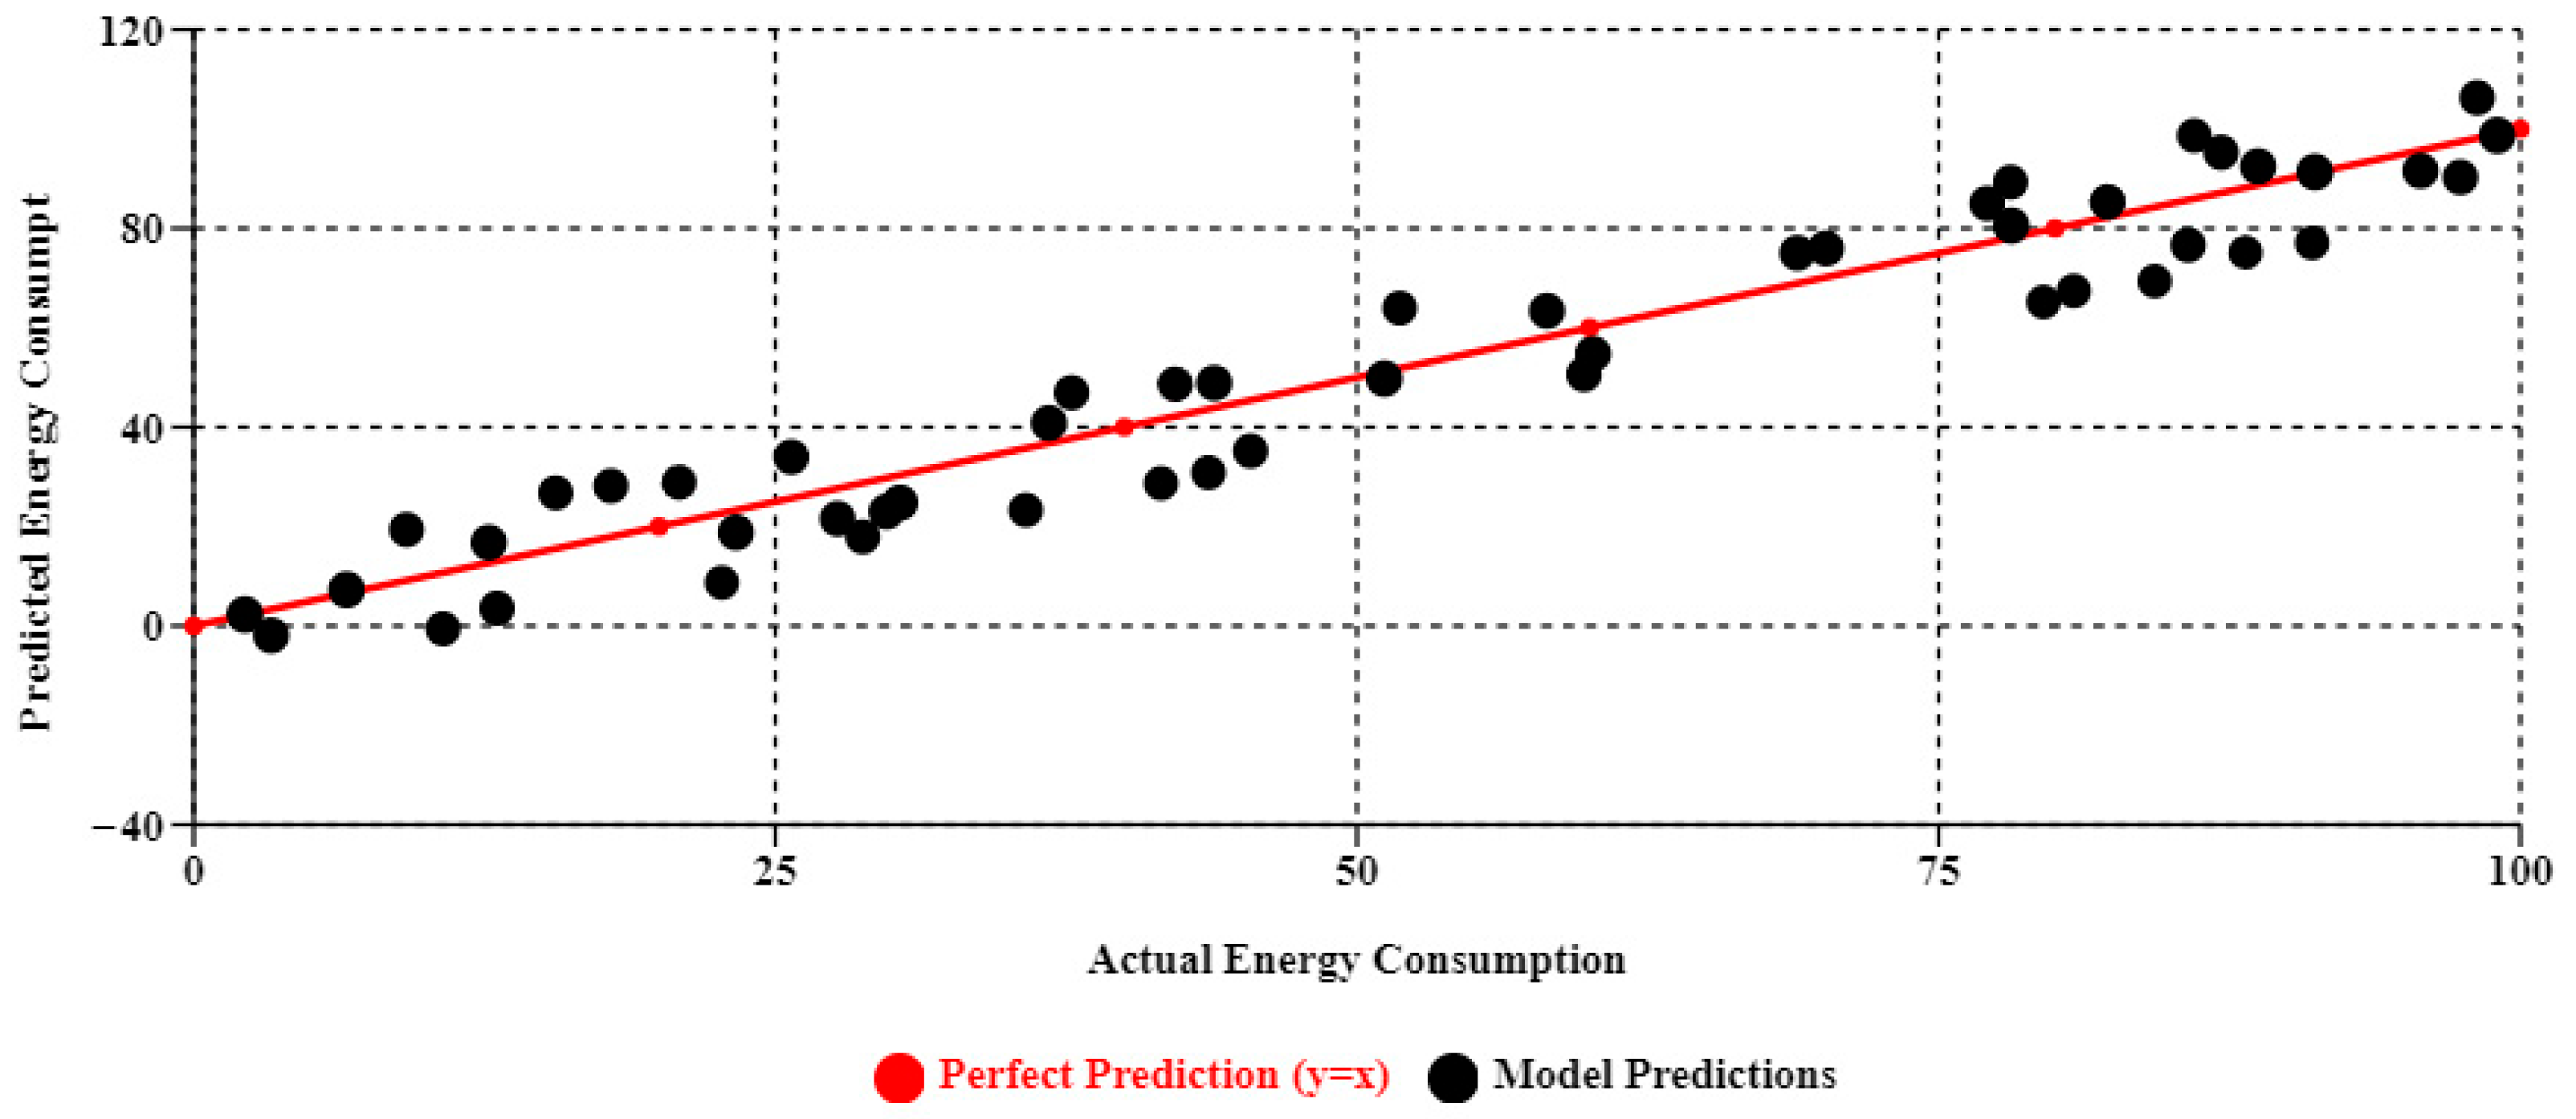
Model Reliability and Statistical Confidence
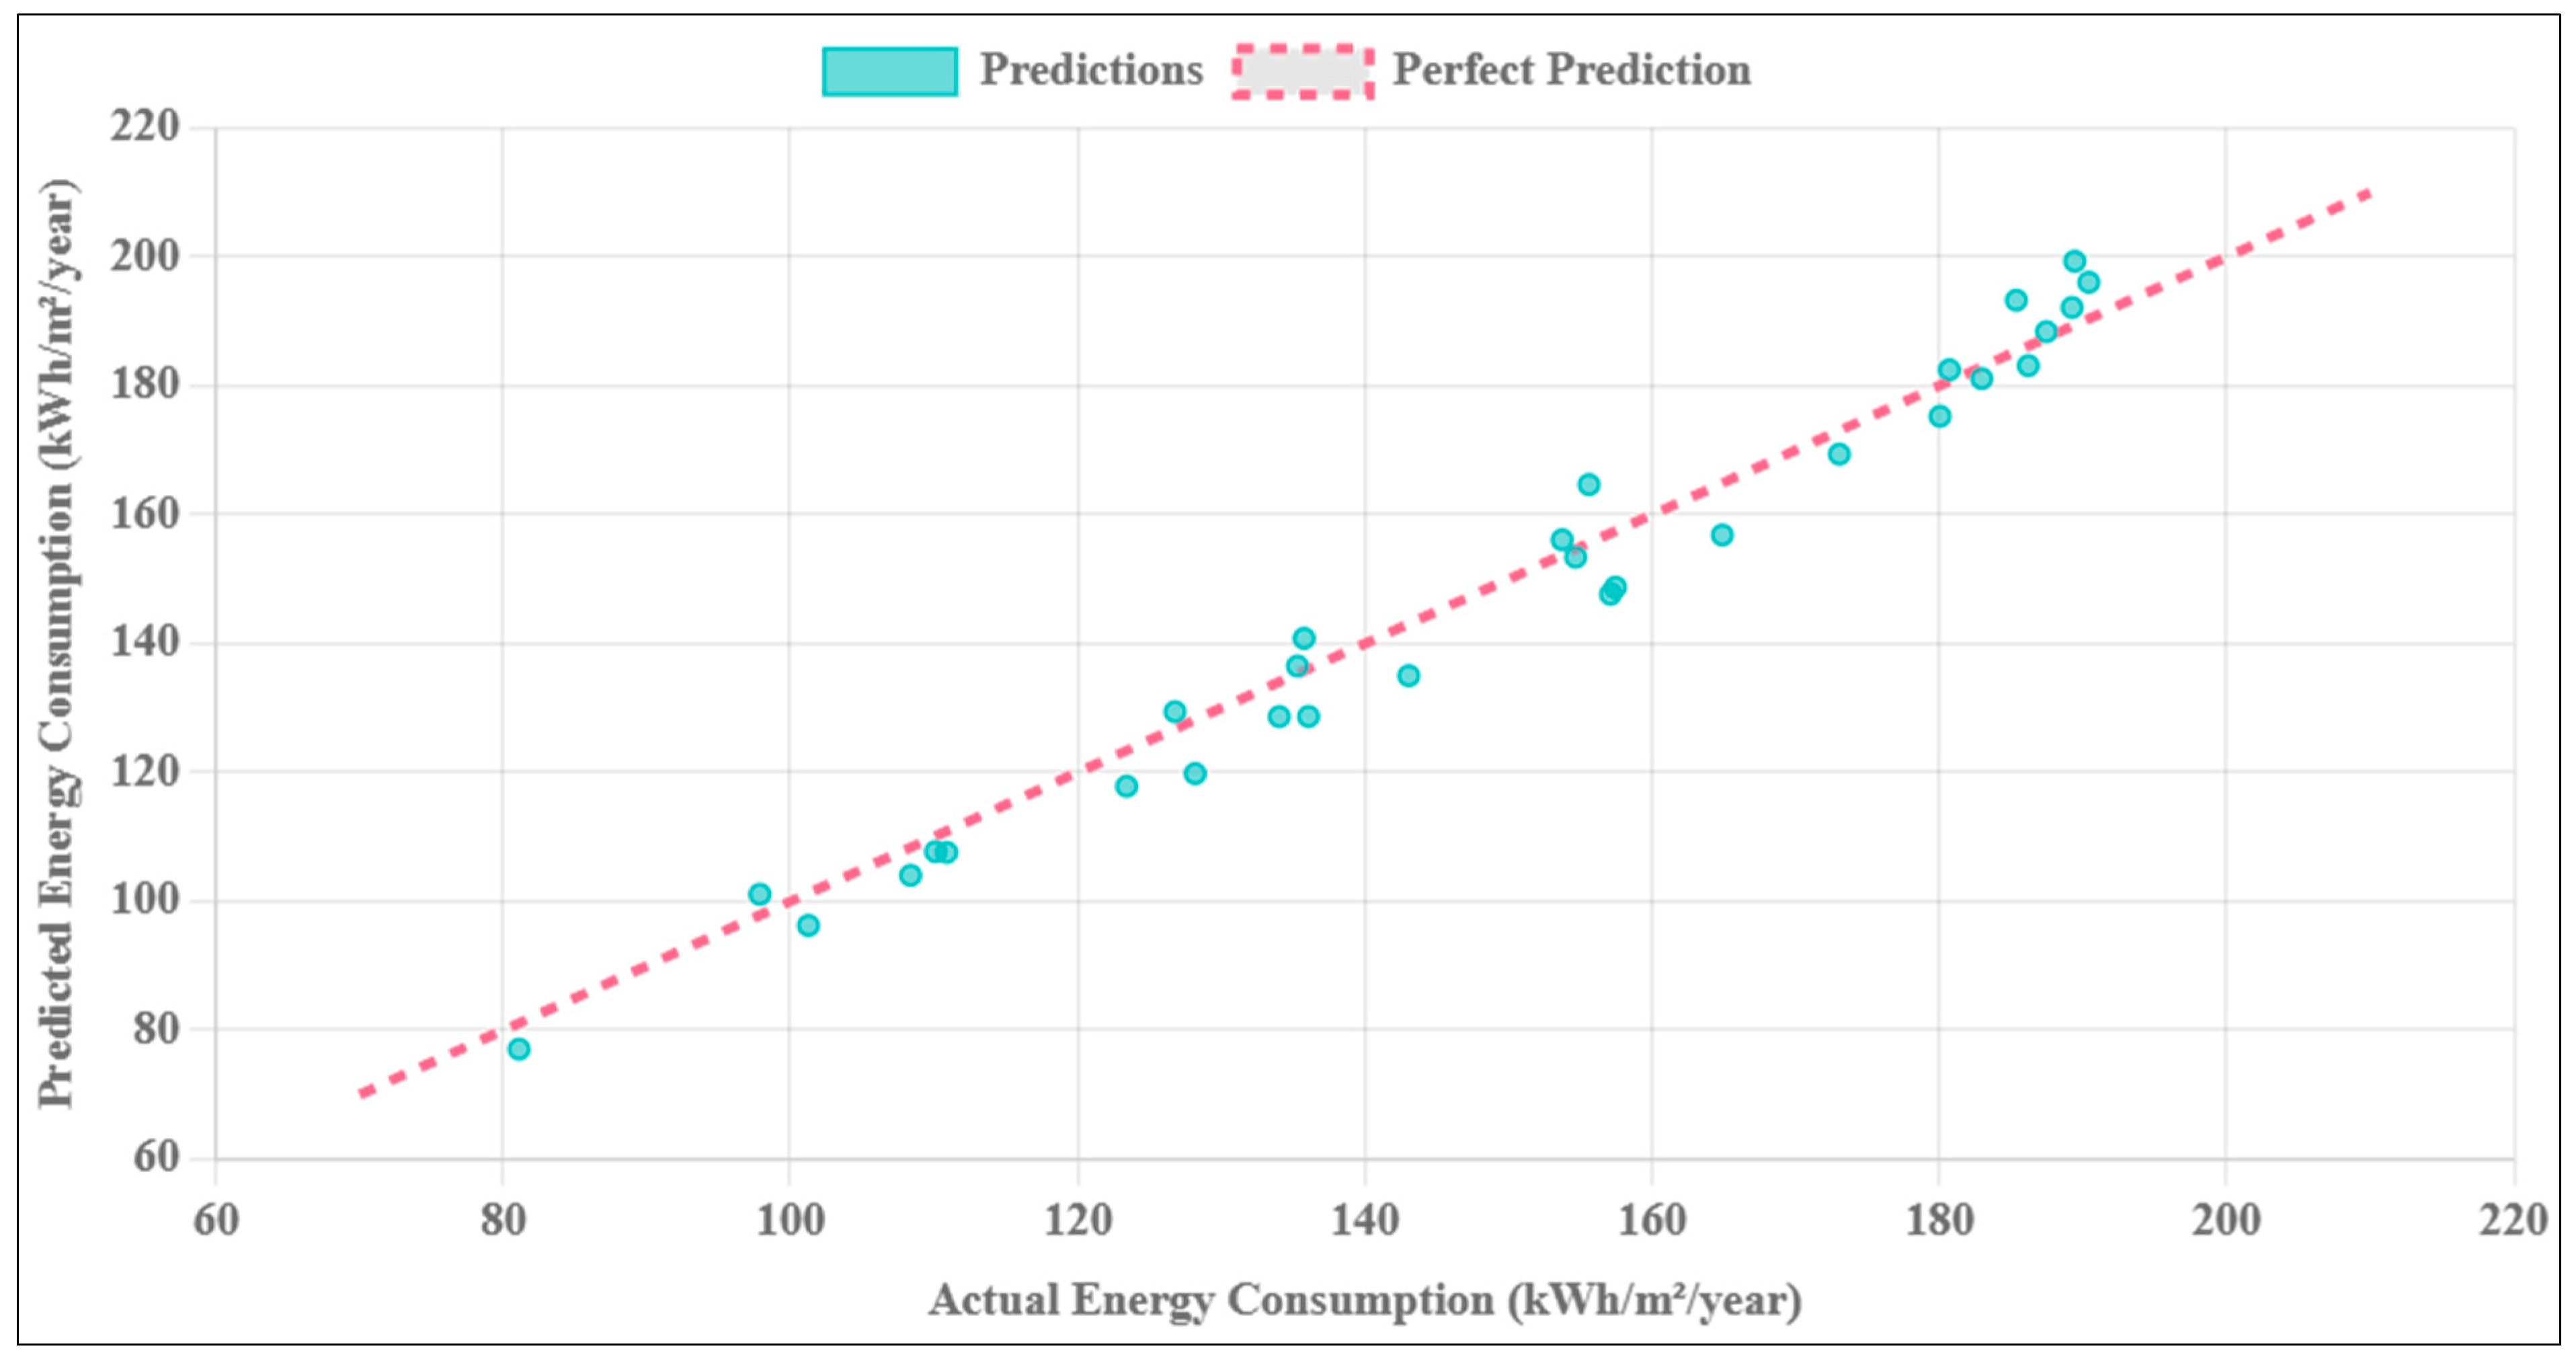
- Cross-validation R2: 0.87 ± 0.03 (95% CI: 0.84–0.90)
- Test set RMSE: 8.2 kWh/m2/year (95% CI: 7.1–9.4)
- Feature importance stability: Correlation coefficient > 0.85 across all CV folds
4.4. Carbon Footprint Evaluation
4.5. Policy Implication Analysis
4.6. Policy-Performance Correlation Analysis
4.6.1. Direct Performance-Policy Linkages
4.6.2. Policy Impact Quantification
4.6.3. Economic Factor Control Analysis
5. Discussion
5.1. Evidence-Based Policy Optimization Recommendations
5.2. Economic Validation Through Performance Measurement
6. Conclusions
Author Contributions
Funding
Data Availability Statement
Conflicts of Interest
References
- Wang, Y.; Guo, C.H.; Chen, X.J.; Jia, L.Q.; Guo, X.N.; Chen, R.S.; Zhang, M.-S.; Chen, Z.-Y.; Wang, H.D. Carbon peak and carbon neutrality in China: Goals, implementation path and prospects. China Geol. 2021, 4, 720–746. [Google Scholar] [CrossRef]
- He, J.K. Global low-carbon transition and China’s response strategies. Adv. Clim. Change Res. 2016, 7, 204–212. [Google Scholar] [CrossRef]
- Luo, J.; Yu, J. Facing the policy challenges of climate change: Assessing China’s strategy and actions in international environmental crisis communication. Commun. Humanit. Res. 2024, 33, 205–212. [Google Scholar] [CrossRef]
- Kuhn, B.M. China’s commitment to the sustainable development goals: An analysis of push and pull factors and implementation challenges. Chin. Political Sci. Rev. 2018, 3, 359–388. [Google Scholar] [CrossRef]
- Zhou, Y.; Li, K.; Liang, S.; Zeng, X.; Cai, Y.; Meng, J.; Shan, Y.; Guan, D.; Yang, Z. Trends, drivers, and mitigation of CO2 emissions in the guangdong–hong kong–macao greater bay area. Engineering 2023, 23, 138–148. [Google Scholar] [CrossRef]
- Wang, R.; Ren, C.; Liao, C.; Huang, Y.; Liu, Z.; Cai, M. Sectoral carbon emission prediction and spatial modeling framework: A local climate zone-based case study of the Guangdong-Hong Kong-Macao Greater Bay Area. Sustain. Cities Soc. 2024, 114, 105756. [Google Scholar] [CrossRef]
- Wang, F.; Harindintwali, J.D.; Yuan, Z.; Wang, M.; Wang, F.; Li, S.; Yin, Z.; Huang, L.; Fu, Y.; Chen, J.M. Technologies and perspectives for achieving carbon neutrality. Innovation 2021, 2, 100180. [Google Scholar] [CrossRef]
- Zhao, C.; Ju, S.; Xue, Y.; Ren, T.; Ji, Y.; Chen, X. China’s energy transitions for carbon neutrality: Challenges and opportunities. Carbon Neutrality 2022, 1, 7. [Google Scholar] [CrossRef]
- Zhang, D.; Wang, J.; Lin, Y.; Si, Y.; Huang, C.; Yang, J.; Huang, B.; Li, W. Present situation and future prospect of renewable energy in China. Renew. Sustain. Energy Rev. 2017, 76, 865–871. [Google Scholar] [CrossRef]
- Awadh, O. Sustainability and green building rating systems: LEED, BREEAM, GSAS and Estidama critical analysis. J. Build. Eng. 2017, 11, 25–29. [Google Scholar] [CrossRef]
- Zhang, Y.; Bai, X.; Mills, F.P.; Pezzey, J.C. Rethinking the role of occupant behavior in building energy performance: A review. Energy Build. 2018, 172, 279–294. [Google Scholar] [CrossRef]
- Fang, G. Typhoon Wind Modeling and Flutter Fragility Analysis of Long-Span Bridges in Coastal Regions of China. Ph.D. Thesis, Clemson University, Clemson, SC, USA, 2019. [Google Scholar]
- Wang, Z.; Xiao, Z.; Tam, C.Y.; Pan, W.; Chen, J.; Hu, C.; Ren, C.; Wei, W.; Yang, S. The projected effects of urbanization and climate change on summer thermal environment in Guangdong-Hong Kong-Macao Greater Bay Area of China. Urban Clim. 2021, 37, 100866. [Google Scholar] [CrossRef]
- Zhou, S.; Li, M.; Xie, J. Evaluating urban–rural gradients and urban forms in metropolitan areas: A local climate zone approach with future spatial simulation. Sustain. Cities Soc. 2024, 112, 105636. [Google Scholar] [CrossRef]
- Liu, Y.; Li, S.; Wang, Y.; Zhang, T.; Peng, J.; Li, T. Identification of multiple climatic extremes in metropolis: A comparison of Guangzhou and Shenzhen, China. Nat. Hazards 2015, 79, 939–953. [Google Scholar] [CrossRef]
- Oh, J.H.; Kim, S.S. Prefabricated Envelope Green Remodeling Potential of Public Office Buildings in Korea. Buildings 2024, 14, 2182. [Google Scholar] [CrossRef]
- Bibri, S.E.; Krogstie, J. Environmentally data-driven smart sustainable cities: Applied innovative solutions for energy efficiency, pollution reduction, and urban metabolism. Energy Inform. 2020, 3, 29. [Google Scholar] [CrossRef]
- Orikpete, O.F.; Ikemba, S.; Ewim, D.R.E. Integration of renewable energy technologies in smart building design for enhanced energy efficiency and self-sufficiency. J. Eng. Exact Sci. 2023, 9, 16423-01e. [Google Scholar] [CrossRef]
- Wang, Y.; Yao, Y.; Chen, S.; Ni, Z.; Xia, B. Spatiotemporal evolution of urban development and surface urban heat island in Guangdong-Hong Kong-Macau greater bay area of China from 2013 to 2019. Resour. Conserv. Recycl. 2022, 179, 106063. [Google Scholar] [CrossRef]
- Duarte, C.; Raftery, P.; Schiavon, S. Development of whole-building energy models for detailed energy insights of a large office building with green certification rating in singapore. Energy Technol. 2018, 6, 84–93. [Google Scholar] [CrossRef]
- Li, L.; Chan, P.W.; Deng, T.; Yang, H.L.; Luo, H.Y.; Xia, D.; He, Y.Q. Review of advances in urban climate study in the Guangdong-Hong Kong-Macau greater bay area, China. Atmos. Res. 2021, 261, 105759. [Google Scholar] [CrossRef]
- Liang, H.; Bian, X.; Dong, L. Towards net zero carbon buildings: Accounting the building embodied carbon and life cycle-based policy design for Greater Bay Area, China. Geosci. Front. 2024, 15, 101760. [Google Scholar] [CrossRef]
- Patchell, J. China’s Greater Bay Area: Agglomeration, External Economies, Governance and Urbanization; Routledge: Oxfordshire, UK, 2023. [Google Scholar]
- Han, T.; Huang, Q.; Zhang, A.; Zhang, Q. Simulation-based decision support tools in the early design stages of a green building—A review. Sustainability 2018, 10, 3696. [Google Scholar] [CrossRef]
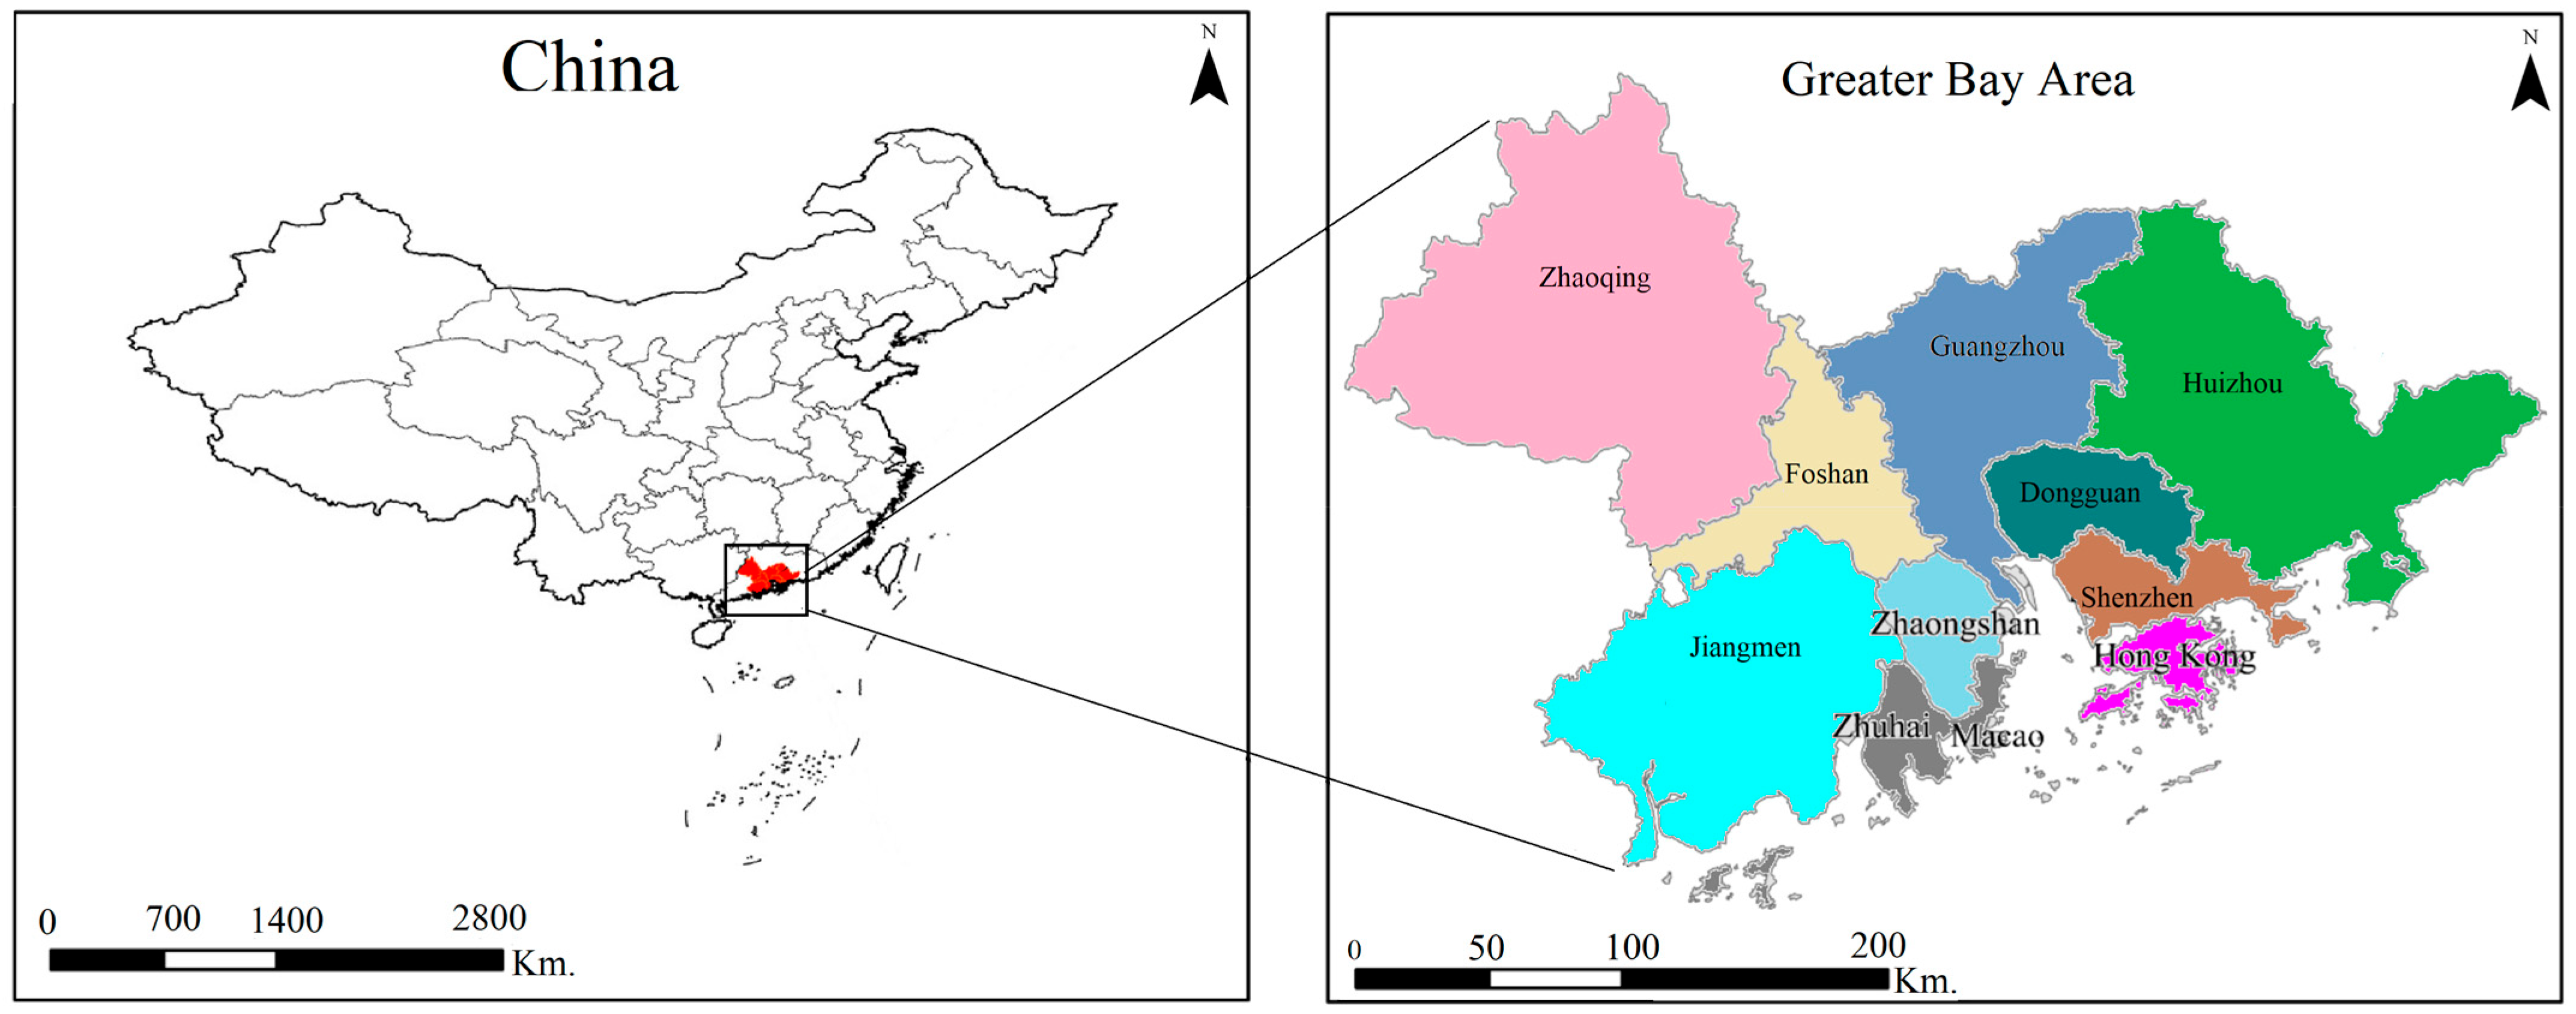


| City/Region | Population (Million, 2023) | Land Area (km2) | GDP (USD Billion, 2023) | Population Density (Per km2) | Urbanization Rate (%) |
|---|---|---|---|---|---|
| Hong Kong | 7.4 | 1110 | 368.6 | 6659 | 100 |
| Macau | 0.7 | 33 | 38.1 | 21,212 | 100 |
| Guangzhou | 18.7 | 7434 | 422.3 | 2515 | 86.3 |
| Shenzhen | 17.7 | 1997 | 475.7 | 8863 | 100 |
| Zhuhai | 2.5 | 1736 | 50.6 | 1440 | 93.2 |
| Foshan | 9.5 | 3798 | 172.1 | 2501 | 95.1 |
| Huizhou | 6.1 | 11,347 | 74.5 | 537 | 74.6 |
| Dongguan | 10.5 | 2460 | 157.3 | 4268 | 91.2 |
| Zhongshan | 4.5 | 1784 | 58.9 | 2522 | 95.3 |
| Jiangmen | 4.8 | 9505 | 54.2 | 505 | 71.4 |
| Zhaoqing | 4.2 | 14,891 | 40.6 | 282 | 65.2 |
| GBA Total | 86.6 | 56,095 | 1912.9 | 1544 | 88.7 |
| Building Type | Green Buildings | Conventional Buildings | Total | Balance Ratio | Construction Period | Size Range (m2) |
|---|---|---|---|---|---|---|
| High-rise Office | 6 | 6 | 12 | 1:1 | 2015–2024 | 8000–25,000 |
| Mid-rise Office | 4 | 4 | 8 | 1:1 | 2012–2022 | 3000–12,000 |
| Residential Tower | 3 | 3 | 6 | 1:1 | 2014–2023 | 15,000–45,000 |
| Mixed-Use | 2 | 2 | 4 | 1:1 | 2016–2024 | 10,000–30,000 |
| Institutional | 1 | 1 | 2 | 1:1 | 2018–2020 | 5000–8000 |
| Building Type | Location | Mean EUI (kWh/m2/year) | Standard Deviation | Sample Size (n) |
|---|---|---|---|---|
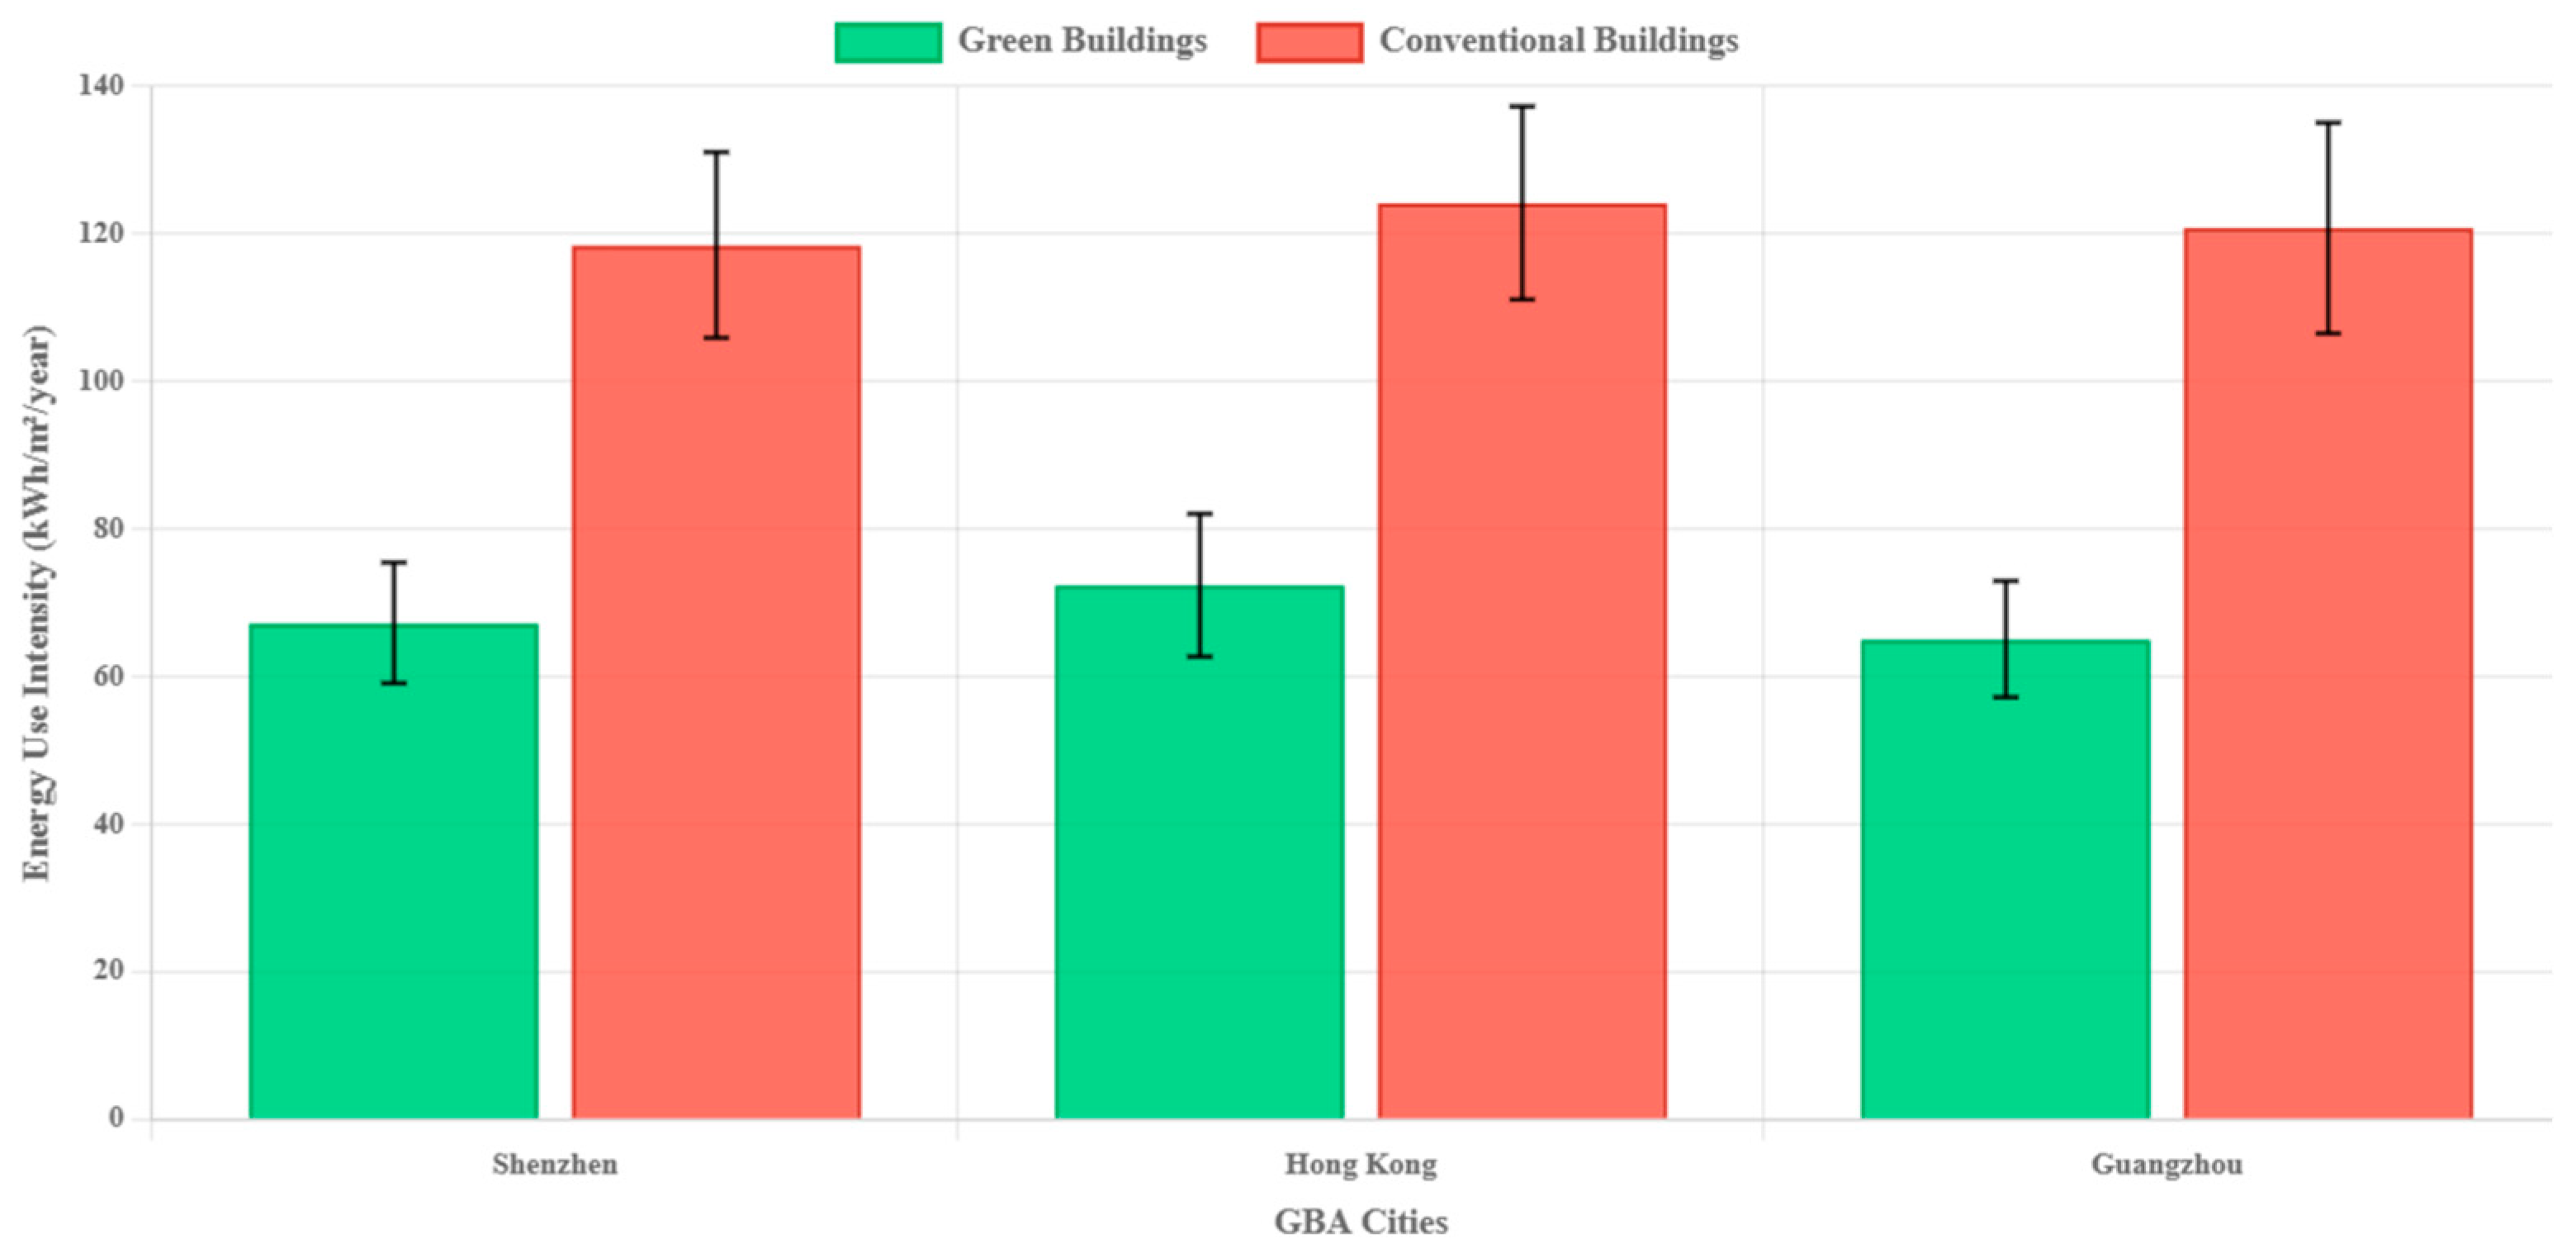
| Green Office | Shenzhen | 67.3 | 8.2 | 7 |
| Conventional Office | Shenzhen | 118.5 | 12.6 | 6 |
| Green Office | Hong Kong | 72.4 | 9.7 | 5 |
| Conventional Office | Hong Kong | 124.2 | 13.1 | 4 |
| Green Office | Guangzhou | 65.1 | 7.9 | 6 |
| Conventional Office | Guangzhou | 120.8 | 14.3 | 4 |
| Building Type | Current TMY | 2030 (RCP 4.5) | 2030 (RCP 8.5) | 2050 (RCP 4.5) | 2050 (RCP 8.5) |
|---|---|---|---|---|---|
| Green Buildings | 68.3 | 73.6 | 76.2 | 78.9 | 85.3 |
| Conventional Buildings | 121.2 | 130.5 | 134.8 | 139.2 | 148.7 |
| % Difference | 43.6% | 43.6% | 43.5% | 43.3% | 42.6% |
| Parameter | Green Buildings | Conventional Buildings | Significance |
|---|---|---|---|
| Indoor Temperature Range (°C) | 22.8–26.3 | 20.1–30.5 | p < 0.001 |
| Relative Humidity Range (%) | 45–62 | 35–70 | p < 0.01 |
| PMV Range (Thermal Comfort) | −0.5 to +0.5 | −1.2 to +1.3 | p < 0.001 |
| Air Quality (CO2 ppm) | 450–750 | 550–1200 | p < 0.001 |
| Resilience Metric | Green Buildings with Resilience Features | Conventional Buildings | Green Buildings Without Specific Resilience Features |
|---|---|---|---|
| Power Continuity (h) | 72.4 | 8.3 | 24.5 |
| Envelope Integrity (0–10 scale) | 8.7 | 6.2 | 7.5 |
| Water Infiltration | 8.3 | 5.8 | 7.1 |
| Protection (0–10 scale) | 1.2 | 4.5 | 2.3 |
| Model | R2 (Mean ± SD) | RMSE (kWh/m2/year) | MAE (kWh/m2/year) | MAPE (%) | 95% CI (R2) | p-Value * |
|---|---|---|---|---|---|---|
| LightGBM | 0.87 ± 0.03 | 8.2 ± 1.1 | 6.1 ± 0.8 | 12.3 ± 2.1 | [0.84, 0.90] | <0.001 |
| Random Forest | 0.82 ± 0.04 | 9.7 ± 1.3 | 7.2 ± 1.0 | 15.1 ± 2.8 | [0.78, 0.86] | <0.001 |
| XGBoost | 0.84 ± 0.03 | 9.1 ± 1.2 | 6.8 ± 0.9 | 13.9 ± 2.4 | [0.81, 0.87] | <0.001 |
| Linear Regression | 0.65 ± 0.06 | 13.4 ± 1.8 | 10.3 ± 1.4 | 21.7 ± 3.5 | [0.59, 0.71] | <0.01 |
| Feature | Importance Score (%) | Standard Error |
|---|---|---|
| HVAC System Efficiency | 24.3 | 1.2 |
| Building Envelope Insulation | 18.7 | 0.9 |
| Window-to-Wall Ratio | 14.5 | 0.8 |
| Shading Design | 10.2 | 0.7 |
| Glazing Performance | 9.6 | 0.6 |
| Orientation | 7.8 | 0.5 |
| Ventilation Strategy | 6.4 | 0.4 |
| Lighting System | 5.2 | 0.3 |
| Occupancy Controls | 3.3 | 0.2 |
| Parameter | Optimal Range | Energy Impact vs. Baseline (%) |
|---|---|---|
| Window-to-Wall Ratio | 30–40% | −12.3 |
| Solar Heat Gain Coefficient | 0.25–0.35 | −8.7 |
| Roof Insulation (R-value) | >4.5 m2·K/W | −10.5 |
| Wall Insulation (R-value) | >3.2 m2·K/W | −9.2 |
| External Shading Projection Factor | >0.5 | −7.8 |
| Glazing U-value | <2.0 W/m2·K | −11.3 |
| Building Type | Location | Carbon Emissions (kgCO2e/m2/year) | Reduction vs. Conventional (%) |
|---|---|---|---|
| Green Office | Shenzhen | 31.2 | 46.8 |
| Conventional Office | Shenzhen | 58.6 | |
| Green Office | Hong Kong | 33.7 | 45.5 |
| Conventional Office | Hong Kong | 61.8 | |
| Green Office | Guangzhou | 30.4 | 47.3 |
| Conventional Office | Guangzhou | 57.7 |
| Building Type | Embodied Carbon | Operational Carbon (50 Years) | Total Life Cycle Carbon | Reduction vs. Conventional (%) |
|---|---|---|---|---|
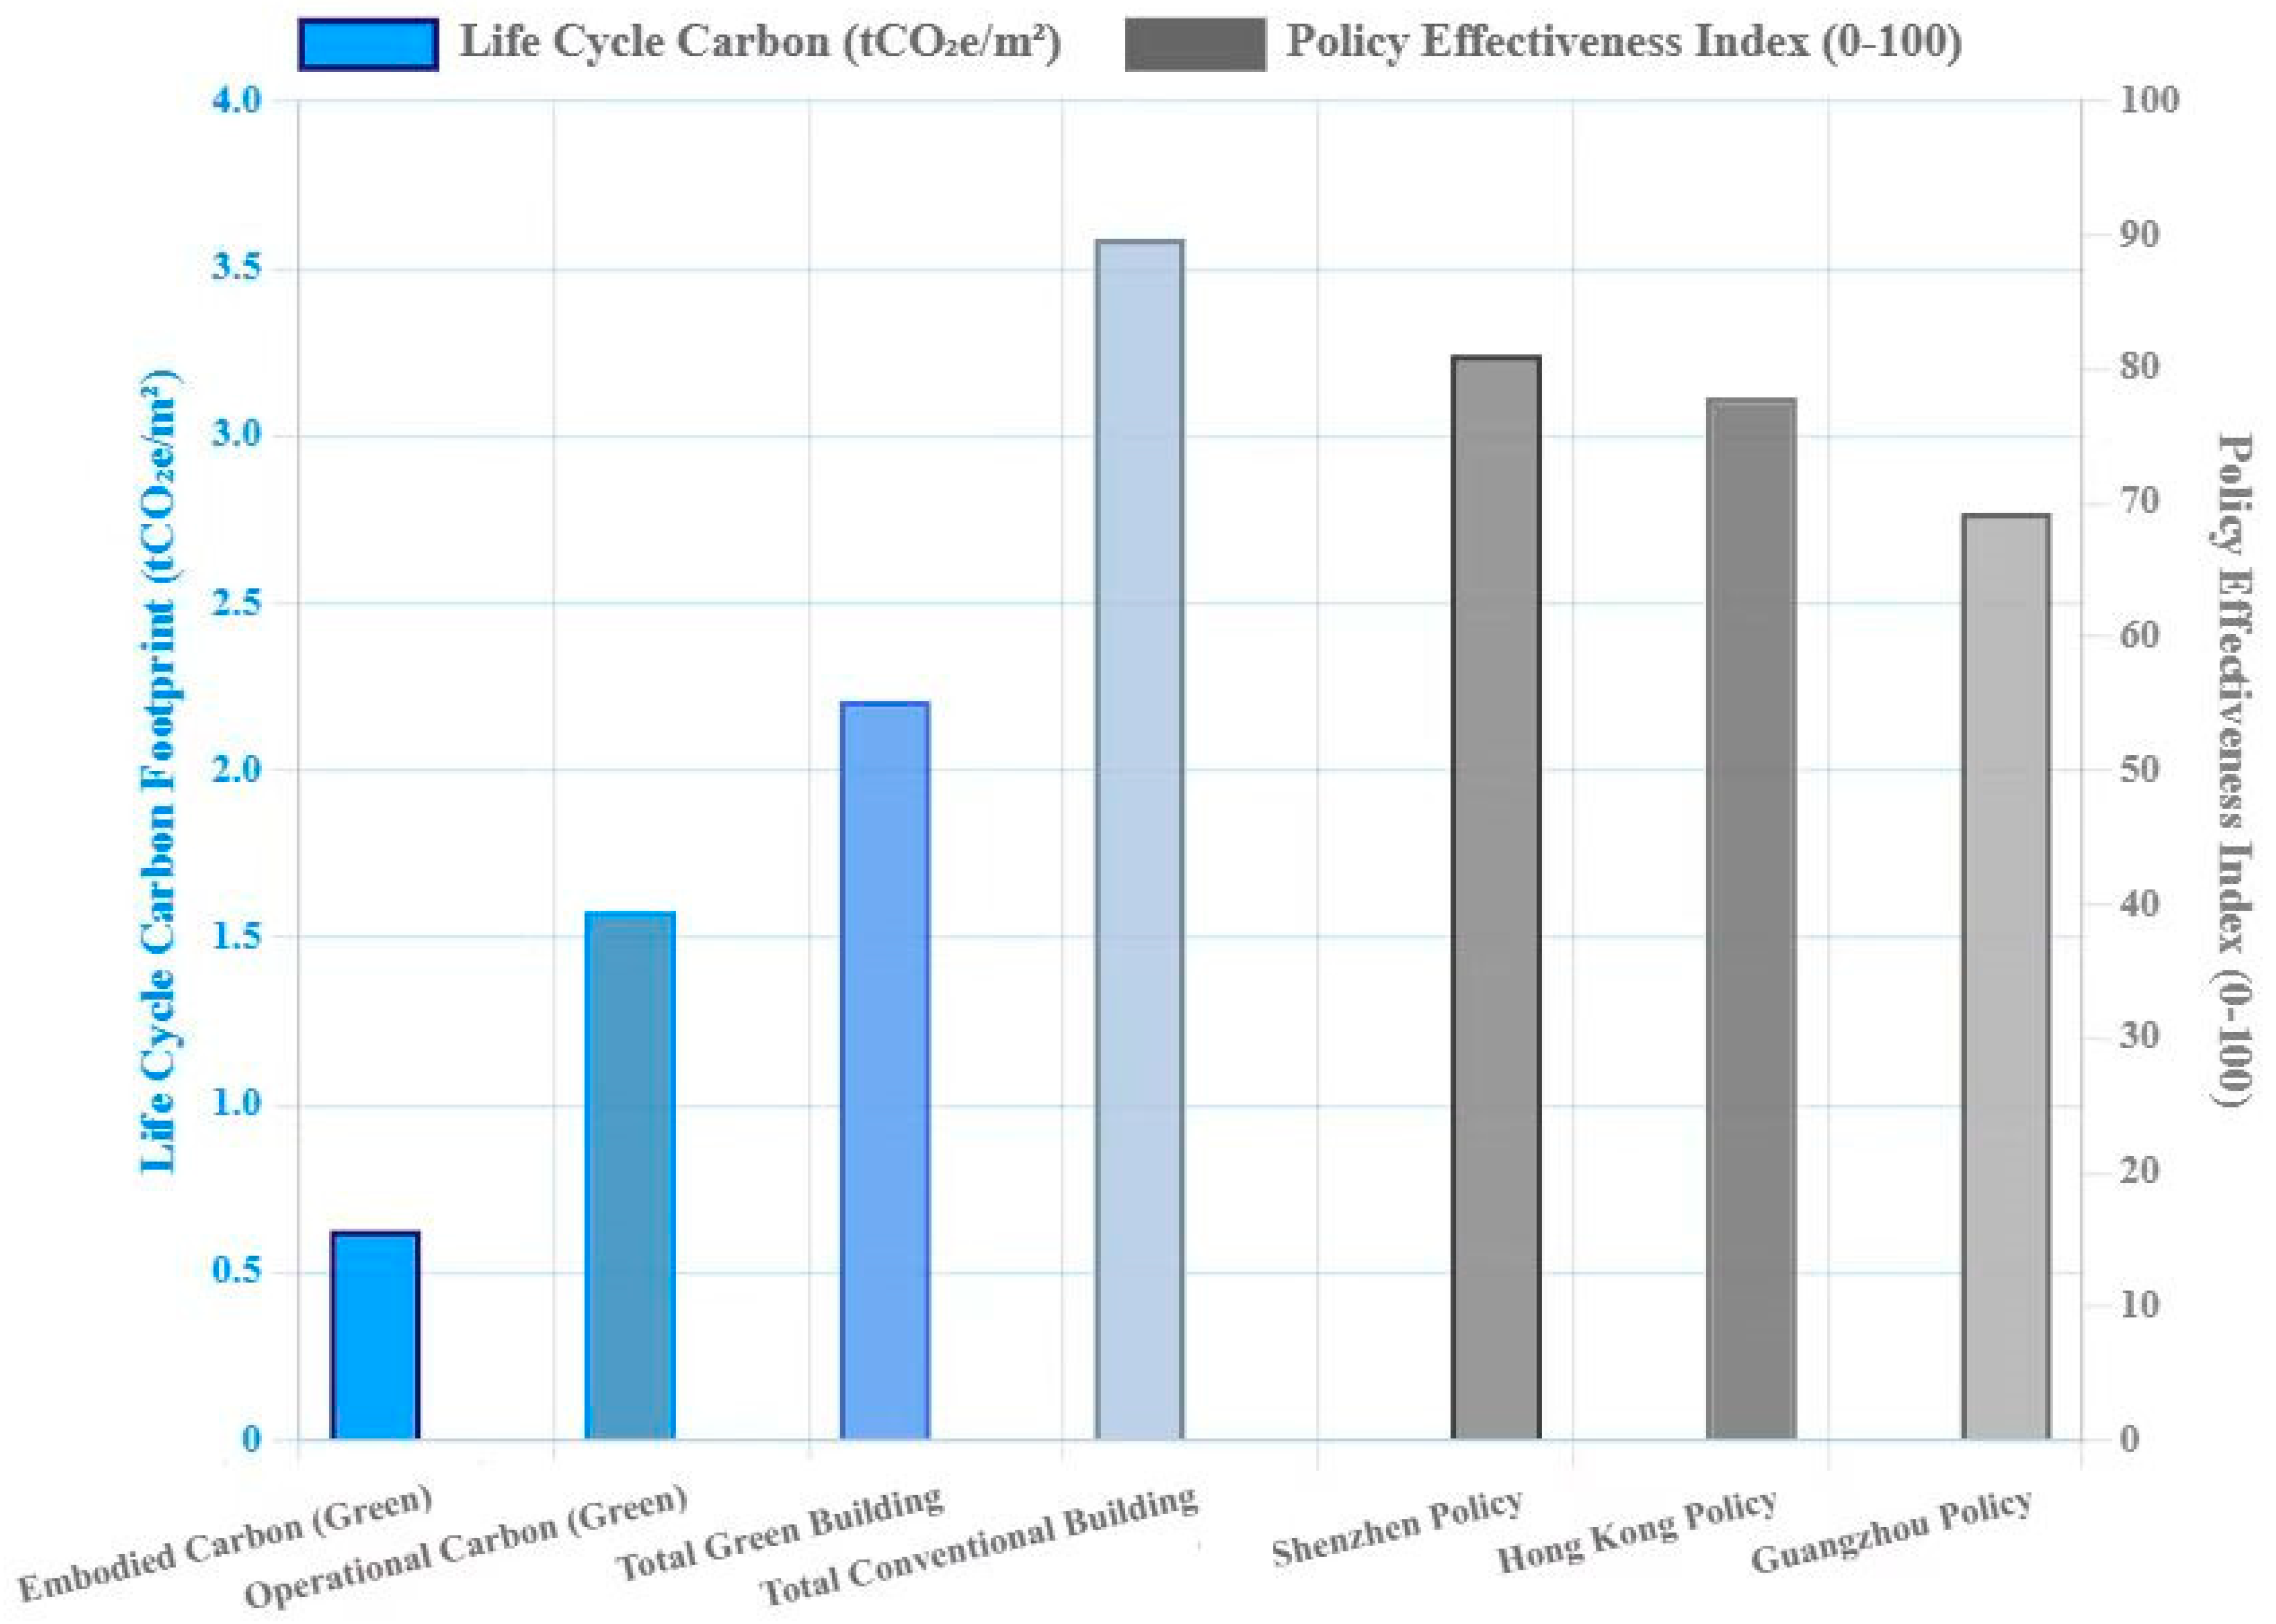
| Green Buildings | 0.63 | 1.58 | 2.21 | 38.4 |
| Conventional | 0.52 | 3.07 | 3.59 |
| Policy | Jurisdiction | Emission Reduction Effectiveness (0–100) | Cost Efficiency (0–100) | Compliance Rate (%) | PEI Score (0–100) |
|---|---|---|---|---|---|
| Three-Star Green Building Evaluation | Mainland GBA | 78.3 | 65.2 | 82.4 | 75.3 |
| System | Hong Kong | 72.5 | 61.8 | 68.3 | 67.5 |
| BEAM Plus | Shenzhen | 81.6 | 70.4 | 91.2 | 81.1 |
| Green Building Design | Hong Kong | 65.3 | 72.6 | 95.8 | 77.9 |
| Regulation (GBDR) | Guangzhou | 76.2 | 58.7 | 73.1 | 69.3 |
| Certification System | Market Penetration (% of New Buildings) | Average Energy Savings (%) | Average Carbon Reduction (%) | Cost Premium (%) |
|---|---|---|---|---|
| China Green Building | 35.3 | 23.7 | 30.6 | 4.8–8.3 |
| Label (Three-Star) | 27.1 | 21.5 | 26.3 | 5.2–9.6 |
| BEAM Plus (Hong Kong) | 12.6 | 25.2 | 32.1 | 65−12.2 |
| LEED (International) | 14.8 | 18.4 | 22.7 | 3.6–7.1 |
| Local Green Standards | 24.5 | 21.8 | 28.4 | 5.1–9.2 |
| Development Scenario | Top-Ranked Policy Combination | Expected Carbon Reduction (%) | Implementation Cost (CNY/m2) | Benefit- Cost Ratio |
|---|---|---|---|---|
| Rapid Urban Growth | Mandatory Standards + Financial Incentives + Capacity Building | 42.3 | 85.6 | 3.8 |
| Moderate Growth | Progressive Standards + Market-Based Mechanisms | 35.7 | 62.3 | 4.6 |
| Regeneration Focus | Retrofit Subsidies + Performance Disclosure + Technical Support | 27.8 | 48.2 | 5.2 |
| Jurisdiction | PEI Score | Average EUI (kWh/m2/Year) | Energy Savings vs. Baseline (%) |
|---|---|---|---|
| Shenzhen (GBDR) | 81.1 | 67.3 | 43.2 |
| Hong Kong (BEEO) | 77.9 | 72.4 | 41.7 |
| Guangzhou (GBEP) | 69.3 | 65.1 | 43.1 |
| PEI Tier | Representative Jurisdictions | Average Payback Period | NPV (50 Years, CNY/m2) | Cost-Effectiveness Ratio |
|---|---|---|---|---|
| High (>75) | Shenzhen (81.1), Hong Kong BEEO (77.9) | 4.1 years | 2540 | 1:3.8 |
| Moderate (60–75) | Guangzhou GBEP (69.3), Hong Kong BEAM Plus (67.5) | 6.3 years | 1890 | 1:2.9 |
| Low (<60) | Baseline/voluntary frameworks | 8.7 years | 1240 | 1:2.1 |
| PEI Tier | Representative Jurisdictions | Average Payback Period | NPV (50 years, CNY/m2) | Cost-Effectiveness Ratio |
Disclaimer/Publisher’s Note: The statements, opinions and data contained in all publications are solely those of the individual author(s) and contributor(s) and not of MDPI and/or the editor(s). MDPI and/or the editor(s) disclaim responsibility for any injury to people or property resulting from any ideas, methods, instructions or products referred to in the content. |
© 2025 by the authors. Licensee MDPI, Basel, Switzerland. This article is an open access article distributed under the terms and conditions of the Creative Commons Attribution (CC BY) license (https://creativecommons.org/licenses/by/4.0/).
Share and Cite
Feng, X.; Xiang, F.; Liao, C. Climate Adaptability and Energy Performance in the Greater Bay Area of China: Analysis of Carbon Neutrality Through Green Building Practices. Buildings 2025, 15, 3066. https://doi.org/10.3390/buildings15173066
Feng X, Xiang F, Liao C. Climate Adaptability and Energy Performance in the Greater Bay Area of China: Analysis of Carbon Neutrality Through Green Building Practices. Buildings. 2025; 15(17):3066. https://doi.org/10.3390/buildings15173066
Chicago/Turabian StyleFeng, Xinshu, Fenfang Xiang, and Caisheng Liao. 2025. "Climate Adaptability and Energy Performance in the Greater Bay Area of China: Analysis of Carbon Neutrality Through Green Building Practices" Buildings 15, no. 17: 3066. https://doi.org/10.3390/buildings15173066
APA StyleFeng, X., Xiang, F., & Liao, C. (2025). Climate Adaptability and Energy Performance in the Greater Bay Area of China: Analysis of Carbon Neutrality Through Green Building Practices. Buildings, 15(17), 3066. https://doi.org/10.3390/buildings15173066


