1. Introduction
Both traditional and new infrastructure construction in China have shown accelerated upgrading, integration of development strategies, continuous innovation, and optimization of construction processes. The construction of a modern comprehensive three-dimensional transportation network has been accelerated, and the overall level of infrastructure has achieved leapfrog development. As the primary foundation form for building structures, bored piles are widely utilized in various civil engineering fields due to their advantages of high bearing capacity, strong geological adaptability, excellent seismic performance, convenient construction, and low noise. However, the inherent defects of bored piles, such as pile tip sedimentation, pile side mud sloughing, and stress relaxation of the soil around the pile, significantly affect their bearing capacity. To address these issues, post-grouting technology for pile foundations is widely used due to its favorable engineering benefits [
1,
2,
3].
Gabaix [
4] first proposed a pile side grouting device in research on post-grouting devices for pile foundations. During single-hole grouting, other grouting hole positions are sealed through the water-filled expansion system of double isolation plates to support layered grouting construction on the pile side. Fleming [
5] mentioned a new type of U-shaped grouting pipe that works in a similar form to open grouting. Pooranampillai et al. [
6] developed a low-fluidity grouting device, which mainly includes an internal pipe with an inner diameter of 2 inches and a start-up hole under the pile to promote the transportation of low-flow slurry through the pile tip. Sze et al. [
7] studied a pile side grouting device for welding grouting tubes on the outside of steel cages and applied it to square piles and underground continuous walls during a project in Hong Kong. Thiyyakkandi et al. [
8] developed a modular precast pile side grouting device, which was shown to effectively control the slurry path, prevent diffusion along the weak zone, and improve the grouting accuracy and reinforcement effect. Nguyen et al. [
9] developed a pile side grouting device that consists of a grouting core tube and two upper and lower sealed rubber balloons. The grouting pipe at the grouting front reduces the device to the position of the grouting hole on the side of the pile, the upper and lower rubber balloons are swelled via water injection to form a closed space, and the slurry is injected into the soil around the pile under pressure. Zhang et al. [
10] developed a pile side grouting device that binds a fixed grouting ring pipe on a steel cage, in which each grouting ring pipe is connected by a vertical grouting steel pipe and multiple one-way grouting devices are distributed on the grouting ring pipe. Dai et al. [
11] developed a distributed post-grouting device for the pile side that has a controllable grouting position and uniform distribution of slurry along the soil layer around the pile.
In laboratory test research on a post-grouting pile, Osamu Kusakabe et al. [
12] revealed the failure mechanism of grouted solid by conducting a model test of grouting at the end of prefabricated piles in sandy soil. Lai et al. [
13] innovatively applied the load transfer method to the study of post-grouting piles and proposed an exponential load transfer model. Hu et al. [
14] proposed a new method for testing the post-grouting effect of super-long pile tips based on distributed optical fiber sensing technology and verified the feasibility and effectiveness of the method through model tests. Dai et al. [
11] carried out laboratory model tests to compare and analyze the bearing characteristics of a single pile under a vertical load in a clay layer using three reinforcement methods: annular point grouting, distributed grouting, and high-pressure jet grouting. They revealed the mechanism of different grouting processes. Zhang et al. [
15] studied the influence of different grouting methods and grouting amounts on the bearing characteristics of pile foundations through laboratory model tests. Wu et al. [
16] carried out a series of cast-in-place pile model tests to analyze the bearing characteristics of a post-grouting pile and the mechanism of slurry diffusion along the pile tip under different grouting and pile tip soil unloading conditions. Asgari et al. [
17] (2024) found that in dense sandy soil, grouting around the pile side contributes more to improving the pile foundation bearing capacity than grouting at the pile tip, suggesting that a strategy focusing on the pile side should be adopted in grouting design. This study further confirms the broad application value of post-grouting technology in enhancing the pile foundation bearing capacity under different soil conditions.
In field test research on post-grouting piles, Kister et al. [
18] innovatively applied distributed optical fiber sensing technology to monitor the process of field pile foundation using 16 fiber grating sensors, which promoted the development of structural health monitoring technology. Dapp et al. [
19] compared and analyzed the bearing characteristics of ungrouted piles and post-grouting piles in sand using field tests and found significant differences between them. Miao et al. [
20] proposed an intelligent processing scheme for distributed optical fiber detection pile foundation data based on machine learning and conducted practical engineering applications. Xing et al. [
21] studied the influence of the pile top load, pile length, pile diameter, and soil moisture content on the negative friction resistance of pile foundations in collapsible loess areas through field tests. In order to evaluate the improvement effect of post-grouting technology on the bearing capacity of bored piles, Zheng et al. [
22] conducted static load tests on post-grouting bored piles at Beijing Capital International Airport. Wan et al. [
23] conducted field post-grouting tests on pile foundations in ultra-thick fine sand layers and systematically studied six pile tip + pile side composite grouting piles and two pile side grouting piles. The effect of post-grouting reinforcement was comprehensively evaluated using electromagnetic wave CT technology and a standard penetration test (SPT). Using a field static load test of four full-scale post-grouting piles, Wan et al. [
24] systematically studied the reinforcement mechanism of pile tip + pile side combined grouting in ultra-thick fine sand soil layers. Sun et al. [
25] studied the application of distributed optical fiber sensing technology in an axial load test of prefabricated piles through field tests and proposed corresponding data processing methods. Thiyyakkandi et al. [
26] studied the construction technology and bearing capacity of a new jet-grouting precast pile in cohesionless soil through field static load tests and verified the strong performance of the pile foundation in cohesionless soil. Wang et al. [
27] studied the influence of pile tip sediment and pile side mud on the axial bearing capacity of super-long and large-diameter bored piles through field-distributed post-grouting tests. Beddelee et al. [
28] proposed a pile foundation bearing capacity detection method based on distributed optical fiber sensing (DFOS) and applied it to a field pile foundation static load test. This method can be used to monitor the strain distribution of the pile body in real-time and calculate the bearing capacity of the pile foundation based on strain data.
Gao et al. [
29] studied the deformation law of cast-in-place large-diameter piles under different load conditions using model tests and numerical simulation, and further analyzed the application of FBG sensors in pile foundation deformation monitoring. Zhou et al. [
30] proposed a pile tip composite post-grouting technology and studied its influence on the bearing characteristics of cast-in-place pile foundations through field tests and numerical simulation. Huang et al. [
31] studied the application of elastic wave CT technology in the detection of the post-grouting effect of pile foundations and verified the feasibility and effectiveness of the technology through model tests and field tests. Zhan et al. [
32] studied the influence of pile tip + pile side post-grouting on the bearing characteristics of super-long bored piles through field tests and numerical simulations. Using laboratory tests and numerical simulation, Zang et al. [
33] studied the mechanical properties of the post-grouting pile–soil interface under different grouting materials (such as cement slurry, chemical slurry, bentonite slurry, etc.). Through laboratory tests and numerical simulation, Shi et al. [
34] studied the influence of grouting pressure, grouting volume, grouting slurry viscosity, and other parameters on grouting pile–soil interaction. Li et al. [
35] proposed pile side distributed geopolymer post-grouting technology and studied its influence on the vertical bearing capacity of pile foundations through model tests and numerical simulation. Mohsen Bagheri et al. [
36] used the concrete damage plasticity (CDP) model in Abaqus software to perform numerical simulations of the mechanical behavior of concrete in pile foundation structures.
In summary, domestic and international researchers have conducted extensive studies on post-grouting of pile foundations, delving into multi-factor coupling, novel monitoring technologies, grouting equipment, materials, and techniques. These investigations have been conducted through field tests, laboratory model tests, theoretical analyses, and numerical simulations, with a focus on enhancing the theory and technology of post-grouting to improve the bearing capacity of pile foundations. Nevertheless, few laboratory model tests have been conducted on distributed super-long and super-diameter post-grouting model piles at the pile tip and pile side. Previous scholars have predominantly utilized prefabricated components, such as concrete piles, steel pipe piles, and organic glass pipe piles, for simulation purposes. The test models were constructed by embedding sensors within the pile body and grouting pipes and artificially increasing the roughness. However, this simplified approach fails to accurately replicate the pile-forming process and on-site maintenance environment of cast-in-place piles. Additionally, it is challenging to achieve multi-layer distributed grouting on the pile side, and the roughness in the artificial simulation significantly deviates from that of the actual pile-forming surface.
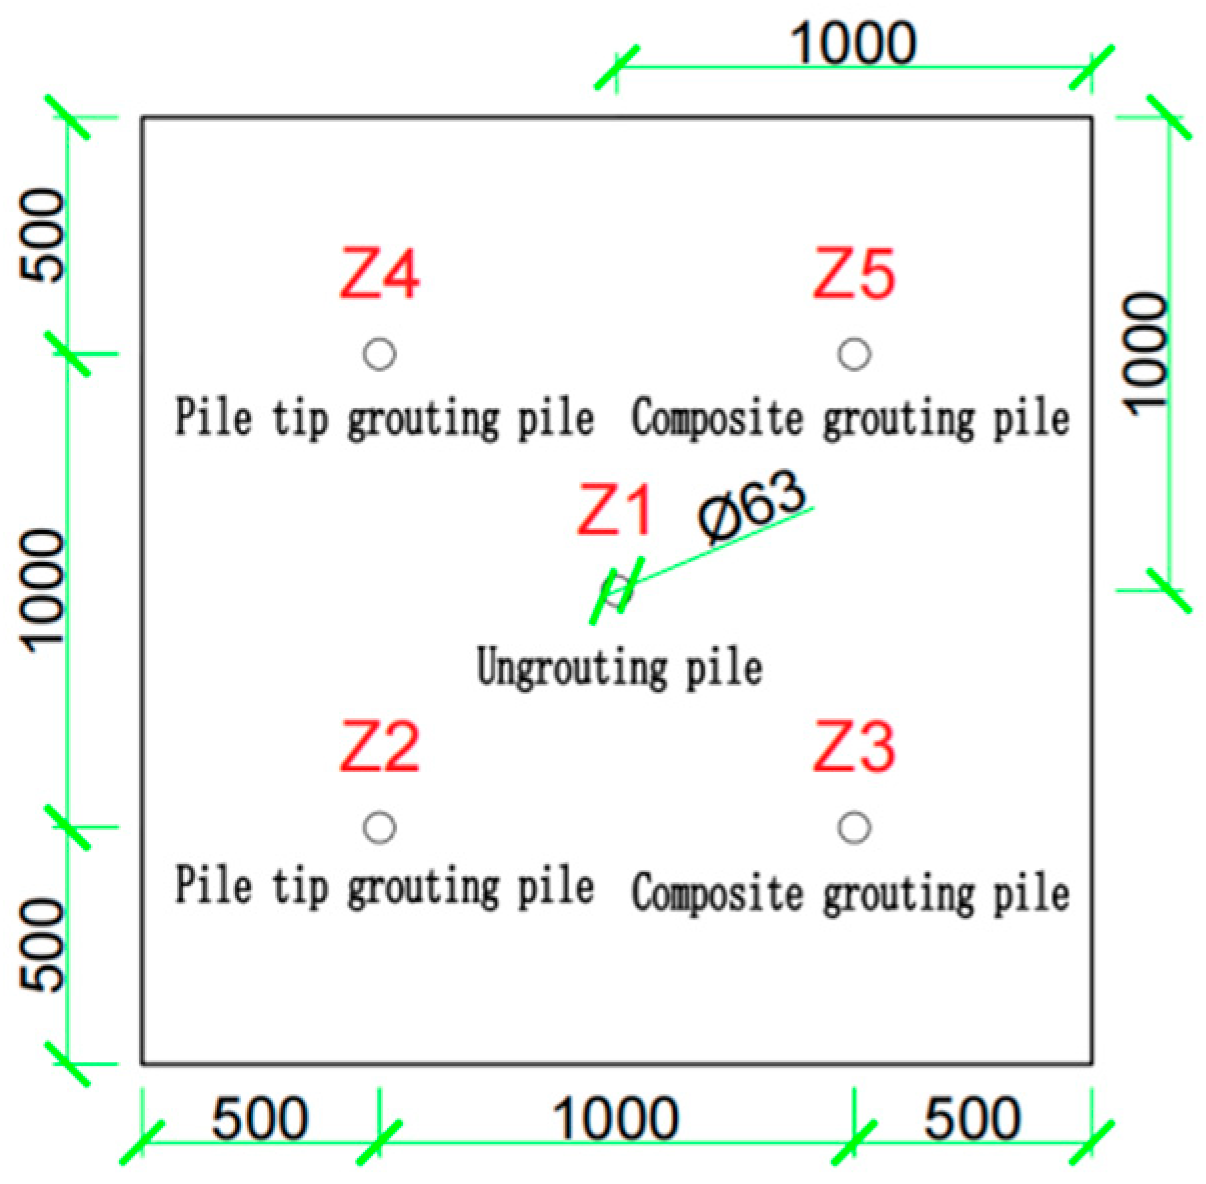
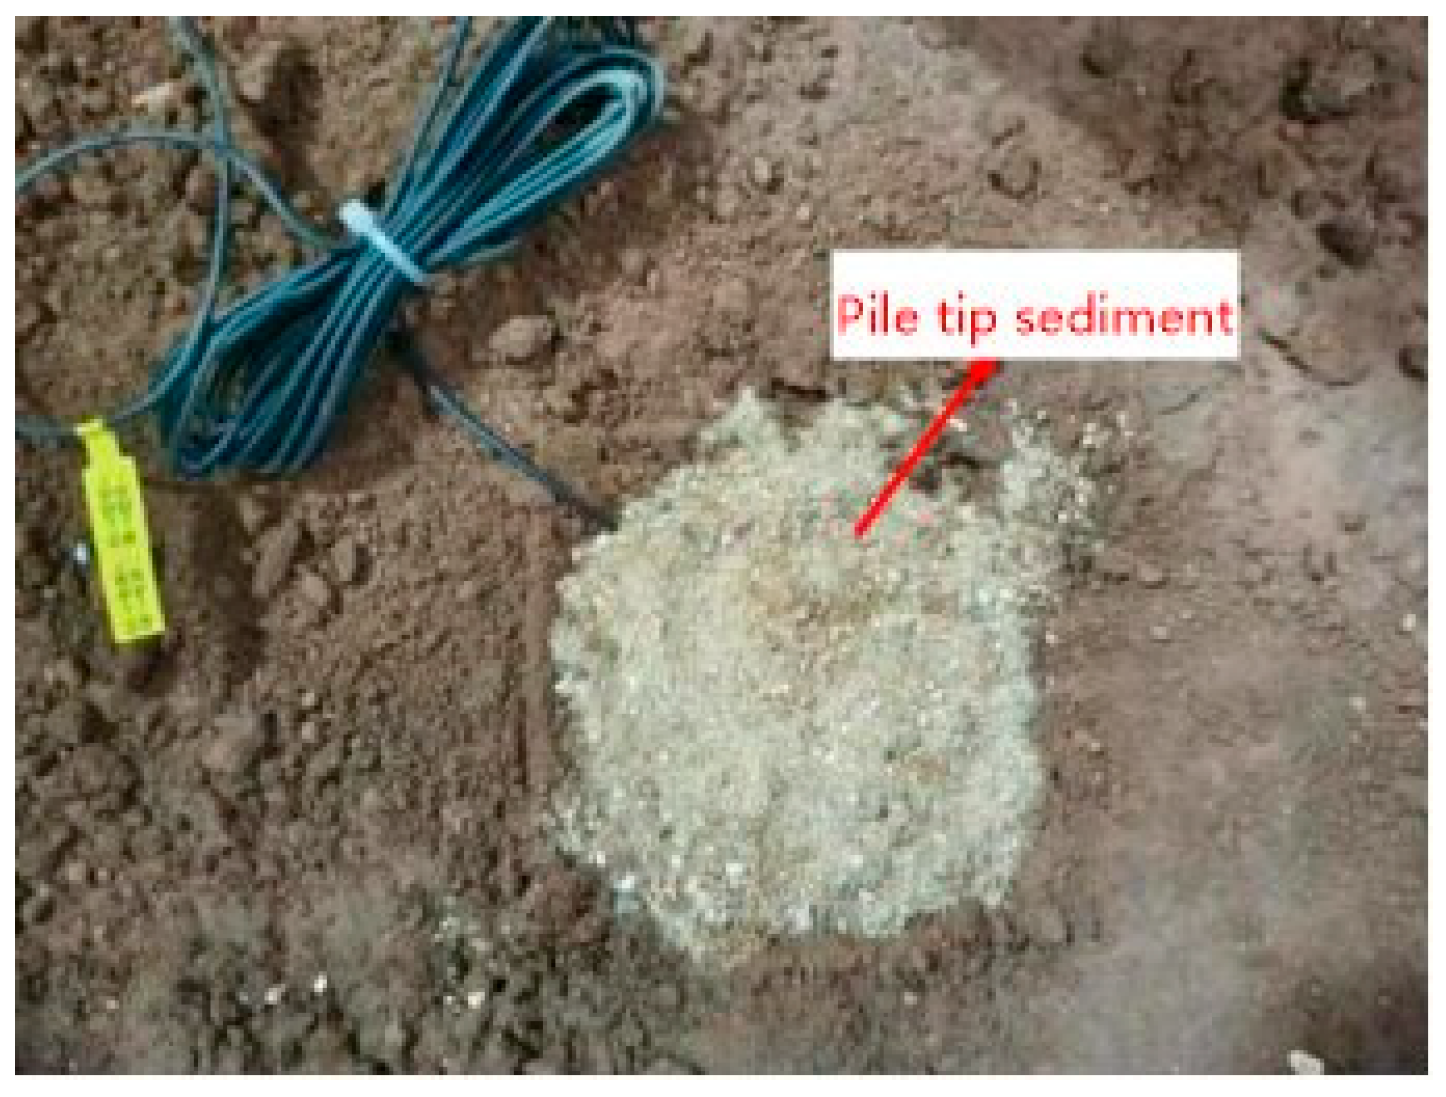
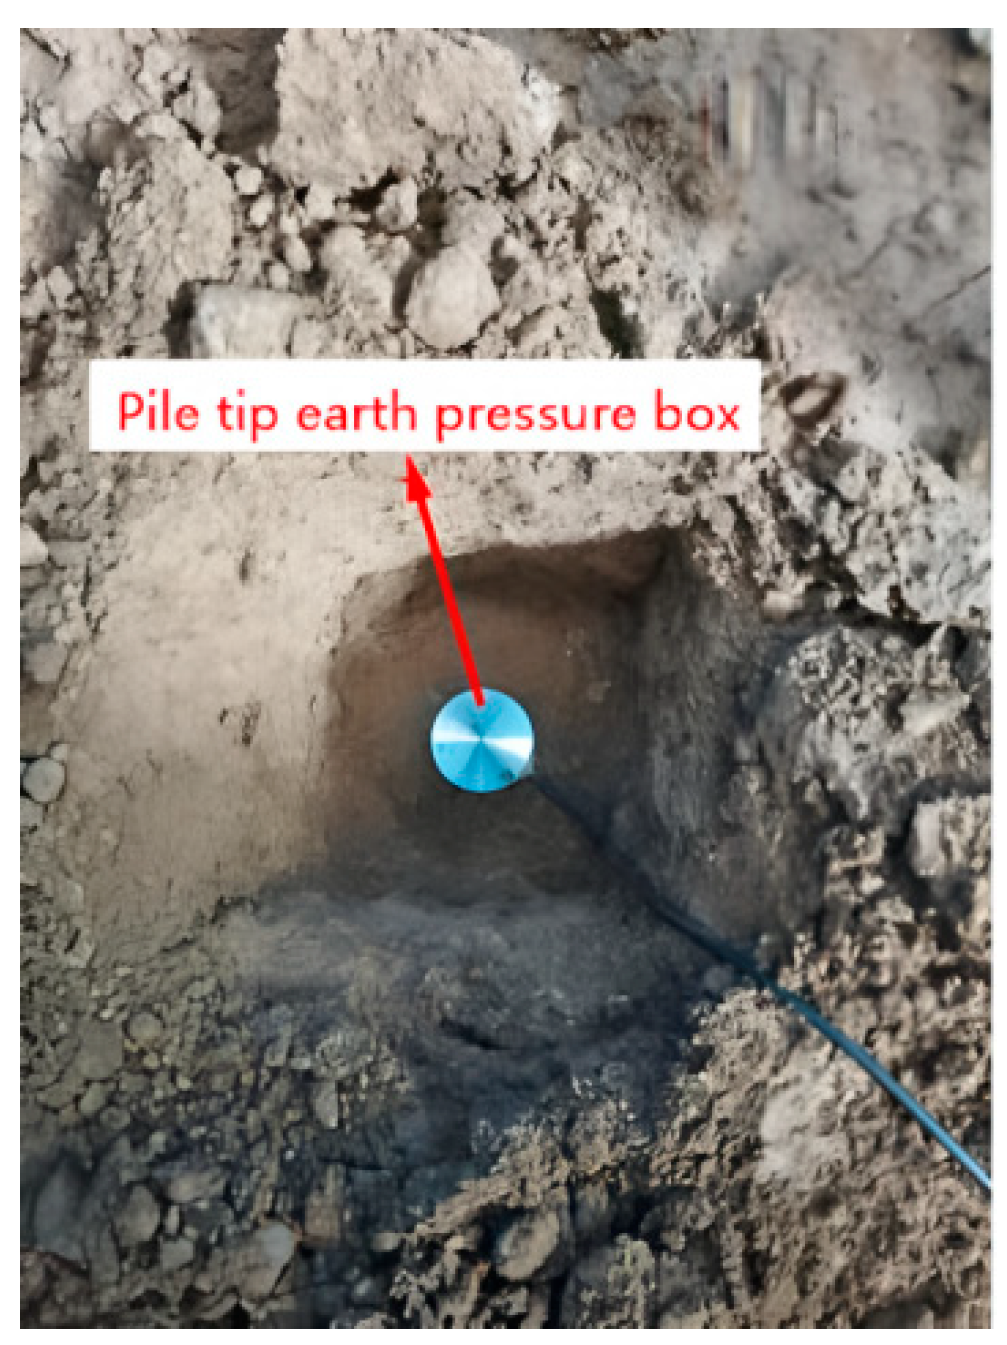
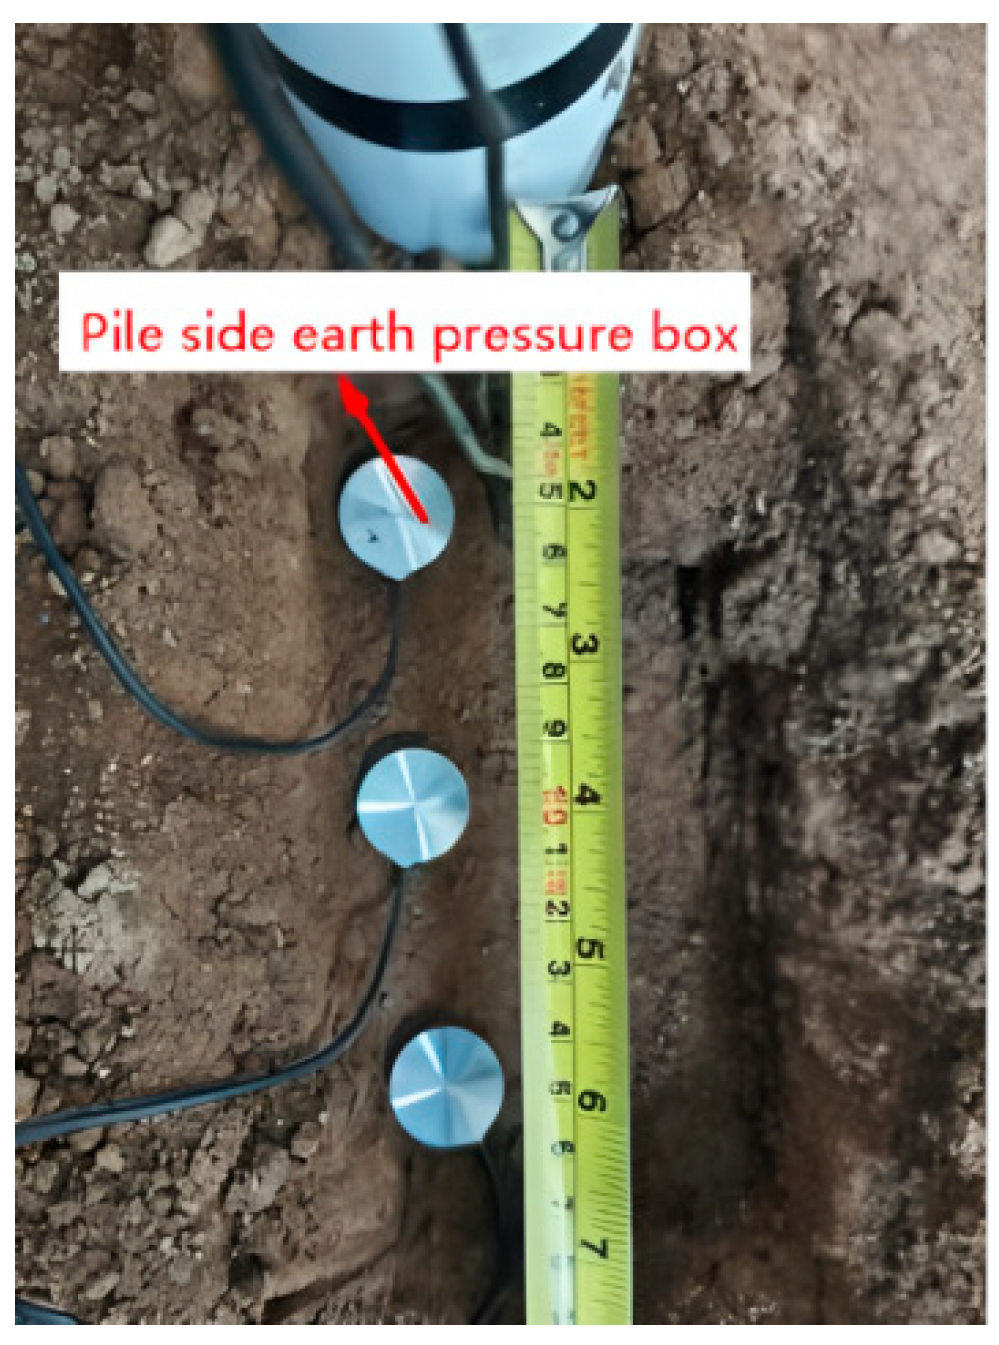
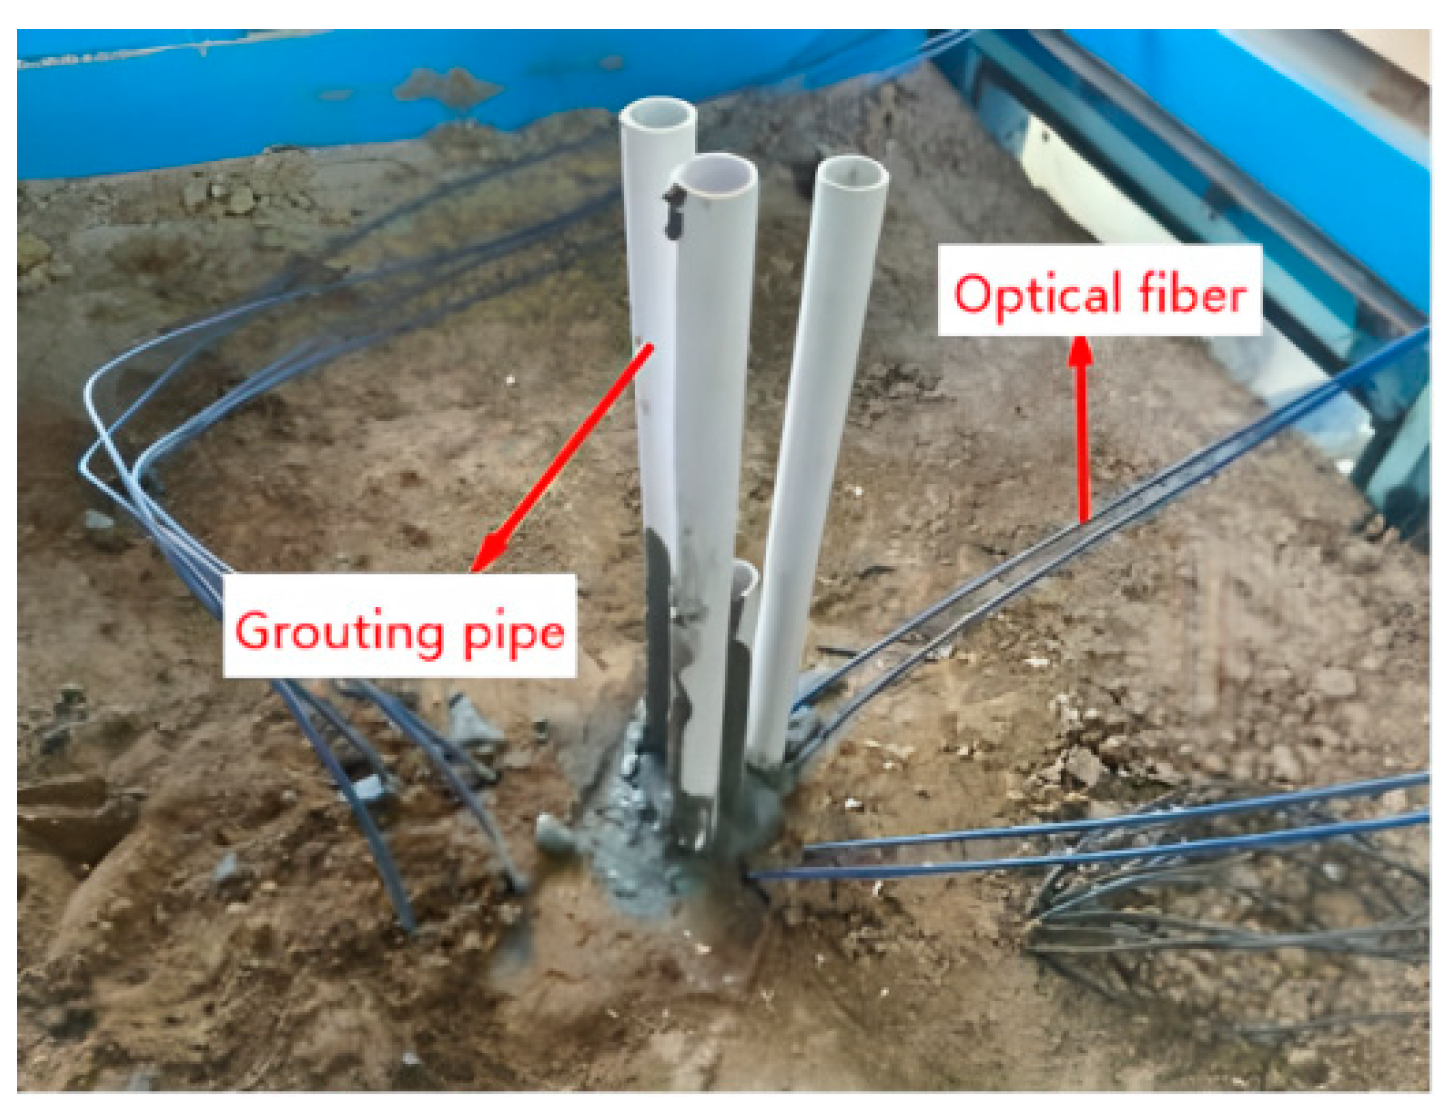
To study the influence of post-grouting on the bearing characteristics of bridge cast-in-place pile foundations, a new model pile-formation process and a pile side distributed grouting process were employed. Laboratory static load tests were conducted using one ungrouted model pile, two pile tip grouting model piles, and two pile tip plus pile side distributed grouting model piles. A soil pressure box was utilized to detect changes in soil pressure around the piles during the grouting process, and distributed sensing fibers were used to monitor changes in pile internal force during the static load tests. Through comparing and analyzing the load–settlement relationship of each model pile under different grouting methods and grouting amounts, the transfer law of the axial force of the pile body, the performance characteristics of pile side friction resistance, and pile tip resistance were examined.
3. Test Results and Analysis
3.1. Soil Pressure
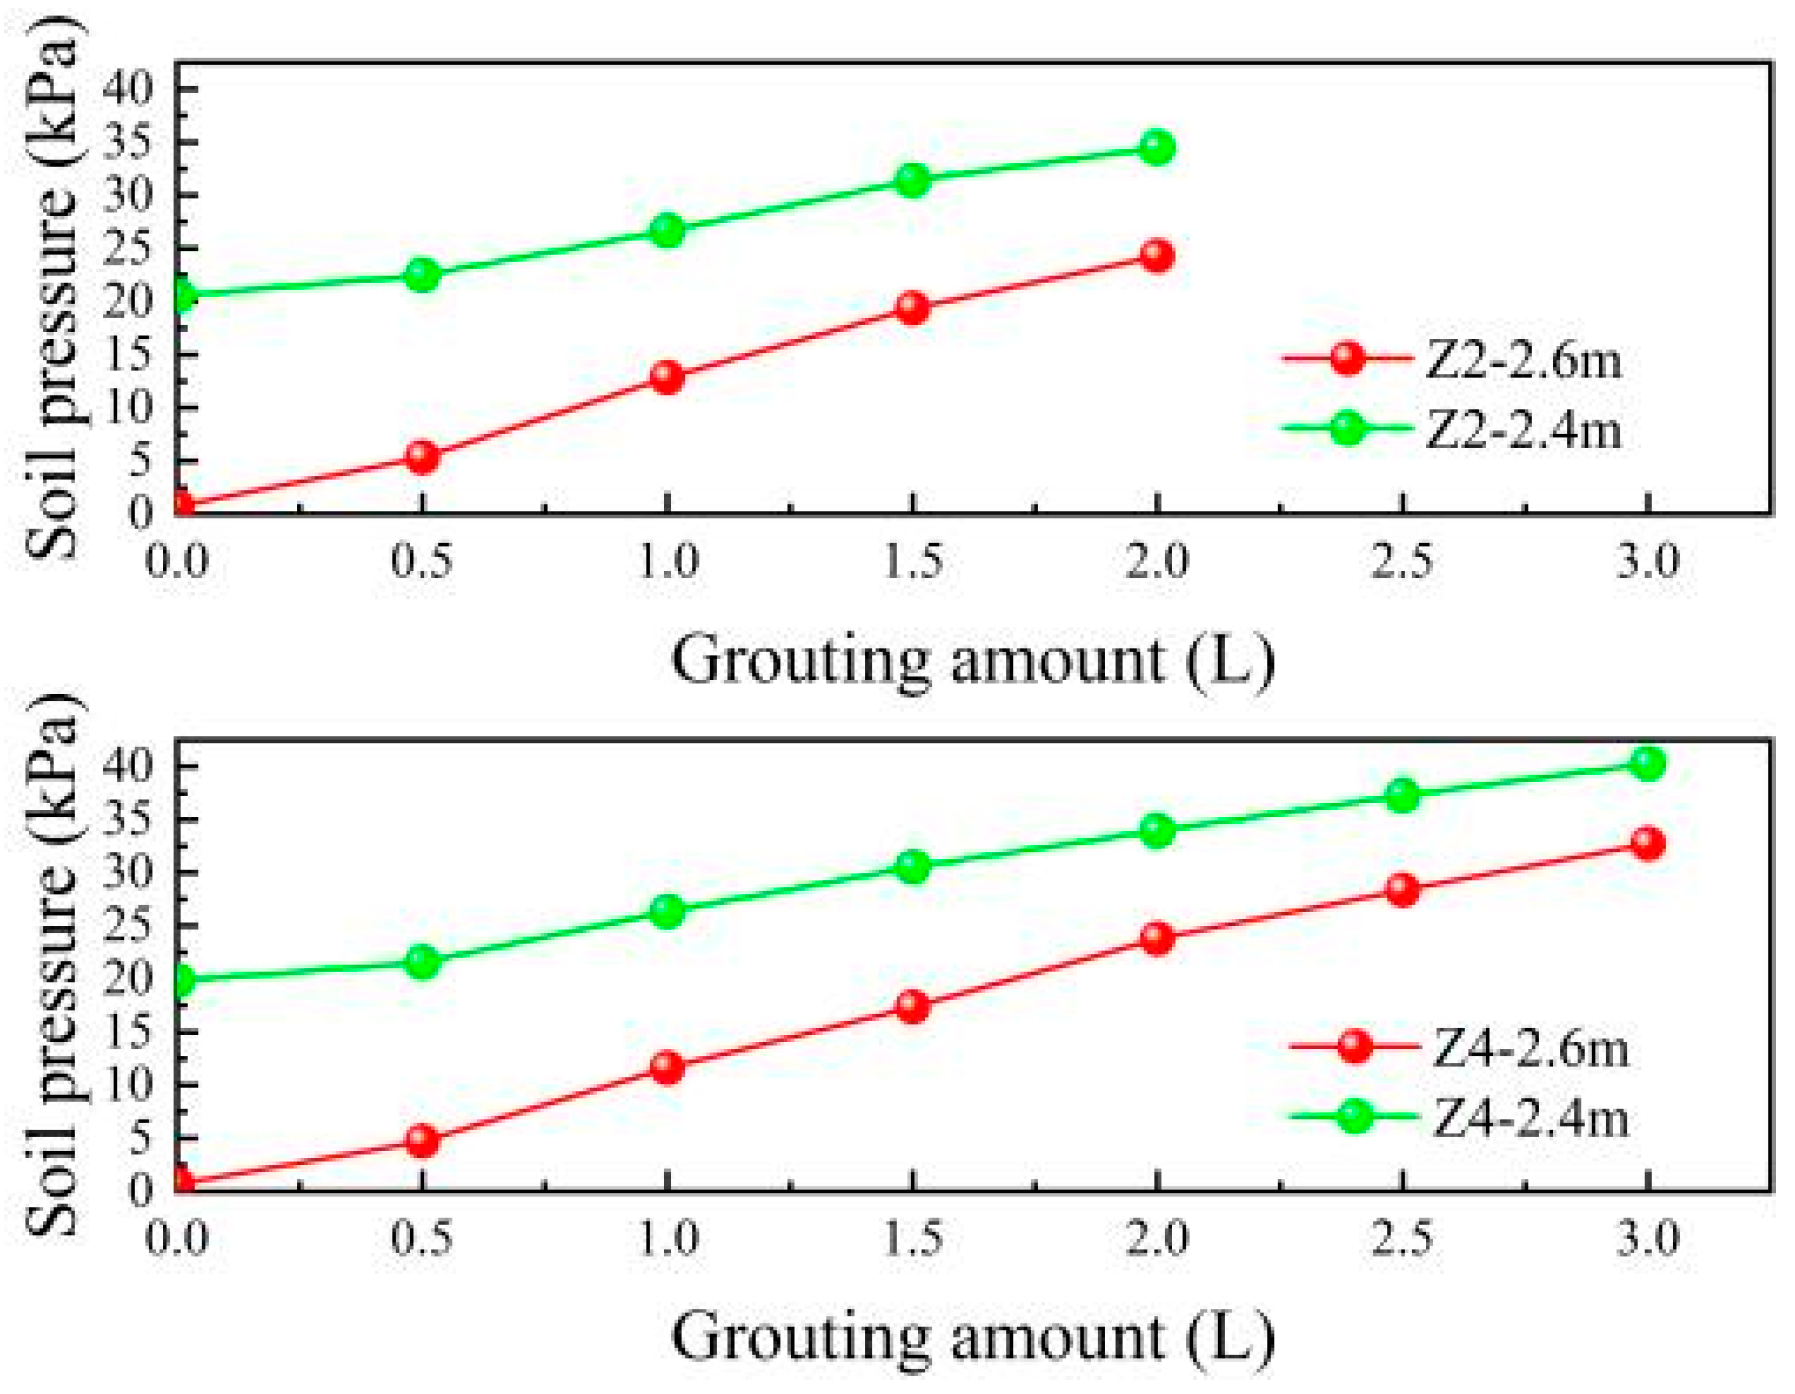
During the model pile grouting process, the dynamic changes in soil pressure near the pile tip and the grouting hole at the pile side serve as a crucial indicator for evaluating the grouting effect. To investigate the impacts of varying grouting quantities on the soil pressure at the tip of the pile tip grouting model piles, the soil pressures at the pile tips of model piles Z2 and Z4 as the grouting amount changes were compiled into a chart, as depicted in
Figure 17.
Figure 17 shows that the soil pressure at the pile tip is positively correlated with the grouting volume at the pile tip. As the grouting volume at the pile tip increases, the solidification effect of the cement slurry on the sediment at the pile tip, the penetration and cementation of the soil layer at the pile tip, the splitting reinforcement, and the bottom expansion effect enhance the density of the soil layer near the pile tip. This, in turn, improves its bearing stiffness and the stress transfer path of the soil layer at the pile tip.
In terms of the soil pressure response on the pile side, both model piles Z2 and Z4 showed a trend of gradually increasing soil pressure with an increase in grouting volume, but there were clear differences in the response characteristics. The larger increase in soil pressure of model pile Z2 indicates that the soil at the pile side is more sensitive to grouting reinforcement, which is presumed to be closely related to the upward return of the slurry, pile-end spreading, and soil splitting and encryption during the grouting process, which significantly improves the densification and structural stiffness of the soil layer on the pile side within the depth of 2.4 m. In contrast, model pile Z4 shows the same trend of increase in soil pressure with the grouting volume, but there are significant differences in the response characteristics. In contrast, the increase in soil pressure on the pile side of model pile Z4 was relatively small, which may be due to its high in situ soil compactness, restricted slurry diffusion path, or weak construction disturbance, thus limiting the grouting effect.
In summary, model pile Z2 showed more significant structural optimization and bearing capacity enhancement effects during grouting reinforcement, while model pile Z4 showed a weaker response to grouting.
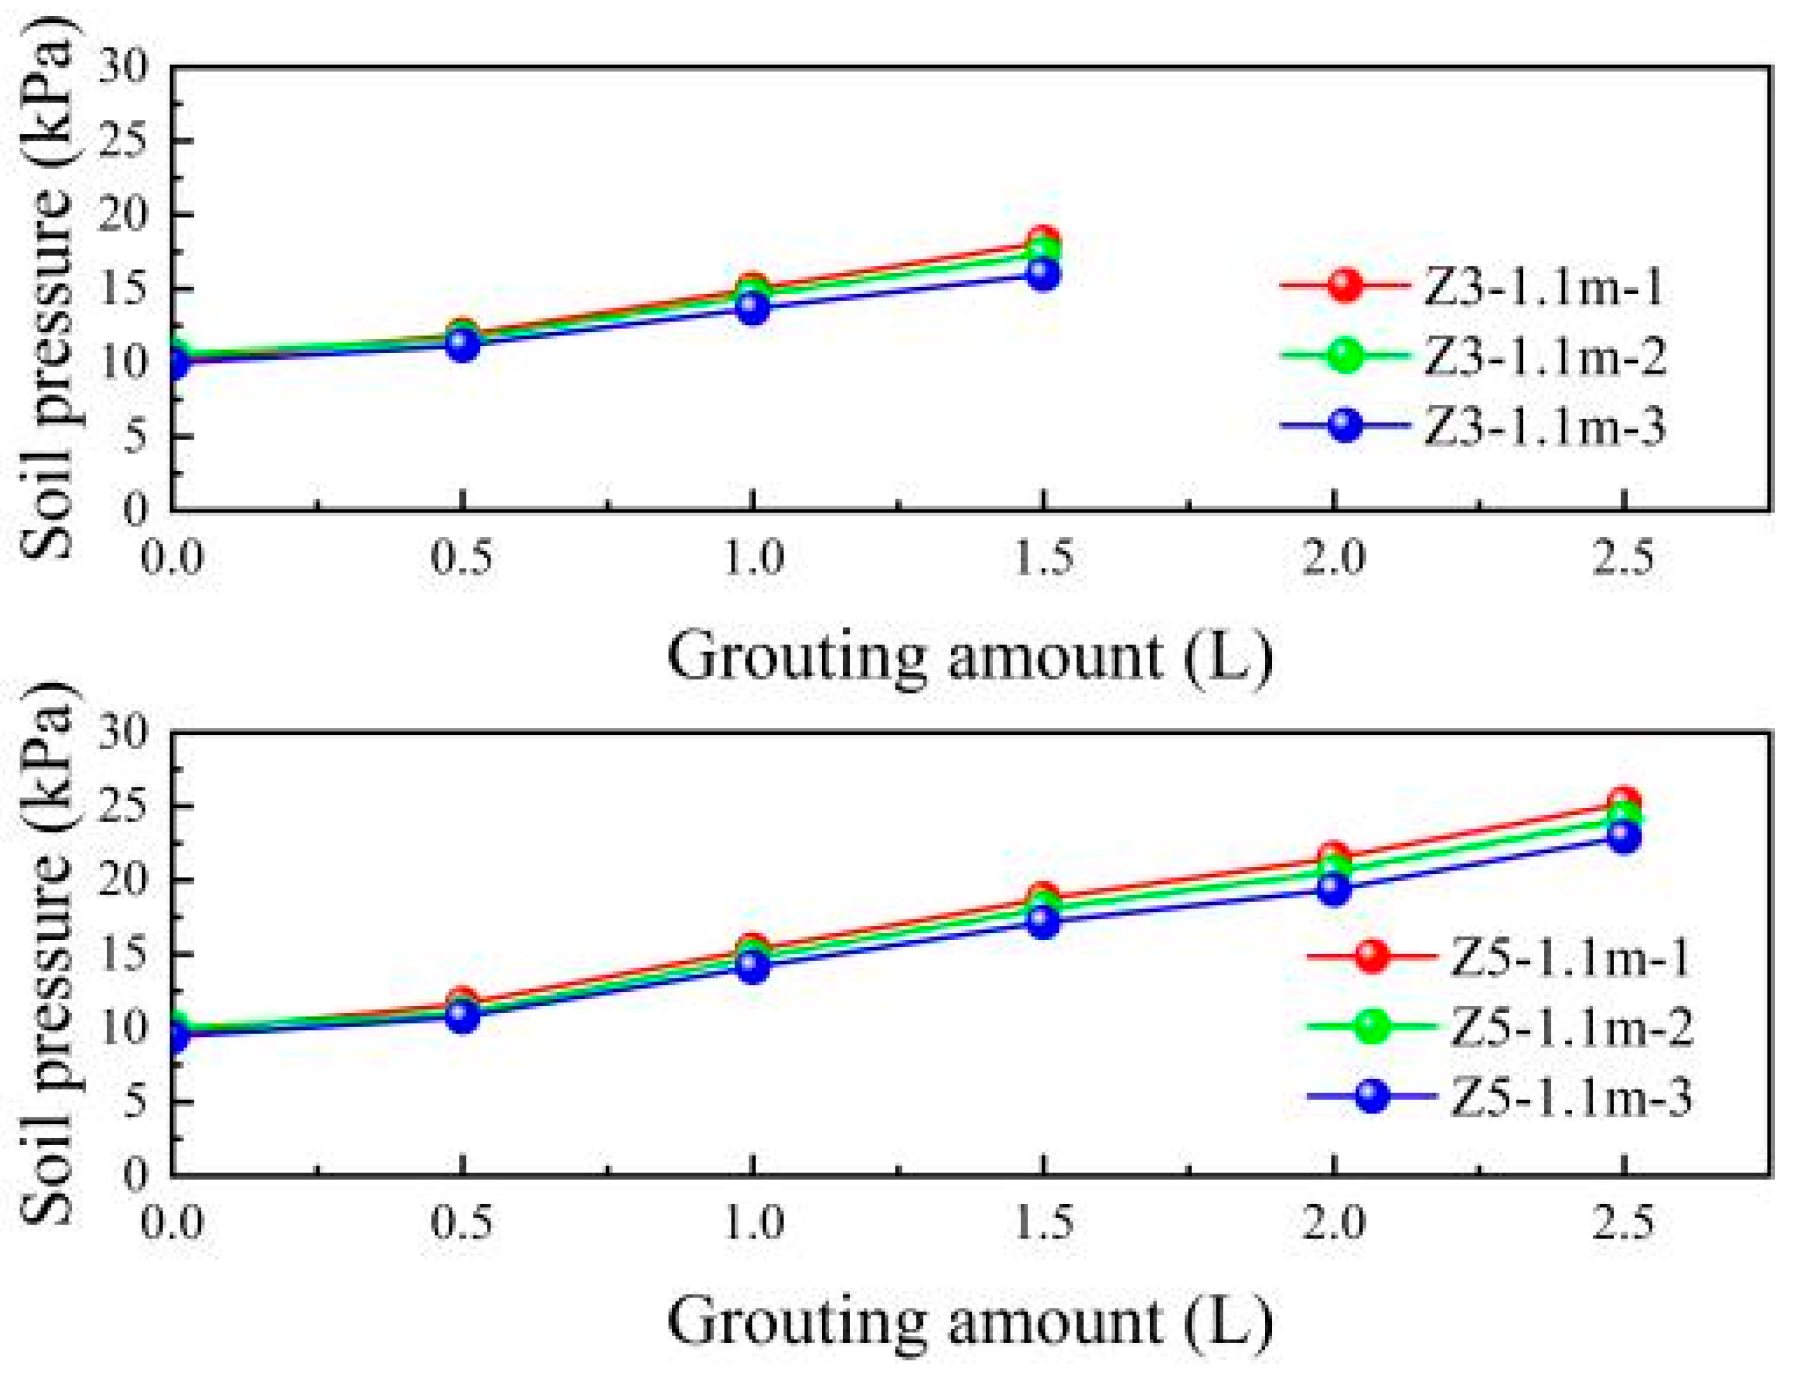
To investigate the impacts of varying grouting quantities at the pile tip and pile side on the soil pressure around the pile, soil pressure data were collected at a depth of 1.1 m near the slurry outlet of model piles Z3 and Z5, as depicted in
Figure 18.
Figure 18 shows that the soil pressure on the pile side positively correlates with the grouting volume at the pile side. As the grouting volume at the 1.0 m grouting hole position of the model pile increases, the penetration, cementation, splitting reinforcement, and diameter expansion effects of the cement slurry on the soil layer near the pile side enhance the density of the soil layer and improve the stress transfer path of the soil layer near the pile side grouting hole. When the total grouting volume at the 1.0 m grouting hole position of the model pile Z3 is 1.5 L, the soil pressures in the three soil pressure boxes along the horizontal direction are 18.12 kPa, 17.36 kPa, and 15.98 kPa, respectively. For model pile Z5, with a total grouting volume of 2.5 L at the 1.0 m grouting hole position, the soil pressures along the horizontal direction of the three soil pressure boxes are 25.19 kPa, 24.15 kPa, and 22.92 kPa, respectively. This indicates that after pile side grouting is completed, the impact of the cement slurry’s penetration and compaction on the soil pressure at the pile side along the horizontal direction gradually diminishes.
Further analysis reveals that the earth pressure at model pile Z3 is the greatest near the slurry outlet hole, which gradually decreases with the increase in distance, indicating that the influence range of grouting is relatively concentrated. In contrast, the difference in earth pressure shrinks at each measurement point of model pile Z5, and the distribution of stress becomes more uniform, indicating that the high grouting volume effectively enhances the spreading range of slurry and strengthens the overall reinforcing effect on the soil body. In comparison, the maximum earth pressure of model pile Z5 was increased by about 38.99% and the minimum earth pressure was increased by about 43.43%, which shows that it has a more significant effect in increasing earth pressure and improving stress transfer.
In conclusion, the grouting volume is a key parameter affecting the soil pressure distribution and reinforcement effect on the pile side, and an appropriate increase in the grouting volume can effectively improve the bearing performance of the soil around the pile. Simultaneously, however, it should be noted that there is a special attenuation law of the slurry in the horizontal diffusion process, and the reinforcement effect may be slowed down by the marginal effect under a high grouting volume. Therefore, reasonable control of the grouting volume is of great engineering significance for the realization of pile–soil cooperative work and optimization of the reinforcement effect.
3.2. Pile Top Load–Settlement
The load–settlement curve (Q–s) at the pile top is an important indicator for characterizing the bearing capacity of pile foundations. Analyzing the corresponding relationship between load and settlement on the curve, the vertical compressive ultimate bearing capacity of the model pile can be accurately determined. The load–settlement curves for the five model piles are depicted in
Figure 19. The loading values and pile top displacements are presented in
Table 3.
As depicted in
Figure 19, the Q–s curves of the four grouted model piles exhibit a gradual change prior to reaching the failure load.
Table 3 reveals that the ultimate bearing capacities of the five model piles are 5.6 kN, 10.3 kN, 15.4 kN, 12.6 kN, and 19.8 kN, respectively. Compared with the ungrouted model pile Z1, the grouted model piles Z2 through Z5 demonstrate a significant enhancement in ultimate bearing capacity, with increases of 83.9%, 175%, 125%, and 253.6%, respectively. When comparing the pile tip grouted model piles Z2 and Z4, it is evident that the ultimate bearing capacity rises by 22.3% when the pile tip grouting volume is augmented by 1 L. Similarly, a comparison of the pile tip and pile side grouted model piles Z3 and Z5 shows that the ultimate bearing capacity increases by 28.6% when the grouting amount at the pile tip remains constant and the grouting amount at each layer of the pile side is increased by 1 L. The displacement of the pile top after failure for the four grouted model piles is notably less than that of the ungrouted model pile, with the displacements being 57.6%, 62.3%, 69.5%, and 73.5% of the ungrouted model pile Z1, respectively. To assess the reliability of the reported displacement ratios, an uncertainty analysis of the measurement system was conducted. The pile head settlements were measured using electronic displacement meters with a resolution of ±0.05 mm. Considering potential fluctuations during manual loading, the total displacement measurement error was estimated to be within ±0.15 mm. Given that the failure stage displacements of the grouted piles ranged from 26 mm to 33 mm, the relative measurement error was approximately ±0.5%. When calculating the displacement ratios (relative to the ungrouted pile Z1), propagation of error leads to an estimated uncertainty of ±3.2%. These results indicate that the reported ratios are valid within acceptable experimental uncertainty bounds. The test results indicate that post-grouting slurry can enhance the structural stiffness of the soil surrounding the pile, increase both the pile tip resistance and pile side friction resistance, effectively reduce the settlement of the pile top, and improve the ultimate bearing capacity of the model pile. The impact of post-grouting slurry on the solidification, cementation, and compaction of pile tip sediment and pile side mud skin further enhances the structural stiffness of the soil around the pile, thereby increasing the pile tip resistance and pile side friction resistance, effectively reducing the settlement of the pile top, and improving the ultimate bearing capacity of the model pile. The ultimate bearing capacity of the model pile, when employing the same grouting method but varying grouting amounts, increases in correlation with the grouting volume.
3.3. Pile Axial Force
The axial force distribution of the five model piles under various loads can be indirectly calculated using the strain data collected by the U-shaped distributed sensing fiber embedded within the pile, with a spatial sampling interval of 0.25 m. The average strain value
for
a section of the pile body can be determined using the following Formula (3):
In the formula, and are the two strain values collected by the U-shaped distributed sensing fiber at the section position inside the pile body.
The axial force value
of the
section of the pile body can be calculated according to the following Formula (4):
In the formula, is the elastic modulus of the model pile; A is the cross-sectional area of the model pile.
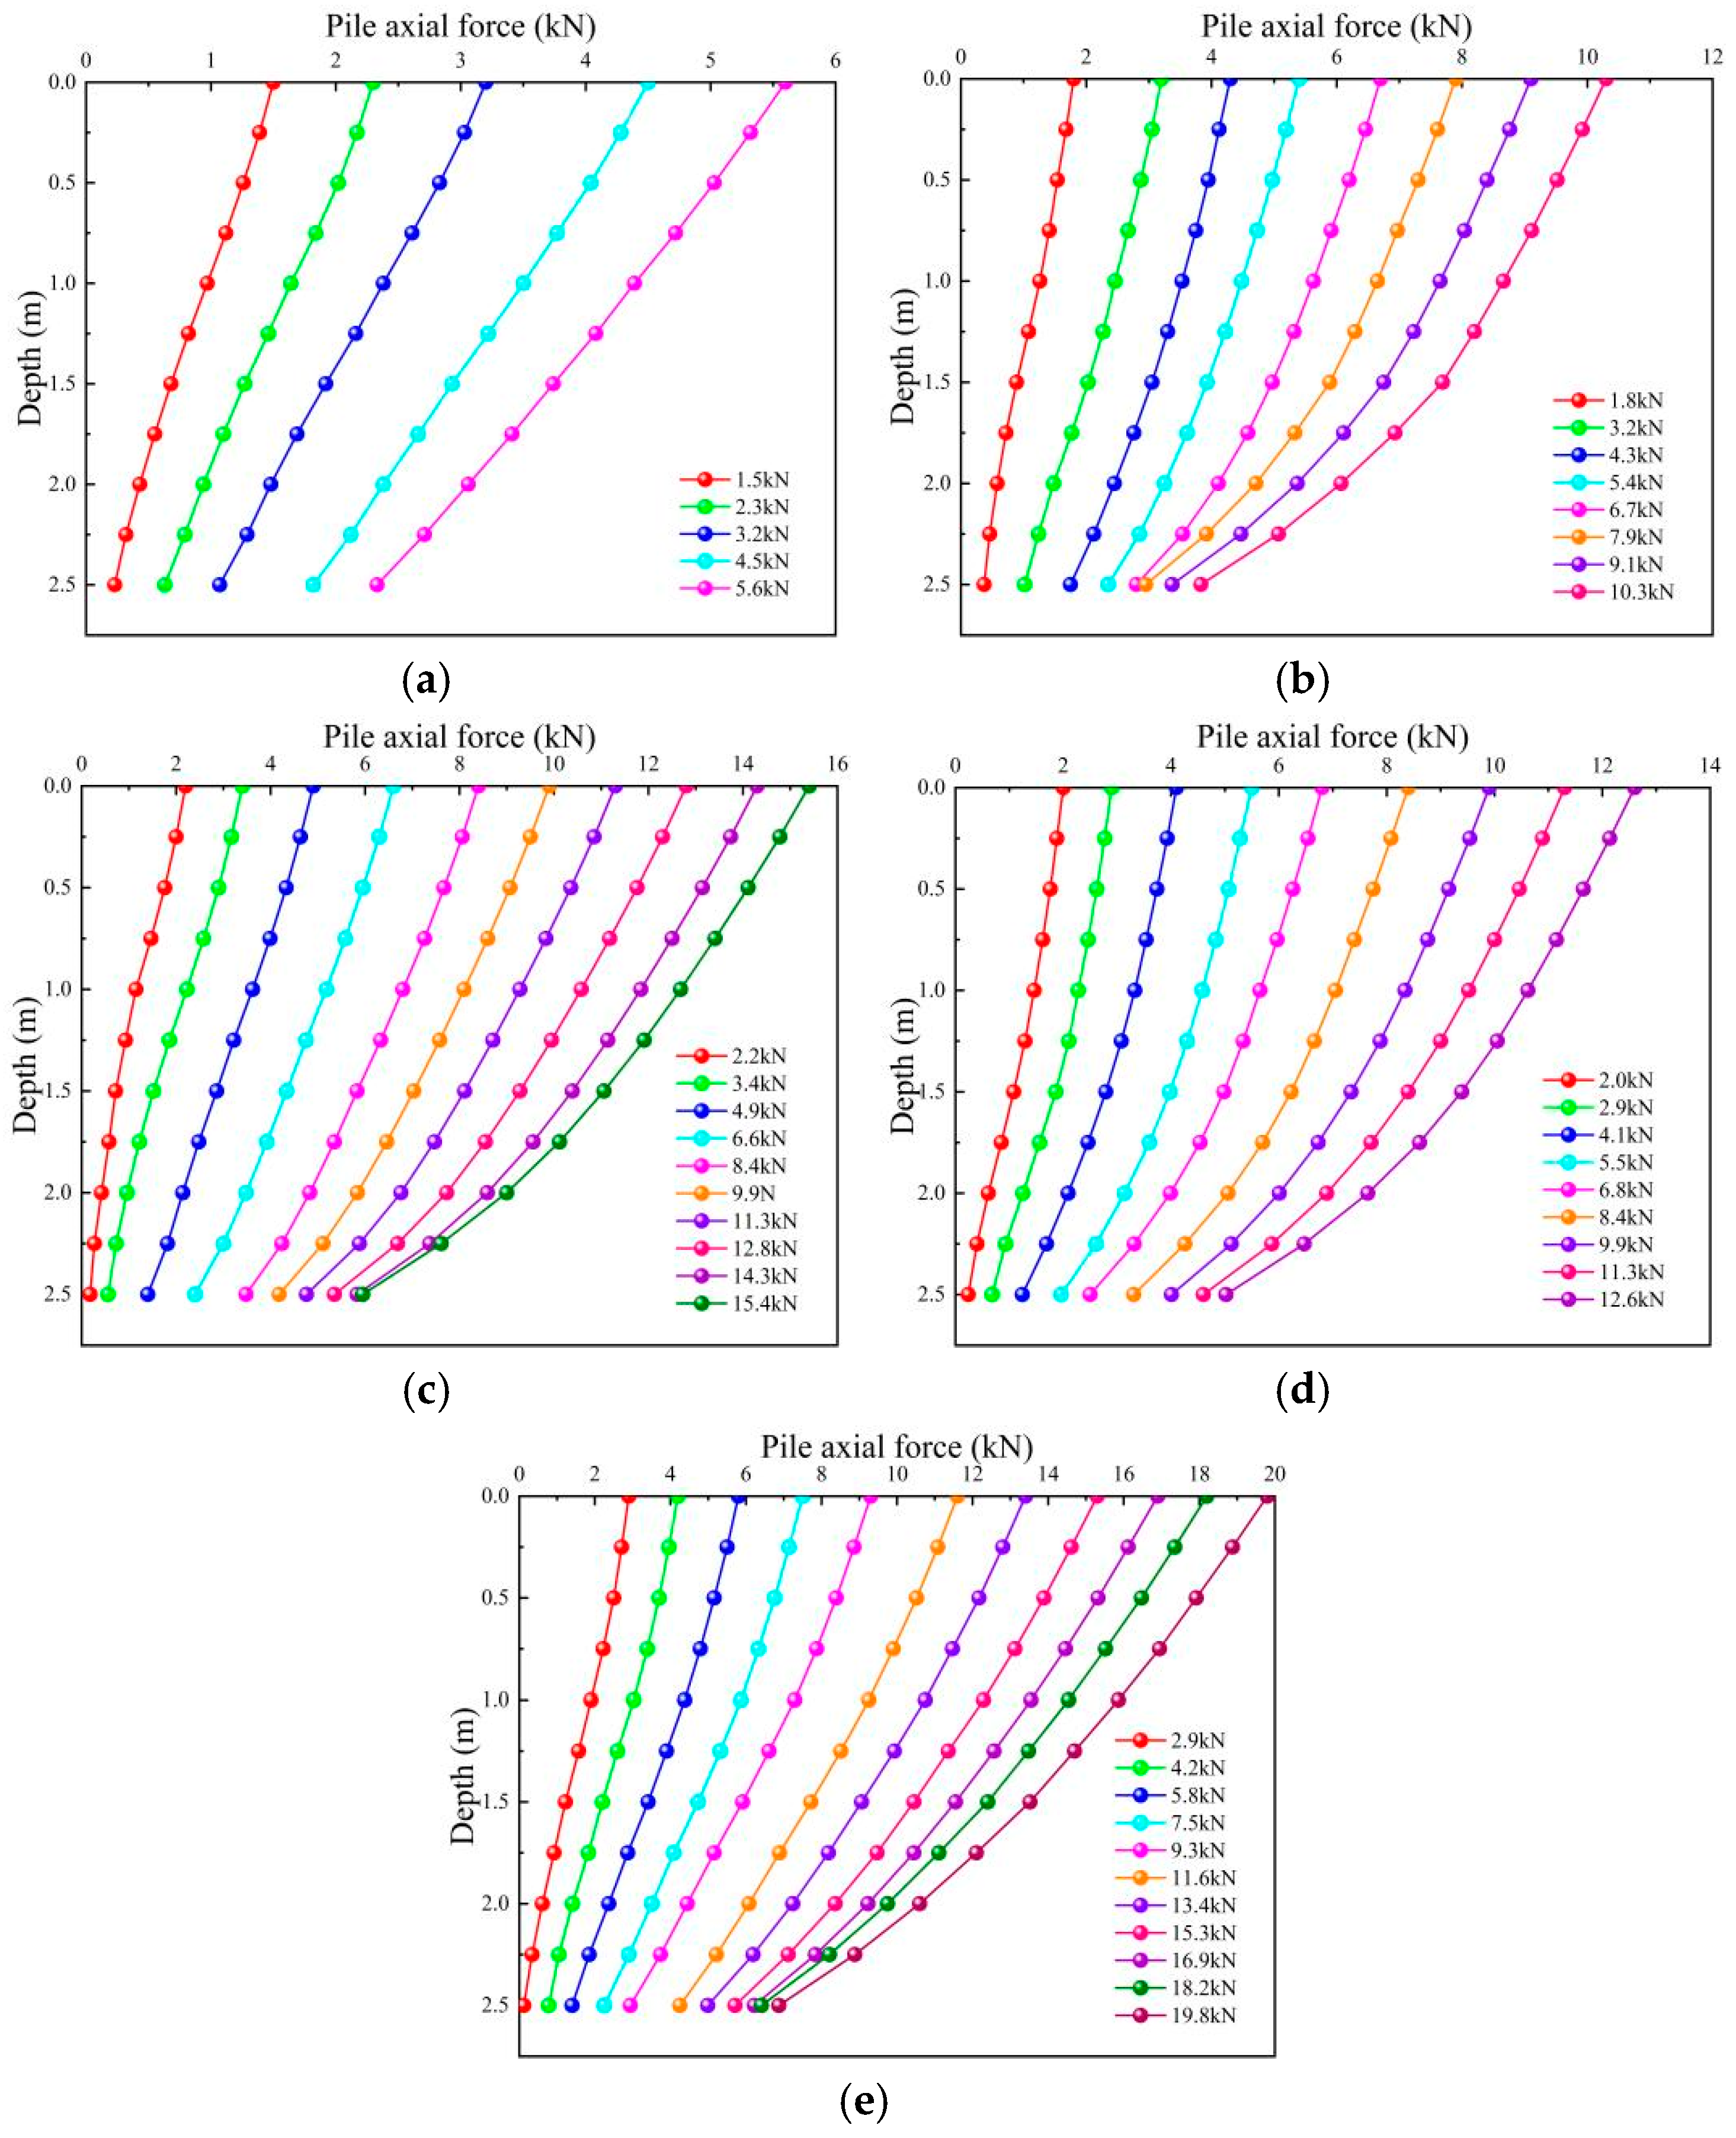
The distribution curve of the axial force along the pile body for each model, with respect to the pile foundation depth, is depicted in
Figure 20.
As shown in
Figure 20, the axial force distribution of the ungrouted pile Z1 is linear under all levels of loads, with no obvious inflection points. This indicates that the axial force difference between two adjacent measuring points is similar, and the distribution of the pile side friction along the pile body is more uniform. When the pile top load is large, the pile axial force distributions of the pile tip grouting piles Z2 and Z4, as well as the pile tip and pile side distributed grouting piles Z3 and Z5, exhibit inflection points at the pile foundation depths of 1.75 m, 1.5 m, 2.0 m, and 1.75 m, respectively. The slope of the curve below these inflection points is significantly reduced, and the axial force of the pile body attenuates rapidly.
The overall variation trend in the axial force distribution of the five model piles is similar. Under various loading conditions, the axial force in the pile body decreases gradually as the depth of the pile foundation increases, and increases with the rise in the load applied at the pile top. In the initial stage of loading, as the axial force at the pile top is small, the axial force transmitted from the pile top to the lower sections is minimal due to the frictional resistance of the pile side. As the load on the pile top increases, the slope of the axial force curve gradually decreases and the axial force at the pile top dissipates more rapidly down the pile body, with a greater proportion transferring to the lower sections of the pile. The frictional resistance along the pile side and the resistance at the pile tip also gradually become fully effective.
3.4. Pile Side Friction
The lateral friction resistance value between two adjacent measuring points on the pile body, under various loads, is determined by the axial force difference between these points and the cross-sectional area of the pile. The calculation is performed using the formula provided in Equation (5).
In the formula, is the axial force difference between the adjacent test sections of the pile body; D is the diameter of the pile; L is the vertical distance between the adjacent test sections of the pile.
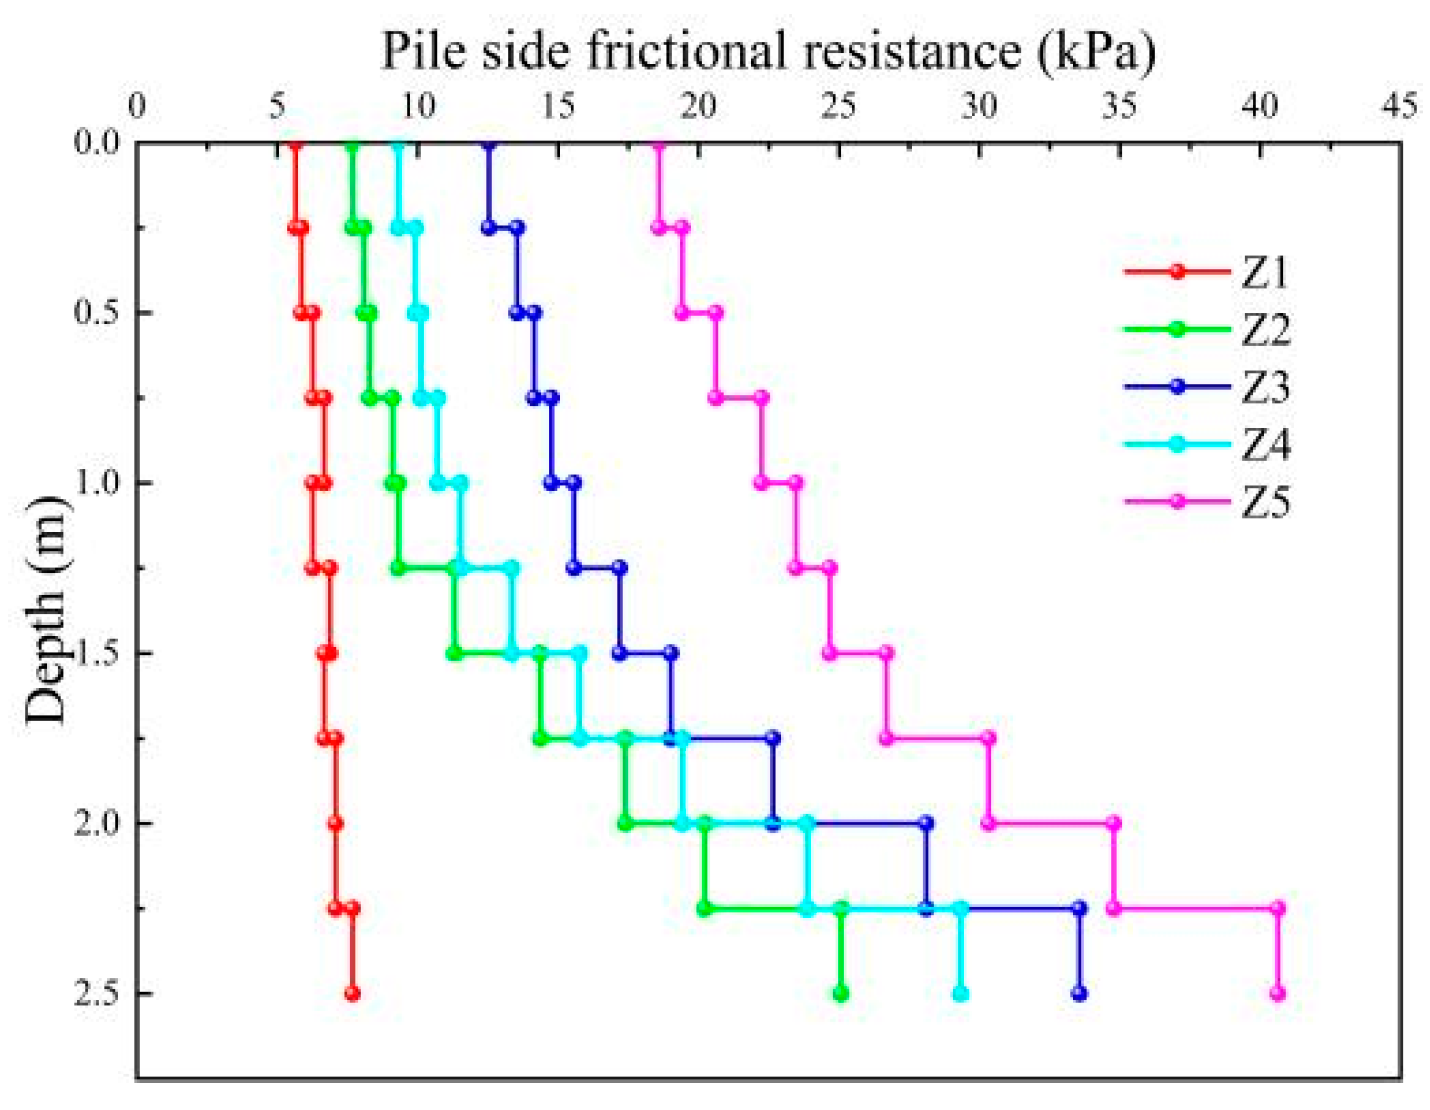
The distribution curve of the frictional resistance of each model pile side, along with the burial depth of the pile foundation, is shown in
Figure 21.
As shown in
Figure 21, the distribution of side friction resistance for the five model piles exhibits similar regularity characteristics: during the low-load phase, the side friction resistance at the upper portion of the pile body predominates, increasing initially and then decreasing with depth. As the load on the pile top increases, the lateral friction resistance of the lower portion of the pile becomes significant, with its growth rate surpassing that of the upper part of the pile. This phenomenon demonstrates the evolution process of the pile foundation’s bearing mechanism: at the onset of loading, the load is primarily sustained by the side friction resistance of the pile’s upper section. As the load on the pile top intensifies, the side friction resistance of the lower part of the pile body and the tip resistance gradually grow, cooperatively increasing the bearing capacity and ultimately establishing a composite bearing system.
The side friction resistance distribution of the five model piles under the ultimate load is shown in
Figure 22.
In
Figure 22, under the ultimate load, the side friction resistance of the upper portion of the pile body for the four grouted model piles differs significantly from that of the lower portion, with a considerable variation in the side friction resistance of the pile. Under the ultimate load, the average pile side friction resistance for model piles Z1 through Z5 is 6.61 kPa, 13.08 kPa, 19.11 kPa, 15.33 kPa, and 26.14 kPa, respectively. The side friction resistance of the pile tip grouting piles Z2 and Z4 increased by 97.9% and 131.9%, respectively, compared to the ungrouted pile Z1, with the increase being positively correlated with the amount of pile tip grouting. The side friction resistance of the pile tip and pile side grouting piles Z3 and Z5 increased by 189.1% and 295.5%, respectively, compared to the ungrouted pile Z1. When the amount of pile tip grouting is constant, the increase is positively correlated with the amount of pile side grouting.
3.5. Pile Tip Resistance
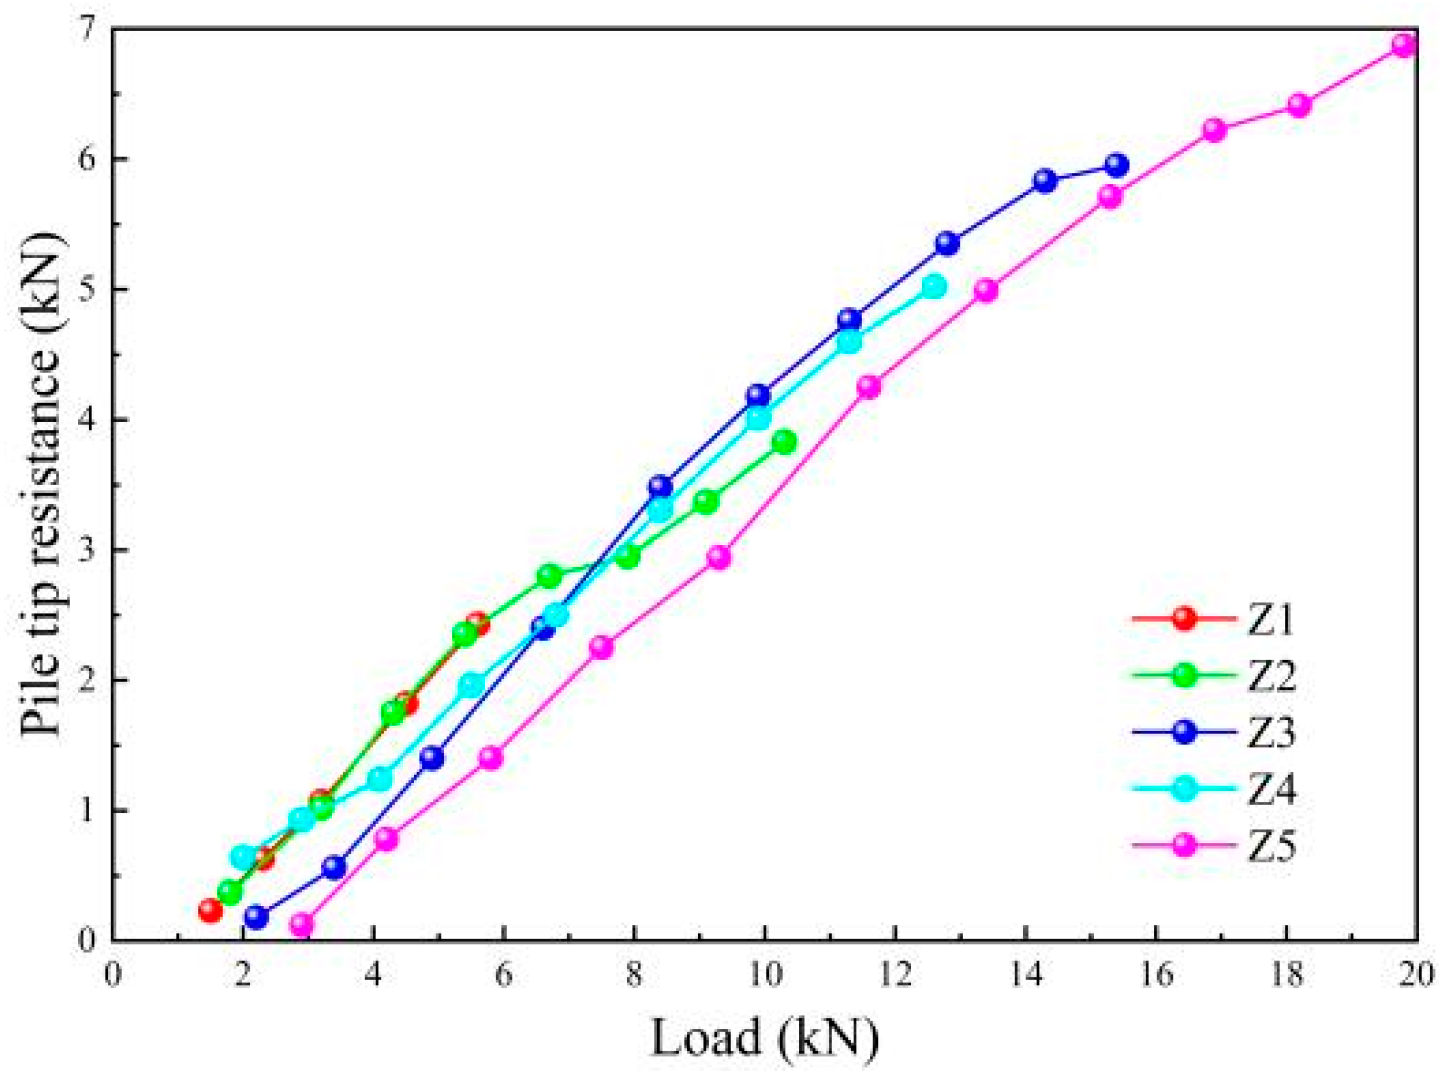
The pile tip resistance of the model pile was approximately determined by the axial force value calculated from the strain data of the distributed sensing fiber at the pile tip position, which was collected by the optical fiber demodulator under various loads. The distribution of pile tip resistance for the five model piles under these loads is depicted in
Figure 23.
In
Figure 23, the overall trend of the end resistance for the five model piles is similar. Under all loading levels, the end resistance of each pile increases incrementally with the progressive increase in the pile top load. However, the behavior of the pile end resistance varies. During the initial loading phase, the pile end resistances of the five model piles gradually become effective. As the pile top load increases, the lateral resistance and end resistance of the ungrouted pile Z1 are fully utilized, reaching their maximum bearing capacity. In contrast, at this stage, the lateral resistance and end resistance of the grouted piles have not yet reached their full potential.
Under the ultimate load, the pile tip resistance of model piles Z1 through Z5 is 2.43 kN, 3.83 kN, 5.90 kN, 5.02 kN, and 6.87 kN, respectively, accounting for 43.4%, 37.2%, 38.6%, 39.8%, and 34.7% of their ultimate load, respectively. All five model piles exhibit characteristics of friction piles. The ultimate pile tip resistance of pile tip grouting piles Z2 and Z4 increased by 57.6% and 106.6%, respectively, compared to that of the ungrouted pile Z1, and this increase is positively correlated with the pile tip grouting amount. The ultimate pile tip resistance of pile tip and pile side grouting piles Z3 and Z5 increased by 144.9% and 182.7%, respectively, compared to that of the ungrouted pile Z1. When the pile tip grouting amount was the same, the range of increase was positively correlated with the pile side grouting amount. The test results indicate that grouting piles Z2 through Z5 support solidification, cementation, and reinforcement on the pile side mud skin caused by the simulated pile tip sediment and water plug opening due to the upward and downward seepage of the grouting slurry. Additionally, the expansion head formed by the slurry hardening at the pile tip and the compaction effect of the cement stone body formed on the pile side enhanced the structural stiffness of the soil around the pile, thereby increasing the pile side friction resistance and the pile tip resistance.
3.6. Comparative Analysis of Pile Side Roughness of Model Pile and Actual Bored Pile
To ensure that the model test results have good engineering adaptability, this study quantitatively compared the pile side roughness of the model pile with that of the actual bored pile. Considering that pile side mechanical resistance is one of the key indices reflecting the roughness of the pile–soil interface, this study used the average pile side mechanical resistance under the limit state for comparison.
The test results show that the average pile side mechanical resistance of the ungrouted model pile (Z1) was 6.61 kPa, while according to the Technical Specification for Pile Foundation of Construction (JGJ 94-2008) and the relevant engineering measurement data, the typical side mechanical resistance of actual bored piles in pulverized clay layer is in the range of 15–30 kPa. According to this, the pile side roughness of the model piles is about 1/2 to 1/4 of that of the actual bored piles, indicating that the modeled piles were formed with the roughness of the pile–soil interface. This indicates a gap in roughness recovery in the model pile formation process. The main reason for this difference is that the model piles were filled with mortar by pulling out the pipe, which partially simulates the filling process but cannot completely restore the complex process of on-site piling disturbance, mud skin removal, and natural hardening interface.
It is worth noting that the pile side resistances of the model piles (e.g., Z3 and Z5) with distributed post-grouting technology increased to 19.11 kPa and 26.14 kPa, which were close to (or even exceeded) the performances of some actual piles. This shows that the post-grouting slurry formed a consolidated body and expanded head structure in the model, which effectively enhanced the strength of the pile–soil interface and compensated for the insufficient roughness of the model pile side.
In summary, the post-grouting measures can compensate for the difference in the interface conditions between the model pile and the prototype pile side, to a certain extent, and improve the representativeness and application value of the model test results.
