Article

Sensitivity of Human Thermal Comfort Benchmarks to Background Temperature and Individual Factors: An Empirical Study in Wuhan, China

1
School of Architecture & Urban Planning, Huazhong University of Science and Technology, Wuhan 430074, China
2
State Key Laboratory of Subtropical Building and Urban Science, Guangzhou 510641, China
3
China Construction No.3 Bureau No.3 Construction Engineering Co., Ltd., Wuhan 430223, China
4
China United Engineering Corporation Limited, Hangzhou 310000, China
5
Hubei Engineering and Technology Research Center of Urbanization, Wuhan 430074, China
6
Centre for Climate-Resilient and Low-Carbon Cities, School of Architecture and Urban Planning, Key Laboratory of New Technology for Construction of Cities in Mountain Area, Ministry of Education, Chongqing University, Chongqing 400045, China
7
School of Architecture, Design and Planning, The University of Queensland, Brisbane 4072, Australia
8
CMA Key Open Laboratory of Transforming Climate Resources to Economy, Chongqing 401147, China
*
Author to whom correspondence should be addressed.
Buildings 2025, 15(17), 3037; https://doi.org/10.3390/buildings15173037
Submission received: 18 July 2025 / Revised: 12 August 2025 / Accepted: 22 August 2025 / Published: 26 August 2025

Abstract

Individuals often adopt distinct behavioral patterns to adapt to different weather conditions. However, most studies on outdoor thermal comfort fail to consider weather variability and associated individual factors as interventions. This study conducted 12 days of field measurements and surveys across two residential areas in Wuhan, categorizing the sampled data based on background temperatures. Thermal benchmarks were developed for different age and gender groups under varying weather conditions, with comparative analyses conducted to evaluate differences in thermal comfort responses. With changes in outdoor temperature, the most comfortable thermal sensation in winter showed a wider fluctuation, ranging from 0.13 to 1.58, while in summer, it ranged between −1.76 and −1.18. The relationship between thermal sensation and comfort varied more significantly among different age groups in winter, while in summer, the differences were more evident between genders. As summer temperatures rose, younger and middle-aged individuals showed a greater increase in thermal sensitivity compared to the elderly. Similarly, males exhibited higher sensitivity than females. In terms of thermally acceptable temperatures, the upper limit was similar across age groups, around 35 °C. However, the lower limit varied as follows: the elderly had the lowest acceptable lower limit of around 0–3 °C; middle-aged individuals tolerated 4–7 °C higher; and young people tolerated 10–12 °C higher than the elderly. Between genders, the upper limit was also similar, but females tolerated 7–10 °C lower temperatures than males. In the context of outdoor thermal comfort studies in residential areas of Wuhan, the Universal Thermal Climate Index demonstrated better applicability than the Physiologically Equivalent Temperature. Overall, by analyzing thermal benchmark models for different demographic groups under varying weather conditions, this study enhances the understanding of how outdoor environments influence thermal comfort and provides valuable insights for targeted microclimate regulation and urban design strategies.

1. Introduction

Rising global temperatures and the frequency of extreme weather are serious problems for many cities [1]. As urbanization accelerates, extreme weather events in urban areas are expected to intensify [2]. This problem contributes to premature mortality in city populations [3]. A study on four heat waves in China in 2013 found a 10.51% increase in mortality risk, underscoring the urgent need for cities to prioritize the creation of healthy, comfortable, and safe outdoor thermal environments.
Outdoor thermal comfort (OTC) is a key indicator of the quality of the outdoor thermal environment. Outdoor meteorological parameters and individual factors are two important factors affecting OTC. Air temperature [4], relative humidity [5], wind speed [6], and mean radiant temperature [7] are the primary meteorological parameters influencing outdoor thermal comfort. Under different meteorological conditions, people’s thermal feeling and thermal comfort are often different. A study that altered the relative humidity in the outdoor environment by a misting system found significant differences in the fitted curves between thermal comfort indicators and thermal sensation under various humidity conditions [8]. As humidity rises, people show higher thermal acceptability. On the other hand, individual factors affecting outdoor thermal comfort include physiological factors, psychological factors, cultural factors, etc. [9]. People of different ages and genders differ in these aspects, resulting in their outdoor thermal sensations being different. Typically, compared to males, females tend to show higher sensitivity and are more susceptible to the outdoor weather temperature [10]. As for age, previous studies have shown that people become less sensitive to heat as they get older [11]. It can be seen that there are significant differences in thermal comfort among different groups. Therefore, when researching thermal comfort, it is necessary to distinguish and compare people of different ages and genders to clarify the differences in thermal comfort of different individuals in different outdoor environments. This will result in targeted strategies for the optimal design of the outdoor environment.
Changes in the outdoor environment synergize with people’s behavior, collectively impacting their thermal sensations. Generally, people make behavioral adjustments in response to weather changes to enhance their outdoor comfort [12]. In hot weather, people employ protective measures, such as using umbrellas, drinking water, and adjusting their travel time and activity type, to better cope with harsh outdoor conditions [13]. Such behavioral adaptations due to weather changes vary among different populations. For instance, in summer, women are more likely to use umbrellas for sun protection compared to men. Also, in winter, young people have a stronger willingness to carry out outdoor activities in the cold than the elderly. These coping behaviors in different weather conditions change the body’s physiological feedback to the outdoor environment, thus generating different outdoor thermal experiences [14]. The disparities in thermal adaptation behaviors among individuals, conversely, further magnify the differences in their outdoor thermal comfort. Yao et al. [15] contrasted the differences in people’s thermal adaptation behaviors and thermal benchmark models between heatwave and non-heatwave weather conditions. It was found that compared to non-heatwave weather, in heatwave weather, the thermal neutral, comfortable, and 80% acceptable ranges changed to higher temperatures, indicating that the high-temperature thermal experience enhanced people’s heat resistance. Xiong et al. [16] carried out an investigation on thermal comfort under various winter weather conditions in Chongqing, China. It was discovered that weather exerts a crucial influence on people’s outdoor activity patterns and, consequently, affects the thermal comfort sensations of different groups. Weather directly influences thermal perceptions while also indirectly shaping them through behavioral adaptations, making it a crucial factor in thermal comfort studies.
Different weather conditions, the physiological characteristics of different populations, and various adaptation behaviors jointly influence people’s outdoor thermal comfort [17]. There are also reciprocal influencing relationships among these factors, rendering the research on outdoor thermal comfort a complex problem [18]. Outdoor weather, as a crucial variable, is frequently changeable. However, most thermal comfort research is conducted in outdoor settings with minimal environmental fluctuations, often overlooking variable weather as a key factor influencing people’s thermal comfort and adaptation behaviors [19]. This omission can lead to inaccuracies in understanding the relationship between the environment and thermal comfort [20]. Additionally, it limits the ability to provide targeted guidance for protecting the health of diverse populations under varying outdoor weather conditions [21]. Therefore, it is necessary to compare and analyze the thermal comfort of different groups under varying weather conditions to develop targeted strategies that enhance protection across diverse weather scenarios.
The applicability of indicators used to evaluate thermal comfort in various scenarios and among different groups of people is equally a focus of thermal comfort research. Scholars have developed several indicators to capture the variability in people’s outdoor thermal comfort experiences [22]. These metrics consider various factors, including the outdoor environment, the subject’s clothing, and other elements, such as physiology [23]. Notably, PET and the UTCI are the most commonly used thermal comfort indicators [24]. PET is based on the Munich Energy Balance Model for Individuals (MEMI) output and is widely used in thermal comfort studies. PET was used for thermal comfort evaluation in 30.2% of 117 studies conducted between 2001 and 2017 [25]. PET has been widely used in studies evaluating outdoor thermal environments in various settings, including urban parks, public squares, commercial spaces, and university campuses. The UTCI was introduced as an indicator of thermal comfort in 1994 [26]. The advanced multi-node thermoregulation model developed by Fiala et al. provides the basis for the UTCI, representing a state-of-the-art advancement compared to PET. Studies have shown that on a microclimate scale, the UTCI is more sensitive to temporal fluctuations in meteorological elements than other comfort indices and effectively captures the subtleties of human perceptions of weather changes [27]. Thermal comfort studies using the UTCI have steadily increased in recent years. Due to the distinct underlying computational models of PET and the UTCI, their applicability varies across different populations, climatic backgrounds, seasons, and outdoor scenarios [28]. The discussion regarding the applicability of these two indices is a central topic in thermal comfort research. Table 1 summarizes the application of PET and the UTCI in outdoor thermal comfort studies conducted over the past decade across various climate zones. Research has shown that the predictive accuracy of PET and the UTCI for thermal comfort can vary depending on the outdoor setting and population characteristics. However, there remains a lack of systematic comparative studies on the applicability of these two indices under different weather conditions and among people of varying ages and genders [29]. This gap hinders the precise characterization of thermal comfort features across diverse population groups.
Based on the above research summary, two key issues are identified. First, most existing studies on thermal comfort focus on static outdoor environments and tend to overlook the influence of weather variability—a critical factor affecting thermal perception and adaptive behavior across different population groups. Second, the applicability of commonly used thermal comfort indices (PET and UTCI) still requires further validation through additional case studies and empirical data under diverse climatic conditions and geographical regions to ensure their robustness across various outdoor settings and user groups.
Building on this need, this study aims to examine the differences in thermal comfort across individuals under varying weather conditions. Focusing on winter and summer, the weather during the measurement period was categorized into hot and cold conditions using background temperature classification. This study analyzed different individuals’ thermal sensation and comfort responses under these conditions. Additionally, thermal benchmark models for different populations were constructed and compared. This study’s objectives are as follows: (1) To compare the relationship between thermal sensation and thermal comfort across different populations in various weather conditions during winter and summer. (2) To analyze differences in thermal benchmark models across age and gender groups under different weather conditions. (3) To evaluate the applicability of thermal comfort assessment metrics, namely, PET and the UTCI, across different weather conditions.

2. Methodology

Field studies and onsite surveys were conducted to achieve the research objectives. Outdoor meteorological data (air temperature, Ta; relative humidity, RH; black globe temperature, Tg; wind speed, Va; etc.), thermal sensation data of respondents (thermal sensation vote, TSV; thermal comfort vote, TCV; thermal acceptability vote, TAV), and behavior records (activity time; thermal adaptation behavior vote) were collected. Based on the collected data, this study first categorized weather conditions by temperature and segmented the population by gender and age. According to these classifications, the relationships between various thermal comfort indicators were examined, including Mean Thermal Comfort Vote (MTCV) and TSV, Mean Thermal Sensation Vote (MTSV) and thermal indices, and the Thermal Acceptable Range (TAR) and thermal indices. Furthermore, differences in thermal adaptation behaviors among various demographic groups were examined. These analyses aimed to explore differences in neutral temperature, the neutral temperature range, and the thermal acceptable range across different population groups under varying weather conditions. The framework of this study is shown in Figure 1. The following sections describe the experimental location, meteorological measurement, questionnaire survey, thermal comfort index, and analysis involved in this study.

2.1. Study Area

Wuhan (30°40′ N, 114°23′ E), a megacity in the middle and lower reaches of the Yangtze River, was selected as the study area. Wuhan falls under the Cfa classification in the Köppen climate system, indicating a humid subtropical climate characterized by hot, humid summers and mild, damp winters [48]. As a representative city in China’s “hot summer and cold winter” climate zone, Wuhan experiences both extreme heat in summer and severe cold in winter, which are the primary factors affecting outdoor thermal comfort [49]. Figure 2 presents the monthly average Ta, maximum Ta, minimum Ta, and RH in Wuhan from 2002 to 2022. These meteorological data were obtained through long-term observations by the Wuhan Tianhe Meteorological Station [50]. The annual average Ta ranges from 4.3 °C to 29.5 °C, with a maximum of 37.8 °C in July and a minimum of −3.9 °C in January, resulting in a temperature variation of over 40 °C. Summer, spanning June to August, has an average Ta of approximately 28.1 °C, with peak temperatures exceeding 38 °C. Winter, from December to February, has an average Ta of around 5.9 °C, with minimum temperatures dropping below −4 °C. The transition seasons are relatively short. The average monthly RH fluctuates between 72.8% and 76.9%. Due to the significant impact of extreme weather in winter and summer, previous studies in Wuhan have mainly focused on these two seasons. Accordingly, this study also examined the outdoor environment and thermal comfort of residential areas during summer and winter.

2.2. Site Selection for the Field Experiment and Questionnaire Surveys

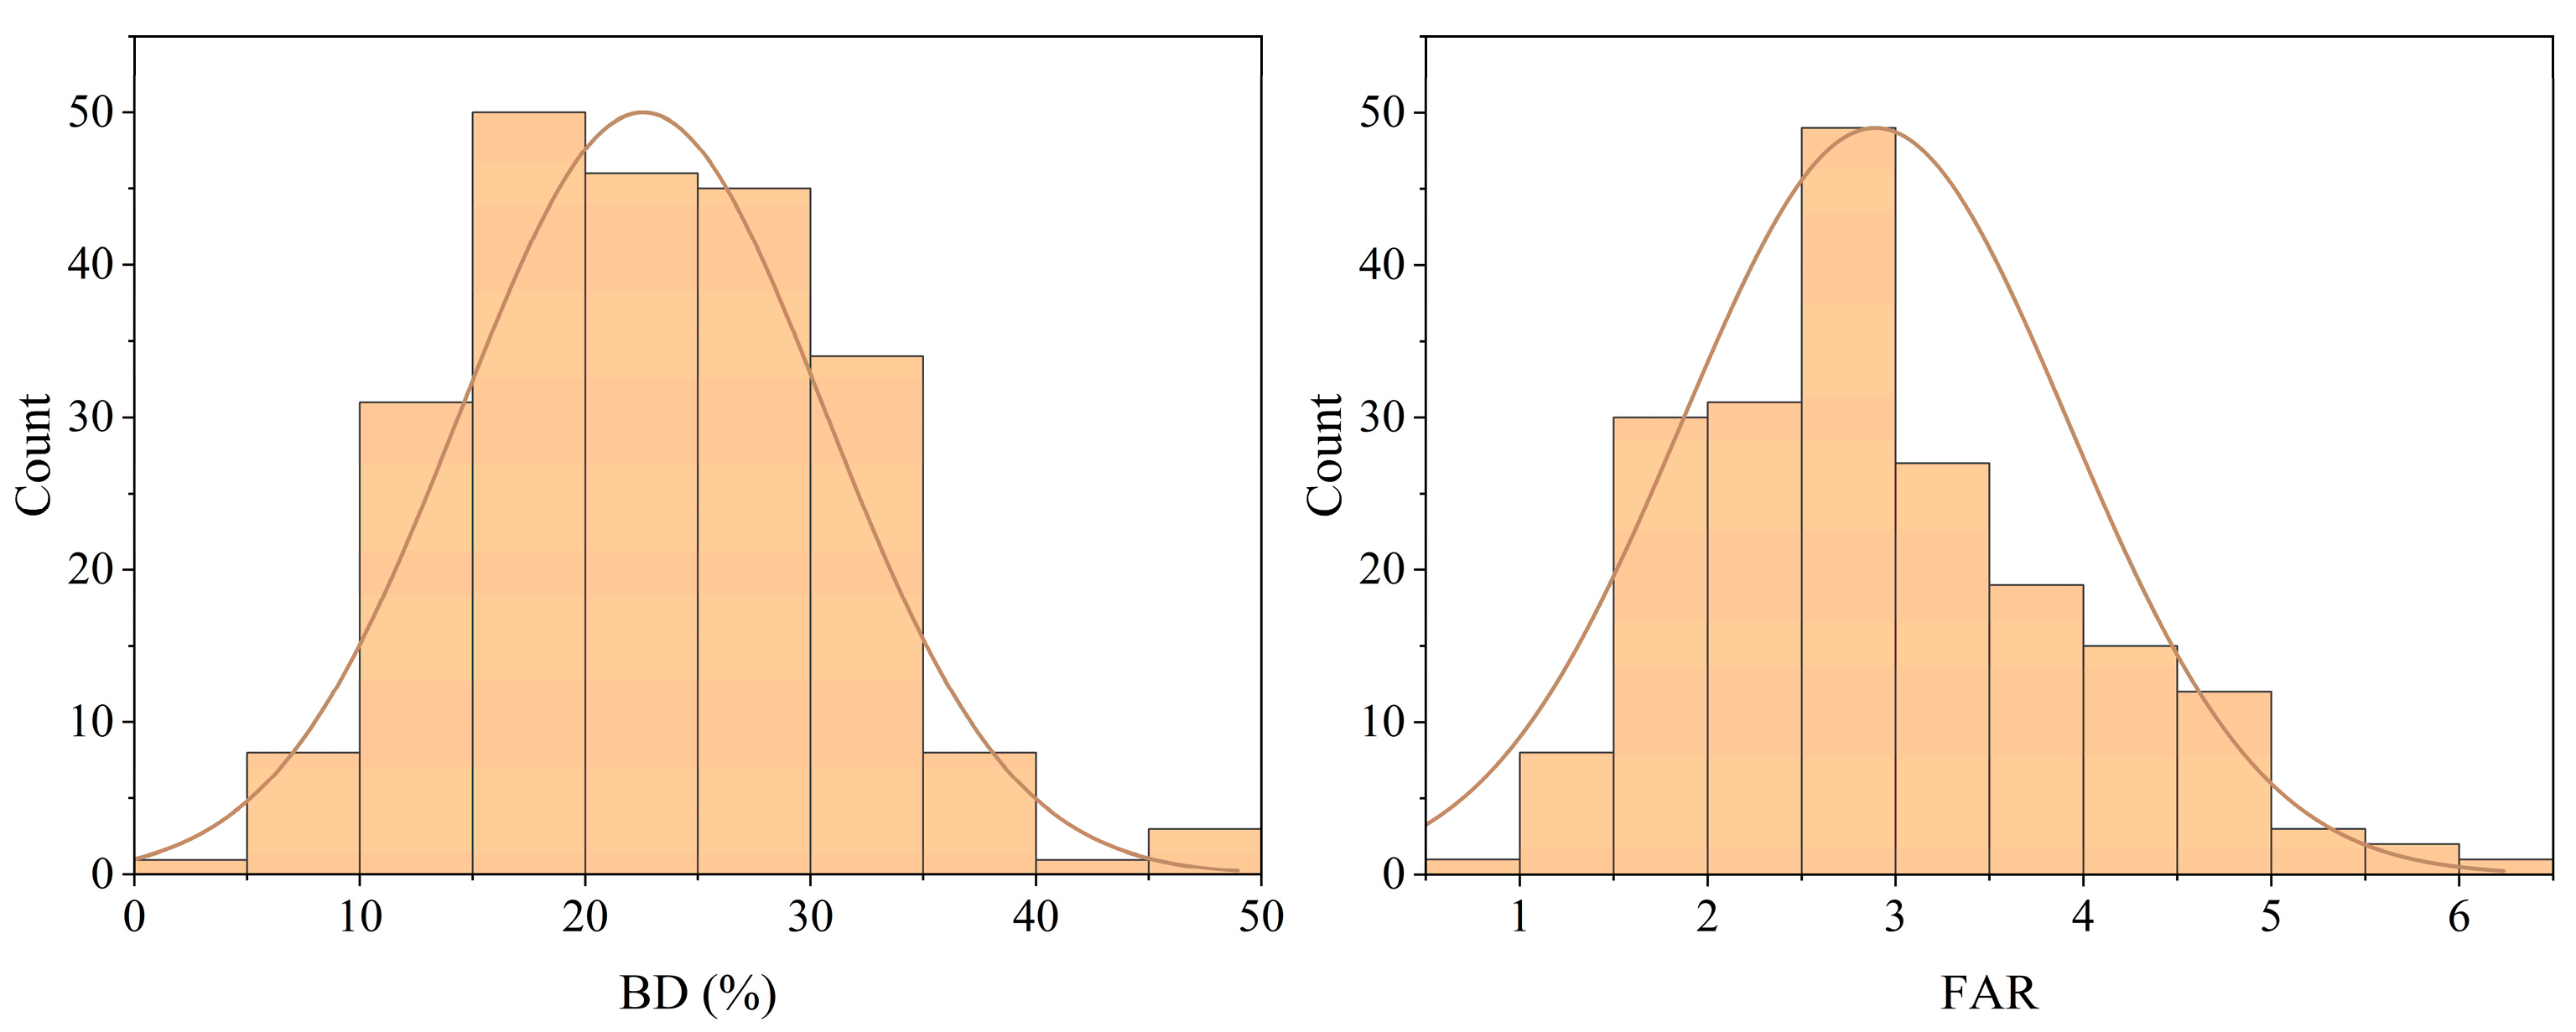
Gufeng Community and Xingfuli Community in Wuhan were selected as the study sites. Both were built around 2000, have relatively high population densities, and include residents of diverse age groups. The two communities differ in spatial characteristics: Gufeng has a building density of 25.8% and a floor area ratio of 2.4, while Xingfuli has a building density of 32.8% and a floor area ratio of 3.3. To verify their representativeness, building density and floor area ratio data from 225 typical residential communities across Wuhan were analyzed. The results show that both communities fall within the mid-range of the overall distribution (Figure 3), indicating good representativeness at the city level.
Meteorological parameters and human activity patterns vary across different outdoor spaces. To ensure a diverse and representative dataset, measurements were conducted in multiple environments. Based on the spatial layout of the two residential communities and residents’ activity patterns, four representative outdoor spaces were selected for meteorological monitoring, namely, areas around buildings, roads, tree-shaded zones, and open squares, as shown in Figure 4. Detailed information is shown in Table 2. This site selection approach ensured comprehensive coverage of different microclimatic conditions and enhanced the reliability of this study’s findings.

2.3. Meteorological Measurement

Field measurements were conducted over ten days in January 2022, the coldest month, and ten days in July and August 2022, the hottest months. Six days of measured data were selected for analysis in winter and summer. Considering the different sunrise and sunset times in each season and the typical activity patterns of residents, outdoor thermal comfort and microclimate surveys were conducted from 9:00 to 17:00 in winter and 8:30 to 18:00 in summer (Table 3).
Meteorological parameters, including Ta, RH, Tg, Va, and wind direction, were obtained from the field survey. The measurement devices included a small weather station (PC-8/8A) and a handheld black globe thermometer (TM-188D). All meteorological sensors were calibrated before deployment, and the black globe thermometers were factory-calibrated. To ensure stable readings, the black globe thermometers were set up about an hour before measurements, allowing sufficient time for thermal equilibrium. They were fully exposed to solar radiation without shading, following standard practice for Tmrt measurement [51]. Wind effects on black globe temperature were not corrected, as the UTCI calculation inherently accounts for wind speed. The sensors were placed at a height of 1.1 m above the ground, and data were automatically recorded at 1 min/session intervals.

2.4. Questionnaire Survey

Respondents within 5 m of the measurement point were surveyed with a questionnaire at the same time as the field measurement. The survey consisted of three parts, as shown in Figure 5. The first part was the survey information, such as the date, time, and location. The second part recorded the respondents’ basic personal information, such as age, gender, and garment. To ensure stable and representative thermal sensations, all the respondents had stayed at the same location and maintained the same activity for at least the previous 15 min, aligning with ASHRAE guidelines [52]. In particular, detailed clothing information (e.g., type and number of clothing items) was collected and later quantified by calculating clothing insulation (clo) values according to international standards of ASHRAE Standard 55 [52]. These clo values were subsequently used as input parameters for calculating thermal comfort indices. Additionally, the respondents’ activity types (e.g., running, rope skipping, brisk walking, Tai Chi, playing cards, chatting, sitting) were obtained through direct interviews and recorded in written form. The metabolic rates (MET) corresponding to these activities were calculated based on the 2011 Compendium of Physical Activities [53] and ISO 8996:2021 [54], considering the physiological characteristics of the respondents. The third part gathered the respondents’ thermal sensations, comfort, acceptability, and weather preferences in the current thermal environment. Thermal sensations were judged by the traditional ASHRAE 7-point scale [52]. Thermal comfort used a 4-point scale. Thermal acceptability was expressed by a 5-point scale. Preferences for air temperature, wind speed, solar radiation, and humidity were recorded using a 3-point scale. All questionnaire surveys were conducted with the informed consent of the participants, and their explicit permission was obtained prior to participation.
A total of 1281 valid questionnaires were collected. To ensure the validity of the survey responses and the representativeness of the study area, the questionnaire data were carefully screened and filtered. First, considering the significant differences in thermal comfort perception between adolescents (under 18 years old) and adults, the responses from individuals under 18 were intentionally excluded. Second, the questionnaires showing substantial discrepancies between thermal sensation votes and corresponding meteorological parameters were removed as outliers. Finally, a stratified random sampling method was employed based on age groups and gender, ensuring that the demographic composition of the sampled respondents aligned with the overall population structure of the local community. Finally, 1138 valid questionnaires were collected, including 515 in winter and 623 in summer. There were slightly more male than female respondents, with a proportion of 55.54% men and 44.46% women. According to the age distribution of the respondents of the survey and other related studies [55], the respondents were divided into the youth group (19–45 years), the middle-aged group (46–64 years), and the elderly group (over 65 years old) by age. Among them, the youth group accounted for 36.56%, the middle-aged group accounted for 40.25%, and the elderly group accounted for 23.20%. All the respondents had resided in the community for more than one year and were adapted to the local climate. Consequently, they were capable of accurately and objectively perceiving outdoor thermal environments. Table 4 records the number of questionnaires for different populations.

2.5. Thermal Comfort Index and Analysis

This study utilized PET and the UTCI for outdoor thermal comfort evaluation. These widely used metrics have been thoroughly researched across various climates and are presented in °C, making them easily understandable for urban planners and policymakers. The latest Rayman Pro thermal comfort calculation software can compute PET and the UTCI. The Rayman model is specifically designed to calculate solar radiation fluxes and thermal comfort indices in urban environments [56]. Although its one-dimensional nature limits its ability to fully capture highly dynamic or irregular urban settings, it has proven effective in a wide range of outdoor thermal comfort studies. The model requires input parameters, including the time of data collection, the geographic location of the sampling point, meteorological conditions (Ta, RH, Va, and Tmrt), and personal variables (metabolic rate and clothing thermal resistance). Among these parameters, Ta, RH, and Va can be directly measured and entered into the software. Tmrt cannot be obtained from instrumental measurements, so it needs to be further calculated by combining Tg, Va, and Ta [57]. The Tmrt calculation formula is obtained as shown in Equation (1).
T m r t = T g + 273 4 + 1.1 × 10 8 × V 0.6 ε × D 0.4 T g T a 1 4 273
where D is the globe diameter (0.05 m in this study) and ε is the globe emissivity (ε = 0.95).
Further calculations are necessary for the wind speed values. PET calculations require wind speeds measured at 1.1 m, while UTCI calculations require wind speeds at 10 m above ground level. Obtaining wind speeds at both 1.1 m and 10 m heights can be challenging due to measurement equipment limitations. As a result, this study follows the recommendation in Bröde [26] and other sources to estimate the 10 m height wind speed values using the wind profile equation provided below:
v z = v m × l o g z z 0 l o g m z 0
where vm is the wind speed at measurement height, m is wind speed measurement height (m), and z0 [26] is 0.01 m for an urban street environment.

2.6. Analytical Objectives

This study initially classified winter and summer weather during the measurement period based on background temperature. During the measurement period, the average Ta was 7.8 °C in winter and 35.1 °C in summer. The lowest recorded temperature occurred on January 12, 2022, at 2.6 °C, while the highest was observed on August 8, 2022, at 40.1 °C. Considering the balance of sample size after classification, in winter, the days were classified into four groups based on their daily average Ta: 5–6 °C (January 13), 7–8 °C (January 9, 11, and 12), 8–9 °C (January 18), and 10–11 °C (January 17). Five groups were identified in summer: 32–33 °C (July 30), 33–34 °C (July 31), 35–36 °C (August 6 and 7), 36–37 °C (August 2), and 37–38 °C (August 8).
This study further categorized the winter and summer data into high- and low-weather-temperature days based on the daily average temperature. In summer, 35 °C is widely recognized as a key temperature threshold, with many countries and regions using it as the benchmark for high-temperature warnings [58]. The China Meteorological Administration (CMA) typically issues a yellow high-temperature warning when temperatures exceed 35 °C [59]. Accordingly, this study adopted 35 °C as the classification criterion for summer: temperatures below 35 °C were classified as cool summer weather (e.g., July 30 and 31); temperatures above 35 °C were classified as hot summer weather (e.g., August 2, 6, 7, and 8). In winter, there is no universally established standard for temperature classification. During the measurement period, the average outdoor temperature ranged from 5 to 11 °C. Based on this, an intermediate value of 8 °C was selected as the classification criterion: temperatures above 8 °C were classified as warm winter weather (e.g., January 17 and 18); temperatures below 8 °C were classified as cold winter weather (e.g., January 9, 11, 12, and 13). The results of the classification can be seen in Table 5.

3. Results

3.1. Percentage of Thermal Sensation Vote

Figure 6 presents the distribution of TSV across the different age groups and genders under various weather temperatures. The pattern of thermal sensation changes with increasing temperature varies between winter and summer. In winter, the proportion of individuals feeling cold (TSV < 0) decreased as temperatures rose, while in summer, the proportion of people feeling hot (TCV > 0) fluctuated with temperature changes.
In winter, the change in the thermal sensation pattern was similar for males and females, with the percentage of individuals feeling cold decreasing as the temperature increased. However, in summer, the thermal sensation to rising temperatures differed between the genders. For males, the proportion of those feeling hot increased gradually when the temperature rose and then declined slowly. In contrast, for females, the proportion of those feeling hot rose steadily with temperature, peaked significantly around 35 °C, and then dropped sharply before stabilizing.
The pattern of thermal sensation change was similar across ages in winter, with a steady decline in those feeling cold as temperatures increased. In summer, middle-aged and elderly individuals exhibited similar patterns, with the proportion of those feeling hot first rising, then declining, and then showing fluctuations. For young individuals, the proportion of those feeling hot initially decreased, then increased as temperatures rose, and then peaked at 36–37 °C before dropping, resulting in greater oscillation.
Overall, the different groups exhibited distinct thermal sensation patterns in response to temperature variations, particularly in summer. In winter, the proportion of individuals feeling cold consistently decreased as temperatures rose. In summer, males showed a more gradual change in thermal sensation, whereas females experienced sharper fluctuations. Middle-aged and elderly individuals exhibited relatively stable responses, while younger individuals displayed the most pronounced oscillations.

3.2. Percentage of Thermal Comfort Vote

Figure 7 presents the distribution of TCV across the different age and gender groups under varying temperatures. In winter, the proportion of individuals experiencing discomfort (TCV < 0) showed a clear decreasing trend as temperatures increased. In summer, the percentage remained relatively stable until temperatures reached 36 °C, where a sharp increase was observed in the 36–37 °C range, followed by a slight decline as temperatures continued to rise.
In winter, the percentage of individuals experiencing discomfort followed different trends across the groups. Among males and middle-aged individuals, the proportion initially decreased, then increased, and subsequently declined again. In contrast, the other groups exhibited a steady decrease in discomfort as temperatures rose. In summer, the TCV distribution showed more complexity. Below 36 °C, the percentage of TCV < 0 among females decreased significantly with rising temperatures, while the elderly group exhibited a slight increase after an initial decline. The other groups showed no distinct pattern. Above 36 °C, discomfort levels increased sharply across all the groups, peaking in the 36–37 °C range before experiencing a slight decline.
Overall, the changes in individual thermal comfort did not show a clear trend of increasing or decreasing as weather temperatures increased. The results suggest that 36 °C appears to be a critical temperature point influencing TCV. Once temperatures reached this point, significant changes in thermal comfort were observed. This phenomenon may be attributed to the core temperature of the human body. Typically, the core body temperature ranges from 36 °C (96.8 °F) to 37 °C (98.6 °F) [60]. When outdoor temperatures exceed 36 °C, the body’s heat dissipation burden increases significantly, impacting outdoor thermal comfort. Interestingly, while the proportion of TCV < 0 increased significantly at 36 °C, it unexpectedly decreased at 37–38 °C. One possible explanation is that the respondents may have consciously reduced their exposure to extreme heat—for instance, by limiting outdoor activities or adopting protective behaviors.

4. Analysis of the Thermal Benchmarks with Different Individuals and Weather Temperatures

4.1. Relationship Between TSV and TCV

This section explores the relationship between thermal sensation and thermal comfort across the different experimental groups, considering the effects of weather temperature, age, and gender on the association between TSV and TCV. The relationship was modeled across various weather conditions and demographic groups. The MTCV corresponding to each unit of TSV was calculated, and a quadratic function was used to analyze the correlation.

4.1.1. Analysis of Different Weather Temperatures

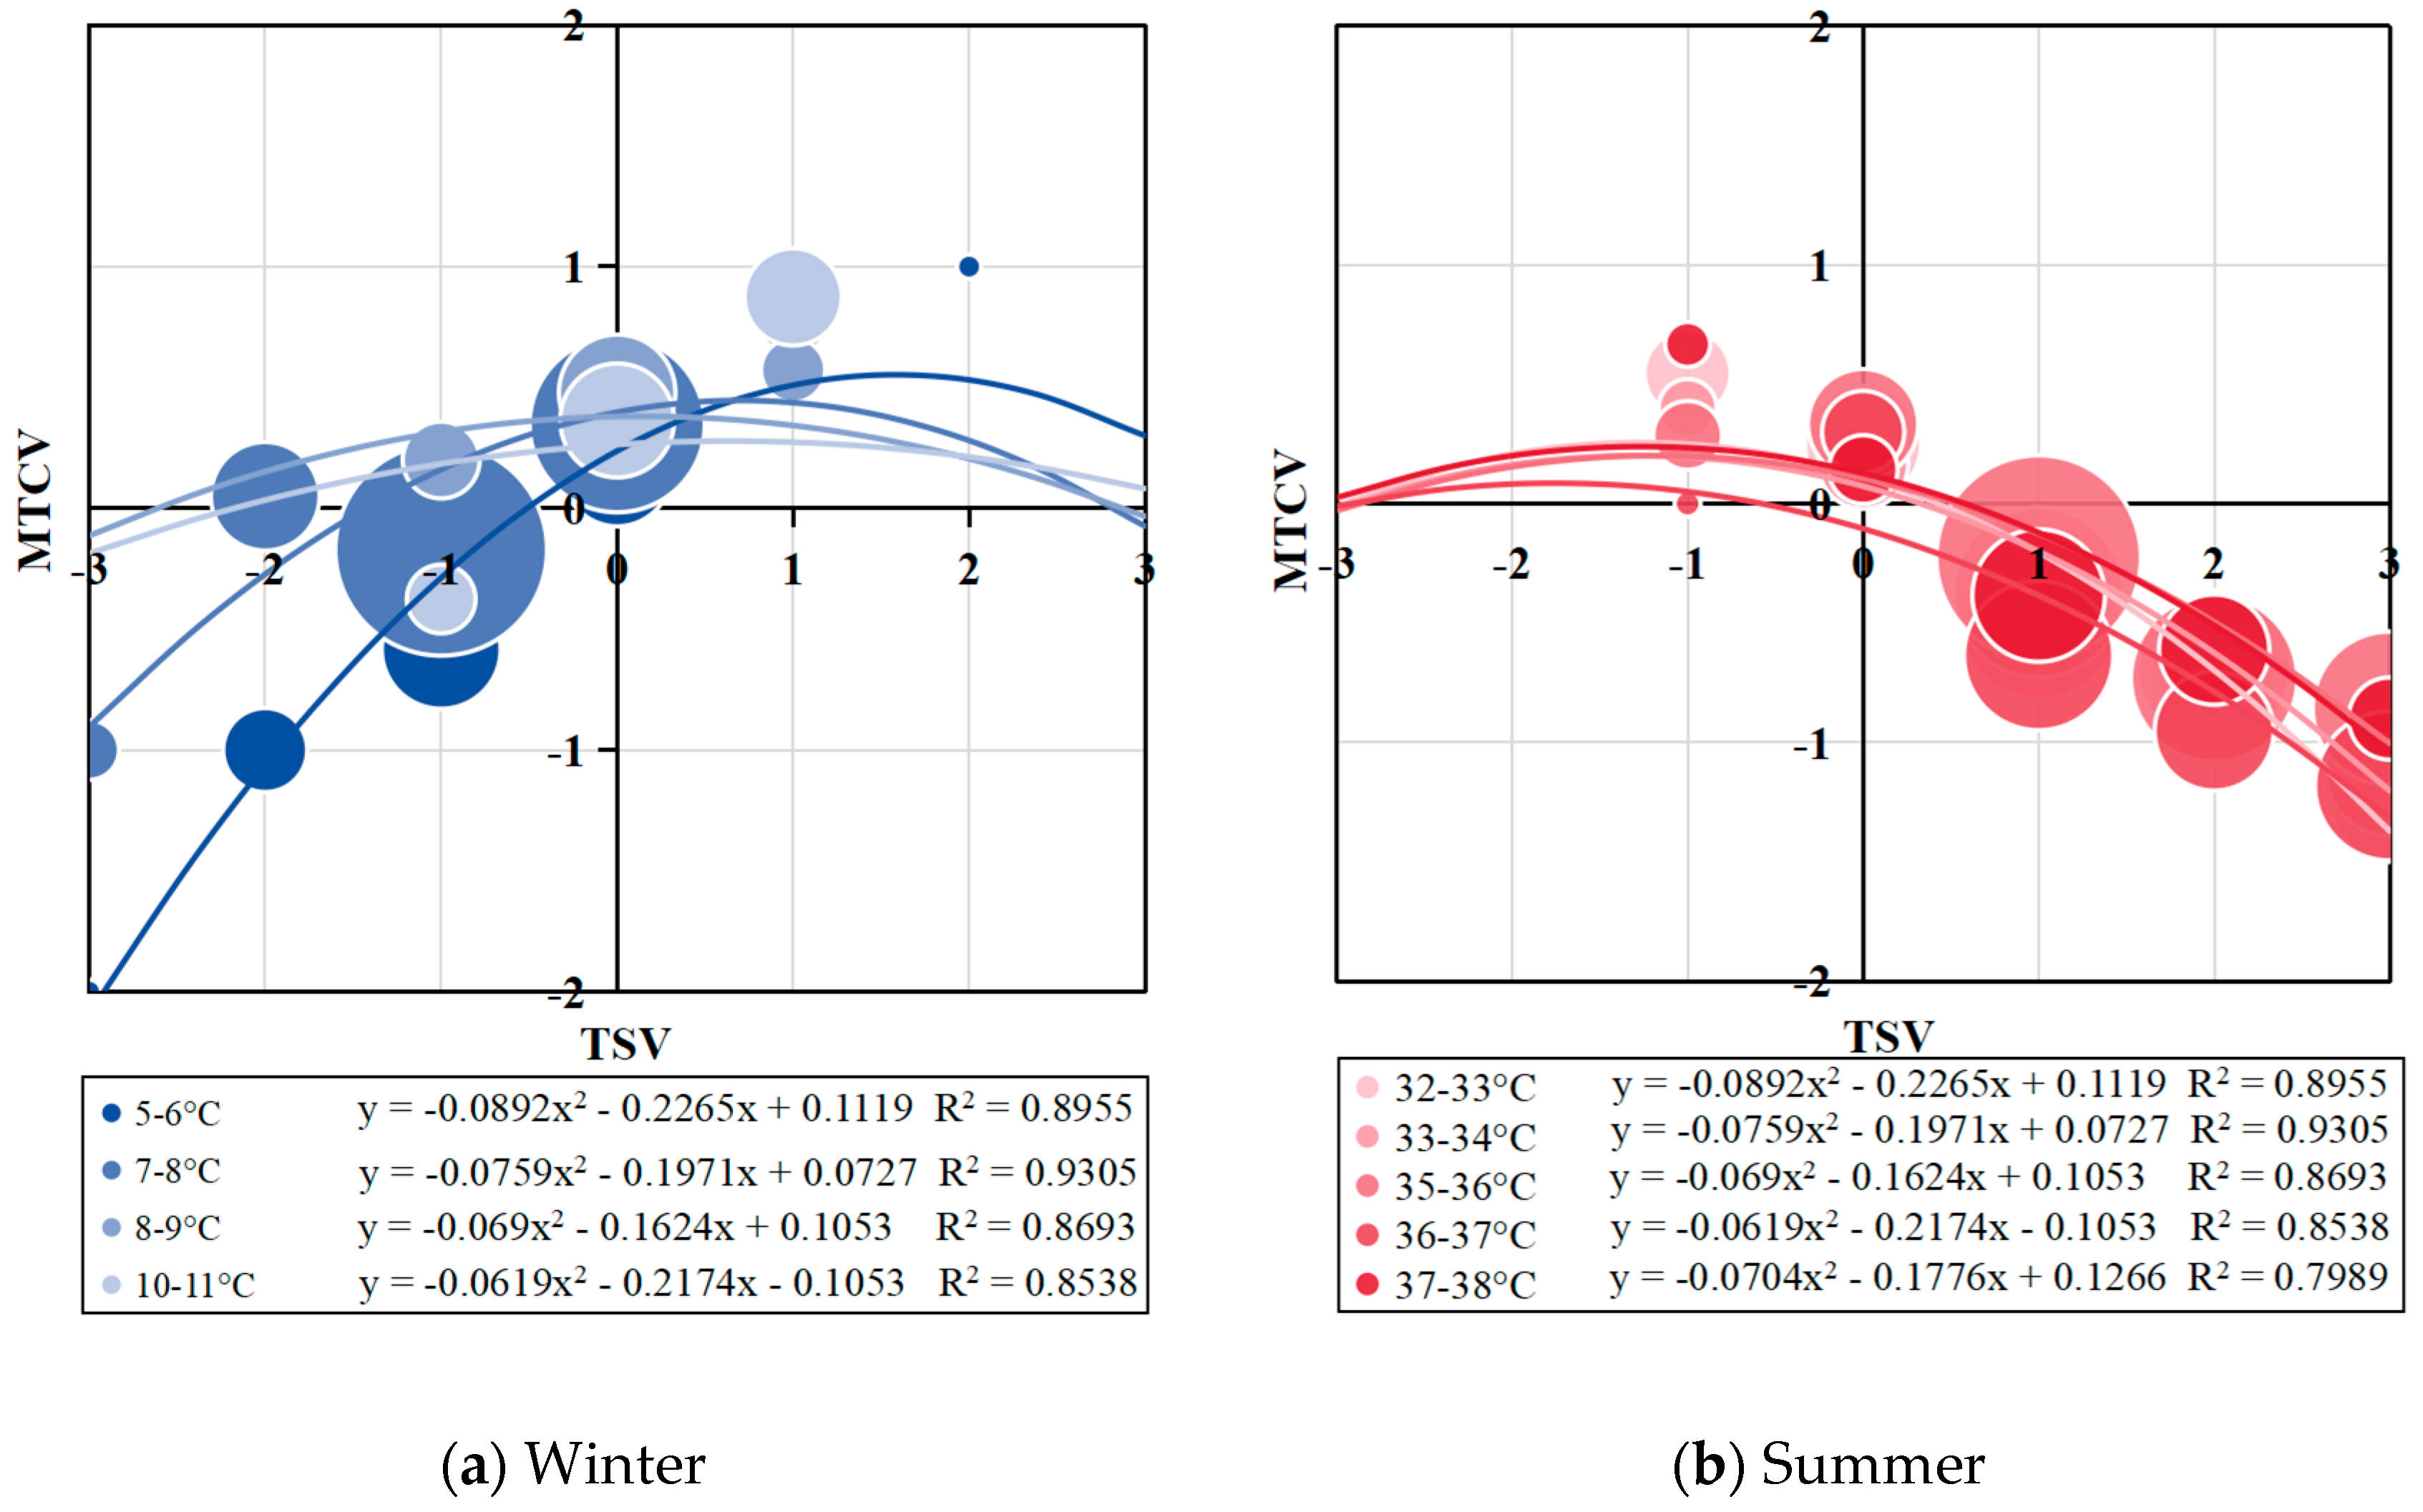
Figure 8 illustrates the fitted curves between TSV and MTCV under different weather temperatures. In winter, the curvature of the fitted curves gradually decreased as temperature increased, leading to an expansion of the TSV range where individuals felt comfortable (TCV > 0), which also shifted toward lower TSV values. Across all the groups, the TSV corresponding to the maximum TCV ranged from 0.13 to 1.58. In summer, the quadratic fitting curves between TSV and MTCV exhibited similar trends across different temperatures. For each group, the TSV associated with the highest comfort consistently remained below 0, ranging from −1.76 to −1.18. Overall, the influence of weather temperature on the TSV-TCV relationship was more pronounced in winter than in summer. Additionally, higher winter temperatures expanded the thermal sensation range associated with comfort, making it easier for individuals to achieve thermal comfort.

4.1.2. Analysis of Different Age Groups

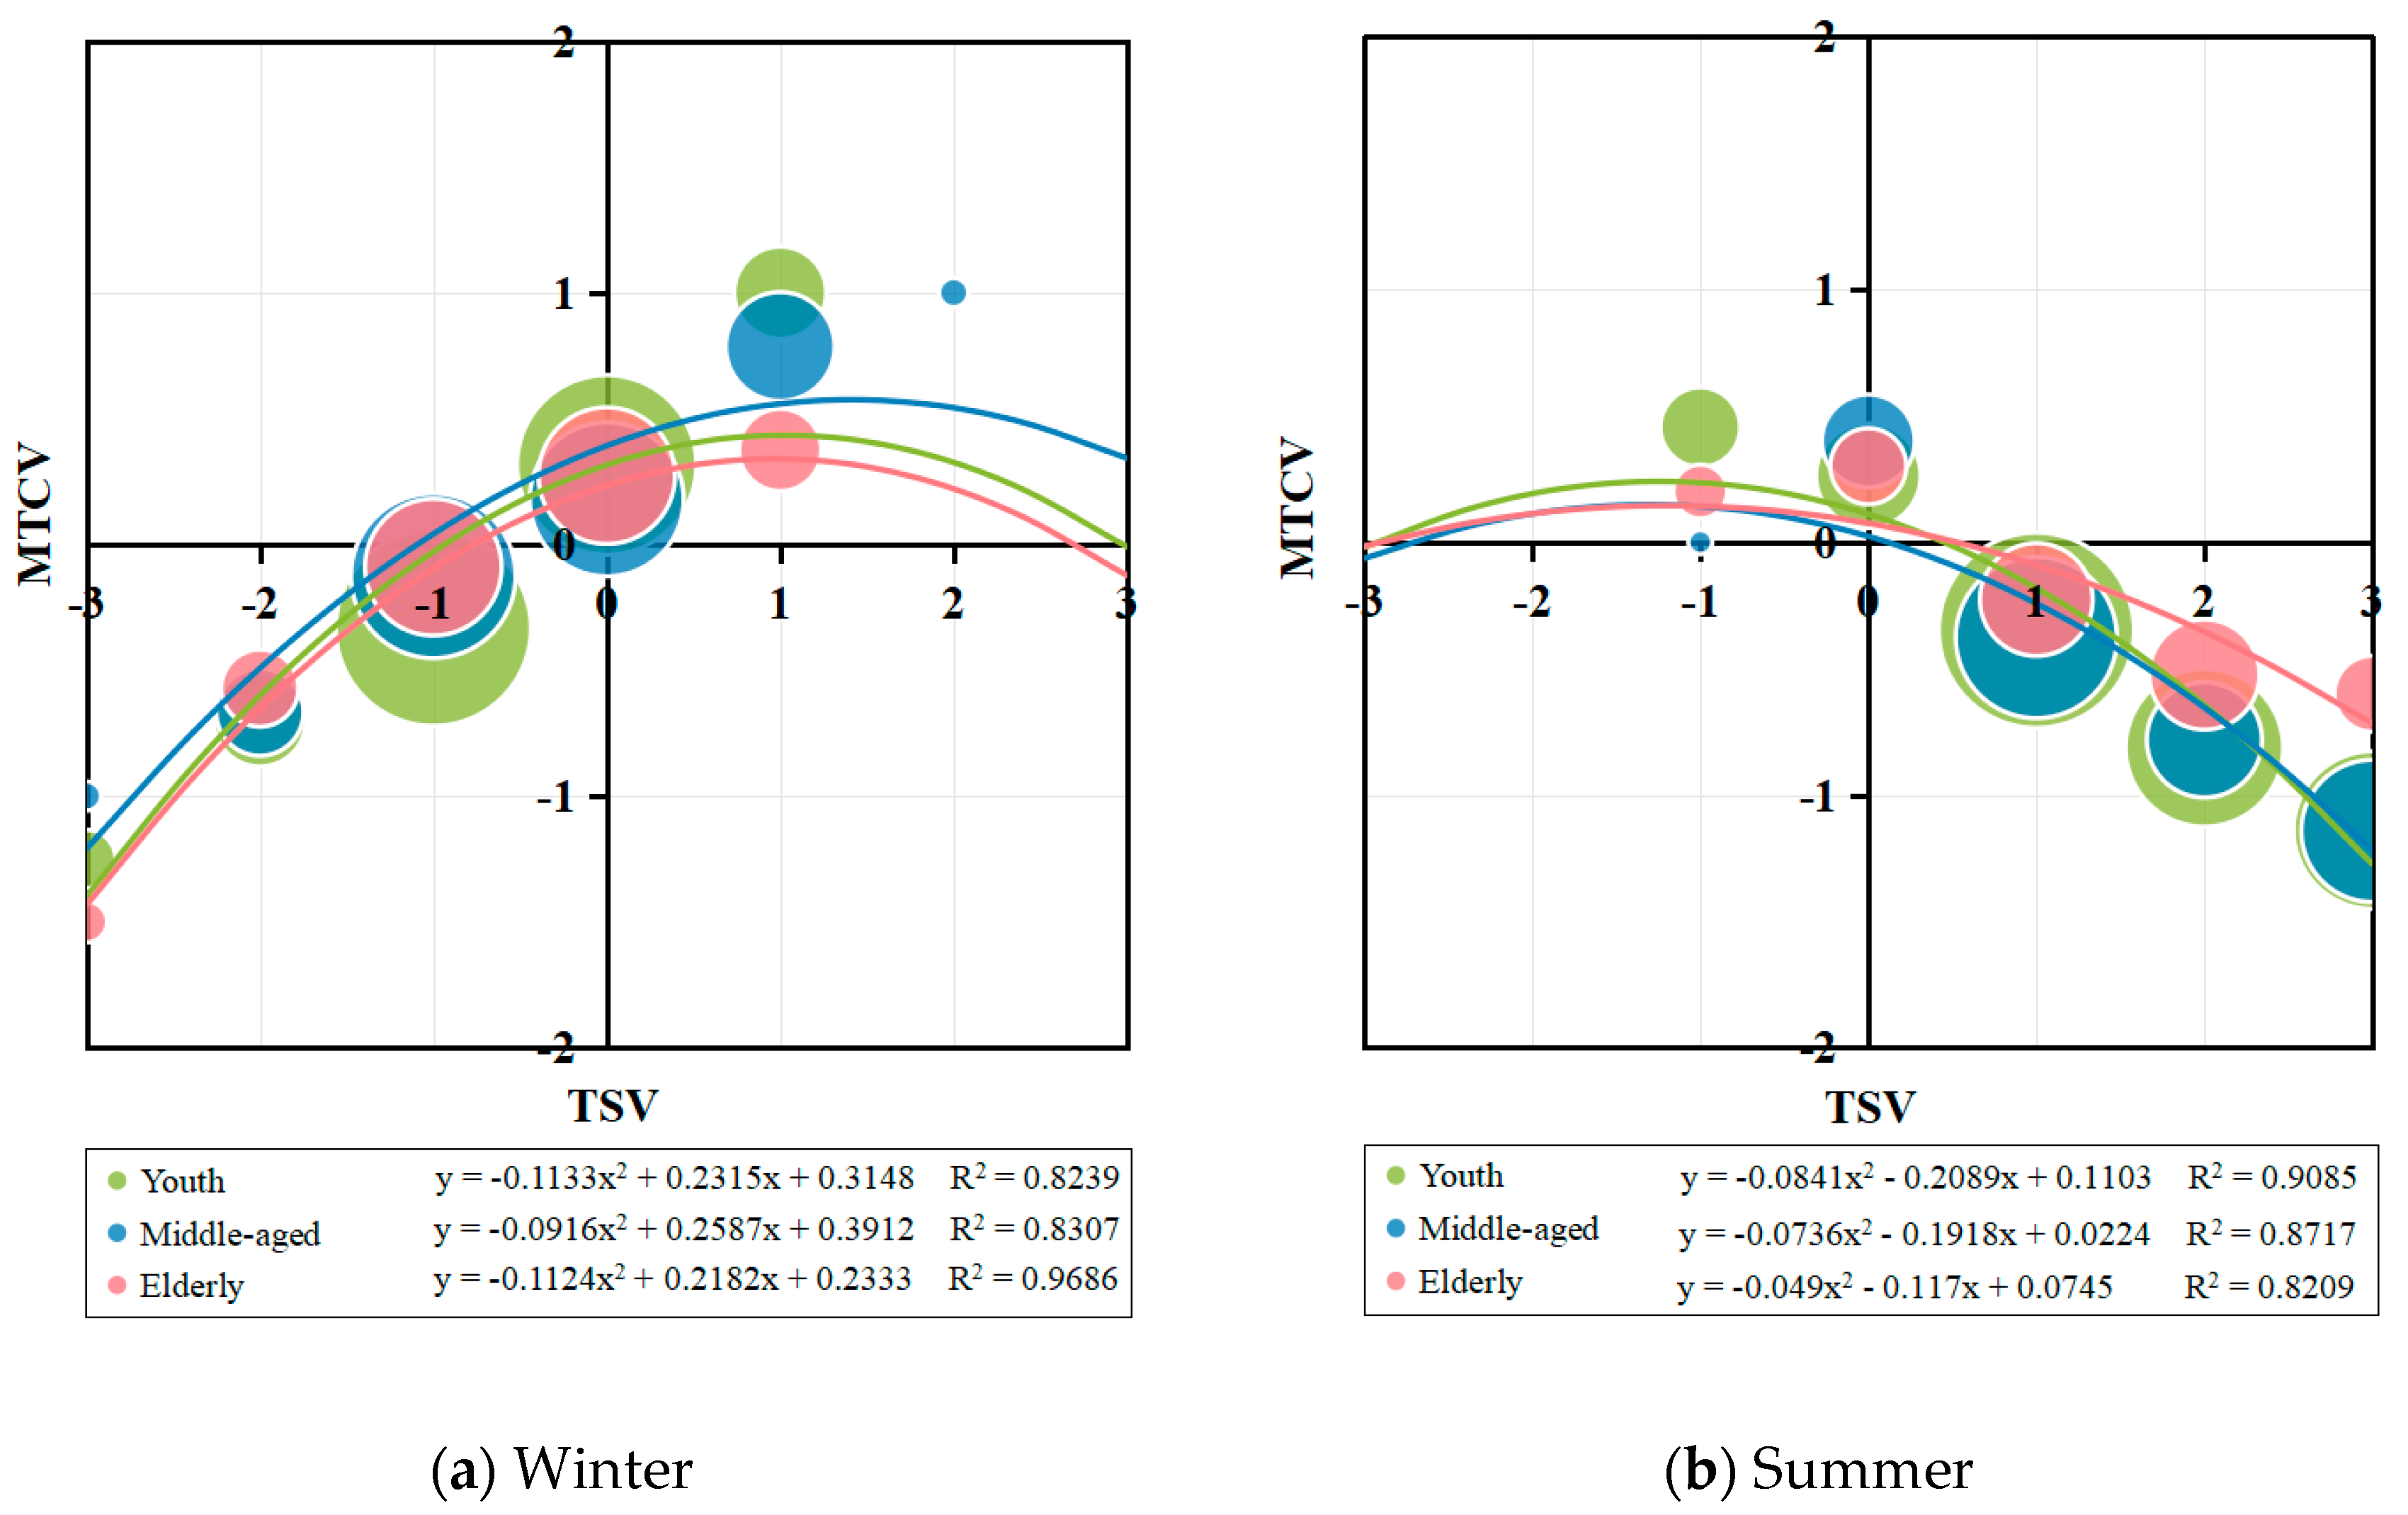
Figure 9 presents the fitted curves between TSV and MTCV across the different age groups. In winter, the thermal comfort range was narrowest for the elderly, followed by the youth, and widest for the middle-aged. The distributions of TSV for individuals who felt comfortable range from “Slightly cool” to “Hot” in winter. All the age groups’ most comfortable thermal sensations clustered around “Slightly warm.” In summer, the range of comfortable thermal sensations for all the age groups extended from “Cold” to “Neutral,” which was narrower than in winter. The most comfortable thermal sensations for all the age groups primarily ranged from “Cool” to “Slightly cool.” It can be seen that the impact of age differences on the relationship between thermal comfort and thermal sensation is more evident in winter compared with summer. During winter, the range of thermal sensations associated with thermal comfort narrows with increasing age.

4.1.3. Analysis of Different Genders

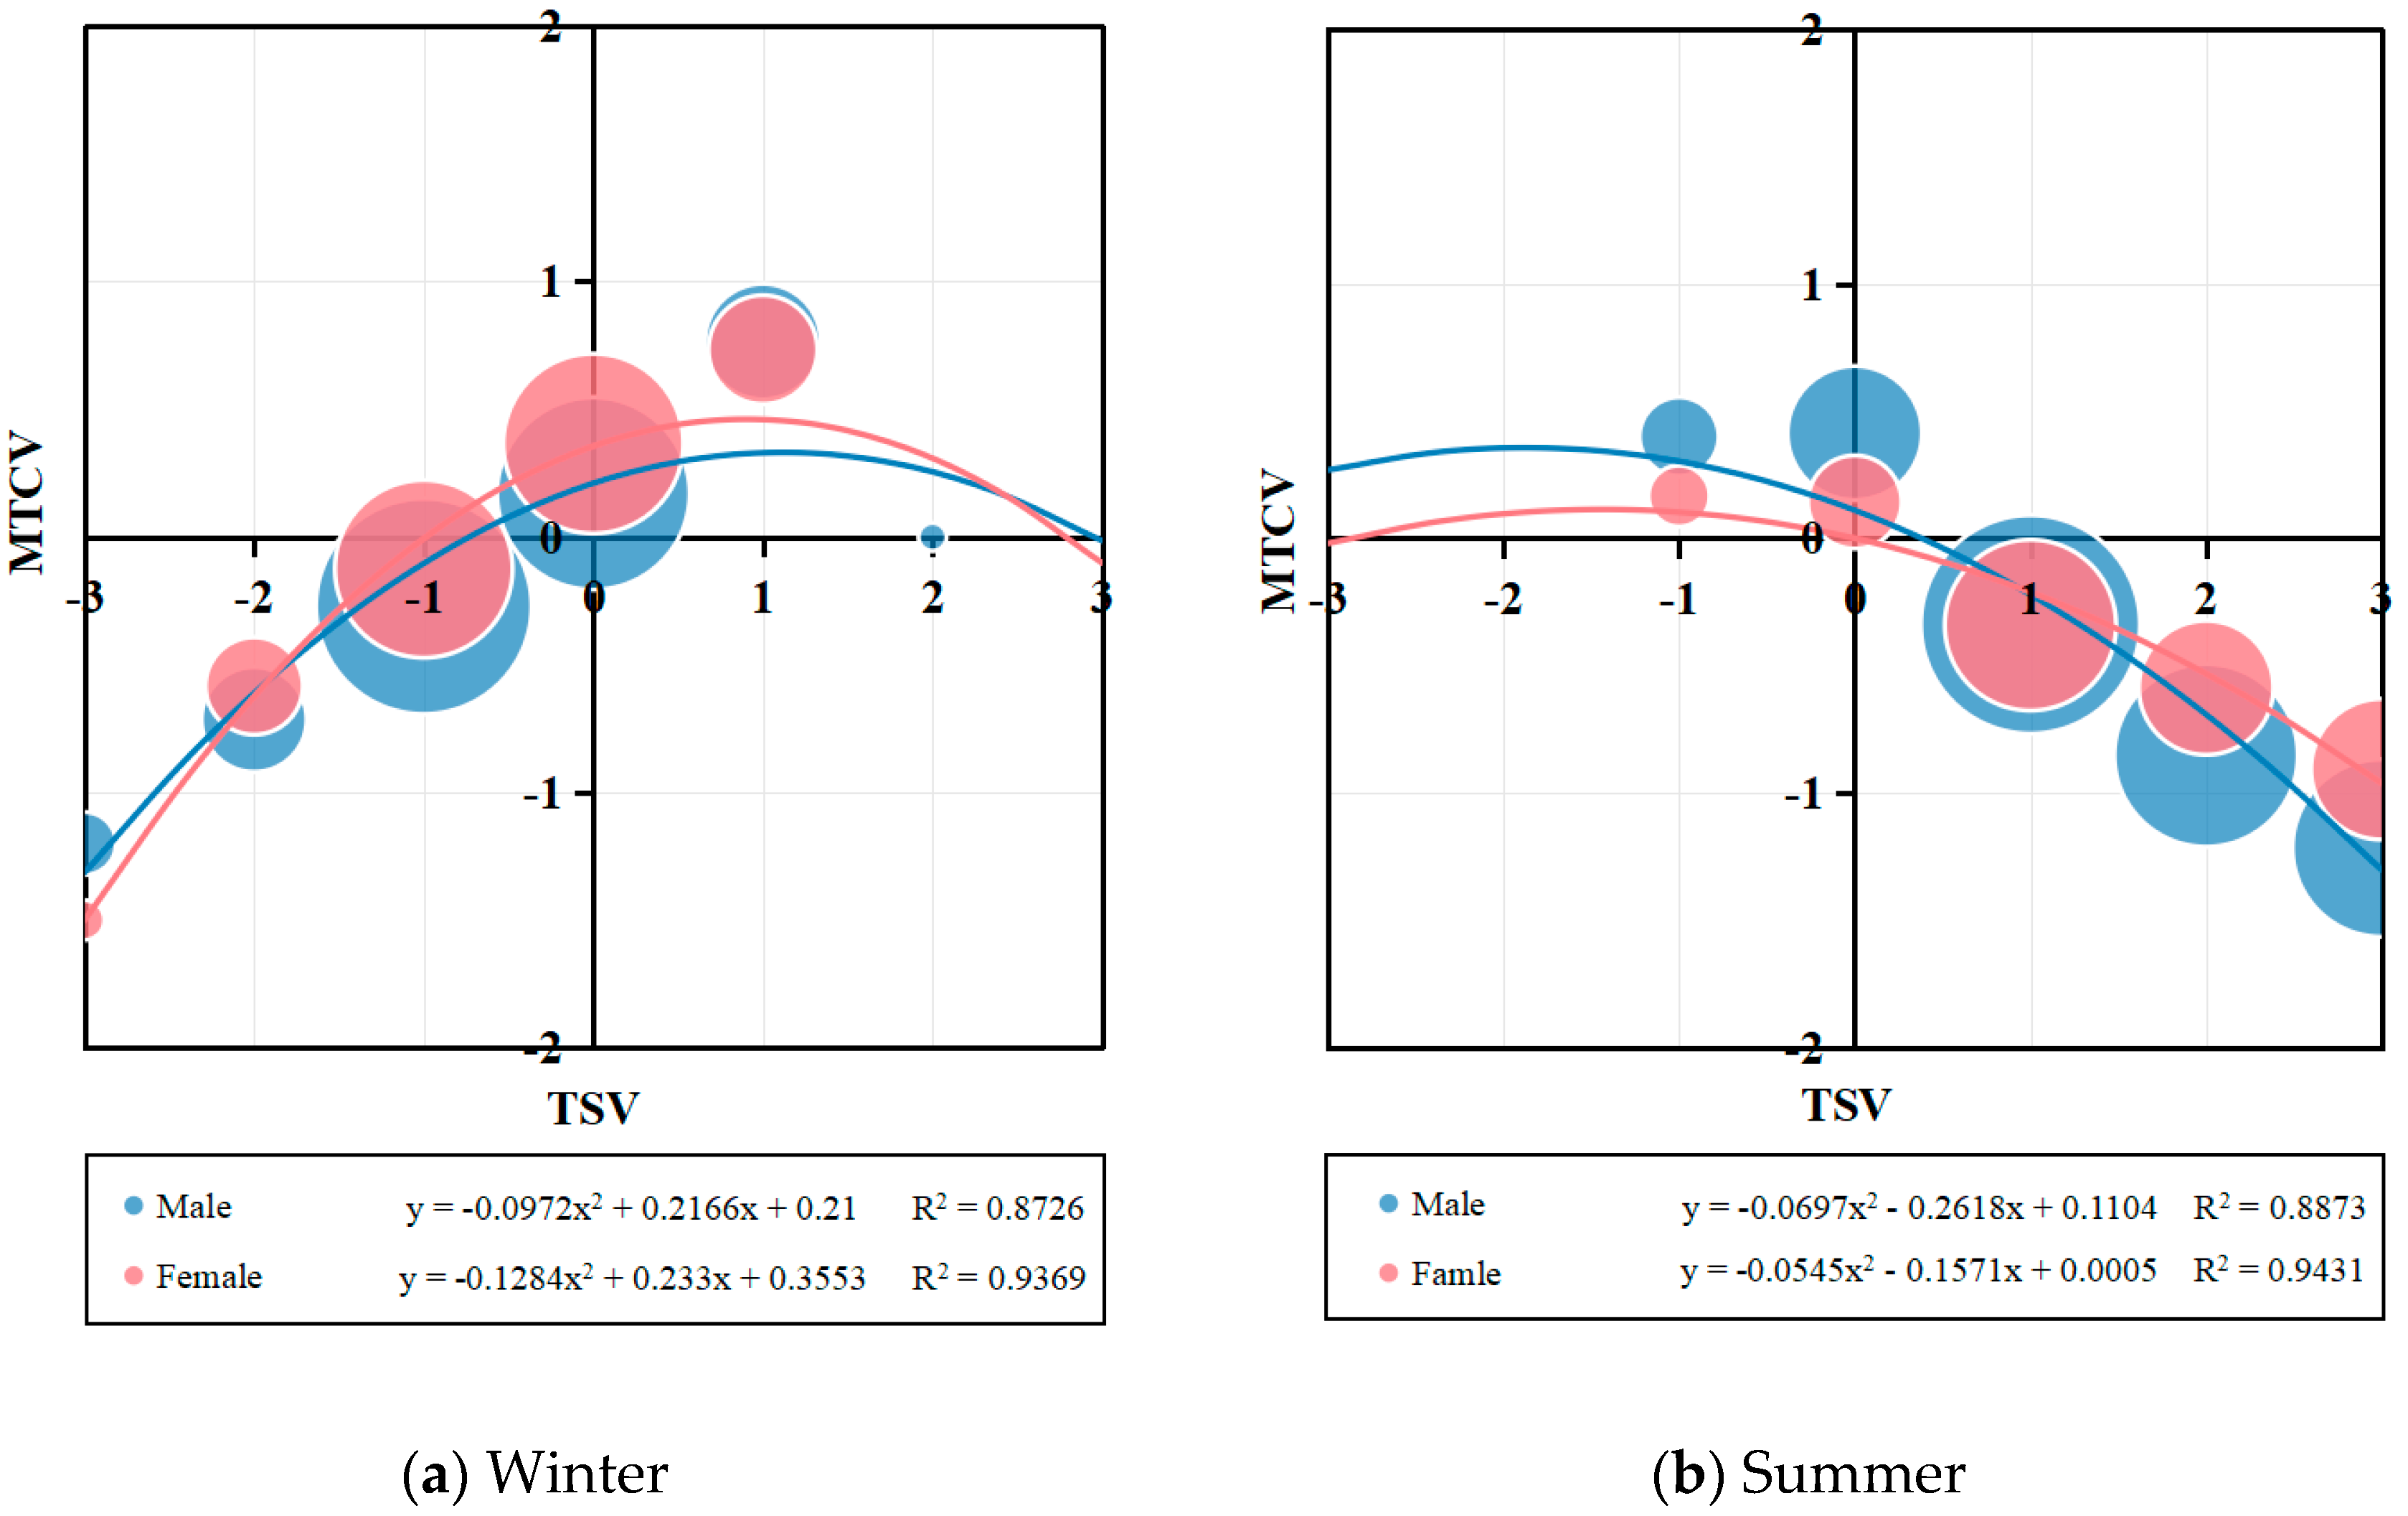
The analysis of TSV and MTCV by gender (Figure 10) indicates that in winter, the TSV range associated with comfort is similar for both men and women, typically spanning from “Slightly warm” to “Hot.” Both genders reported “Slightly warm” as the most comfortable thermal sensation. In summer, while the upper limit of TSV for thermal comfort was similar between men and women, the lower limit differed significantly, with men exhibiting a much lower TSV threshold for comfort than women. Additionally, the TSV corresponding to optimal thermal comfort was lower for men than for women. These findings suggest that gender differences in the relationship between thermal comfort and thermal sensation are more pronounced in summer, whereas in winter, the variation between men and women is minimal.

4.2. Analysis of Thermal Neutral Temperature in Winter

Neutral temperature refers to the temperature at which individuals perceive neither cold nor heat. In this study, MTSV was calculated for each 1 °C interval of PET and the UTCI using linear regression analysis. The correlation coefficient (R2) in the regression equations indicates the predictive accuracy of PET and the UTCI for MTSV, while the slope reflects the sensitivity of MTSV to changes in these indices.
Based on this analysis, this section explores the relationship between MTSV and the thermal comfort indices (PET and UTCI) across the different age and gender groups under varying winter and summer conditions, establishing thermal benchmarks accordingly. In addition, the thermal comfort baseline models developed for the different age and gender groups yielded p-values well below 0.05, indicating statistical significance and demonstrating that the models effectively capture the influence of temperature on thermal perception.

4.2.1. Analysis of Different Age Groups

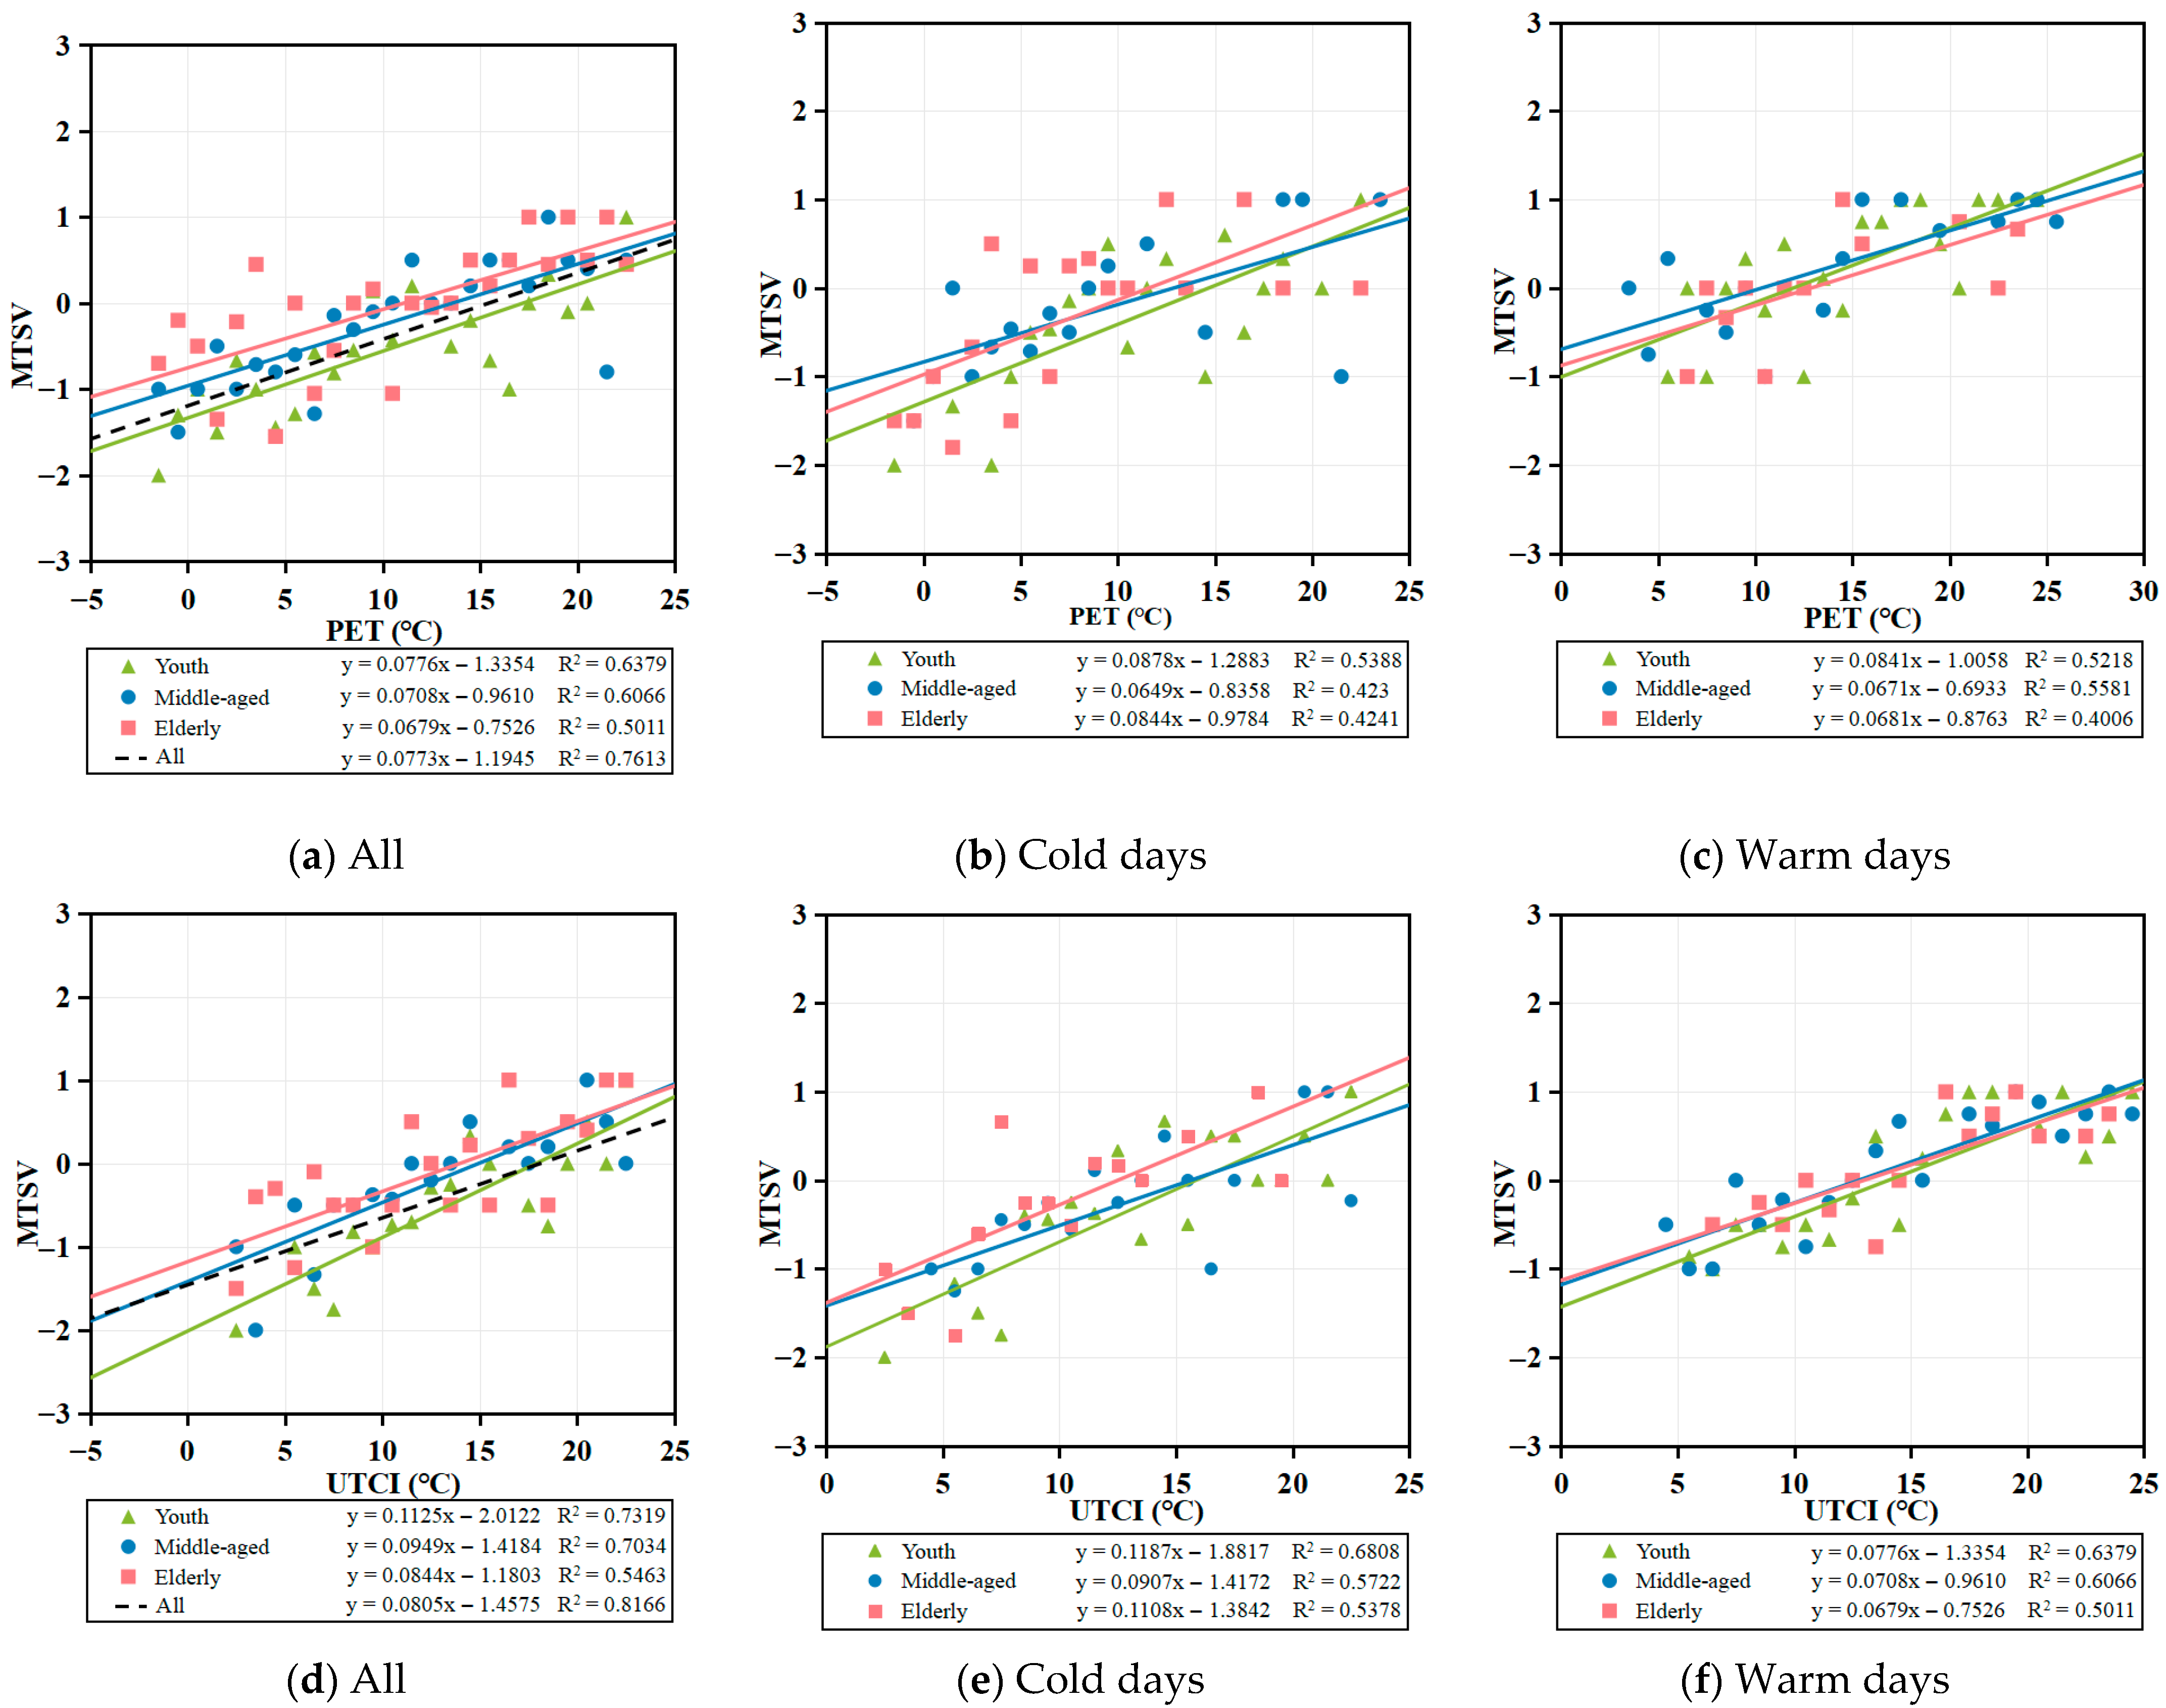
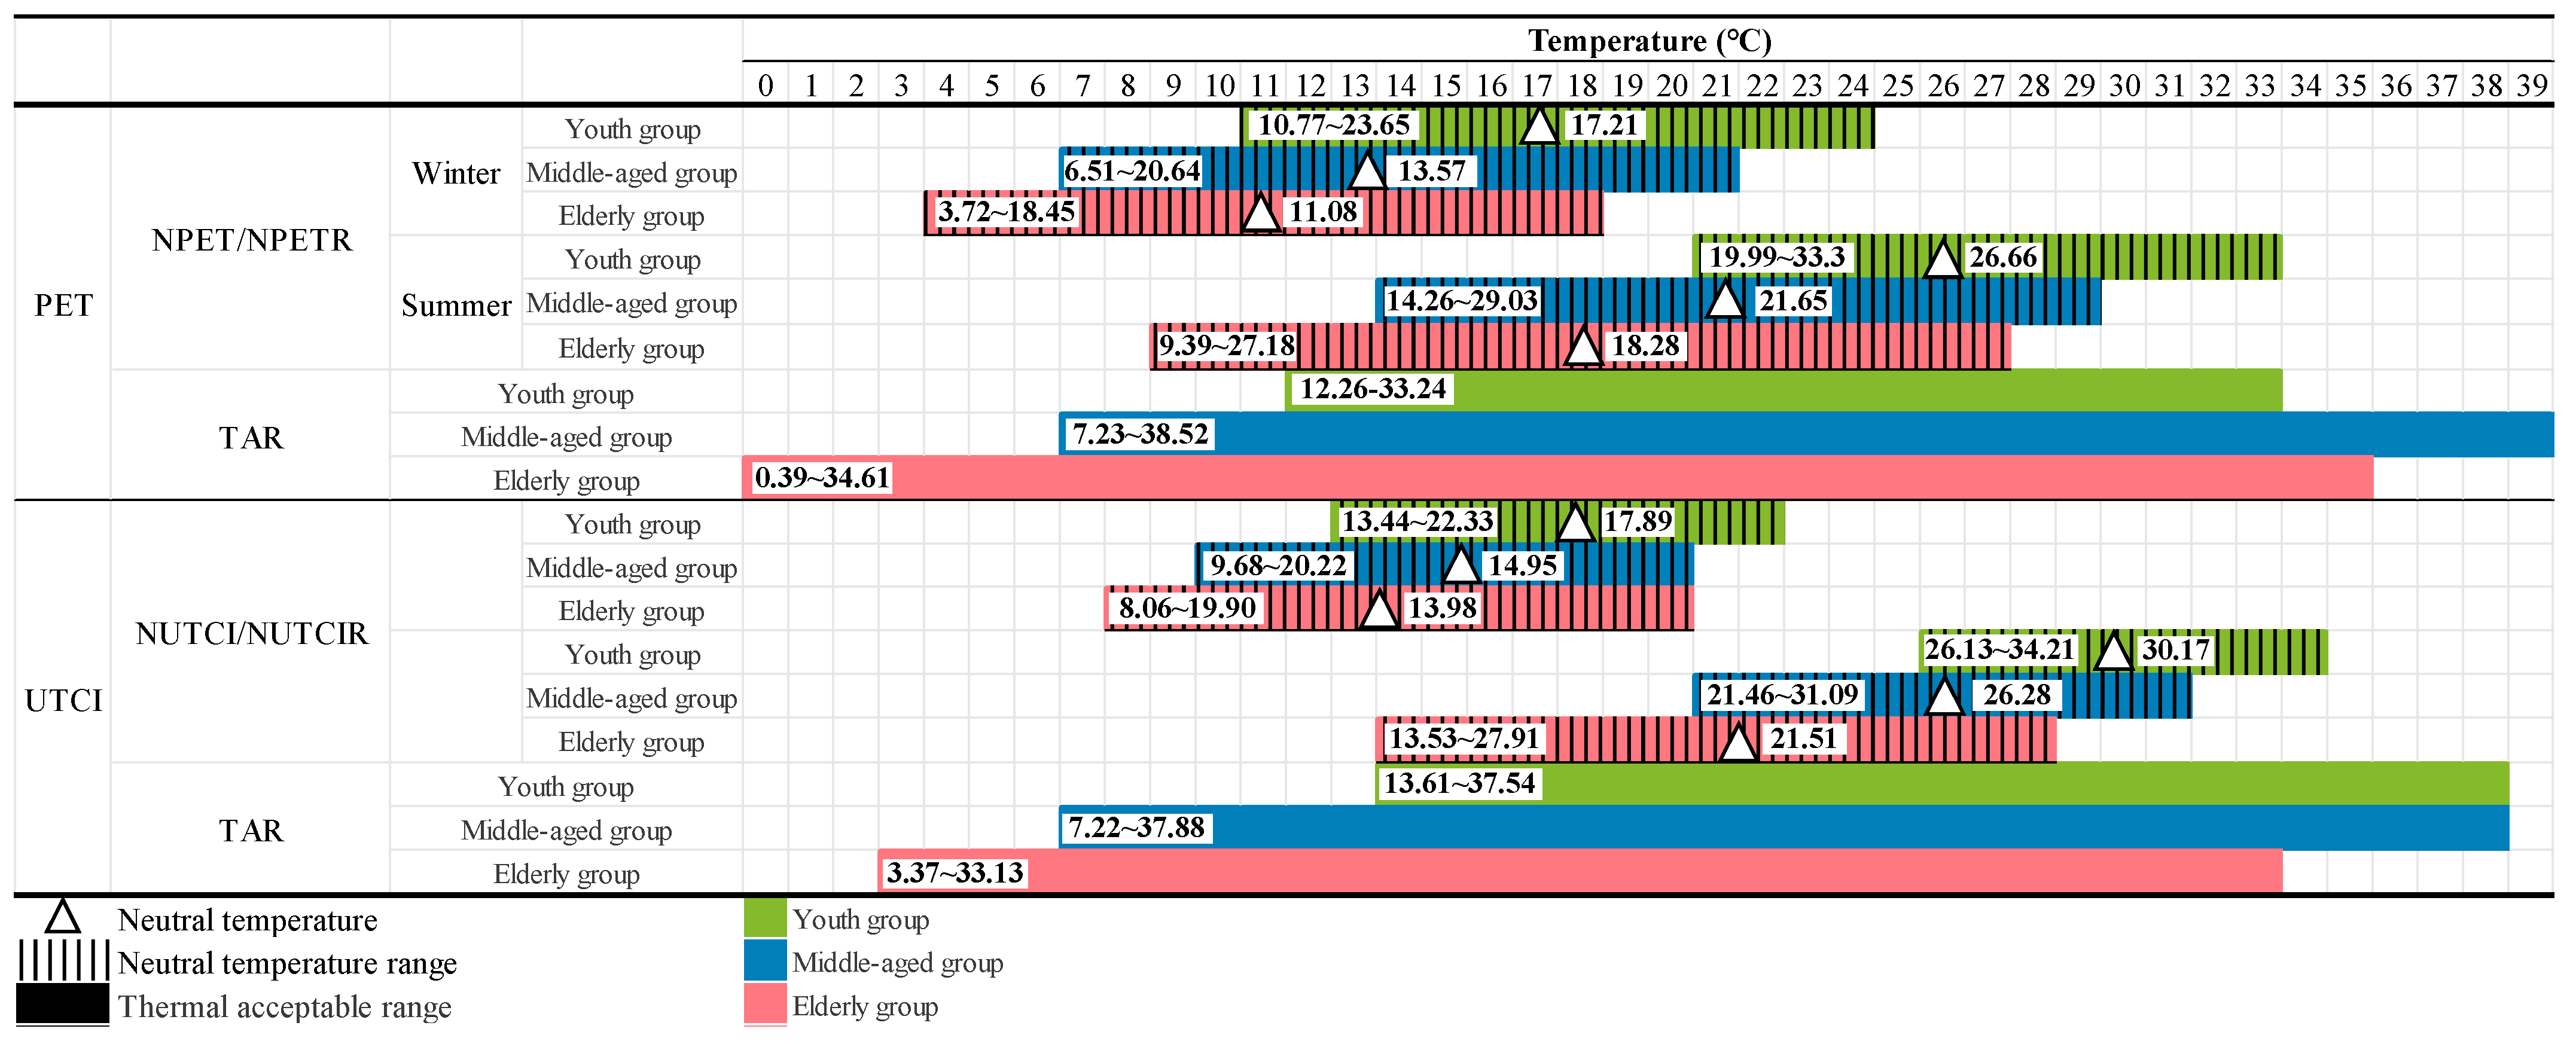
The fitted curves for the different age groups indicate that the UTCI exhibited higher predictive accuracy than PET across all the age groups (Figure 11). Additionally, thermal sensitivity decreased with age, a trend consistent with previous studies [61]. The predictive accuracy (R2) of both PET and the UTCI for thermal sensation declined with increasing age, likely due to the fact that most existing thermal comfort models were developed using college students as study subjects [62], often overlooking physiological changes associated with aging [63]. In terms of thermal neutral temperatures, the elderly exhibited the lowest values (11.08 °C for PET, 13.98 °C for UTCI), followed by the middle-aged individuals (13.57 °C for PET, 14.95 °C for UTCI), and the youth (17.21 °C for PET, 17.89 °C for UTCI). This suggests that older individuals are more acclimated to colder temperatures.
Overall, no substantial differences in thermal sensitivity and neutral temperature values were observed across the age groups under varying winter weather conditions. These findings align with previous research on thermal sensitivity in extreme cold weather, which reported that temperature variations had minimal impact on thermal sensitivity in cold environments [64].
This shows that weather, as a short-term effect, does not have a significant impact on people’s thermal benchmarks in winter. However, differences in thermal benchmarks persist due to the long-term effects of climatic conditions. The slope of the neutral temperature curve for the elderly in Xi’an, a cold region where the mean temperature of the coldest month is below 0 °C, is 0.0407 [37]. This is smaller than the slope of the neutral temperature curve for the elderly in Huangshan [42], where the mean temperature of the coldest month exceeds 0 °C, which is 0.089. This suggests that populations in colder regions exhibit lower thermal sensitivity compared to those in regions with milder winters.

4.2.2. Analysis of Different Genders

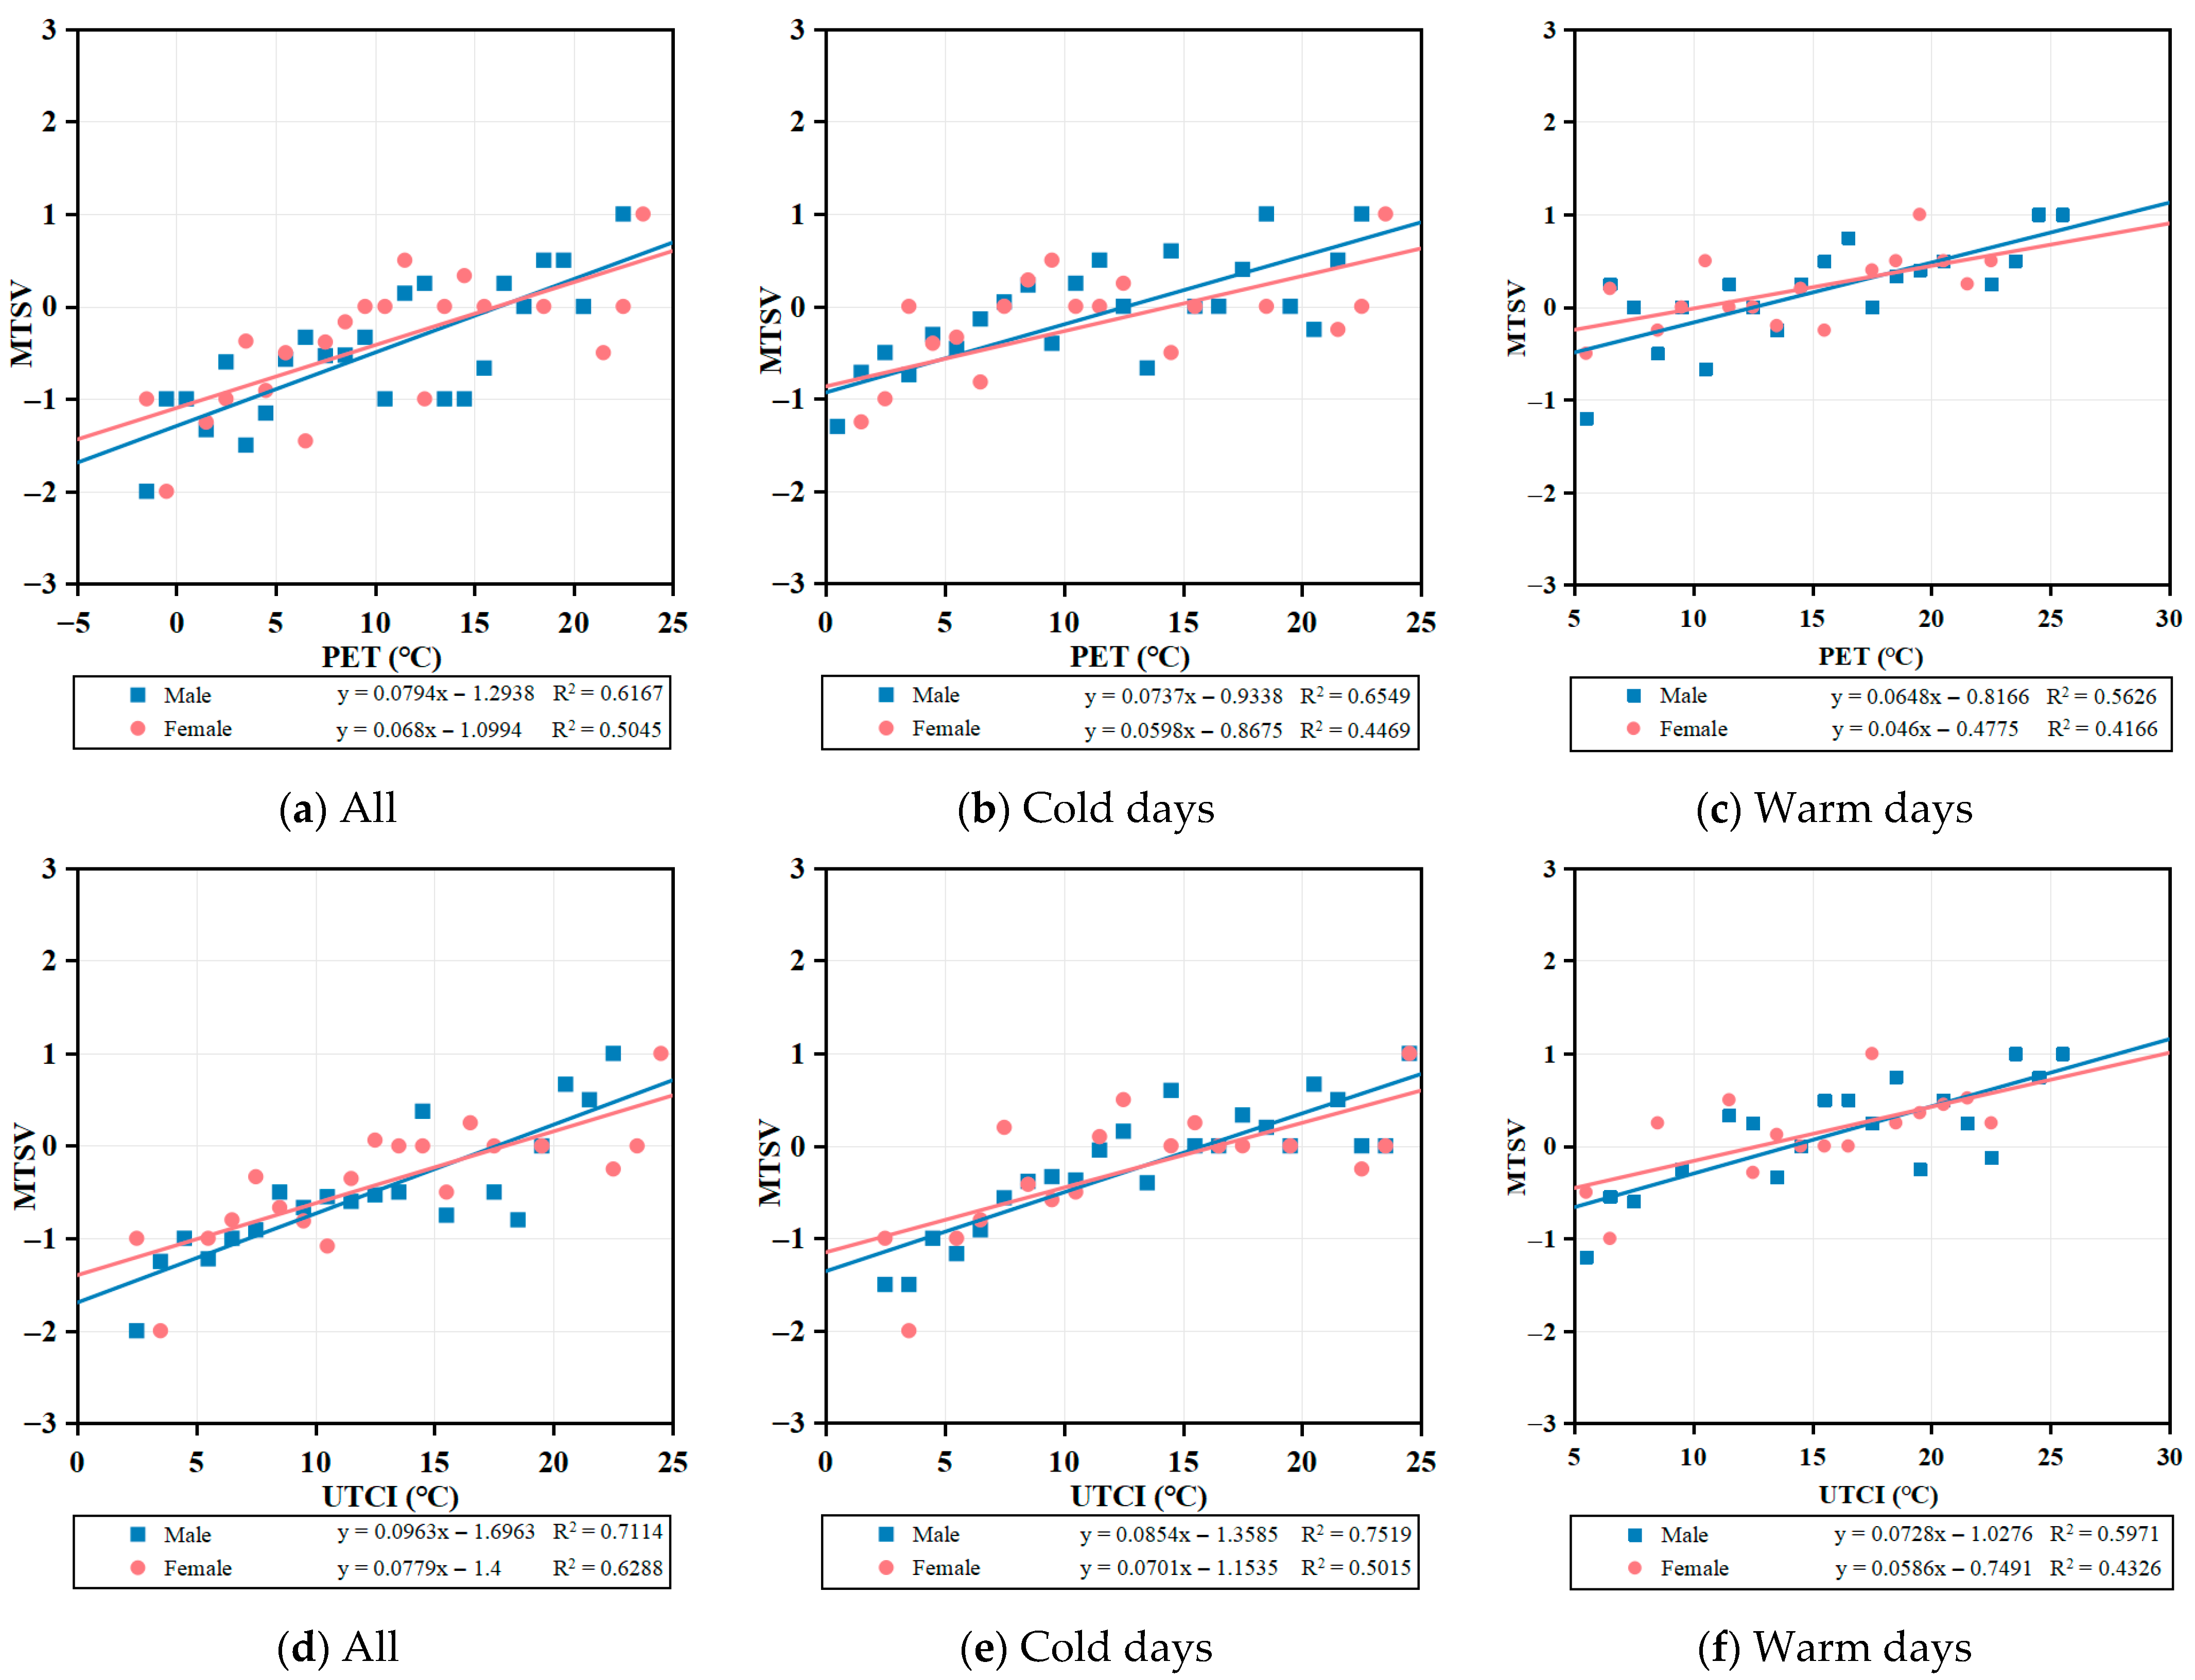
In predicting TSV across different gender groups, the UTCI exhibited higher accuracy than PET (Figure 12). In winter, males displayed slightly higher thermal sensitivity than females. The neutral temperature values were similar between males (16.29 °C for PET, 17.61 °C for UTCI) and females (16.17 °C for PET, 18.24 °C for UTCI). No significant differences in thermal sensitivity were observed between the genders on either cold or warm winter days. For both genders, the neutral temperature on warm days was slightly higher than that on cold days. Overall, gender differences had a minimal impact on thermal sensation in winter, regardless of weather conditions. This finding aligns well with the correlation analysis of thermal comfort and thermal sensation discussed in Section 4.1.3.

4.3. Analysis of Thermal Neutral Temperature in Summer

4.3.1. Analysis of Different Age Groups

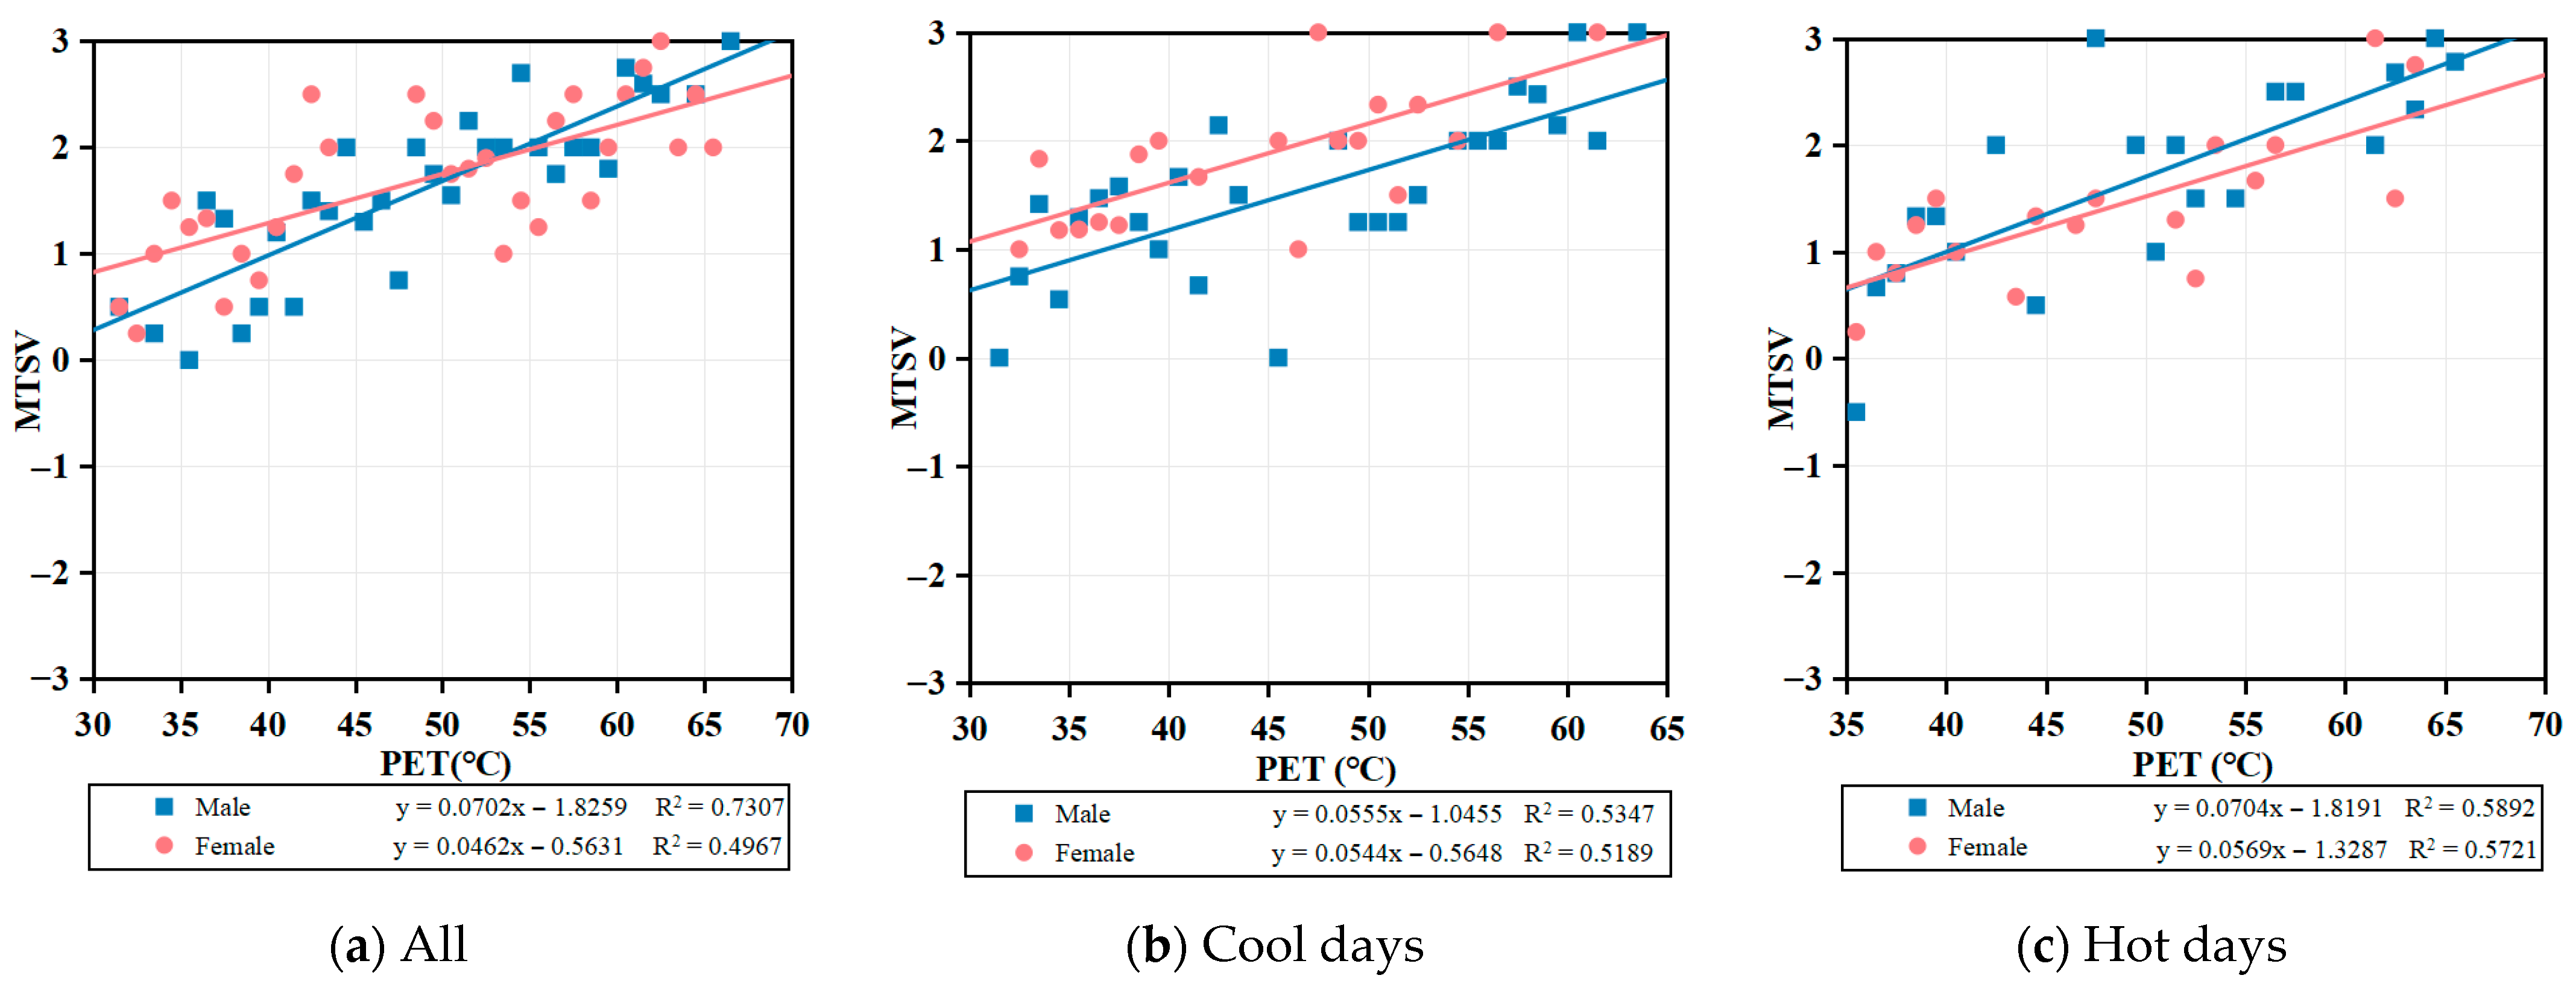
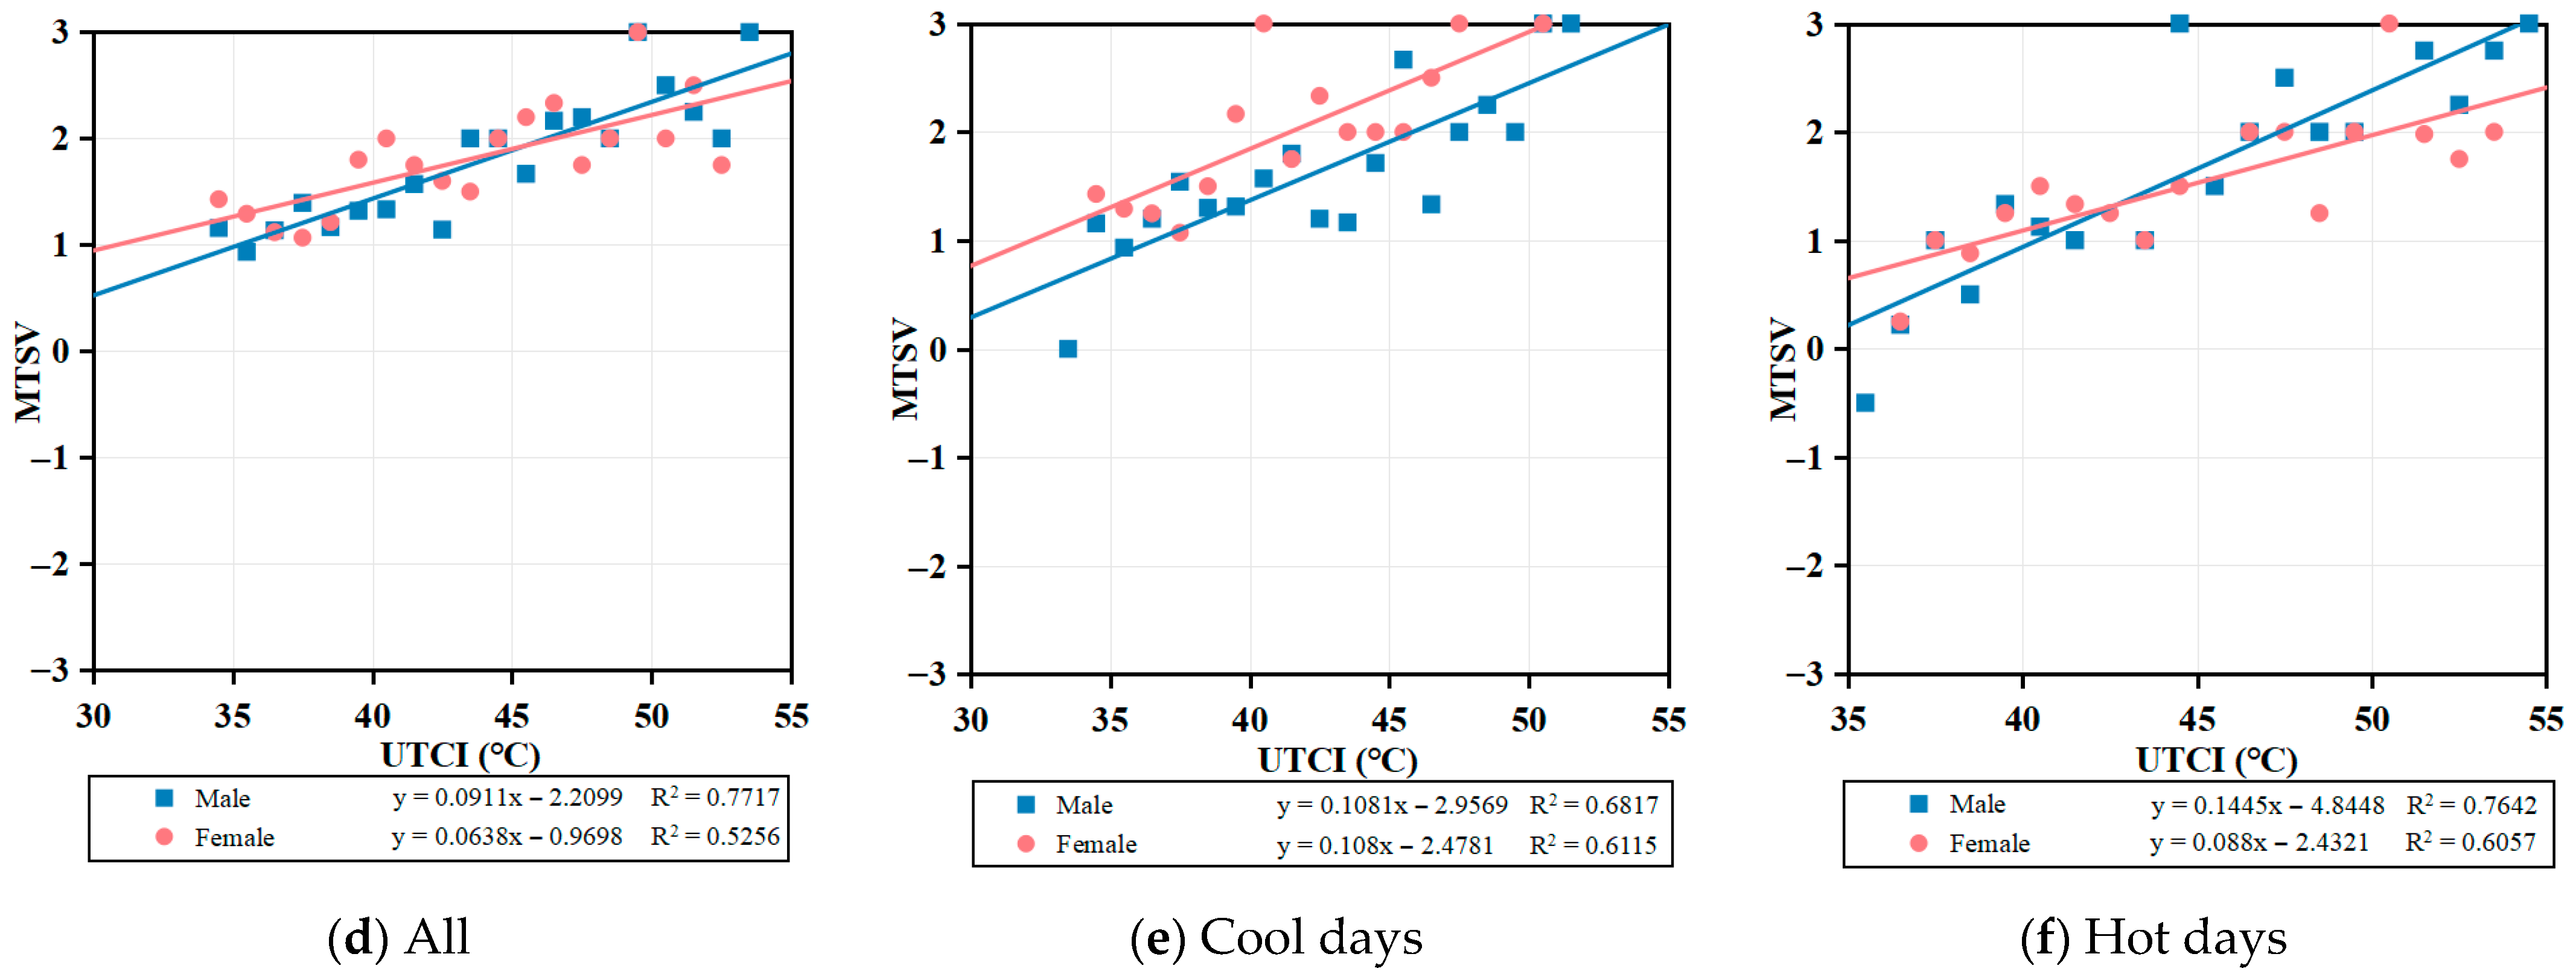
PET and the UTCI exhibited lower predictive accuracy for summer thermal sensation compared to winter (Figure 13). Analyzing PET and the UTCI across the different age groups revealed a gradual decline in thermal sensitivity with age, consistent with the winter findings. In summer, the elderly had the lowest neutral temperature values (12.68 °C for PET, 21.51 °C for UTCI), followed by the middle-aged (21.65 °C for PET, 26.28 °C for UTCI), and the youth (26.66 °C for PET, 30.17 °C for UTCI). When considering different weather temperatures, thermal sensitivity was higher on hot days than on cool days, particularly among the youth and middle-aged groups. In contrast, the elderly exhibited only a slight increase in thermal sensitivity under hotter conditions. This reinforces the idea that thermal sensitivity declines with age [65]. Previous studies suggest that older individuals have reduced thermal perception and require stronger thermal stimuli to experience the same level of thermal feedback as younger individuals [66].
The increase in thermal sensitivity due to hot weather observed in this study contrasts with findings from a study conducted in Chongqing [15]. That study examined differences in thermal benchmarks between heatwave conditions (temperatures exceeding 35 °C) and non-heatwave conditions, reporting no significant variation in thermal sensitivity across different weather temperatures, though neutral temperature values increased. This discrepancy may be attributed to environmental differences. The Chongqing study was conducted in a commercial district with extensive tree cover, shaded areas, and air-conditioned shopping malls, which provided relief from extreme heat. In contrast, the participants in this study were frequently exposed to direct sunlight, leading to a heightened thermal sensation.
Overall, in outdoor urban environments, thermal sensitivity increases with rising temperatures in summer across all age groups. And this increase is more pronounced among young and middle-aged individuals than among the elderly.

4.3.2. Analysis of Different Genders

In the summer analysis by gender, the UTCI continued to demonstrate higher predictive accuracy than PET (Figure 14). Among all the respondents, males exhibited greater thermal sensitivity than females, with significantly higher neutral temperatures for males (26.01 °C for PET, 24.26 °C for the UTCI) compared to females (12.19 °C for PET, 15.20 °C for the UTCI).
On cool days, thermal sensitivity was similar between males and females. However, as temperatures increased, males experienced a significant rise in thermal sensitivity, whereas the increase was less pronounced in females. Although there is no universal consensus on the effect of gender on heat perception, some studies suggest that females tend to exhibit higher thermal sensitivity than males in hot weather. In contrast, the findings of this study indicate that while males’ thermal sensitivity increased markedly on hot days, females maintained a relatively stable thermal response. This stability in female thermal sensitivity may be attributed to behavioral adaptations. Women more frequently utilize shading measures, such as sun umbrellas and face covers, during outdoor activities, reducing direct sun exposure and mitigating the effects of high temperatures. In the process of adapting to the outdoor environment, not only physiological adaptations but also behavioral adaptations of different groups of people can guarantee their comfort.

4.4. Analysis of Thermal Acceptable Temperature Range with Individual Groups

The TAR values for the different age groups were analyzed using the PET and UTCI metrics. The TAR is defined as the temperature range deemed acceptable by at least 80% (normal conditions) or 90% (strict conditions) of respondents, as specified in ASHRAE Standard 55 [52]. In this study, the 80% acceptability threshold was adopted, meaning that only 20% of the respondents found the thermal conditions unacceptable. To quantify this, the thermal unacceptability rate for each 1 °C increase in PET and the UTCI was calculated and modeled using quadratic polynomial fitting. Based on the above, this section analyzes the TAR in different age and gender groups based on the PET and UTCI indicators.

4.4.1. Analysis of Different Age Groups

The fitting results indicated that the UTCI provided a more accurate representation of thermal acceptability compared to PET (Figure 15). In the PET-based fitting, the upper limit of acceptable temperatures remained consistent across the age groups, at approximately 35 °C, with minimal variation. However, the lower limit exhibited more pronounced differences, with the elderly having the lowest threshold at 0.39 °C, followed by the middle-aged at 7.23 °C, and the youth at 12.26 °C. This suggests that the elderly had the broadest thermally acceptable range, followed by the middle-aged, with the youth exhibiting the narrowest range.
For the UTCI, the upper limit varied slightly between the youth and middle-aged groups, both around 37 °C, while the elderly group had the lowest upper limit at 33.13 °C. A similar trend was observed for the lower limit, where the elderly had the lowest threshold (3.37 °C), followed by the middle-aged (7.22 °C) and the youth (13.61 °C). These findings reinforce the notion that thermal acceptability widens with age, with older individuals demonstrating higher tolerance to a broader range of temperatures.
Overall, the elderly exhibited the broadest range of thermally acceptable temperatures, followed by the middle-aged, with the youth having the narrowest range. This trend has been corroborated by previous studies [67]. The acceptable temperature range progressively shifted toward lower temperatures with age, transitioning from the youth to the middle-aged and then to the elderly. This pattern may be attributed to age-related physiological changes, such as diminished thermoregulatory capacity due to reduced vasoconstriction and vasodilation efficiency. As a result, older adults tend to have lower sensitivity to cold environments while experiencing reduced tolerance to heat [68]. Consequently, they face a higher risk of heat stress during extreme summer conditions [69]. Additionally, the broader thermal acceptability range among the elderly may stem from their greater exposure to outdoor environments compared to younger groups [70]. During this study, the elderly participants frequently engaged in activities such as socializing or walking, leading to prolonged exposure and better adaptation to outdoor conditions.

4.4.2. Analysis of Different Genders

The analysis of the TAR across the different genders is presented in Figure 16. The upper limit of the 80% thermally acceptable temperature range for males was comparable to that for females in both the PET and UTCI fittings. However, the lower limit of the TAR was lower for females than for males, indicating that females tend to tolerate cooler temperatures better; specifically, the lower limit was approximately 7–10 °C lower for females than for males.
Overall, females exhibited a broader range of thermally acceptable temperatures and showed a greater willingness to accept cooler conditions compared to males. However, existing studies present conflicting findings on gender differences in thermal acceptability. Some research suggests that females are more sensitive to thermal environments, possess a narrower TAR, and have a lower tolerance for thermal stress [11]. Conversely, other studies have found that gender has a negligible impact on the thermally acceptable range [71]. These discrepancies highlight the ongoing debate and lack of consensus regarding the influence of gender on thermal perception. Additionally, the increasing availability of wearable sun-shading devices during summer may contribute to this phenomenon. For instance, sun umbrellas offer women more comprehensive protection from solar radiation, enabling them to better cope with hot weather conditions. However, PET and UTCI calculations do not effectively account for the impact of these protective measures on human thermal comfort, which may introduce uncertainties into the final assessment results.

4.5. Comparison of Results with Other Studies

4.5.1. Effect of Age Differences on Thermal Benchmarks

The analysis of thermal benchmarks revealed moderate differences between the genders. However, variations across the different age groups were more complex. Therefore, a comparative analysis of thermal benchmarks was conducted among the young, middle-aged, and elderly individuals to better understand these age-related differences.
The comparison highlights differences in thermal benchmarks across the age groups, as illustrated in Figure 17. From the youth to middle age and then to the elderly, both neutral temperatures and their acceptable ranges gradually shifted from higher to lower temperature zones, a pattern consistent with observations in both winter and summer. This phenomenon may be attributed to the decline in thermoregulatory efficiency with age, as the ability to adjust body heat through vasoconstriction and dilation weakens, leading to decreased sensitivity to cold environments and reduced tolerance to hot weather in older individuals [72]. Consequently, the elderly face a higher risk of heat stress in hot environments compared to younger individuals [73].
With increasing age, the respondents’ neutral and acceptable temperature ranges gradually expanded, suggesting that increasing age increases environmental tolerance. With age, thermoregulatory responses to hot and cold stimuli become slower and less effective [74], reducing sensitivity to ambient temperature fluctuations and leading to a broader range of neutral and acceptable temperatures. However, an overly wide thermal comfort range presents challenges for researchers in precisely defining the optimal comfort range for elderly individuals. This issue also underscores the limitations of traditional thermal comfort models when applied to older populations. Therefore, future research should focus on developing more suitable thermal comfort evaluation models and indicators tailored to the physiological characteristics of the elderly [37]. Given the differences in neutral and acceptable temperature ranges among age groups, it is advisable to consider the overlapping regions of these ranges when designing residential renovations and evaluating outdoor environments. This approach can help ensure thermal comfort for people of all ages.

4.5.2. Comparative Analysis of Different Geographical Regions

Further comparisons were conducted to analyze the differences in neutral temperatures and their respective ranges between the population of Wuhan and those in other regions.
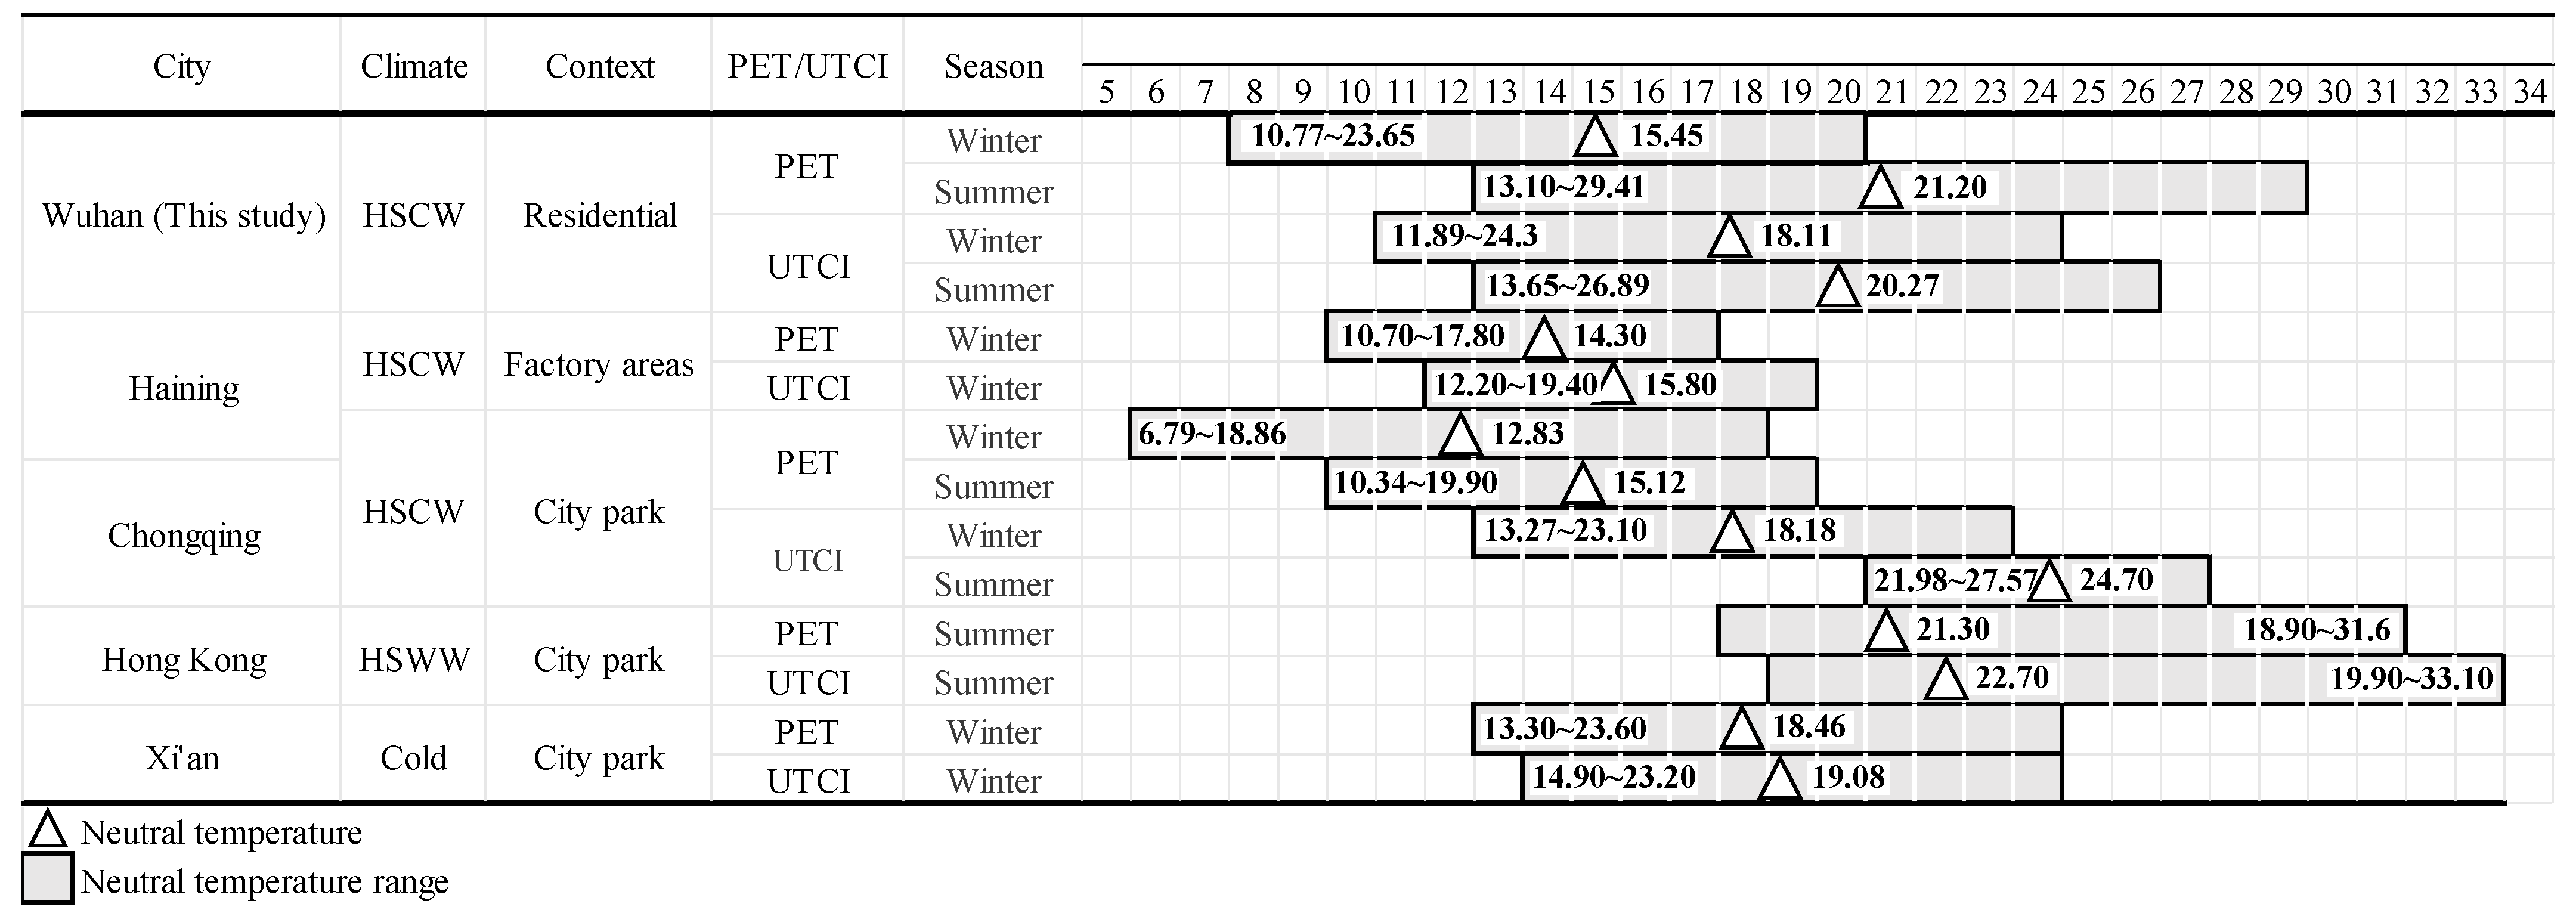
Figure 18 presents a comparison of the neutral temperatures and their respective ranges across different regional populations during winter and summer. Previous studies on OTC have primarily focused on urban residential areas and parks. Compared to Haining [43], which also falls within the Cfa climate subregion, Wuhan’s winter neutral PET (NPET) is approximately 1.15 °C higher. However, Wuhan exhibits a significantly wider NPET range (NPETR) than Haining. Similarly, the neutral UTCI (NUTCI) in Wuhan during winter is higher than in Haining, and the neutral UTCI range (NUTCIR) is also broader, indicating that residents in Wuhan have a greater ability to adapt to environmental conditions. This difference may be attributed to the climate characteristics of Haining. Although both cities fall within the Cfa climate subregion, Haining, located in southeastern China, experiences a more maritime-influenced climate, leading to milder winters and fewer extreme weather events. As a result, the adaptive temperature range for Haining residents is narrower. Compared with Chongqing [41], which is also located in the Cfa climate zone, Wuhan exhibits a higher NPET—approximately 2 °C higher in winter and about 6 °C higher in summer. Although the NUTCI values in winter are similar between the two cities, with a difference of only about 1 °C, Wuhan records a higher NUTCI in summer and a broader neutral temperature range. These differences highlight the regional variations in PET and UTCI adaptability among populations in different locations.
Compared to other regions, Wuhan’s NPET and NUTCI in summer are significantly lower than those of Hong Kong [33]. This is primarily due to Hong Kong’s classification within the Cwa climate zone, where the higher annual mean air temperature has enhanced residents’ adaptation to hot weather. Additionally, Wuhan exhibits slightly higher neutral temperatures in winter than Xi’an [37], another city in the Cwa climate zone. Despite sharing the same Köppen classification, Xi’an experiences a harsher climate than Hong Kong, characterized by hot, humid summers and cold, dry winters. According to China’s optional climate zoning criteria, Hong Kong falls within the “hot summer, warm winter” region, while Xi’an belongs to the “cold region.” Notably, while the lower limits of NPETR and NUTCIR in Wuhan’s winter are comparable to those in Xi’an, the upper limits are significantly higher. This may be attributed to Wuhan’s greater winter temperature fluctuations compared to Xi’an, where winter temperatures are lower and more stable. Such fluctuations could contribute to a broader adaptation range for Wuhan residents in the winter thermal environment.
For cities located in the Cfa climate zone, the distinct climatic features—characterized by extremely hot summers and cold, damp winters—result in relatively wide neutral temperature ranges during both seasons, reflecting a higher level of thermal adaptability among local populations [75]. However, although all fall under the same climatic classification, cities such as Wuhan, Haining, and Chongqing exhibit notable differences in their residents’ thermal adaptation, particularly in summer. These findings highlight the importance of conducting fine-grained thermal comfort assessments and modeling at the urban scale, rather than relying solely on generalized “Cfa characteristics.” Even within the same climate category, cities should develop localized microclimate strategies—including vegetation planning, water features, and ventilation corridors—based on site-specific thermal comfort benchmarks and adaptation profiles.

4.6. Analysis of Thermal Adaptive Behaviors with Individual Groups

4.6.1. Analysis of Different Age Groups

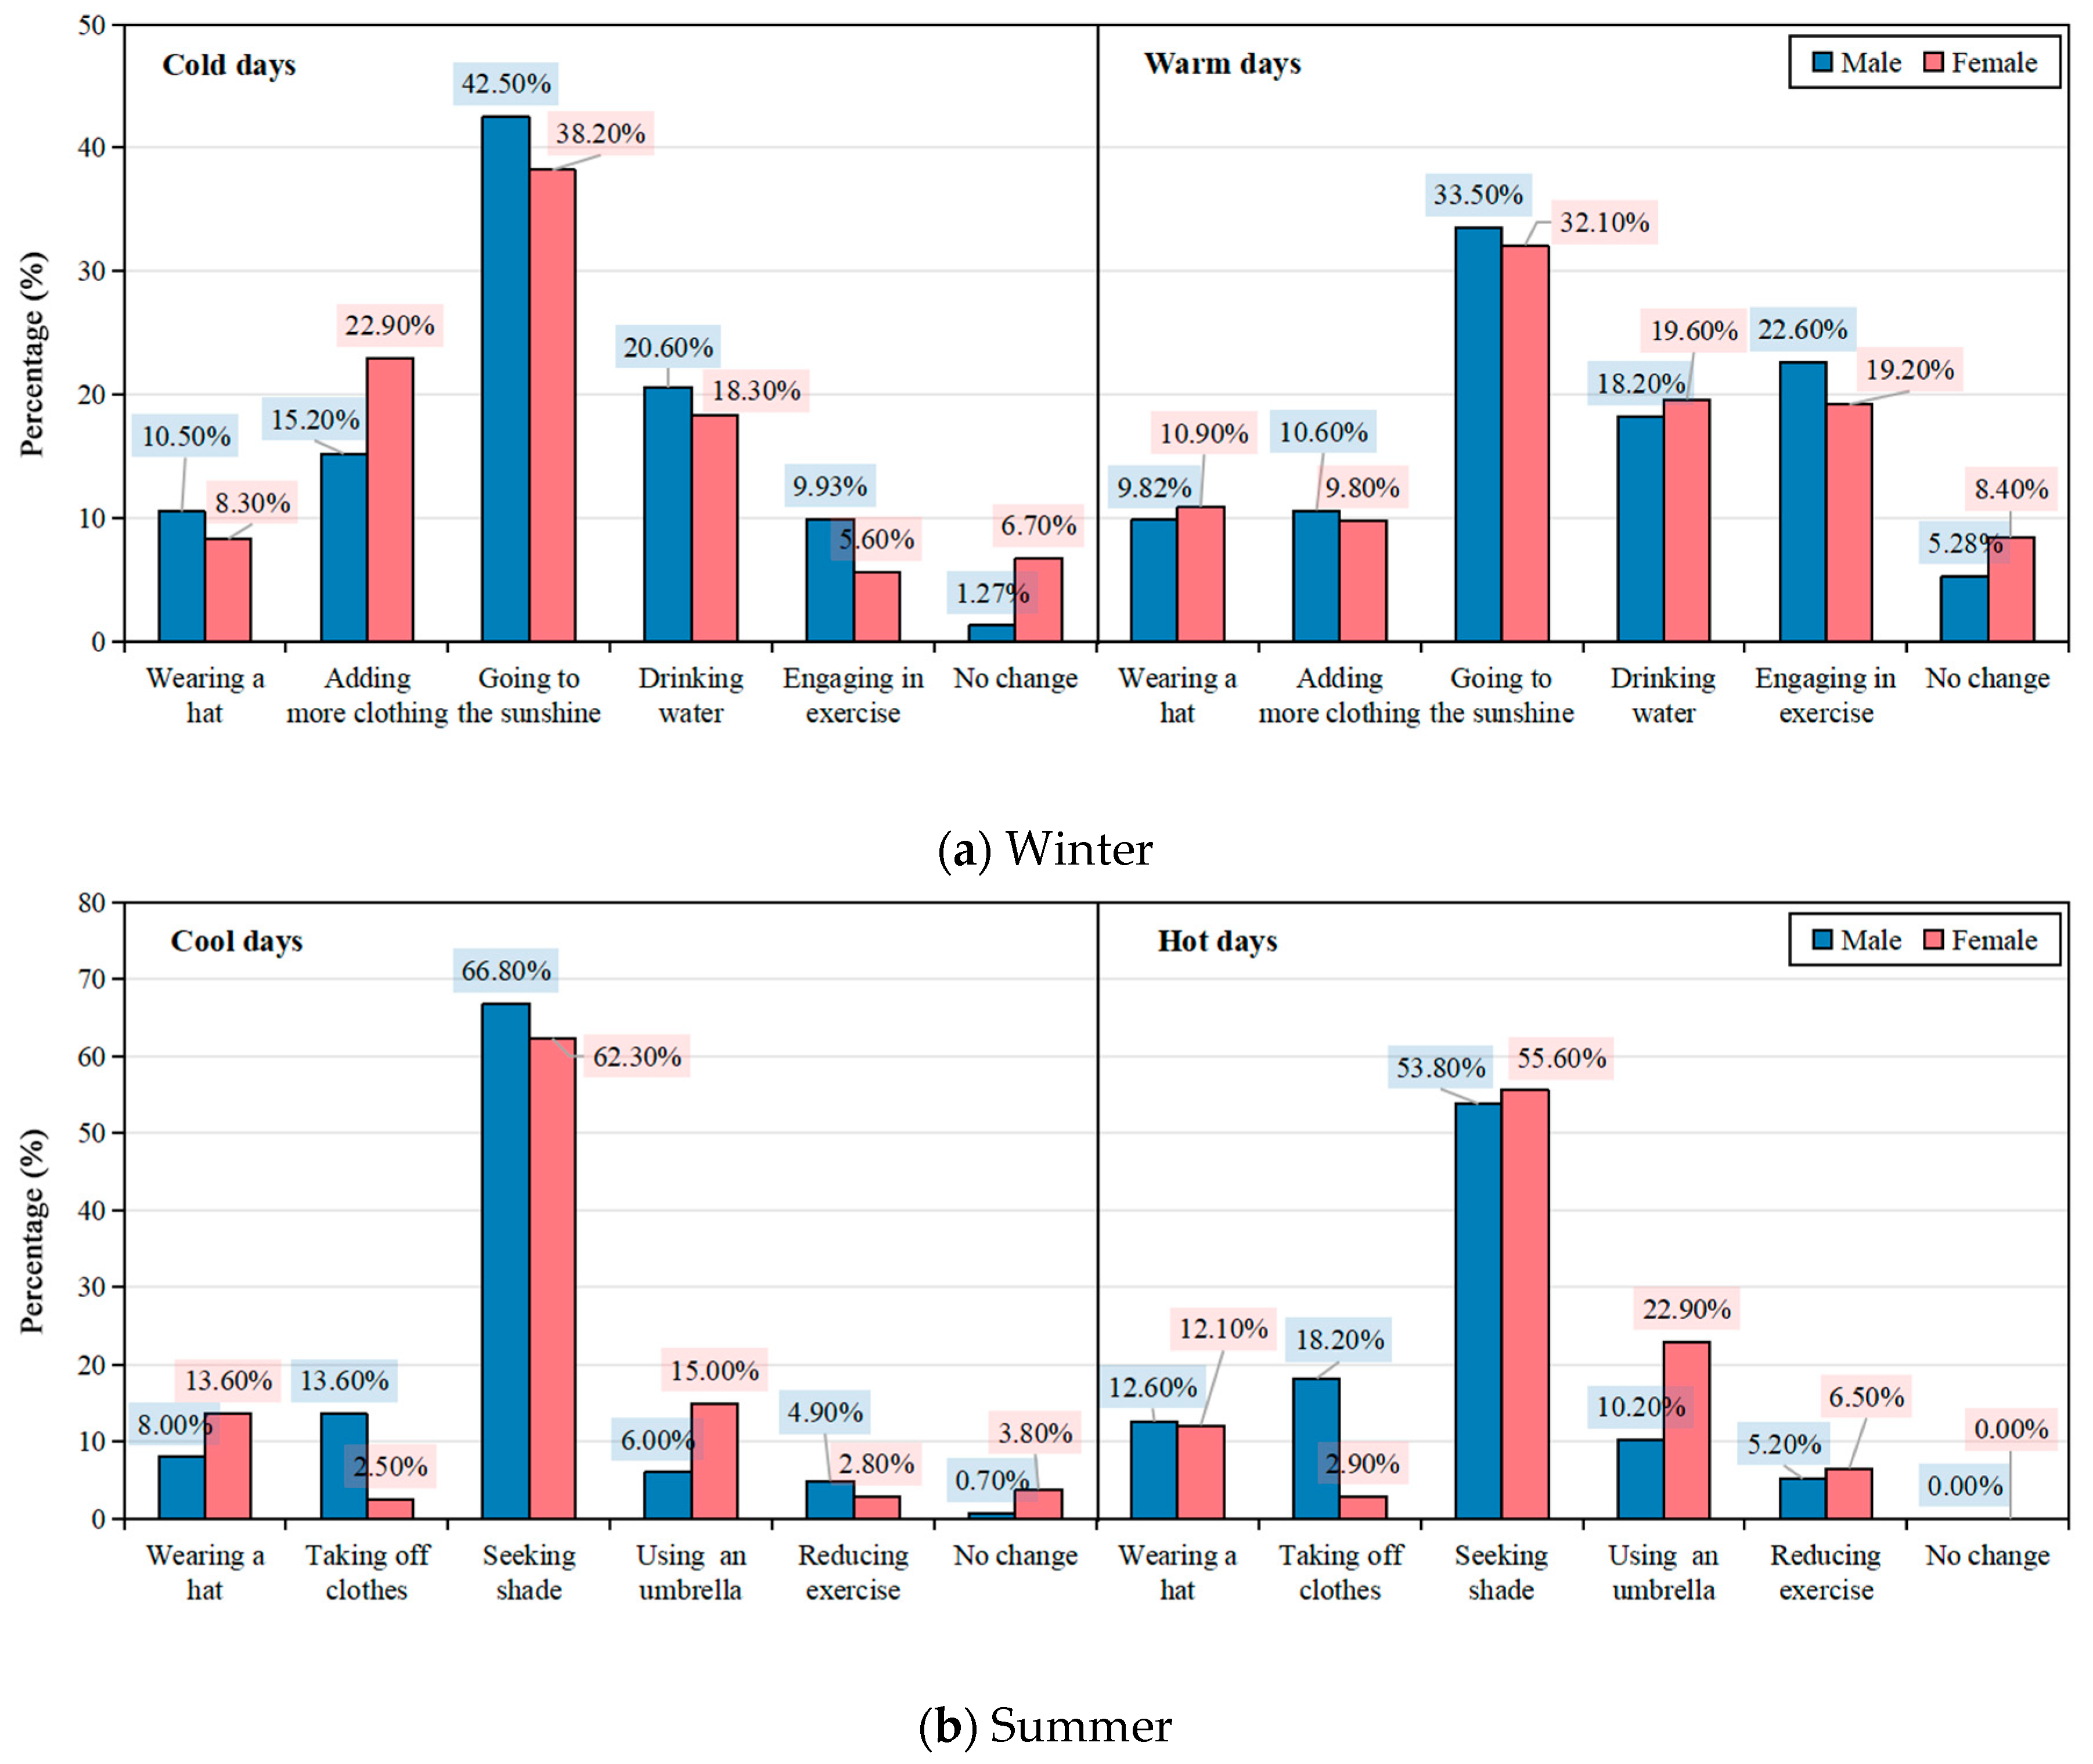
Figure 19 presents the percentage distribution of thermal adaptation behaviors among the different age groups under various weather conditions in winter and summer. In winter, “Going into the sunshine” was the most preferred heat adaptation behavior across all the age groups. From cold to warm days, the secondary choices varied among the different age groups. The elderly consistently prioritized “Adding more clothing,” while the youth preferred “Engaging in exercise.” In contrast, middle-aged individuals shifted their preference from “Drinking water” on colder days to “Engaging in exercise” as temperatures increased. Notably, as winter temperatures rose, the proportion of individuals “Engaging in exercise” significantly increased across all the age groups. This suggests that while “Engaging in exercise” serves as a response to cold outdoor conditions, a more comfortable winter environment encourages greater participation in outdoor physical activities.
In summer, “Seeking shade” was the predominant cooling strategy for all the age groups, followed by “Using an umbrella,” regardless of whether the day was cool or hot. Additionally, the proportion of individuals using protective measures, such as “Using an umbrella” and “Wearing a hat”, increased from cool to hot days.
Overall, solar radiation emerged as the primary factor influencing thermal adaptation behaviors. Furthermore, age-related differences in thermal adaptation behaviors were more pronounced in winter, whereas in summer, behavioral patterns were largely consistent across the age groups.

4.6.2. Analysis of Different Genders

In winter, both males and females predominantly preferred “Going into the sunshine” as their primary heat acclimatization behavior (Figure 20). However, their secondary choices varied with temperature changes. As conditions shifted from cold to warm, females’ second choice transitioned from “Adding more clothing” to “Drinking water” and “Engaging in exercise,” while males’ preference shifted from “Drinking water” to “Engaging in exercise.”
In summer, “Seeking shade” was the most common heat adaptation behavior for both genders. As temperatures increased, females tended to favor “Using an umbrella” as their second choice, whereas males were more likely to opt for “Removing clothing.” The primary differences in thermal adaptation behaviors between males and females in summer were observed in these two strategies.
Overall, females were more inclined to adopt protective measures, such as using an umbrella, to mitigate the effects of the outdoor environment, whereas males were more likely to rely on behavioral adjustments, such as removing clothing. These gender-based differences in thermal adaptation strategies contributed to variations in exposure to outdoor thermal conditions and heat stress.

4.7. Summary and Design Implications

Based on the outdoor environment measurements conducted in winter and summer in this study, in cities like Wuhan and other urban areas within the Cfa climate zone, there exists a pronounced seasonal temperature contrast—cold winters and hot summers. For the design of outdoor spaces in residential areas, it is essential to create climatically responsive and flexible environments that can dynamically adapt to seasonal variations [76]. In summer, outdoor spaces should prioritize effective solar shading, natural ventilation, and heat mitigation strategies to reduce thermal stress, while in winter, wind protection, solar access, and localized warming elements should be incorporated to enhance thermal comfort [77]. Such seasonally adaptive design can be achieved through multi-layered vegetation structures, adjustable shading devices, thermally responsive materials, and spatial configurations that accommodate shifting microclimatic needs. Furthermore, based on the questionnaire data collected in this study, prolonged periods of extreme heat during summer have a more pronounced impact on outdoor thermal comfort in residential areas. Therefore, in the context of Wuhan, improving outdoor thermal comfort during the summer season has emerged as a more urgent and critical task for urban design and environmental governance [78].
Due to physiological differences and variations in thermal adaptation behaviors under distinct seasonal conditions, different age and gender groups exhibit differences in their thermal comfort benchmarks. This finding highlights the importance of acknowledging group-specific diversity in climate-responsive design for residential outdoor spaces, rather than relying on an “average user” as the sole basis for planning [79]. It is recommended that multi-layered and adjustable microclimate strategies be incorporated into residential landscape and spatial design. These may include activity zones with varying levels of shading and ventilation, flexible seating arrangements, and transitional climate-buffering spaces that cater to the needs of diverse age groups [80]. Such design approaches enhance inclusivity by better accommodating varying physiological needs and behavioral preferences. Furthermore, integrating thermal comfort benchmarks for different demographic groups into the planning and evaluation process can help more accurately identify specific comfort thresholds. This ensures that outdoor environments remain livable and inclusive even under conditions of extreme seasonal temperature fluctuations.

4.8. Limitations

This study has several limitations. First, the field survey and on-site measurements were conducted only in Wuhan, China. Although Wuhan represents a typical Cfa climate zone, its unique geographical context and urban morphology may limit the generalizability of the findings. Future research should consider cross-city comparisons within other Cfa climate regions to enhance the broader applicability of the results. Second, while the measurements were carried out on typical meteorological days in both winter and summer, potential extreme weather events during the study period (e.g., cold snaps or heatwaves) may have interfered with the participants’ thermal perceptions, thereby affecting the representativeness of the data. Third, due to the impact of the COVID-19 pandemic, the sample size was relatively limited. Although it meets the basic statistical requirements, expanding the sample size would help improve the robustness of the models and increase the power of statistical testing. In addition, this study relied primarily on self-reported questionnaires, which may introduce subjective bias. Future research could incorporate wearable devices and non-invasive physiological sensors to obtain more objective and continuous thermal response data. Lastly, although the regression model comparisons between the demographic groups did not reveal statistically significant differences, this does not negate the presence of actual variations in thermal comfort characteristics. Notably, we still observed distinct differences in subjective thermal sensation and neutral temperatures across the groups. Given the small sample sizes and subtle between-group differences, future studies with larger datasets and multidimensional indicators—combined with structural equation modeling—could offer deeper insights into the interaction mechanisms and adaptive behaviors underlying group-based thermal responses.

5. Conclusions

A comprehensive understanding of the relationship between thermal comfort and thermal sensation among different population groups in outdoor environments is essential for optimizing settlement design and promoting sustainable urban development. This study systematically explored the relationship between thermal comfort and thermal sensation of different groups of people under different weather conditions in winter and summer by combining field measurements and questionnaires in two settlements in Wuhan. In addition, thermal benchmark models were established for different people groups in different scenarios. The conclusions of the study are as follows:
Weather temperature plays a complex role in shaping the relationship between TSV and TCV. This study identified 36 °C as a critical threshold in summer, beyond which significant shifts in TSV and TCV occur, likely due to increased physiological strain on heat dissipation. In winter, variations in weather temperature had a more pronounced impact on the relationship between TSV and MTCV. Furthermore, age-related differences in the relationship of TSV-MTCV were more evident in winter, while gender-related differences were more pronounced in summer.
Variations in summer temperatures had a more pronounced impact on the respondents’ thermal benchmarks. As temperatures rose, thermal sensitivity increased, with the youth and middle-aged exhibiting a significantly greater increase in sensitivity compared to the elderly, and males showing a more pronounced increase than females. In contrast, the elderly and females demonstrated a broader range of thermal acceptability and a stronger preference for cooler outdoor environments. This phenomenon may be attributed to their relatively lower metabolic rates and heat dissipation capacity, as well as their heightened focus on protective measures to mitigate the effects of extreme outdoor temperatures.
Finally, this study found that the UTCI is more suitable for assessing OTC in Wuhan residential areas compared to PET. Although the UTCI exhibits strong correlations (exceeding 96%) with commonly used thermal comfort indices, such as PET, SET, and PMV, it demonstrates greater sensitivity to temporal variations in the microclimate. This heightened sensitivity allows the UTCI to better capture subtle changes in human thermal perception in response to weather fluctuations. Given the distinct microclimatic characteristics of residential outdoor environments and this study’s focus on the effects of temperature variations on thermal comfort, the UTCI proves to be highly applicable in this context.
This study provides valuable insights into the differences and underlying mechanisms influencing thermal benchmark models across different population groups under varying weather conditions. Additionally, the findings serve as a reference for optimizing the design of residential areas to improve outdoor thermal comfort.

Author Contributions

Conceptualization, M.W., C.Z. and S.X.; methodology, M.W. and B.H.; software, M.W. and C.Z.; validation, M.W. and S.W.; formal analysis, M.W. and C.Z.; investigation, M.W. and S.W.; resources, M.W., H.W., B.H. and S.X.; data curation, S.W., H.W. and Q.C.; writing—original draft preparation, M.W.; writing—review and editing, M.W. and B.H.; visualization, C.Z. and Q.C.; supervision, B.H. and S.X.; project administration, M.W. and S.X.; funding acquisition, M.W., B.H. and S.X. All authors have read and agreed to the published version of this manuscript.

Funding

This research was funded by the National Natural Science Foundation of China (No. 52378020), the Program for HUST Academic Frontier Youth Team (No. 2019QYTD10), the Open Foundation of the State Key Laboratory of Subtropical Building and Urban Science (No. 2023KA02), the Urban Renewal and Transportation Joint Laboratory of Anhui Province (No. 2024CSGX-KF01), the China Meteorological Administration “Research on value realization of climate ecological products” Youth Innovation Team Project (No. CMA2024QN15), Chongqing Natural Science Foundation Project (No. CSTB2024NSCQ-MSX0670), and the Fundamental Research Funds for the Central Universities (No. YCJJ20251304).

Data Availability Statement

The raw data supporting the conclusions of this article will be made available by the authors on request.

Acknowledgments

The authors extend special thanks to the anonymous reviewers and editor for their valuable comments and recommendations for publishing this paper.

Conflicts of Interest

Huohua Wang was employed by China Construction No.3 Bureau No.3 Construction Engineering Co., Ltd. Qiwei Chen was employed by China United Engineering Corpation Limited. The remaining authors declare that the research was conducted in the absence of any commercial or financial relationships that could be construed as a potential conflict of interest.

Abbreviations

The following abbreviations are used in this manuscript:
MTCVMean TCV
MTSVMean TSV
NPETNeutral PET (°C)
NPETRNeutral PET range (°C)
NUTCINeutral UTCI (°C)
NUTCIRNeutral UTCI range (°C)
OTCOutdoor thermal comfort
PETPhysiological equivalent temperature (°C)
RHRelative humidity (%)
TaAir temperature (°C)
TARThermal acceptability range
TAVThermal acceptability vote
TCVThermal comfort vote
TgBlack globe temperature (°C)
TmrtMean radiant temperature (°C)
TSVThermal sensation vote
UTCIUniversal thermal climate index (°C)
VaWind speed (m/s)

References

  1. Global Temperature|Vital Signs—Climate Change: Vital Signs of the Planet, (n.d.). Available online: https://climate.nasa.gov/vital-signs/global-temperature/?intent=121 (accessed on 27 September 2024).
  2. Zhao, Q.; Guo, Y.; Ye, T.; Gasparrini, A.; Tong, S.; Overcenco, A.; Urban, A.; Schneider, A.; Entezari, A.; Vicedo-Cabrera, A.M.; et al. Global, regional, and national burden of mortality associated with non-optimal ambient temperatures from 2000 to 2019: A three-stage modelling study. Lancet Planet. Health 2021, 5, e415–e425. [Google Scholar] [CrossRef]
  3. Dong, Y.; Ren, Z.; Fu, Y.; Hu, N.; Guo, Y.; Jia, G.; He, X. Decrease in the residents’ accessibility of summer cooling services due to green space loss in Chinese cities. Environ. Int. 2022, 158, 107002. [Google Scholar] [CrossRef]
  4. Yang, M.; Li, Y.; Du, Y.; Wang, Y.; Fei, W.; Huang, J.; Liang, J. What is the outdoor thermal comfort (OTC) threshold in Gulangyu, China: An empirical study. Urban Clim. 2024, 56, 102086. [Google Scholar] [CrossRef]
  5. Amaripadath, D.; Rahif, R.; Velickovic, M.; Attia, S. A systematic review on role of humidity as an indoor thermal comfort parameter in humid climates. J. Build. Eng. 2023, 68, 106039. [Google Scholar] [CrossRef]
  6. Liu, K.; Lian, Z.; Dai, X.; Lai, D. Comparing the effects of sun and wind on outdoor thermal comfort: A case study based on longitudinal subject tests in cold climate region. Sci. Total Environ. 2022, 825, 154009. [Google Scholar] [CrossRef]
  7. Liu, Y.; Zhang, G.; Yang, W. Dynamic estimation of urban heat exposure for outdoor jogging: Combining individual trajectory and mean radiant temperature. Urban Clim. 2024, 55, 101871. [Google Scholar] [CrossRef]
  8. Xie, X.; Sun, Z.; Zhu, X.; Zhao, S.; Wang, Z.; Zhai, Y. Influence of misting system on the thermal environment and thermal comfort of seated people in semi-outdoor space in Xi’an, China. Front. Archit. Res. 2024, 13, 668–681. [Google Scholar] [CrossRef]
  9. Nikolopoulou, M. Outdoor thermal comfort. Front. Biosci. (Sch. Ed.) 2011, 3, 1552–1568. [Google Scholar] [CrossRef]
  10. Jin, H.; Liu, S.; Kang, J. Gender differences in thermal comfort on pedestrian streets in cold and transitional seasons in severe cold regions in China. Build. Environ. 2020, 168, 106488. [Google Scholar] [CrossRef]
  11. Yuan, T.; Hong, B.; Qu, H.; Liu, A.; Zheng, Y. Outdoor thermal comfort in urban and rural open spaces: A comparative study in China’s cold region. Urban Clim. 2023, 49, 101501. [Google Scholar] [CrossRef]
  12. Huang, Z.; Cheng, B.; Gou, Z.; Zhang, F. Outdoor thermal comfort and adaptive behaviors in a university campus in China’s hot summer-cold winter climate region. Build. Environ. 2019, 165, 106414. [Google Scholar] [CrossRef]
  13. Su, Y.; Wu, Z.; Gao, W.; Wang, C.; Zhao, Q.; Wang, D.; Li, J. Summer outdoor thermal comfort evaluation of urban open spaces in arid-hot climates. Energy Build. 2024, 321, 114679. [Google Scholar] [CrossRef]
  14. Baquero Larriva, M.T.; Higueras García, E. Thermal Comfort for the Elderly: A Systematic Review of the Scientific Literature. Rev. Esp. Geriatr. Gerontol. 2019, 54, 280–295. [Google Scholar] [CrossRef]
  15. Xu, T.; Yao, R.; Du, C.; Li, B. Outdoor thermal perception and heatwave adaptation effects in summer—A case study of a humid subtropical city in China. Urban Clim. 2023, 52, 101724. [Google Scholar] [CrossRef]
  16. Xiong, K.; He, B.-J. Wintertime outdoor thermal sensations and comfort in cold-humid environments of Chongqing China. Sustain. Cities Soc. 2022, 87, 104203. [Google Scholar] [CrossRef]
  17. Kim, Y.; Brown, R.D. Climate-sensitive street design: Evaluating summer pedestrian activity and behavioral thermal adaptation on the high line. NYC. Build. Environ. 2025, 281, 113203. [Google Scholar] [CrossRef]
  18. Xu, T.; Yao, R.; Du, C.; Li, B.; Fang, F. A quantitative evaluation model of outdoor dynamic thermal comfort and adaptation: A year-long longitudinal field study. Build. Environ. 2023, 237, 110308. [Google Scholar] [CrossRef]
  19. Zou, J.; Yu, Y.; Mortezazadeh, M.; Lu, H.; Gaur, A.; Wang, L. Evaluating Climate Change Impacts on Building Level Steady-State and Dynamic Outdoor Thermal Comfort. Build. Environ. 2025, 271, 112604. [Google Scholar] [CrossRef]
  20. Huang, B.; Matzarakis, A.; He, B.-J. Nonlinear law of cumulative heat exposure and dynamic thermal comfort during pedestrians’ walking: Field experiments and machine learning predictions. Sustain. Cities Soc. 2025, 131, 106696. [Google Scholar] [CrossRef]
  21. Ji, Y.; Song, J.; Shen, P. A review of studies and modelling of solar radiation on human thermal comfort in outdoor environment. Build. Environ. 2022, 214, 108891. [Google Scholar] [CrossRef]
  22. Kumar, P.; Sharma, A. Study on importance; procedure, and scope of outdoor thermal comfort—A review. Sustain. Cities Soc. 2020, 61, 102297. [Google Scholar] [CrossRef]
  23. Potchter, O.; Cohen, P.; Lin, T.-P.; Matzarakis, A. Outdoor human thermal perception in various climates: A comprehensive review of approaches, methods and quantification. Sci. Total Environ. 2018, 631–632, 390–406. [Google Scholar] [CrossRef]
  24. Zhang, S.; Zhang, X.; Niu, D.; Fang, Z.; Chang, H.; Lin, Z. Physiological equivalent temperature-based and universal thermal climate index-based adaptive-rational outdoor thermal comfort models. Build. Environ. 2023, 228, 109900. [Google Scholar] [CrossRef]
  25. Deng, X.; Nie, W.; Li, X.; Wu, J.; Yin, Z.; Han, J.; Pan, H.; Lam, C.K.C. Influence of built environment on outdoor thermal comfort: A comparative study of new and old urban blocks in Guangzhou. Build. Environ. 2023, 234, 110133. [Google Scholar] [CrossRef]
  26. Bröde, P.; Fiala, D.; Błażejczyk, K.; Holmér, I.; Jendritzky, G.; Kampmann, B.; Tinz, B.; Havenith, G. Deriving the operational procedure for the Universal Thermal Climate Index (UTCI). Int. J. Biometeorol. 2012, 56, 481–494. [Google Scholar] [CrossRef]
  27. Luo, M.; Guo, F.; Tang, H.; Ming, R.; Huang, L.; Zhao, H. A Systematic Review of the Influence of Physiological Factors on Outdoor Thermal Comfort. Hum. Settl. Sustain. 2025, 1, 27–40. [Google Scholar] [CrossRef]
  28. Cheung, P.K.; Jim, C.Y. Comparing the cooling effects of a tree and a concrete shelter using PET and UTCI. Build. Environ. 2018, 130, 49–61. [Google Scholar] [CrossRef]
  29. Kozak, M.; Lipecki, T. The impact of green walls on outdoor thermal comfort in residential areas under warm weather conditions: A case study. Urban Clim. 2025, 62, 102541. [Google Scholar] [CrossRef]
  30. Lai, D.; Guo, D.; Hou, Y.; Lin, C.; Chen, Q. Studies of outdoor thermal comfort in northern China. Build. Environ. 2014, 77, 110–118. [Google Scholar] [CrossRef]
  31. Liu, W.; Zhang, Y.; Deng, Q. The effects of urban microclimate on outdoor thermal sensation and neutral temperature in hot-summer and cold-winter climate. Energy Build. 2016, 128, 190–197. [Google Scholar] [CrossRef]
  32. Hadianpour, M.; Mahdavinejad, M.; Bemanian, M.; Nasrollahi, F. Seasonal differences of subjective thermal sensation and neutral temperature in an outdoor shaded space in Tehran, Iran. Sustain. Cities Soc. 2018, 39, 751–764. [Google Scholar] [CrossRef]
  33. Cheung, P.K.; Jim, C.Y. Improved assessment of outdoor thermal comfort: 1-hour acceptable temperature range. Build. Environ. 2019, 151, 303–317. [Google Scholar] [CrossRef]
  34. Cheng, B.; Gou, Z.; Zhang, F.; Feng, Q.; Huang, Z. Thermal comfort in urban mountain parks in the hot summer and cold winter climate. Sustain. Cities Soc. 2019, 51, 101756. [Google Scholar] [CrossRef]
  35. Sharmin, T.; Steemers, K.; Humphreys, M. Outdoor thermal comfort and summer PET range: A field study in tropical city Dhaka. Energy Build. 2019, 198, 149–159. [Google Scholar] [CrossRef]
  36. Kenawy, I.; Lam, C.K.C.; Shooshtarian, S. Summer outdoor thermal benchmarks in Melbourne: Applications of different techniques. Build. Environ. 2021, 195, 107658. [Google Scholar] [CrossRef]
  37. Ma, X.; Tian, Y.; Du, M.; Hong, B.; Lin, B. How to design comfortable open spaces for the elderly? Implications of their thermal perceptions in an urban park. Sci. Total Environ. 2021, 768, 144985. [Google Scholar] [CrossRef]
  38. Silva, T.J.V.; Hirashima, S.Q.S. Predicting urban thermal comfort from calibrated UTCI assessment scale—A case study in Belo Horizonte city, southeastern Brazil. Urban Clim. 2021, 36, 100652. [Google Scholar] [CrossRef]
  39. Mei, Y.; Xu, L. Research on Seasonal Thermal Neutral Temperature in West Lake Scenic Area of Hangzhou, China. Int. J. Environ. Res. Public Health 2022, 19, 14677. [Google Scholar] [CrossRef]
  40. Manavvi, S.; Rajasekar, E. Evaluating outdoor thermal comfort in urban open spaces in a humid subtropical climate: Chandigarh, India. Build. Environ. 2022, 209, 108659. [Google Scholar] [CrossRef]
  41. Wei, D.; Yang, L.; Bao, Z.; Lu, Y.; Yang, H. Variations in outdoor thermal comfort in an urban park in the hot-summer and cold-winter region of China. Sustain. Cities Soc. 2022, 77, 103535. [Google Scholar] [CrossRef]
  42. Wang, W.; Li, Y.; Li, L.; Wang, R.; Wang, Y. Study on thermal comfort of elderly in community parks: An exploration from the perspectives of different activities and ages. Build. Environ. 2023, 246, 111001. [Google Scholar] [CrossRef]
  43. He, X.; Gao, W.; Wang, R.; Yan, D. Study on outdoor thermal comfort of factory areas during winter in hot summer and cold winter zone of China. Build. Environ. 2023, 228, 109883. [Google Scholar] [CrossRef]
  44. Zhang, H.; Wang, Y.; Guo, F.; Zhao, J.; Dong, J.; Zhu, P. Factors influencing outdoor thermal comfort in a coastal park during the transition seasons in cold regions of China. Urban. Clim. 2024, 55, 101856. [Google Scholar] [CrossRef]
  45. Li, Z.; Zhou, L.; Hong, X.; Qiu, S. Outdoor thermal comfort and activities in urban parks: An experiment study in humid subtropical climates. Build. Environ. 2024, 253, 111361. [Google Scholar] [CrossRef]
  46. Heidari, A.; Davtalab, J.; Sargazi, M.A. Effect of awning on thermal comfort adjustment in open urban space using PET and UTCI indexes: A case study of Sistan region in Iran. Sustain. Cities Soc. 2024, 101, 105175. [Google Scholar] [CrossRef]
  47. Al Tahir, I.; El Fattah, A.A.; Mohammed, M.; Asif, M.; Almahdy, O. Evaluating the performance of outdoor shading devices on human thermal comfort in hot humid climates: A case study of Dhahran. Build. Environ. 2025, 271, 112625. [Google Scholar] [CrossRef]
  48. Cai, M.; Li, M.; Liu, H. Optimizing cooling efficiency of urban greenspaces across local climate zones in Wuhan, China. Urban For. Urban Green. 2025, 105, 128691. [Google Scholar] [CrossRef]
  49. Zhang, C.; Xu, S.; Qi, C.; Dai, R.; Mendis, T.; Wang, M. Comparison of Thermal Comfort in Different Subway Spaces in China’s Hot Summer and Cold Winter Region: A Field Investigation Based on Subway Station Transition. Buildings 2025, 15, 786. [Google Scholar] [CrossRef]
  50. METAR TAF: Wuhan Tianhe International Airport, Wuhan, People’s Republic of China. (n.d.). Available online: https://zh.allmetsat.com/metar-taf/china.php?icao=ZHHH (accessed on 9 August 2025).
  51. Qin, H.; Ma, Y.; Niu, J.; Huo, J.; Wei, X.; Yan, J.; Han, G. Investigating differences of outdoor thermal comfort for the elderly among genders across seasons: A case study in Chongqing, China. Urban Clim. 2025, 61, 102398. [Google Scholar] [CrossRef]
  52. Standard 55—Thermal Environmental Conditions for Human Occupancy, (n.d.). Available online: https://www.ashrae.org/technical-resources/bookstore/standard-55-thermal-environmental-conditions-for-human-occupancy (accessed on 27 September 2024).
  53. Ainsworth, B.E.; Haskell, W.L.; Herrmann, S.D.; Meckes, N.; Bassett, D.R.J.; Tudor-Locke, C.; Greer, J.L.; Vezina, J.; Whitt-Glover, M.C.; Leon, A.S. 2011 Compendium of Physical Activities: A Second Update of Codes and MET Values. Med. Sci. Sports Exerc. 2011, 43, 1575. [Google Scholar] [CrossRef]
  54. ISO 8996: 2021, ISO (n.d.). Available online: https://www.iso.org/standard/74443.html (accessed on 9 August 2025).
  55. Lin, Z.; Yang, R.; Li, K.; Yi, G.; Li, Z.; Guo, J.; Zhang, Z.; Junxiang, P.; Liu, Y.; Qi, S.; et al. Establishment of age group classification for risk stratification in glioma patients. BMC Neurol. 2020, 20, 310. [Google Scholar] [CrossRef]
  56. Meng, F.; Qin, M.; Gao, Z.; Wang, H.; Xu, X.; Xu, F. A review of RayMan in thermal comfort simulation: Development, applications and prospects. Build. Environ. 2025, 270, 112547. [Google Scholar] [CrossRef]
  57. Johansson, E.; Thorsson, S.; Emmanuel, R.; Krüger, E. Instruments and methods in outdoor thermal comfort studies—The need for standardization. Urban Clim. 2014, 10, 346–366. [Google Scholar] [CrossRef]
  58. Yao, R.; Li, Y.; Du, C.; Li, B. A ‘heart rate’-based model (PHSHR) for predicting personal heat stress in dynamic working environments. Build. Environ. 2018, 135, 318–329. [Google Scholar] [CrossRef]
  59. High Temperature Warning Science, (n.d.). Available online: https://www.cma.gov.cn/yjkp/202111/t20211104_4194712.html (accessed on 14 March 2025).
  60. Xu, X.; Lian, Z. A sleep staging model based on core body temperature rhythm. Energy Build. 2024, 310, 114099. [Google Scholar] [CrossRef]
  61. Natsume, K.; Ogawa, T.; Sugenoya, J.; Ohnishi, N.; Imai, K. Preferred ambient temperature for old and young men in summer and winter. Int. J. Biometeorol. 1992, 36, 1–4. [Google Scholar] [CrossRef]
  62. Zhao, Q.; Liu, J.; Sullivan, N.; Chang, K.; Spina, J.; Blasch, E.; Chen, G. Anomaly detection of unstructured big data via semantic analysis and dynamic knowledge graph construction. In Proceedings of the Signal Processing, Sensor/Information Fusion, and Target Recognition XXX, Online, 12–17 April 2021; Volume 11756, p. 117560N. [Google Scholar] [CrossRef]
  63. Su, X.; Li, Y.; Gu, C.; Liu, Z.; Yang, B.; Hong, B. A modified COMFA model for elderly people in outdoor environments. Sustain. Cities Soc. 2023, 99, 104940. [Google Scholar] [CrossRef]
  64. Li, C.; Wu, J.; Fan, C.; Sun, B.; Hu, Z. Human thermal perception in extremely cold environments: A study of overall and local responses. Energy Build. 2024, 303, 113773. [Google Scholar] [CrossRef]
  65. Larriva, M.T.B.; Higueras, E. Health risk for older adults in Madrid, by outdoor thermal and acoustic comfort. Urban Clim. 2020, 34, 100724. [Google Scholar] [CrossRef]
  66. Taylor, N.A.S.; Allsopp, N.K.; Parkes, D.G. Preferred Room Temperature of Young vs Aged Males: The Influence of Thermal Sensation, Thermal Comfort, and Affect. J. Gerontol. Ser. A 1995, 50, M216–M221. [Google Scholar] [CrossRef]
  67. Lindner-Cendrowska, K.; Błażejczyk, K. Impact of selected personal factors on seasonal variability of recreationist weather perceptions and preferences in Warsaw (Poland). Int. J. Biometeorol. 2018, 62, 113–125. [Google Scholar] [CrossRef]
  68. Anderson, G.S.; Meneilly, G.S.; Mekjavic, I.B. Passive temperature lability in the elderly. Europ. J. Appl. Physiol. 1996, 73, 278–286. [Google Scholar] [CrossRef]
  69. Seino, K.; Nakamura, K.; Alemi, S. Social interactions and heat stress mitigation among elderly people in a healthy city. Lancet Planet. Health 2024, 8, S12. [Google Scholar] [CrossRef] [PubMed]
  70. Mishra, N.K.; Vance, M.E.; Novoselac, A.; Patel, S. Dynamic optimization of personal exposure and energy consumption while ensuring thermal comfort in a test house. Build. Environ. 2024, 252, 111265. [Google Scholar] [CrossRef]
  71. Oliveira, S.; Andrade, H. An initial assessment of the bioclimatic comfort in an outdoor public space in Lisbon. Int. J. Biometeorol. 2007, 52, 69–84. [Google Scholar] [CrossRef]
  72. Yochihara, Y.; Ohnaka, T.; Nagai, Y.; Tokuda, T.; Kawashima, Y. Physiological responses and thermal sensations of the elderly in cold and hot environments. J. Therm. Biol. 1993, 18, 355–361. [Google Scholar] [CrossRef]
  73. Maeda, T.; Kobayashi, T.; Tanaka, K.; Sato, A.; Kaneko, S.-Y.; Tanaka, M. Seasonal Differences in Physiological and Psychological Responses to Hot and Cold Environments in the Elderly and Young Males; Tochihara, Y., Ohnaka, T., Eds.; Elsevier Ergonomics Book Series; Elsevier: Amsterdam, The Netherlands, 2005; pp. 35–41. [Google Scholar] [CrossRef]
  74. Yung, E.H.K.; Wang, S.; Chau, C. Thermal perceptions of the elderly, use patterns and satisfaction with open space. Landsc. Urban Plan. 2019, 185, 44–60. [Google Scholar] [CrossRef]
  75. Li, J.; Liu, N. The perception, optimization strategies and prospects of outdoor thermal comfort in China: A review. Build. Environ. 2020, 170, 106614. [Google Scholar] [CrossRef]
  76. Zhou, S.; Xu, X.; Xu, H.; Zhao, Z.; Yuan, H.; Wang, Y.; Qiao, R.; Wu, T.; Jia, W.; Wang, M.; et al. From heat resilience to sustainable co-benefits: Adaptive urban morphology generation based on multimodal data fusion and a novel generative framework. Sustain. Cities Soc. 2025, 127, 106452. [Google Scholar] [CrossRef]
  77. Zhou, S.-Q.; Yu, Z.-W.; Ma, W.-Y.; Yao, X.-H.; Xiong, J.-Q.; Ma, W.-J.; Xiang, S.-Y.; Yuan, Q.; Hao, Y.-Y.; Xu, D.-F.; et al. Vertical canopy structure dominates cooling and thermal comfort of urban pocket parks during hot summer days. Landsc. Urban Plan. 2025, 254, 105242. [Google Scholar] [CrossRef]
  78. Xu, J.; Xu, X.; Wang, Z.; Chen, H.; Ren, Q.; Huang, H.; Cui, Y.; An, R.; Liu, Y. Investigating thermal exposure during daily walking through a human-scale approach: An analysis of a hot summer in Wuhan. Build. Environ. 2024, 264, 111932. [Google Scholar] [CrossRef]
  79. Kim, J.Y.; Park, C.Y.; Hyun, J.H.; Kim, S.H.; Yun, S.H.; Lee, D.K.; Kim, J.Y. Landscape Design for Improved Thermal Environment: An Optimized Tree Arrangement Design for Climate-Responsive Outdoor Spaces in Residential Buildings Complexes. Sustain. Cities Soc. 2023, 97, 104762. [Google Scholar] [CrossRef]
  80. Uchiyama, Y.; Kyan, A.; Sato, M.; Ushimaru, A.; Minamoto, T.; Kiyono, M.; Harada, K.; Takakura, M. Local environment perceived in daily life and urban green and blue space visits: Uncovering key factors for different age groups to access ecosystem services. J. Environ. Manag. 2024, 370, 122676. [Google Scholar] [CrossRef]
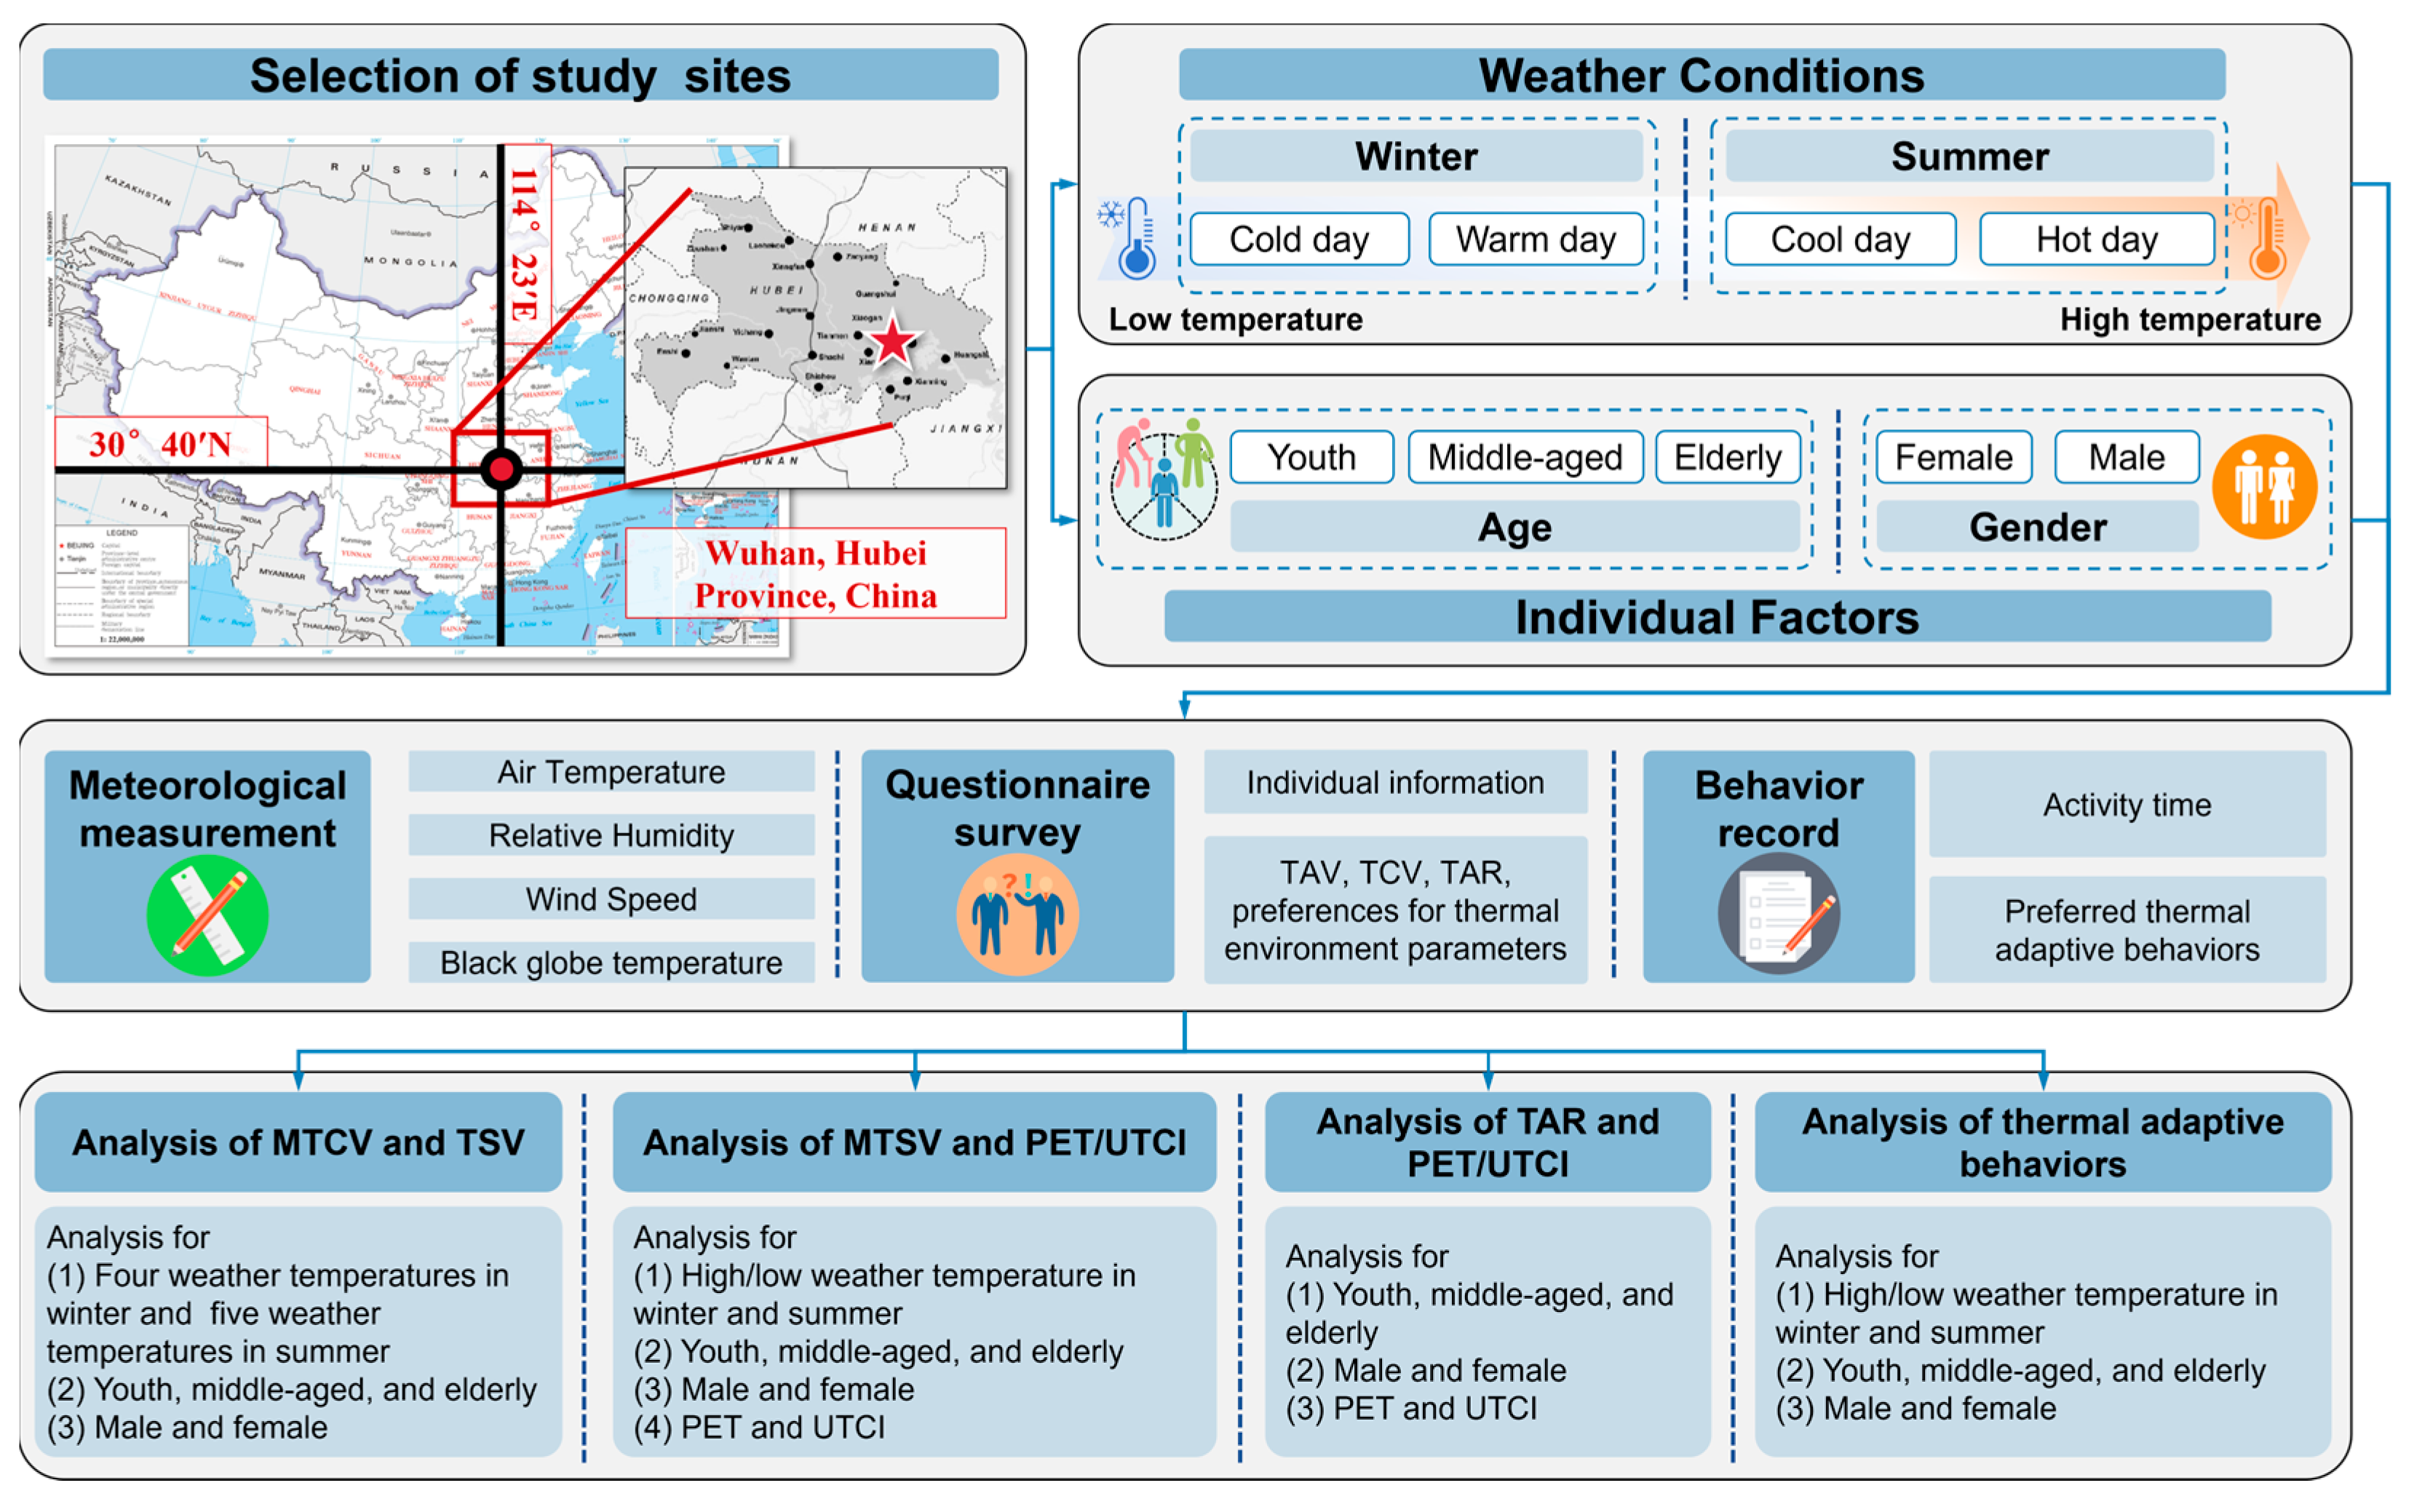
Figure 1. The framework of this study.
Buildings 15 03037 g001
Figure 2. Monthly mean, maximum, and minimum air temperature and mean relative humidity in Wuhan from 2002 to 2022.
Buildings 15 03037 g002
Figure 3. The normal distribution of residential building density and floor area ratio.
Buildings 15 03037 g003
Figure 4. Geographical location of the study area and distribution of the measurement sites.
Buildings 15 03037 g004
Figure 5. Questionnaire of votes.
Buildings 15 03037 g005
Figure 6. Percentage of thermal sensation votes.
Buildings 15 03037 g006
Figure 7. Percentage of thermal comfortable votes.
Buildings 15 03037 g007
Figure 8. Quadratic regression of TSV and MTCV in different weather temperatures.
Buildings 15 03037 g008
Figure 9. Quadratic regression of TSV and MTCV of different age groups.
Buildings 15 03037 g009
Figure 10. Quadratic regression of TSV and MTCV of different genders.
Buildings 15 03037 g010
Figure 11. Linear regression of PET and UTCI on MTSV for different age groups. (a) PET-based fitting analysis under all weather conditions; (b) PET-based fitting analysis on cold days; (c) PET-based fitting analysis on warm days; (d) UTCI-based fitting analysis under all weather conditions; (e) UTCI-based fitting analysis on cold days; (f) UTCI-based fitting analysis on warm days.
Buildings 15 03037 g011
Figure 12. Linear regression of PET and UTCI on MTSV for different gender groups. (a) PET-based fitting analysis under all weather conditions; (b) PET-based fitting analysis on cold days; (c) PET-based fitting analysis on warm days; (d) UTCI-based fitting analysis under all weather conditions; (e) UTCI-based fitting analysis on cold days; (f) UTCI-based fitting analysis on warm days.
Buildings 15 03037 g012
Figure 13. Linear regression of PET and UTCI on MTSV for different age groups. (a) PET-based fitting analysis under all weather conditions; (b) PET-based fitting analysis on cool days; (c) PET-based fitting analysis on hot days; (d) UTCI-based fitting analysis under all weather conditions; (e) UTCI-based fitting analysis on cool days; (f) UTCI-based fitting analysis on hot days.
Buildings 15 03037 g013
Figure 14. Linear regression of PET and UTCI on MTSV for different gender groups. (a) PET-based fitting analysis under all weather conditions; (b) PET-based fitting analysis on cool days; (c) PET-based fitting analysis on hot days; (d) UTCI-based fitting analysis under all weather conditions; (e) UTCI-based fitting analysis on cool days; (f) UTCI-based fitting analysis on hot days.
Buildings 15 03037 g014aBuildings 15 03037 g014b
Figure 15. Relationship between thermal acceptable rate and PET and UTCI of different age groups.
Buildings 15 03037 g015
Figure 16. Relationship between the thermal acceptable rate and the PET and UTCI of different gender groups.
Buildings 15 03037 g016
Figure 17. Comparison of thermal benchmarks for different age groups.
Buildings 15 03037 g017
Figure 18. Comparison of thermal benchmarks for different geographic populations.
Buildings 15 03037 g018
Figure 19. Percentage of thermal adaptive behaviors of different age groups.
Buildings 15 03037 g019
Figure 20. Percentage of thermal adaptive behaviors in different gender groups.
Buildings 15 03037 g020
Table 1. Studies on outdoor thermal comfort worldwide in the last ten years (2014–2024).
YearCitySeasonKöppen Climate ClassificationObjectivesPeopleIndicators
2014 [30]TianjinWinter and summerDwaParkMixed agesUTCI
2016 [31]ChangshaWinter and summerCfaOutdoor public spacesYoung peoplePET
2018 [32]TehranFour seasonsBWkUniversity campusMixed agesPET, PMV, and UTCI
2019 [33]Hong KongSummerCwaCity parkMixed agesPET and UTCI
2019 [34]MianyangWinter and summerCwaUniversity campusYoung peoplePET
2019 [35]DhakaFall and summerAwResidential, commercial, and educational areaMixed agesPET
2021 [36]MelbourneJanuary–FebruaryCsbCity squareMixed agesPET
2021 [37]Xi’anWinter and summerCwaParkElderly peoplePET
2021 [38]Belo HorizonteWinter and summerAwCity squareMixed agesUTCI
2022 [39]HangzhouWinter and summerCfaScenic areaYoung peoplePET
2022 [40]ChandigarhWinter and summerCwaProminent sitesMixed agesPET
2022 [41]ChongqingWinter and summerCfaParkMixed agesPET and UTCI
2023 [42]HuangshanWinterCfaCommunity parksElderly peoplePET
2023 [43]HainingWinterCfaFactoryMixed agesPET and UTCI
2024 [44]DalianSpring and fallDwaParkMixed agesUTCI
2024 [45]XiamenWinter and summerCfaParkMixed agesPET
2025 [46]SistanSummerBWhOutdoor public spacesMixed agesPET and UTCI
2025 [47]DhahranSummerBWhSquareMixed agesPET
Table 2. Measurement point information.
Measurement PointSerial NumberDescriptions
Street SitesA1, B1Located on streets perpendicular to building facades. Site A1 had impermeable ground surfaces with tall trees on one side, while Site B1 was flanked by buildings on both sides.
Roadway SitesA2, B2Positioned on roads parallel to building facades, with D/H ratios of 1.67 and 2.67, respectively. Site B2 featured tall trees on both sides.
Shaded AreasA3, B3Located under tree canopies, providing shaded conditions.
Open SpacesA4, B4, A5Central courtyards surrounded by buildings. A4 had minimal daytime shade, while A5, situated in the northwest corner of the residential area, was more open and received ample sunlight.
Rooftop SitesRA, RBLocated on residential building rooftops and used for collecting background meteorological data.
Table 3. Date of the survey.
Measured SeasonDateResidential AreasMeasured TimeSurveys Time
WinterJanuary 9Gufeng community8:30–18:309:00–18:00
January 11
January 12
January 13Xingfuli community8:30–18:309:00–18:00
January 17
January 18
SummerJanuary 30Gufeng community8:30–18:308:30–18:00
January 31
August 2
August 6Xingfuli community8:30–18:308:30–18:00
August 7
August 8
Table 4. Statistics on the number of people surveyed.
YouthMiddle-AgedElderlyTotal
WinterSummerWinterSummerWinterSummerWinterSummer
Male1021261151386883285347
Female85103961094964230276
Total187229211247117147515623
Table 5. Classification of weather during the measurement period.
SeasonCategorizationAverage Daily Temperatures
WinterCool day (Low temperature)5 ≤ Ta < 6 °C (January 13)
7 ≤ Ta < 8 °C (January 9, 11, and 12)
Warm day (High temperature)8 ≤ Ta < 9 °C (January 18)
10 ≤ Ta < 11 °C (January 17)
SummerCool day (Low temperature)32 ≤ Ta < 33 °C (July 30)
33 ≤ Ta < 34 °C (July 31)
Hot day (High temperature)35 ≤ Ta < 36 °C (August 6 and 7)
36 ≤ Ta < 37 °C (August 2)
37 ≤ Ta < 38 °C (August 8)
Disclaimer/Publisher’s Note: The statements, opinions and data contained in all publications are solely those of the individual author(s) and contributor(s) and not of MDPI and/or the editor(s). MDPI and/or the editor(s) disclaim responsibility for any injury to people or property resulting from any ideas, methods, instructions or products referred to in the content.