Article

Research on Flexural Performance of Low-Strength Foamed Concrete Cold-Formed Steel Framing Composite Enclosure Wall Panels

1
Shandong Electric Power Engineering Consulting Institute Co., Ltd., Jinan 250013, China
2
School of Civil Engineering, Shandong Jianzhu University, Jinan 250061, China
*
Author to whom correspondence should be addressed.
Buildings 2025, 15(17), 3018; https://doi.org/10.3390/buildings15173018
Submission received: 13 July 2025 / Revised: 18 August 2025 / Accepted: 22 August 2025 / Published: 25 August 2025
(This article belongs to the Section Building Materials, and Repair & Renovation)

Abstract

To meet the requirements of a prefabricated building with specific strength limitations and assembly rate criteria, the research proposes a Low-Strength Foamed Concrete Cold-Formed Steel (CFS) Framing Composite Enclosure Wall Panel (LFSW). The ABAQUS 2024 finite element analysis (FEA) combined with bending performance tests on five specimens were employed to examine crack propagation and failure modes of wall panels under wind load, investigating the influence mechanisms of foamed concrete strength, CFS framing wall thickness, CFS framing section height, and concrete cover thickness on the flexural performance of wall panels. The experimental results demonstrate that increasing the steel thickness from 1.8 mm to 2.5 mm enhances the ultimate load-carrying capacity by 46.15%, while enlarging the section height from 80 mm to 100 mm improves capacity by 26.67%. When the foamed concrete strength increased from 0.5 MPa to 1.0 MPa, the wall panel cracking load increased by 50%, while the ultimate load capacity changed by less than 5%. Increasing the concrete cover thickness from 25 mm to 35 mm enhanced the ultimate capacity by 7%, indicating that both parameters exert limited influence on the composite wall panel’s flexural capacity. Finite element simulations demonstrate excellent agreement with experimental results, confirming effective composite action between foamed concrete and CFS framing under service conditions. This validation establishes that the simplified analytical model neglecting interface slip provides better accuracy for engineering design, offering theoretical foundations and practical references for optimizing prefabricated building envelope systems.

1. Introduction

With increasing global commitment to environmental protection, the conventional construction industry has encountered developmental bottlenecks. Traditional construction approaches characterized by high energy consumption and low efficiency no longer satisfy modern sustainability requirements [1]. Amidst global industrial upgrading and population aging trends, the persistent labor shortage in construction sectors remains unresolved in the near term. Leading economies including the United States, European Union, and China have implemented new policy frameworks to drive green transition in construction, promoting low-carbon development, enhancing environmental sustainability, and advancing resource-efficient practices [2,3,4].
In this context, prefabricated building systems have achieved significant technological advancement in recent years. These systems demonstrate inherent advantages in industrialized production and standardized assembly, with their characteristic workflow of factory prefabrication, batch logistics, and site assembly being particularly compatible with steel structure applications. Prefabricated steel structures demonstrate distinctive features including lightweight construction, high strength-to-weight ratio, enhanced ductility, component standardization, manufacturing precision, minimized wet construction processes, accelerated project timelines, and improved material recyclability [5,6,7,8]. To further optimize these structural properties and develop advanced composite systems, CFS-based structural systems—particularly CFS framing composite walls—have become a key research focus in structural engineering with extensive academic validation [9,10].
CFS framing composite walls utilize load-bearing skeletons comprising CFS members, typically fabricated from cold-formed thin-walled steel with inherent advantages of lightweight design and efficient manufacturability, integrated with multi-material components: cladding panels, thermal insulation layers, foam concrete elements, and mechanical fasteners for reliable intercomponent connections [11,12]. Current CFS composite wall systems are primarily classified into three configurations: CFS framing with overlay panels, CFS framing with grout-filled cavities, and CFS framing with foam concrete composites; structural details are shown in Figure 1. Comprehensive investigations of these systems by international researchers have established robust theoretical foundations for system optimization.
Building upon existing literature, this study summarizes and compares the typical performance characteristics of CFS framing composite wall panels as detailed in Table 1. The CFS wall panel systems exhibit significantly lower weight per unit area than traditional reinforced concrete enclosure wall panels, demonstrating a reduced mass advantage. Additionally, notable distinctions exist among the three types of CFS wall panels regarding mass, thermal performance, and construction methods. As a novel prefabricated structural system, these three categories of CFS wall panels have been subjected to extensive investigations by researchers globally.
CFS framing composite wall systems with cladding panels typically consist of CFS framing members connected to cladding panels via self-drilling screws, with cavity insulation incorporated based on thermal performance requirements. M. Nithyadharan et al. [13] conducted monotonic and reversed cyclic shear tests to analyze the effects of cladding thickness, screw spacing, and panel arrangement on structural strength and stiffness, establishing critical mechanical benchmarks. Selvaraj and Madhavan [14,15,16] performed four-point bending tests on gypsum-sheathed CFS walls, demonstrating a 126% increase in ultimate load capacity due to composite skin effects, while identifying conservative estimations in the AISI S100 specification [17] regarding gypsum board contributions. Fatih Yilmaz et al. [18] systematically investigated flexural behavior of oriented strand board (OSB) or plywood-clad CFS walls through 15 experimental configurations, focusing on cladding material type (OSB/plywood), panel thickness (9–18 mm OSB), CFS framing spacing, screw spacing, and sheathing configuration. Experimental results indicated 33% flexural capacity improvement with OSB thickness doubling from 9 mm to 18 mm, while increasing CFS thickness from 1.2 mm to 2.0 mm enhanced load capacity by 86% and stiffness by 45%. Current research encompasses extensive experimental and numerical studies on parameters including loading conditions [19], cladding material properties [20,21,22,23,24,25,26,27], fastener behavior [26,28,29], wall panel dimensions [30,31,32], and CFS member characteristics [33,34].
CFS framing grout-filled composite walls represent an evolution of CFS framing cladding systems. During factory prefabrication or on-site construction, grouting materials are injected into wall cavities through pre-installed injection ports, enhancing interfacial bonding between cladding panels and CFS framing. Studies [35,36,37,38] have validated that foam concrete infill effectively mitigates bond slip at cladding–framework interfaces, with synergistic interaction between foam concrete and CFS framing significantly improving compressive strength, shear resistance, and lateral load capacity. This integrated system demonstrates enhanced structural integrity and superior seismic performance. Feng Yu [39] investigated the flexural capacity of various grout-filled CFS walls through experimental and numerical analyses, revealing that increased foam concrete density enhances moment resistance while delaying strain localization, with wall panel span-to-depth ratio critically influencing deformation magnitude.
The foam concrete CFS framing wall panels are manufactured through a process where the steel framing is fully encapsulated by lightweight concrete in the factory. Following curing completion, the prefabricated panels are transported to construction sites for assembly. Studies [40,41,42] conducting bending performance tests on CFS-foam concrete floor systems revealed adequate load capacity and deformation capability, though premature cracking occurs due to insufficient system stiffness. Substituting conventional concrete with foam concrete reduces structural self-weight while improving constructability. Fang Liu et al. [43] developed a layered CFS-Expanded Polystyrene (EPS) foam concrete composite wall system for cold climate applications, where optimized EPS foam concrete mix design achieved reduced thermal expansion coefficients and enhanced thermal insulation performance. Alignment with Chinese standard GB/T700-2006 [44] enabled derivation of flexural capacity equations showing a strong correlation with experimental and FE analysis results. Xibing Hu et al. [45] investigated full-scale CFS-foam concrete walls (3000 mm × 2500 mm) through ABAQUS-based FE modeling, demonstrating satisfactory global stiffness and elastoplastic deformation capacity. By analyzing parameters, optimizing web height, thickness, and steel grade of CFS members, and adjusting wall thickness, modifying CFS spacing configurations can enhance the flexural bearing capacity of the wall.
Based on a 2 × 1000 MW thermal power project in Shandong Province, China, the plant front area comprises six functional buildings: an office building, on-duty dormitory, recreation center, staff cafeteria, and guest residence building. Taking the guest residence as an example, this three-story structure stands 13.45 m tall with a floor area of 4597.02 m2. All three floors feature identical layouts, housing 96 dormitory rooms collectively. According to Shandong’s prefabricated building scoring standards, the plant front area structures must achieve a 50% assembly rate, with enclosure walls and internal partition walls constituting one of the primary prefabricated components. The project urgently requires a novel wall panel system that prioritizes high assembly performance over demanding flexural capacity requirements.
Both CFS framing with cladding panels and grout-filled CFS wall systems inevitably create continuous thermal bridges due to their reliance on screw connections between panels and framing members [46]. The thermal conductivity mismatch between these fasteners and either cavity insulation or grout materials significantly compromises the overall thermal performance. Furthermore, grout-filled CFS walls frequently employ “semi-wet/semi-dry” construction methods in practice, which reduces assembly rates and fails to meet this project’s requirements. In contrast, the lightweight concrete-encapsulated CFS system effectively eliminates thermal bridges and avoids on-site wet work processes. To address this project’s specific needs—including moderate flexural capacity requirements and compact panel dimensions—we propose a novel low-strength foamed concrete CFS composite insulated wall panel that fully satisfies the prescribed assembly rate criteria. As a prefabricated enclosure wall panel, the system is installed by directly clamping its upper and lower sections into pre-embedded structural connectors. Its wind resistance capacity constitutes a critical indicator for evaluating safety performance. This research conducted wall panel modeling and wind load applicability analysis using the ABAQUS finite element simulation to assess flexural performance. A set of four-point flexural performance tests on five specimens was designed to investigate wind resistance behavior, analyzing failure modes through primary comparative parameters (foam concrete strength, CFS framing wall thickness, section height, and concrete cover thickness). The influence of different parameters on flexural behavior and ultimate load capacity was evaluated by analyzing load-displacement curves alongside critical stage loads and displacements.

2. Composite Wall Panel Design

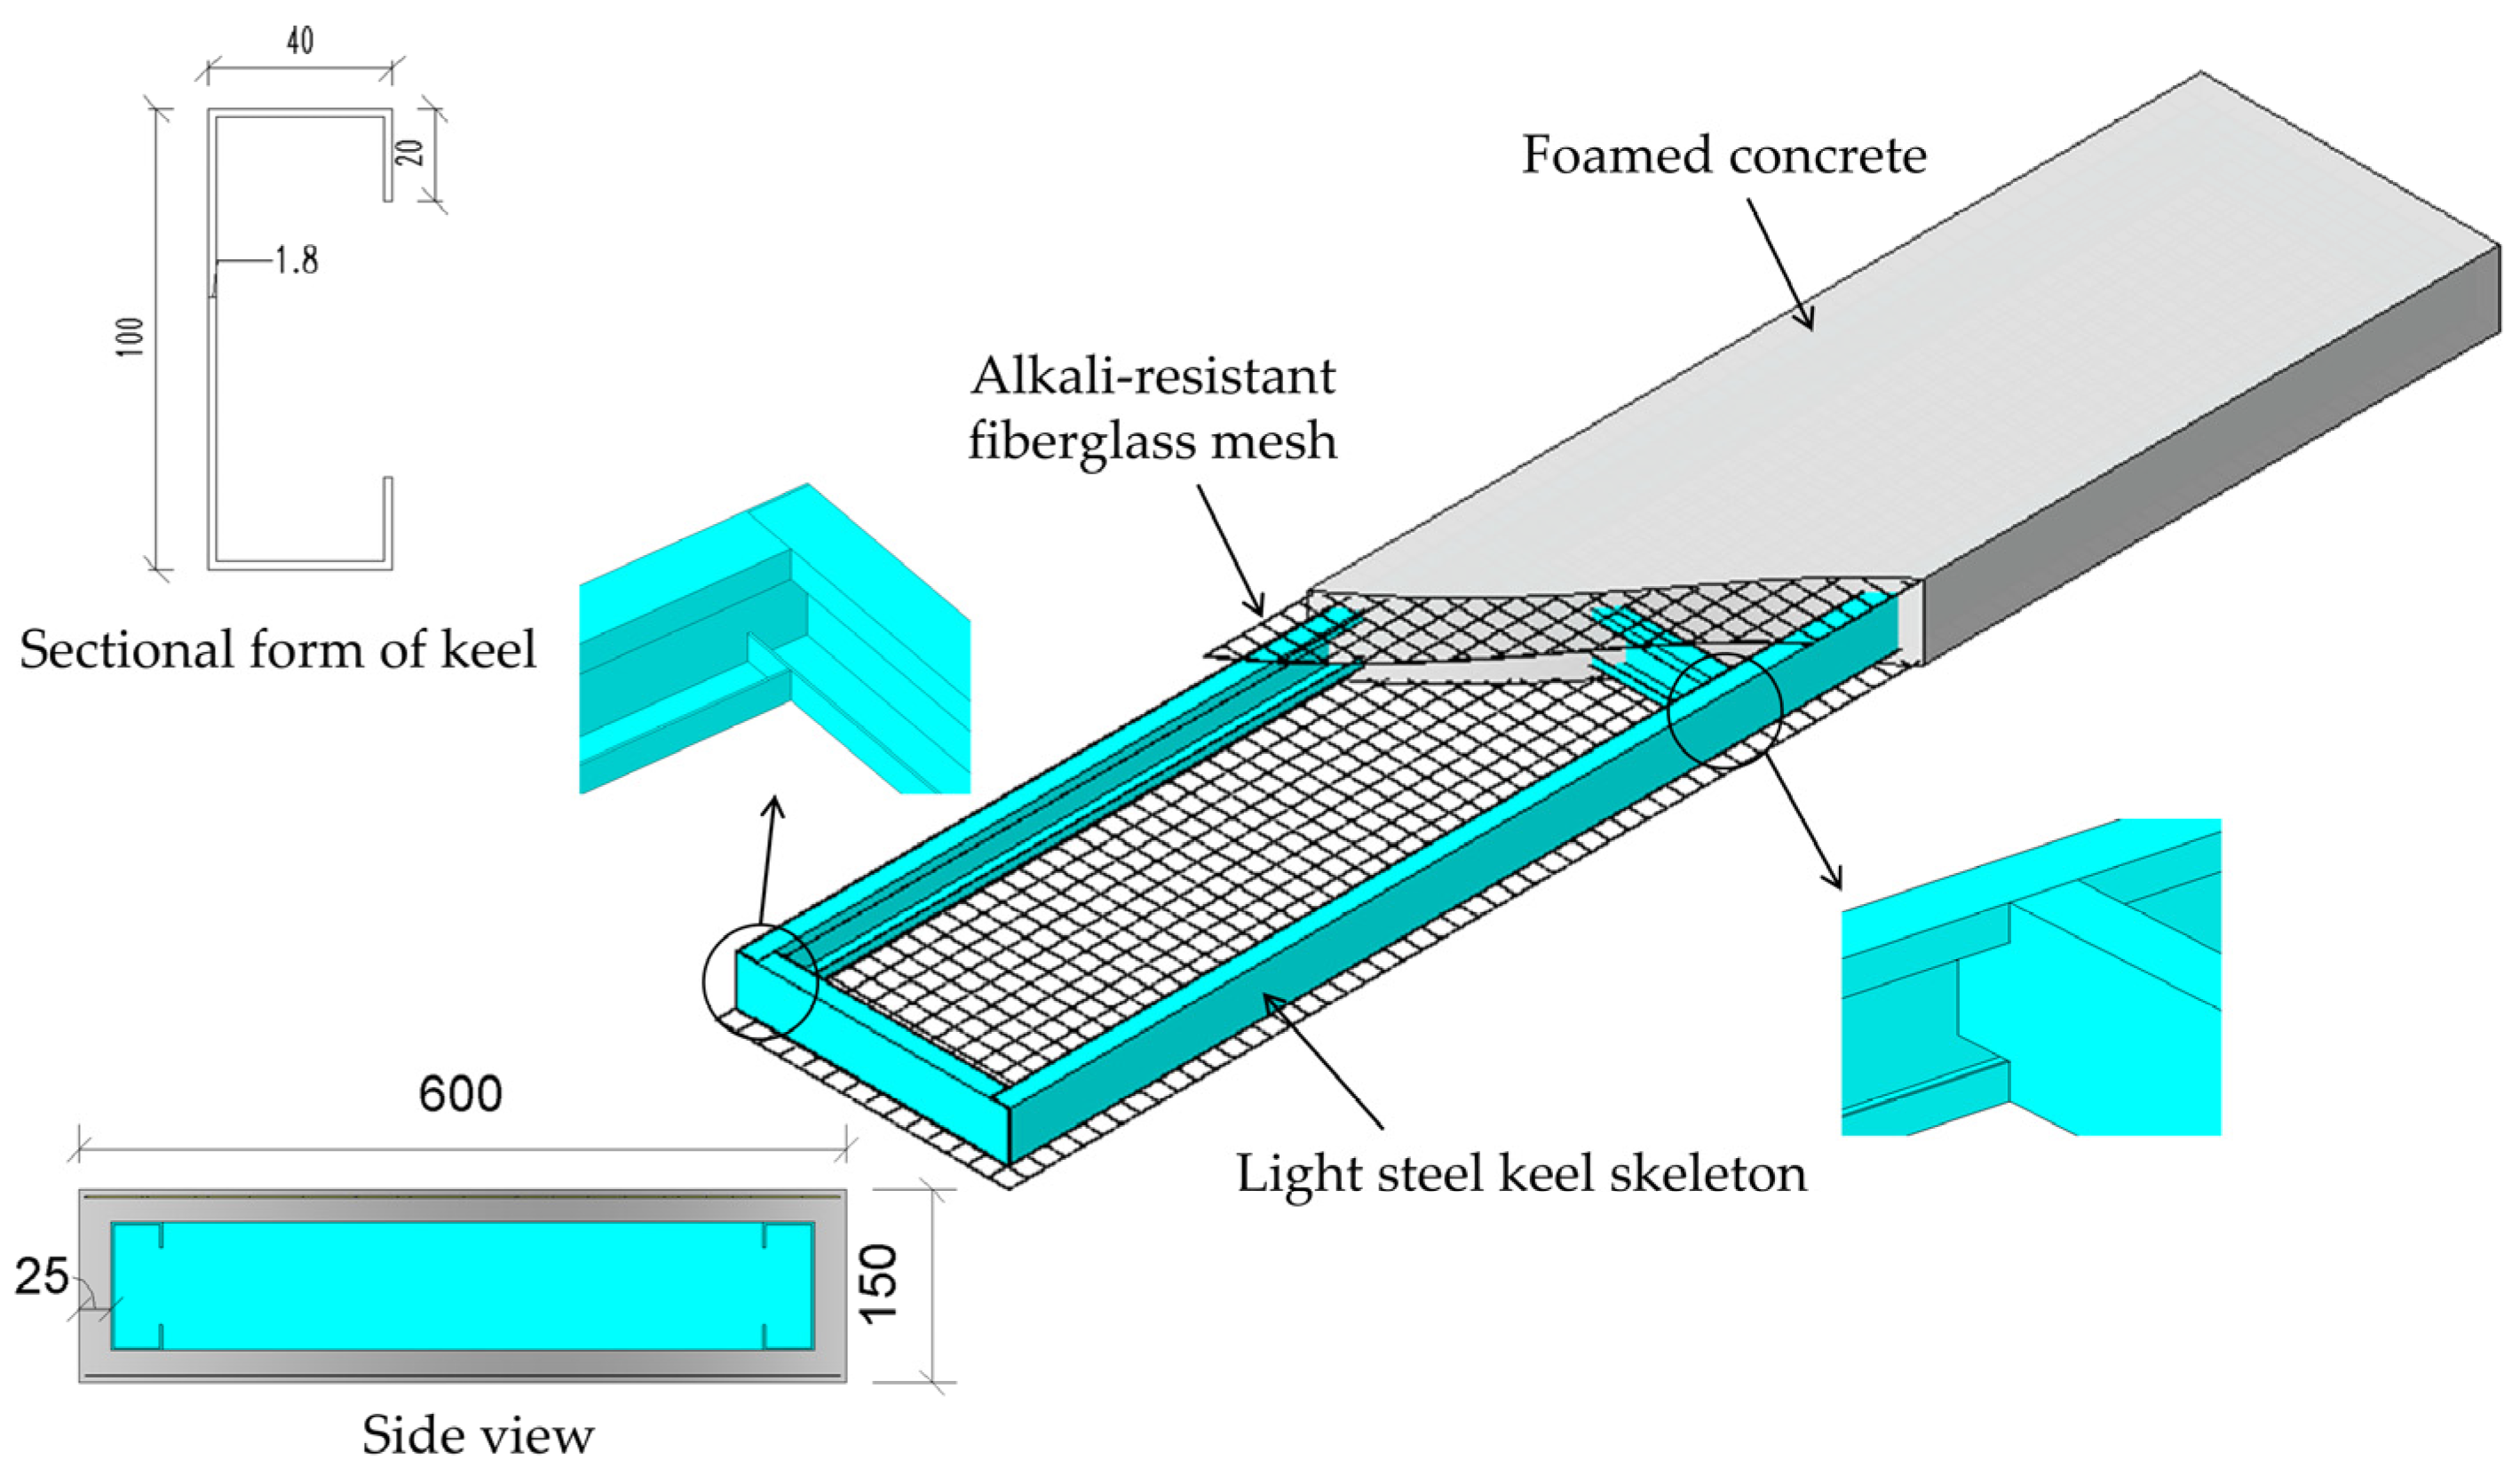
Low-strength foam concrete CFS composite wall panels (LFSW) utilize CFS as a skeleton embedded within low-strength foam concrete. This design maximizes the bending resistance of CFS, while the concrete wrap enhances the composite wall panel’s integrity. The use of low-strength foam concrete effectively reduces the wall panel’s weight, achieving lightweight construction and lowering assembly difficulty. Additionally, the integrated CFS skeleton mitigates the wall panel’s thermal bridge effect, improving the composite wall panel’s insulation performance. By installing a layer of alkali-resistant glass fiber mesh on both sides of the wall panel as a structural design measure for the wall panel, this mesh increases the tensile strength of the tensile zone and prevents stress concentration, dispersing potential large cracks into smaller ones and enhancing the crack resistance of low-strength foam concrete.
The CFS design employs Q195 grade C-shaped cold-formed thin-walled steel (C100 × 40 × 20 × 1.8 mm). The CFS skeleton comprises two end ribs, reinforcing ribs, and main ribs. Main ribs are arranged in a flange-to-flange manner with a 550 mm spacing. End ribs and reinforcing ribs are connected to the main ribs via limb cutting and welding. The foam concrete strength is approximately 1 MPa, the protective layer thickness is 25 mm, and the composite wall panel’s overall dimensions are 3000 mm × 600 mm × 150 mm; the wall panel has a designed self-weight of 211 kg with a system weight per unit area of 117 kg/m2, as shown in Figure 2.

3. Finite Element Simulation Analysis

3.1. Analysis Assumptions

On the premise of ensuring simulation accuracy, in order to simplify the analysis and improve calculation speed, the model is simplified during finite element analysis:
(1)
Literature review reveals two distinct scenarios regarding the concrete–steel interface: consideration of interface slip versus neglect of interface slip. Based on flexural tests of CFS-foamed concrete specimens [42,43,45], the CFS framing serves as the primary load-bearing component. Negligible interfacial slip occurs between the CFS framing and foamed concrete, with minimal impact on the global structural behavior.
(2)
Due to the minimal impact of alkali-resistant fiberglass mesh on the model’s flexural performance (owing to its low strength), this component is omitted from the model.
(3)
Given that the bending radius of CFS framing is very small, its influence on flexural performance is deemed negligible and thus excluded from the analysis.

3.2. Wall Panel Model Establishment

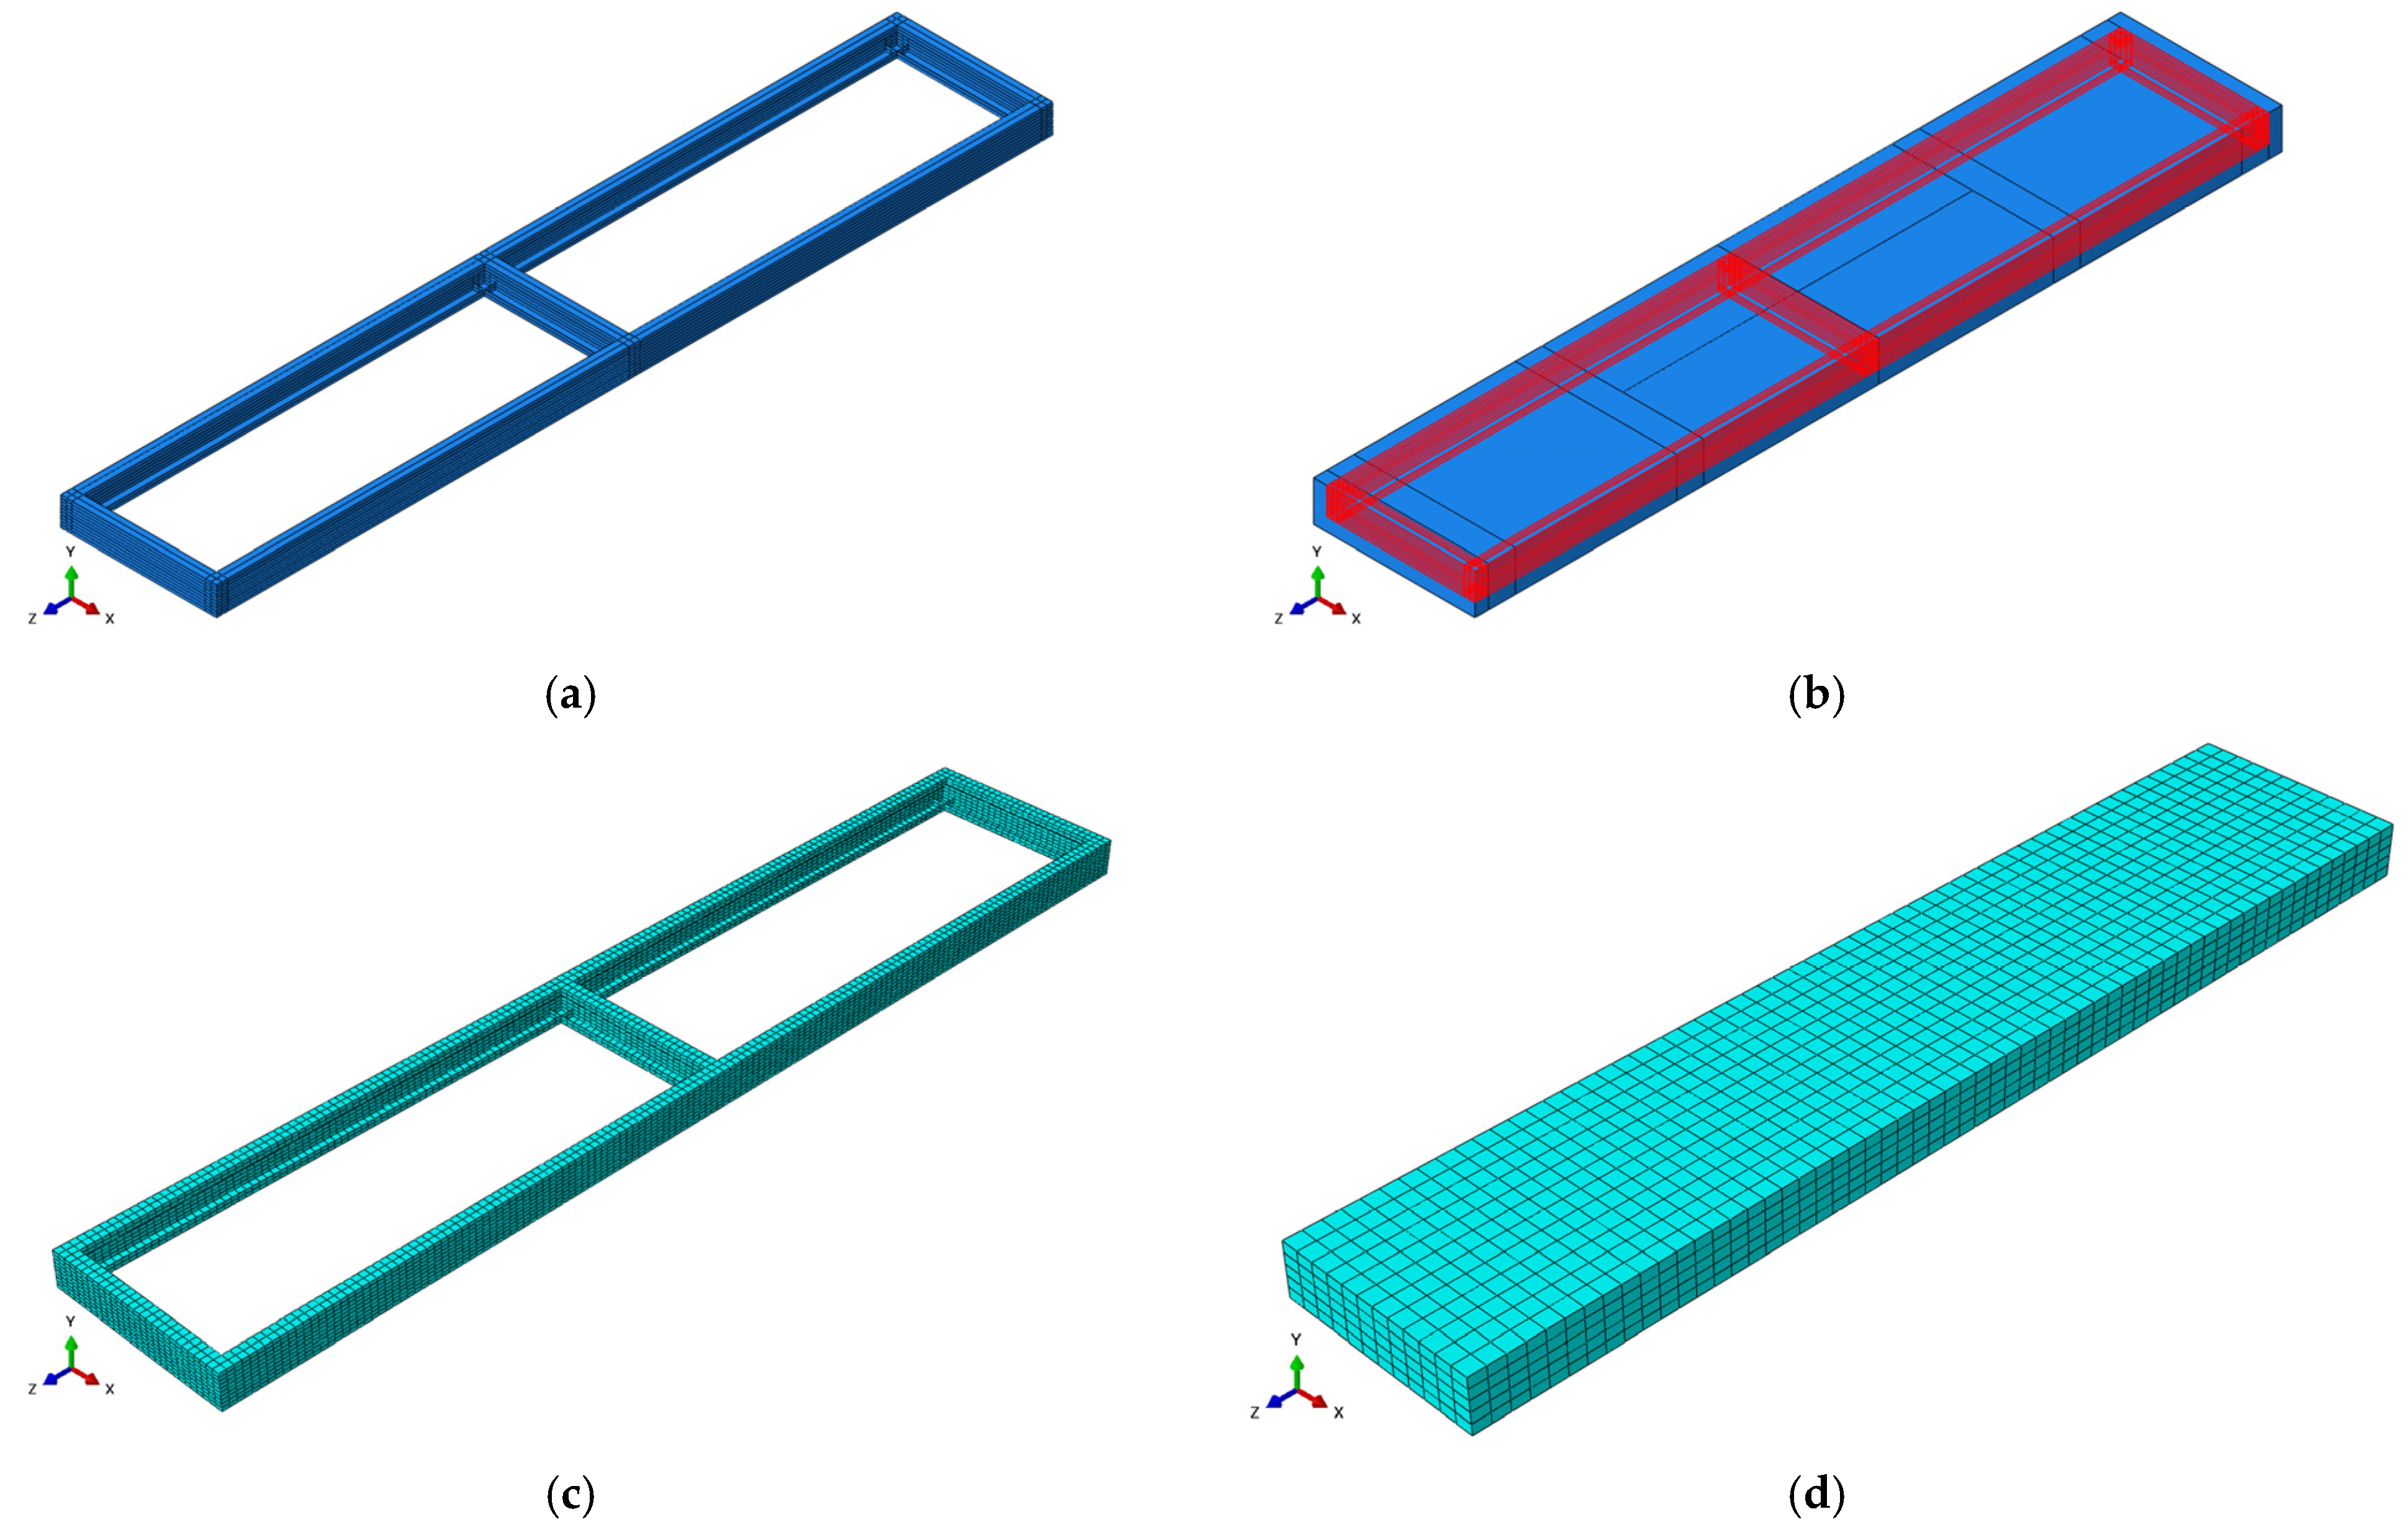
ABAQUS software is used for finite element analysis, with foam concrete and rigid gaskets simulated using solid element C3D8R. The C3D8R element type effectively accounts for material non-linearity and is particularly suitable for analyzing cracking and bending behavior. CFS framing components were simulated using S4R shell elements, with the main rib, end rib, and reinforcing rib of the CFS framing combined through the Merge command. The CFS framing and foam concrete wall panel were connected via an Embedded Region constraint to prevent bond slip between materials, as illustrated in Figure 3a,b.
Referring to reference [43,45], a structured method was used to partition the grid, and the length of the CFS framework grid elements was determined to be 20 mm through trial calculations. The foam concrete model incorporated 600 mm × 100 mm × 10 mm cushion blocks at both loading and support locations, meshed with 50 mm elements (Figure 3c,d).
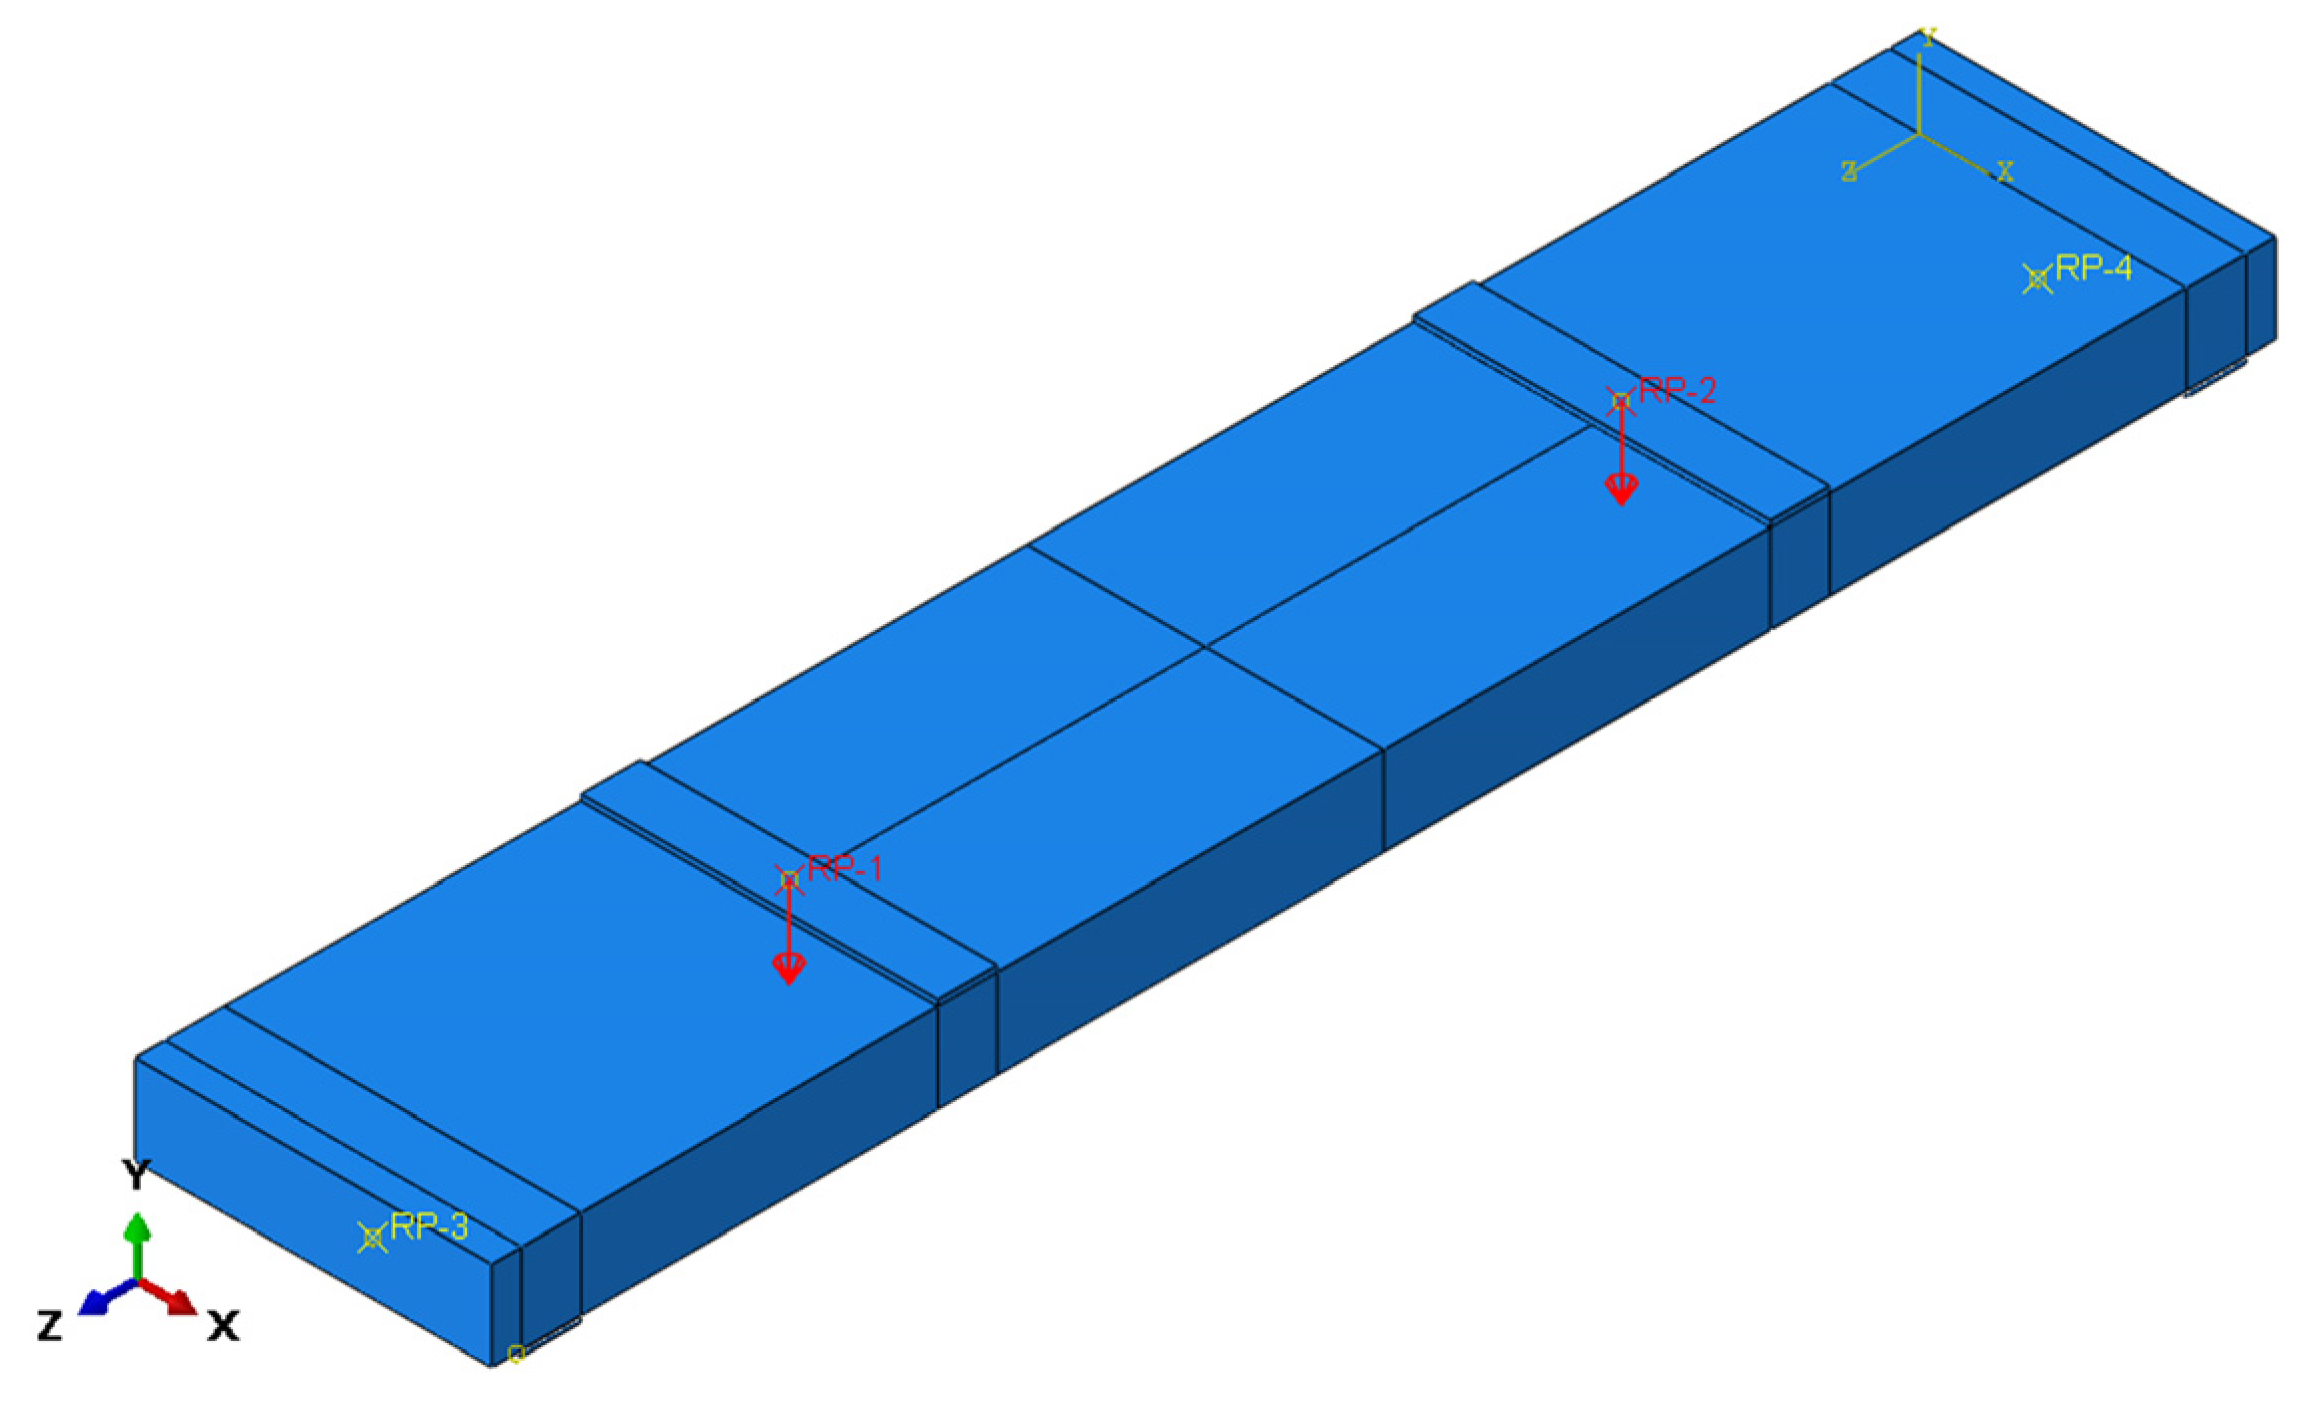
To prevent stress concentration in concrete at loading and support locations during testing, four high-stiffness steel pads were installed. These pads were connected to the foamed concrete model using Tie constraints. Four reference points were established for load application and constraint implementation, coupled to corresponding rigid pad surfaces via kinematic coupling.
Displacement-controlled loading was applied at reference points. Reference points RP-1 and RP-2 at loading locations were subjected to 60 mm displacement in the negative Y-direction. Reference points RP-3 and RP-4 at support locations were configured as follows: RP-3 simulated a fixed hinge support (U1 = U2 = U3 = 0), while RP-4 represented a sliding hinge support (U1 = U2 = 0). The configuration after constraint application is shown in Figure 4.

3.3. Calculation of Parameter Settings

The foam concrete material is modeled using the Concrete Damaged Plasticity (CDP) constitutive model in ABAQUS, which captures tensile cracking and compressive crushing under monotonic and cyclic loading conditions. This model defines material yielding and failure through equivalent plastic strains in tension and compression, while incorporating stiffness degradation caused by crack propagation.
Implementation of the CDP model requires specifying the concrete’s plastic properties, including a dilation angle of 30°, eccentricity of 0.1, a ratio of bi-directional to uniaxial compressive strength of 1.16, a constant stress ratio K = 0.667, and a viscosity coefficient of 0.005.
Foamed concrete is a lightweight concrete produced by mixing mechanically generated foam with cementitious paste, containing abundant closed micropores internally. Both material composition and internal microstructure of foamed concrete differ significantly from conventional concrete, resulting in substantial variations in their fundamental mechanical properties. Considering the low-strength foamed concrete in this wall panel design primarily provides lateral support and thermal insulation for the CFS framing skeleton; the tensile strength of foamed concrete is generally taken as 1/15 to 1/10 of its uniaxial compressive strength. Therefore, the tensile strength in this study is set at 1/10 of the compressive strength. Literature [47] adopts three-segment curve fitting for the uniaxial compressive constitutive relationship: the ascending branch employs a cubic polynomial, while two descending branches utilize rational expressions. The mathematical expression is as follows:
y = 1.787 x 0.574 x 2 0.213 x 3 14.566 9.044 x 4.522 / x 2 ( 1 1.2 x ) / ( 1.5 1.7 x ) 0 x 1 1 x 1.05 1.05 x 4
where x is the ratio of strain to peak strain, and y is the ratio of stress to yield strength.
The ideal elastic–plastic model is selected for the CFS framing skeleton. This model retains the main mechanical properties of steel while simplifying calculations for convergence. The mathematical expression for its stress–strain curve is as follows:
σ = E s ε f y ( ε ε y ) ( ε y > ε )
where σ is steel stress, ε is the strain of steel, E S is Young’s modulus of steel, f y is the yield strength of steel, and ε y is the strain value corresponding to the yield strength of steel.
The basic material parameters used in the simulation are shown in Table 2.

3.4. Analysis of Finite Element Simulation Results

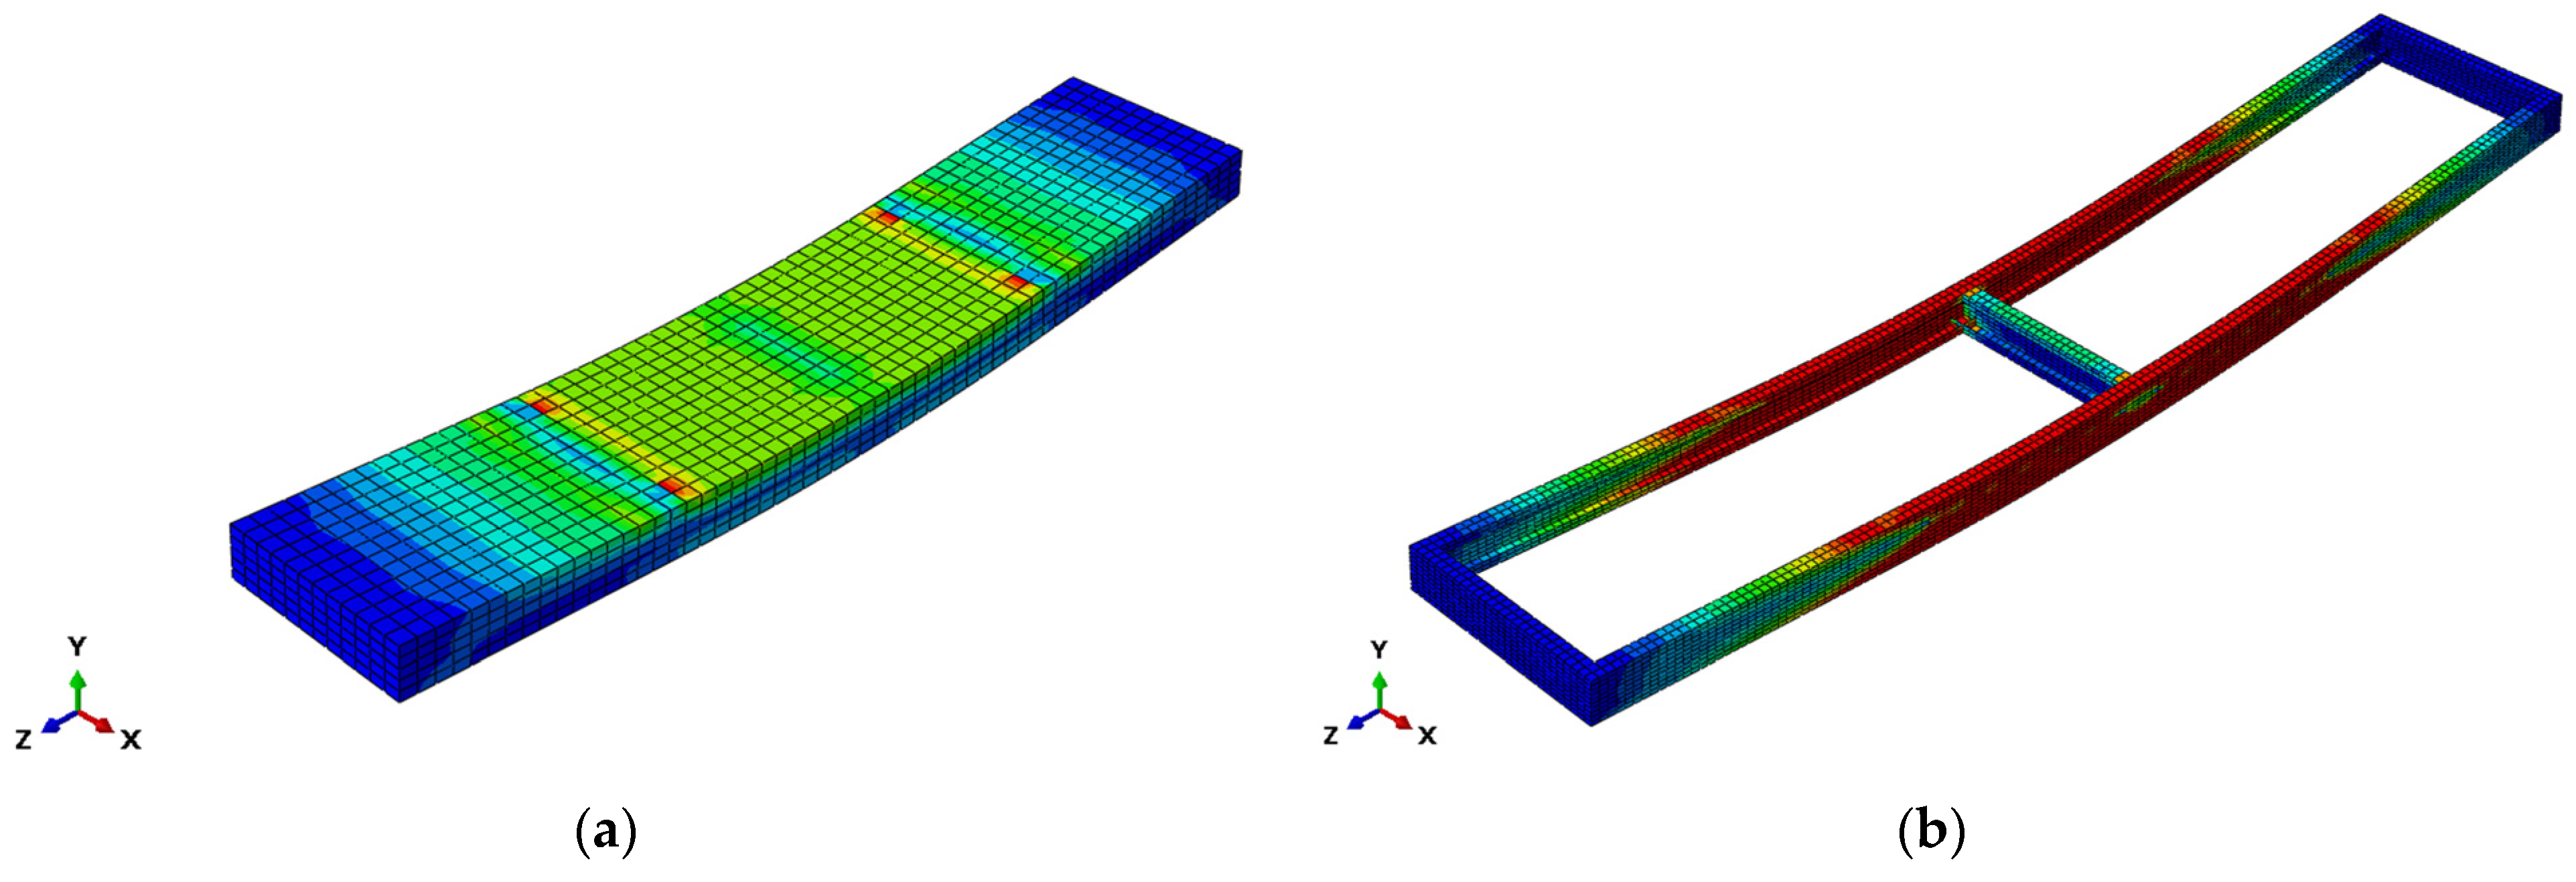
Figure 5 presents the von Mises stress distribution in both foam concrete and CFS framing components, revealing significantly higher stress concentrations in CFS members compared to foam concrete, particularly at mid-span locations of primary ribs. This stress pattern confirms effective utilization of CFS bending capacity in the wall design, with primary ribs governing flexural performance. Foam concrete encapsulation effectively restrains CFS buckling deformations, while coordinated deformation patterns under ultimate loading conditions demonstrate robust composite interaction. This synergy maintains the mechanical integrity of CFS framing while enhancing lateral restraint and thermal insulation through foam concrete integration, establishing practical significance for engineering applications.
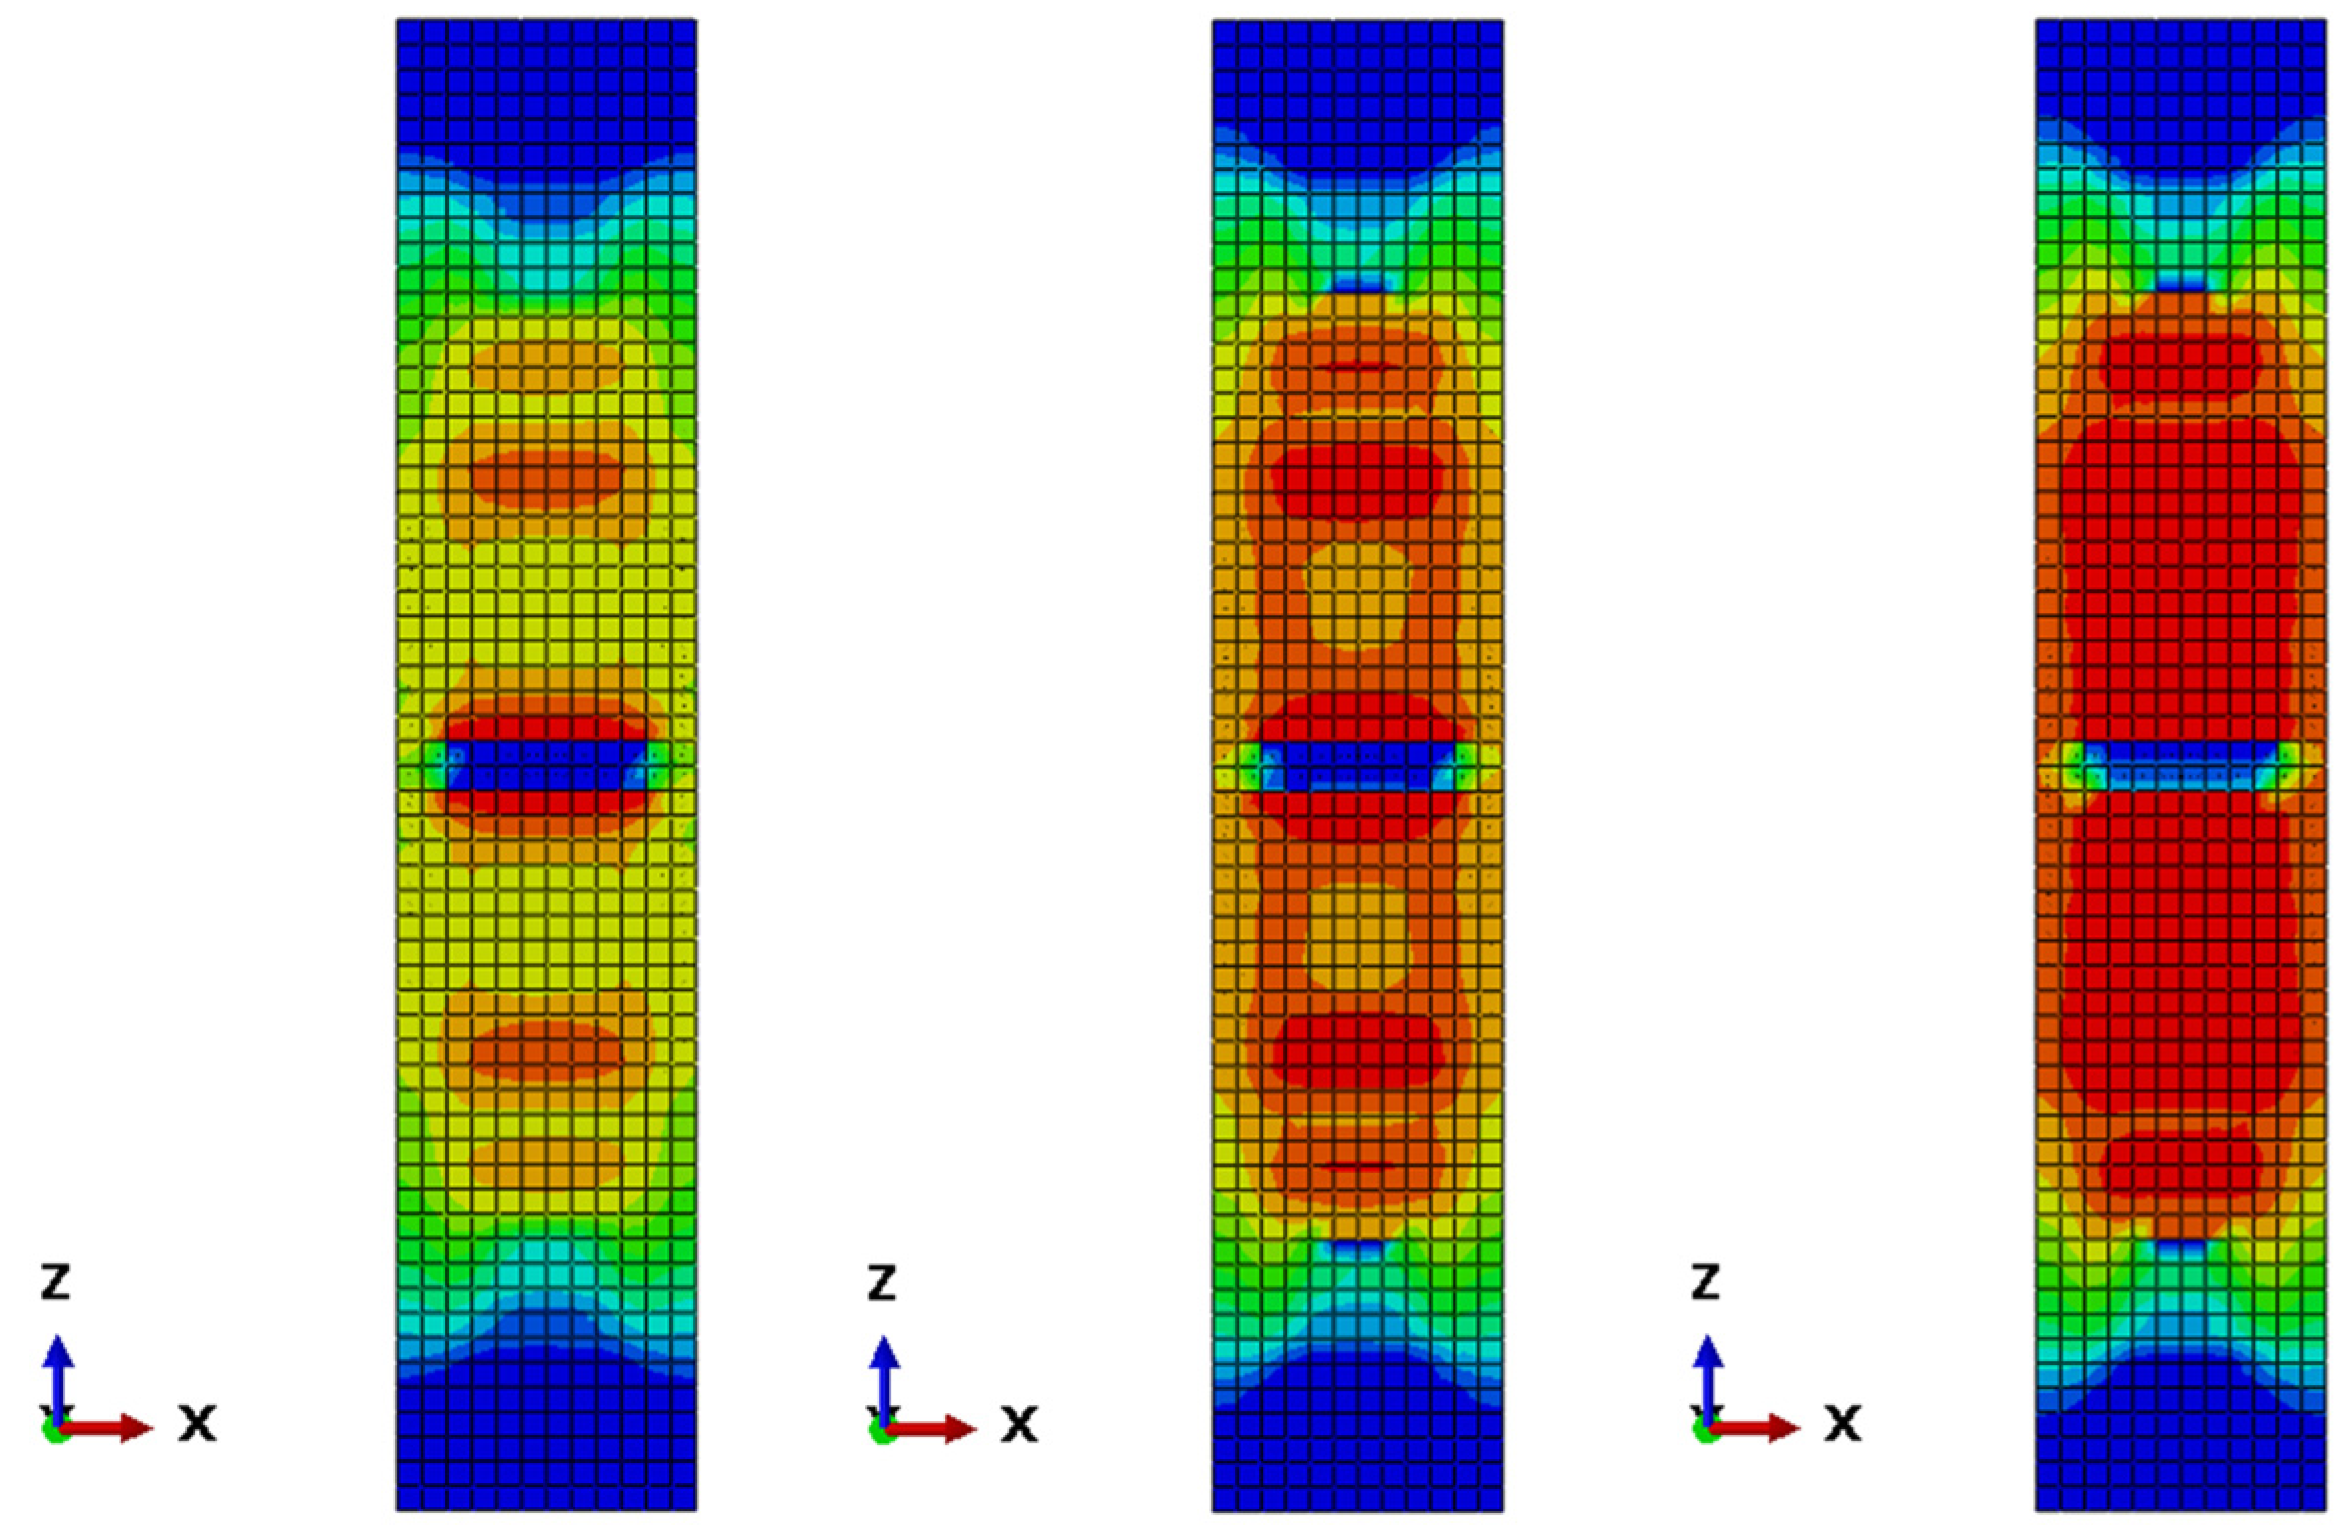
Figure 6 demonstrates three characteristic stages of tensile damage evolution in the wall panel, while Figure 7 presents corresponding damage contours for both tensile and compressive failure modes. The tensile damage pattern reveals primary cracking initiating at the slab bottom, with crack propagation originating from mid-span loading points (Figure 6). Progressive loading induces transverse crack development, extending laterally along the slab bottom and progressing vertically to approximately two-thirds of the sidewall height (Figure 7a). Compressive damage analysis in Figure 7b indicates stress concentration at the panel top mid-span region, confirming concrete crushing under incremental loading conditions.
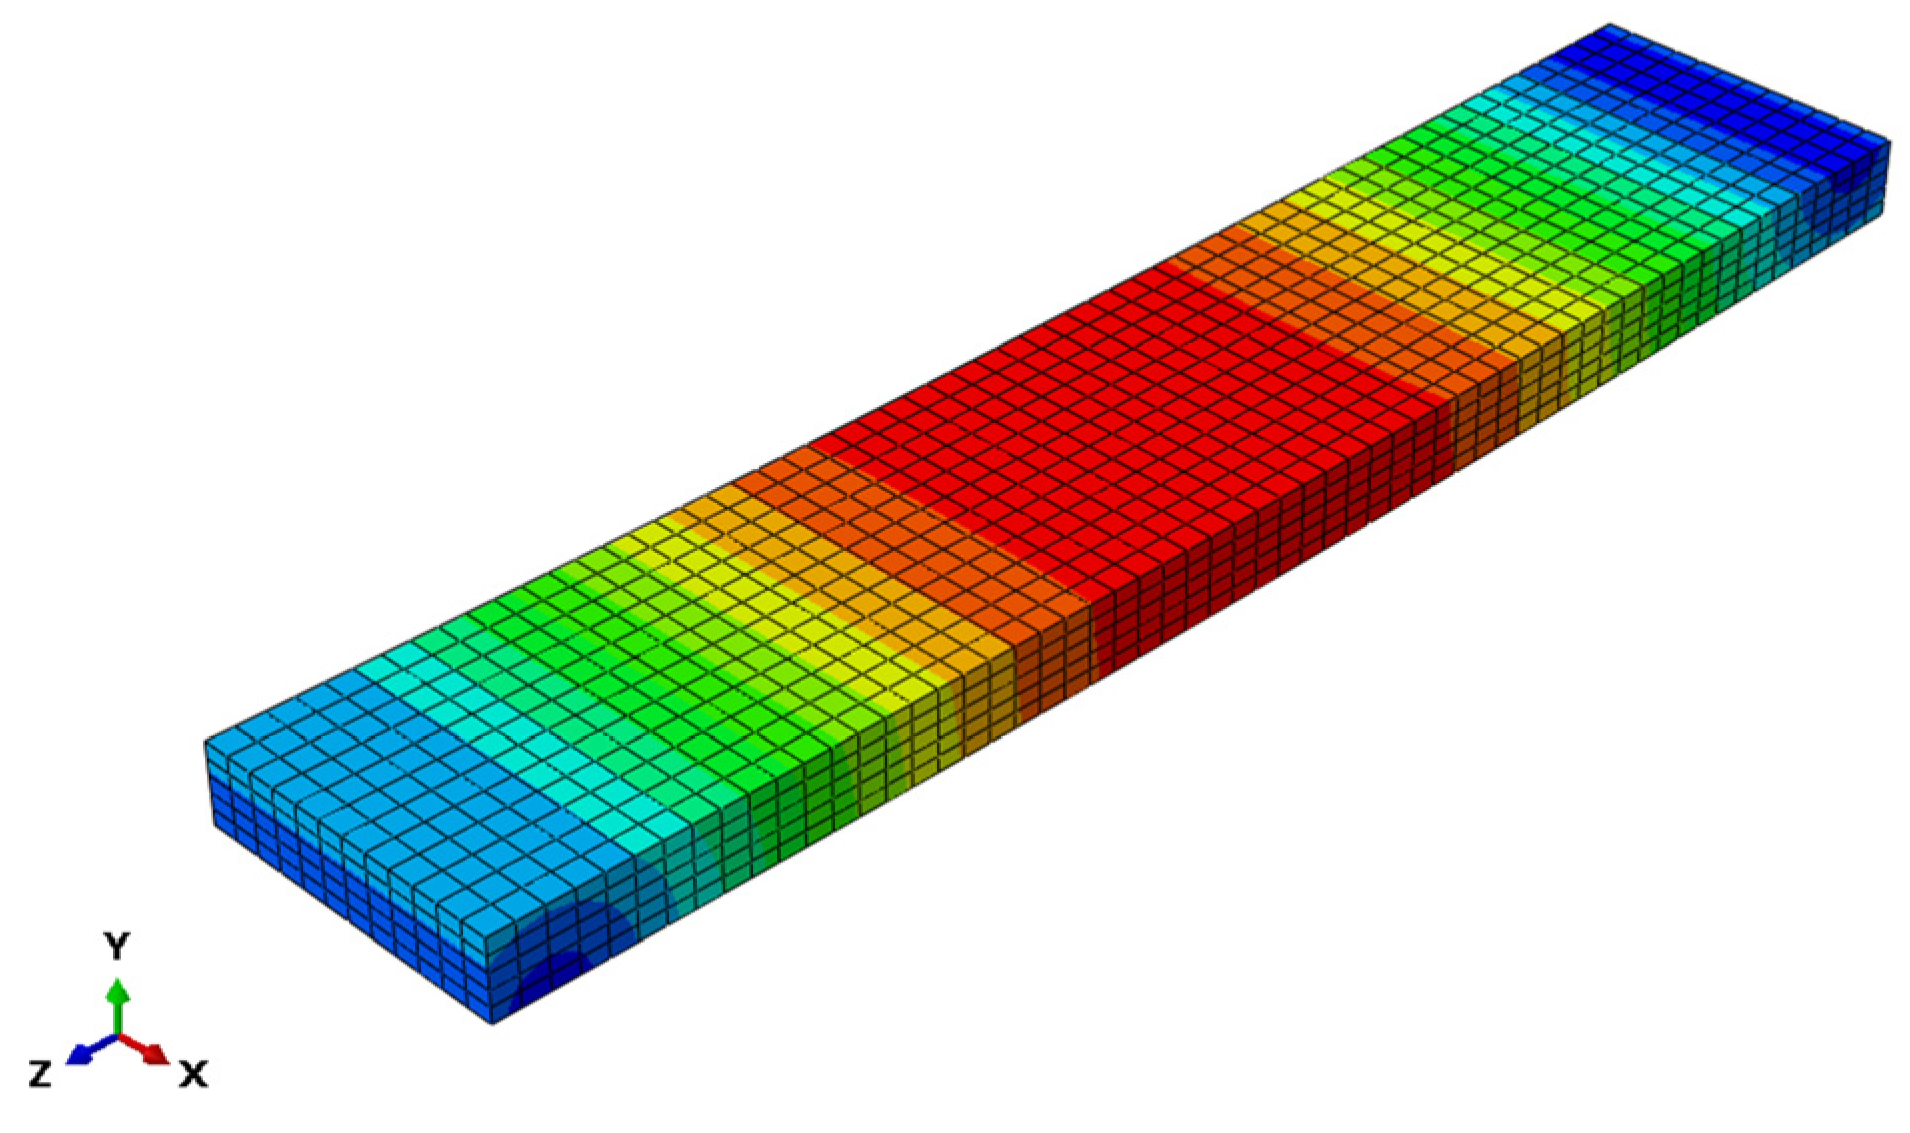
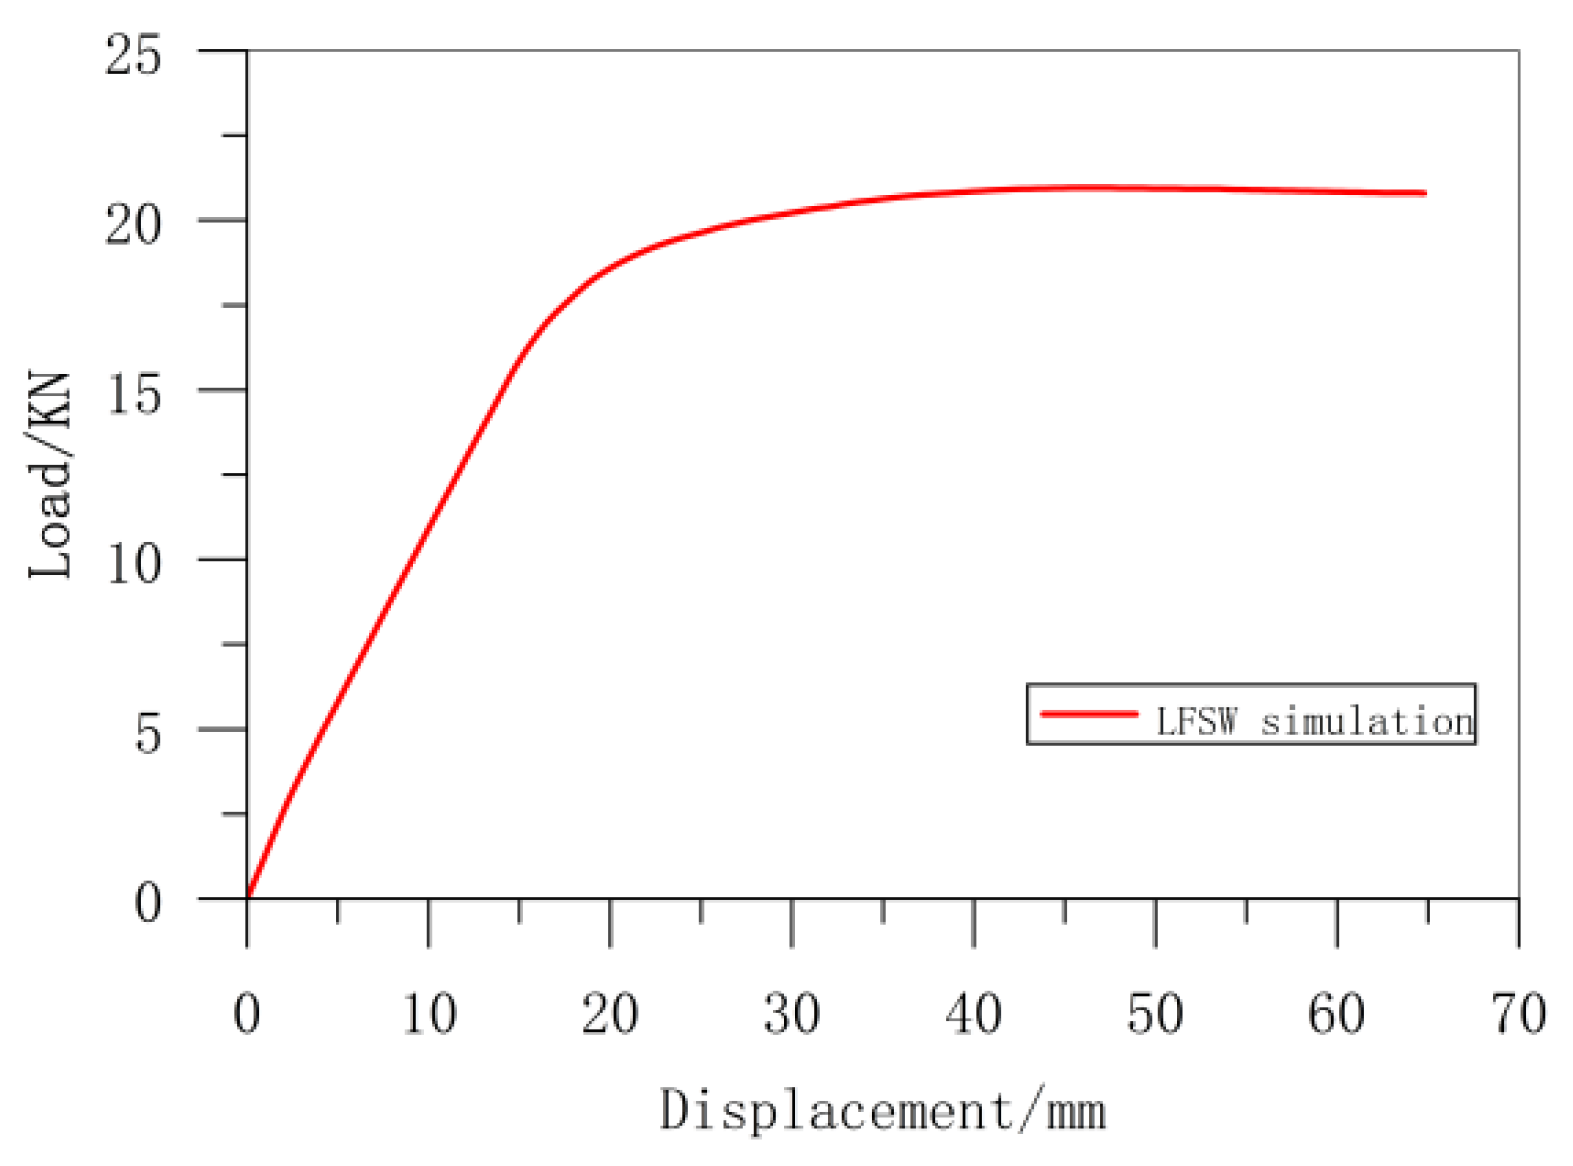
Figure 8 presents the deformation cloud map of the wall panel, while Figure 9 depicts the mid-span load-displacement curve. As shown in Figure 8, under uniform loading, the maximum deflection of the wall panel occurs at mid-span, with the deflection cloud map showing a uniform distribution. The deflection values decrease symmetrically along the panel’s length from the mid-span maximum. During loading, the top and bottom of the wall panel deform synergistically due to the bending resistance of the CFS framing, and the composite wall panel’s bending aligns with the deformation patterns under uniform loads. According to the mid-span load-displacement curve in Figure 9, the wall panel’s behavior exhibits distinct stages. Initially, the curve is in the elastic stage, with cracks initiating at 5.76 kN. However, the curve lacks a clear inflection point, indicating that the CFS framing provides high stiffness at this stage. As the load increases, the curve shows a distinct inflection point, likely due to framing yielding. The simulated peak load reaches 20.84 kN, demonstrating the wall panel’s favorable flexural performance.

4. Applicability Analysis of Wall Panels

By conducting finite element simulations on LFSW and analyzing the simulation results, it was found that the designed wall panel has good bending resistance performance. According to the Load Code for the Design of Building Structures (GB50009-2012) [48], the wind load on the building enclosure wall panel is calculated and compared with the LFSW simulation results to examine the applicability of the wall panel in various regions. In standard [48], the formula for calculating wind load is as follows:
ω k = β g z μ s l μ z ω 0
where ω k is the standard value of wind load, unit KN/m2; β g z is the gust coefficient at height z, determined based on the height of the building from the ground and the type of ground roughness; μ s l is the local shape coefficient of wind load; μ z is the coefficient of variation of wind pressure height, determined according to the category of ground roughness. The standard divides ground roughness into four categories: A, B, C, and D. ω 0 is the basic wind pressure, measured in KN/m2.
Considering the primary application of this wall panel in Shandong Province, China, three representative locations were selected for basic wind pressure values: Jinan City (0.45 kN/m2), Qingdao City (0.60 kN/m2), and Chengshantou, Rongcheng City (0.70 kN/m2). For a closed rectangular building with Class B terrain roughness, the windward coefficient was taken as 1.0 and the leeward coefficient as −0.6. The local wind load shape coefficient was determined to be 1.6 under the most critical loading condition. The adopted height variation coefficients and corresponding wind load calculation results are presented in Table 3.
To enable direct comparison of wind resistance performance for LFSW panels at identical heights under equivalent conditions, the cracking load capacity of LFSW was standardized to 3.20 kN/m2. Analysis of the calculated results indicates that the maximum applicable height for LFSW panels reaches ≥100 m in Jinan, ≥100 m in Qingdao, and 80 m in Chengshantou, Rongcheng City. The designed wall panel demonstrates superior wind load resistance capability, exhibits adequate safety margins, and possesses significant research value.

5. Research on the Bending Resistance Test of Wall Panels

5.1. Test Wall Panel Specimen Parameters

Based on practical engineering requirements, five wall panel specimens were designed for experimental investigation, all following the configuration illustrated in Figure 2. The key design parameters are summarized in Table 4. For comparative purposes, specimen LFSW-1 maintains identical specifications to those used in the finite element simulation model.

5.2. Specimen Fabrication

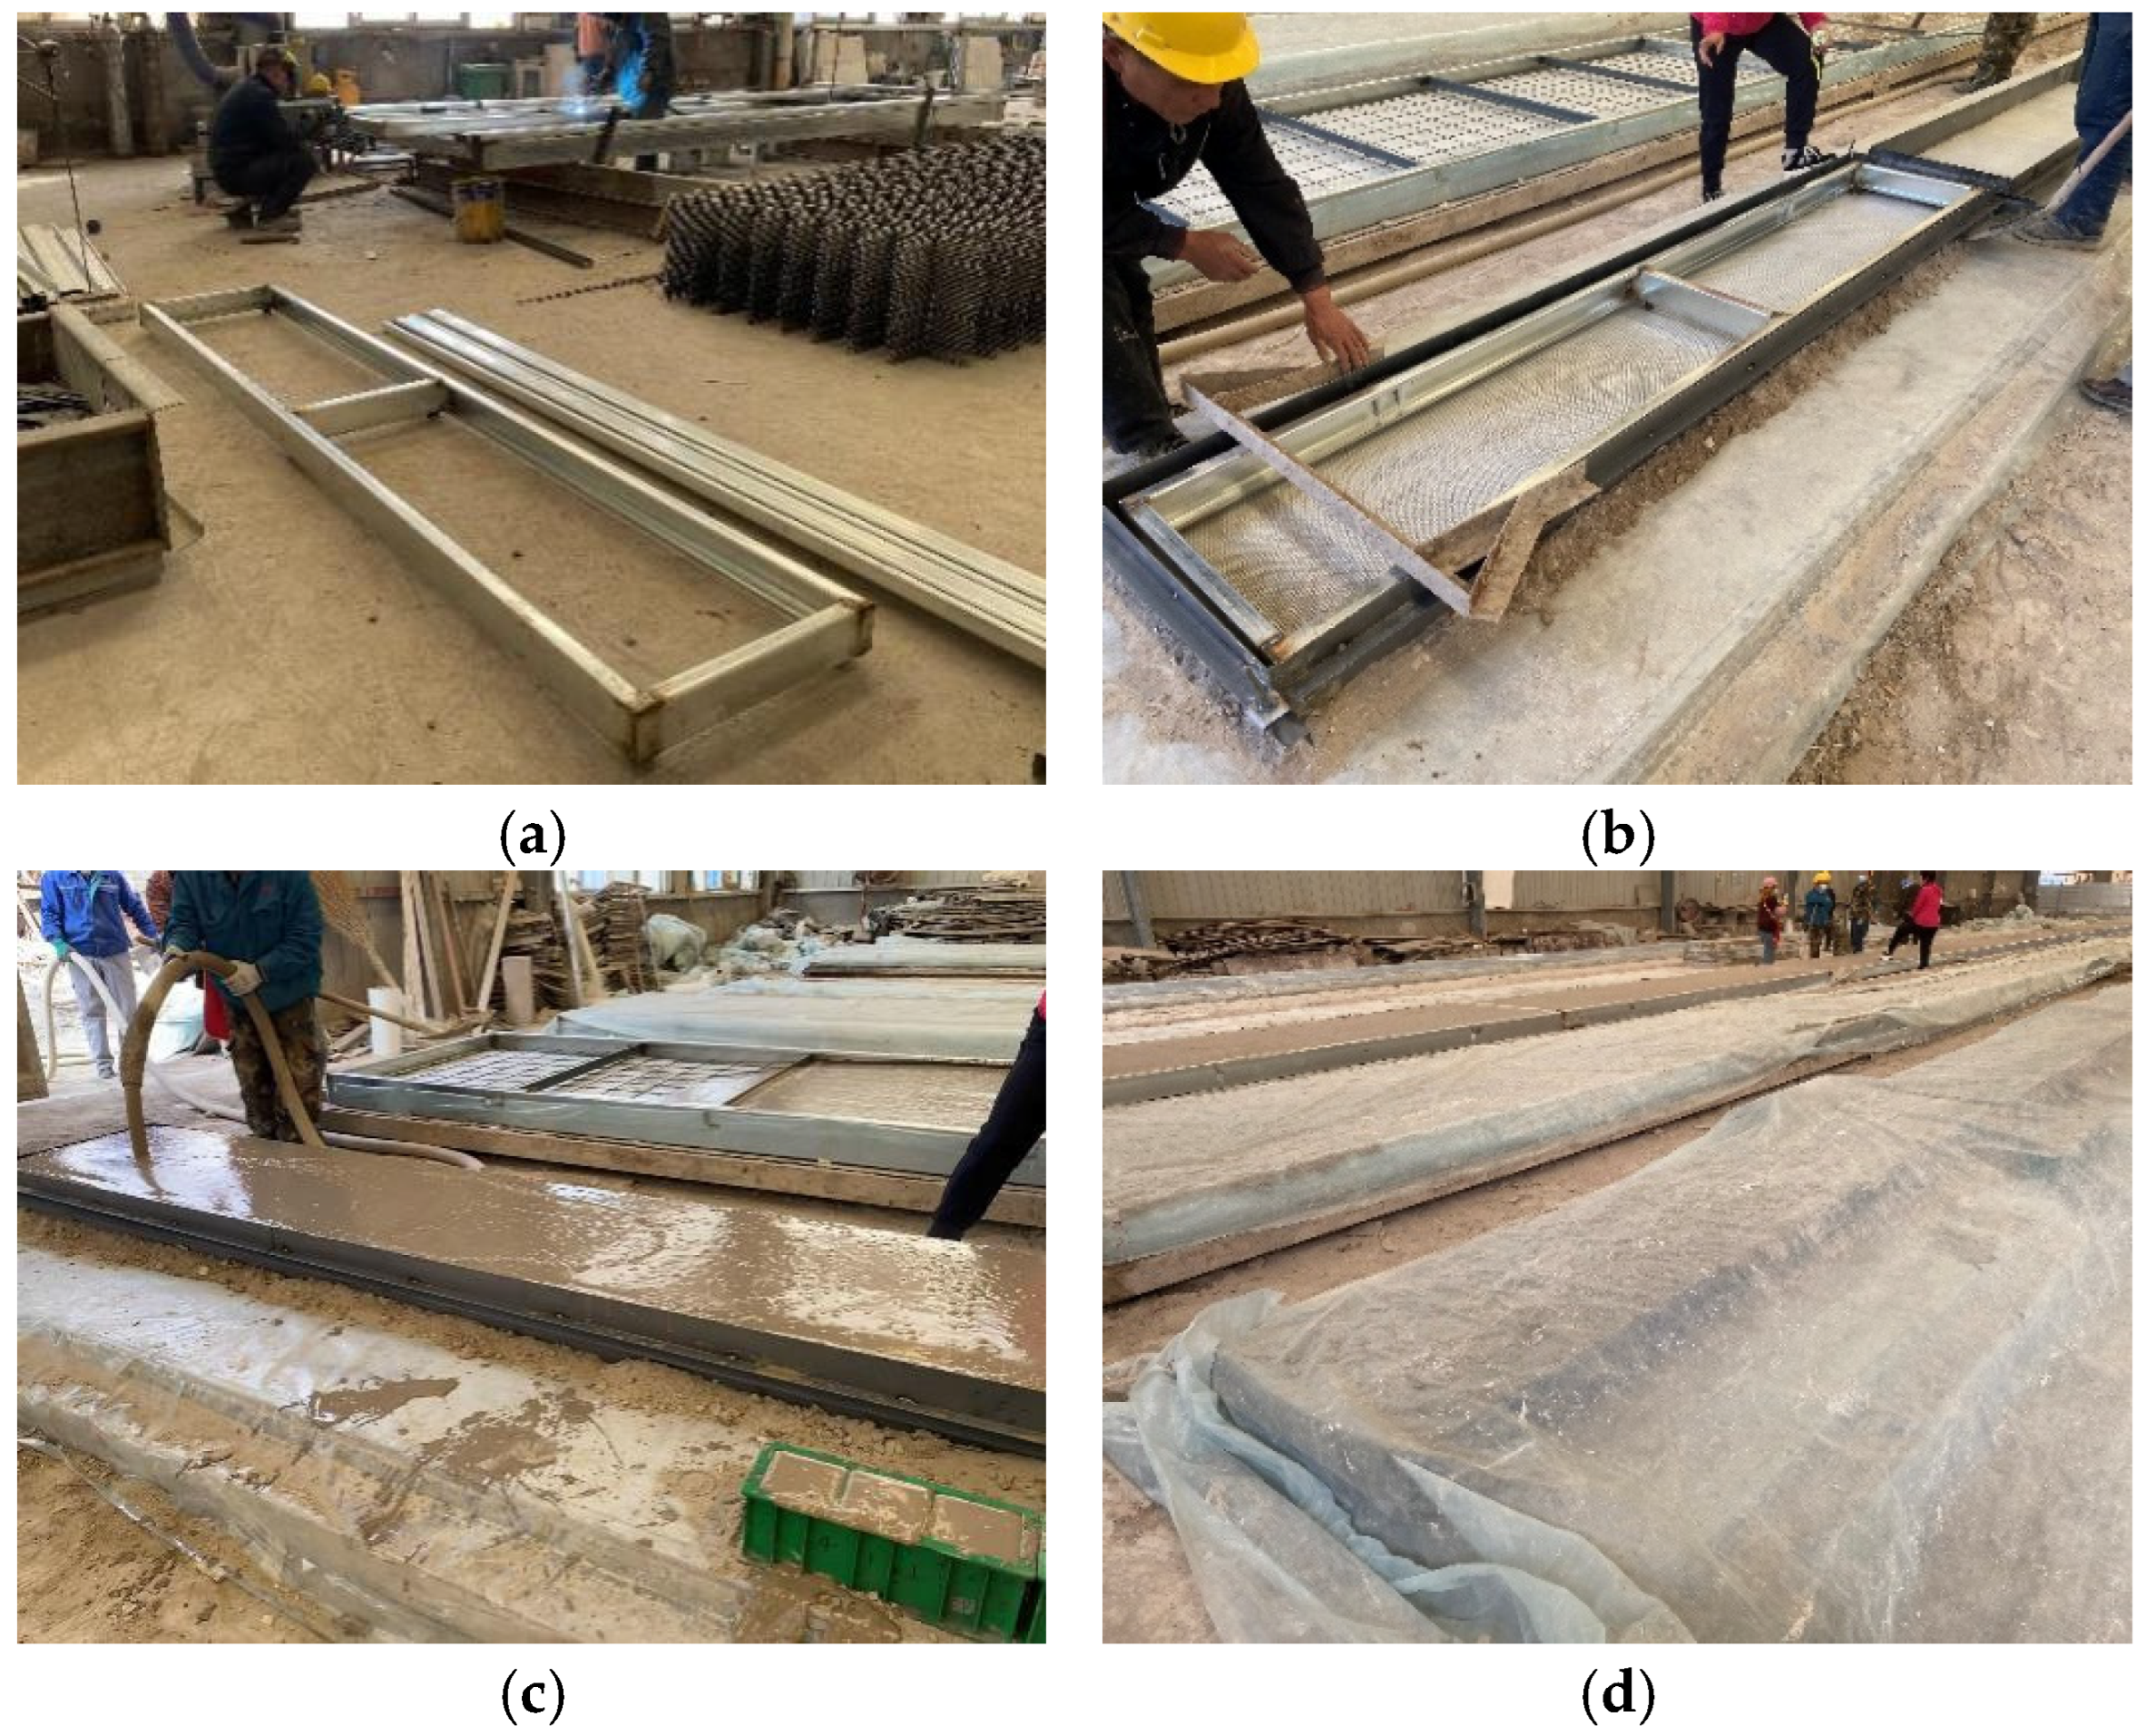
The materials and processing for the production of this experimental specimen are from Shandong Qingqiang Building Materials Co., Ltd. in Jinan, China. The CFS framing skeleton was connected through welding. End ribs and reinforcing ribs underwent limb cutting before being integrated into a closed framework with main ribs using automatic welding or mechanical connecting equipment. Four supports matching the concrete cover height were welded onto the skeleton. Prior to pouring, a first layer of 4 mm × 4 mm alkali-resistant glass fiber mesh was pre-installed at the mold base, followed by positioning the CFS framing skeleton.
Wall panel specimens employed single monolithic casting to ensure that foamed concrete fully filled the skeleton interstices and encapsulated the framing. After concrete placement, a second layer of alkali-resistant glass fiber mesh was embedded into the surface. Mold-skeleton alignment was maintained during pouring to control concrete cover thickness. Considering foamed concrete’s enhanced fluidity compared to conventional concrete, sand backfilling was applied at mold joints to prevent leakage.
Specimens and foamed concrete test cubes were demolded 4 h post-casting, followed by curing under identical conditions. Key fabrication procedures are illustrated in Figure 10.

5.3. Material Performance Test

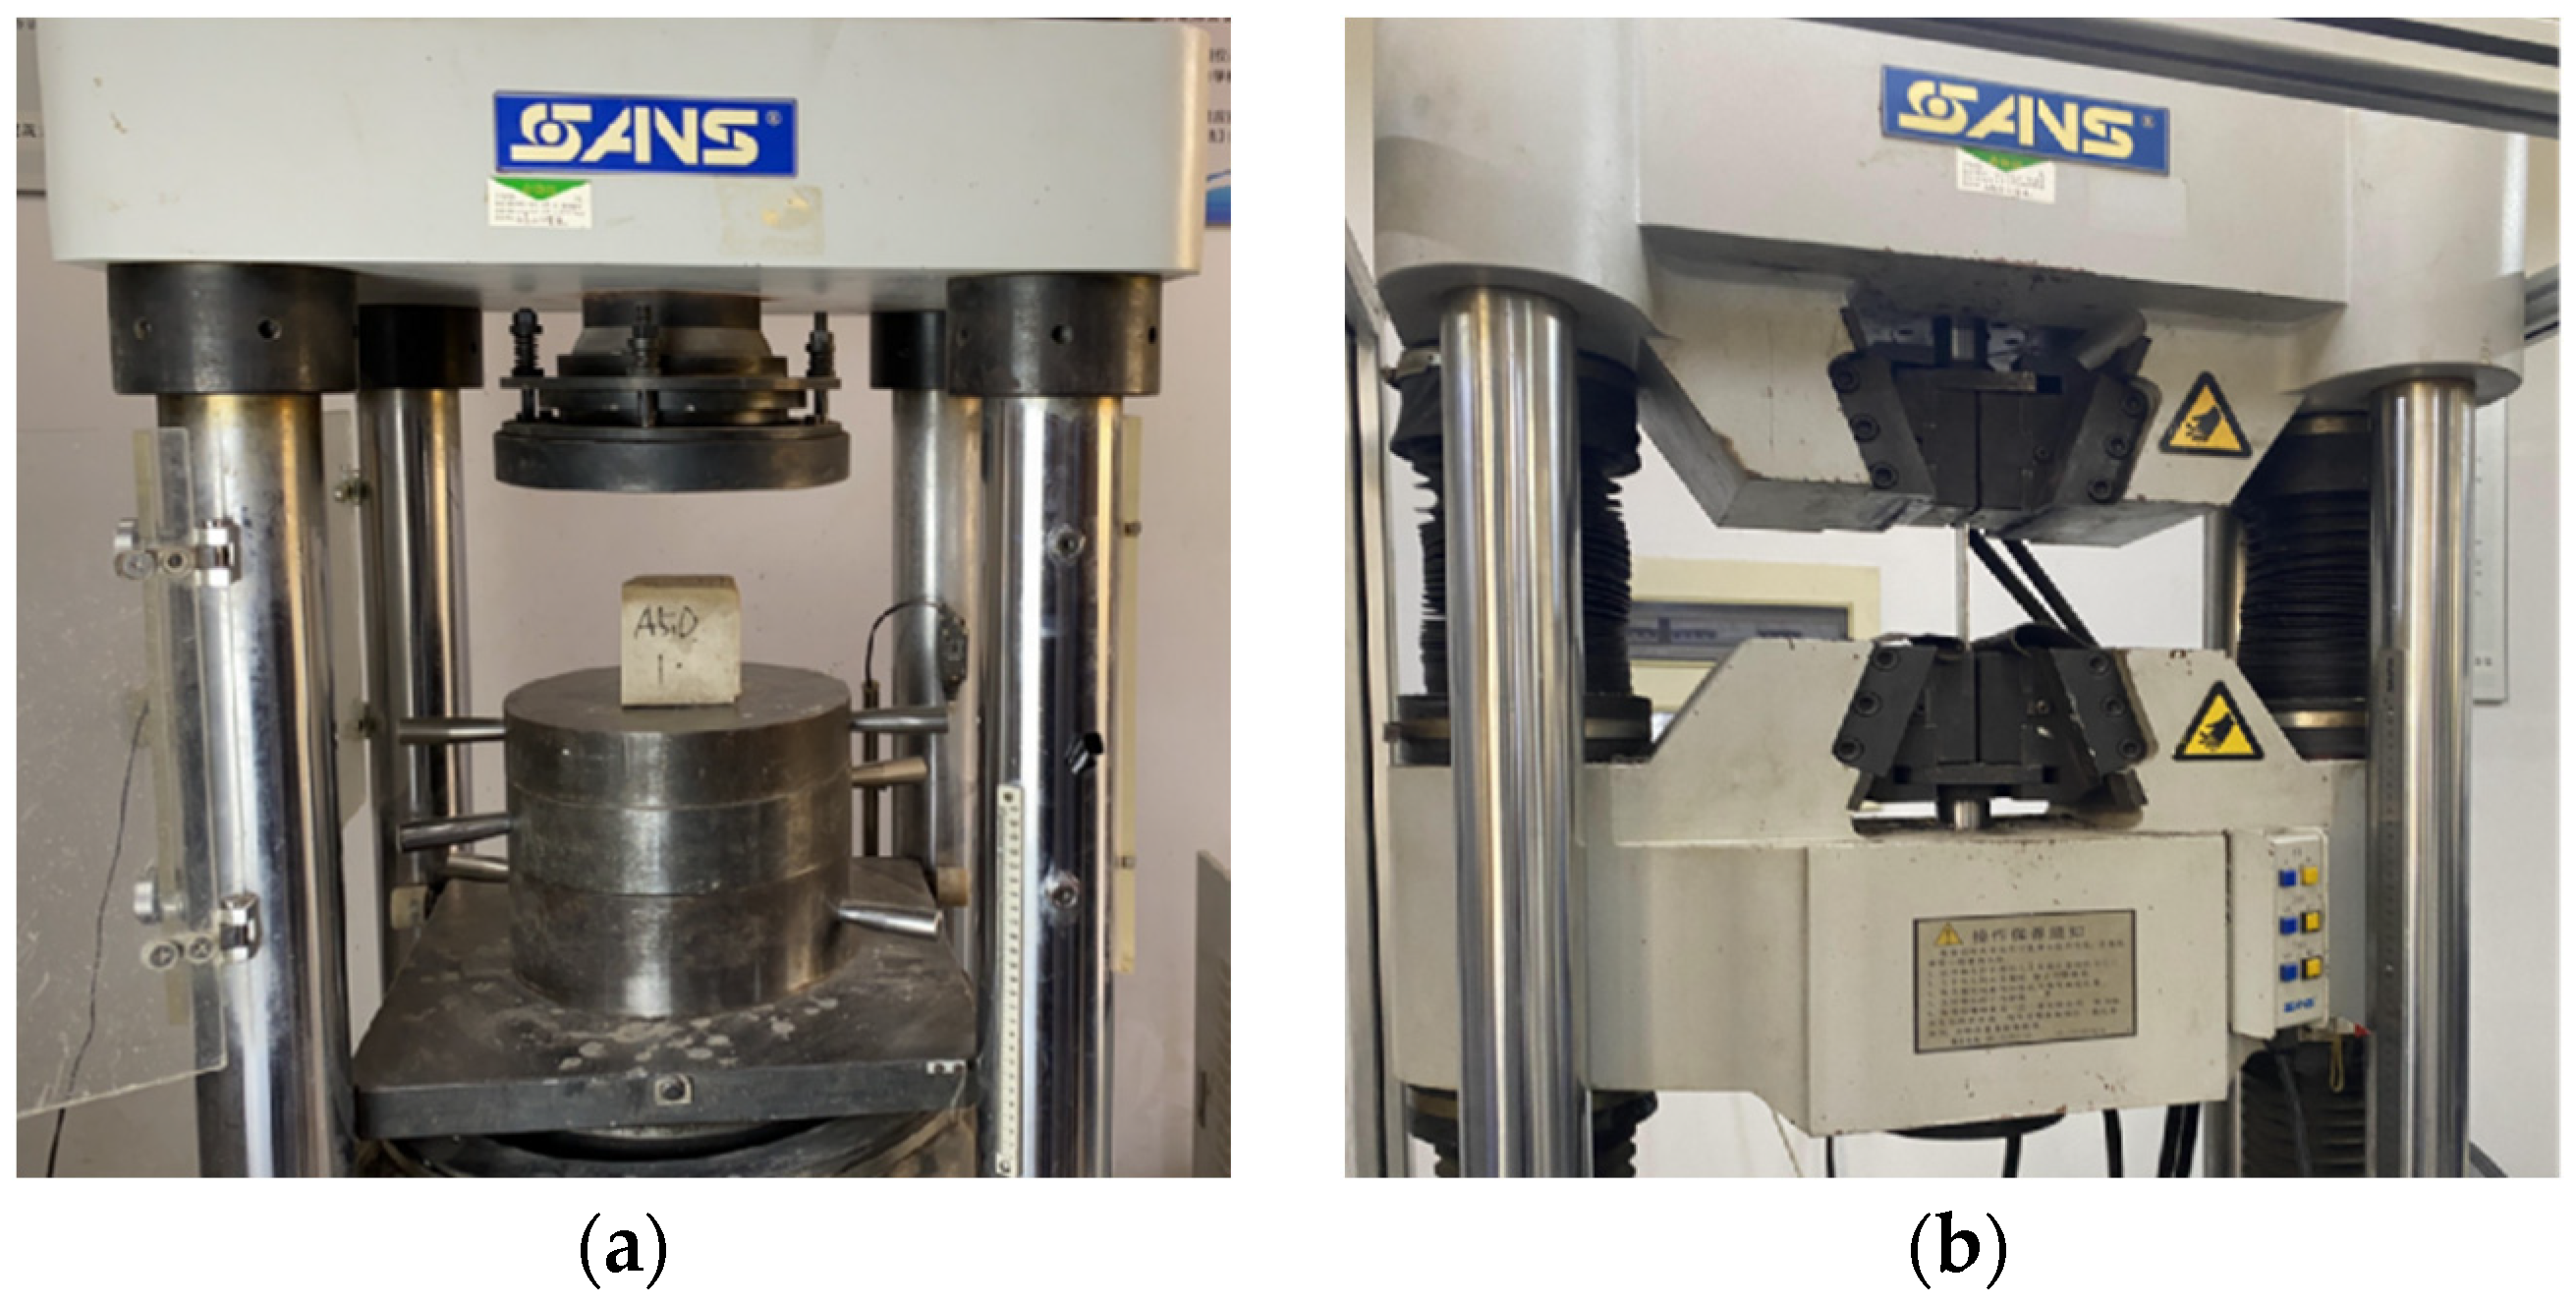
The material performance test for foamed concrete was conducted in accordance with Foamed Concrete JG/T 266-2011 [49] and Standard for Test Methods of Physical and Mechanical Properties of Concrete GB/T 50081-2019 [50]. Using foamed concrete from the same batch as the test specimens, two groups of 100 mm × 100 mm × 100 mm cubic specimens (A1 and A2) with different strength grades were cast, with three specimens in each group. After curing under identical conditions, compressive strength tests were performed. The experimental procedure is illustrated in Figure 11a, and the test results are presented in Table 5.
Four Q195 grade steel specimens with a thickness of 1.8 mm were prepared for material performance testing. To accurately represent the specimen characteristics, steel from the same production batch used for fabricating the wall panel framing members was selected. Two specimens were extracted from the web section and two from the flange section of the C-section steel. The experimental procedure is illustrated in Figure 9, while the detailed test values and results of the framing material performance are presented in Table 6.

5.4. Experimental Apparatus and Data Acquisition

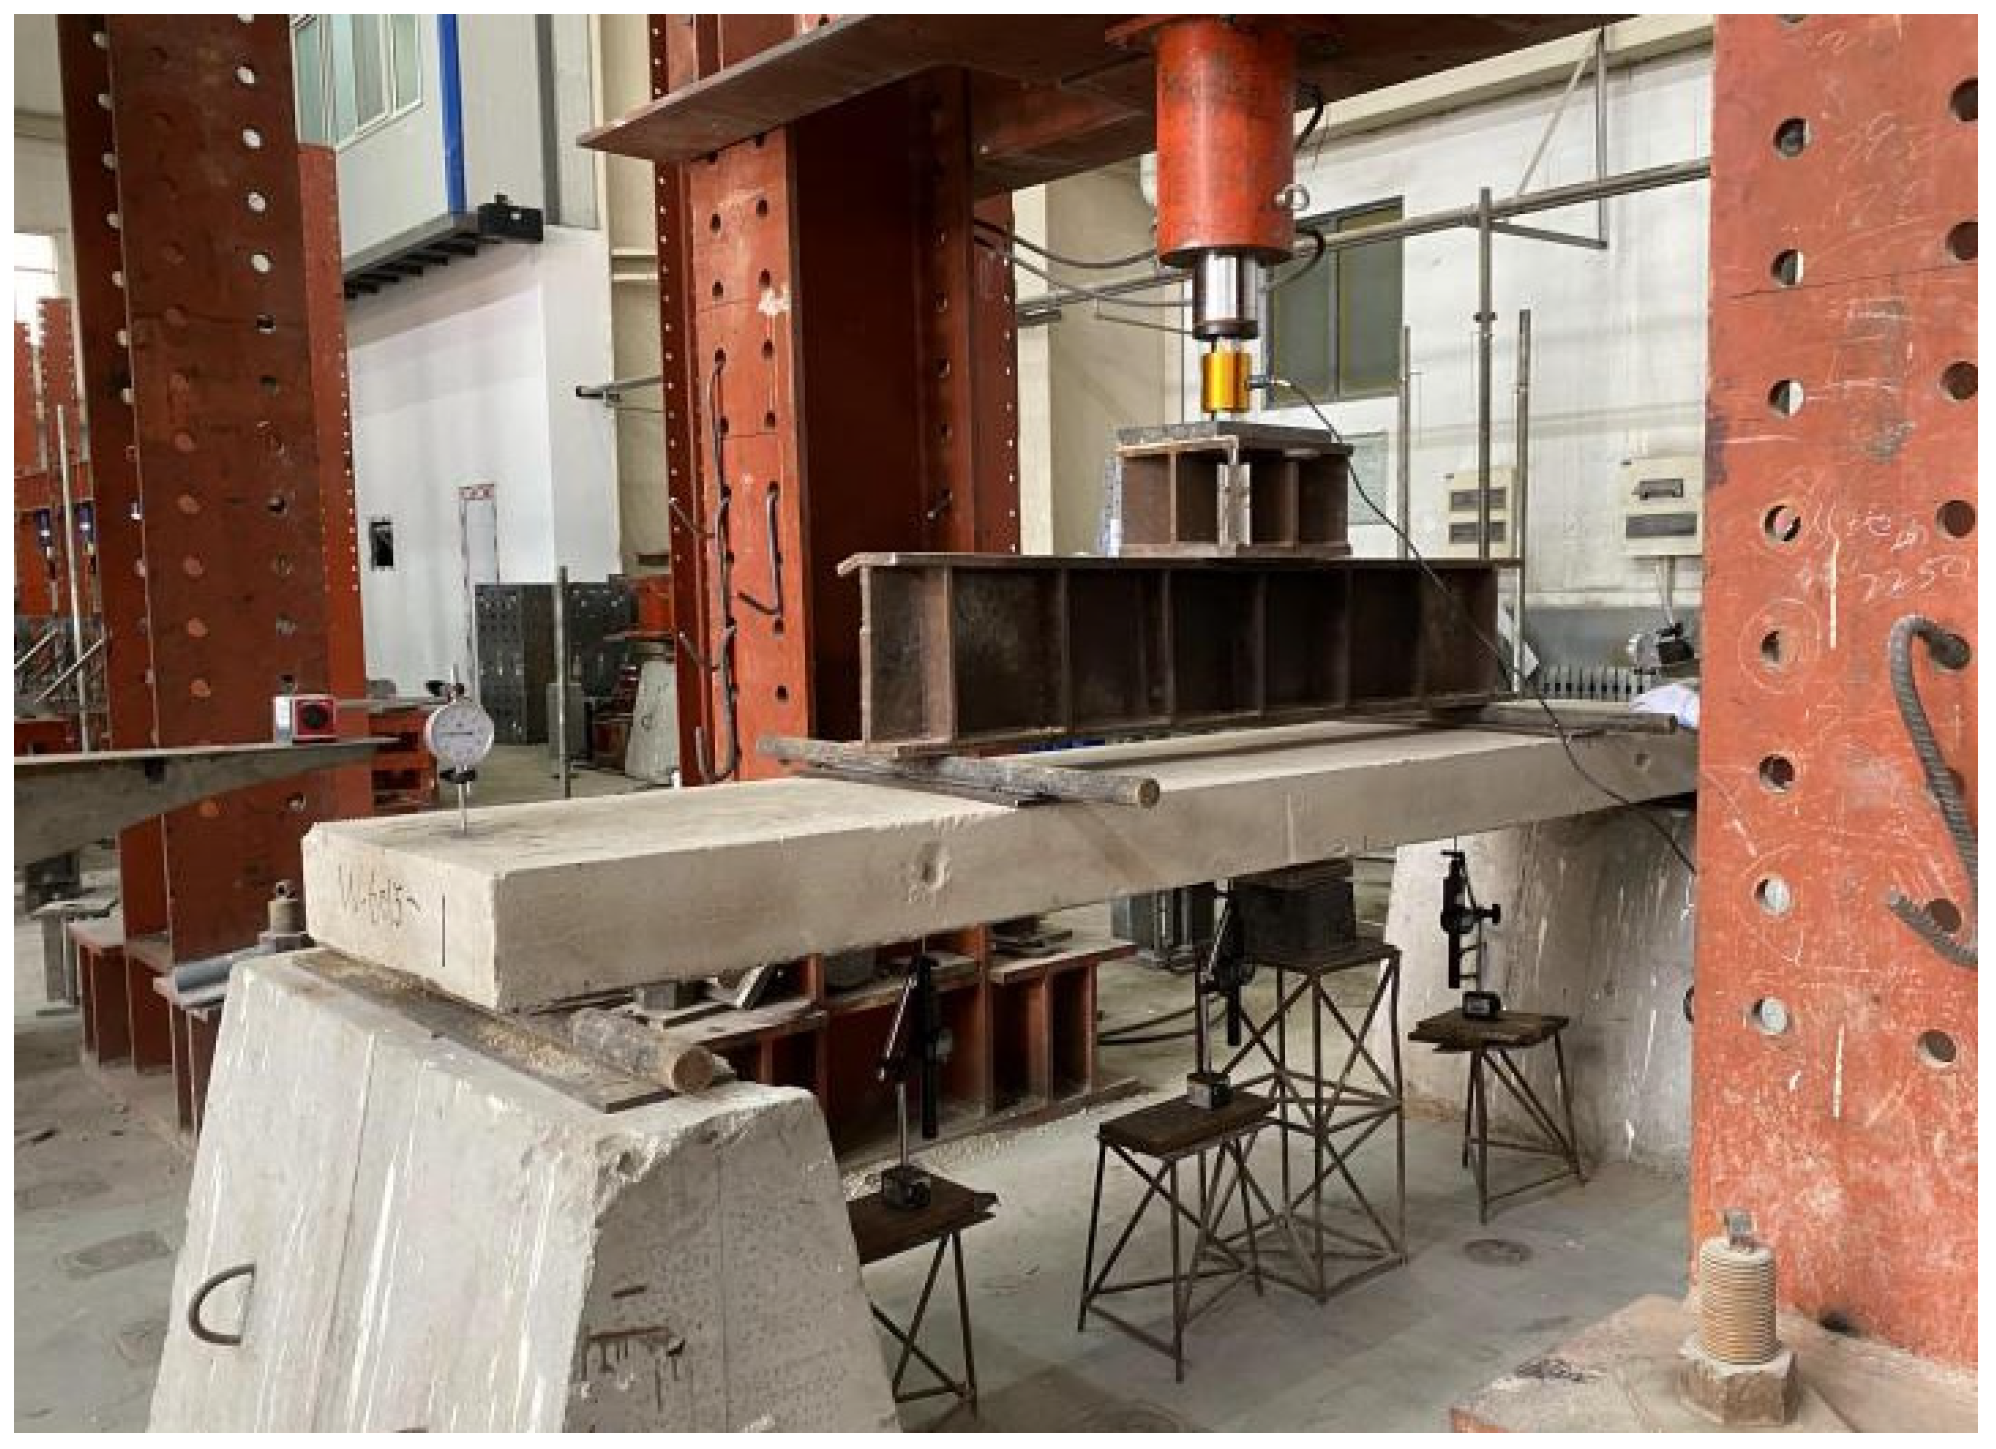
To simulate wind load effects on CFS-framed lightweight concrete composite wall panels, all specimens underwent four-point bending tests with quarter-point concentrated loading. The experimental setup is illustrated in Figure 12 and Figure 13. A hydraulic jack with 63 MPa capacity applied loads through a distribution beam directly onto the panel, with 1400 mm spacing between loading points (1/4 of the total span). A BLR-1 type 10-ton load cell recorded applied loads. Displacement transducers were positioned at quarter-span, mid-span, and three-quarter-span locations along the panel length to measure deflection. Mechanical displacement transducers mounted at both end supports compensated for settlement effects on deflection measurements. This configuration enabled determination of cracking load, yield load, and ultimate load to evaluate the flexural capacity of the exterior wall panel system.

5.5. Loading Method

In compliance with the technical specifications of GB/T 50152-2012 “Standard for Test Methods of Concrete Structures” [51], the experiment adopted a two-stage load-displacement graded loading system, continuously monitoring and recording potential failure phenomena including crack propagation in the wall panel, compressive damage of top concrete, interaction behavior between concrete and CFS framing, as well as buckling behavior of the CFS framing. The experiment procedure commenced with a preloading phase, where an initial 2 kN load was applied to eliminate any initial gaps between the specimen and loading apparatus while simultaneously verifying the reliability of displacement transducers, strain gauges, and other measurement systems. Following stabilization of all instrument readings, complete unloading was performed to reset the system.
The formal loading phase employed a graded loading protocol with 2 kN increments. Each load level was maintained for 5 min to ensure complete stress redistribution, during which crack pattern observation, width measurement, and critical strain data acquisition were conducted concurrently.
Upon observation of significant plastic deformation in the specimen, the control mode was switched to mid-span displacement control, using 2 mm vertical displacement increments at mid-span as the loading criterion. Loading continued until termination conditions were met, including (1) substantial reduction in load-bearing capacity, (2) crack width exceeding limit values, or (3) occurrence of brittle failure, thereby completing the full observation of structural failure progression.

6. Test Results and Analysis

6.1. Destructive Phenomenon

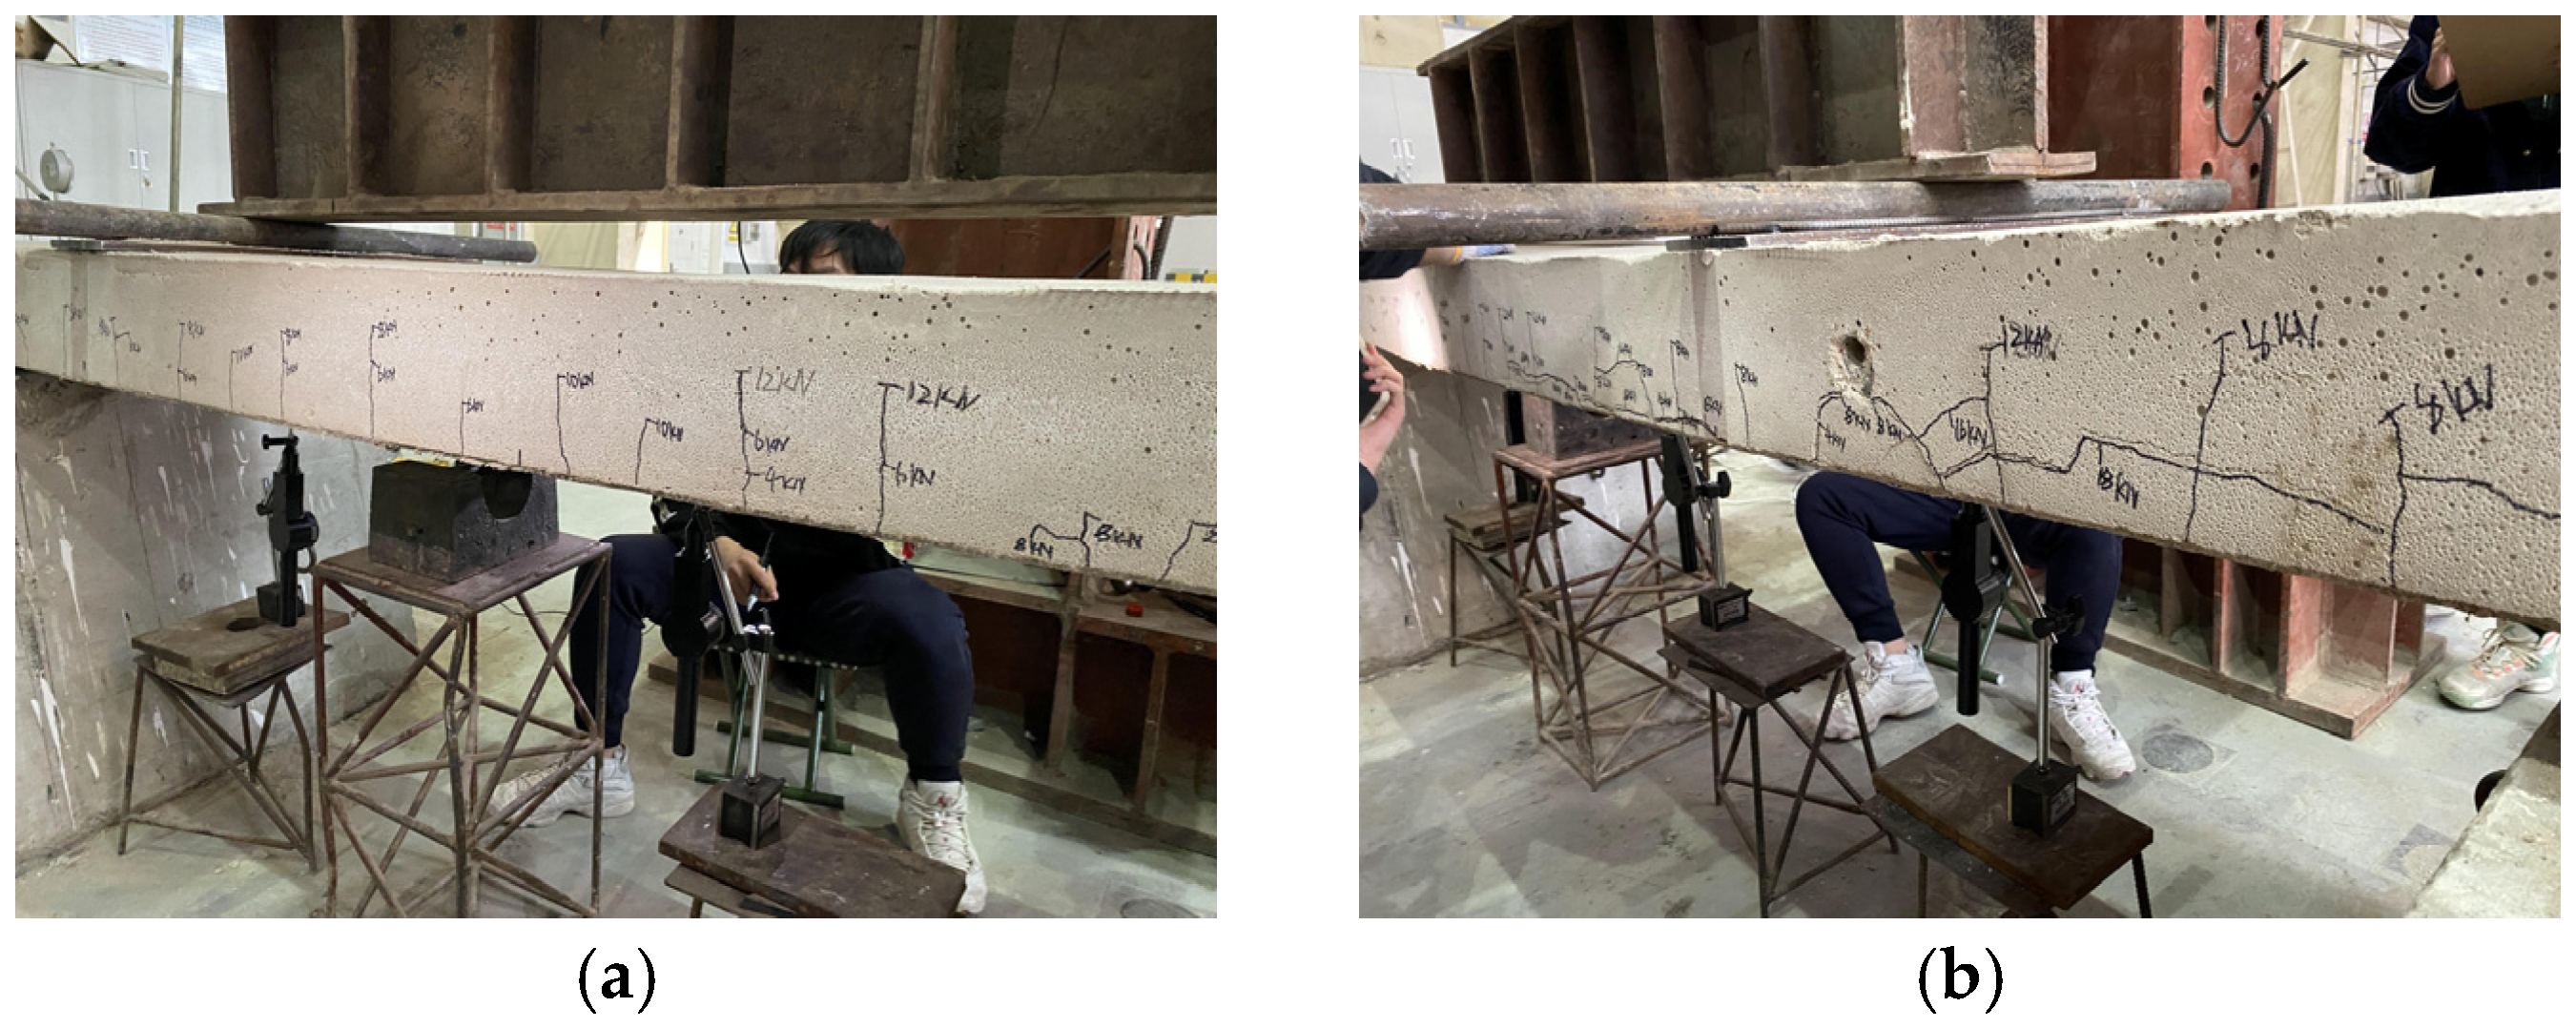
The experiment found that the failure phenomenon of wall panel specimens at each stage under load has a certain regularity. The typical failure phenomenon of specimen LFSW-1 is shown in Figure 14.
The failure process of specimen LFSW-1 can be categorized into three distinct phases: elastic phase, cracking phase, and ultimate failure phase.
Elastic phase: This phase encompasses the period from initial load application until the first crack appearance in the specimen. Cracks were recorded through visual inspection and crack width comparator measurements. During this stage, the foamed concrete and CFS framing demonstrate effective composite action.
Cracking phase: At 6 kN loading, initial flexural cracks emerged at the bottom of the pure bending segment, exhibiting characteristic vertical patterns indicative of normal section bending failure. When the load reached 12 kN, these vertical cracks propagated along the side surface, extending up to 90 mm in length. With continued loading, transverse cracks began developing perpendicular to the longitudinal axis. The foamed concrete at the bottom reached its limit state and ceased contributing to load resistance, marking the end of this phase.
Ultimate failure phase: The wall panel undergoes substantial deformation prior to failure. At 18 kN loading, diagonal cracks penetrating the panel thickness develop near the supports. With continued loading, cracking intensifies in the low-strength foamed concrete, while longitudinal cracks at the panel bottom progressively propagate and widen, accompanied by interfacial slip between the foamed concrete and CFS framing. Concurrently, the top fiberglass mesh exhibits buckling, and concrete crushing occurs beneath the loading points.
At the end of the experiment, the damaged foamed concrete was removed, and experimental results of the internal CFS framing are shown in Figure 15.
Other specimens have the same failure stage as specimen LFSW-1, and the description is based on the typical failure phenomena of each specimen.
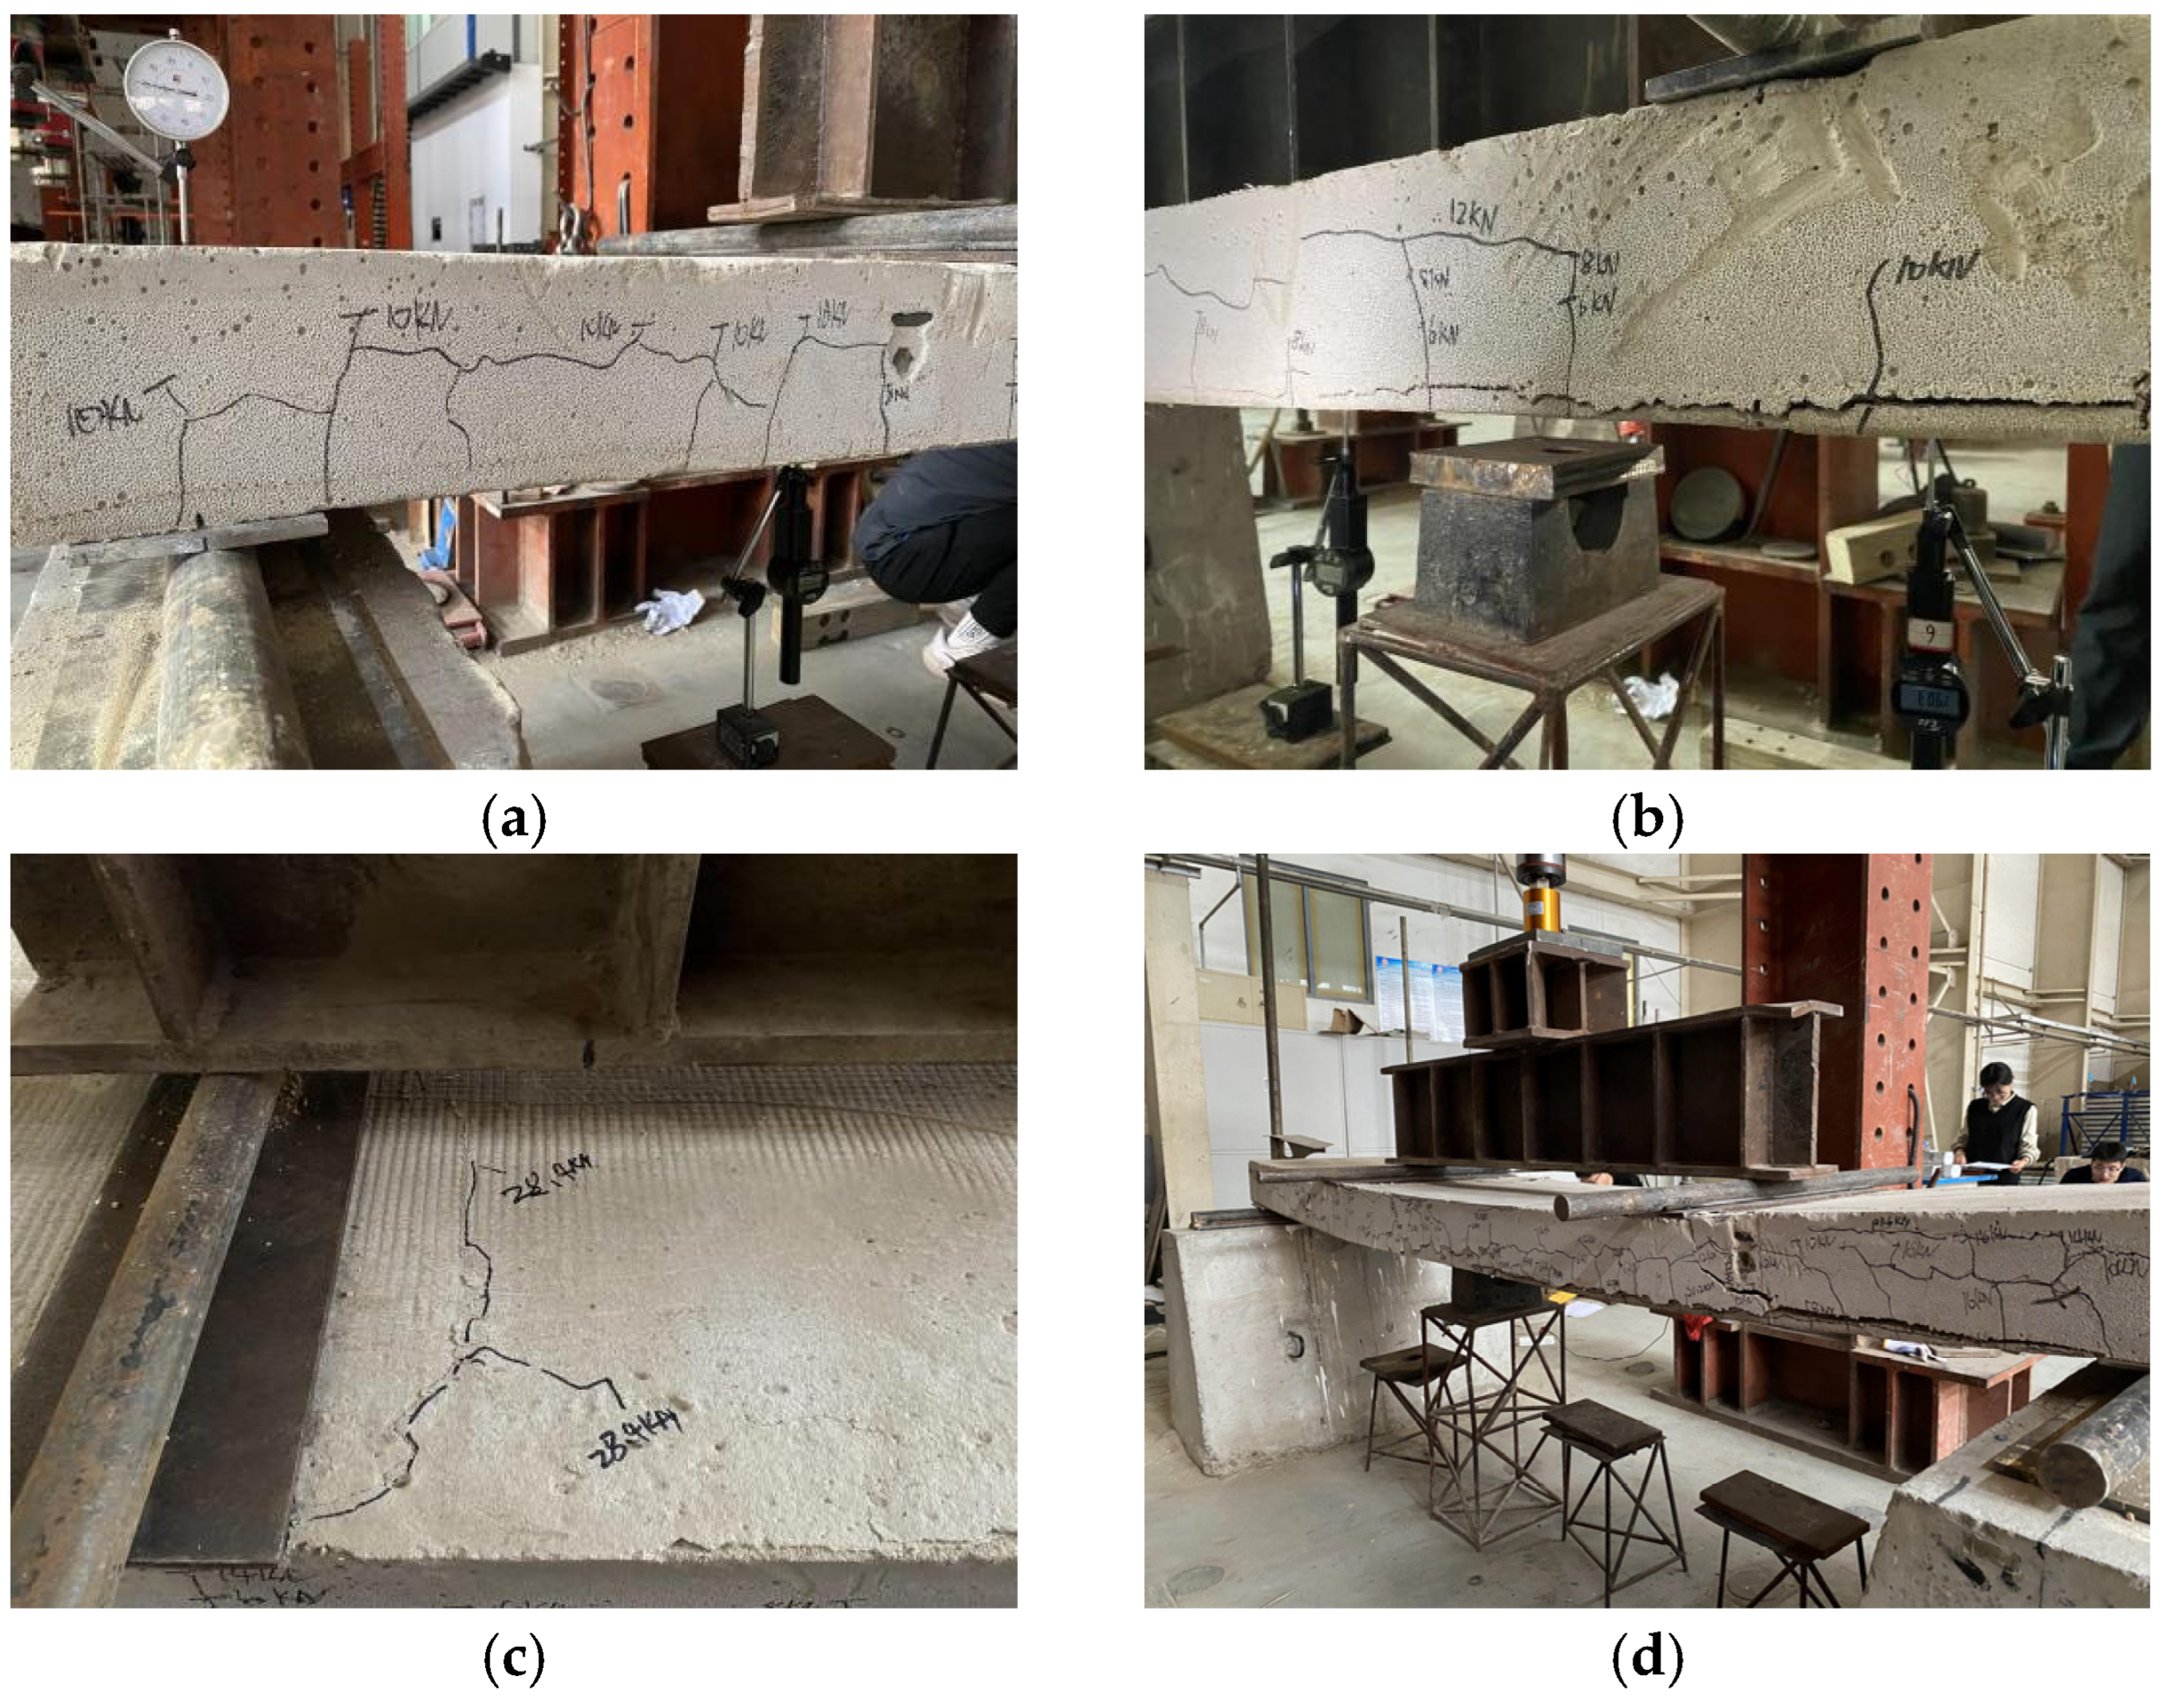
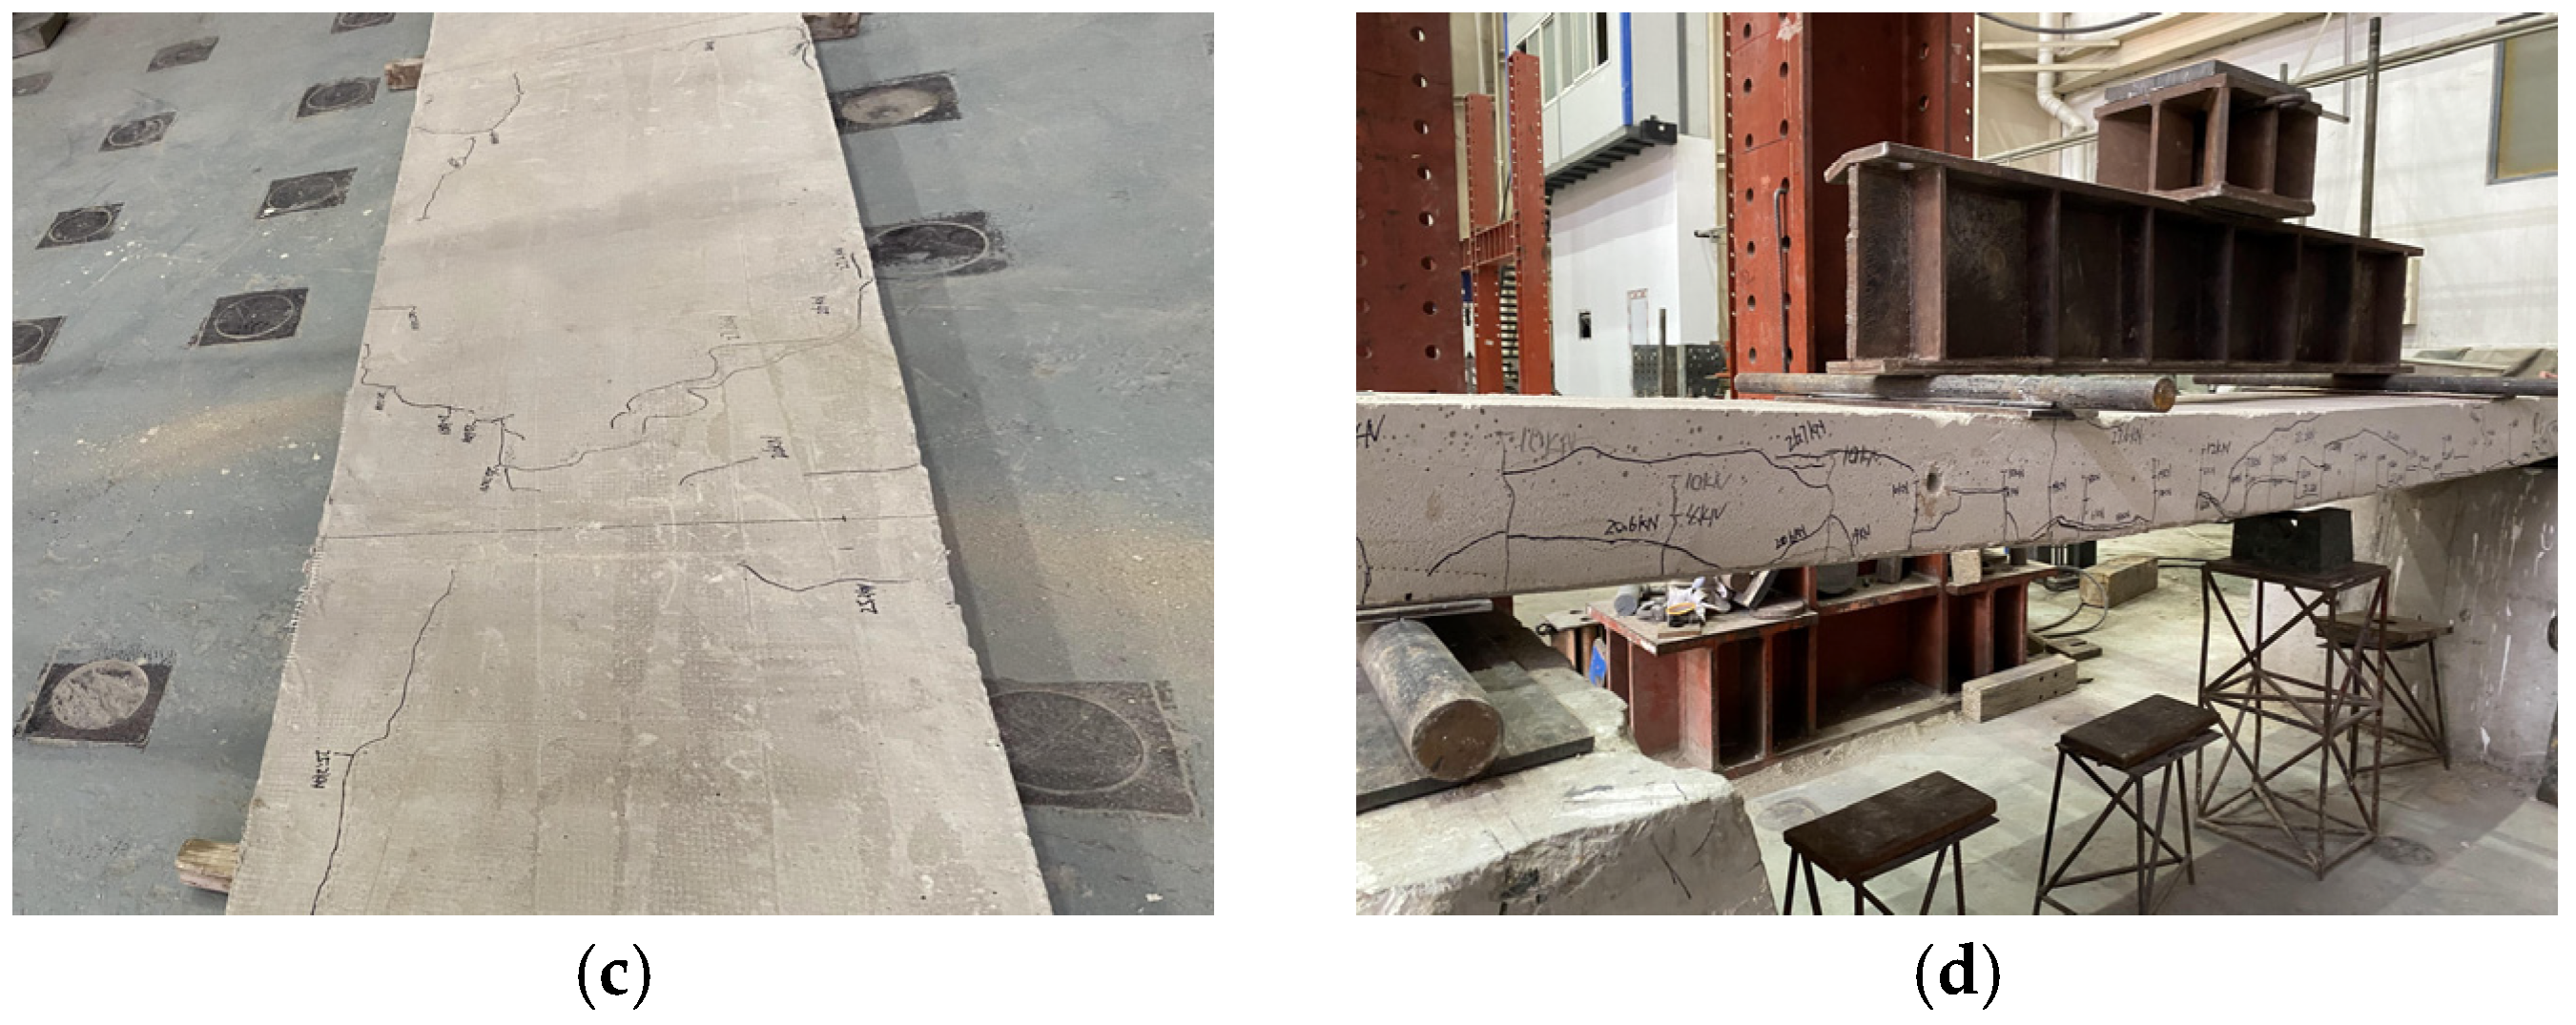
For specimen LFSW-2, initial cracking occurred at the mid-span bottom when the load reached 4 kN. At 10 kN loading, multiple diagonal cracks developed in all shear-span sections, accompanied by a mid-span displacement of 9.39 mm (Figure 16a). When loaded to 20 kN, audible cracking sounds were observed as a transverse crack fully penetrated the lower portion of the side surface (Figure 16b). The test protocol then transitioned to displacement-controlled loading. Under displacement control, transverse cracking at the panel bottom became evident at 23.21 mm displacement. At 39.08 mm displacement, buckling of the fiberglass mesh and concrete arching occurred at the mid-span top region (Figure 16c). When the displacement reached 59.37 mm (corresponding to 1/50 of the span length), significant crack widening was observed in the lower side surface, exposing the internal fiberglass mesh with pronounced delamination phenomena, while maintaining a load of 32.8 kN (Figure 16d).
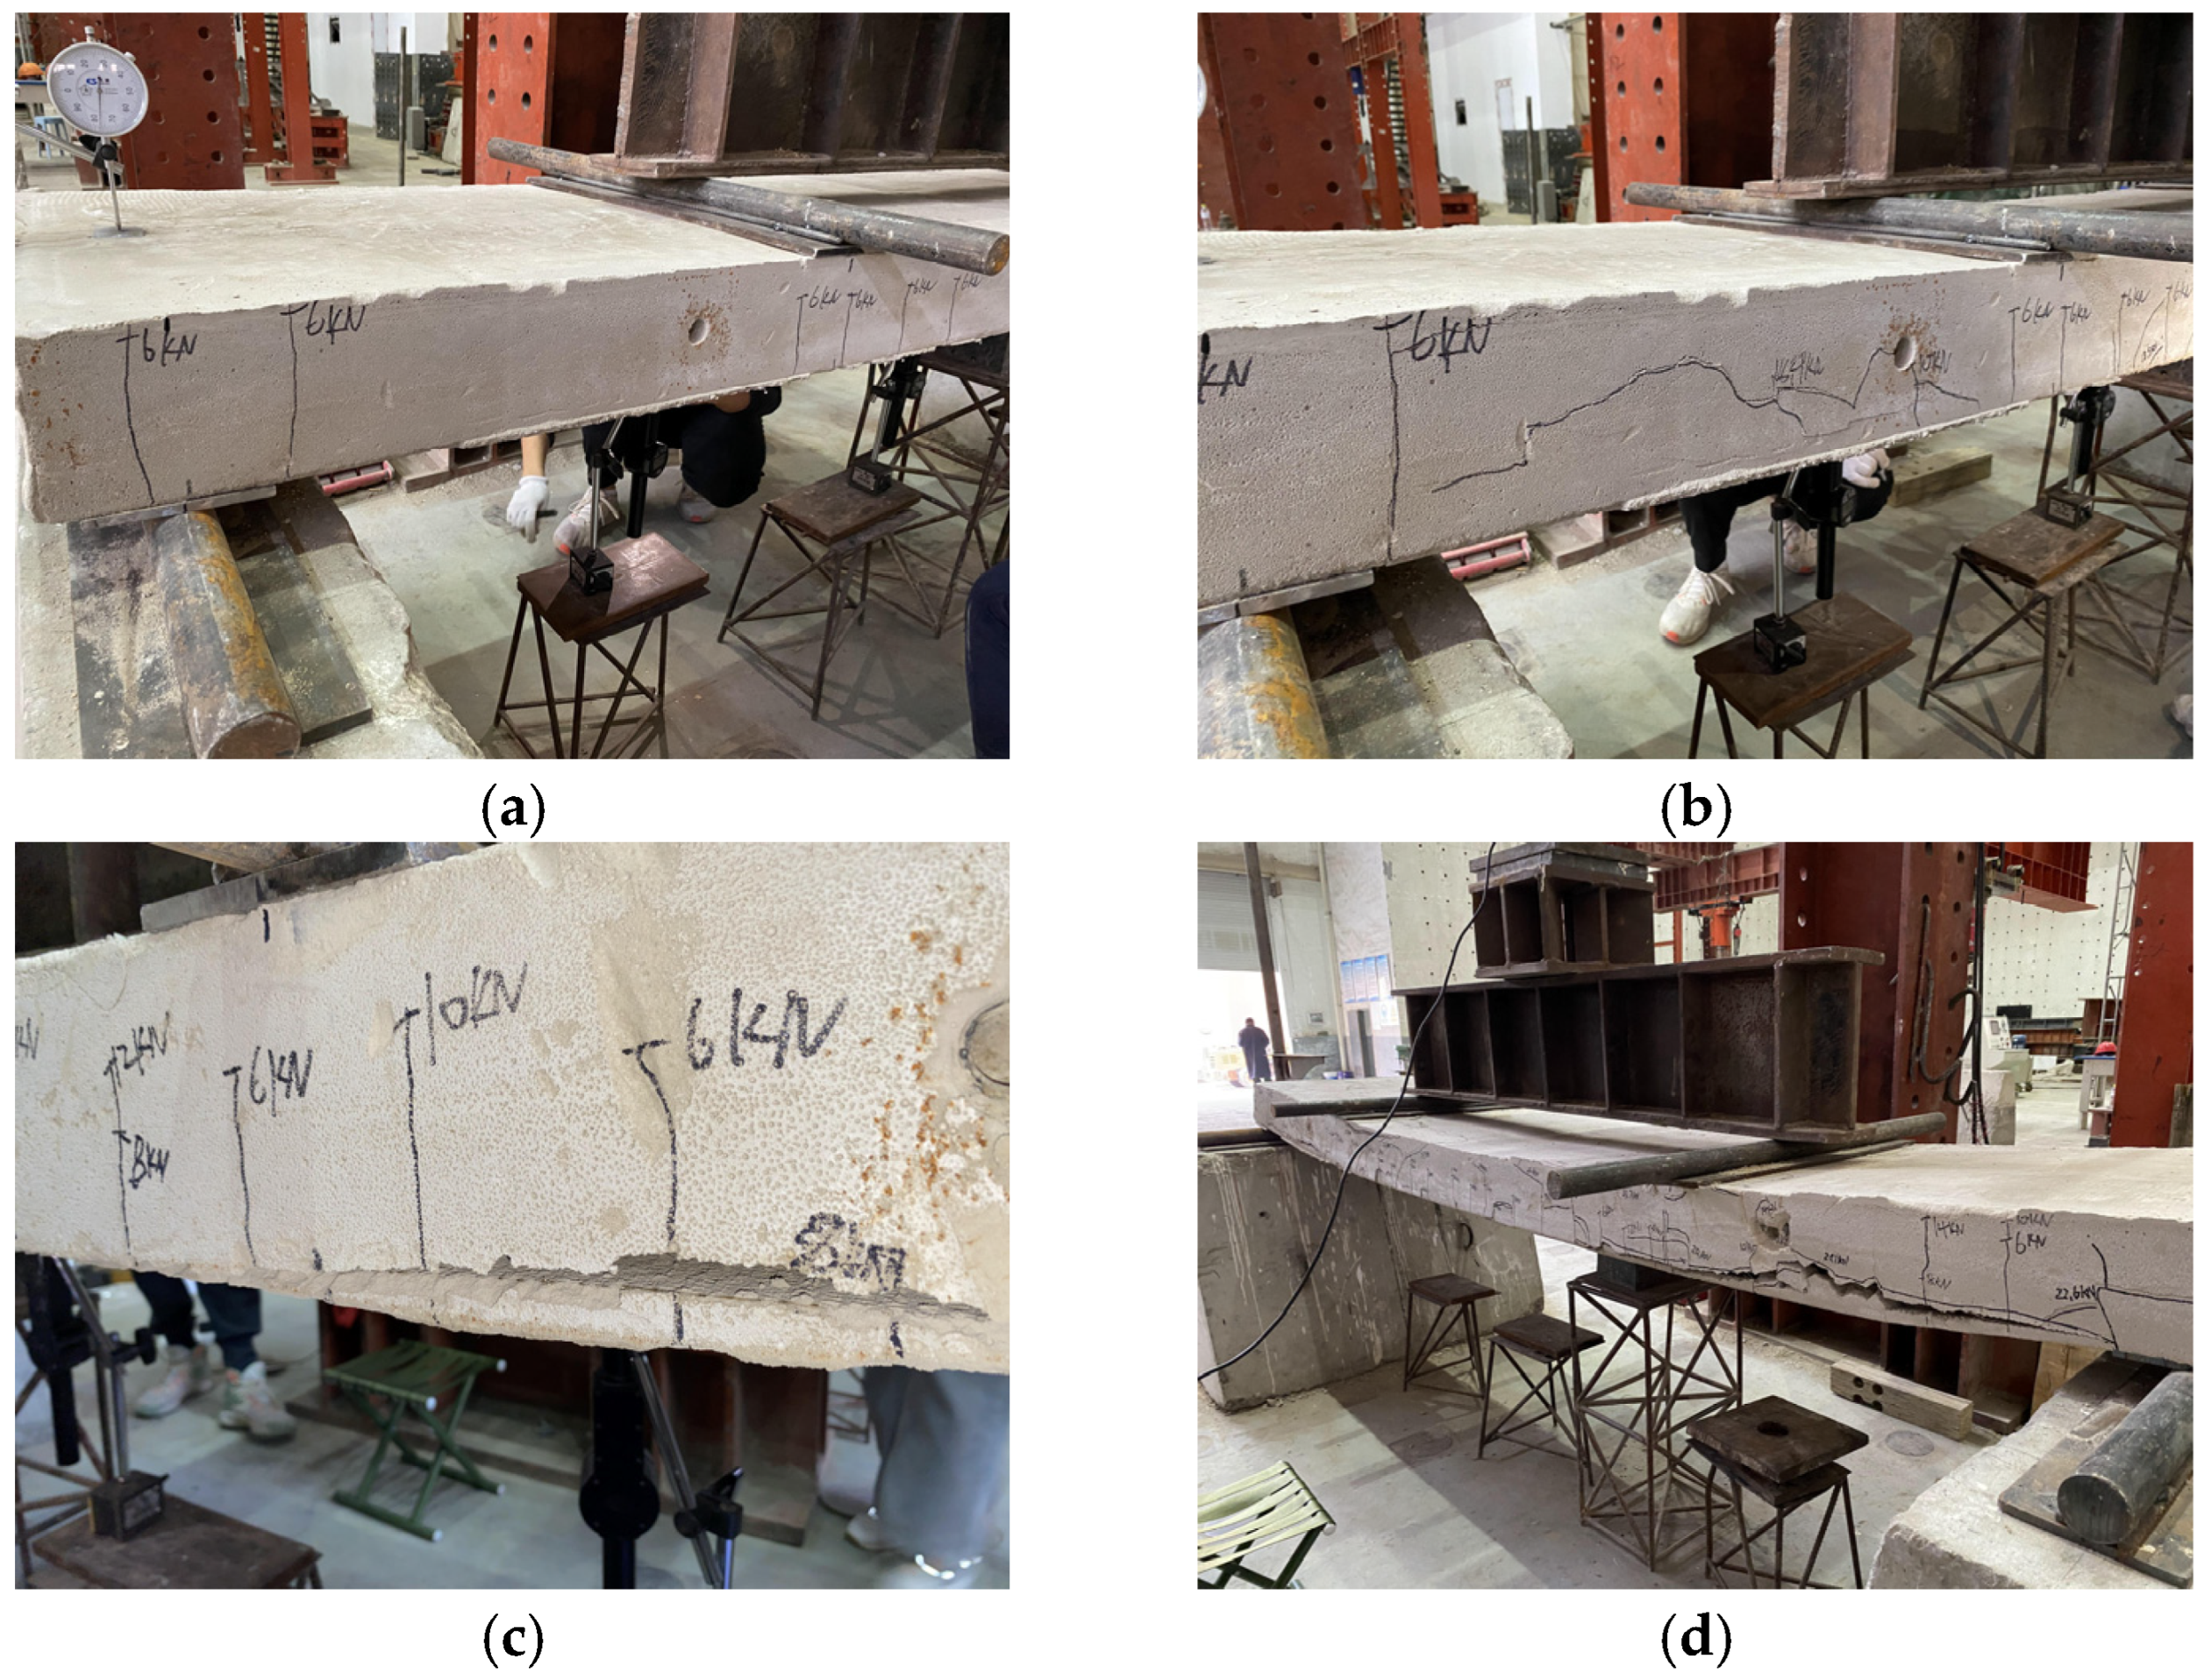
When the load on the LFSW-3 specimen reached 6 KN, the first batch of microcracks appeared at the bottom of the pure curved section of the wall panel, and rapidly propagated to a height of 1/3 of the thickness on the side of the panel. When the load is loaded to 14 KN, the specimen produces abnormal noise and diagonal cracks connecting the vertical cracks that appear on the plate side, showing a penetration tendency (Figure 17a). When the displacement control was applied to a load of 21.17 mm, a relatively flat through crack appeared in the lower part of the plate along the longitudinal direction of the plate (Figure 17b). When the displacement control was loaded to 37.99 mm, a through crack appeared on the upper part of the plate side and the crack at the bottom of the plate continued to widen. At this time, the load was 28 KN (Figure 17c). As the loading displacement increases, the concrete at the top loading point of the slab is crushed and the fiberglass mesh arches. When the displacement load reaches 64.30 mm, the mid-span displacement reaches 1/50 of the span, and the specimen produces abnormal noise, causing the bottom concrete to detach (Figure 17d). At this time, the load is 30.3 KN.
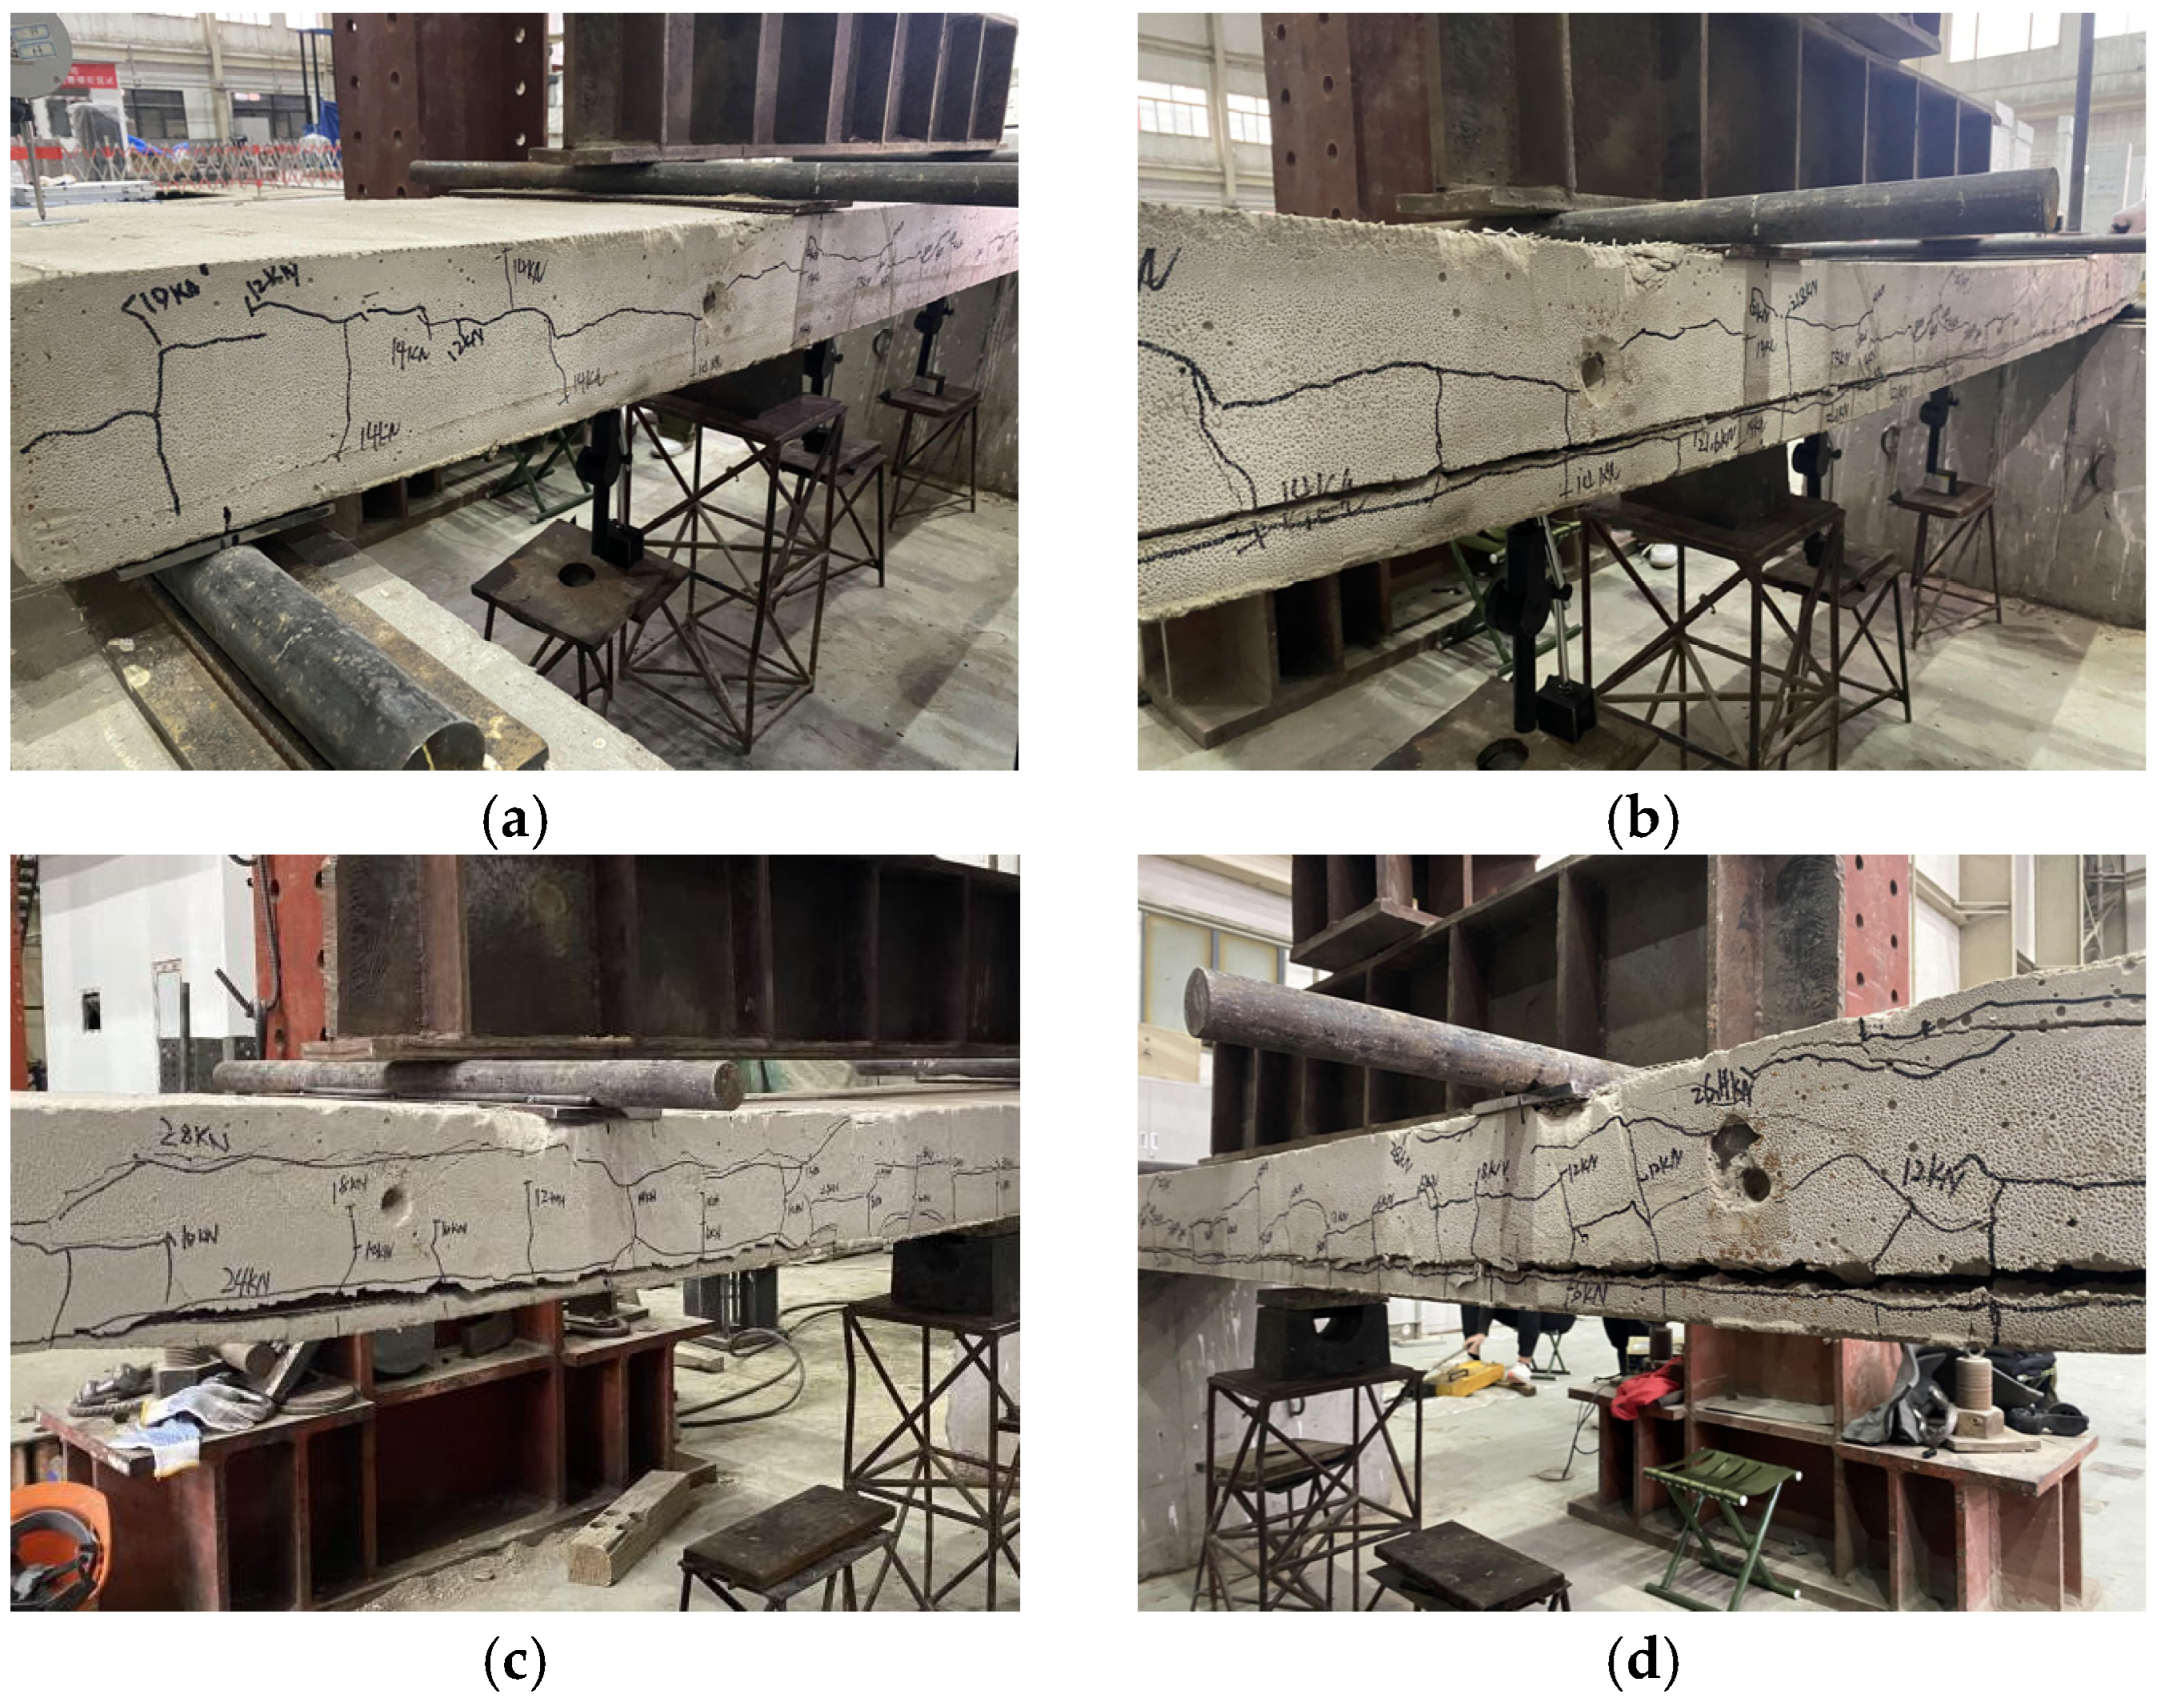
When the load on specimen LFSW-4 reached 4 KN, the first batch of microcracks appeared at the bottom of the plate, and the rapid propagation to the side of the plate appeared again. When the load reached 8 KN, diagonal cracks appeared first in the shear-span section. When the load is loaded to 12 KN, the crack on the middle plate side of the specimen card rises to 9 mm, and the mid-span displacement is 13.99 mm (Figure 18a). When the load is loaded to 18 KN, a saw-tooth patterned transverse crack appears that is different from the horizontal through crack of the LFSW-3 specimen (Figure 18b). When the displacement control was loaded to 34.93 mm and the load was 23.4 KN, the through cracks on the side of the plate continued to extend and the loading point was compressive failure. Compared with other specimens, there were more failure points at the top of the plate (Figure 18c). When the displacement control load is 60.26 mm, the mid-span displacement reaches 1/50 of the span, and the load value is 27.3 KN (Figure 18d).
The failure behavior of specimen LFSW-5 exhibited characteristic stages under progressive loading. Initial cracking occurred at the pure bending section bottom when the load reached 4 kN. At 6 kN loading, shear-span cracks penetrated the side surface while additional vertical cracks developed in the pure bending region (Figure 19a). When loaded to 18.9 kN, audible cracking sounds accompanied the formation of irregular transverse cracks at the mid-panel side (Figure 19b), corresponding to a mid-span displacement of 26.23 mm, prompting the transition to displacement-controlled loading. Under displacement control at 36.91 mm, significant crack widening exposed the reinforcing mesh with initial local delamination (Figure 19c). When the displacement control is loaded to 61.85 mm and the mid-span displacement reaches 1/50 of the span, the load value is 25.5 KN. The transverse cracks in the lower part of the slab side widen, and the concrete shows signs of cracking (Figure 19d).

6.2. Comparison Between LFSW-1 Test and Simulation of Test Piece

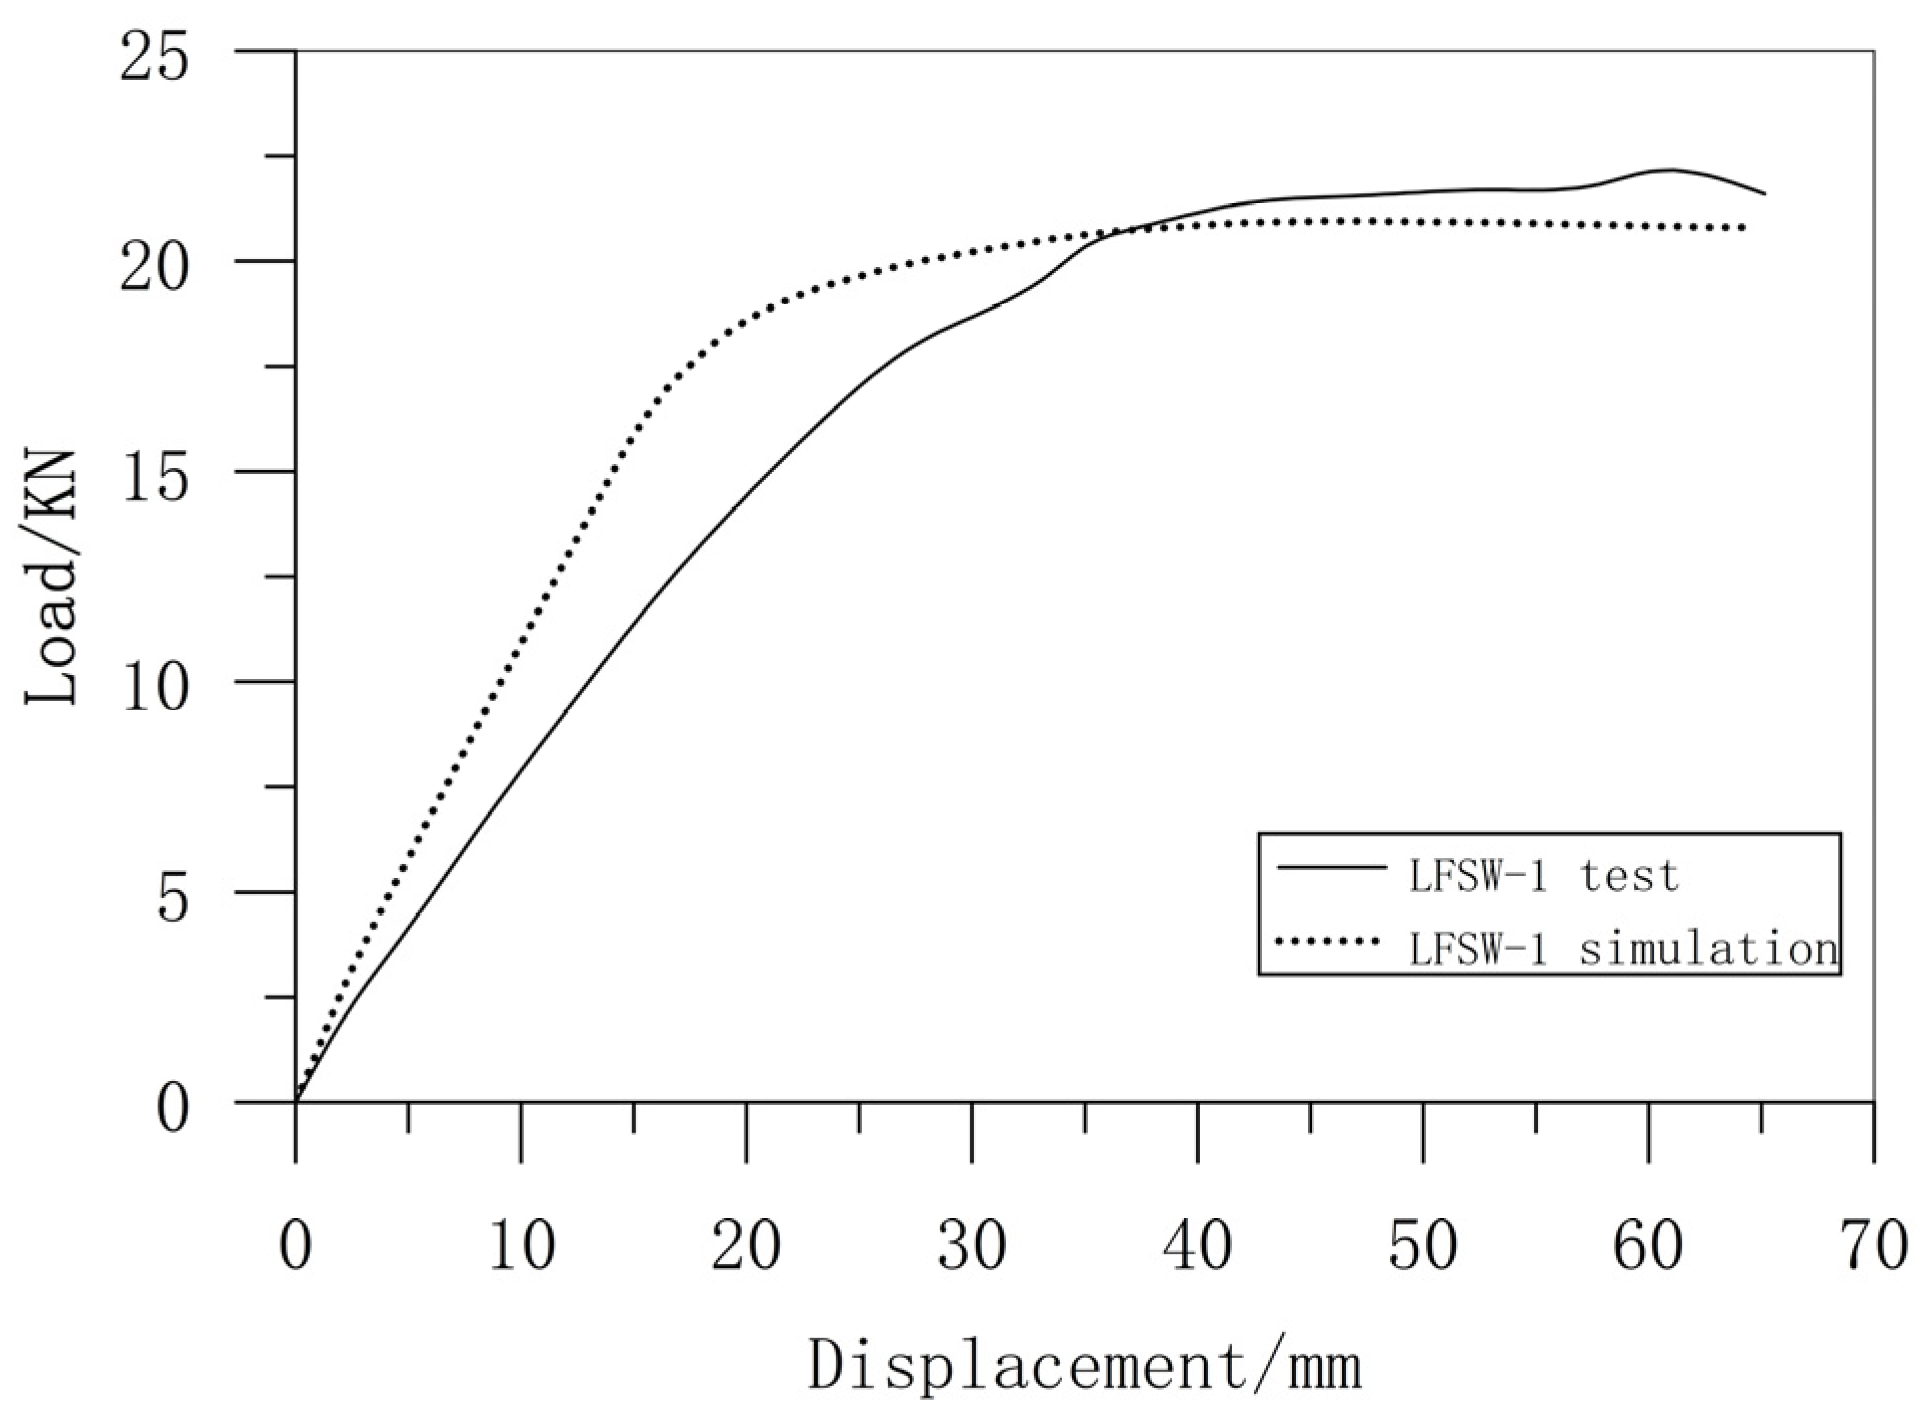
Figure 20 presents the comparative load-displacement curves obtained from both finite element simulation and experimental testing for specimen LFSW-1, while Table 6 provides quantitative comparisons of load, displacement, and stiffness values at cracking and peak points between simulated and tested results.
Comparative analysis of Figure 5 and Figure 15 demonstrates consistent deformation patterns in the CFS framing. Additionally, no local buckling was observed in tested framing members, confirming effective lateral restraint capacity provided by the foamed concrete. Crack propagation records revealed substantial agreement with the three characteristic stages of tensile damage shown in Figure 6: initial cracks concentrated at mid-span and loading points, progressively extending laterally along the slab with increasing load. Concurrently, concrete crushing beneath loading points and concrete arching in the mid-span region occurred during advanced loading stages, aligning with compressive damage patterns in Figure 7a. Final failure observations indicated maximum displacement at mid-span, consistent with displacement simulations in Figure 8.
The comparative analysis reveals close agreement between simulated and experimental curves for LFSW-1: cracking point simulation discrepancy of 4.00%; peak point simulation discrepancy of 5.82%. The numerical simulation exhibits satisfactory accuracy. But the finite element model exhibits notably higher initial stiffness than experimental measurements. This discrepancy primarily stems from unavoidable initial defects in actual wall panel fabrication that reduce initial structural stiffness relative to idealized simulations. Furthermore, the simulated curve demonstrates a distinct yield plateau after reaching the yield point, maintaining a horizontal trend due to the adoption of an ideal elastic–plastic constitutive model for steel that neglects post-yield hardening behavior observed in actual materials. This modeling simplification accounts for the growing deviation between simulated and experimental results in the post-yield phase.
As evidenced by data in Table 7, the simulated cracking load appears slightly conservative compared to experimental values. This underestimation results from the finite element model’s omission of fiberglass mesh reinforcement effects. Experimental observations of uniformly distributed microcracks in the pure bending section substantiate this interpretation, confirming the mesh’s contribution to enhanced cracking resistance in actual specimens.

6.3. Test Load-Displacement Curves and Key Test Data for Each Specimen

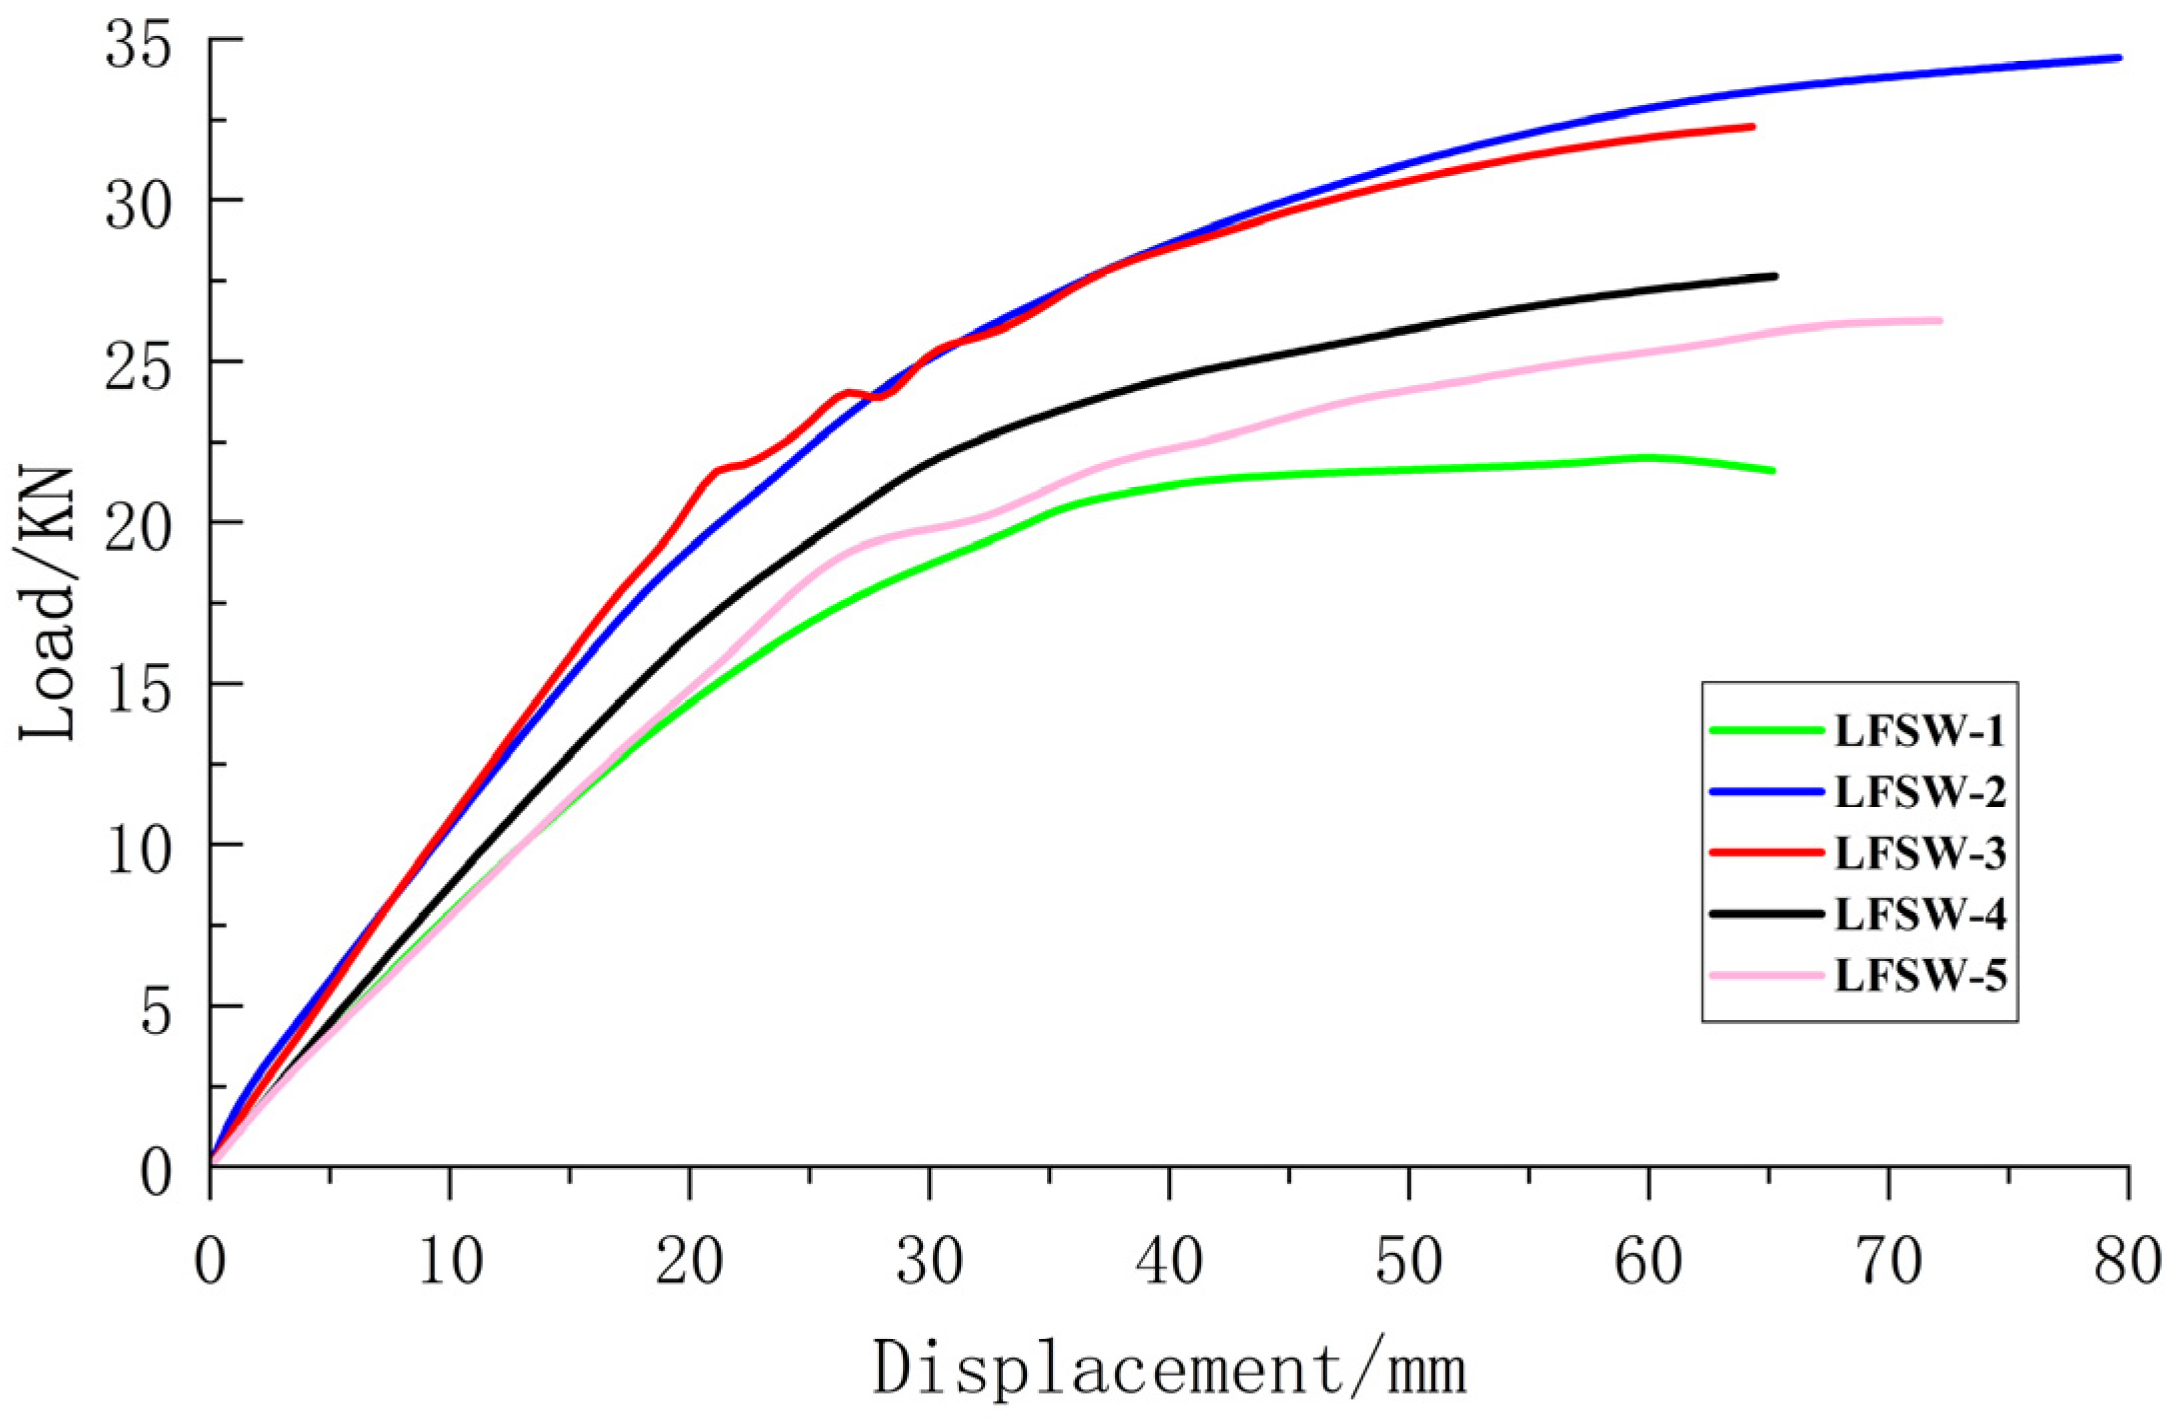
Figure 21 presents the load-displacement curves for all test specimens. All specimens exhibited similar load-displacement curve development patterns, characterized by three distinct phases: (1) a pre-yield phase with substantial load increase and steep slope, (2) a post-yield phase marked by a clear inflection point with reduced slope and stiffness, dominated by displacement growth, and (3) a failure phase where the mid-span displacement exceeded 1/50 of the span length. Notably, none of the specimens demonstrated failure characteristics such as load reduction to 85% of peak capacity or crushing-induced loss of load-bearing capability in the compressed foamed concrete region.

6.4. Bending Deformation of Test Piece

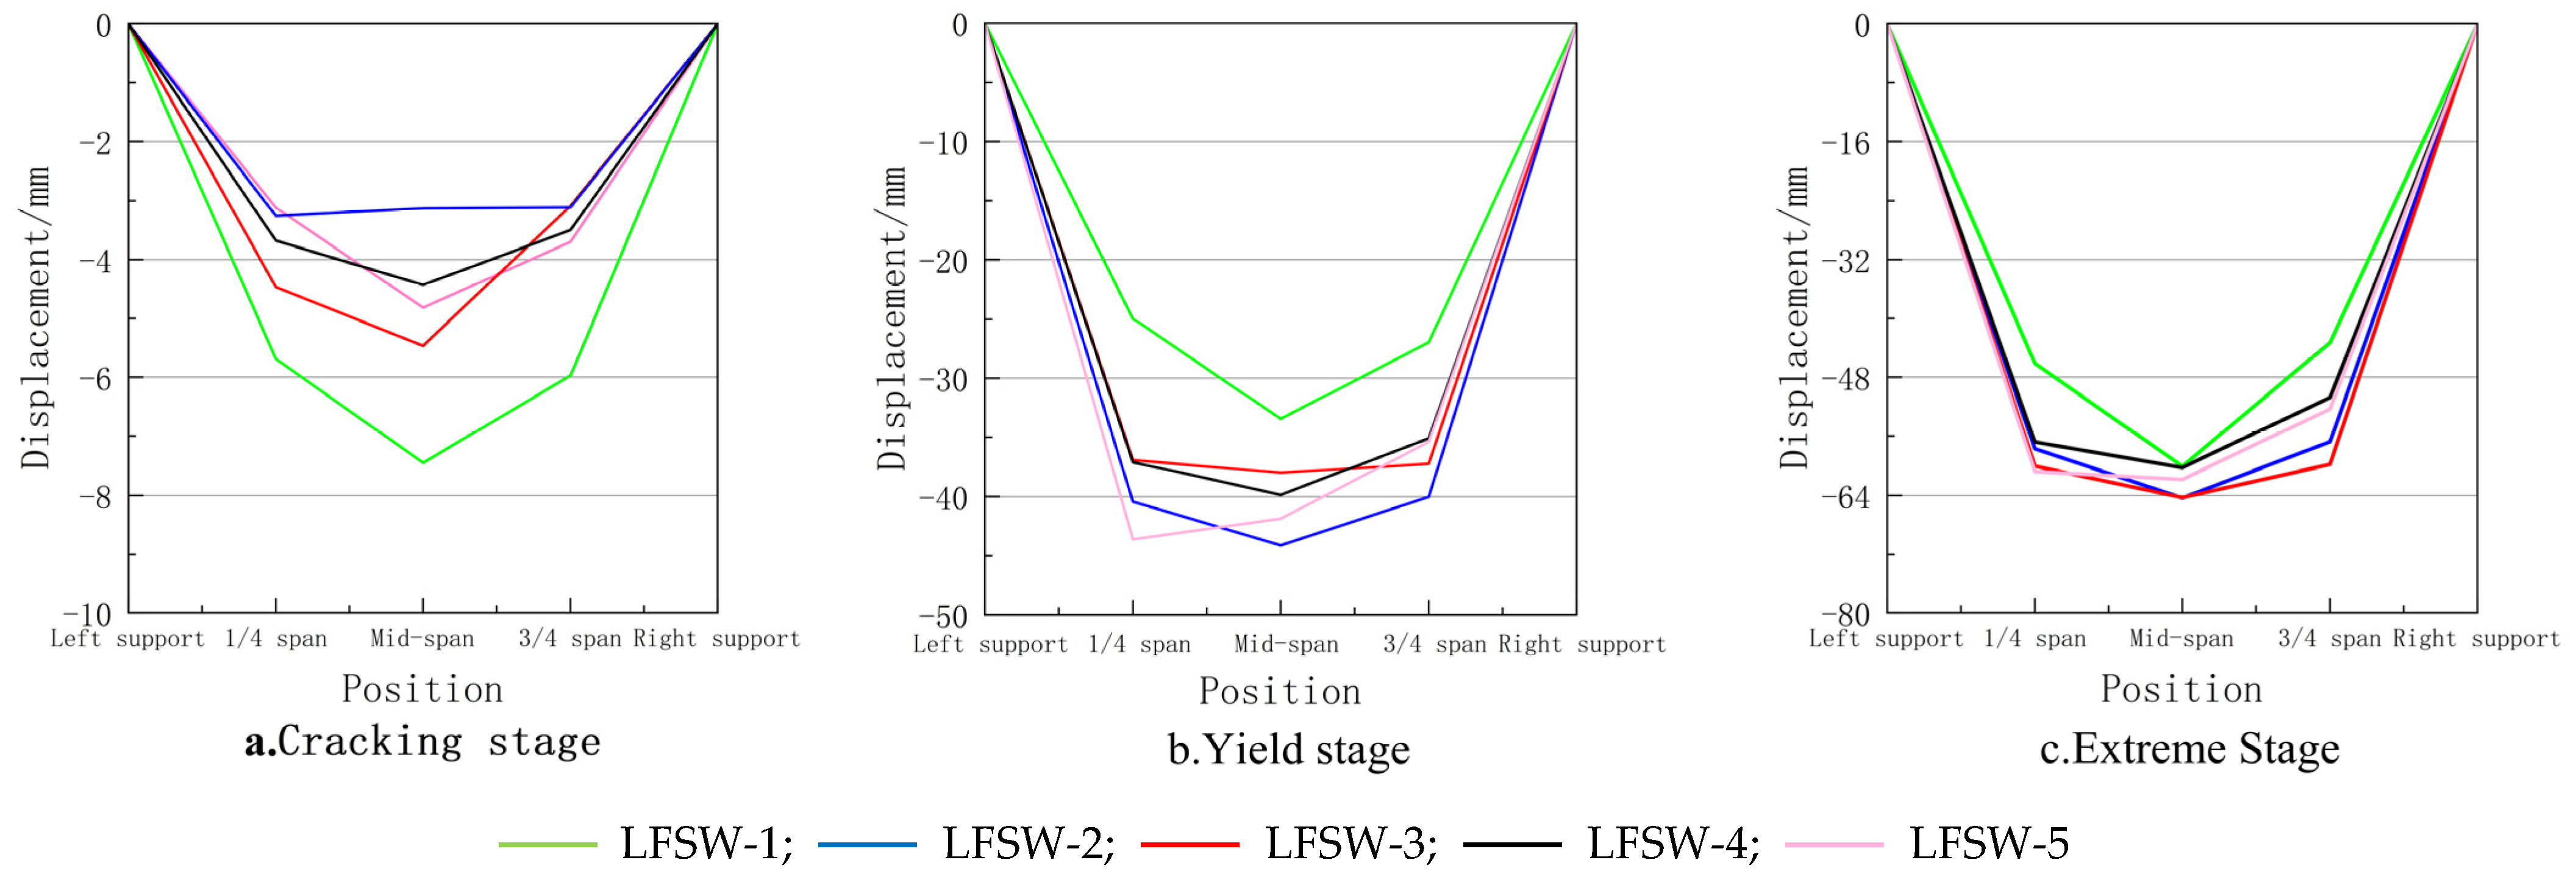
Figure 22 illustrates the bending deformation profiles along the longitudinal direction for all five specimens during cracking, yielding, and ultimate stages, exhibiting characteristic sinusoidal half-wave patterns. The maximum displacement consistently occurred at mid-span for all specimens except LFSW-5, which demonstrated unique behavior with peak displacement at quarter-span during yielding and near-equal displacements at quarter-span and mid-span at failure.
During the cracking stage, the relatively low-strength foamed concrete resulted in cracking displacements susceptible to external factors including specimen fabrication and handling processes. Nevertheless, specimens LFSW-2 (with increased framing thickness) and LFSW-4 (with enhanced concrete cover) exhibited notably smaller cracking displacements. At the yielding stage, measured deflections reached 33.44 mm, 44.11 mm, 37.99 mm, 39.86 mm, and 41.88 mm, respectively, representing 5.57–14.09 times the cracking-stage values—a quantitative demonstration of the specimens’ substantial deformation capacity and safety reserves.

6.5. Analysis of Influencing Factors

6.5.1. Strength of Foam Concrete

The test piece LFSW-2 uses compressive strength 0.5 MPa foam concrete, and the test piece LFSW-3 uses compressive strength 1 MPa foam concrete. Other test parameters are the same. The yield strength is determined using the equal energy method [52,53].
Comparative analysis of Figure 21 and Table 8 data reveals that the load mid-span displacement curves of both specimens essentially coincide. The 50% increase in cracking load with higher foamed concrete strength demonstrates improved crack resistance capacity. Conversely, the 13.9% reduction in yield displacement indicates greater interfacial slip susceptibility between foamed concrete and CFS framing under sustained loading, accelerating mid-span displacement development. Negligible differences in ultimate load and failure displacement ultimately confirm that foamed concrete strength exerts limited influence on the LFSW flexural performance.

6.5.2. CFS Framing Wall Thickness

The test piece LFSW-1 uses a 1.8 mm CFS framing wall thickness, and the test piece LFSW-3 uses a 2.5 mm framing wall thickness. The other test parameters are the same.
Analysis of Figure 21 and Table 9 data demonstrates that increased CFS framing thickness enhances specimen stiffness during the elastic phase. While both specimens exhibit comparable cracking loads, the yield and ultimate loads show significant improvements of 42.1% and 46.2%, respectively. These results confirm that greater CFS wall thickness substantially improves the LFSW post-cracking flexural performance.

6.5.3. CFS Framing Section Height

The LFSW-5 light steel keel uses CFS framing with dimensions of C80 × 40 × 15 × 2.5, while the LFSW-3 light steel keel uses CFS framing with dimensions of C100 × 40 × 20 × 2.5. All other test parameters are the same.
Through the data in Figure 21 and Table 10, it is observed that an increase in CFS framing thickness enhances the specimen’s stiffness during the elastic phase. The cracking load, yield load, and ultimate load increase by 50.0%, 23.9%, and 26.7%, respectively.

6.5.4. Protection Layer Thickness

The test piece LFSW-5 adopts a concrete cover of 25 mm, and the test piece LFSW-4 adopts a concrete cover of 35 mm. The other test parameters are the same.
Through the data in Figure 21 and Table 11, it is observed that the load mid-span displacement curves of both specimens exhibit similar trends. Increasing the concrete cover thickness raises the yield load and ultimate load by 8.4% and 7.1% compared to LFSW-5, respectively, indicating that increased concrete cover depth exerts limited influence on the flexural performance of the LFSW.
Comparative analysis clearly delineates the influence of four parameters on wall panel flexural performance and ultimate load capacity. However, unexpected mid-span displacement patterns were observed during specific loading stages, potentially attributable to three factors: (1) Unpredictable material variations during specimen fabrication causing deviations between actual and design strength of foamed concrete; (2) Undetected internal damage occurring during transportation/handling of low-strength foamed concrete specimens; (3) Potential stress concentration within the test loading apparatus.

7. Conclusions and Prospect

This study develops a low-strength foamed concrete CFS framing composite wall panel that integrates the high strength of CFS framing with the lightweight properties and superior thermal performance of foamed concrete. The system satisfies requirements for prefabricated steel structures with moderate strength demands and assembly rate criteria. Through finite element simulation and experimental analysis, the following conclusions are derived:
(1)
CFS-foamed concrete composite wall panels exhibit distinct failure characteristics at each loading stage, demonstrating typical flexural failure modes.
(2)
Comparative tests demonstrate that when LFSW framing wall thickness increased from 1.8 mm to 2.5 mm, ultimate load capacity improved by 46.15% and when section height enlarged from 80 mm to 100 mm, capacity increased by 26.67%. Foamed concrete strength enhancement from 0.5 MPa to 1.0 MPa raised wall panel cracking load by 50% while altering ultimate load capacity by less than 5%. Increasing concrete cover thickness from 25 mm to 35 mm enhanced ultimate capacity by 7%. Both parameters (foamed concrete strength and cover thickness) exert limited influence on LFSW flexural capacity. Elevating the cross-sectional height and wall thickness of steel framing effectively enhances flexural behavior and ultimate load-bearing performance of this wall panel.
(3)
The ABAQUS finite element analysis combined with experimental validation elucidate parameter influence mechanisms on flexural behavior, establishing foundations for subsequent research on flexural capacity equations, optimal panel design, and engineering implementation.
Current limitations and future research directions include the following:
(1)
While this study examined foamed concrete strength, concrete cover thickness, CFS section height, and thickness, future work should investigate additional parameters (panel width, CFS material grade, length, stiffener configuration) through FEA or experimentation on four supplementary specimens.
(2)
Experimental observations revealed significant bond degradation between low-strength foamed concrete and plastically deformed CFS framing during failure stages, causing severe concrete spalling at the base. Current FEA models show limited accuracy in ultimate failure prediction. Design optimization should address interfacial failure mechanisms to mitigate concrete spalling.

Author Contributions

Conceptualization, X.L. and K.W.; methodology, X.L. and Q.Z.; software, Q.Z. and C.L.; validation, Q.Z. and C.L.; formal analysis, data curation, writing—original draft preparation, Q.Z.; writing—review and editing, Q.Z. and X.L.; project administration, Q.Z. All authors have read and agreed to the published version of the manuscript.

Funding

This research was funded by [1. Technology Development Project of Shandong Electric Power Engineering Consulting Institute Co., Ltd.; 2. Key R&D Program of Shandong Province; 3. Technology-based SMEs Innovation Capacity Enhancement Project of Shandong Province] grant number [1. 37-2024-21-K0012; 2. 2018GSF122003; 3. 2022TSGC2144] And The APC was funded by [Shandong Electric Power Engineering Consulting Institute Co., Ltd.].

Data Availability Statement

Data are contained within the article.

Conflicts of Interest

Authors Xinliang Liu and Kunpeng Wang were employed by the company Shandong Electric Power Engineering Consulting Institute Co., Ltd. The remaining authors declare that the research was conducted in the absence of any commercial or financial relationships that could be construed as a potential conflict of interest.

References

  1. Manfredi, V.; Santarsiero, G.; Masi, A.; Ventura, G. The High-Performance Dissipating Frame (HPDF) System for the Seismic Strengthening of RC Existing Buildings. Sustainability 2021, 13, 1864. [Google Scholar] [CrossRef]
  2. Li, B.Z.; Yao, R.M. Building energy efficiency for sustainable development in China: Challenges and opportunities. Build. Res. Inf. 2012, 40, 417–431. [Google Scholar] [CrossRef]
  3. Alkaff, S.A.; Sim, S.; Efzan, M.E. A review of underground building towards thermal energy efficiency and sustainable development. Renew. Sustain. Energy Rev. 2016, 60, 692–713. [Google Scholar] [CrossRef]
  4. Androutsopoulos, V.; Spanou, A. Energy Efficiency Actions to Uptake Energy Retrofitting Measures in Buildings. In Proceedings of the International Conference on Sustainable Synergies from Buildings to the Urban Scale (SBE), Thessaloniki, Greece, 16–19 October 2016; pp. 875–881. [Google Scholar]
  5. Lawson, P.M.; Byfield, M.P.; Popo-Ola, S.O.; Grubb, P.J. Robustness of light steel frames and modular construction. Proc. Inst. Civ. Eng. Struct. Build. 2008, 161, 3–16. [Google Scholar] [CrossRef]
  6. Yang, N.; Bai, F. Damage Analysis and Evaluation of Light Steel Structures Exposed to Wind Hazards. Appl. Sci. 2017, 7, 239. [Google Scholar] [CrossRef]
  7. Uang, C.M.; Bruneau, M. State-of-the-Art Review on Seismic Design of Steel Structures. J. Struct. Eng. 2018, 144, 03118002. [Google Scholar] [CrossRef]
  8. Zhang, J.-F.; Zhao, J.-J.; Yang, D.-Y.; Deng, E.-F.; Wang, H.; Pang, S.-Y.; Cai, L.-M.; Gao, S.-C. Mechanical-property tests on assembled-type light steel modular house. J. Constr. Steel Res. 2020, 168, 105981. [Google Scholar] [CrossRef]
  9. Tao, C.; Yun, Z.; Deng, B.F. Study on seismic behavior of double leg C-type cold-formed thin-walled steel frame. J. Constr. Steel Res. 2023, 209, 108035. [Google Scholar] [CrossRef]
  10. Shi, Y.; Gao, C.; Xu, Y.; Zeng, L.; Peng, X. Study on the shear resistance of CFS walls with built-up side columns. J. Constr. Steel Res. 2024, 213, 108435. [Google Scholar] [CrossRef]
  11. Yang, J.; Zou, J.; Yang, W. Analytical Research on the Impact Test of Light Steel Keel and Lightweight Concrete of Composite Wall. Appl. Sci. 2022, 12, 2957. [Google Scholar] [CrossRef]
  12. Wang, J.; Qiu, Z.; Liang, J. Experimental investigations on the lateral performance of foam concrete light steel keel composite wall. J. Build. Eng. 2023, 72, 106551. [Google Scholar] [CrossRef]
  13. Nithyadharan, M.; Kalyanaraman, V. Behaviour of cold-formed steel shear wall panels under monotonic and reversed cyclic loading. Thin-Walled Struct. 2012, 60, 12–23. [Google Scholar] [CrossRef]
  14. Selvaraj, S.; Madhavan, M. Investigation on sheathing effect and failure modes of gypsum sheathed cold-formed steel wall panels subjected to bending. Structures 2019, 17, 87–101. [Google Scholar] [CrossRef]
  15. Selvaraj, S.; Madhavan, M. Studies on Cold-Formed Steel Stud Panels with Gypsum Sheathing Subjected to Out-of-Plane Bending. J. Struct. Eng. 2018, 144, 04018136. [Google Scholar] [CrossRef]
  16. Selvaraj, S.; Madhavan, M. Structural behaviour and design of plywood sheathed cold-formed steel wall systems subjected to out of plane loading. J. Constr. Steel Res. 2020, 166, 105723. [Google Scholar] [CrossRef]
  17. AISIS100–16C; North American Cold-Formed Steel Specification for the Design of Cold-Formed Steel Structural Members. American Iron and Steel Institute: Washington, DC, USA, 2016.
  18. Yilmaz, F.; Becque, J.; Mojtabaei, S.M.; Hajirasouliha, I. Experimental investigation of the behaviour and capacity of sheathed cold-formed steel stud walls under inward flexural loading. Thin-Walled Struct. 2023, 192, 111048. [Google Scholar] [CrossRef]
  19. Gao, W.C.; Xiao, Y. Seismic behavior of cold-formed steel frame shear walls sheathed with ply-bamboo panels. J. Constr. Steel Res. 2017, 132, 217–229. [Google Scholar] [CrossRef]
  20. Cai, W.; Fang, H.; Qi, Y.J.; Liu, W.Q.; Zhu, X.X. Bending Performance Test of Prefabricated Light Steel Concrete External Wall Panel. Ind. Build. 2021, 51, 50–57. [Google Scholar] [CrossRef]
  21. Li, Y.M.; Zhao, D.P.; Li, K.; Wang, H. Calculation and experimental study on bending skin effect of light steel keel fireproof board composite wall. Prog. Build. Steel Struct. 2023, 25, 10–15. [Google Scholar] [CrossRef]
  22. Wu, K.K.; Qi, Y.J. Bending Performance of Light Steel Keel Aluminum Honeycomb Sandwich Plate Composite Wall Panel. J. Nanjing Univ. Technol. (Nat. Sci. Ed.) 2022, 44, 214–219. [Google Scholar]
  23. Accorti, M.; Baldassino, N.; Zandonini, R.; Scavazza, F.; Rogers, C.A. Reprint of Response of CFS Sheathed Shear Walls. Structures 2016, 8, 318–330. [Google Scholar] [CrossRef]
  24. Mowrtage, W.; Yel, N.H.; Pekmezci, B.; Atahan, H.N. Load carrying capacity enhancement of cold formed steel walls using shotcreted steel sheets. Thin-Walled Struct. 2012, 60, 145–153. [Google Scholar] [CrossRef]
  25. Ye, J.; Wang, X.; Jia, H.; Zhao, M. Cyclic performance of cold-formed steel shear walls sheathed with double-layer wallboards on both sides. Thin-Walled Struct. 2015, 92, 146–159. [Google Scholar] [CrossRef]
  26. Yilmaz, F.; Mojtabaei, S.M.; Hajirasouliha, I.; Becque, J. Behaviour and performance of OSB-sheathed cold-formed steel stud wall panels under combined vertical and seismic loading. Thin-Walled Struct. 2023, 183, 110419. [Google Scholar] [CrossRef]
  27. Zhang, W.; Mahdavian, M.; Yu, C. Lateral strength and deflection of cold-formed steel shear walls using corrugated sheathing. J. Constr. Steel Res. 2018, 148, 399–408. [Google Scholar] [CrossRef]
  28. Selvaraj, S.; Madhavan, M. Flexural Behaviour and Design of Cold-Formed Steel Wall Panels Sheathed with Particle Cement Board. J. Constr. Steel Res. 2019, 162, 105723. [Google Scholar] [CrossRef]
  29. Xie, Z.; Yan, W.; Yu, C.; Mu, T.; Song, L. Experimental investigation of cold-formed steel shear walls with self-piercing riveted connections. Thin-Walled Struct. 2018, 131, 1–15. [Google Scholar] [CrossRef]
  30. Liu, C.; Mao, X.; He, L.; Chen, X.; Yang, Y.; Yuan, J. A new demountable light-gauge steel framed wall: Flexural behavior, thermal performance and life cycle assessment. J. Build. Eng. 2022, 47, 103856. [Google Scholar] [CrossRef]
  31. Qian, Z.X.; Pan, J.L.; Zhang, L.A.; Wang, L. Study on the flexural performance of light steel keel concrete composite wall panels. Ind. Build. 2020, 50, 32–37+4. [Google Scholar] [CrossRef]
  32. DaBreo, J.; Balh, N.; Ong-Tone, C.; Rogers, C. Steel sheathed cold-formed steel framed shear walls subjected to lateral and gravity loading. Thin-Walled Struct. 2014, 74, 232–245. [Google Scholar] [CrossRef]
  33. Nan, B.; Chi, Y.; Yang, Z. Study on flexural performance of light steel keel composite wall with web openings. J. Constr. Steel Res. 2025, 228, 109376. [Google Scholar] [CrossRef]
  34. Tan, C.L.; Wan, H.Y.; Chen, A.Y. Parametric Numerical Analysis of Bending Performance of Light Steel Keel Sandwich Composite External Wall Panel. J. Taiyuan Univ. Technol. 2020, 51, 19–25. [Google Scholar] [CrossRef]
  35. Yao, B.; Fang, H.; Qian, Z.; Wang, Q.; Sun, J.; Wang, W. Experimental and Numerical Study on Axial Compression Cold-Formed Steel Composite Wall under Concentrated Loads. Buildings 2023, 13, 1232. [Google Scholar] [CrossRef]
  36. Wang, J.; Liang, J.; Hou, W.; Lu, L. Experimental investigation on the compressive behaviour of foam concrete light steel keel composite wall. J. Asian Archit. Build. Eng. 2024, 1–14. [Google Scholar] [CrossRef]
  37. Fang, H.; Qian, Z.; Yao, B.; Wang, W. Experimental studies on the mechanical behaviors of cold-formed thin-walled steel-foam concrete composite walls. Adv. Struct. Eng. 2024, 27, 1477–1489. [Google Scholar] [CrossRef]
  38. Shi, Y.; Sun, C.; Gao, C.; Liu, J.; Peng, X. Study on lateral resistance of cold-formed corrugated steel plates with lightweight foam concrete composite walls. Thin-Walled Struct. 2025, 210, 112964. [Google Scholar] [CrossRef]
  39. Yu, F.; Kuang, G.; Bu, S.; Chen, L. Flexural performance tests and numerical analysis of fabricated light-gauge steel reinforced foam concrete filled steel mesh formwork wallboards. Structures 2024, 66, 106813. [Google Scholar] [CrossRef]
  40. Amran, Y.M.; Rashid, R.S.; Hejazi, F.; Safiee, N.A.; Ali, A.A. Response of precast foamed concrete sandwich panels to flexural loading. J. Build. Eng. 2016, 7, 143–158. [Google Scholar] [CrossRef]
  41. Qiao, W.; Yan, X.; Zhu, R.; Wang, F.; Wang, D. Flexural properties of new cold -formed thin -walled steel and concrete composite slabs. J. Build. Eng. 2020, 31, 101441. [Google Scholar] [CrossRef]
  42. Liu, D.; Fu, F.; Liu, W. Structural Behavior of Composite Floor System Using Cold-Formed Thin-Walled C Steel Channel Embedded Foam Concrete. Appl. Sci. 2021, 11, 9888. [Google Scholar] [CrossRef]
  43. Liu, F.; Zhao, L.; Yuan, L.; Wu, G.; Zheng, R.; Mu, Y. Research on Flexural Performance of Basalt Fiber-Reinforced Steel-Expanded Polystyrene Foam Concrete Composite Wall Panels. Buildings 2025, 15, 285. [Google Scholar] [CrossRef]
  44. GB/T 700—2006; Carbon Structural Steel. China Standard Press: Beijing, China, 2007.
  45. Hu, X.B.; Zhang, Z.W.; Huang, J.Y.; Mao, Q.S.; Li, Q.S.; Yuan, Z.S. Research on flexural performance of light steel keel foam concrete lightweight wallboard. Prog. Build. Steel Struct. 2022, 24, 67–75. [Google Scholar] [CrossRef]
  46. Soares, N.; Santos, P.; Gervásio, H.; Costa, J.J.; da Silva, L.S. Energy efficiency and thermal performance of lightweight steel-framed (LSF) construction: A review. Renew. Sustain. Energy Rev. 2017, 78, 194–209. [Google Scholar] [CrossRef]
  47. Xiong, Y.Q. Research on the Damage Evolution Law and Damage Model of Multi Ribbed Composite Walls. Master’s Thesis, Beijing Jiaotong University, Beijing, China, 2008. [Google Scholar]
  48. GB 50009-2012; Code for Load of Building Structures. Ministry of Housing and Urban Rural Development of the People’s Republic of China: Beijing, China, 2012.
  49. JG/T 266-2011; Foam Concrete. Ministry of Housing and Urban Rural Development of the People’s Republic of China: Beijing, China, 2011.
  50. GB/T 50081-2019; Standard for Test Methods of Physical and Mechanical Properties of Concrete. Ministry of Housing and Urban Rural Development of the People’s Republic of China: Beijing, China, 2019.
  51. GB/T 50152-2012; Standard for Test Methods of Concrete Structures. Ministry of Housing and Urban Rural Development of the People’s Republic of China: Beijing, China, 2012.
  52. JG/T 544-2018; Light steel keel composite wall. Ministry of Housing and Urban Rural Development of the People’s Republic of China: Beijing, China, 2018.
  53. Feng, P.; Qiang, H.L.; Ye, L.P. Definition and Discussion of the “Yield Point” of Materials, Components, and Structures. Eng. Mech. 2017, 34, 36–46. [Google Scholar]
Figure 1. Schematic diagram of structure and section of CFS wall panel: (a) CFS framing with overlay panels; (b) CFS framing with grout-filled cavities; (c) CFS framing with foam concrete composites.
Buildings 15 03018 g001
Figure 2. Foam concrete light steel keel composite wall panel.
Buildings 15 03018 g002
Figure 3. Finite element model of lightweight steel keel lightweight concrete composite wall panel: (a) CFS framing; (b) Skeleton embedded wall panel model and loading gasket; (c) Grid division of CFS framing; (d) Grid division of foam concrete wallboard.
Buildings 15 03018 g003
Figure 4. Schematic diagram of constrained wall panel.
Buildings 15 03018 g004
Figure 5. Stress distribution of foam concrete and light steel keel frame members: (a) Foamed concrete; (b) CFS framing skeleton.
Buildings 15 03018 g005
Figure 6. Three typical stages of contour plot of DAMAGET.
Buildings 15 03018 g006
Figure 7. Contour plot of DAMAGEC and DAMAGET to wall panels: (a) Contour plot of DAMAGEC; (b) Contour plot of DAMAGET.
Buildings 15 03018 g007
Figure 8. Contour plot of U.
Buildings 15 03018 g008
Figure 9. Simulated load mid-span displacement curve.
Buildings 15 03018 g009
Figure 10. Specimen fabrication sequence: (a) CFS framing welding; (b) Placing the framing skeleton into the mold; (c) Foamed concrete pouring; (d) Curing process.
Buildings 15 03018 g010
Figure 11. Material performance experiment: (a) Concrete material properties experiment; (b) Steel material properties experiment.
Buildings 15 03018 g011
Figure 12. Schematic diagram of experimental loading.
Buildings 15 03018 g012
Figure 13. On-site test device diagram.
Buildings 15 03018 g013
Figure 14. Typical failure state diagram of specimen: (a) Crack state diagram of test piece; (b) Yield state diagram of specimen; (c) Failure state diagram of test piece.
Buildings 15 03018 g014
Figure 15. Light steel keel skeleton after destruction.
Buildings 15 03018 g015
Figure 16. Failure mode of LFSW-2 specimen: (a) Shear-span diagonal crack; (b) Transverse crack running through the side of the slab; (c) Arch at the top of the mid-span; (d) Specimen failure as a whole.
Buildings 15 03018 g016
Figure 17. Failure mode of LFSW-3 specimen: (a) Continuous oblique crack on the board side; (b) Transverse through crack at the bottom of the board side; (c) A crack runs through the top of the board side; (d) The specimen is damaged as a whole.
Buildings 15 03018 g017
Figure 18. Failure mode of LFSW-4 specimen: (a) Vertical cracks on the board side rise; (b) Transverse cracks running through the side of the board; (c) Plate top compression failure; (d) The specimen is damaged as a whole.
Buildings 15 03018 g018aBuildings 15 03018 g018b
Figure 19. Failure mode of LFSW-5 test piece: (a) Vertical crack propagation in the board; (b) Lateral cracks on the side of the board; (c) Widening of cracks at the bottom of the board side; (d) The specimen is damaged as a whole.
Buildings 15 03018 g019
Figure 20. Simulation and test load-displacement curve of LFSW-1 test piece.
Buildings 15 03018 g020
Figure 21. Vertical load mid-span displacement curve of member.
Buildings 15 03018 g021
Figure 22. Vertical deflection curves of specimens at different stages.
Buildings 15 03018 g022
Table 1. Comparative analysis of typical performance characteristics for CFS framing composite wall panels.
Wall Panel TypeWeight Range Per Unit Area (kg/m2)Key Technical FeaturesThermal BridgeConstruction Method
CFS framing with overlay panels30–60CFS framing with screw-connected cladding panels (cement fiber/gypsum boards, etc.) and cavity insulationSignificantDry construction
CFS framing with grout-filled
cavities
70–120CFS framing with cladding panels and screw-connected on-site grouting (concrete/mortar)ModerateSemi-wet/semi-dry construction
CFS framing with foam concrete composites90–160CFS framing with factory-precast lightweight concreteLowDry construction
Traditional reinforced concrete enclosure wall panel410–450Steel reinforcement with cast-in-place ordinary concreteLowSemi-wet/semi-dry construction
Table 2. Material attribute settings.
MaterialTensile Strength (MPa)Compressive Strength (MPa)Elastic Modulus (MPa)Poisson’s Ratio
Foamed concrete0.0850.855000.2
C-shaped steel3103102.06 × 1050.3
Table 3. Selection and calculation results of wind load calculation parameters.
Height Above Ground/mPressure Height CoefficientGust CoefficientWind Load Standard Value/KN/m2
ω 0 = 0.45 ω 0 = 0.60 ω 0
101.001.701.221.631.90
201.231.631.441.922.25
301.391.591.592.122.48
401.521.571.722.292.67
501.621.551.812.412.81
601.711.541.902.532.95
701.791.521.962.613.05
801.871.512.032.713.16
901.931.502.082.783.24
1002.001.502.162.883.36
Table 4. Design parameters of wallboard specimen.
Test Piece NumberDimensions of C-Shaped Steel/mmProtection Layer Thickness/mmStrength of Foam Concrete/MPa
LFSW-1C100 × 40 × 20 × 1.8251.0
LFSW-2C100 × 40 × 20 × 2.5250.5
LFSW-3C100 × 40 × 20 × 2.5251.0
LFSW-4C80 × 40 × 15 × 2.5351.0
LFSW-5C80 × 40 × 15 × 2.5251.0
Table 5. Compressive strength of foamed concrete.
Test Block NumberMeasured Density/kg/m3Failure Load/kNCompressive Strength/MPaMean Value/MPa
A1.0-14957.920.790.85
A1.0-24939.420.94
A1.0-34888.280.83
A2.0-150614.121.41.48
A2.0-251616.911.69
A2.0-352613.441.34
Table 6. Material property test results of light steel keel.
Specimen NumberYield Strength (MPa)Mean Value (MPa)Tensile Strength (MPa)Mean Value (MPa)
F-1219.4221.3310.4312.2
F-2220.6311.8
Y-1223.7314.2
Y-2221.5312.4
Table 7. Comparison of simulated and experimental values of specimen LFSW-1.
Test PieceTypeCracked NodePeak Node
Load
/KN
Displacement
/mm
Stiffness
/kN/mm
Load
/KN
Displacement
/mm
Stiffness
/kN/mm
LFSW-1Test6.007.450.8122.1360.080.37
Simulate5.764.951.1620.8460.230.35
Table 8. Influence results of foam concrete.
ParameterLFSW-2LFSW-3
Strength of foam concrete/MPa0.51.0
Cracking stateLoad/KN4.06.0
Displacement/mm3.135.46
Yielding stateLoad/KN29.828.0
Displacement/mm44.1137.99
Limit stateLoad/KN33.432.3
Displacement/mm64.3564.30
Elastic stiffness1.281.10
Table 9. Influence results of CFS framing wall thickness.
ParameterLFSW-1LFSW-3
CFS framing wall thickness/mm1.82.5
Cracking stateLoad/KN6.06.0
Displacement/mm7.455.46
Yielding stateLoad/KN19.728.0
Displacement/mm33.4437.99
Limit stateLoad/KN22.132.3
Displacement/mm60.0864.30
Elastic stiffness0.811.10
Table 10. Influence results of CFS framing section height.
ParameterLFSW-5LFSW-3
CFS framing section height/mm80100
Cracking stateLoad/KN4.06.0
Displacement/mm4.825.46
Yielding stateLoad/KN22.628.0
Displacement/mm41.8837.99
Displacement/mm61.8564.30
Elastic stiffness0.831.10
Table 11. Influence results of concrete cover.
ParameterLFSW-5LFSW-4
Concrete cover/mm2535
Cracking stateLoad/KN4.04.0
Displacement/mm4.824.43
Yielding stateLoad/KN22.624.5
Displacement/mm41.8839.86
Limit stateLoad/KN25.527.3
Displacement/mm61.8560.26
Elastic stiffness0.830.90
Disclaimer/Publisher’s Note: The statements, opinions and data contained in all publications are solely those of the individual author(s) and contributor(s) and not of MDPI and/or the editor(s). MDPI and/or the editor(s) disclaim responsibility for any injury to people or property resulting from any ideas, methods, instructions or products referred to in the content.