Abstract
In order to explore new wall panel materials and structural systems suitable for prefabricated buildings, this study proposes a polypropylene fiber-reinforced concrete sandwich wall panel (PFRC sandwich wall panel) and a polypropylene fiber-reinforced concrete sandwich wall panel with glass fiber grid (G-PFRC sandwich wall panel). A comparative investigation was conducted using finite element analysis to numerically simulate the mechanical response of these composite wall panels under impact loads. The simulation results were compared with those of an unreinforced concrete sandwich wall panel with glass fiber grid (G-UC sandwich wall panel). Key findings include: (1) Compared with the G-UC sandwich wall panel, the G-PFRC sandwich wall panel exhibited 19.3% lower peak deformation and 23.7% reduced residual deformation; (2) Relative to the standard PFRC sandwich wall panel, the G-PFRC sandwich wall panel demonstrated 16.5% smaller peak deformation and 27.9% less residual deformation under impact loads; (3) Damage analysis revealed that the G-PFRC sandwich wall panel developed fewer cracks with lower damage severity compared to both the PFRC and G-UC sandwich wall panels. Parametric studies further indicated that the G-PFRC sandwich wall panel maintains superior deformation resistance and impact performance across varying impact heights and impact masses. The synergistic combination of polypropylene fiber with a glass fiber grid significantly enhances the impact resistance of composite sandwich panels, providing valuable theoretical insights for engineering applications of these novel wall systems in prefabricated construction.
1. Introduction
The prefabricated concrete composite sandwich wall panel represents a new type of energy-saving wall panel that combines assembly construction with low energy consumption, which conforms to the “green and low-carbon” concept and holds broad application prospects in the field of prefabricated buildings [1,2]. The inner and outer concrete slabs on both sides of traditional sandwich wall panels are typically made of ordinary concrete materials, which exhibit deficiencies such as low tensile strength, susceptibility to cracking, and high brittleness [3,4]. To improve ductility, steel mesh is usually incorporated into traditional concrete sandwich wall panels. However, this practice involves cumbersome manual binding and installation positioning [5], increasing labor costs and construction time for non-load-bearing sandwich wall panels used in enclosure structures. To reduce labor costs and enhance construction efficiency, this study considers the reinforcing influence of polypropylene fiber on the mechanical properties and deformation capacity of concrete, along with its advantages of light weight, corrosion resistance, and low cost [6,7,8]. Polypropylene fiber concrete is introduced into prefabricated composite sandwich wall panels, replacing steel mesh to ensure the ductility of the wall panel.
During production, transportation, construction, and final use, wall panels are frequently subjected to unexpected impacts from external objects, which may cause significant deformation and stress changes, thereby reducing the quality of the wall panels and affecting their performance across various aspects [9,10]. Therefore, in practical engineering applications, the impact resistance of wall panels is crucial, necessitating research into the impact resistance of PFRC wall panels. Current research on the impact resistance of components under the impact of high-speed or large-mass objects primarily focuses on other fields, with relatively few studies addressing concrete sandwich wall panels. However, existing research on the impact resistance of sandwich components with similar structures to concrete sandwich wall panels provides valuable references for this study.
Mazek et al. [11] utilized rigid polyurethane foam and foam aluminum as core materials to reinforce the concrete panel, forming a structure similar to a sandwich panel, and conducted an on-site blasting test. Simultaneously, a finite element model was employed for validation. The finite element results demonstrated excellent agreement with the experimental findings. The study revealed that the sandwich structure significantly enhanced the mechanical properties of concrete panels under impact loads. Sohel et al. [12] employed a drop hammer tester to investigate the impact resistance of a novel steel–concrete–steel (SCS) sandwich slab, deriving an analytical expression correlating load with indentation. A finite element model was employed to verify the test results by a parametric analysis considering concrete strength and plate thickness as variables. The proposed SCS sandwich slab exhibited superior impact resistance. Yang et al. [13] examined the impact resistance of precast light-weight concrete sandwich panel with raw fly ash (PLCSP sandwich panel) and performed numerical simulations using LS-DYNA software. The results demonstrated that PLCSP possesses remarkable impact toughness and deformation recovery capability. Additionally, a linear relationship between the residual displacement, maximum displacement of PLCSP, and impact energy was established based on numerical simulation. Hopkins et al. [14] analyzed the characteristics of concrete composite wall panels under blast loads through many simulations. Their findings showed that despite being lighter in weight, sandwich wall panels exhibited comparable performance to solid panels under blast loads, suggesting promising application prospects in both conventional structures and blast-resistant structures.
This paper proposes a new precast composite concrete wall panel based on polypropylene fiber concrete. It innovatively adds polypropylene fiber to concrete sandwich wall panels containing XPS to replace steel mesh reinforcement that requires cumbersome manual operations. Meanwhile, the study investigates the effect of combining glass fiber mesh with polypropylene fiber on the impact performance of concrete wall panels. A detailed analysis is conducted of the impact force time-history curves, displacement time-history curves, and damage distribution curves of the PFRC sandwich wall panel, the G-PFRC sandwich wall panel, and the G-UC sandwich wall panel as a control group. The results indicate that the PFRC sandwich wall panel demonstrates excellent impact deformation resistance, while glass fiber grids further enhance the impact resistance of the wall panels. A comprehensive parametric analysis of PFRC and G-PFRC sandwich wall panels was conducted to investigate the impact response of wall panels under varying impact conditions, such as impact velocity, impact mass, impact position, and different concrete plate thicknesses.
2. Establishment of Finite Element Model for Impact Performance of Wall Panels
Currently, widely used finite element analysis software for investigating the dynamic impact response of components includes ABAQUS and LS-DYNA [14,15]. Since the impact duration of impact loading varies under different conditions, there are currently multiple methods for its simulation and calculation [16]. Considering that the research object in this paper is the short-duration impact of heavy objects on concrete wall panels, with extremely short contact time, we selected the ABAQUS2022/Explicit module for analysis in order to solve the transient nonlinear problems during impact.
The PFRC and G-PFRC sandwich wall panels were dimensionally designed to establish a benchmark model for finite element analysis. To better evaluate the effect of polypropylene fiber and glass fiber grid on the performance of sandwich wall panels, an unreinforced concrete sandwich wall panel with glass fiber grid (G-UC sandwich wall panel) was utilized as a control group. These wall panels share identical dimensions and internal structures with the G-PFRC sandwich wall panel.
The sandwich wall panel uses connectors passing through the middle insulation layer to connect the inner and outer concrete slabs into a unified three-layer structure [17]. Connectors play a critical role in ensuring reliable connections between the inner and outer sides of the sandwich wall panel. Distributed in a truss-type configuration within the wall panel, connectors ensure coordinated force application between the inner and outer slabs, thereby achieving a combined effect [18]. Greater connector stiffness enhances the integration of the wall panel. Therefore, this study selects stainless steel truss connectors, which effectively distribute and balance structural loads through the coordinated action of chords and webs, ensuring the combined effect and overall stability of the sandwich wall panel. The stainless steel connector system has been extensively applied in Europe [19,20].
The internal structure of the PFRC sandwich wall panel is illustrated in Figure 1. Its dimensions are designed as 4000 mm × 3000 mm × 150 mm, based on the overall panel size. Specifically, the panel width is 4000 mm, the height is 3000 mm, and the thickness of both the inner and outer concrete slabs is 50 mm. The insulation layer consists of a 50 mm thick XPS (extruded polystyrene foam) board, leading to a total thickness of 150 mm. The distance between the steel truss connector and the edge of the wall panel is 250 mm, with an arrangement spacing of 500 mm between adjacent steel trusses. Figure 2 provides a detailed view of the steel truss connector, which measures 2800 mm in length and comprises seven bands, each 400 mm long. The anchoring depth is set at 25 mm. Additionally, 20 mm thick concrete edge sealing is applied at both ends of the wall panel’s height to protect the insulation layer. The internal layouts of G-PFRC and G-UC sandwich wall panels are depicted in Figure 3. The dimension of the glass fiber grid is 3900 mm × 2900 mm, with a single mesh size of 25.4 mm × 25.4 mm. The embedding depth from the inner and outer surfaces of the concrete slab is 20 mm. Apart from the glass fiber grid, all wall panels share identical dimensions and internal structures. The three-dimensional schematic diagram of sandwich wall panels in Figure 4 visually demonstrates its internal structure.
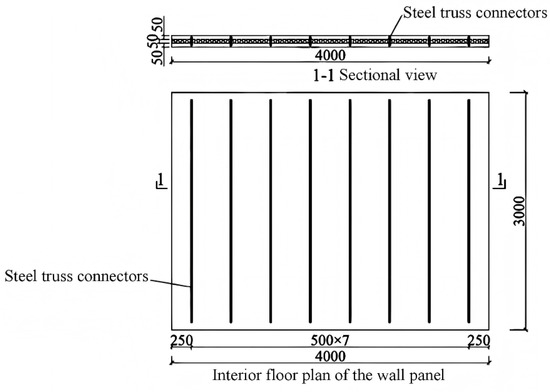
Figure 1.
Internal structure diagram of PFRC sandwich wall panel.
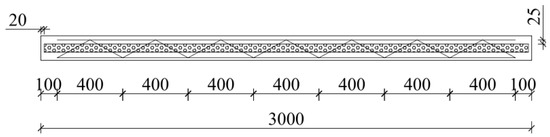
Figure 2.
Detailed layout of steel truss connector.
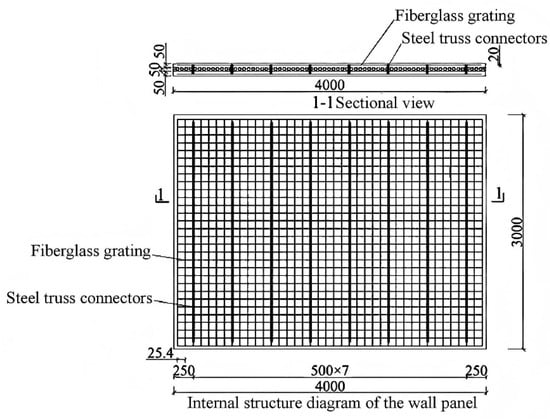
Figure 3.
Internal structure diagram of G-PFRC and G-UC sandwich wall panel.
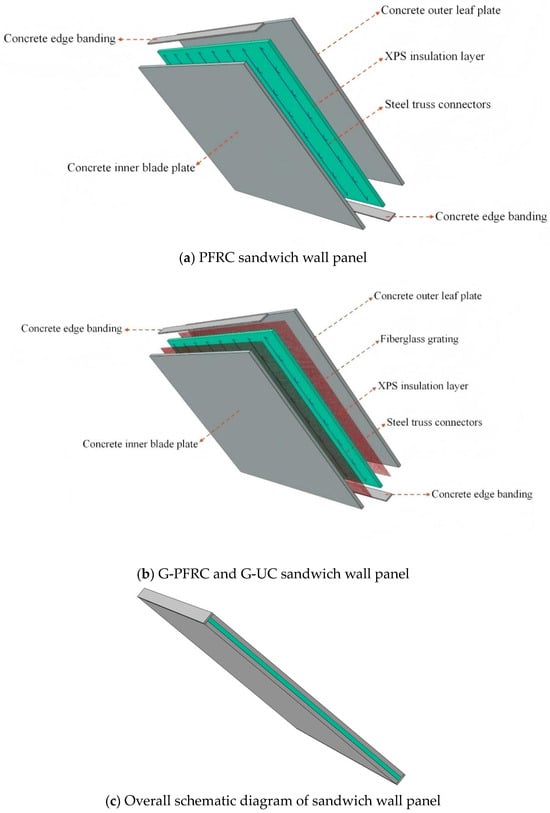
Figure 4.
Three-dimensional diagram of sandwich wall panel.
2.1. Constitutive Relationship of Materials
2.1.1. Constitutive Relationship of Concrete
ABAQUS2022 offers users three constitutive models for describing the mechanical behavior of concrete: the Model of Concrete Damage Plasticity (CDP), the Model of Concrete Smeared Cracking (CSC), and the Model of Concrete Brittle Cracking (CBC) [21,22,23,24]. By defining parameters such as Poisson’s ratio, elastic modulus, yield stress, inelastic strain, and softening parameter, the CDP model can comprehensively capture the stress–strain curve, encompassing the elastic, plastic, softening, and failure stages. The CDP model overcomes the limitations of the CSC model, which only simulates macroscopic cracks through stiffness reduction, and the CBC model, which is only applicable to ideal brittle fracture while ignoring plastic deformation. It achieves this by independently defining tensile damage and compressive damage variables to, respectively, describe the propagation of concrete micro-cracks and crushing behavior. The CDP model can better simulate the absorption of external energy and its conversion to internal energy through material plastic deformation, quantitatively reflect stiffness degradation through damage variables, and simulate the process of structural transition from elastic to failure states. Consequently, the CDP model was chosen to explain the constitutive relationship of concrete.
According to previous tests, the optimal mechanical properties of polypropylene fiber concrete are achieved when the volume content of crude fibers and fiber length are 1% and 30 mm, respectively. Therefore, the mechanical property test results of polypropylene fiber concrete with this mix ratio, along with those of plain concrete, serve as the basis for the concrete constitutive relationship in finite element analysis. Combined with the tensile constitutive relationship equation for concrete proposed by Guo Zhenhai and the influence function of the characteristic value of polypropylene fiber on the control index of the tensile stress–strain curve of concrete given by Liang et al. [25,26], the tensile constitutive relationship curves of polypropylene fiber concrete and ordinary concrete used in this study were determined. The constitutive relationship curve of concrete CDP in ABAQUS2022 is presented in Figure 5.
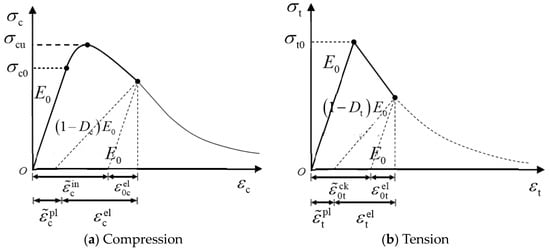
Figure 5.
Constitutive relationship curve of concrete CDP in ABAQUS2022.
In the plastic stage of concrete, appropriate plastic parameters must be defined, including expansion angle ψ, eccentricity ratio e, the ratio of biaxial compressive strength to uniaxial compressive strength fb0/fc0, shape parameter Kc, and viscosity coefficient μ. The expansion angle is a critical parameter of the plastic potential function of concrete, directly affecting its constraint effect. Typically, the expansion angle ranges from 15° to 45° but should not exceed the friction angle. Considering the constraint effect of fibers on the matrix, changes in fiber content may alter the expansion angle. In this study, an expansion angle of 36° [27] was adopted to more accurately reflect the influence of fibers on concrete performance. Furthermore, the viscosity coefficient μ significantly affects calculation speed and accuracy. For quasi-static analysis, μ = 0.0005 balances both calculation speed and accuracy effectively. Specific parameter values are presented in Table 1.

Table 1.
The value of concrete plastic parameters.
In the CDP model, the corresponding damage factor d needs to be input. According to the energy equivalence principle proposed by Sidiroff [28], it can be known that:
where is the concrete stress; is the concrete elastic modulus; and is the concrete strain.
Additionally, under impact conditions, the strain rate effect of concrete must be considered. When subjected to dynamic loads, concrete exhibits increased compressive and tensile strengths. The strain rate parameters are set according to the recommended values in the European standard CEB-FIP1993 [29]:
where DIF is the dynamic magnification factor; is the dynamic compressive strength, N/mm2; is the static compressive strength, N/mm2; is the dynamic compressive strain rate, s−1; is the reference static compressive strain rate, taken as −30 × 10−6 s−1; and and are parameters taken according to the specification, which are 0.014 and 0.012, respectively.
where is the dynamic tensile strength, N/mm2; is the static tensile strength, ; is the dynamic tensile strain rate, s−1; is the reference static tensile strain rate, taken as −1 × 10⁻⁶ s−1; and and are parameters taken according to the specification, which are 0.018 and 0.0062, respectively.
2.1.2. Constitutive Relationship of Steel
Steel truss connectors are extensively utilized in engineering applications and adhere to well-established design and manufacturing standards. The upper and lower chords of the steel truss consist of CRB550 high-strength steel bars with a diameter of 5 mm. According to the specification of “Cold Rolled Ribbed Steel Bars” (GB/T 13788-2017) [30], these materials exhibit an elastic modulus of 190,000 MPa, a Poisson’s ratio of 0.3, and a yield strength of 500 MPa. Based on test data provided by the Mechanical Industry Material Quality Inspection Center through Peikko Company, the stainless steel web has an elastic modulus of 190,000 MPa, a Poisson’s ratio of 0.3, a nominal yield strength measured at 510 MPa, and a diameter of 5.5 mm. Given that the steel used in the steel truss lacks a distinct yield point, the constitutive relationship adopts an elastic–plastic constitutive model without considering the strengthening stage.
where is the stress of steel; is the elastic modulus of steel; is the strain of steel; is the yield strain of steel; and is the yield strength.
The strain rate effect significantly influences the yield strength of steel [31]. Therefore, the strain rate effect of steel must be considered when analyzing wall panels under impact loads. In this study, the impact simulation involves low-speed impact, resulting in a low strain rate of steel. The Cowper–Symonds mechanical model is employed:
where represents the yield strength of steel at strain rate ; represents the yield strength of steel under static conditions; and C and P are constants related to the material type. For steel, C is generally taken as 40.4 s−1, and P is taken as 5.
2.1.3. Constitutive Relationship of Glass Fiber Grid
The glass fiber grid used in this study is GGA5050, with a mesh size of 25.4 mm × 25.4 mm, a longitudinal and transverse fracture strength of ≥ 50 kN/m, a longitudinal and transverse fracture elongation of ≤ 3%, and an elastic modulus and Poisson’s ratio of 35 GPa and 0.25, respectively [32]. As a typical tough material, the glass fiber grid adopts an elastic constitutive model for ease of analysis and calculation [33]. The cross-sectional area of a single grid in both the longitudinal and transverse directions is 5 mm2. As a GFRP (glass fiber-reinforced plastic) material, since the tensile strength variation of the glass fiber grid at low strain rates is not obvious [34], and given the small impact load and low material strain rate in this work, the strain rate effect of the glass fiber grid is not considered. Consequently, the constitutive relationship of the glass fiber grid is depicted in Figure 6.
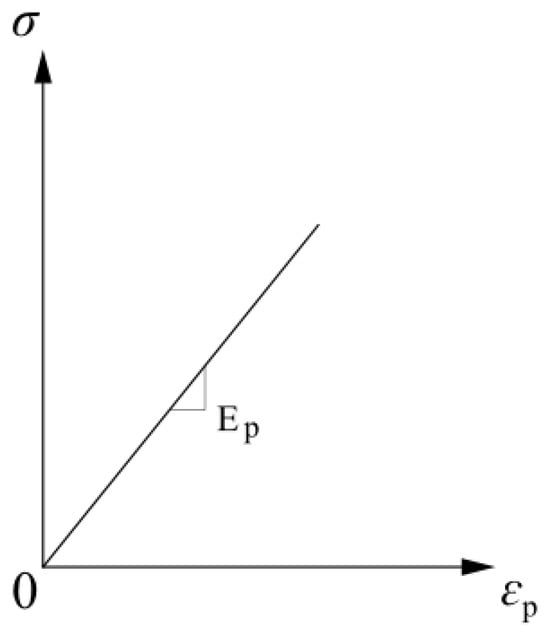
Figure 6.
Constitutive relationship of glass fiber grid.
2.1.4. Constitutive Relation of Thermal Insulation Materials
Compared with concrete, XPS board, which primarily serves a thermal insulation function, exhibits a smaller elastic modulus. According to the relevant literature, its elastic modulus is 4.66 MPa, its Poisson’s ratio is 0.05, and it is considered an elastic material [35].
It is worth noting that in ABAQUS2022, true stress and corresponding inelastic strain values are required, whereas the stress–strain curve gained from material mechanical property tests corresponds to nominal stress and nominal strain. When the material enters the strengthening stage, there is a significant discrepancy between the two. Thus, the nominal stress and nominal strain must be appropriately converted. The specific conversion formula is as follows:
where is the true stress, is the nominal stress, is the nominal strain, is the true strain, is the inelastic strain, and E is the elastic modulus.
2.2. Element Type and Meshing
The anti-impact finite element model for the wall panel established according to the aforementioned wall panel dimensions is illustrated in Figure 7. Concrete and XPS insulation boards employ the linear continuum 3-Dimensional 8-node reduced integration element (C3D8R). This element accurately simulates various materials and mechanical behaviors while maintaining stability under large deformation, nonlinear, and inelastic conditions. Mesh size significantly affects numerical simulation results. After trial calculations, the global mesh size of the model is set to 50 mm, balancing computational efficiency and accuracy. To ensure simulation accuracy, the concrete and insulation layers of the impacted portion of the wall panel are locally refined, with a mesh size of 25 mm. Additionally, to prevent inaccurate analysis results caused by the hourglass phenomenon, 4 layers of elements are divided along the thickness direction of both internal and external concrete slabs. In the simulation analysis of concrete wall panels, when the main object of analysis is the concrete slab rather than the innovative steel truss connectors, modeling the steel truss connectors with solid elements would introduce many unnecessary computational contents to the analysis of the specimen. Therefore, most researchers choose to simplify conventional steel trusses by using beam elements, and this paper adopts the same simplification approach. The steel truss utilizes a B31 beam element, which can transmit bending moments, with a mesh size of 25 mm. The glass fiber grid is simulated using a T3D2 truss element, also with a mesh size of 25 mm. Furthermore, the sizes of the support and the impact object are appropriately increased to enhance computational efficiency while ensuring simulation accuracy.
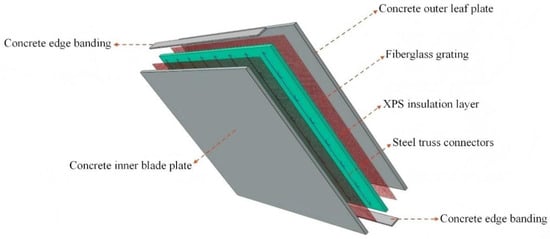
Figure 7.
Element type of sandwich wall panel finite element model.
2.3. Loads, Boundary Conditions, and Interactions
According to the wall panel impact performance test device described in the “Test Methods for Building Wallboard” (GB/T 30100-2013) [36], the boundary conditions of the wall panel are defined as shown in Figure 8. Although some current studies simulate the interaction and slip between dissimilar materials by setting relevant parameters [37], the strength of the insulation layer material involved in this paper is too weak compared to fiber-reinforced concrete. Therefore, this paper made relevant simplifications in the simulation, conducting the simulation analysis of the wall panel under relatively ideal conditions. The bond-slip effect between the insulation layer and the inner and outer concrete slabs is not considered, and the “Tie” command is used for binding. The steel truss and glass fiber grid are embedded throughout the entire wall panel model using the “Embed” command. The interaction between the support and wall panel, as well as between the impact object and the impact surface of the wall panel, is defined through surface contact. Specifically, the tangential behavior is governed by the penalty friction coefficient, while the normal behavior is defined as “hard contact”. To simplify the analysis, the impact object is treated as a rigid body, and its deformation effects are not considered. Additionally, the stress and strain induced in the support due to the transmitted impact force from the wall are negligible and can be disregarded. Therefore, the support is also modeled as a rigid body and fully constrained, with all translational and rotational degrees of freedom set to zero (i.e., U1 = U2 = U3 = UR1 = UR2 = UR3 = 0). The finite element model of the impact performance of the wall panel is demonstrated in Figure 9. The load is applied by specifying the impact object mass and assigning an initial velocity toward the wall in the initial analysis step of the predefined field. In the baseline model, the object has a mass of 120 kg and an original velocity of 6.26 m/s, which is equal to falling from a height of 2 m.
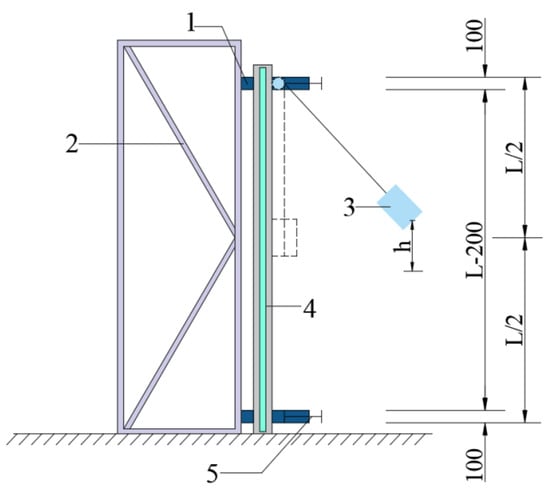
Figure 8.
Impact device diagram. Note: Explanation of the numbers in the schematic diagram of the impact device: 1-fixed beam (support); 2-fixed frame; 3-impact object; 4-wall panel specimen; and 5-beam fastening device.
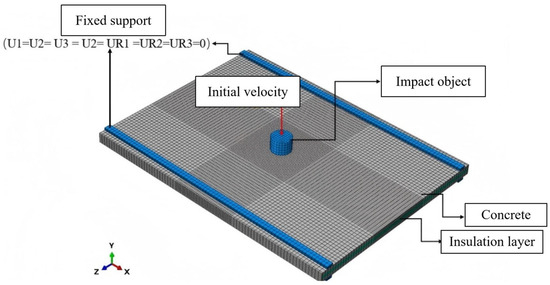
Figure 9.
Finite element model of impact performance of wall panel.
2.4. Validation of Finite Element Simulation
To validate the accuracy of the finite element model of the wall panel established in this study, the modeling method described above was employed to simulate the drop hammer impact test reported in the literature [38]. The specimen dimension is 1000 mm × 800 mm, with 2.9 mm thick steel plates installed at the top and bottom. Inside the steel plates, studs with a diameter of 5 mm and a length of 30 mm are welded at a spacing of 75 mm. The steel plates on both sides are connected by tension steel bars with a diameter of 10 mm and a spacing of 150 mm. A core concrete layer with a thickness of 75 mm is put between the steel plates. Fixed supports are arranged at the top and bottom of the wall panel to secure it in place. The impact object is a hemispherical rigid body with a diameter of 80 mm and a weight of 233.5 kg. Shell elements were used for the steel plates and stiffeners, solid elements for the concrete and drop hammer, and beam elements for the internal tie bars and studs. The mesh size was consistent with that in the literature. The dynamic friction coefficient between steel and concrete was supplemented as 0.1. Meanwhile, the material properties of concrete and steel were set using the constitutive models from the literature. The same Explicit module used in this paper was employed to simulate the dynamic response of the specimen under impact loading. The full-scale finite element model of the wall panel is demonstrated in Figure 10.
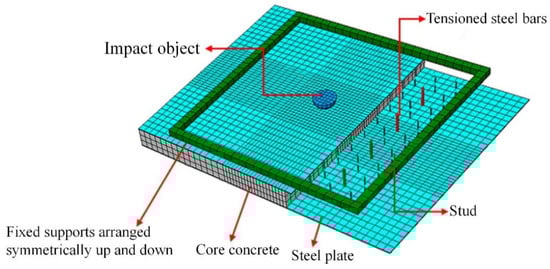
Figure 10.
Validation model of wall panel impact test.
Numerical simulations were performed on two specimens, numbered H15 and H30 in the literature [38]. For H15, the drop height was 1.5 m, resulting in a collision speed of 5.42 m/s at the critical position. For H30, the drop height was 3 m, leading to a collision speed of 7.67 m/s at the critical position. The displacement time-history curve and impact force time-history curve of the wall panel were extracted and compared with the test results reported in the literature [38], as shown in Figure 11. The results demonstrate that the finite element model established in this study accurately simulates the mechanical behavior of the wall panel under impact loads. The finite element modeling method used herein exhibits good accuracy and reliability, making it suitable for impact finite element analysis of the wall panel.
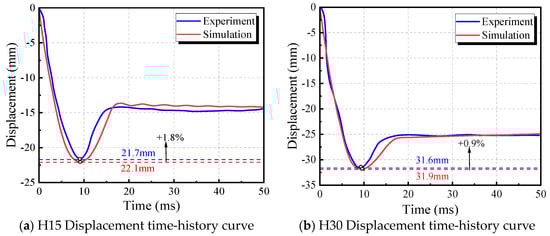
Figure 11.
Comparison of finite element results with test results.
3. Finite Element Analysis of Benchmark Wall Panel Model
The wall panel finite element model established above serves as the benchmark model for impact finite element simulation. The displacement time-history curve, impact force time-history curve, and damage distribution curve of the PFRC sandwich wall panel, G-PFRC sandwich wall panel, and G-UC sandwich wall panel (used as the control group) were analyzed.
3.1. Displacement Time-History Curve Analysis
The displacement time-history curve of the benchmark model is presented in Figure 12. By comparison, it can be found that the change trends of displacement time-history curves of all three wall panels are similar. Under the effect of the impact object, the wall panel deforms rapidly and reaches its peak value. Subsequently, the wall panel rebounds, recovering part of its elastic deformation, while oscillating at a plastic deformation level, which corresponds to residual deformation. Consequently, the displacement time-history curve of the wall panel exhibits a wavy pattern. The comparison of peak deformation and residual deformation for all three wall panels is summarized in Table 2. It is evident that the G-PFRC sandwich wall panel demonstrates smaller peak deformation and residual deformation compared to the PFRC and G-UC sandwich wall panels, showing superior resistance to impact deformation. Compared with the G-UC sandwich wall panel, the G-PFRC sandwich wall panel exhibits enhanced mechanical properties and deformation capacity due to the incorporation of polypropylene fiber concrete. This results in a 19.3% reduction in peak deformation and a 23.7% reduction in residual deformation, representing a significant improvement. Since polypropylene fibers can increase the toughness of concrete through the crack-bridging effect of fibers, G-PFRC wall panels exhibit better impact toughness and fracture energy absorption capacity compared to G-UC wall panels without polypropylene fibers. When compared with the PFRC sandwich wall panel, the G-PFRC sandwich wall panel shows a 16.5% decrease in peak deformation and a 27.9% decrease in residual deformation under impact conditions, highlighting the substantial enhancement in impact deformation resistance achieved by incorporating glass fiber grids. Among these, polypropylene fibers primarily consume impact energy through mechanisms such as interfacial debonding and fiber pull-out, which manifests macroscopically as increasing the ultimate tensile strain of concrete and delaying crack initiation and propagation. Meanwhile, the glass fiber mesh serves as a continuous reinforcing framework, providing certain rigid constraints to the concrete layer, thereby dispersing impact stress to a larger area to reduce the overall impact deformation of the concrete layer. Overall, the combination of polypropylene fiber concrete and glass fiber grids significantly enhances the composite sandwich wall panels’ ability to resist impact deformation.
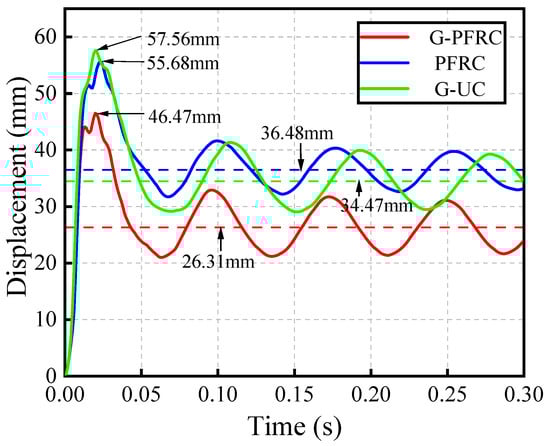
Figure 12.
The displacement time-history curve of wall panel.
Table 2.
Peak displacement and residual displacement of wall panel.
3.2. Impact Force Time-History Curve Analysis
The impact force time-history curves of all three wall panels are illustrated in Figure 13. The changes in these curves exhibit certain similarities among the three wall panels. First, the duration of impact force is approximately the same for all three wall panels, with the impact force decreasing to zero near 0.04 s. Secondly, both main peaks and secondary peaks are presented in the impact force curve. The main peak is larger and has a shorter duration, while the secondary peak is much smaller than the main peak but has a longer duration. The main peak occurs when the impact object initially contacts the surface of the wall panel. At this time, most of the kinetic energy of the impact object is transferred to the wall panel, causing its velocity to decrease rapidly. Following this, due to the reduced contact area between the impact object and the wall panel, the impact force decreases sharply. During this phase, the wall panel and impact object move in the same direction, but the wall panel’s velocity remains lower than that of the impact object. As a result, multiple contacts occur between the impact object and the wall panel, leading to the secondary peak in impact force. Finally, as the impact object separates from the wall panel, the impact force diminishes to zero.
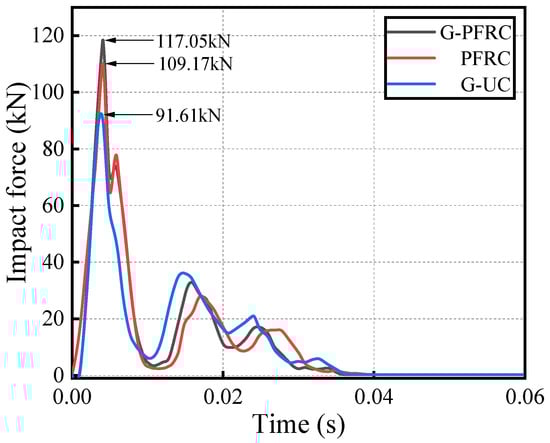
Figure 13.
The impact force time-history curve of wall panel.
From Figure 13, it can also be observed that the peak impact forces of the G-PFRC and PFRC sandwich panels are relatively close, but both are greater than that of the G-UC sandwich panel. The magnitude of the peak impact force has a close relation to the mechanical properties of concrete. At the optimal volumetric content and length of coarse fibers, the overall mechanical properties of polypropylene fiber concrete are significantly enhanced compared to ordinary concrete, resulting in a higher peak impact force for the PFRC wall panel compared to the ordinary concrete sandwich wall panel [39,40].
3.3. Damage Distribution Analysis
The damage cloud map of the wall panel reflects its crack development under impact loads. The damage cloud maps of all three wall panels were extracted for analysis, as shown in Figure 14. By observing the damage cloud maps, it can be found that all three panels share a common feature: the centers of both the surface and bottom of the wall panel are the most severely damaged areas, with an obvious local depression occurring at the impact position. The damage on the wall panel surface spreads in a ring shape around the impact point, while the bottom exhibits radial damage. Meanwhile, the boundary conditions of the wall panel and its weak stiffness at the mid-span position make the wall panel prone to overall bending deformation around the weak axis, thus generating more transverse damage cracks. Because of the remarkable mechanical properties of polypropylene fiber concrete, the overall deformation and local deformation of the G-PFRC sandwich wall panel are smaller than those of the G-UC sandwich wall panel. The damage of the G-UC sandwich wall panel is significantly more severe than that of the G-PFRC sandwich wall panel, resulting in a large number of transverse cracks. Additionally, it can be observed that the number of cracks in the G-PFRC sandwich wall panel is less than that in the PFRC sandwich wall panel, because the incorporation of glass fiber grids reduces the overall deformation of the G-PFRC sandwich wall panel. However, the local deformation range and damage degree at the center of both wall panels do not change significantly due to the incorporation of glass fiber grids.
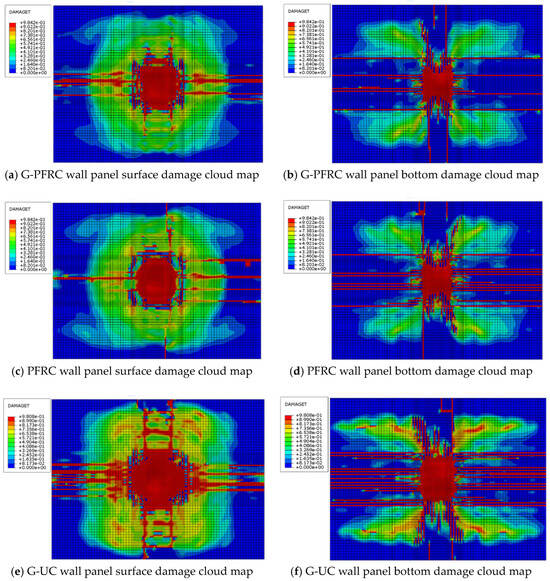
Figure 14.
Damage cloud map of wall panels.
4. Analysis of Impact Performance Parameters of Wall Panel
To further investigate the dynamic responses of PFRC and G-PFRC sandwich panels under impact loads, the model material and boundary conditions were kept constant, and the influence of parameters such as impact energy, impact mass, concrete slab thickness, and impact position on the impact performance of the wall panel was studied. The impact object mass in the parameter analysis was set to 30 kg, consistent with the mass specified in the standard “Test Methods for Building Wallboard” (GB/T 30100-2013) [36].
4.1. Impact Response of Wall Panel at Different Impact Heights
To analyze the effects of varying impact energies on the impact effect of the wall panel under the condition of same impact object mass, the impact object was given a velocity equivalent to that obtained from free fall at heights of 0.5, 1.5, 2.5, and 3.5 m, corresponding to velocities of 3.13, 5.42, 7.00, and 8.28 m/s, respectively, as presented in Table 3.
Table 3.
The velocity corresponding to different impact heights.
The mid-span displacement time-history curves of the PFRC and G-PFRC sandwich wall panels under different impact heights are presented in Figure 15. It can be found that as the impact height increases, the peak deformation and residual deformation of both wall panels after impact loads gradually increase. However, due to the incorporation of glass fiber grids in the G-PFRC sandwich wall panel, its peak deformation and residual deformation are smaller, though the difference between the two types of panels is not significant. This is because, despite the enhancement in impact energy with increasing impact height, the relatively smaller impact object mass does not cause substantial deformation of the wall panel. This also demonstrates that the incorporation of glass fiber grids enhances the wall panel’s resistance to impact deformation. The trend of peak deformation and residual deformation of the wall panel with respect to impact height is illustrated in Figure 16. It can be seen from the figure that with the increase in impact height, the peak deformation and residual deformation of the wall panel increase approximately linearly.
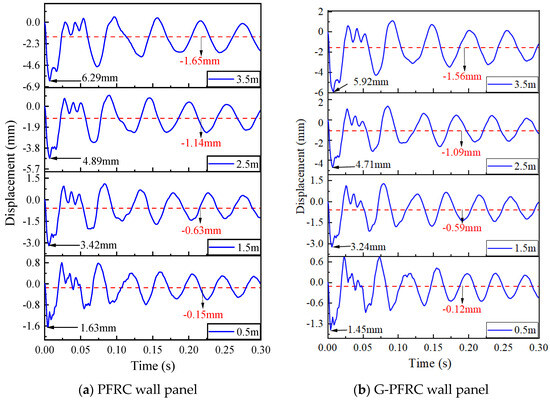
Figure 15.
Displacement time-history curve of wall panel under different impact heights.
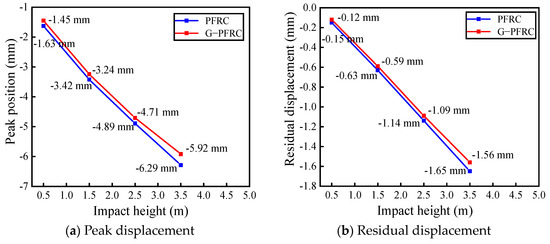
Figure 16.
Change in peak displacement and residual displacement of wall panel with impact height.
The impact force time-history curves of the PFRC and G-PFRC sandwich wall panels are depicted in Figure 17. From the figure, it can be seen that as the impact height increases, the impact force on the wall panel gradually increases. The impact force on the G-PFRC sandwich wall panel is greater than that on the PFRC sandwich wall panel. The reason is that the incorporation of glass fiber grids reduces the deformation of the wall panel to a certain extent and strengthens the interaction between the wall panel and the impact object [41].
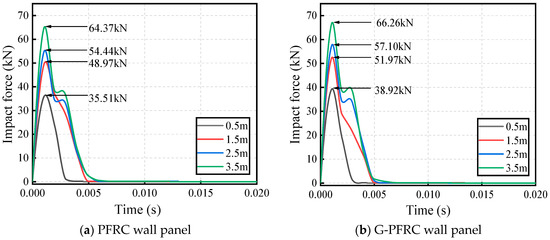
Figure 17.
Impact force time-history curve of wall panel under various impact heights.
4.2. Impact Response of Wall Panel Under Different Impact Masses
While maintaining constant impact energy, the mass of the impact object is increased to investigate its influence on the impact performance of the wall panel. When the impact energy is fixed at 441 J (equivalent to the energy of a 30 kg object falling from a height of 1.5 m) and gravitational acceleration is considered as 9.8 m/s2, the corresponding impact velocities for different impact object masses are obtained, as presented in Table 4 below.
Table 4.
Impact velocity corresponding to different masses.
The displacement time-history curves of the PFRC and G-PFRC sandwich wall panels under different impact masses are presented in Figure 18, while the change curve of peak deformation and residual deformation of both wall panels with respect to impact mass is illustrated in Figure 19. By analyzing Figure 18 and Figure 19 together, it can be observed that as the impact object mass rises, both the peak deformation and residual deformation of the wall panel after impact also increase. Moreover, the displacement of the G-PFRC sandwich wall panel is smaller than that of the PFRC sandwich wall panel, further demonstrating the reinforcing effect of glass fiber grids on the impact resistance of the wall panel.
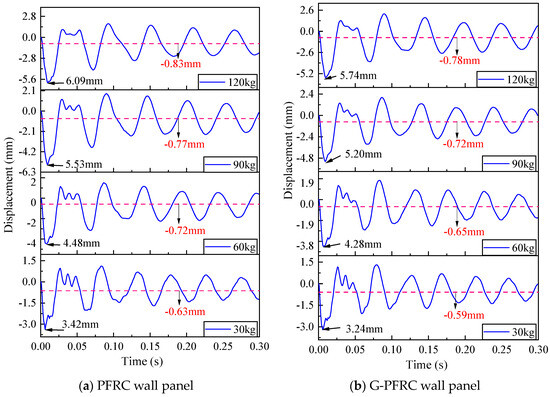
Figure 18.
Displacement time-history curve of wall panel under various impact masses.
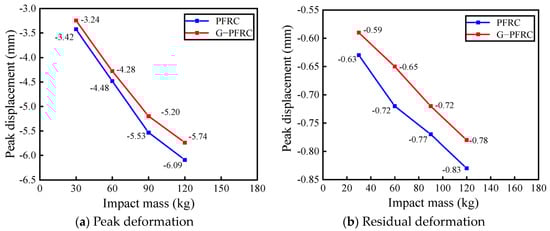
Figure 19.
Change in peak displacement and residual displacement of wall panel with impact mass.
The impact force time-history curves of the PFRC and G-PFRC sandwich wall panels under different impact masses are shown in Figure 20. By observing Figure 20, it is found that the variation in the impact force of the wall panel differs from the change in impact force under varying impact heights mentioned earlier. As the impact object mass rises, the interaction time between the impact object and the wall panel gradually lengthens, and the impact force on both wall panels initially rises and then decreases. This indicates that the magnitude of impact force on the wall panel at this point is not determined by a single factor but requires consideration of the combined effects of factors such as the mass, velocity, and contact time of the impact object with the wall panel.
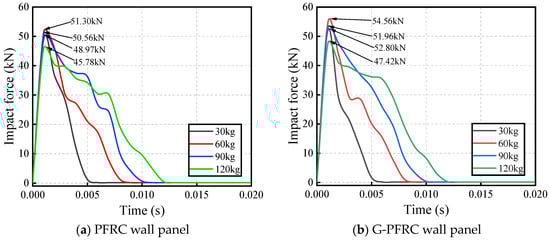
Figure 20.
Impact force time-history curve of wall panel under various impact masses.
4.3. Impact Response of Wall Panels with Different Thicknesses of Inner and Outer Concrete Slabs
To analyze the effect of varying thicknesses of inner and outer concrete slabs on the impact performance of the wall panel, the slab thickness Ct was increased to 55 mm, 60 mm, and 65 mm to establish a new wall panel finite element model for analysis. The displacement time-history curves of the G-PFRC and PFRC sandwich wall panels are shown in Figure 21. The figure demonstrates that the displacement time-history curves of the wall panel with varying thicknesses of inner and outer concrete slabs are similar. Figure 22 reflects the changes in the peak deformation and residual deformation of the wall panel under different concrete slab thicknesses. Since the increase in slab thickness enhances the overall stiffness of the wall panel, it can be found from the figure that the deformation of the wall panel during the impact process is reduced, thereby decreasing the peak deformation and residual deformation of the wall panel. From the beginning to the end, the peak deformation and residual deformation of the G-PFRC sandwich wall panel are smaller than those of the PFRC sandwich wall panel, indicating that the deformation of the G-PFRC sandwich wall panel is less pronounced.
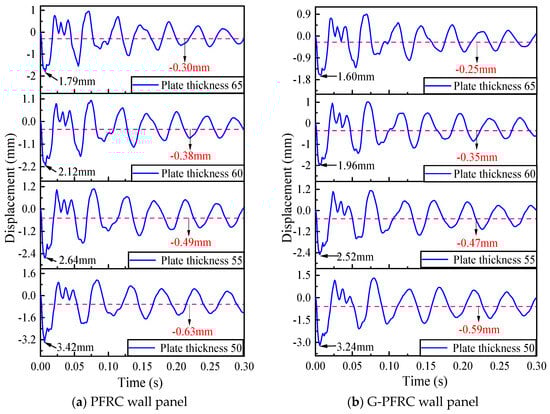
Figure 21.
Displacement time-history curve of wall panel with various concrete slab thicknesses.
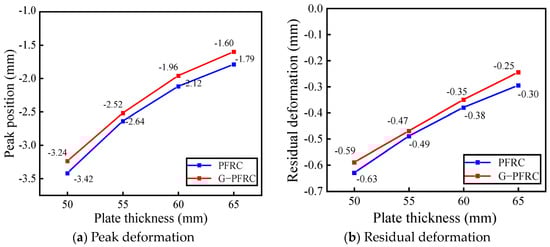
Figure 22.
Change in peak and residual displacement of wall panel with slab thickness.
The impact force time-history curves of the PFRC and G-PFRC sandwich wall panels under different concrete slab thicknesses are presented in Figure 23. It can be found that the interaction time of the impact object and the wall panel does not change significantly with increasing slab thickness, but the impact force on the wall panel gradually increases with increasing slab thickness. This is because, as the stiffness of the wall panel increases, the wall panel becomes less prone to deformation. When the impact energy remains constant, the deformation energy of the wall panel decreases, and more energy is converted into reaction force, thus increasing the impact force.
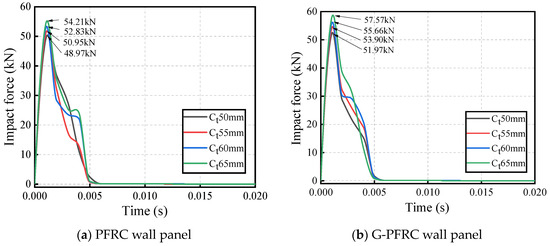
Figure 23.
Impact force time-history curve of wall panel with various concrete slab thicknesses.
4.4. Impact Response of Wall Panel at Different Impact Positions
During the transportation and use of the wall panel, the impact position is random. Hence, it is required to analyze the impact effects of various impact positions on the wall panel. The four impact point positions considered in this study are shown in Figure 24, namely the mid-span of the wall panel (impact point 1), one-quarter of the panel height (impact point 2), one-quarter of the panel width (impact point 3), and the edge of the panel width (impact point 4).
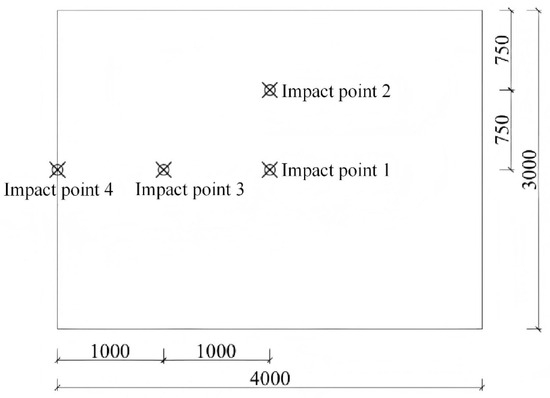
Figure 24.
Schematic diagram of impact position of wall panel.
The displacement time-history curves of both of the two wall panels located at the mid-span are presented in Figure 25. It is evident that the deformation of the wall panel varies depending on the impact position. Specifically, when impacted at the edge, relatively large peak deformation and residual deformation occur, along with a larger vibration amplitude, indicating weaker impact resistance at the edge of the wall panel. When impacted at one-quarter of the wall panel height, the deformation of the wall panel is constrained by the support due to its proximity, resulting in minimal deformation at this position. After being impacted at one-quarter of the wall panel width, the impact response of the wall panel resembles that observed under mid-span conditions, with little difference in peak deformation.
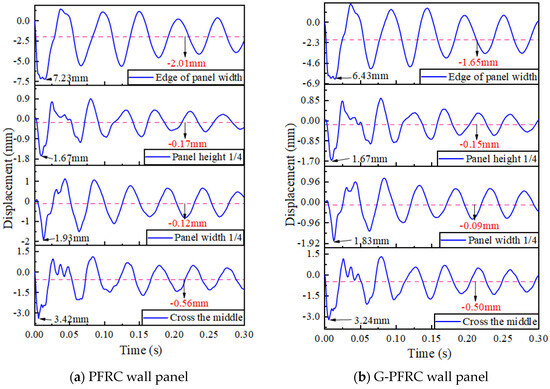
Figure 25.
Displacement time-history curve of wall panel at different impact positions.
Figure 26 illustrates the impact force time-history curves of the PFRC and G-PFRC sandwich wall panels at various impact positions. Upon comparison, it is found that the maximum impact force occurs at one-quarter of the wall panel height, attributed to the closer proximity to the support and greater stiffness compared to other positions. At the edge of the wall panel, the impact force persists for the longest duration. The larger deformation and prolonged impact force duration at the edge indicate weaker stiffness in this region. Consequently, in practical engineering applications, attention should be given to mitigating the adverse effects of impact loads at this position, and certain measures should be implemented to enhance the stiffness of the wall panel at the edge.
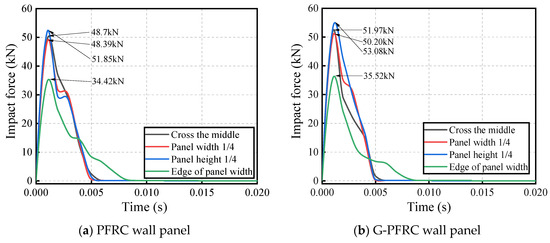
Figure 26.
Impact force time-history curve of wall panel at various impact positions.
Table 5 summarizes the influences of various parameters on the impact response of the wall panels from the previous parametric analysis, specifically including three key indicators: peak deformation, residual deformation, and impact force. The table compares the performance of two materials, PFRC and G-PFRC, under different parameter conditions. The parametric analysis primarily examined the effects of impact height from 0.5 m to 3.5 m, impact mass from 30 kg to 120 kg, concrete panel thickness from 50 mm to 65 mm, and impact locations from Point 1 to Point 4.
Table 5.
Effects of various parameters on the impact response of wall panels.
5. Conclusions
This work conducted finite element simulation analysis on the impact resistance of PFRC sandwich wall panels, G-PFRC sandwich wall panels, and G-UC sandwich wall panels as a control group. The impact force time-history curves, displacement time-history curves, and damage distribution curves of all three wall panels were compared and analyzed. The results demonstrated that the use of polypropylene fiber concrete and glass fiber grids reduces the peak deformation, residual deformation, and damage degree of the wall panels, thereby enhancing their impact deformation resistance. Specific conclusions are as follows:
- (1)
- Among the three wall panels, the G-PFRC sandwich wall panel exhibits the best impact resistance and deformation resistance. When the impact object mass remains constant, the peak deformation, residual deformation of all three wall panels, and the impact force on the wall panels increase basically linearly with increasing impact height (impact energy). Additionally, when the impact energy remains constant, as the impact object mass rises, the peak deformation and residual deformation of all three wall panels also increase accordingly, while the impact force on the wall panel initially increases and then decreases.
- (2)
- Increasing the inner and outer concrete slab thickness significantly enhances the overall stiffness of the wall panel. During the impact process, thicker inner and outer slabs result in reduced wall panel deformation, lower peak deformation, and residual deformation. Moreover, under identical slab thickness conditions, the peak deformation and residual deformation of G-PFRC sandwich wall panels are smaller than those of PFRC sandwich wall panels, indicating that polypropylene fiber can significantly improve the impact resistance of sandwich wall panels.
- (3)
- Different impact positions significantly influence the impact effect of wall panels. Under identical impact conditions, the deformation of the same wall panel varies considerably depending on the impact position. When impacted at the edge of the wall panel, it exhibits the weakest impact resistance, resulting in significant peak deformation and residual deformation. When impacted at one-quarter of the wall panel height, its deformation is constrained by the support, resulting in minimal deformation. Therefore, during the design and application of the wall panel, it is necessary to consider strengthening the stiffness of the wall panel edges.
This work mainly studies the impact resistance of three types of wall panels: G-UC, PFRC, and G-PFRC. The research content of this paper indicates that G-PFRC concrete sandwich wall panels exhibit excellent impact resistance performance. For practical engineering applications, the parametric study in this paper can provide guidance for optimizing wall panel thickness and predicting panel performance under different impact conditions, facilitating the improvement of safety and effectiveness in structural design. Meanwhile, enhancing the impact resistance of wall panels helps to improve the safety of building structures and reduce maintenance costs throughout their life cycle, demonstrating broad application prospects and potential in precast concrete components.
Author Contributions
Software, X.T.; Resources, G.X.; Writing—original draft, Y.S.; Writing—review & editing, P.L. All authors have read and agreed to the published version of the manuscript.
Funding
This research was funded by the Shaoxing Science and Technology Program, grant number 2024B41006, the Shandong province technology-based small and medium-sized enterprises innovation capability enhancement project, grant number 2023TSGC0188.
Data Availability Statement
The original contributions presented in the study are included in the article, further inquiries can be directed to the corresponding author.
Conflicts of Interest
Author Yingying Shang was employed by the company Zhejiang Jinggong Steel Structure Group Co., Ltd. The remaining authors declare that the research was conducted in the absence of any commercial or financial relationships that could be construed as a potential conflict of interest.
Abbreviations
| PFRC | Polypropylene fiber-reinforced concrete |
| G-PFRC | Polypropylene fiber-reinforced concrete sandwich wall panel with glass fiber grid |
| G-UC | Unreinforced concrete sandwich wall panel with glass fiber grid |
| SCS | Steel–Concrete–Steel |
| PLCSP | Precast Lightweight Concrete Sandwich Panels |
| XPS | Extruded Polystyrene Insulation |
| Model-CDP | Model of Concrete Damage Plasticity |
| Model-CSC | Model of Concrete Smeared Cracking |
| Model-CBC | Model of Concrete Brittle Cracking |
References
- Sah, T.P.; Lacey, A.W.; Hao, H.; Chen, W. Prefabricated concrete sandwich and other lightweight wall panels for sustainable building construction: State-of-the-art review. J. Build. Eng. 2024, 89, 109391. [Google Scholar] [CrossRef]
- He, J.X.; Xu, Z.D.; Zhang, L.Y.; Lin, Z.H.; Hu, Z.W.; Li, Q.Q.; Dong, Y.R. Shaking table tests and seismic assessment of a full-scale precast concrete sandwich wall panel structure with bolt connections. Eng. Struct. 2023, 278, 115543. [Google Scholar] [CrossRef]
- Hegarty, R.; Kinnane, O. Review of precast concrete sandwich panels and their innovations. Constr. Build. Mater. 2020, 233, 117145. [Google Scholar] [CrossRef]
- Xiong, F.; Zou, H.; Lu, Y. A macro element of demountable bolted steel-concrete composite connections for a novel prefabricated concrete sandwich wall panel structure. Eng. Struct. 2023, 293, 116571. [Google Scholar] [CrossRef]
- O’Hegarty, R.; Kinnane, O.; Grimes, M.; Newell, J.; Clifford, M.; West, R. Development of thin precast concrete sandwich panels: Challenges and outcomes. Constr. Build. Mater. 2021, 267, 120981. [Google Scholar] [CrossRef]
- Wei, W.; Xukun, M.; Chulei, F.; Na, L.; Wei, T.; Fuyong, C.; Ping, J.; Guoxiong, M. Mechanical characteristics and microscopic mechanism of polypropylene fiber modified recycled road solid waste fine aggregate mortar. J. Build. Eng. 2024, 97, 110798. [Google Scholar] [CrossRef]
- Ma, X.; Wei, P.; Jiang, P.; Xu, H.; Li, N.; Qian, S.; Wang, W.; Mei, G. Frost resistance and micro mechanism of metakaolin and polypropylene fiber modified coastal cement soil. J. Mater. Res. Technol. 2025, 35, 3058–3072. [Google Scholar] [CrossRef]
- Mahdi, S.; Venkatesan, S.; Gravina, R.J. Durability characteristics of polypropylene fiber–reinforced waste cardboard concrete. J. Mater. Civ. Eng. 2025, 37, 04025100. [Google Scholar] [CrossRef]
- Abdolpour, H. Development of Prefabricated Modular Houses in Pure Composite Sandwich Panels. Ph.D. Thesis, Universidade do Minho Escola de Engenharia, Guimaraes, Portugal, 2017. [Google Scholar]
- Zheng, C.; Xiong, F.; Liu, Y.; Yu, M. Study on the flexural behavior of precast concrete multi-ribbed sandwich slabs under different boundary conditions. Eng. Struct. 2023, 291, 116342. [Google Scholar] [CrossRef]
- Mazek, S.A.; Mostafa, A.A. Impact of composite materials on performance of reinforced concrete panels, Computers and Concrete. Int. J. 2014, 14, 767–783. [Google Scholar]
- Sohel, K.; Liew, J.R. Behavior of steel–concrete–steel sandwich slabs subject to impact load. J. Constr. Steel Res. 2014, 100, 163–175. [Google Scholar] [CrossRef]
- Yang, Y.; Ge, Z.; Li, Y.; Xiong, Y.; Yuan, Q. Study on impact resistance of precast light-weight concrete sandwich panels. Structures 2023, 47, 966–975. [Google Scholar] [CrossRef]
- Hopkins, P.M.; Chen, A.; Yossef, M. Static and dynamic analyses of insulated concrete sandwich panels using a unified non-linear finite element model. Eng. Struct. 2017, 132, 249–259. [Google Scholar] [CrossRef]
- Pang, R.; Sun, Y.; Xu, Z.; Xu, K.; Cui, J.; Dang, L. Shaking table test and numerical simulation of a precast frame-shear wall structure with innovative untopped precast concrete floors. Eng. Struct. 2024, 300, 117162. [Google Scholar] [CrossRef]
- Bagheri, M.; Jamkhaneh, M.E.; Samali, B. Effect of seismic soil–pile–structure interaction on mid-and high-rise steel buildings resting on a group of pile foundations. Int. J. Geomech. 2018, 18, 04018103. [Google Scholar] [CrossRef]
- Ding, R.; Sun, Y.T.; Nie, X.; Chen, D.Q. Experimental study on seismic behaviour of an unreinforced precast wall-slab structure based on UHPC sandwich panels. J. Build. Eng. 2023, 68, 106197. [Google Scholar] [CrossRef]
- Tawil, H.; Tan, C.G.; Sulong, N.H.R.; Nazri, F.M.; Shamsudin, M.F.; Bunnori, N.M. Optimization of shear resistance in precast concrete sandwich wall panels using an S-Type shear connector. Buildings 2024, 14, 1725. [Google Scholar] [CrossRef]
- Amran, Y.M.; Ali, A.A.; Rashid, R.S.; Hejazi, F.; Safiee, N.A. Structural behavior of axially loaded precast foamed concrete sandwich panels. Constr. Build. Mater. 2016, 107, 307–320. [Google Scholar] [CrossRef]
- Bush, T.D.; Stine, G.L. Flexural behavior of composite precast concrete sandwich panels with continuous truss connectors. PCI J. 1994, 39, 112–121. [Google Scholar] [CrossRef]
- Zhao, B.; Du, L.; Chen, G.; Yue, L.; Cui, C.; Ge, M. Experimental and numerical study on the shear performance of stainless steel-GFRP connectors for use in precast concrete sandwich panels. Sci. Rep. 2024, 14, 13814. [Google Scholar] [CrossRef]
- Pang, R.; Zhang, L.; Zhang, T.; Dang, L.; Wang, W. Experimental study and numerical simulation on the transverse force transmission mechanism of discretely connected precast RC floor. Structures 2023, 56, 104842. [Google Scholar] [CrossRef]
- Guo, C.; Wang, Z.; Zhao, H.; Zhou, Z.; Wang, M. Numerical simulation of corrugated steel concrete prefabricated support structure for underground engineering. Sustainability 2023, 15, 14495. [Google Scholar] [CrossRef]
- Huang, J.Q.; Dan, M.L.; Chong, X.; Jiang, Q.; Feng, Y.L.; Wang, Y.W. Out-of-plane shear performance of textile reinforced concrete sandwich panel: Numerical analysis and parametric study. Structures 2025, 71, 108080. [Google Scholar] [CrossRef]
- Liang, N.; You, X.; Yan, R.; Miao, Q.; Liu, X. Experimental investigation on the mechanical properties of polypropylene hybrid fiber-reinforced roller-compacted concrete pavements. Int. J. Concr. Struct. Mater. 2022, 16, 3. [Google Scholar] [CrossRef]
- Guo, Z.H. Strength and Constitutive Relationship of Concrete: Principles and Applications; China Industrial Press: Beijing, China, 2004. [Google Scholar]
- Mindlin, R. Influence of rotatory inertia and shear on flexural motions of isotropic. Elastic Plates 1951, 18, 31–38. [Google Scholar]
- Sidoroff, F. Description of Anisotropic Damage Application to Elasticity, Physical Non-Linearities in Structural Analysis: Symposium Senlis; Springer: Berlin/Heidelberg, Germany, 1981; pp. 237–244. [Google Scholar]
- Comité Euro-International du Béton. CEB-FIP Model Code 1990: Design Code; Thomas Telford Publishing: London, UK, 1993. [Google Scholar]
- GB/T 13788-2017; Cold-Rolling Ribbed Bar. Architecture & Building Press: Beijing, China, 2017.
- Jones, N. Structural Impact; Cambridge University Press: Cambridge, UK, 2011. [Google Scholar]
- Hufner, D.R.; Hill, S.I. High strain rate testing and modeling of a woven E-glass–vinylester composite in dry and saturated conditions. J. Compos. Mater. 2017, 51, 3017–3039. [Google Scholar] [CrossRef]
- Taniguchi, N.; Nishiwaki, T.; Kawada, H. Tensile strength of unidirectional CFRP laminate under high strain rate. Adv. Compos. Mater. 2007, 16, 167–180. [Google Scholar] [CrossRef]
- Orton, S.L.; Chiarito, V.P.; Rabalais, C.; Wombacher, M.; Rowell, S.P. Strain rate effects in CFRP used for blast mitigation. Polymers 2014, 6, 1026–1039. [Google Scholar] [CrossRef]
- Choi, K.B.; Choi, W.C.; Feo, L.; Jang, S.J.; Yun, H.D. In-plane shear behavior of insulated precast concrete sandwich panels reinforced with corrugated GFRP shear connectors. Compos. Part B Eng. 2015, 79, 419–429. [Google Scholar] [CrossRef]
- GB/T 30100-2013; Standard Test Methods for Building Wall Panels. Architecture & Building Press: Beijing, China, 2013.
- Asgari, A.; Ranjbar, F.; Bagheri, M. Seismic resilience of pile groups to lateral spreading in liquefiable soils: 3D parallel finite element modeling. Structures 2025, 74, 108578. [Google Scholar] [CrossRef]
- Zhao, W.Y.; Guo, Q.Q. Study on behavior of double-skin steel-concrete composite walls subjected to low-velocity impact. China Civ. Eng. J. 2018, 51, 88–94. [Google Scholar]
- Ahmad, J.; Burduhos-Nergis, D.D.; Arbili, M.M.; Alogla, S.M.; Majdi, A.; Deifalla, A.F. A review on failure modes and cracking behaviors of polypropylene fibers reinforced concrete. Buildings 2022, 12, 1951. [Google Scholar] [CrossRef]
- Hosseinzadeh, H.; Salehi, A.M.; Mehraein, M.; Asadollahfardi, G. The effects of steel, polypropylene, and high-performance macro polypropylene fibers on mechanical properties and durability of high-strength concrete. Constr. Build. Mater. 2023, 386, 131589. [Google Scholar] [CrossRef]
- Woltman, G.; Noel, M.; Fam, A. Experimental and numerical investigations of thermal properties of insulated concrete sandwich panels with fiberglass shear connectors. Energy Build. 2017, 145, 22–31. [Google Scholar] [CrossRef]
Disclaimer/Publisher’s Note: The statements, opinions and data contained in all publications are solely those of the individual author(s) and contributor(s) and not of MDPI and/or the editor(s). MDPI and/or the editor(s) disclaim responsibility for any injury to people or property resulting from any ideas, methods, instructions or products referred to in the content. |
© 2025 by the authors. Licensee MDPI, Basel, Switzerland. This article is an open access article distributed under the terms and conditions of the Creative Commons Attribution (CC BY) license (https://creativecommons.org/licenses/by/4.0/).