Article

Dynamic BIM-Driven Framework for Adaptive and Optimized Construction Projects Scheduling Under Uncertainty

by
Mohammad Esmaeil Gandomkar Armaki
,
Ali Akbar Shirzadi Javid
* and
Shahrzad Omrani
School of Civil Engineering, Iran University of Science and Technology (IUST), Tehran 16846-13114, Iran
*
Author to whom correspondence should be addressed.
Buildings 2025, 15(17), 3004; https://doi.org/10.3390/buildings15173004 (registering DOI)
Submission received: 15 July 2025 / Revised: 17 August 2025 / Accepted: 21 August 2025 / Published: 24 August 2025

Abstract

Conventional project scheduling techniques often rely on manual trial-and-error methods, which can lead to inaccurate evaluations. This study presents a dynamic scheduling framework to dynamically adjust scheduling decisions based on real-time productivity and budget constraints, resulting in improvement in scheduling accuracy in project management. By integrating advanced computational tools, the proposed approach addresses complex scheduling challenges. The model integrates Building Information Modeling (BIM)-based 3D data, productivity and process simulation, and optimization techniques to provide a unified scheduling tool that supports informed decision-making while considering real-time constraints, including productivity performance and budget limitations. The results demonstrated notable improvements over conventional methods, including a 13% increase in scheduling accuracy relative to the actual total project cost and a 34.4% improvement in scheduling accuracy based on the actual project duration, compared to the contractor’s baseline. The framework dynamically adjusts schedules and budgets according to current project conditions. These findings demonstrate its reliability as a decision-making tool for construction project management. The study introduces an integrative scheduling framework that adapts to real-time project conditions and is validated against actual project data. The integration of BIM, system dynamics, process simulation, and ACOR optimization provides a novel approach to construction scheduling. This methodology improves project management efficiency by automating scheduling adjustments based on ongoing progress.

1. Introduction

1.1. BIM for Cost Estimation and Scheduling

Accurate cost estimation and scheduling are essential for successful construction projects. Traditional methods like the Program Evaluation and Review Technique (PERT) and the Critical Path Method (CPM) rely heavily on manual processes, often yielding inflexible estimates that require costly mid-project revisions [1,2]. Although more recent approaches integrate optimization algorithms and BIM, many still lack effective real-time adaptability for dynamic construction environments [3].
BIM’s detailed models enable more accurate cost evaluations than conventional 2D methods. For example, a 3D BIM model allowed energy analysis across multiple locations, optimizing design to reduce heating and cooling loads while improving efficiency [4]. Studies have demonstrated BIM’s benefits: higher BIM maturity levels improve safety and scheduling [5], BIM-based quantity take-off QTO reduces costs and time [6], integration with process planning increases accuracy [7], and automated solutions such as bar bending schedules streamline workflows [8]. A 5D BIM and Bayesian Belief Network framework has been used to automate probabilistic cash flow analysis, integrating risk impacts via fuzzy logic to improve results [9]. Open BIM frameworks have addressed reliability in early-stage estimation [10], while BIM genetic algorithm (GA) hybrids have enabled automated scheduling [11]. Collectively, these studies confirm BIM’s potential to significantly improve efficiency and precision in construction [12].

1.2. Simulation-Based Scheduling in Construction

Discrete Event Simulation (DES) offers several advantages in construction management, including the ability to analyze the effects of variability, optimize resource allocation, and model complex systems. It provides a cost-effective means to evaluate a range of management decisions [13]. Recent studies have integrated BIM with DES to improve simulation accuracy. Lu and Olofsson [14] reported that combining BIM with DES improves scheduling accuracy and project visualization. However, many existing techniques lack process-centric continuous updates and product-centric changes, both of which are critical for effective construction management [15]. Numerous studies have adopted DES as a widely recognized and effective method for scheduling and planning construction projects [16,17,18,19]. Simulation-based scheduling improves detailed planning at the operational level by using DES to replicate resource allocation and construction logic. To address these needs, various tools have been developed, such as simplified DES methods and activity-based simulation scheduling models [20]. Nevertheless, achieving detailed activity-level scheduling requires deeper integration between process simulation models and BIM [21]. While these advancements have contributed to the field, further research is needed to develop comprehensive management tools that seamlessly integrate current process data to support accurate and dynamic simulation-based scheduling in construction.

1.3. System Dynamics in Construction Management

A promising approach to addressing these challenges is the use of hybrid models that combine Discrete Event Simulation (DES), system dynamics (SD), and Building Information Modelling (BIM). The hybrid model proposed by Peña-Mora et al. [22] integrates DES and SD with BIM to improve construction project management. By combining the strengths of both techniques, this method provides a more adaptive and comprehensive tool for project management. It enables real-time adjustments based on actual project progress, which improves the accuracy of cost estimates and schedules, increases overall performance, and reduces delays.
Correlated uncertainties, such as labor availability, material delivery, and weather conditions, have a significant effect on the planning of repetitive construction projects. These factors increase variability in timelines and influence multiple activities simultaneously [23]. By integrating BIM with SD, Dadashi Haji et al. [24] evaluated safety leading indicators in construction projects. The authors used SD to model the casual relationships between safety leading indicators and to simulate their interactions and impacts over time. Between 1995 and 2014, construction labor productivity increased by only 1% annually compared with 3.6% in the manufacturing sector [25]. Large construction projects have been reported to experience budget overruns of up to 80% and schedule delays of about 20% [26]. According to Ashcraft [27], such issues can be attributed to reliance on conventional project delivery techniques and slow technological adoption. This framework directly addresses such overruns by continuously incorporating real-time productivity data, financial limitations, and simulation-driven projections; our model supports more flexible and well-informed scheduling choices, helping to minimize the likelihood of exceeding the budget and time.

1.4. Labor Productivity

Labor productivity plays a pivotal role in determining construction project performance, influencing schedule adherence, cost control, and overall project quality. System dynamics (SD) has proven effective in capturing the nonlinear and interdependent factors that drive productivity changes over time, offering advantages over conventional methods such as the measured mile technique. However, for SD models to accurately simulate productivity, they require structured and detailed input data. Building Information Modeling (BIM) addresses this need by providing precise definitions of activities, spatial configurations, and material quantities. This enables the calculation of task-level productivity rates by linking labor inputs with geometric constraints and construction sequences. The integration of BIM and SD therefore offers a robust approach for mapping productivity variations to cost and time outcomes in a dynamic project environment. Al-Kofahi et al. [28] developed an SD model to quantify the productivity impacts of change orders, while Leon et al. [29] extended this approach to forecast multi-dimensional project performance. Nasirzadeh and Nojedehi [30] demonstrated the value of SD in analyzing rework and learning curve effects. Yao et al. [31] applied SD to examine the linkages between sustainability and performance linkages, and Porwal et al. [32] advanced this by integrating BIM for waste and productivity analysis. Sterman [33] further validated the capability of SD to capture feedback loops that are often overlooked by conventional methods.

1.5. Nonlinear Relationship Between Time and Cost

The nonlinear relationship between cost and time, a key concept for improving planning accuracy, represents a critical area where these insights converge. Conventional linear models often fail to capture the complex interdependencies among time, cost, and productivity. To address this limitation, Perez et al. [34] proposed nonlinear time–cost trade-off models for construction scheduling that overcome the constraints of linear assumptions. These models distinguish between non-collaborative and collaborative resource scenarios and incorporate performance coefficients to account for efficiency loss.
Deckro et al. [35] developed nonlinear time–cost trade-off models characterized by quadratic cost relationships, incorporating factors such as operational constraints, crashing decisions, and resource levels. Zhang et al. [36] further extended this concept by integrating time–cost–quality trade-offs, introducing of the Quality Performance Index (QPI) and examining the nonlinear relationships among cost, quality, and time.

1.6. ACOR Optimization Algorithm for Scheduling

Recent advances in algorithms have significantly improved construction planning, particularly in BIM optimization. Kateryna et al. [37] introduced graph-based methods for managing detailed sub-schedules, while El-Menshawy et al. [38] automated BIM-to-Primavera scheduling, identifying project-specific constraints. Faghihi et al. [39,40] applied genetic algorithms to BIM-based sequencing, and Hossam Wefki et al. [41] integrated BIM with 5D simulations. Long [42] combined probabilistic scheduling with evolutionary algorithms for uncertainty management.
Wang et al. [43] developed IACO, which improved TSN scheduling and outperformed traditional ACO. Li and Zhang [44] applied ACO to resource-constrained scheduling, while Socha and Dorigo [45] adapted Ant Colony Optimization for Continuous Domains (ACOR) for continuous optimization. Tavakolan et al. [46] demonstrated ACOR’s capability to optimize portfolios under constraints. To address the complex and nonlinear nature of construction scheduling under uncertainty, this study employs the ACOR algorithm. ACOR is a metaheuristic optimization method particularly well-suited for problems involving continuous variables, such as time–cost trade-offs in construction activities. Its ability to adaptively search for near-optimal solutions in dynamic environments makes it a powerful tool for improving scheduling accuracy in real-world project scenarios.
The paper is structured as follows: Section 2 highlights the research significance and identifies critical gaps in current construction scheduling practices. Section 3 presents the proposed methodology, detailing the integration of BIM, system dynamics, Discrete Event Simulation, and ACOR optimization. Section 4 discusses the results and model validation based on a real construction project. Section 5 provides a comprehensive discussion, including a critical evaluation and consideration of replicability. Finally, Section 6 concludes the study by summarizing the findings and outlining practical implications and limitations.

2. Research Significance and Identified Gaps

Despite advancements in integrating BIM with simulation and optimization techniques, current approaches face significant limitations in adapting to real-time changes during construction projects. Unlike previous methods like BIM-GA [11] or BIM-DES [14] frameworks, which often treat scheduling as static, failing to incorporate dynamic interdependencies between productivity factors, financial constraints, and activities sequences, our model integrates real-time condition updates to reoptimize dynamically. Additionally, the nonlinear relationship between the time and cost of activities is frequently oversimplified, leading to inaccuracies in planning. The proposed framework captures the nonlinear relationship between time and cost for each activity, which dynamically evolves through the interaction of productivity-driven system dynamics (SD) simulations, budget constraints, and activity start times. These factors, in turn, influence the time–cost relationship of subsequent activities. The limited and inconsistent integration of tools such as DES and SD into project management frameworks continues to constrain their capability to effectively simulate and optimize complex, real-world scenarios. Furthermore, many algorithmic methods still lack the sophistication needed to manage multi-dimensional constraints dynamically, reducing their effectiveness in real-time construction settings.
The contributions of the current study are as follows:
  • Development of a dynamic construction scheduling framework that integrates BIM, Discrete Event Simulation (DES), system dynamics (SD), and the ACOR optimization algorithm.
  • Modeling and incorporating nonlinear time–cost relationships that evolve dynamically based on real-time productivity and budget constraints.
  • Seamless integration of productivity-driven SD simulations into scheduling processes, enabling adaptive decision-making in uncertain construction environments.
  • Demonstrating the effectiveness of the proposed model through validation using real project data, showing measurable improvements in scheduling accuracy and cost control.
  • Addressing the limitations of static BIM optimization frameworks by enabling real-time schedule reoptimization based on project-specific changes.

3. Methodology

This study presents a framework that integrates BIM with optimization and simulation techniques. As shown in Figure 1, the framework is organized into five stages.
Stage 1: A 3D BIM model is developed as the foundation of the project, extracting essential data on activities, quantities, and schedules. It visually integrates material, scheduling, and spatial data to support process optimization and simulation.
Stage 2: Workers’ Productivity Calculation. Factors influencing productivity, such as climate, fatigue, and skill level, are identified and analyzed using SD techniques. Productivity is then calculated, and a marginal cost coefficient is determined for each activity to assess cost variations for optimization.
Stage 3: Data Extraction and Collection. Essential data for optimization is systematically stored. Scheduling information and work quantities are extracted from BIM and saved in a database. Marginal cost coefficients and related datasets are linked to maintain consistency for the subsequent stages.
Stage 4: Activity Sequencing, Time, and Cost Analysis. An initial activity sequence is developed, incorporating random variables to simulate uncertainties such as cost fluctuations and delays. Nonlinear cost–time relationships are incorporated into a DES model, implemented using Simphony.Net (v4.0). The results are assessed for accuracy, adherence to project constraints, and cost efficiency, with the most favorable outcomes recorded for further analysis.
Stage 5: Finalizing the Schedule. The optimized project schedule is saved for implementation, ensuring efficiency in time, resource use, and cost. This process ensures that construction proceeds according to a validated and optimized plan.

3.1. The Process of Tool Implementation

To address the challenges discussed earlier, a case study was conducted on Building No. 2 of the Ministry of Agriculture in Iran. This study introduces a technique that integrates construction optimization and simulation to minimize cost and time, using programming to overcome the limitations of previous methods.
The BIM model was developed in Autodesk Revit 2017, while AnyLogic (v8.3) was used to analyze variations in human resource productivity. Construction activities, constraints, and conditions were defined using real-world data stored in Microsoft Access 2017. The project structure, including activities and dependencies, was then established.
Process simulation was carried out using Simphony.NET (v4.0), and the ACOR algorithm, coded in VB.NET (Visual Studio v15.7), performed the optimization. This integrated framework enables seamless automation, efficiently analyzing monthly cost constraints and productivity variations.
VB.NET was selected for its high execution speed and ability to compile directly into machine language, ensuring efficient operation on Windows OS, the dominant platform in Iran. The seamless integration of tools improves accuracy and identifies the optimal execution path based on project duration and cost, demonstrating its effectiveness in overcoming prior methodological challenges.

BIM Model Generation

The BIM model was developed using the plans and information for a seven-story building. Due to the data availability, the model includes only three floors of the actual project (Figure 2). The model consists of four distinct floors, each with an identical area of 567 m2 but differing in height and operational zones.
The foundation floor is 1.00 m in height and contains a single operational zone. Floor 1 has a height of 5.75 m and is divided into two operational zones. Floors 2 and 3 each have a height of 2.75 m and feature two operational zones. This tiered configuration maintains spatial consistency while allowing functional segmentation across levels.
After the BIM model is generated, users can apply a shared parameter to assign project zones to elements, enabling the dentification of different zones withing the model. Once this step is completed, a specialized BIM plug-in extracts the necessary data to generate a schedule. This includes element details (e.g., area, volume, height, material type, category, type, and dimensions), project data (e.g., project zones and their associated components), and non-modeled element task types.
The plug-in organizes the extracted information into the “Tasks” table in Microsoft Access 2017. It standardizes terminology across categories that use different nomenclature (e.g., “Work Amount,” “Resource ID,” and “Tasks Name”). Once the BIM model is developed, it stores all required material quantities and exports this information in a format that can be retrieved by software such as Microsoft Access 2017 for further processing and integration into project management workflows.
The collected data is stored in a structured database, making it suitable for use in the optimization process and Discrete Event Simulation. This approach ensures that the BIM model data is well-organized and can be seamlessly integrated with scheduling workflows for effective project management.

3.2. Calculation of Workers’ Productivity

In this study, the factors influencing employee productivity were identified based on expert surveys and findings from previous research [29]. A total of 23 factors were ultimately selected as the most influential parameters. The two structured Likert-scale questionnaires (1–4 rating scales) were administered to 10 experts across owner, consultant, and contractor groups. Reliability was assessed via consistency in normalized weight matrices used to evaluate two aspects: (1) the pairwise effect of influential factors on productivity and (2) the overall effect of these factors on employee productivity. Based on their influence, the factors were classified into four levels: no impact, low impact, moderate impact, and high impact.
Ten managers and workers from the organization completed the questionnaires. The study involved ten industry experts representing a range of organizational roles. The owner organizations contributed three participants: a Project Manager (22 years of experience), a Financial Controller (17 years), and a Quality Assurance Representative (15 years). The consultant group included a Construction Manager with 28 years of experience, a Foreman (14 years), and a Project Planner with 8 years of experience. The contractor group had the highest representation, consisting of two Project Executives (10 years each), a Safety Officer (12 years), and a Project Manager with 25 years of experience. This cross-section provided balanced perspectives from both leadership and operational levels within the construction industry.
Once the questionnaires were completed, the average responses were stored in a separate matrix. In addition to identifying influential parameters, this process allowed the recognition of the factors with the greatest direct impact on productivity. To determine how these factors change over time, the method proposed by Mawdesley et al. [47] was applied. In this approach, each factor influencing productivity is itself affected by other factors. For example, worker enthusiasm at a given time depends on its value at an earlier time as well as on factors such as management effectiveness, job security, delays in salary payments, and other relevant influences. Equation (1) illustrates how these factors interact.
F R = e c × F ( t 1 ) + ( 1 e c ) × F t
In this equation, e c denotes the percentage impact of the factor from the previous time, F R represents the Final Impact of the Factor on productivity, F ( t ) represents the Impact of the Factor at Time ( t ) , and F ( t 1 ) is the Impact of the Factor at Time ( t 1 ) .
Equation (2) shows how to calculate this impact:
F t = b c × [ a i × A F i ] + ( 1 b c ) × ( O F )
where a i denotes the coefficient of the effect of every single factor on the final factor, b c represents the coefficient associated with the effect of the considered factors related to the specific factor, O F denotes other influencing factors, and A F i represents the factors affecting the final factor.
The contribution of the six final factors to productivity was then determined using the weights obtained from the normalized response matrix (Table 1).

System Dynamics Modeling

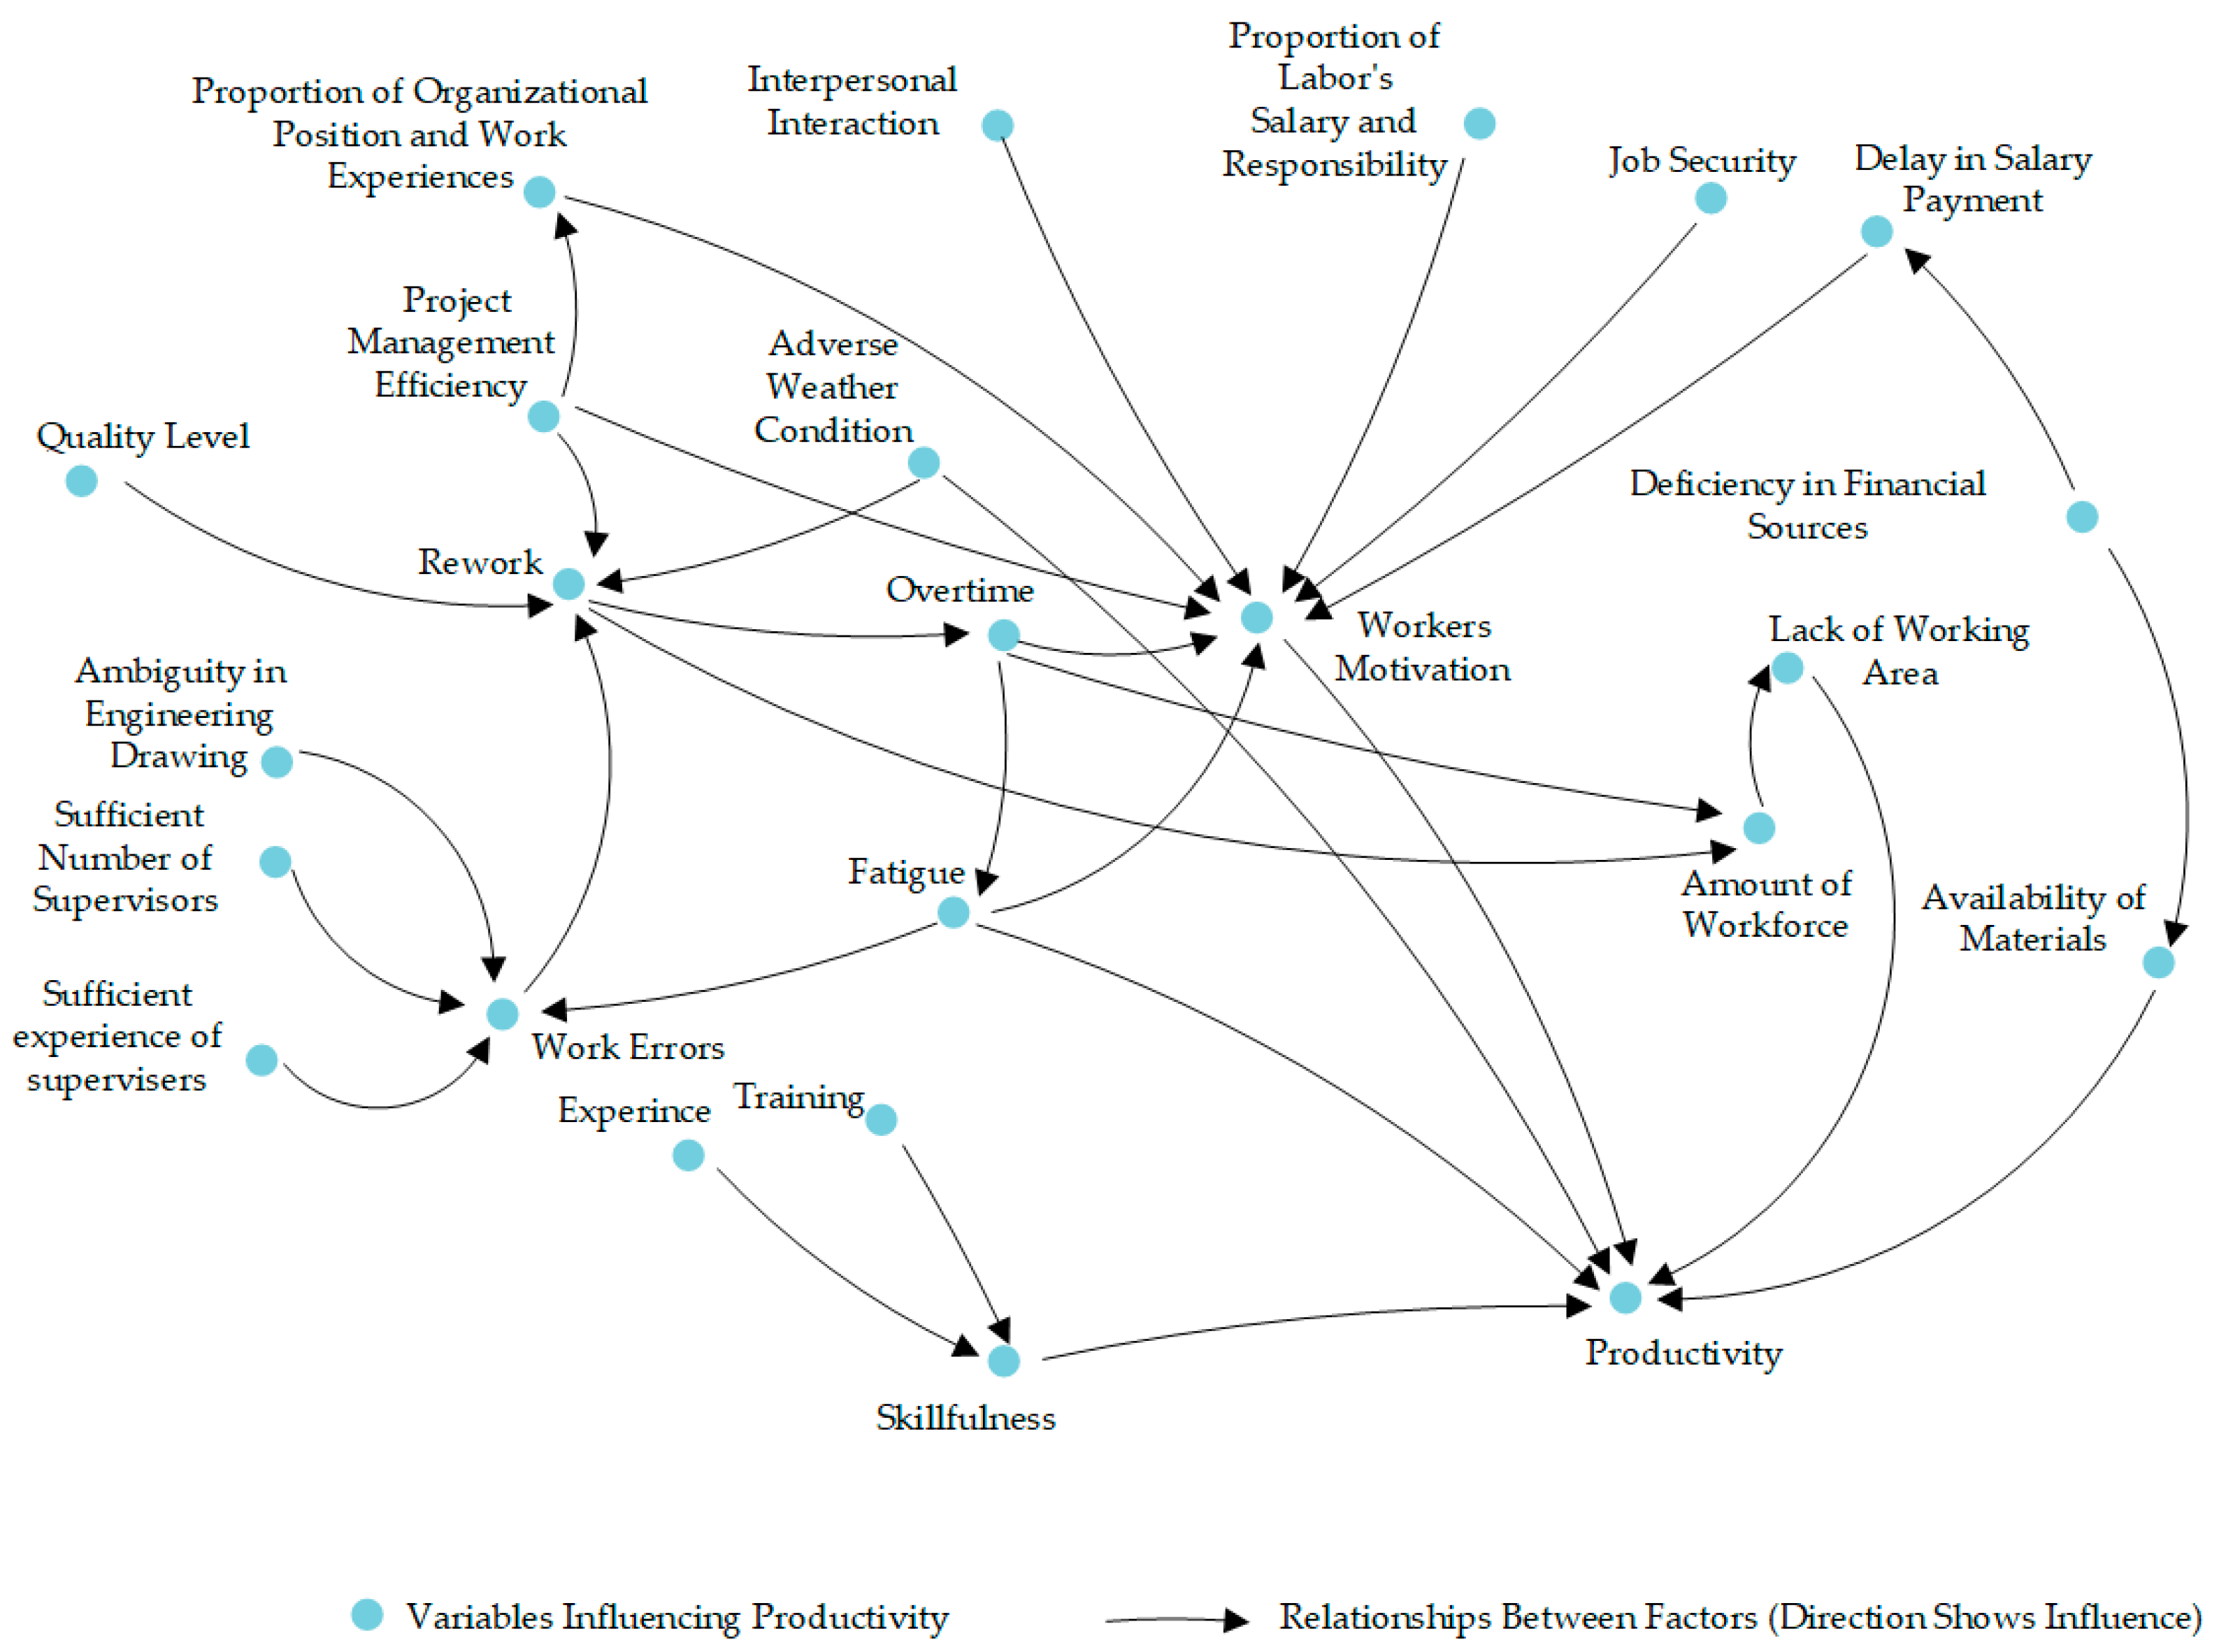
As shown in Figure 3, SD modeling was used to simulate productivity variations over the entire project duration. This approach provides a framework for analyzing and modeling complex interactions and feedback loops within a construction project, enabling the estimation of multiple factors that influence productivity. At this stage, productivity-related factors were simulated based on relationships identified in the earlier stage.
To account for all potential scheduling scenarios, the simulation was run for nine months, with productivity determined for the same period. Separate simulations were conducted for different worker categories, including form workers, concrete workers, and rebar workers. This modeling process enabled the analysis of these factors and their effects on both project costs and scheduling.

3.3. Data Extraction and Collection

The data for this study was collected from a construction project and included real project records, system dynamics data, and detailed BIM models. The collection process drew from multiple sources to ensure a comprehensive analysis.
BIM data provided detailed information on all project activities, including dimensions and scope, serving as the basis for understanding the project’s operational and structural components. Real project data included cost records, monthly budget adjustments, and actual timelines, along with critical factors influencing productivity, such as weather conditions, worker skill levels, fatigue, and project complexity. In addition, SD data was extracted to support direct cost calculations, offering insights into dynamic interactions and variations affecting project costs. This integrated approach established a strong data framework to support accurate analysis. All collected data was organized and stored in a database for use in the optimization and simulation processes.

3.4. Activities’ Time, Cost, and Sequential Order

Accurate calculation of each activity’s cost is essential for effective project budgeting and management. In this study, the cost calculation method incorporates multiple factors to provide a precise and comprehensive estimation of expenses. The total project cost includes indirect costs, direct costs, penalties, and bonuses.
Based on the collected data, the indirect costs are USD 250 per day. According to the contract, the bonus for completing tasks ahead of the scheduled deadline is USD 250 per day, while the penalty for each day of delay is USD 375.
The direct cost in this study includes the total direct expenses for all activities, categorized into human resource costs and on-site material costs. While on-site material costs remain fixed, the human resource costs fluctuate depending on the timing and duration of each activity. This variability results from the dynamic nature of project conditions modeled through SD simulations. To estimate the costs of human resources, C 0 D C i , a final cost increase parameter, is utilized on the basis of the final cost theory in economics. Different C 0 D C i values are affected by a variety of circumstances affecting the execution of the activity, which in turn affect the activity duration [29,30]. One can define Equation (3) as follows:
C = i = 1 n [ ( T C i b i ) + C 0 D C i [ ( T C i R D i ) ( T C i I D i ) ] 2 + M C i ) ]
where T C i is the remaining task completion percentage of the activity, D C represents the total direct cost of the project, C 0 D C i is the final cost increase parameter, b i denotes the cost of completing the activity in the normal time, I D i represents the planned duration for the activity, M C i represents the cost associated with materials and equipment for each activity, and R D i denotes the duration of the activity.
To calculate the cost and time of each activity in this method, the lower limit, upper limit, normal time, and cost at the normal time are first determined. The activity cost within this time range is then calculated using the parameter C 0 D C i .
In order to determine the C 0 D C i parameter for human resource costs, in accordance with the nature of this parameter, which reflects the effect of a variety of factors on increasing the cost of an activity due to an increase/decrease in the activity duration, the productivity concept was employed. Through the estimation of the employees’ productivity over the duration of the project, three time boundaries—upper, normal, and lower limits—were established based on historical data from previous similar projects and contractor experience. These values were subsequently reviewed and validated by site engineers to ensure their practical relevance and accuracy. The cost corresponding to the upper time limit for each activity was determined based on the calculated productivity. Using the upper time limit, the normal limit, the corresponding cost for the upper time limit, and the cost for the normal time for each activity, a cost–time variation graph was developed (Figure 4). These variations in cost and time arise from changes in productivity.

3.5. Process Simulation and ACOR Integrated Performance

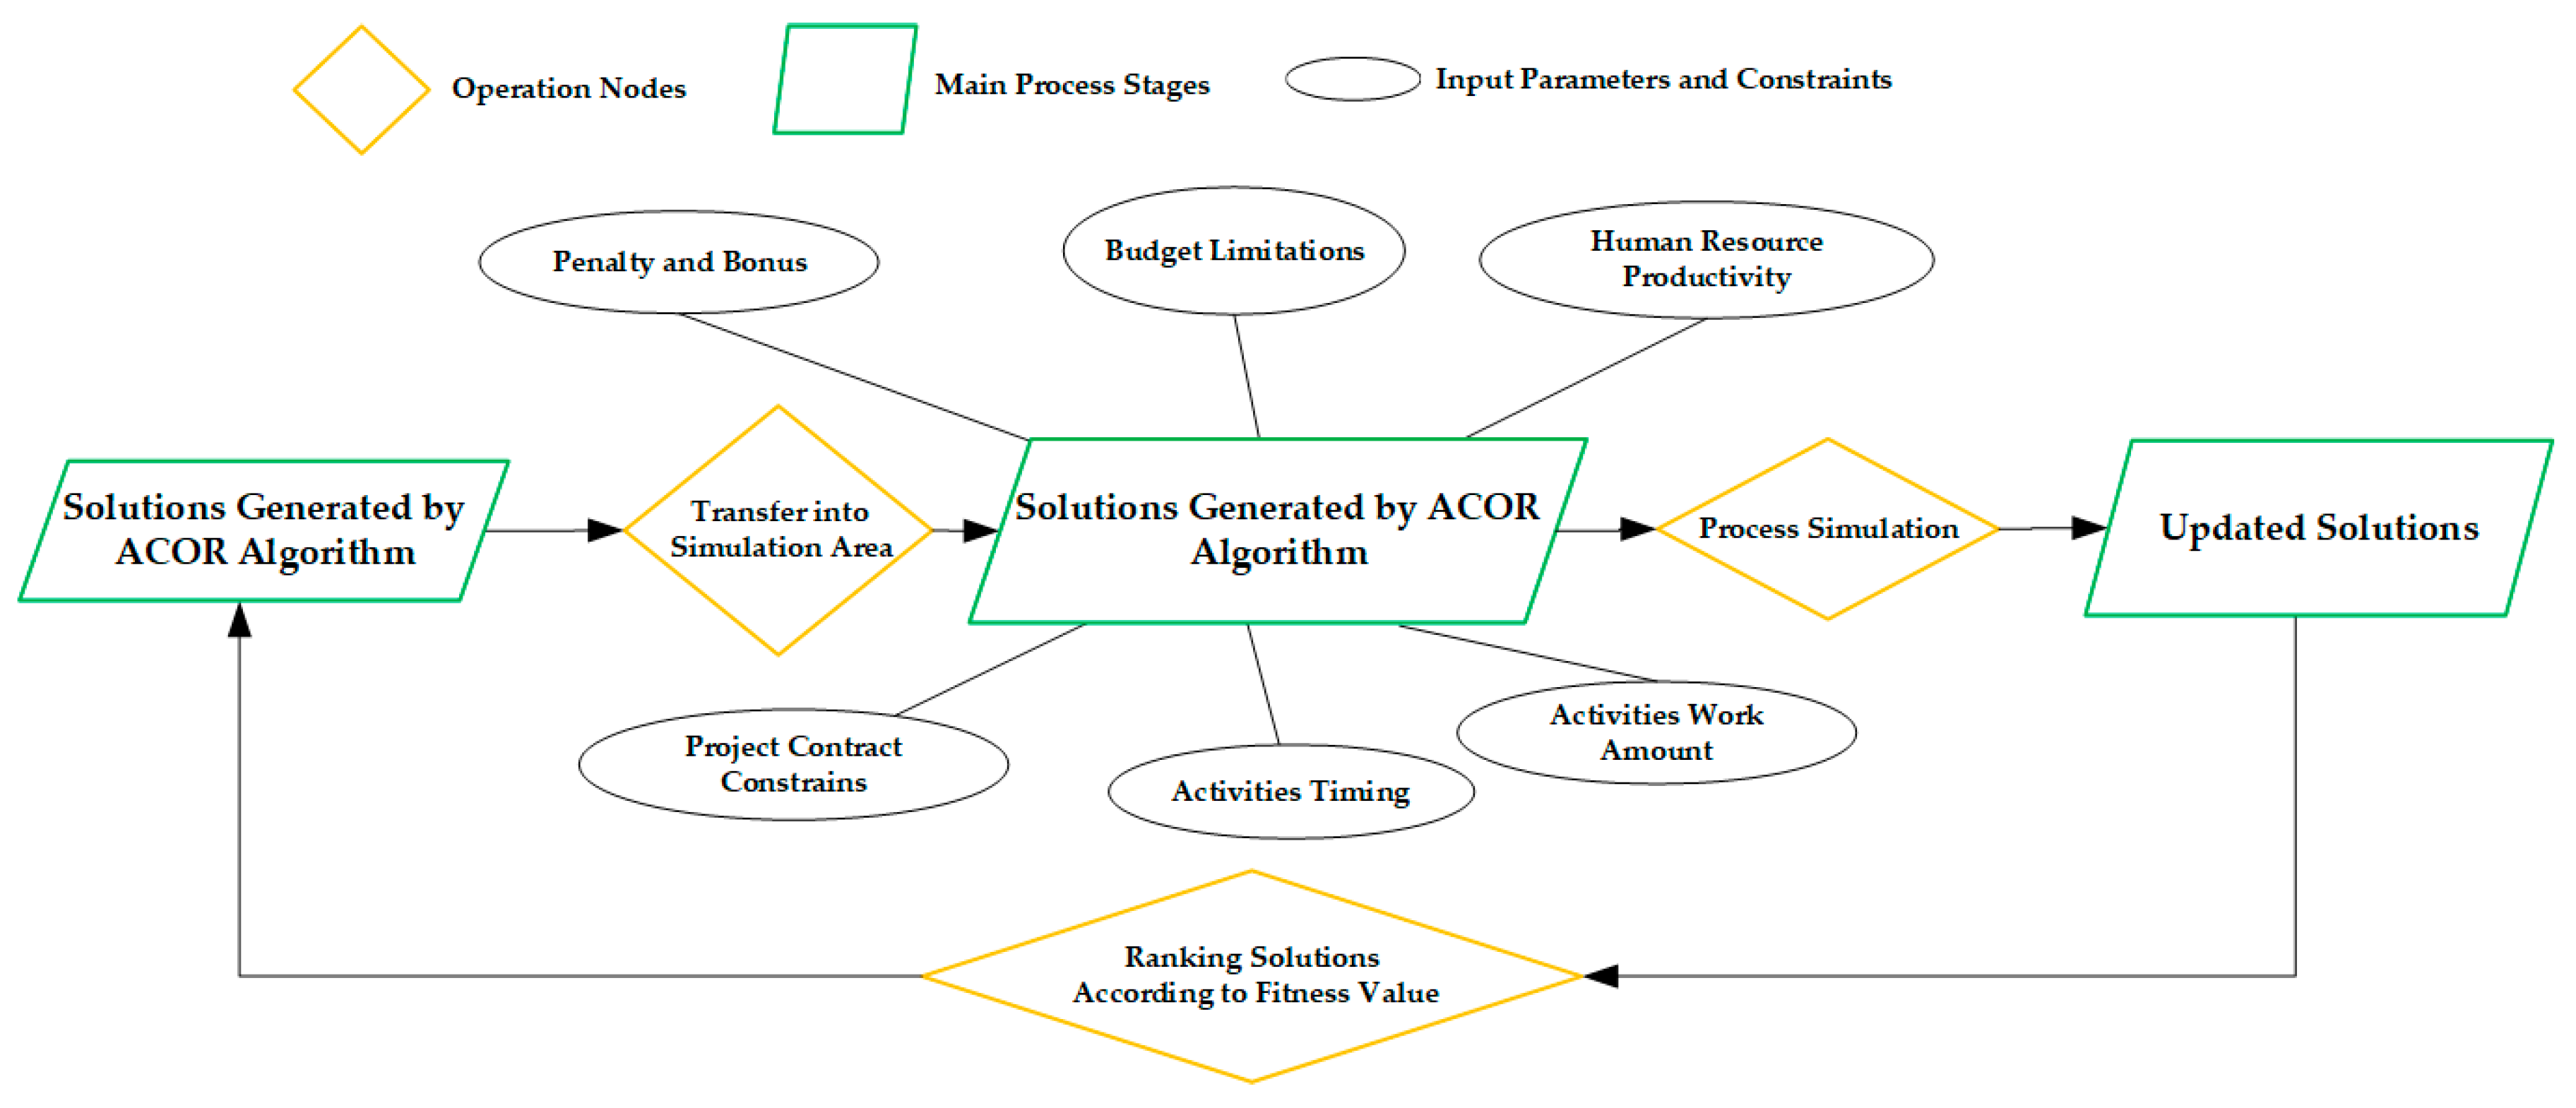
The simulation begins by organizing tasks according to their precedence constraints. However, monthly budget limitations and fluctuations in productivity over time can alter task sequences, costs, and durations, resulting in revised schedules. To address this, the algorithm produces random solutions representing different states of cost and time for every single activity by considering the nonlinear relationship between cost and time. In the course of the simulation, the data regarding the monthly costs and completion of the project is collected and fed back into the algorithm. If the acquired solution aligns with the constraints, it is analyzed based on the objective function and stored in the solution table. Thus, new solutions are created in accordance with the fitness value. The process is iterated continuously until the ACOR algorithm satisfies its termination criteria (Figure 5).
Simphony.Net (v4.0) was used to simulate project cost and time in discrete phases, assessing productivity changes, task prioritization, and budget constraints. This approach ensures that all cost factors are accounted for, supporting effective financial management.
The software integrates time–cost relationships, work volumes, productivity metrics, and penalties or rewards, simulating activities to estimate total project costs and durations. The dataset, which includes activity durations and activity costs, is then transferred to the optimization algorithm for adaptive decision-making; this data transformation and integration process is implemented through custom coding to ensure seamless communication between the simulation and optimization components. Each task is simulated stepwise, with continuous assessment of budget availability. If sufficient funds are available, the task begins; otherwise, it is delayed until adequate funds are secured. For multi-month tasks, incurred costs are compared against monthly budgets to maintain financial balance, ensuring realistic project execution.
The simulation monitors task delays caused by budget shortages, cumulative costs, and actual start and finish times. It also accounts for parallel tasks within designated zones, ensuring that precedence constraints are maintained. Entities represent activity execution data and are dynamically generated to manage parallel operations.
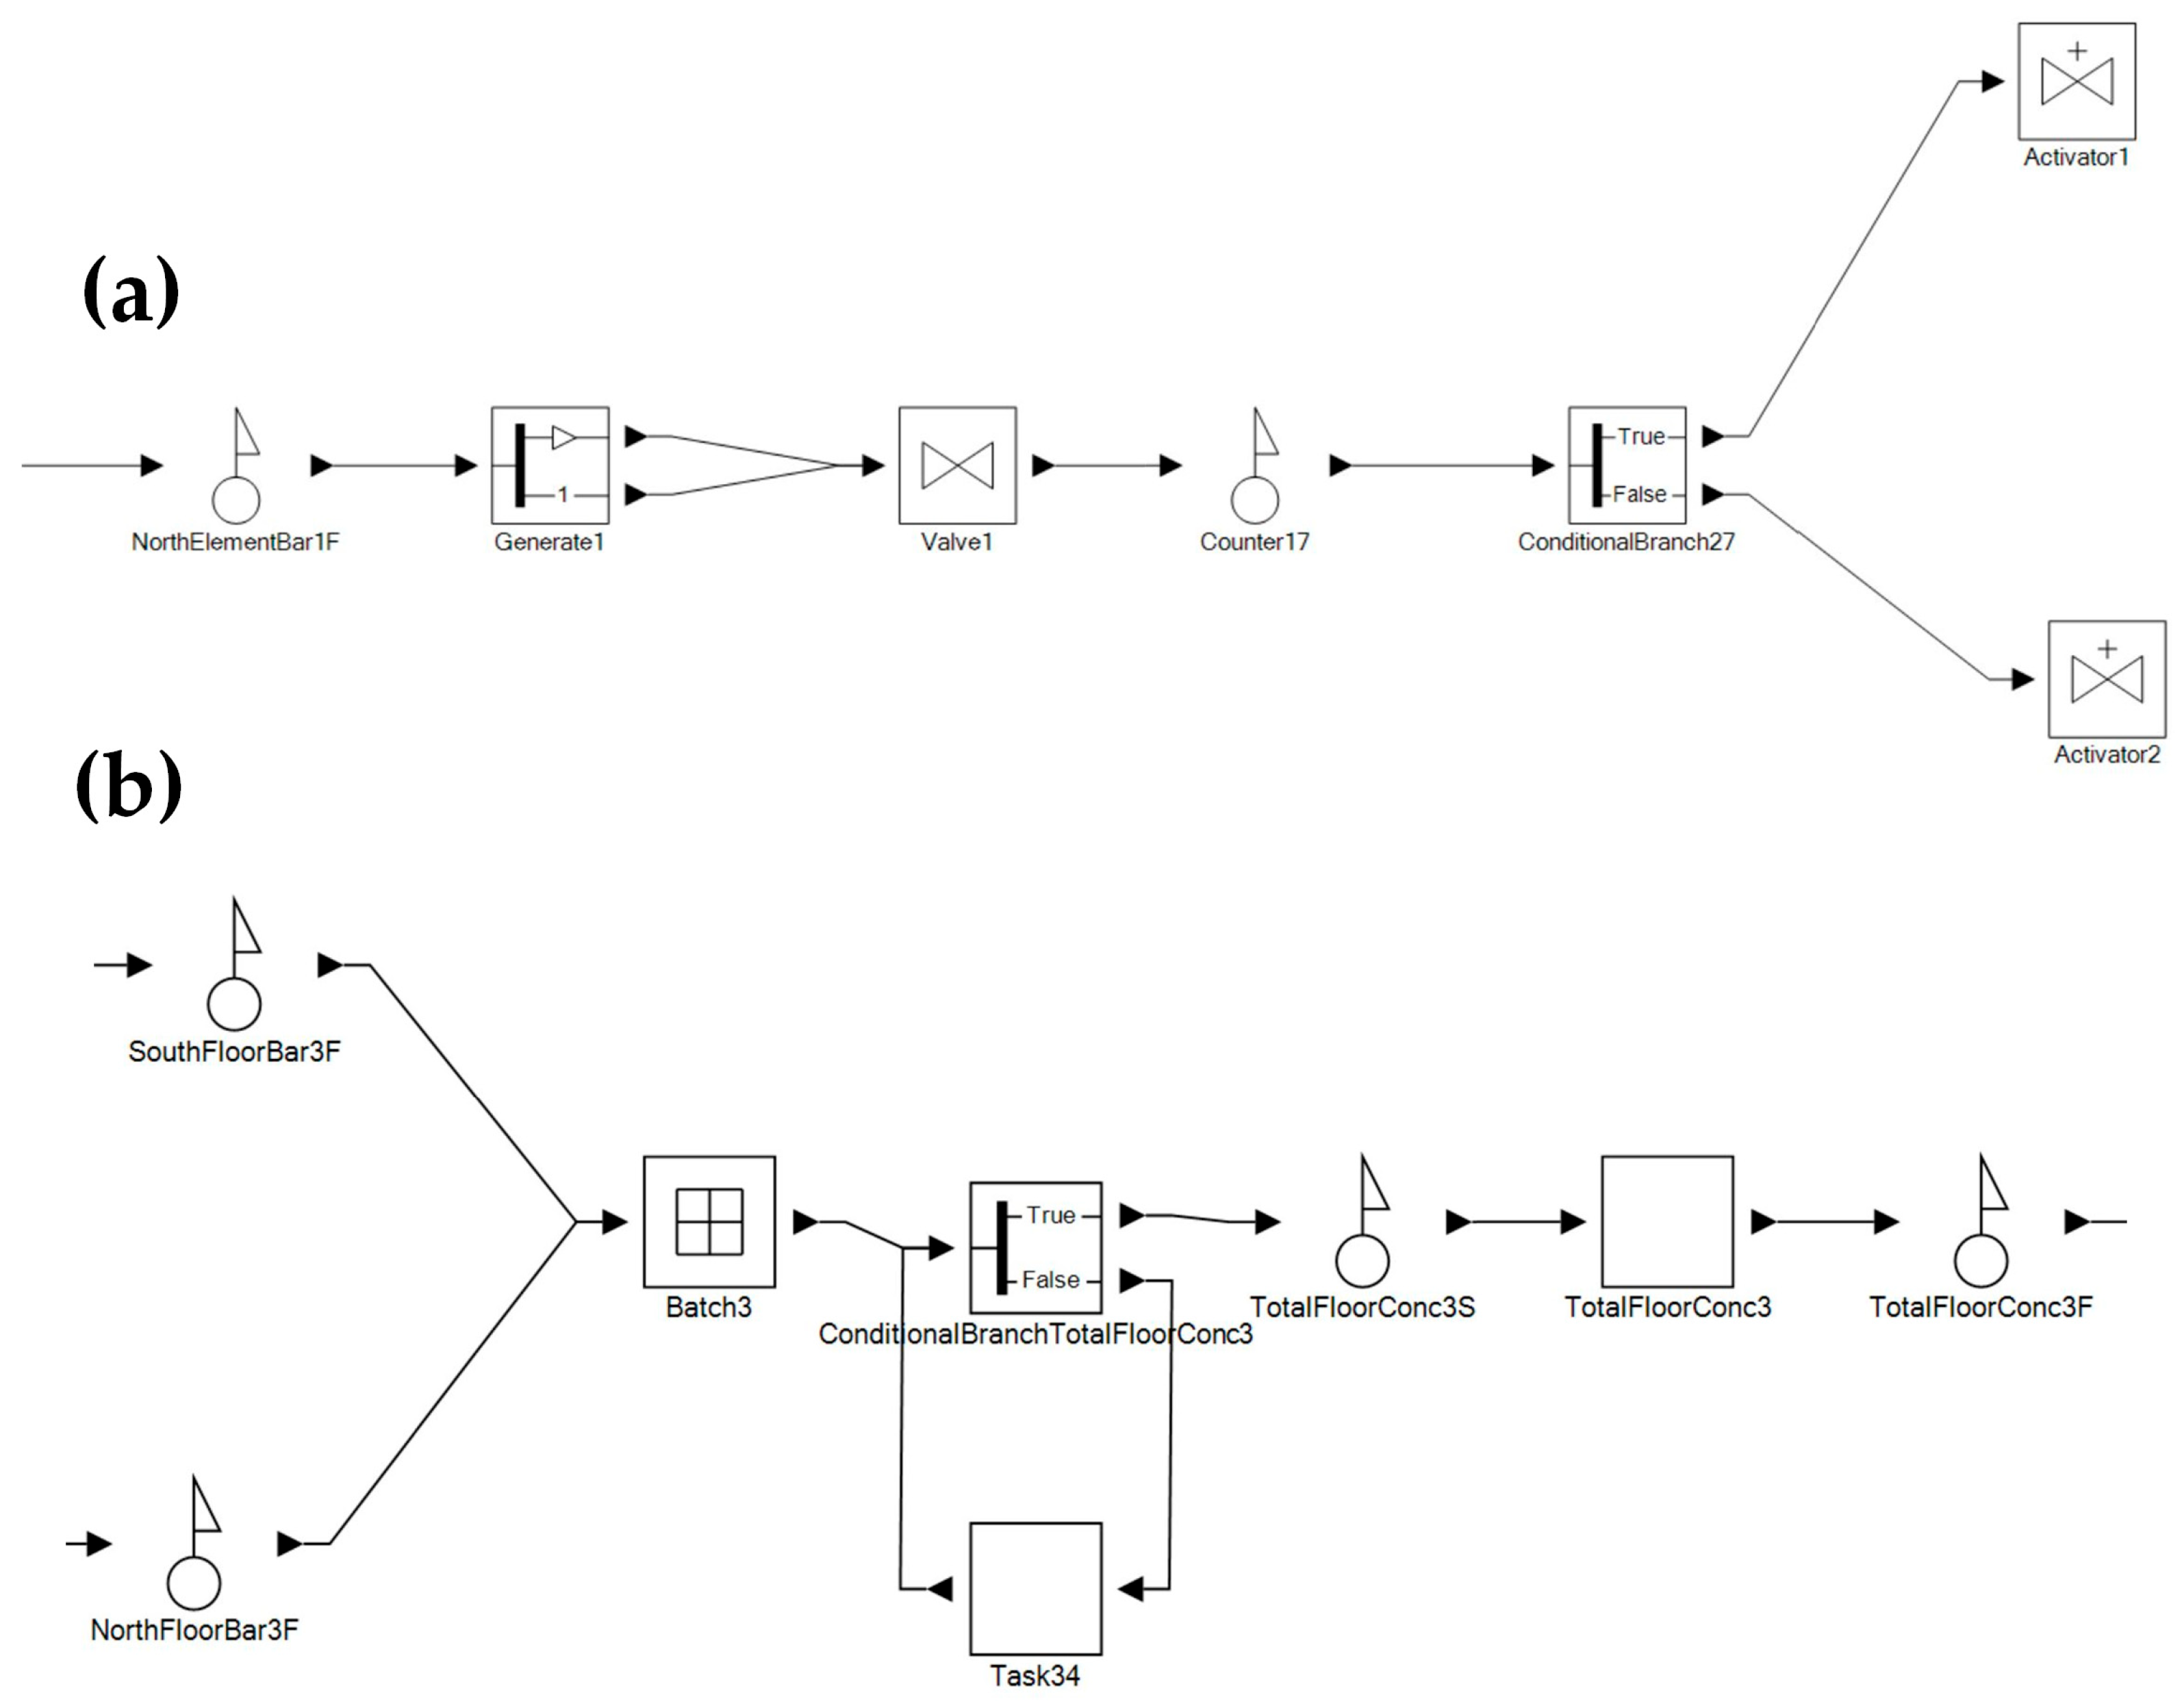
The simulation progresses in three stages, beginning with a single entity. New entities are created only when parallel activities are present, ensuring adaptability. If no parallel activities exist, the simulation continues with a single entity. During navigation, entities are evaluated for operational status and budget feasibility. In the final integration phase, all parallel processes merge into a unified outcome (Figure 6).
By coordinating these entities, the simulation accurately models parallel activities, identifies interdependencies, and integrates them into a comprehensive project overview. Once the simulation is complete, the system provides detailed start and finish times, the cumulative project cost over the entire duration, and task durations.
This adaptive simulation process ensures that cost and time calculations remain dynamic and realistic, incorporating critical factors, such as productivity shifts and budget variations. By accurately modeling real-world complexities, the simulation is a reliable tool for effective project management and planning.

3.6. Implementation of ACOR Algorithm

The ACOR algorithm (Ant Colony Optimization for Continuous Domains) was coded for seamless integration with the process simulation and implemented in a parallel, multithreaded configuration to maximize resource utilization and computation speed. Its purpose is to optimize project costs and scheduling. The decision variables, task cost and task duration, are continuous, and therefore best represented in a continuous search space.
The ACOR algorithm operates through the following steps:
Initialization: Define parameters such as pheromone evaporation rate, pheromone deposition rate, and problem dimensions.
Solution Population: Populate a matrix with random numbers representing project cost, time, and sequence. The number of solutions is set to ten times the problem dimension, where the dimension (n) equals the number of simulation activities (35).
Pheromone Model: Solutions are evaluated based on normalized weights and performance. Higher-performing solutions are assigned greater probabilities, although lower-performing ones are still considered to maintain diversity. Once a solution is selected, a Gaussian distribution is generated, where the mean represents the decision variable value and the standard deviation controls diversity. A higher standard deviation promotes exploration, while a lower value supports convergence. New solutions are sampled iteratively and sorted, with the least promising eliminated. This adaptive search process continues until either a predefined iteration limit is reached or convergence is achieved.
Iteration Process: Ants simulate movement through project activities, with each path representing a potential solution. Movement is influenced by heuristic information and pheromone levels.
Objective Function: The goal is to minimize project cost and time while meeting all constraints, including budget limits and activity dependencies. Reducing costs directly contributes to shorter project durations, which in turn affects indirect costs, direct costs, bonuses, and penalties.
Pheromone Update: Pheromone levels are adjusted based on the quality of solutions, guiding subsequent ants toward more effective paths.
Convergence: Three termination conditions are applied:
1-
No valid solution: If all solutions are invalid, the optimization stops to prevent the propagation of invalid results, improving speed and performance.
2-
Distribution-based criteria: In population-based algorithms, termination occurs when solutions cluster near the optimum. This can be measured using decision variables, objective function, or both [48]. Given that ACOR is a population-based algorithm, such a criterion is used for termination [49]. ACOR takes the following approach: when the normalized improvement of the best solution falls below a defined threshold, the population is considered converged and optimization stops. In this study, convergence was assessed using Formula (4), with a threshold (Acc set at 5%).
A c c = G o a l   F u n c t i o n   B e s t   S o l u t i o n G o a l   F u n c t i o n   W o r s t   S o l u t i o n G o a l   F u n c t i o n   W o r s t   S o l u t i o n
3-
Exhaustion-based criteria: A maximum iteration limit is set to prevent excessive computational load. Once this limit is reached, the algorithm terminates. In this study, the maximum number of iterations was set to 10,000.
The ability of the ACO algorithm to dynamically adjust to changes in project constraints and conditions makes it a suitable tool for optimizing the cost and schedule of construction projects.
After the optimization process, the results are automatically saved in an Excel file. These results, organized into separate sections, include detailed information on each activity, the total project cost and duration, the project schedule, financial flow, and related data.

4. Results

4.1. Model Validation

The proposed model was validated using data from a real construction project—validation involved comparing the model’s predictions with the actual project outcomes. The contractor’s schedule had been developed solely based on previous experience, without accounting for financial constraints or factors affecting worker productivity. This approach led to substantial differences between the planned and actual project conditions, resulting in numerous problems.
According to this study’s findings, the contractor’s schedule estimated a project duration of 90 days, whereas the proposed model indicated 142 days. The project was ultimately completed on the 152nd day. As a result, the model reduced the scheduling error from 41% to 6.6%.
If construction-related factors had been incorporated into the original schedule, the proposed and actual schedules would have been more closely aligned, as the critical path identified by the model differed from that followed during execution. Another important aspect related to budget constraints was the workshop closure during the project, which—without adequate planning—could have halted operations due to lack of funds. The model in this study accounted for these constraints, resulting in a 15% reduction in operational shutdowns.
The monthly budgets for the project implementation for the first to the fourth months were USD 100,000, USD 25,000, USD 100,000, and USD 125,000, respectively, which were based on the actual contract between the client and the contractor. This budget constraint had a significant impact on project scheduling. After the model was completed, the final costs from the initial schedule, the actual project implementation, and the model output were compared (see Figure 7).
The results show that the actual total project cost is closer to the model output than to the project baseline, indicating higher scheduling accuracy. The lower cost projected in the initial plan is due to the omission of budget limitations over time in the project baseline, which led to numerous implementation issues. Figure 7a–c present the cash flow and expenditure diagrams for the project baseline, actual execution, and the model.
As shown in Figure 7b, although the total project budget exceeded the anticipated cost, there were periods during the execution when costs surpassed the available budget. Because this was not accounted for in the initial planning, it led to issues such as temporary project shutdowns due to insufficient funds, an extended overall project duration, and higher indirect costs from penalties.
Figure 7c illustrates that penalties, reduced worker productivity, and delays in project execution over time resulted in higher actual costs than initially anticipated, highlighting the problem of inadequate planning.
The schedule produced by the model, accounting for reduced operational shutdowns and budget constraints, resulted in a 15% decrease in workshop closures, significantly lower indirect costs and penalties, and improved resource productivity. These factors ultimately reduced the total project cost. Moreover, throughout execution, project costs remained below the available budget.

4.2. Estimation of Workers’ Productivity over Time

While the optimal execution of activities occurs at their normal cost and duration, project constraints, such as tight deadlines or budget limits, often necessitate extending or crashing activity durations. These modifications, however, can lead to increased activity costs. Such changes are closely linked to workers’ productivity, which has a significant impact on the total project cost and duration. To improve scheduling accuracy, it is essential to estimate these variations with precision.
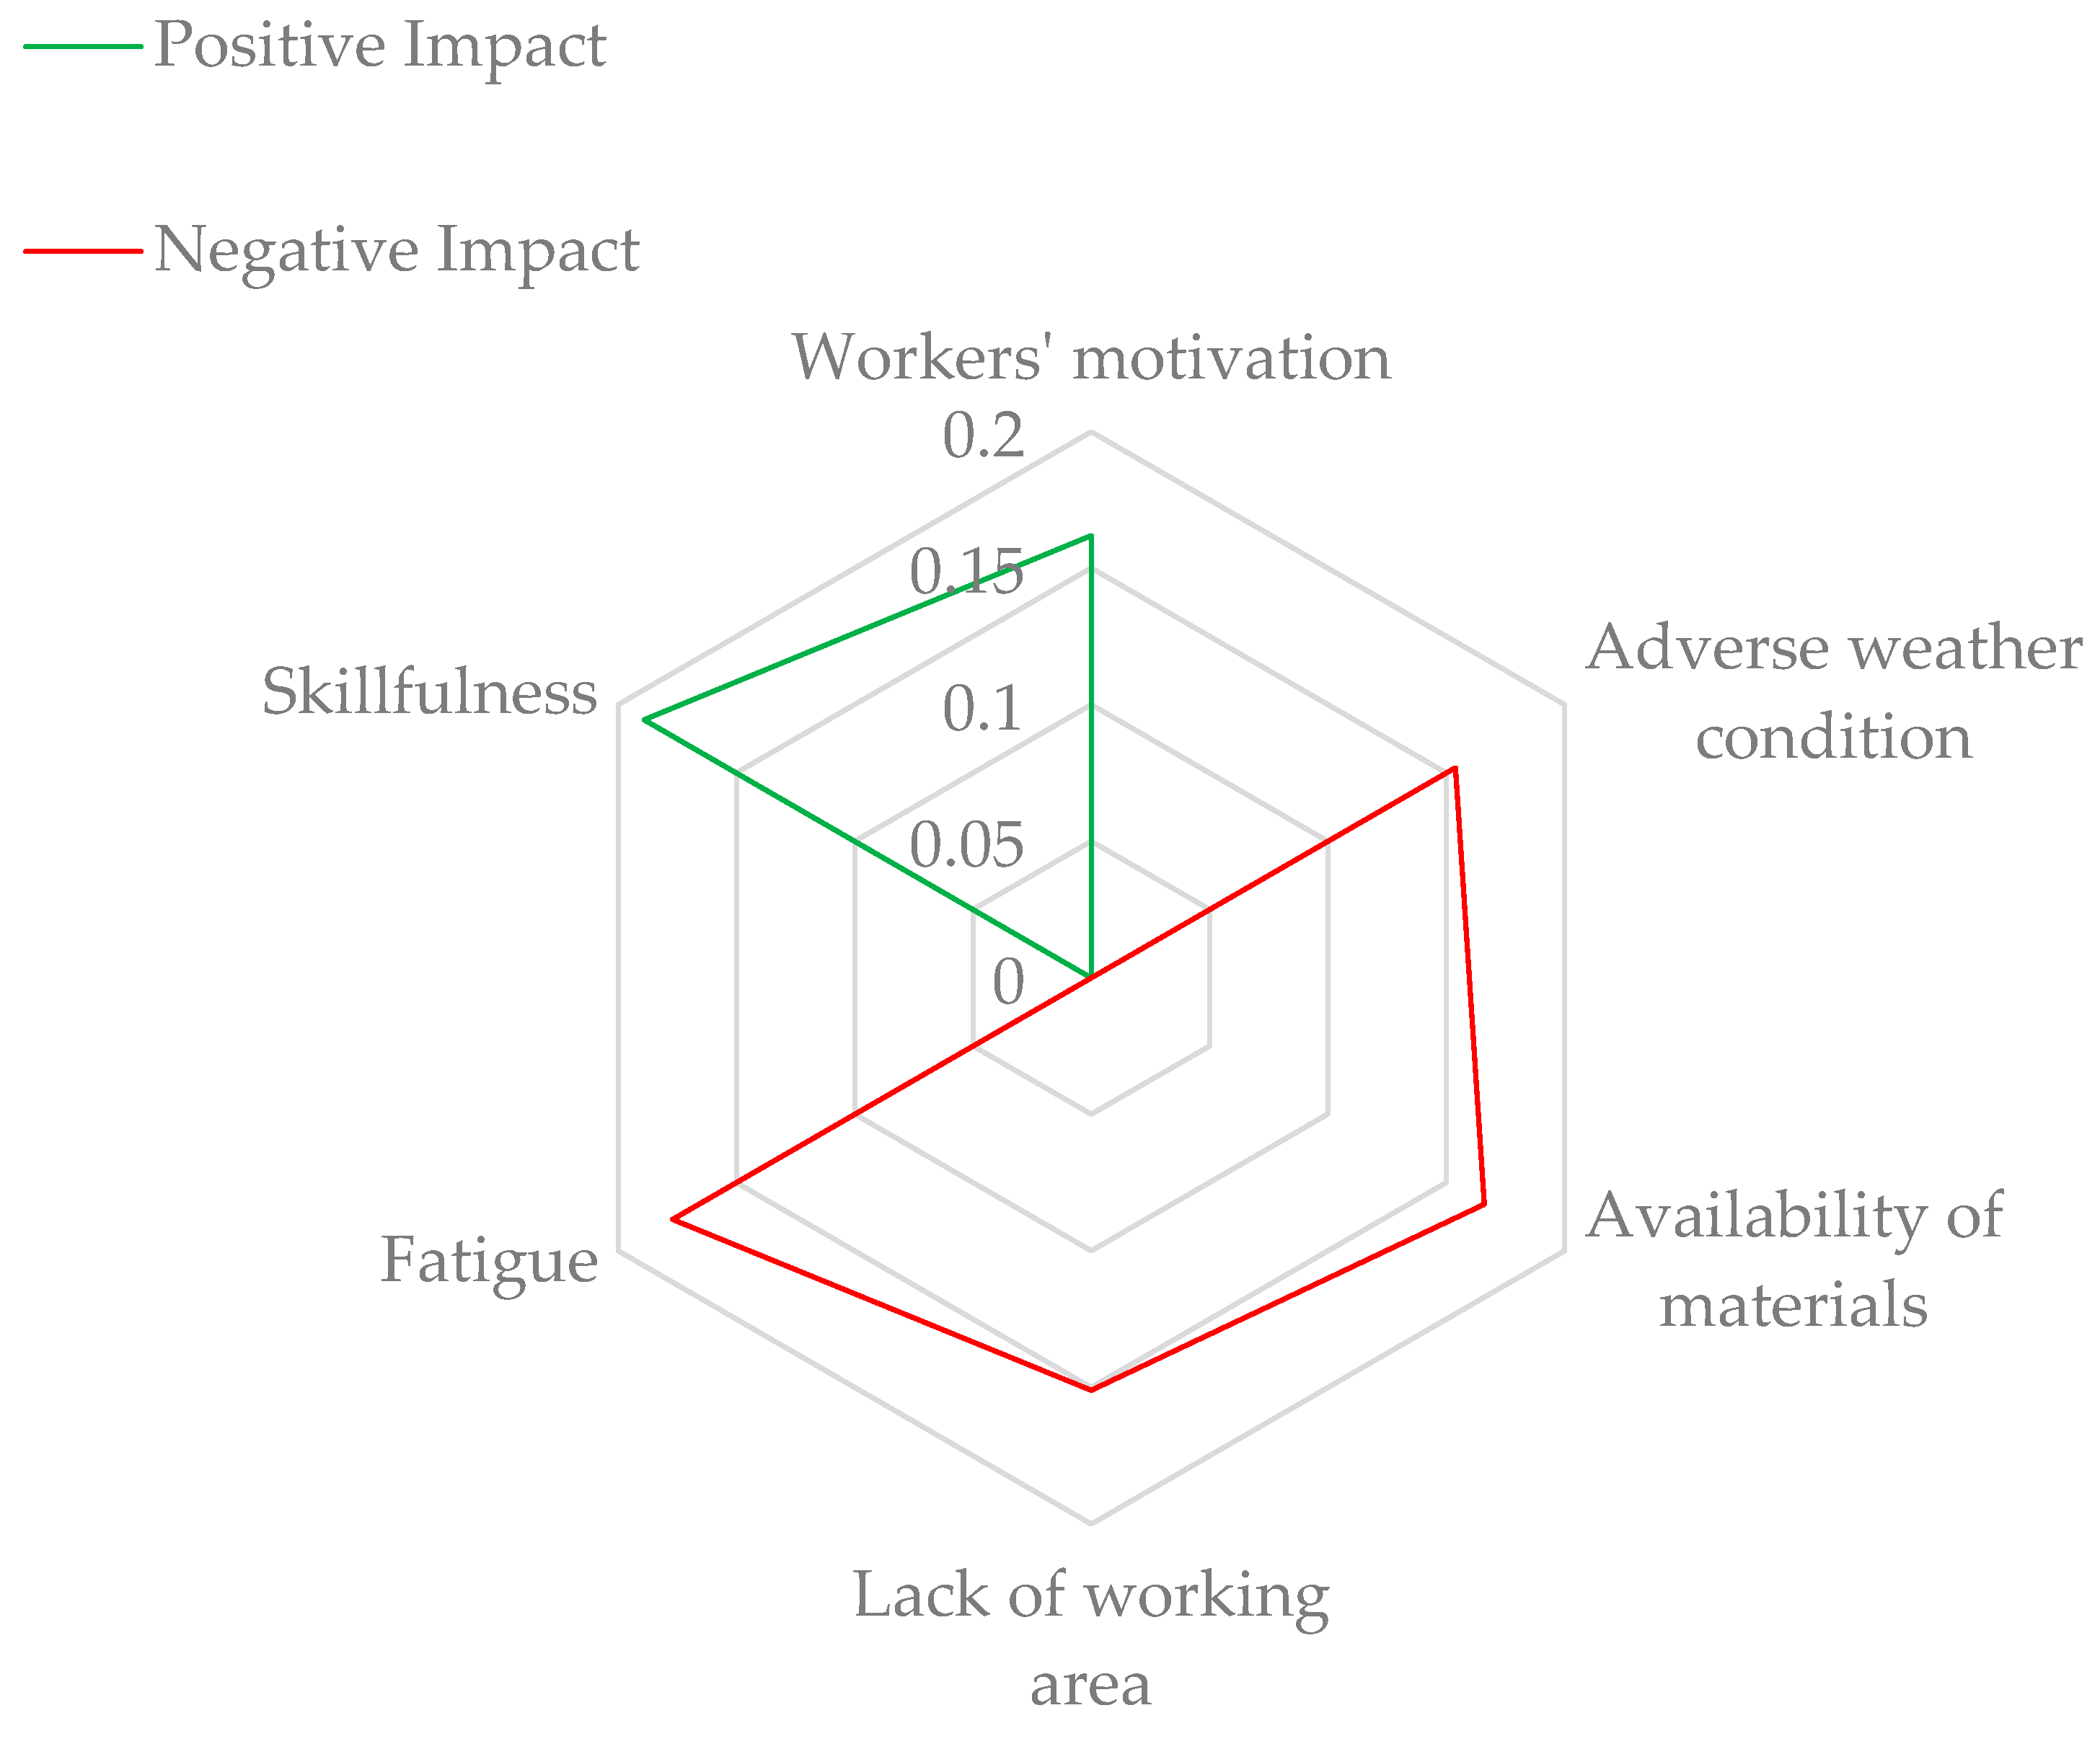
Of all the factors influencing workers’ productivity, two, (1) motivation and (2) skill level, had a direct positive impact. In contrast, four factors, (1) fatigue, (2) adverse weather conditions, (3) limited working area, and (4) material availability, had a direct negative impact on productivity. Figure 8 illustrates the effect of these factors on workers’ productivity over time, based on their assigned weights.
This study used SD to model productivity variations over time when activities were either crashed or extended. The analysis focused on key construction tasks, including formwork, rebar, and concrete work. The results, summarized in Table 2, show monthly changes in productivity. For example, concrete pouring productivity declined from 27.87 m3/day in the first month to 20.38 m3/day by the third month. Similar downward trends were observed in reinforcement and formwork activities.
Human productivity was found to decline over time due to productivity-reducing factors outweighing productivity-enhancing elements.
The model applied AnyLogic software (version 8.3) to capture the dynamics of these influencing factors and their interdependencies, reflecting their effects across the project timeline. This approach enables estimation of the final cost increase parameter through analysis of worker productivity variations.
Because this technique effectively addresses the complexities of nonlinear time–cost trade-offs in construction activities, it provides a more adaptable and accurate framework for project scheduling.
It is important to note that these findings are specific to the project examined in this study; the influencing factors and their interactions vary across projects, highlighting the importance of tailoring such dynamic models to individual project conditions.

4.3. Optimization Results

The large amount of data, numerous constraints, and the scale and comprehensiveness of the model result in an infinite number of possible scheduling scenarios. This creates an NP-HARD optimization problem that requires a metaheuristic and evolutionary optimization algorithm to solve it. When selecting a suitable algorithm, in addition to speed, optimization accuracy, and convergence capability, the functionality and nature of the algorithm are critical considerations.
The ant colony algorithm was chosen for its dynamic optimization capability, meaning that as the objective function changes over time, the optimization path also changes accordingly. This makes it highly suitable for the nature of this study and provides a foundation for further model development. The algorithm also demonstrates high speed, accuracy, and convergence performance. After 10,000 iterations in this study, it achieved an error rate of 6.7%, indicating strong convergence.
The model presented in this paper was executed twice: once with the optimization process and once without it. A comparison of the results shows that optimization had a substantial impact on improving the quality of the model output to the extent that the model has limited practical value without it.
As shown in Table 3, omitting the optimization process extended the project completion time by four days compared with the optimized model. The workshop shutdown period also increased from 28 days to 31 days. In addition, the cost of project completion without optimization was higher by USD 59,675. These results indicate that the optimization process provides significant benefits, reducing the total project cost by 15%.
The sensitivity analysis in Table 4 compares the proposed model with and without optimization, as well as the effects of ±10% changes in productivity on the optimized model. The base optimized model achieved the lowest total cost and a shorter duration than the non-optimized model, highlighting the benefits of continuous reoptimization.
A 10% increase in productivity shortened the schedule by 9 days but increased costs by 7.6% due to accelerated resource utilization. In contrast, a 10% decrease in productivity extended the project by 5 days and increased costs by 8.3%, driven by higher indirect expenses and penalties. These results suggest that productivity changes have a greater impact on project duration than on total cost, highlighting the importance of productivity management in schedule optimization.

4.4. Improved Scheduling Accuracy and Dynamic Scheduling

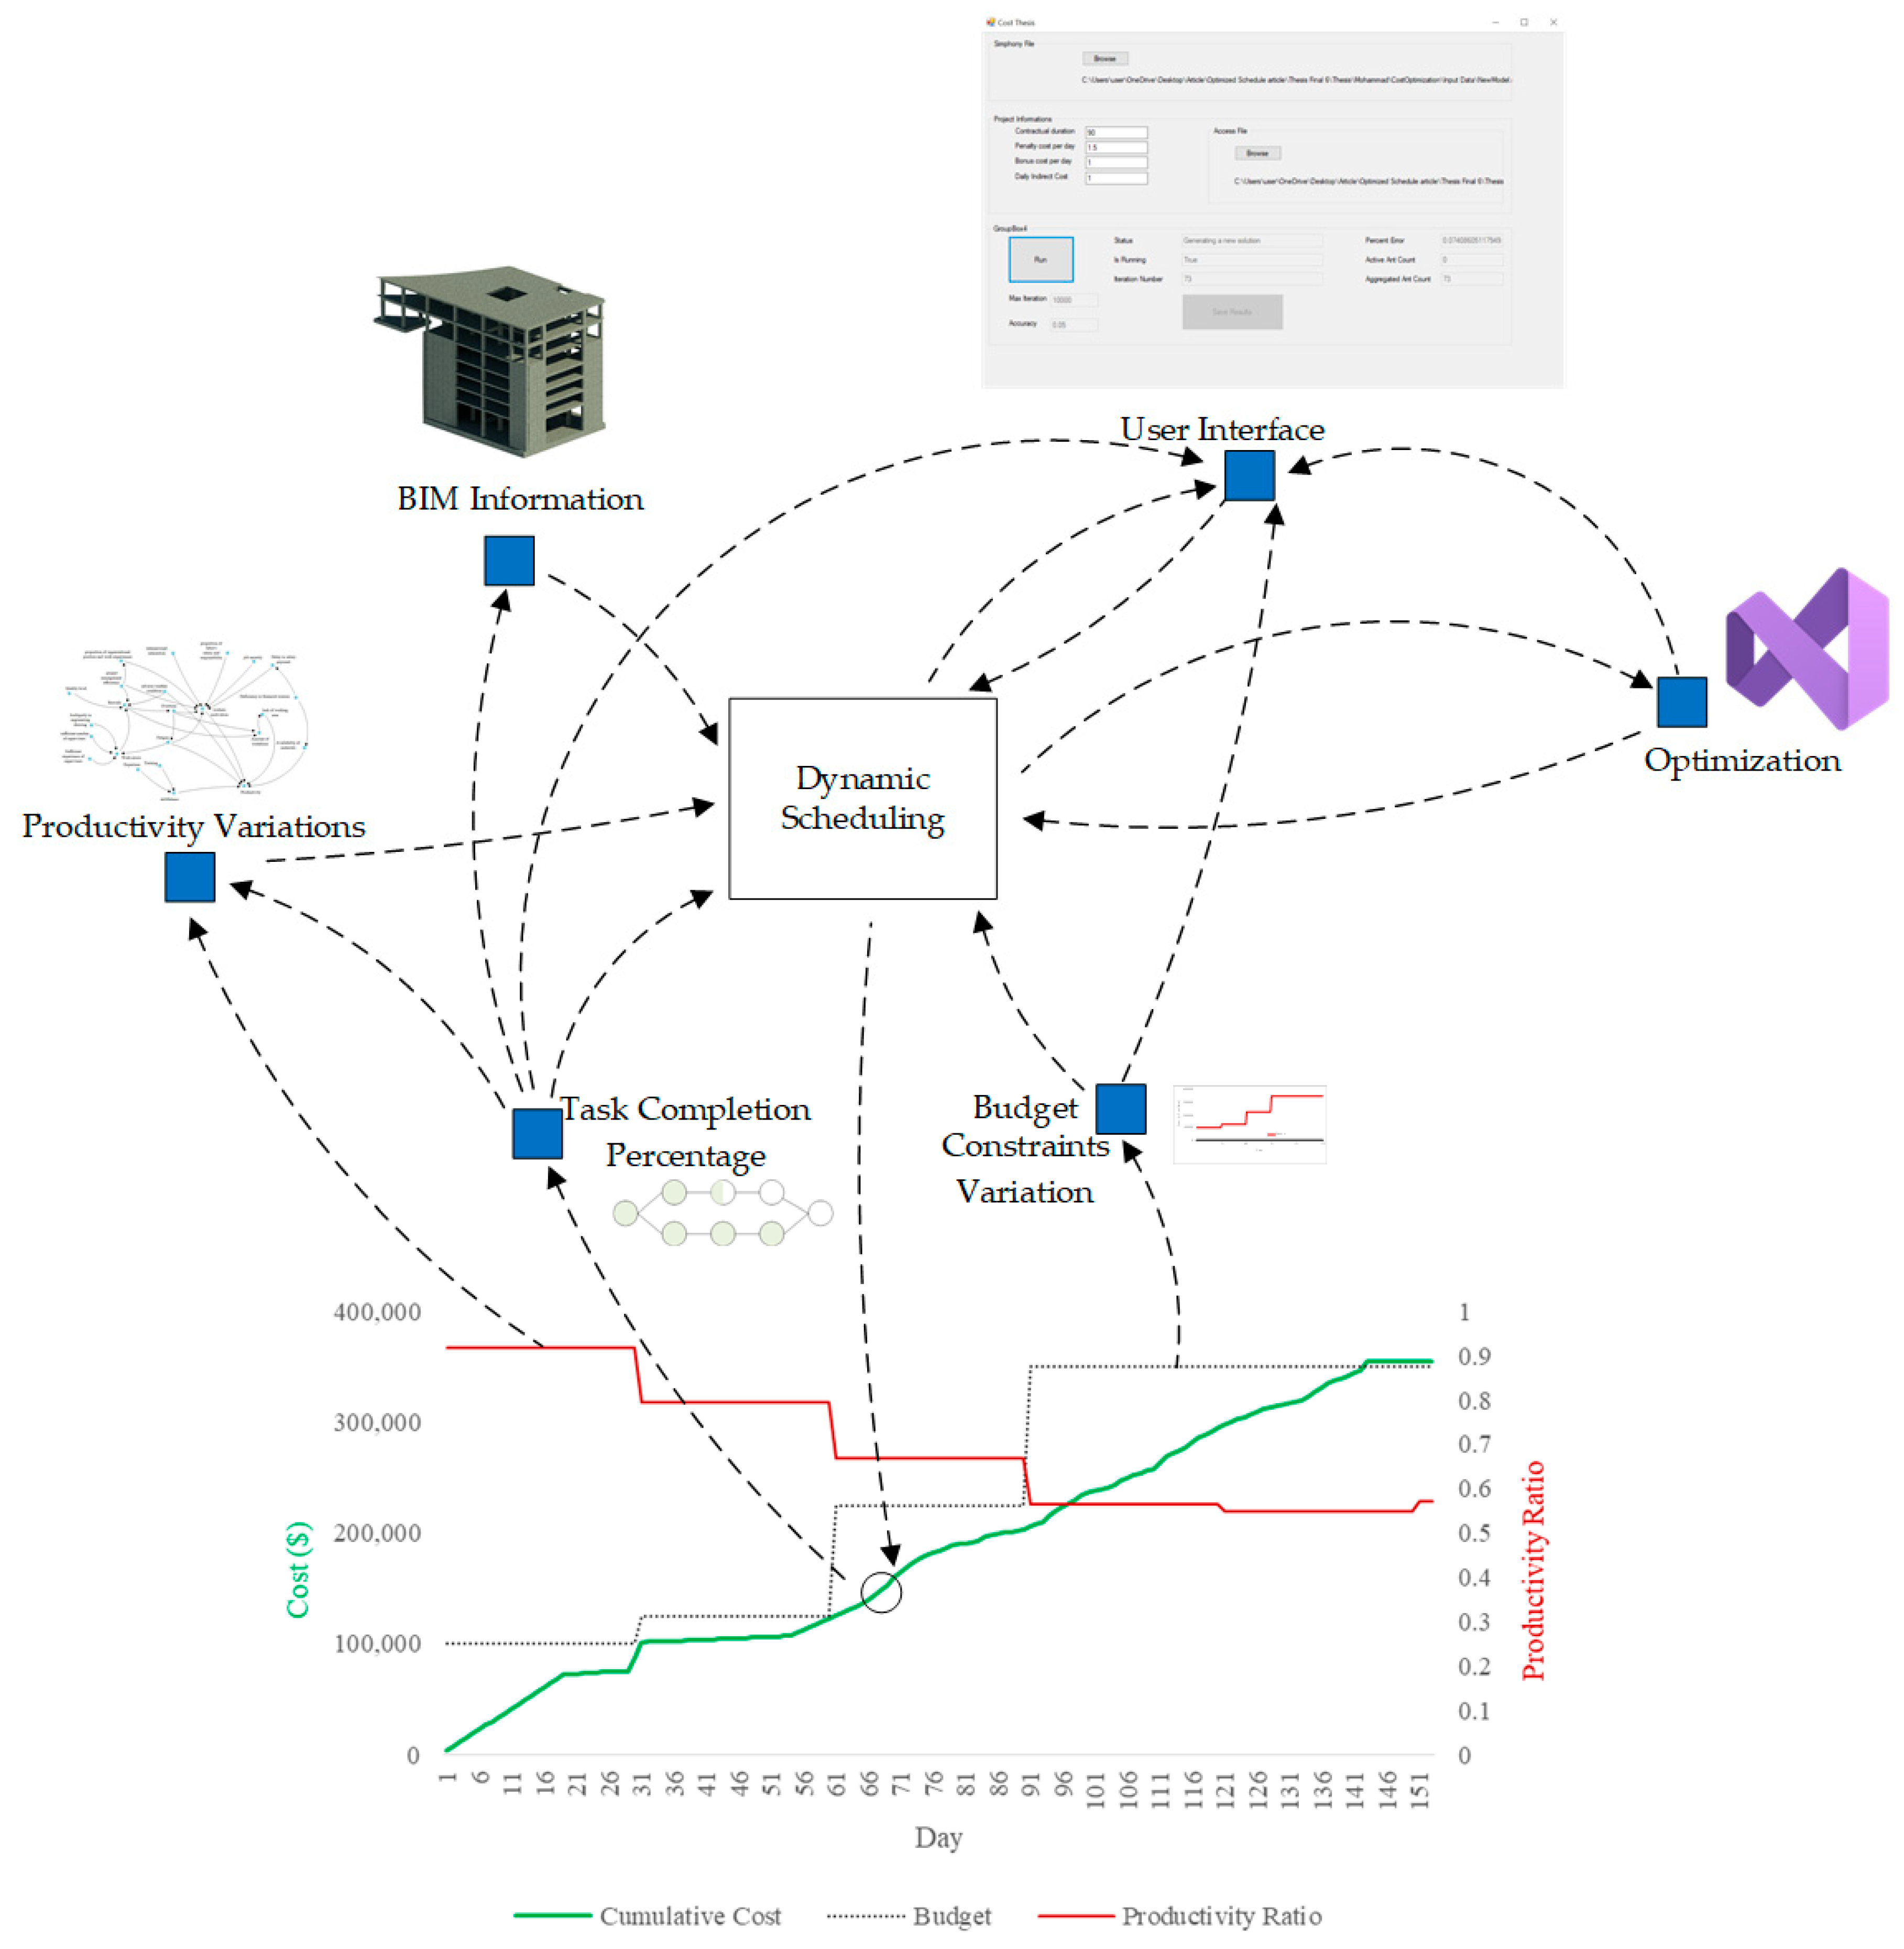
Figure 9 shows the framework of the dynamic scheduling model presented in this study. Integrating BIM data, worker productivity factors, and nonlinear cost–time relationships improves scheduling accuracy, aligning results more closely with actual outcomes. The model accounts for constraints, execution modes, sequencing, and budget limits to improve precision.
Fluctuating productivity and budget constraints lead to variations in costs and durations, which affect activity timing and overall schedules. Traditional scheduling methods are often error-prone and time-consuming and may exceed practical capabilities. The proposed model provides a dynamic and efficient solution by incorporating cost and duration variations, ensuring accuracy in managing complex dependencies. It supports parallel, sequential, and hybrid scheduling approaches to meet a range of project requirements.
Cost data is continuously updated to identify deviations and maintain financial constraints. Dynamic budget adjustments enable real-time optimization by reflecting monthly financial changes and ensuring schedule feasibility. This integration bridges the gap between practical scheduling and financial limitations, enabling project managers to achieve optimal results.
One of the key challenges in BIM-based scheduling is component synchronization. The proposed model automates all scheduling steps beyond the initial activity setup, ensuring accuracy by explicitly defining project constraints. Despite its complexity, the model achieves significant automatic synchronization
The model is capable of maintaining coherent parallel and sequential scheduling across multiple project zones while simultaneously satisfying time, budget, and precedence constraints. This synchronization is achieved through the programmatic integration of Building Information Modeling (BIM), Discrete Event Simulation (DES), system dynamics, and ACOR. The framework dynamically adapts to productivity fluctuations over time, ensuring consistency and feasibility throughout the evolving project schedule.

5. Discussion

The results indicate that the proposed framework delivers substantial improvements over both the contractor’s baseline schedule and established dynamic scheduling approaches. Across all evaluation metrics, it achieved a 34.4% increase in scheduling accuracy and a 13% improvement in project cost prediction accuracy, underscoring its capacity to outperform conventional practice. When compared with BIM–GA [11] and BIM–DES [14,15] methods, the framework demonstrated superior adaptability, achieved through the continuous reoptimization of schedules using real-time productivity and budget data. Against the hybrid DES–SD model [22], the integration of ACOR optimization contributed a further 6–10% increase in scheduling accuracy while reducing idle time—performance gains that were not observed in non-optimized models.
The incorporation of nonlinear time–cost trade-offs represents a methodological advance over previous work [34,36], which often neglected budget constraints and lacked mechanisms for real-time responsiveness. This feature enables the framework to account for complex interdependencies between cost and duration, thereby producing schedules that are not only more accurate but also better aligned with practical project constraints.
Replication of these results in different project contexts entails several preparatory steps: developing a project-specific BIM model, conducting a detailed productivity factor assessment, defining budget profiles, simulating processes, and calibrating ACOR parameters to reflect project scale and complexity. While the workflow is broadly applicable, its impact is mediated by factors such as project type, resource heterogeneity, and site conditions. In more complex or resource-constrained settings, the framework’s continuous reoptimization is likely to yield particularly pronounced gains in accuracy and efficiency. For smaller or more stable projects, the improvements may be less dramatic but remain meaningful in enhancing reliability.

6. Conclusions

This study provides strong evidence of the effectiveness of the proposed technique in improving the efficiency and accuracy of construction project management. The model’s dynamic nature allows for real-time modifications, which are essential for reducing cost overruns and delays and for enabling an agile project delivery approach. By adopting BIM technology, construction firms can better adhere to project timelines, achieve more accurate financial planning, and improve overall resource productivity.
The policy implications outlined in this paper highlight the need for standardization, real-time monitoring, and training to fully realize the potential benefits of the proposed model in the construction industry. These findings add to the growing body of literature advocating for the integration of advanced modeling approaches into project management.
A comparison of the schedule generated by the proposed model and those from the initial plan and the actual project execution leads to the following conclusions:
  • The use of enriched data from a BIM model significantly improves the accuracy of work quantity evaluations, which in turn improves the precision of activity duration estimates at each stage of the project. Integrating BIM with construction process simulation allows constraints such as budget limits and activity sequences to be seamlessly incorporated, giving stakeholders a clearer understanding of project progress and planning.
  • The inclusion of the factors that affect productivity and accounting for monthly budget limits improved the accuracy of estimating the overall project completion time by 33%. In addition, the use of SD allows both direct and indirect factors influencing productivity over time to be considered, providing greater flexibility in identifying the causes of productivity fluctuations throughout the project.
  • Through the integration of system dynamics, BIM, process simulation, and optimization produced notable improvements, including a 4% reduction in total costs compared with real-world execution and a 9% decrease in project duration. The optimization process proved highly effective, reducing the error margin to 6.7% after 10,000 iterations, with project duration shortened by 3% and costs reduced by 15%.
  • The integration of BIM, SD, and process simulation with optimization improved project management by utilizing enriched data, dynamically incorporating productivity factors, and efficiently integrating constraints and optimization steps. This resulted in a more efficient and accurate project execution.
  • Despite the demonstrated benefits of the proposed dynamic BIM-driven scheduling framework, several limitations must be acknowledged. First, the model requires accurate and high-resolution productivity data, which may not always be readily available in all construction contexts. Second, the implementation assumes a certain level of BIM maturity and technical expertise, which could be a barrier for small- to mid-scale firms. Third, the model’s computational demands are relatively high due to the simulation of complex project activities across multiple zones, which may limit its real-time deployment for very large or complex projects.
  • Future research could explore the integration of machine learning techniques to predict productivity trends and automate parameter tuning in the ACOR algorithm. Additionally, expanding the model’s applicability to different types of construction projects (e.g., infrastructure or residential housing) and validating it across various geographic and regulatory contexts would enhance its generalizability. Lastly, cloud-based deployment and user-interface simplification could help make the tool more accessible to practitioners in the industry.

Author Contributions

Conceptualization, M.E.G.A. and A.A.S.J.; methodology, M.E.G.A.; software, M.E.G.A. and S.O.; validation, M.E.G.A. and A.A.S.J.; investigation, S.O. and M.E.G.A.; resources, M.E.G.A.; writing—original draft preparation, M.E.G.A. and A.A.S.J.; writing—review and editing, A.A.S.J., M.E.G.A., and S.O.; supervision, A.A.S.J. All authors have read and agreed to the published version of the manuscript.

Funding

This research received no external funding.

Data Availability Statement

Data available on request from the authors.

Conflicts of Interest

The authors declare no conflicts of interest.

Abbreviations

The following abbreviations are used in this manuscript:
BIMBuilding Information Modeling
ACORContinuous Ant Colony Optimization
DESDiscrete Event Simulation
GAGenetic Algorithm
QTOQuantity Take-Off
PERTProgram Evaluation and Review Technique
CPMCritical Path Method
SDSystem Dynamics
QPIQuality Performance Index

References

  1. Love, P.E. Auditing the indirect consequences of rework in construction: A case based approach. Manag. Audit. J. 2002, 17, 138–146. [Google Scholar] [CrossRef]
  2. AlSehaimi, A.O.; Tzortzopoulos, P.; Koskela, L.J. Improving construction management practice with the Last Planner System: A case study. Eng. Constr. Archit. Manag. 2014, 21, 51–64. [Google Scholar] [CrossRef]
  3. Newell, A.; Simon, H.A. Human Problem Solving; Prentice-Hall: Englewood Cliffs, NJ, USA, 1972; ISBN 9781635617924. [Google Scholar]
  4. Chaarvika, I.; Bhatnagar, A.; Sammeta, R.; Balasubramanian, M.; Monisha, R. Comparison of Energy Analysis in a Residential Building Using Building Information Modeling. In Sustainable Construction Materials: Select Proceedings of ACMM 2021; Springer: Singapore, 2021; pp. 239–255. [Google Scholar]
  5. Haji, M.D.; Taghaddos, H.; Sebt, M.; Chokan, F.; Zavari, M. The effects of bim maturity level on the 4d simulation performance: An empirical study. Int. J. Eng. 2021, 34, 606–614. [Google Scholar] [CrossRef]
  6. Valinejadshoubi, M.; Moselhi, O.; Iordanova, I.; Valdivieso, F.; Bagchi, A. Automated system for high-accuracy quantity takeoff using BIM. Autom. Constr. 2023, 157, 105155. [Google Scholar] [CrossRef]
  7. Wang, W.-C.; Weng, S.-W.; Wang, S.-H.; Chen, C.-Y. Integrating building information models with construction process simulations for project scheduling support. Autom. Constr. 2014, 37, 68–80. [Google Scholar] [CrossRef]
  8. Khant, L.P.; Widjaja, D.D.; Kwon, K.; Kim, S. A BIM-Based Bar Bending Schedule Generation Algorithm with Enhanced Accuracy. Buildings 2024, 14, 1207. [Google Scholar] [CrossRef]
  9. Madihi, M.H.; Tafazzoli, M.; Javid, A.A.S.; Nasirzadeh, F. Probabilistic Cash Flow Analysis Considering Risk Impacts by Integrating 5D-Building Information Modeling and Bayesian Belief Network. Buildings 2025, 15, 1774. [Google Scholar] [CrossRef]
  10. Choi, J.; Kim, H.; Kim, I. Open BIM-based quantity take-off system for schematic estimation of building frame in early design stage. J. Comput. Des. Eng. 2014, 2, 16–25. [Google Scholar] [CrossRef]
  11. Wu, Z.; Ma, G. Automatic generation of BIM-based construction schedule: Combining an ontology constraint rule and a genetic algorithm. Eng. Constr. Arch. Manag. 2022, 30, 5253–5279. [Google Scholar] [CrossRef]
  12. Preece, C.N.; Barati, R.; Charehzehi, A. Enhancing planning and scheduling program by using benefits of BIM-based applications. Civ. Environ. Res. 2013, 3, 41–48. [Google Scholar]
  13. Wainer, G. Discrete-Event Modeling and Simulation: A Practitioner’s Approach; CRC Press: Boca Raton, FL, USA, 2017. [Google Scholar]
  14. Lu, W.; Olofsson, T. Building information modeling and discrete event simulation: Towards an integrated framework. Autom. Constr. 2014, 44, 73–83. [Google Scholar] [CrossRef]
  15. Abbasi, S.; Taghizade, K.; Noorzai, E. BIM-based combination of takt time and discrete event simulation for implementing just in time in construction scheduling under constraints. J. Constr. Eng. Manag. 2020, 146, 04020143. [Google Scholar] [CrossRef]
  16. AbouRizk, S.M.; Wales, R.J. Combined discrete-event/continuous simulation for project planning. J. Constr. Eng. Manag. 1997, 123, 11–20. [Google Scholar] [CrossRef]
  17. AbouRizk, S.; Halpin, D.; Mohamed, Y.; Hermann, U. Research in modeling and simulation for improving construction engineering operations. J. Constr. Eng. Manag. 2011, 137, 843–852. [Google Scholar] [CrossRef]
  18. AbouRizk, S. Role of simulation in construction engineering and management. J. Constr. Eng. Manag. 2010, 136, 1140–1153. [Google Scholar] [CrossRef]
  19. Dashti, M.S.; RezaZadeh, M.; Khanzadi, M.; Taghaddos, H. Integrated BIM-based simulation for automated time-space conflict management in construction projects. Autom. Constr. 2021, 132, 103957. [Google Scholar] [CrossRef]
  20. Lu, M.; Lam, H.-C.; Dai, F. Resource-constrained critical path analysis based on discrete event simulation and particle swarm optimization. Autom. Constr. 2008, 17, 670–681. [Google Scholar] [CrossRef]
  21. Konig, M.; Koch, C.; Habenicht, I.; Spieckermann, S. Intelligent BIM-based construction scheduling using discrete event simulation. In Proceedings of the 2012 Winter Simulation Conference (WSC), Berlin, Germany, 9–12 December 2012; pp. 1–12. [Google Scholar]
  22. Peña-Mora, F.; Han, S.; Lee, S.; Park, M. Strategic-operational construction management: Hybrid system dynamics and discrete event approach. J. Constr. Eng. Manag. 2008, 134, 701–710. [Google Scholar] [CrossRef]
  23. Wang, W.-C.; Demsetz, L.A. Model for evaluating networks under correlated uncertainty—NETCOR. J. Constr. Eng. Manag. 2000, 126, 458–466. [Google Scholar] [CrossRef]
  24. Haji, M.D.; Behnam, B.; Sebt, M.H.; Ardeshir, A.; Katooziani, A. BIM-based safety leading indicators measurement tool for construction sites. Int. J. Civ. Eng. 2022, 21, 265–282. [Google Scholar] [CrossRef]
  25. Barbosa, F.; Woetzel, J.; Mischke, J.; Ribeirinho, M.J.; Sridhar, M.; Parsons, M.; Bertram, N.; Brown, S. Reinventing Construction: A Route of Higher Productivity; McKinsey Global Institute: New York, NY, USA, 2017. [Google Scholar]
  26. Imagining Construction’s Digital Future McKinsey & Company. Available online: https://www.mckinsey.com/capabilities/operations/our-insights/imagining-constructions-digital-future (accessed on 18 January 2024).
  27. Ashcraft, H. Transforming project delivery: Integrated project delivery. Oxf. Rev. Econ. Policy 2022, 38, 369–384. [Google Scholar] [CrossRef]
  28. Al-Kofahi, Z.G.; Mahdavian, A.; Oloufa, A. System dynamics modeling approach to quantify change orders impact on labor productivity 1: Principles and model development comparative study. Int. J. Constr. Manag. 2020, 22, 1355–1366. [Google Scholar] [CrossRef]
  29. Leon, H.; Osman, H.; Georgy, M.; Elsaid, M. System dynamics approach for forecasting performance of construction projects. J. Manag. Eng. 2018, 34, 04017049. [Google Scholar] [CrossRef]
  30. Nasirzadeh, F.; Nojedehi, P. Dynamic modeling of labor productivity in construction projects. Int. J. Proj. Manag. 2013, 31, 903–911. [Google Scholar] [CrossRef]
  31. Yao, H.; Shen, L.; Tan, Y.; Hao, J. Simulating the impacts of policy scenarios on the sustainability performance of infrastructure projects. Autom. Constr. 2011, 20, 1060–1069. [Google Scholar] [CrossRef]
  32. Porwal, A.; Parsamehr, M.; Szostopal, D.; Ruparathna, R.; Hewage, K. The integration of building information modeling (BIM) and system dynamic modeling to minimize construction waste generation from change orders. Int. J. Constr. Manag. 2020, 23, 156–166. [Google Scholar] [CrossRef]
  33. John, S. System Dynamics: Systems Thinking and Modeling for a Complex World; Massachusetts Institute of Technology: Cambridge, MA, USA, 2002. [Google Scholar]
  34. Ballesteros-Pérez, P.; Elamrousy, K.M.; González-Cruz, M.C. Non-linear time-cost trade-off models of activity crashing: Application to construction scheduling and project compression with fast-tracking. Autom. Constr. 2019, 97, 229–240. [Google Scholar] [CrossRef]
  35. Deckro, R.F.; Hebert, J.E.; Verdini, W.A.; Grimsrud, P.H.; Venkateshwar, S. Nonlinear time/cost tradeoff models in project management. Comput. Ind. Eng. 1995, 28, 219–229. [Google Scholar] [CrossRef]
  36. Zhang, L.; Du, J.; Zhang, S. Solution to the time-cost-quality trade-off problem in construction projects based on immune genetic particle swarm optimization. J. Manag. Eng. 2014, 30, 163–172. [Google Scholar] [CrossRef]
  37. Sigalov, K.; König, M. Recognition of process patterns for BIM-based construction schedules. Adv. Eng. Inform. 2017, 33, 456–472. [Google Scholar] [CrossRef]
  38. ElMenshawy, M.; Marzouk, M. Automated BIM schedule generation approach for solving time–cost trade-off problems. Eng. Constr. Arch. Manag. 2021, 28, 3346–3367. [Google Scholar] [CrossRef]
  39. Faghihi, V.; Reinschmidt, K.F.; Kang, J.H. Construction scheduling using genetic algorithm based on building information model. Expert Syst. Appl. 2014, 41, 7565–7578. [Google Scholar] [CrossRef]
  40. Faghihi, V. Automated and Optimized Scheduling Using BIM. Ph.D. Thesis, Texas A&M U niversity, College Station, TX, USA, 2014. [Google Scholar]
  41. Wefki, H.; Elnahla, M.; Elbeltagi, E. BIM-based schedule generation and optimization using genetic algorithms. Autom. Constr. 2024, 164, 105476. [Google Scholar] [CrossRef]
  42. Long, L.D. A non-unit repetitive construction project scheduling with uncertainties. Autom. Constr. 2024, 164, 105428. [Google Scholar] [CrossRef]
  43. Wang, Y.; Chen, J.; Ning, W.; Yu, H.; Lin, S.; Wang, Z.; Pang, G.; Chen, C. A time-sensitive network scheduling algorithm based on improved ant colony optimization. Alex. Eng. J. 2021, 60, 107–114. [Google Scholar] [CrossRef]
  44. Li, H.; Zhang, H. Ant colony optimization-based multi-mode scheduling under renewable and nonrenewable resource constraints. Autom. Constr. 2013, 35, 431–438. [Google Scholar] [CrossRef]
  45. Socha, K.; Dorigo, M. Ant colony optimization for continuous domains. Eur. J. Oper. Res. 2008, 185, 1155–1173. [Google Scholar] [CrossRef]
  46. Tavakolan, M.; Chokan, F.; Haji, M.D. Simultaneous project portfolio selection and scheduling from contractor perspective. Int. J. Constr. Manag. 2023, 24, 298–313. [Google Scholar] [CrossRef]
  47. Mawdesley, M.J.; Al-Jibouri, S. Modelling construction project productivity using systems dynamics approach. Int. J. Prod. Perform. Manag. 2009, 59, 18–36. [Google Scholar] [CrossRef]
  48. Fernández-Vargas, J.A.; Bonilla-Petriciolet, A.; Rangaiah, G.P.; Fateen, S.-E.K. Performance analysis of stopping criteria of population-based metaheuristics for global optimization in phase equilibrium calculations and modeling. Fluid Phase Equilibria 2016, 427, 104–125. [Google Scholar] [CrossRef]
  49. Omran, M.G.; Al-Sharhan, S. Improved continuous Ant Colony Optimization algorithms for real-world engineering optimization problems. Eng. Appl. Artif. Intell. 2019, 85, 818–829. [Google Scholar] [CrossRef]
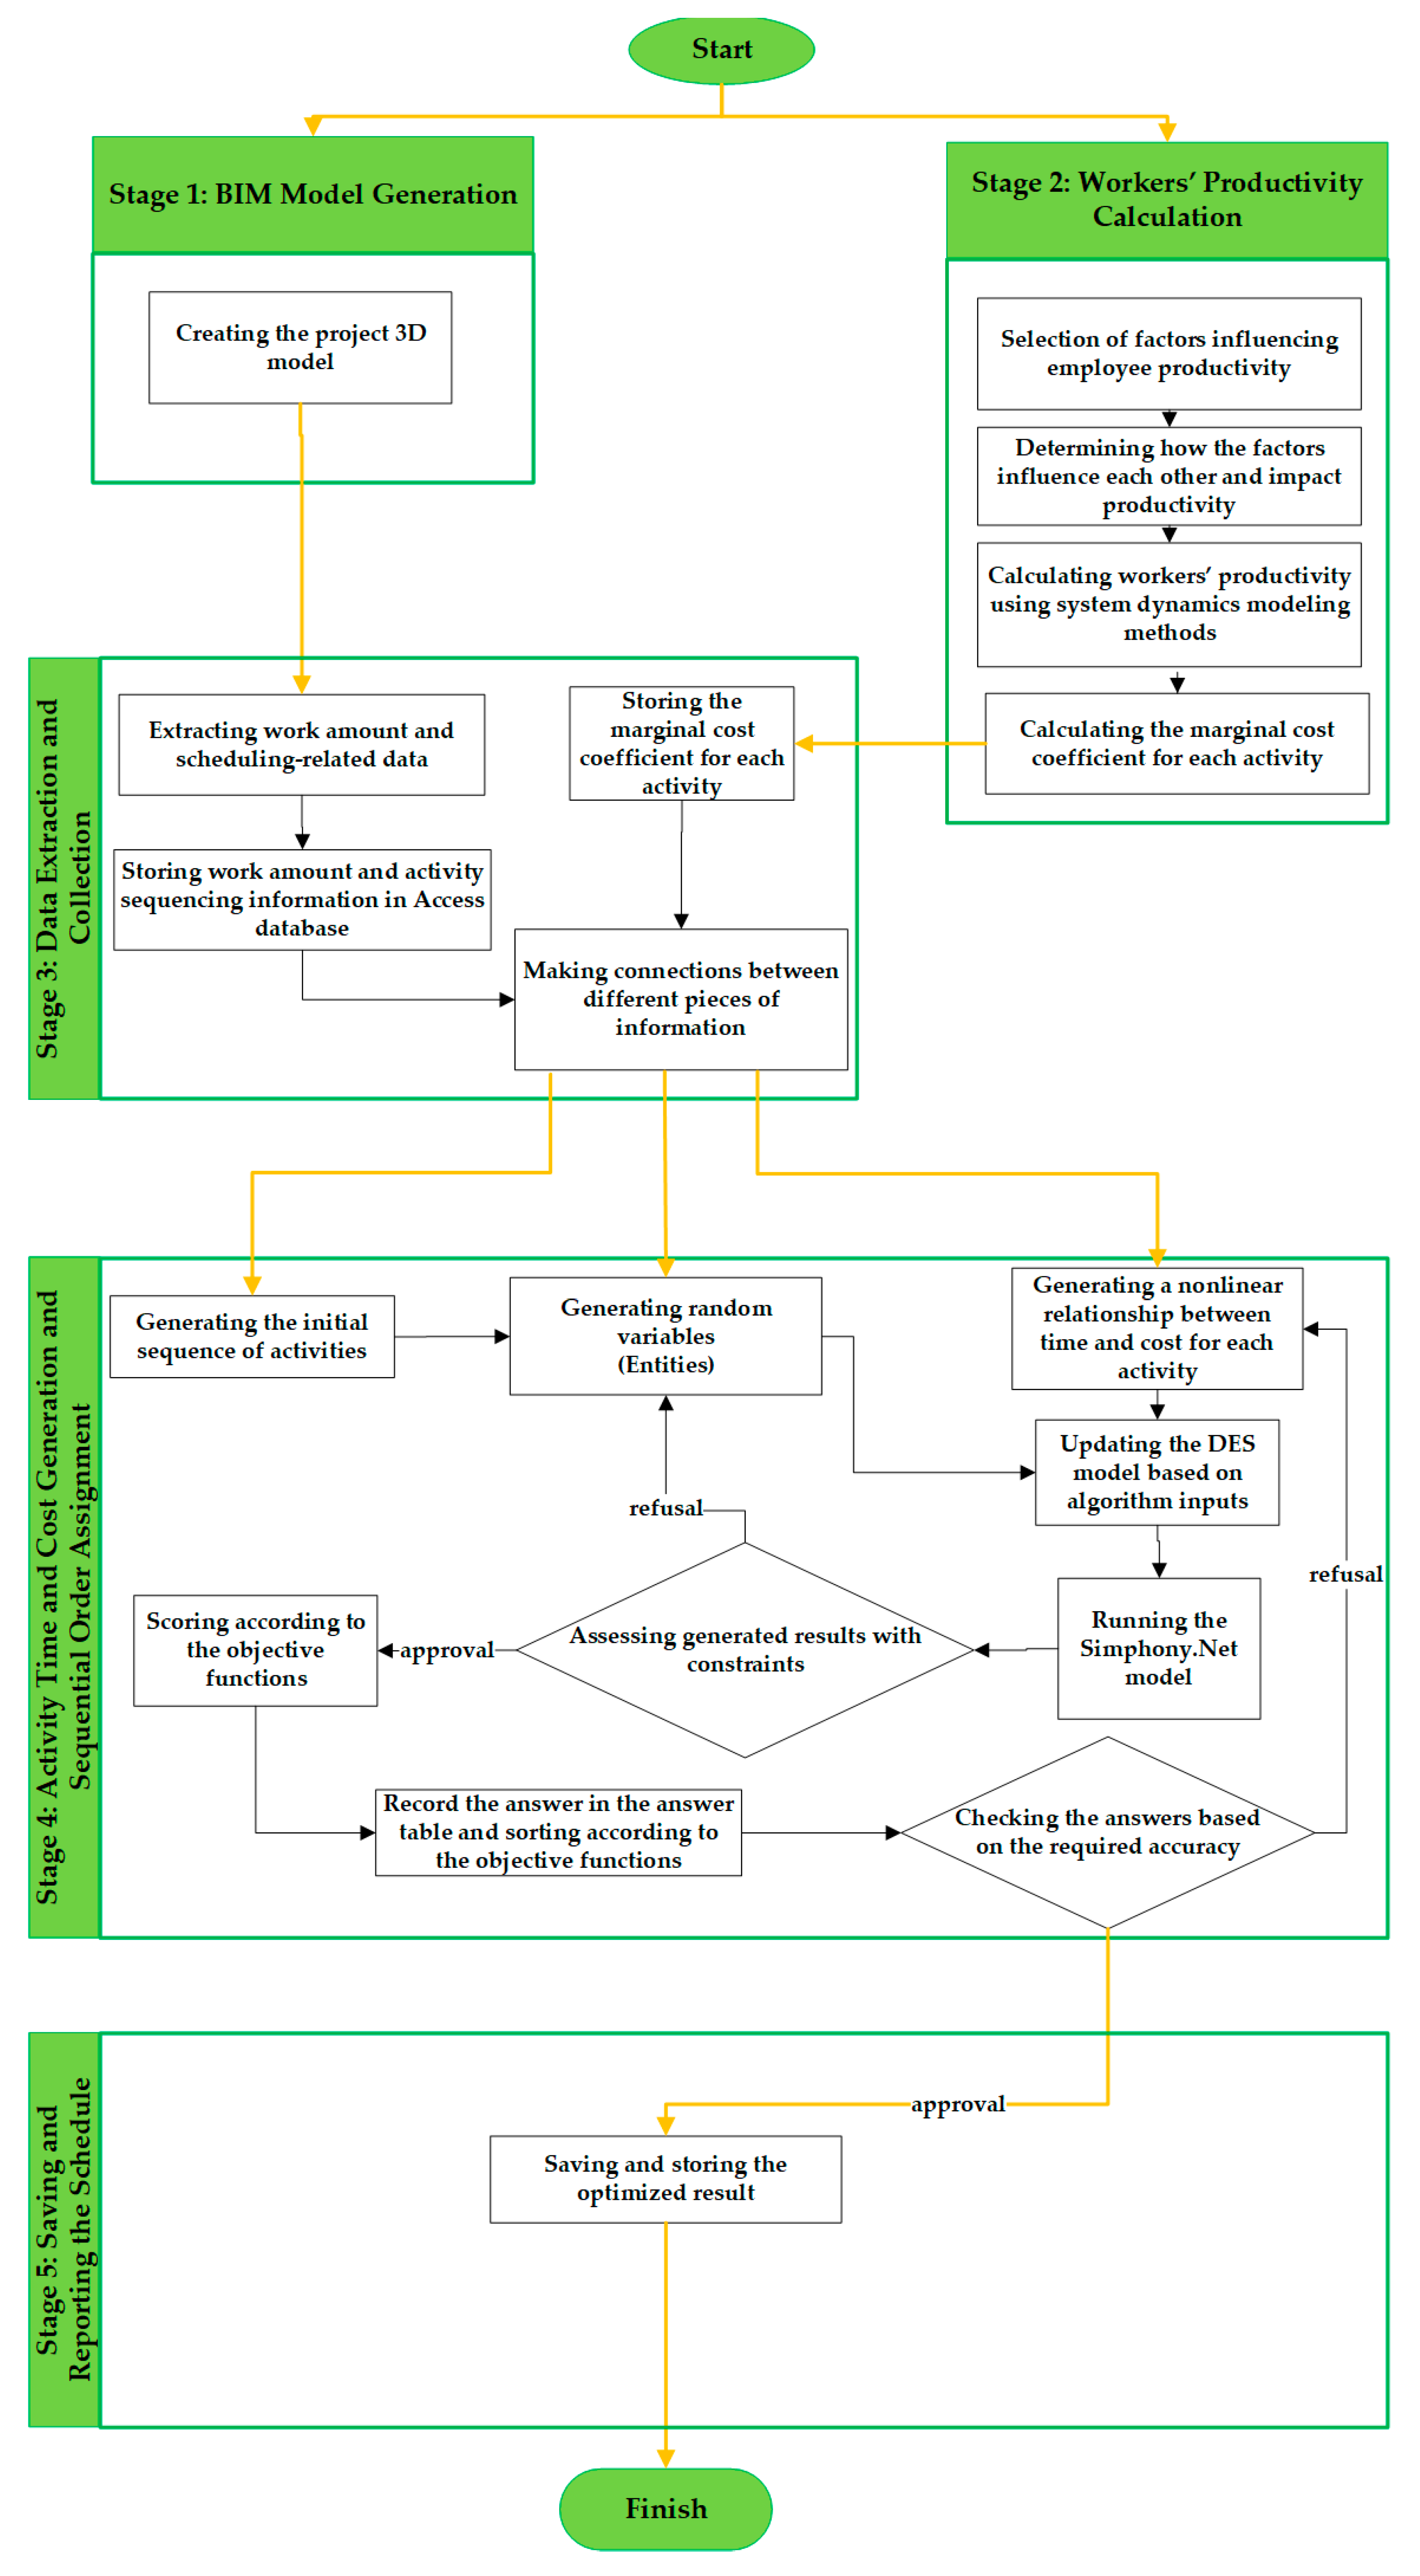
Figure 1. Methodology flowchart.
Buildings 15 03004 g001
Figure 2. Project BIM model (developed by the authors using Autodesk Revit).
Buildings 15 03004 g002
Figure 3. System dynamics representation of factors influencing workers’ productivity. (Item categories are adapted from Nasirzadeh and Nojedehi [30], while the causal links and overall structural relationships were developed by the authors to reflect the context of this study.).
Buildings 15 03004 g003
Figure 4. Time–cost trade-off diagram for the formwork activity in the southern section of the first floor: (a) second month and (b) third month.
Buildings 15 03004 g004
Figure 5. Diagram of entity and ants’ performance.
Buildings 15 03004 g005
Figure 6. (a) Generation of entities to cover parallel tasks. (b) Merging entities by employing “Batch”. The model was developed in Simphony.Net.
Buildings 15 03004 g006
Figure 7. (a) Comparison of budget and model cumulative cost. (b) Comparison of budget and baseline cumulative cost. (c) Comparison of budget and actual cumulative cost.
Buildings 15 03004 g007
Figure 8. Effect of factors on the basis of weights on workers’ productivity at time.
Buildings 15 03004 g008
Figure 9. Framework of dynamic scheduling.
Buildings 15 03004 g009
Table 1. Segment of the matrix showing the impact of various factors on one another and on workers’ productivity, based on normalized weights.
Factors Affecting Employee ProductivityWorker EnthusiasmDelays in Salary PaymentsFatigueWorkers’ Productivity
Workers’ Motivation0000.162
Job Security00.45800
Project Management Efficiency0.133000
Delays in Salary Payments0.14500.4690
Skillfulness0000.189
Fatigue0.135000.177
Adverse Weather Conditions0000.154
Lack of Working Area0000.151
Availability of Materials0000.166
Table 2. Productivity variations over time.
MonthConcrete Pouring (m3/Day)Formwork (m2/Day)Reinforcement (Tons/Day)
127.879.190.38
224.187.950.33
320.386.700.28
417.205.640.23
516.785.490.23
617.495.720.24
717.535.760.24
817.595.770.24
917.535.820.24
Table 3. Comparison of different plans’ outcomes.
Scheduling ScenarioTotal Cost (USD)Total Time (Day)Closure (Day)Time Error
Relative to the Actual Time
Cost Error
Relative to the
Actual Cost
Baseline Plan (Initial Prediction)300,75090041%16.5%
Actual Project Performance360,504152330%0%
Model Prediction—Without Optimization407,175146314%13%
Model Prediction—With Optimization347,686142286.6%3.5%
Table 4. Sensitivity analysis of model performance under productivity variations.
Scheduling ScenarioTotal Cost (USD)Total Time (Days)ΔCost vs. Base OptimizedΔTime vs. Base OptimizedKey Observations
Base Optimized Model347,686142Balance of cost and time; continuous reoptimization
Model—Without Optimization407,175146+17.1%+2.8%Static sequencing; higher cost despite slight time reduction vs. actual
Optimized Model (Productivity +10%)374,013133+7.6%−6.3%Schedule compression; slight cost rise from resource acceleration
Optimized Model (Productivity −10%)376,645147+8.3%+3.5%Cost increase from indirect costs and extended duration
Disclaimer/Publisher’s Note: The statements, opinions and data contained in all publications are solely those of the individual author(s) and contributor(s) and not of MDPI and/or the editor(s). MDPI and/or the editor(s) disclaim responsibility for any injury to people or property resulting from any ideas, methods, instructions or products referred to in the content.