Article

Optimized Plant Configuration Designs for Wind Damage Prevention in Masonry Heritage Buildings: A Case Study of Zhen Guo Tower in Weihui, Henan, China

College of Horticulture and Landscape Architecture, Henan Institute of Science and Technology, Xinxiang 453003, China
*
Author to whom correspondence should be addressed.
Buildings 2025, 15(17), 2999; https://doi.org/10.3390/buildings15172999
Submission received: 25 June 2025 / Revised: 20 August 2025 / Accepted: 22 August 2025 / Published: 23 August 2025
(This article belongs to the Section Building Structures)

Abstract

Wind-induced erosion and extreme weather events pose growing risks to the structural integrity of masonry heritage buildings. However, current mitigation approaches often overlook ecological sustainability. This study investigates the wind-regulating effects of vegetation surrounding the Zhen Guo Tower, a 400-year-old masonry structure in Weihui, Henan Province, China. Using computational fluid dynamics (CFD) simulations, we first assess the protective performance of the existing vegetation layout and then develop and evaluate an optimized plant configuration. The results show that the proposed multilayered vegetation arrangement effectively reduces wind speeds by up to 13.57 m/s under extreme wind conditions, particularly within the 5–15 m height range. Wind protection efficiency improved by 28–68% compared to the baseline. This study demonstrates a replicable and ecologically integrated strategy for mitigating wind hazards in masonry heritage sites through vegetation-based interventions.

1. Introduction

“Routine maintenance is better than drastic intervention; preventive action before disasters is more effective than post-disaster restoration.” Since the early 21st century, preventive conservation has gradually become a widely accepted principle in the field of architectural heritage protection [1]. Among the key challenges facing this field today is how to effectively prevent climate change-induced damage to heritage buildings [2,3,4].
As a significant typology of traditional Chinese architecture, masonry buildings constitute an essential component of China’s architectural heritage [5]. Owing to their high structural rigidity, low tensile strength, and frequent exposure to open-air in situ conditions, masonry heritage structures are particularly vulnerable to deterioration. Prolonged exposure to climatic factors, such as wind, solar radiation, rainfall, and moisture evaporation, often leads to significant material degradation over time [6].
Wind, as a persistent and high-frequency external force, plays a critical role in the deterioration processes of heritage buildings [7]. Wind erosion can accelerate the detachment of surface particles, resulting in micro-scale damage such as pitting and perforation on building façades [8]. Under extreme weather conditions, high wind speeds may exert forces that exceed the structural capacity of heritage buildings, potentially leading to tilting, cracking, or even partial collapse [9]. Moreover, wind often interacts with fluctuations in temperature and humidity, creating coupled effects that promote the propagation of internal cracks and the growth of pore structures, thereby accelerating material degradation and significantly reducing the structural lifespan [10]. Currently, wind damage mitigation for heritage buildings mainly relies on artificial interventions, such as mechanical reinforcement and chemical coatings [11,12,13]. While these measures may offer short-term protection, they present several critical limitations: (1) poor material compatibility may induce secondary damage, (2) high maintenance costs and a short service life hinder sustainable management, and (3) the lack of ecological integration and environmental resilience renders them ineffective in coping with increasingly complex climatic conditions [14,15,16,17].
In recent years, computational fluid dynamics (CFD) has been widely adopted as an economical, efficient, and reliable tool for environmental simulations in various domains, including wind environment analysis for architectural heritage, structural vulnerability assessments, and the design of protective interventions [8,18,19]. This approach allows for the detailed simulation of the airflow around buildings under complex terrain and meteorological conditions, offering a non-invasive and accurate method for assessing wind-induced hazards [20].
Vegetation-based windbreaks can effectively mitigate wind-induced damage by altering airflow patterns and reducing the wind velocity and pressure gradients around structures [21]. In recent years, vegetation has been extensively validated as an ecological intervention for regulating micro-scale wind conditions, alleviating urban heat island effects, and enhancing outdoor thermal comfort [22,23,24]. Recent wind-tunnel tests on a historical wooden pagoda demonstrated that strategically planted trees can reduce façade pressures and base wind loads, providing experimental support that vegetation-based wind mitigation can translate into a lower structural demand at heritage towers [25]. However, its application in the preventive conservation of heritage buildings remains underexplored, with a notable absence of systematic research grounded in empirical simulation and quantitative assessment.
To address this research gap, this study uses the Zhen Guo Tower—a provincially protected masonry heritage building in Weihui, Henan Province, China—as a case study. By employing computational fluid dynamics (CFD) simulations, this study evaluates the impact of existing vegetation configurations on the wind environment surrounding the heritage structure and explores optimized planting strategies. This study proposes a novel ecological approach to wind hazard mitigation by using vegetation communities as functional buffers, aiming to advance both theoretical innovation and practical implementation in the field of green heritage conservation.
Unlike previous studies that focus on structural reinforcement or stress response modeling, this study emphasizes a preventive conservation approach—reducing aerodynamic loads through vegetation optimization to mitigate wind-induced deterioration. This study seeks to address the following three core research questions: (1) To what extent does the existing vegetation configuration around Zhen Guo Tower regulate the local wind environment? (2) Can vegetation communities significantly reduce wind-induced risks during extreme weather conditions? (3) Can the optimization of the vegetation layout effectively enhance the wind protection performance, thereby providing a replicable ecological strategy for the conservation of masonry heritage buildings?
This study is structured around the analytical framework illustrated in Figure 1, aiming to introduce an ecological regulation perspective into the preventive conservation of architectural heritage and to advance both theoretical innovation and practical implementations in the domain of green heritage protection.

2. Regional Context and Research Subject

2.1. Overview of Zhen Guo Tower

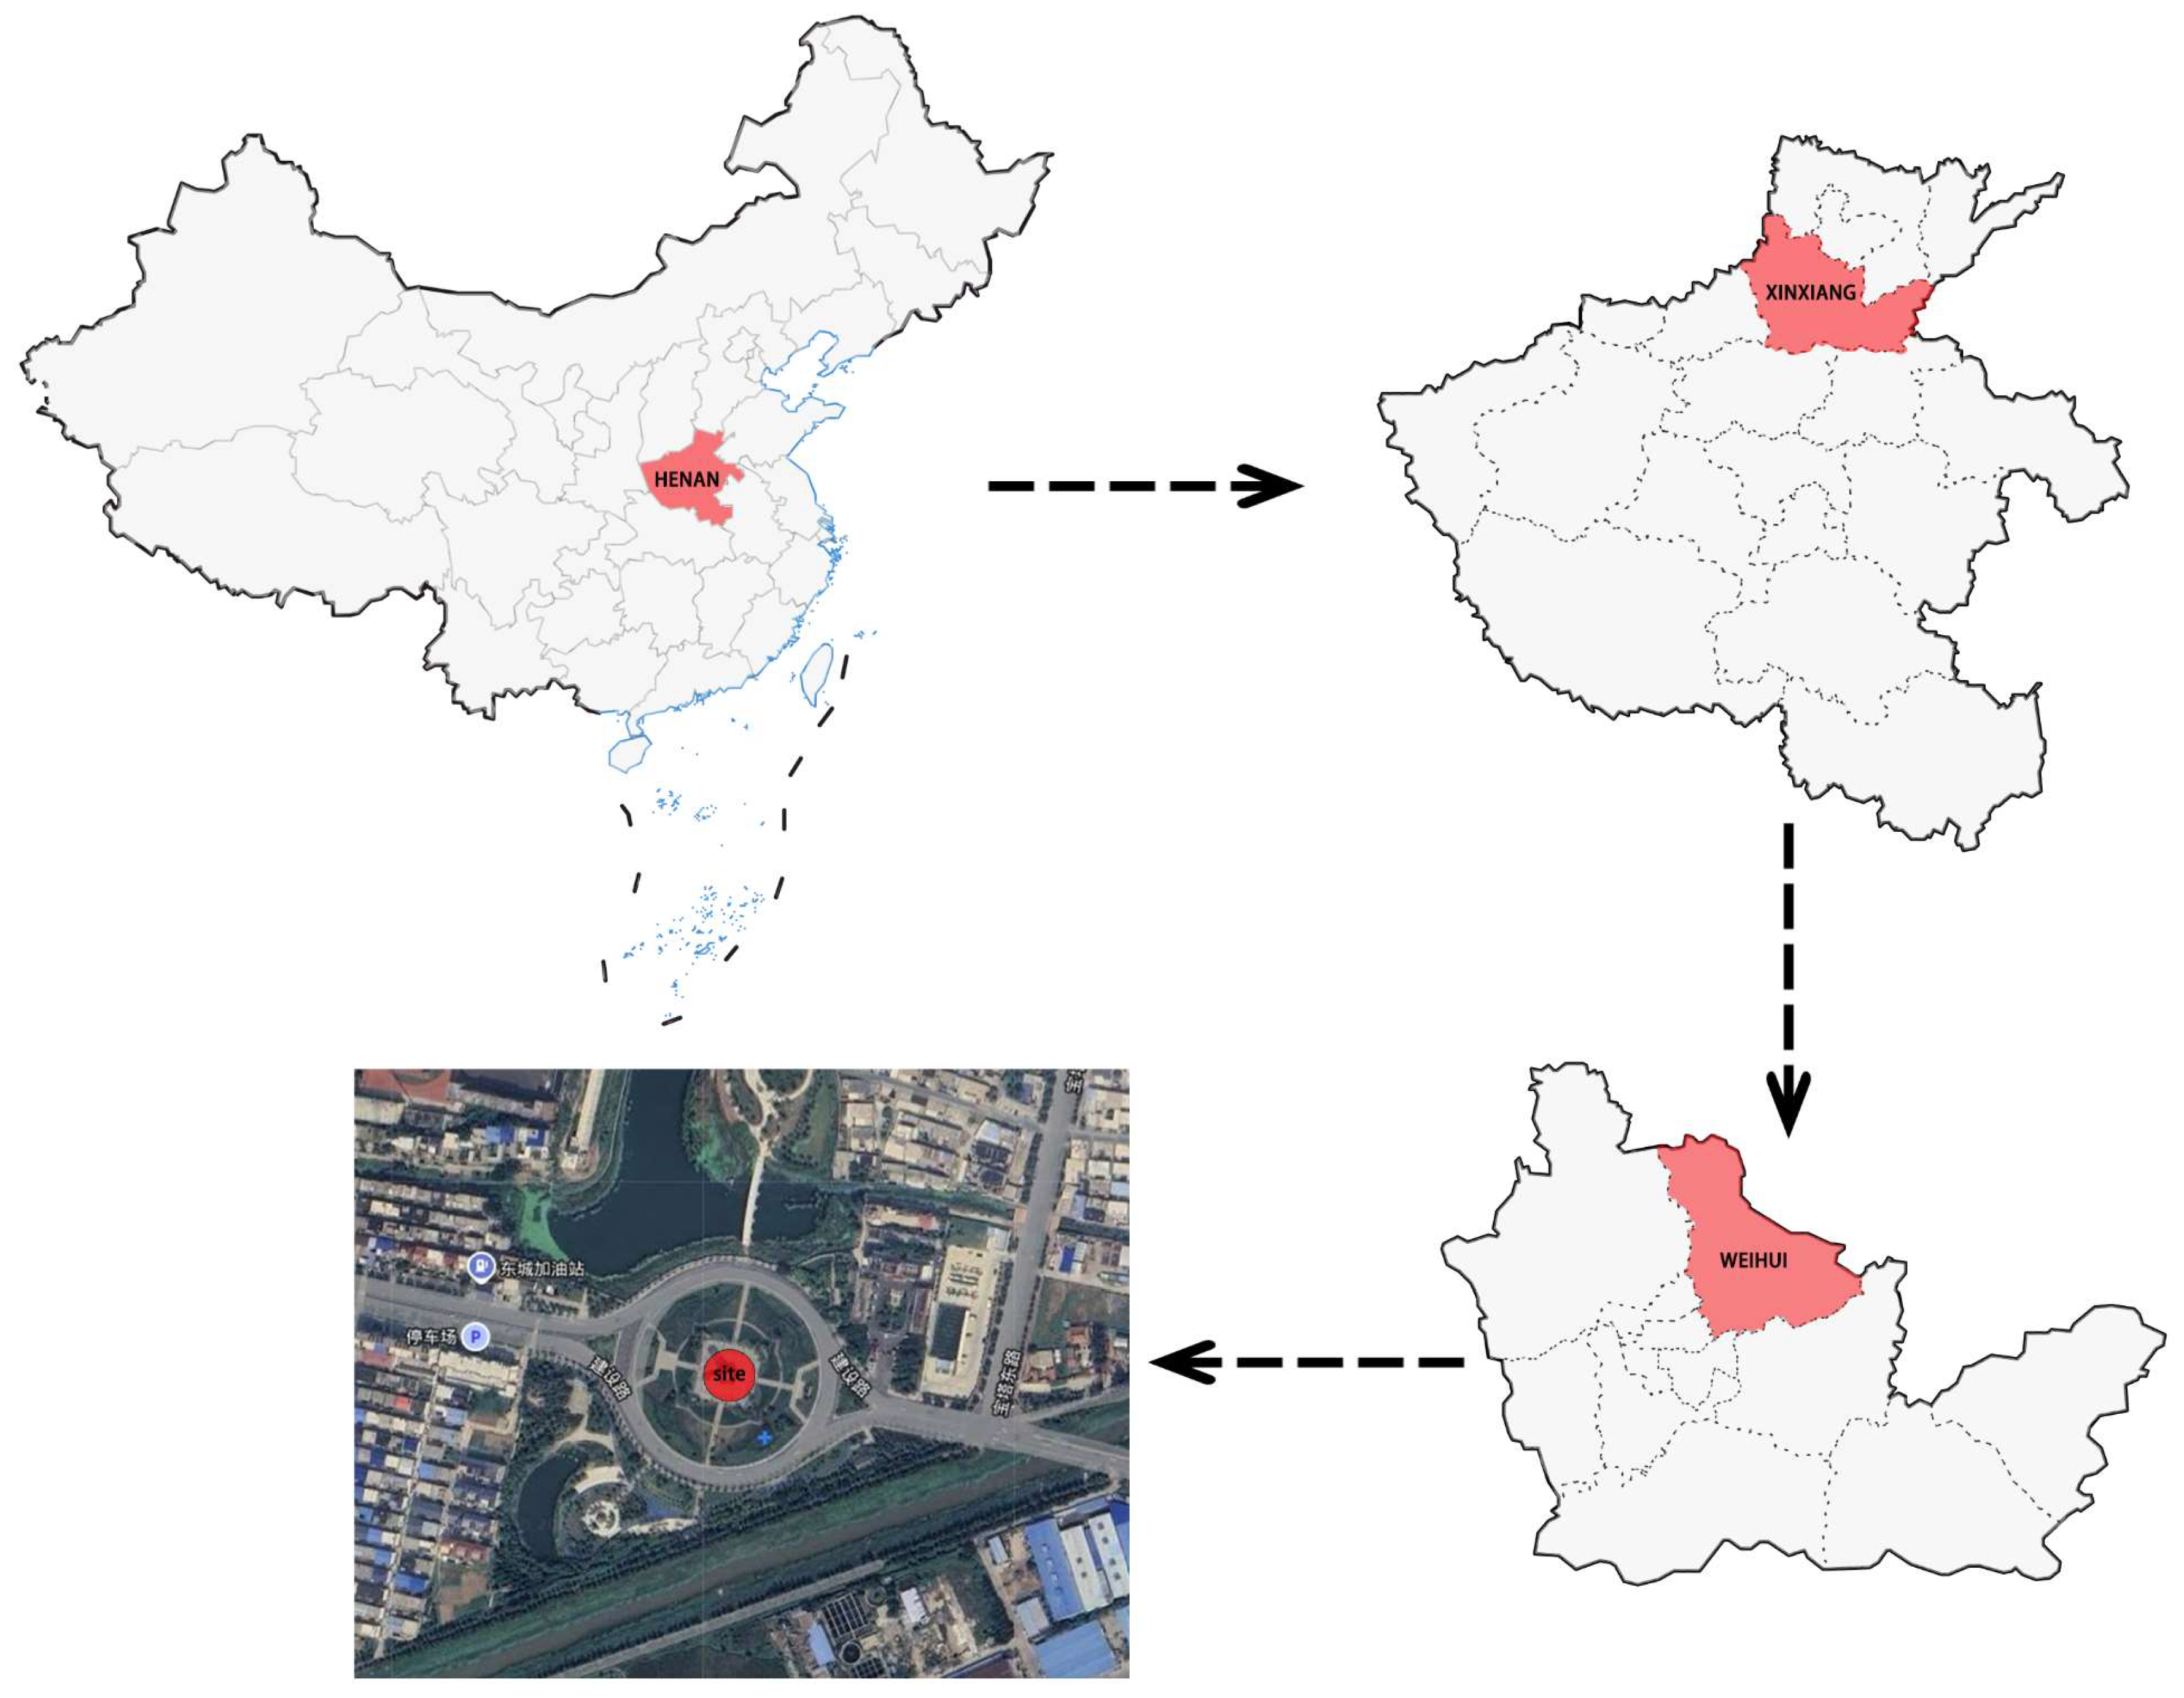
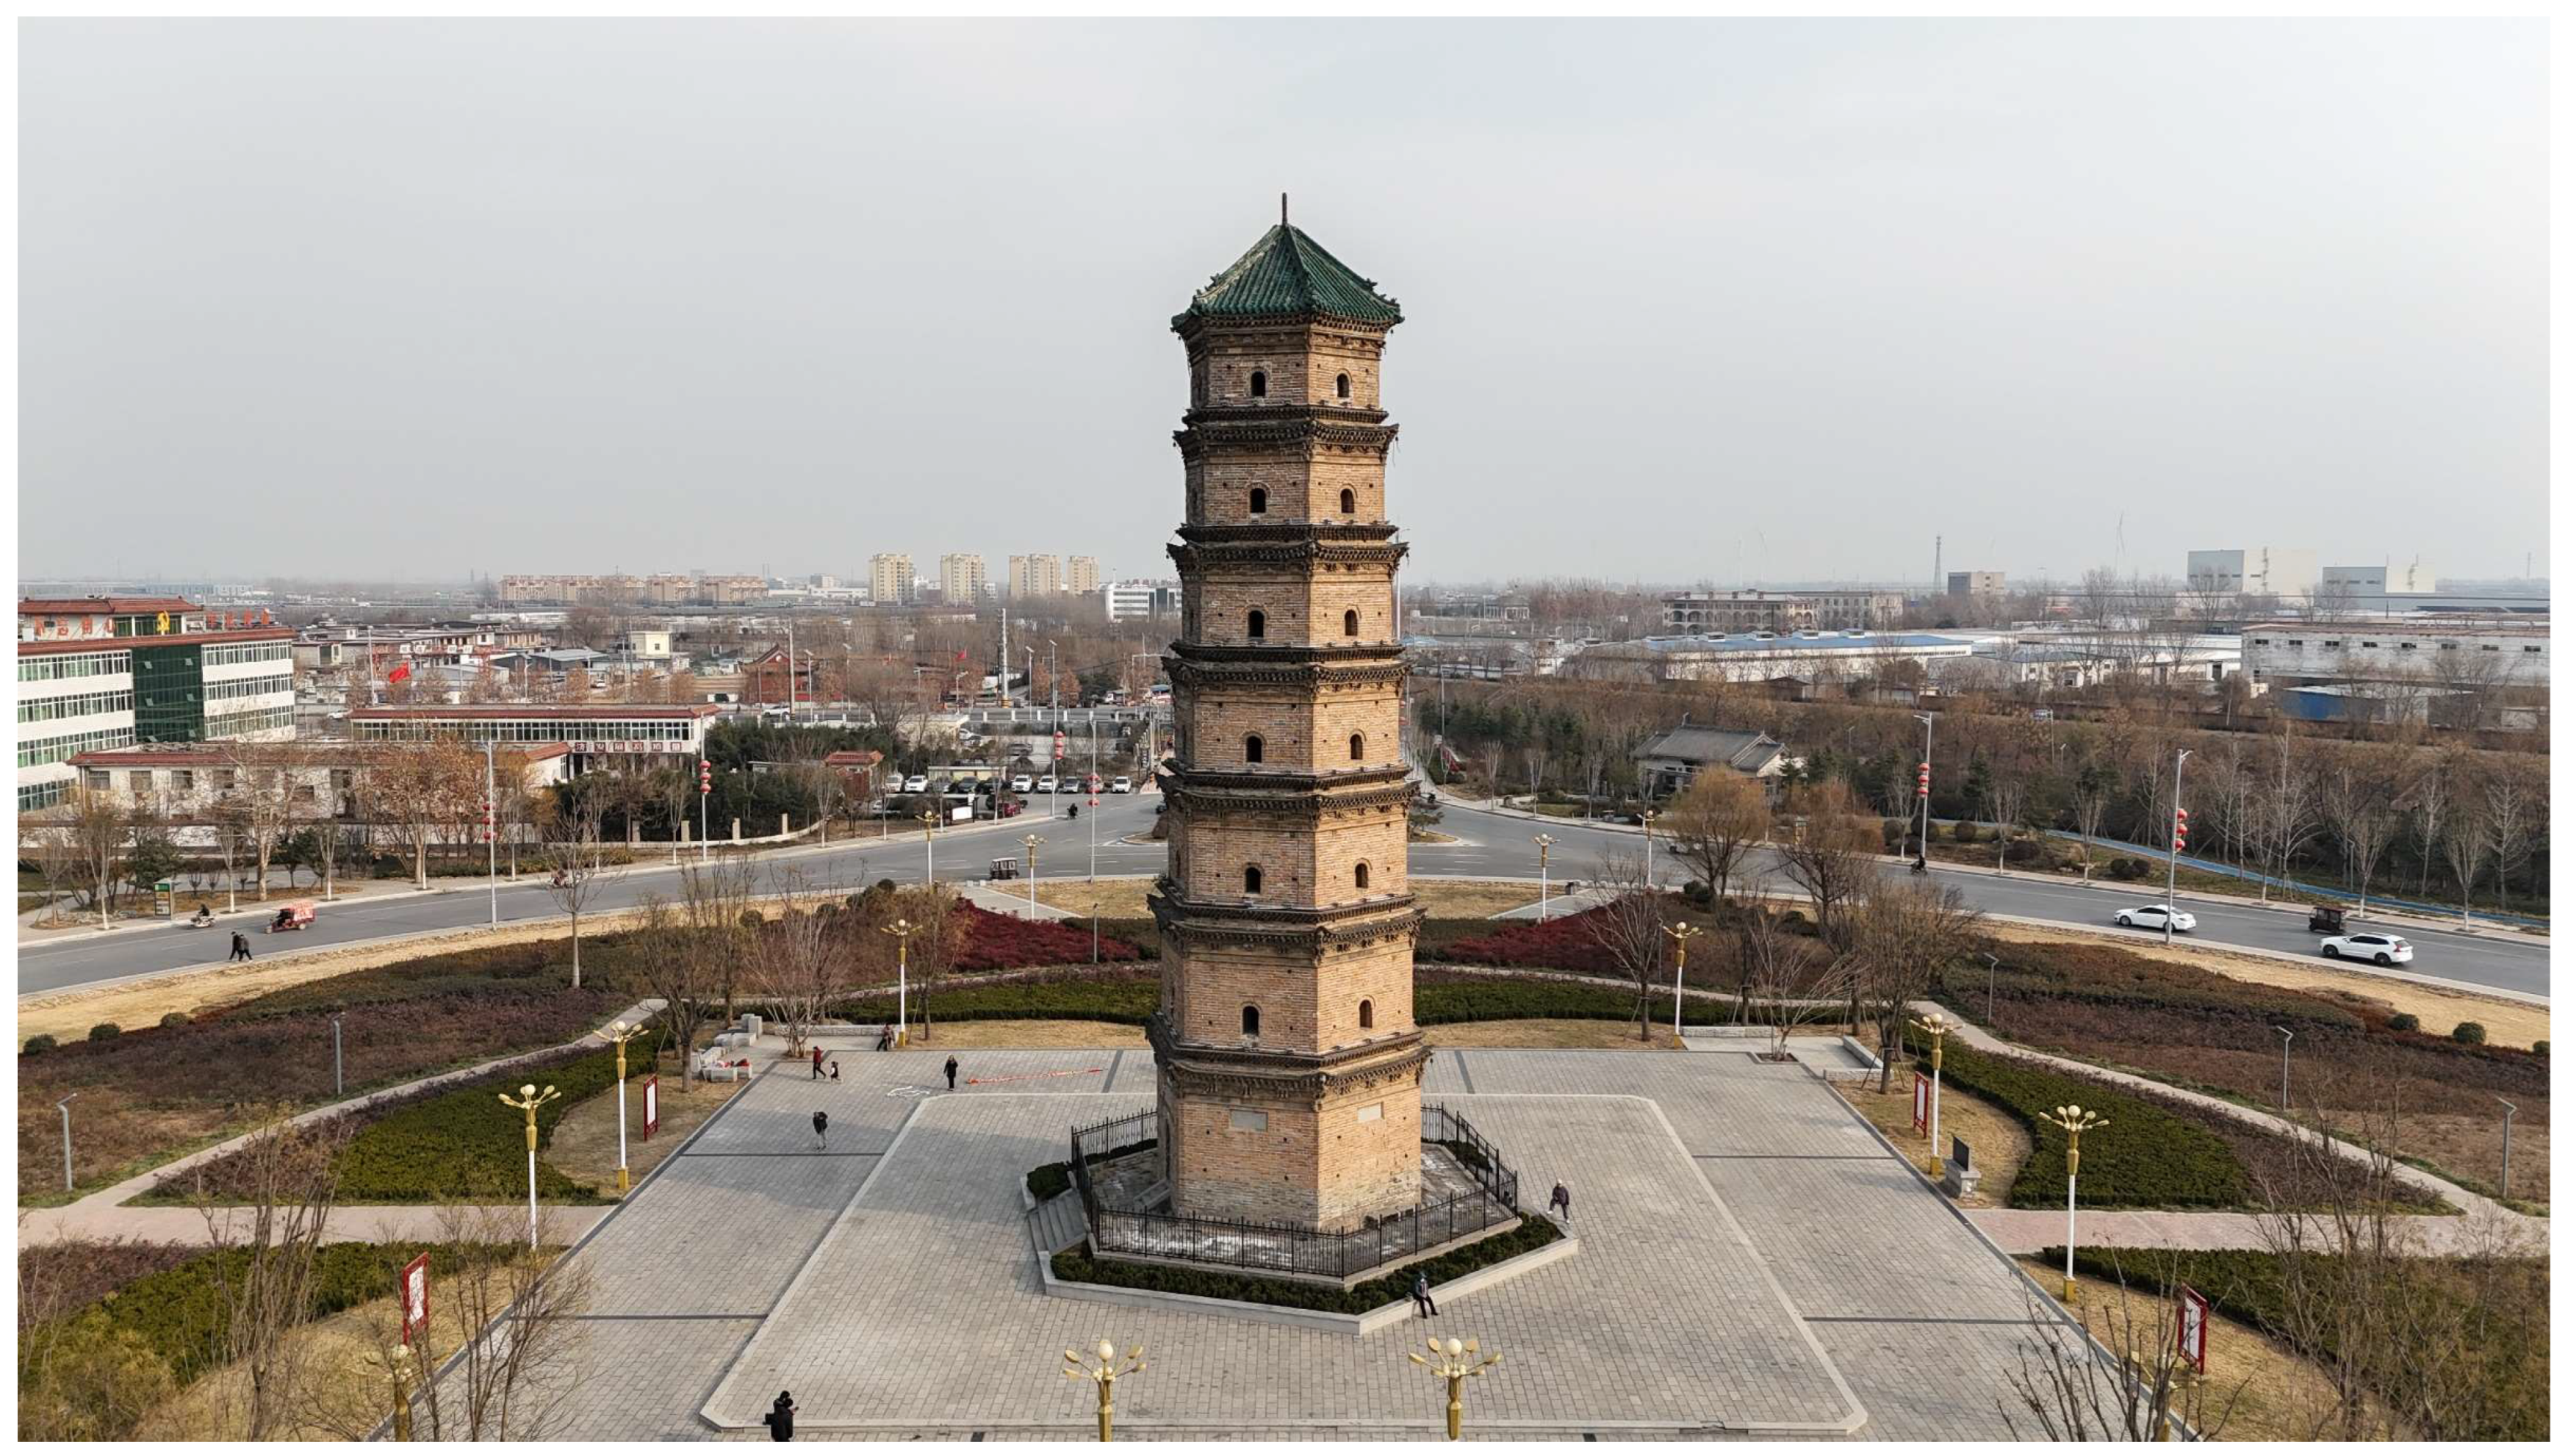
Weihui is a county-level city in northern Henan Province, China, between a 113°51′–114°19′ E longitude and a 35°19′–35°42′ N latitude. The region is characterized by a warm temperate continental monsoon climate (Figure 2). Zhen Guo Tower, also known as Lingying Tower, is located in a roundabout park along Jianshe Road in the urban area of Weihui. Originally constructed in 1585 AD during the 13th year of the Ming Dynasty’s Wanli reign, the tower is a representative seven-story pavilion-style brick pagoda. It stands at 34.5 m tall with a hexagonal base, featuring densely arranged eaves and intricate dougong brackets, reflecting the advanced masonry techniques and architectural esthetics of the Ming Dynasty (Figure 3). In 1986, the tower was designated as a provincially protected cultural heritage structure in Henan. Despite multiple restorations, the tower has retained its overall historical integrity and original appearance.
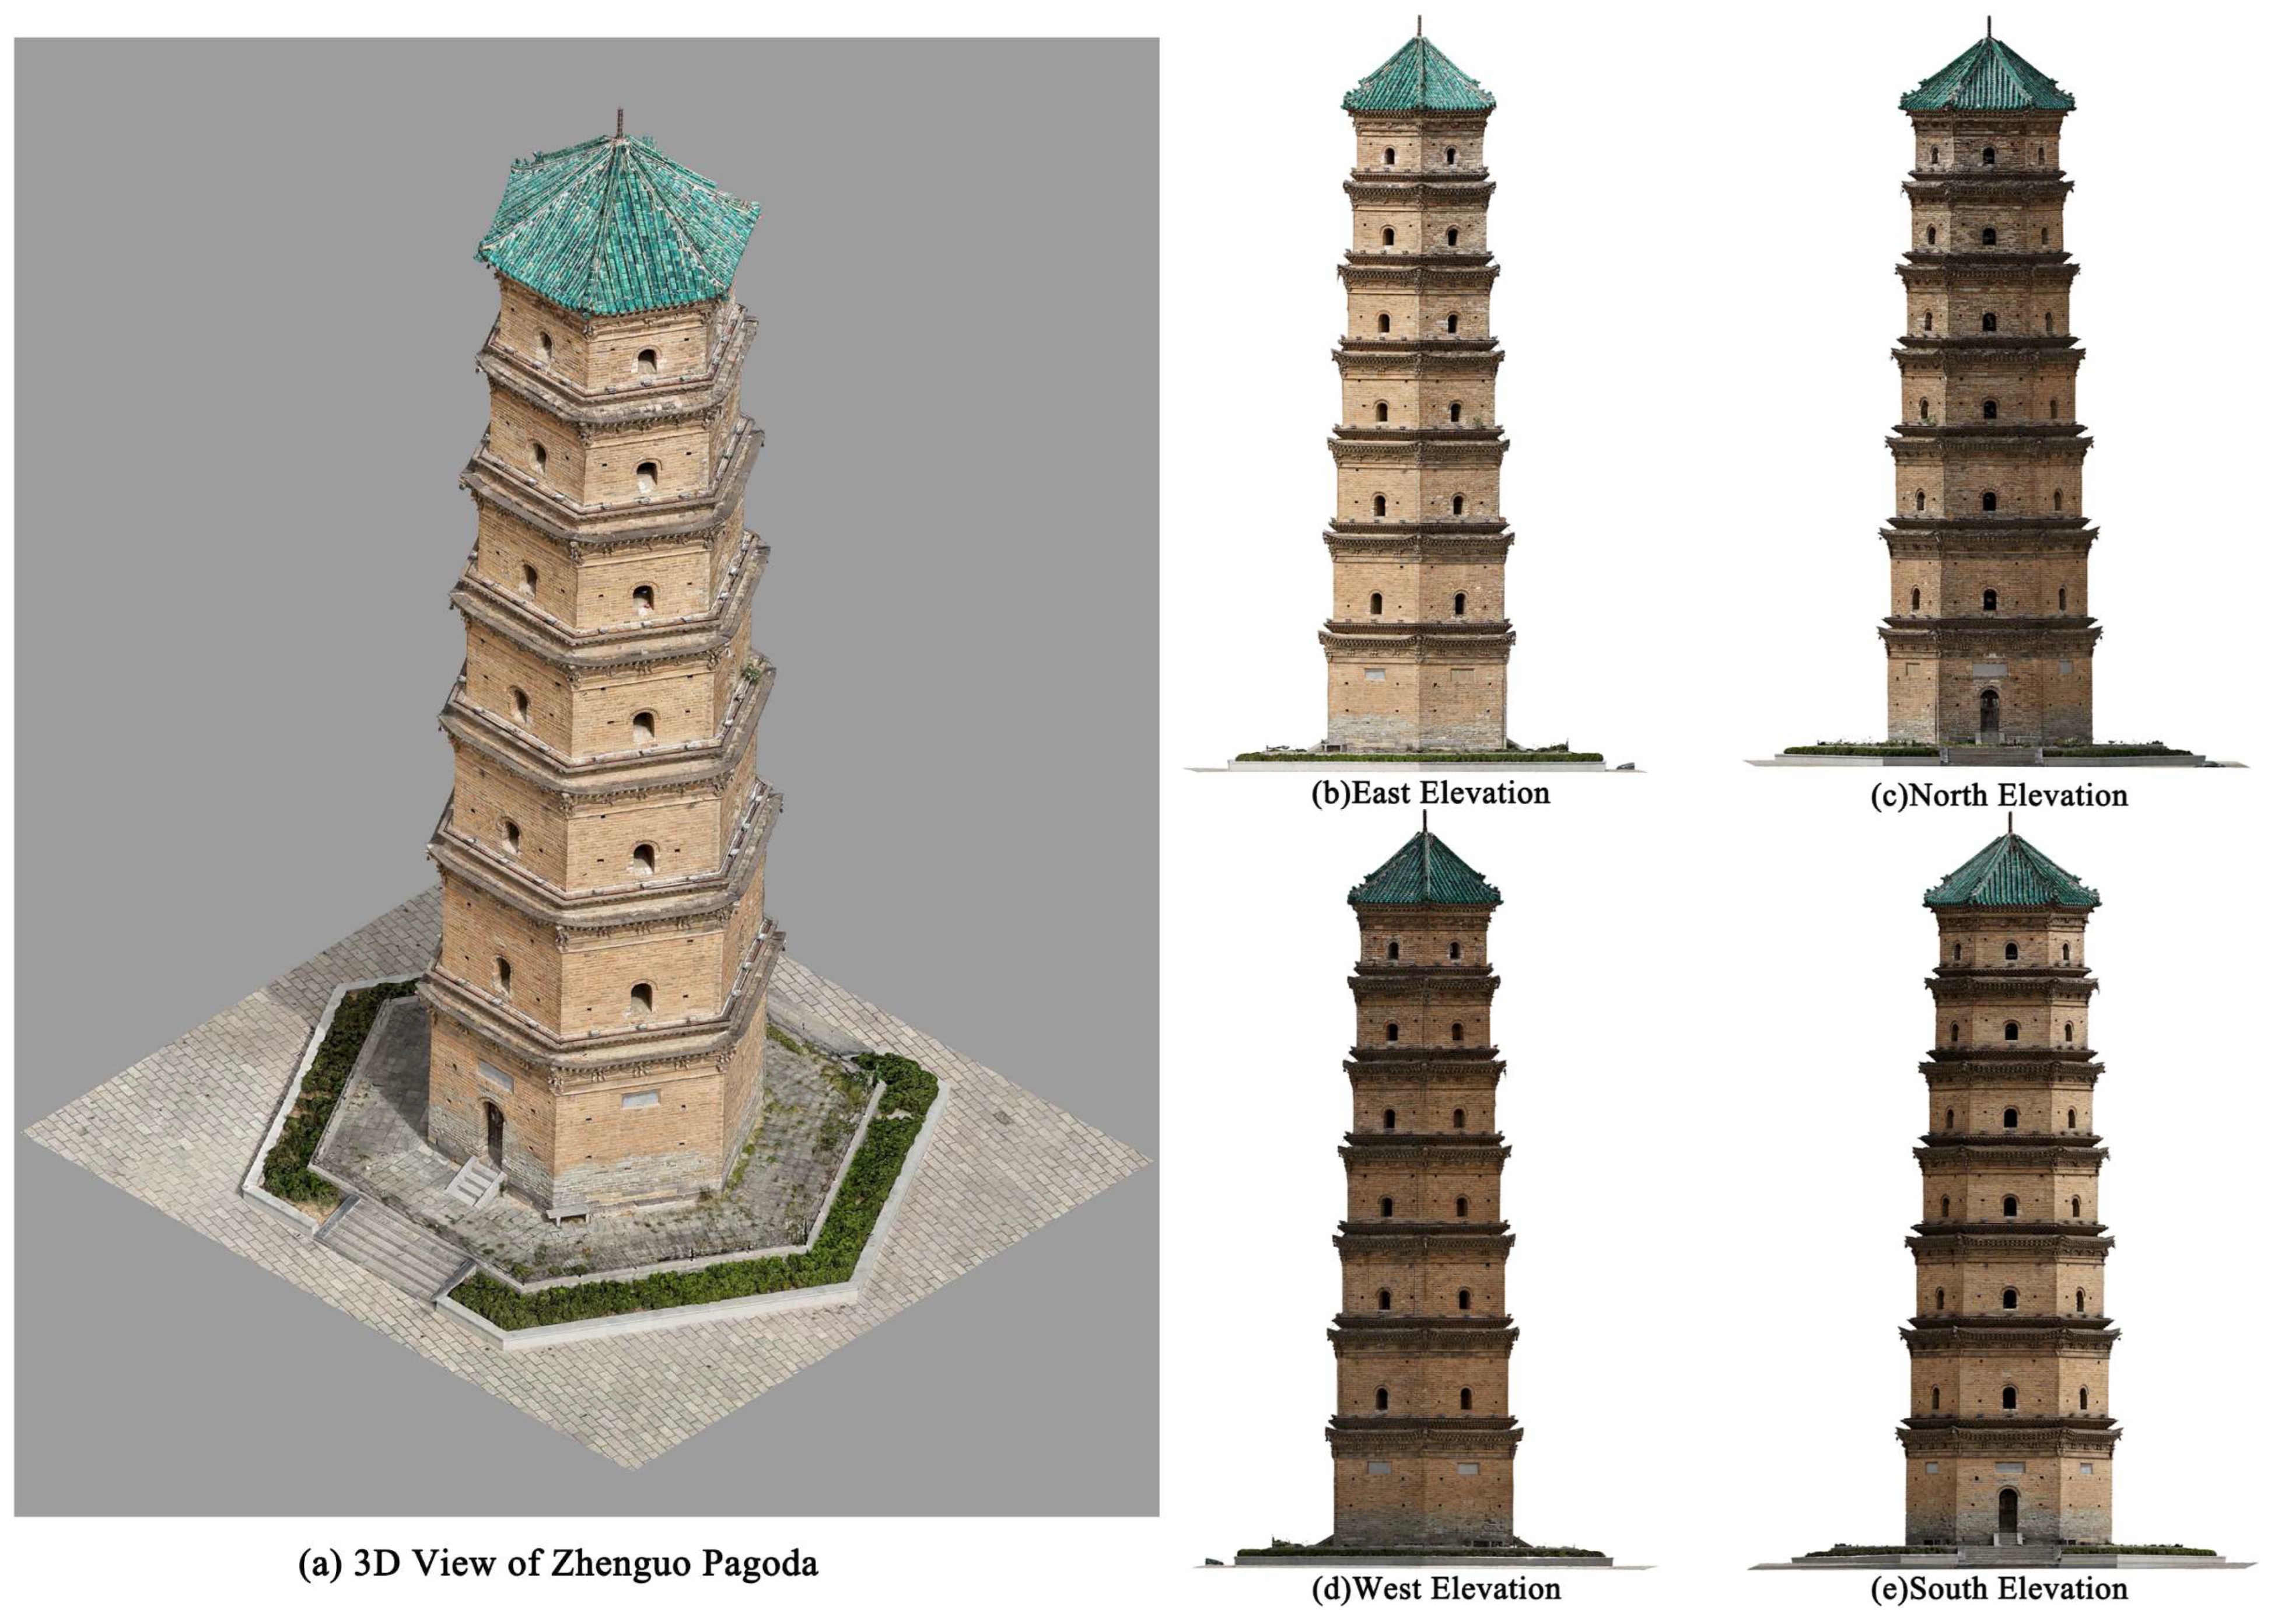
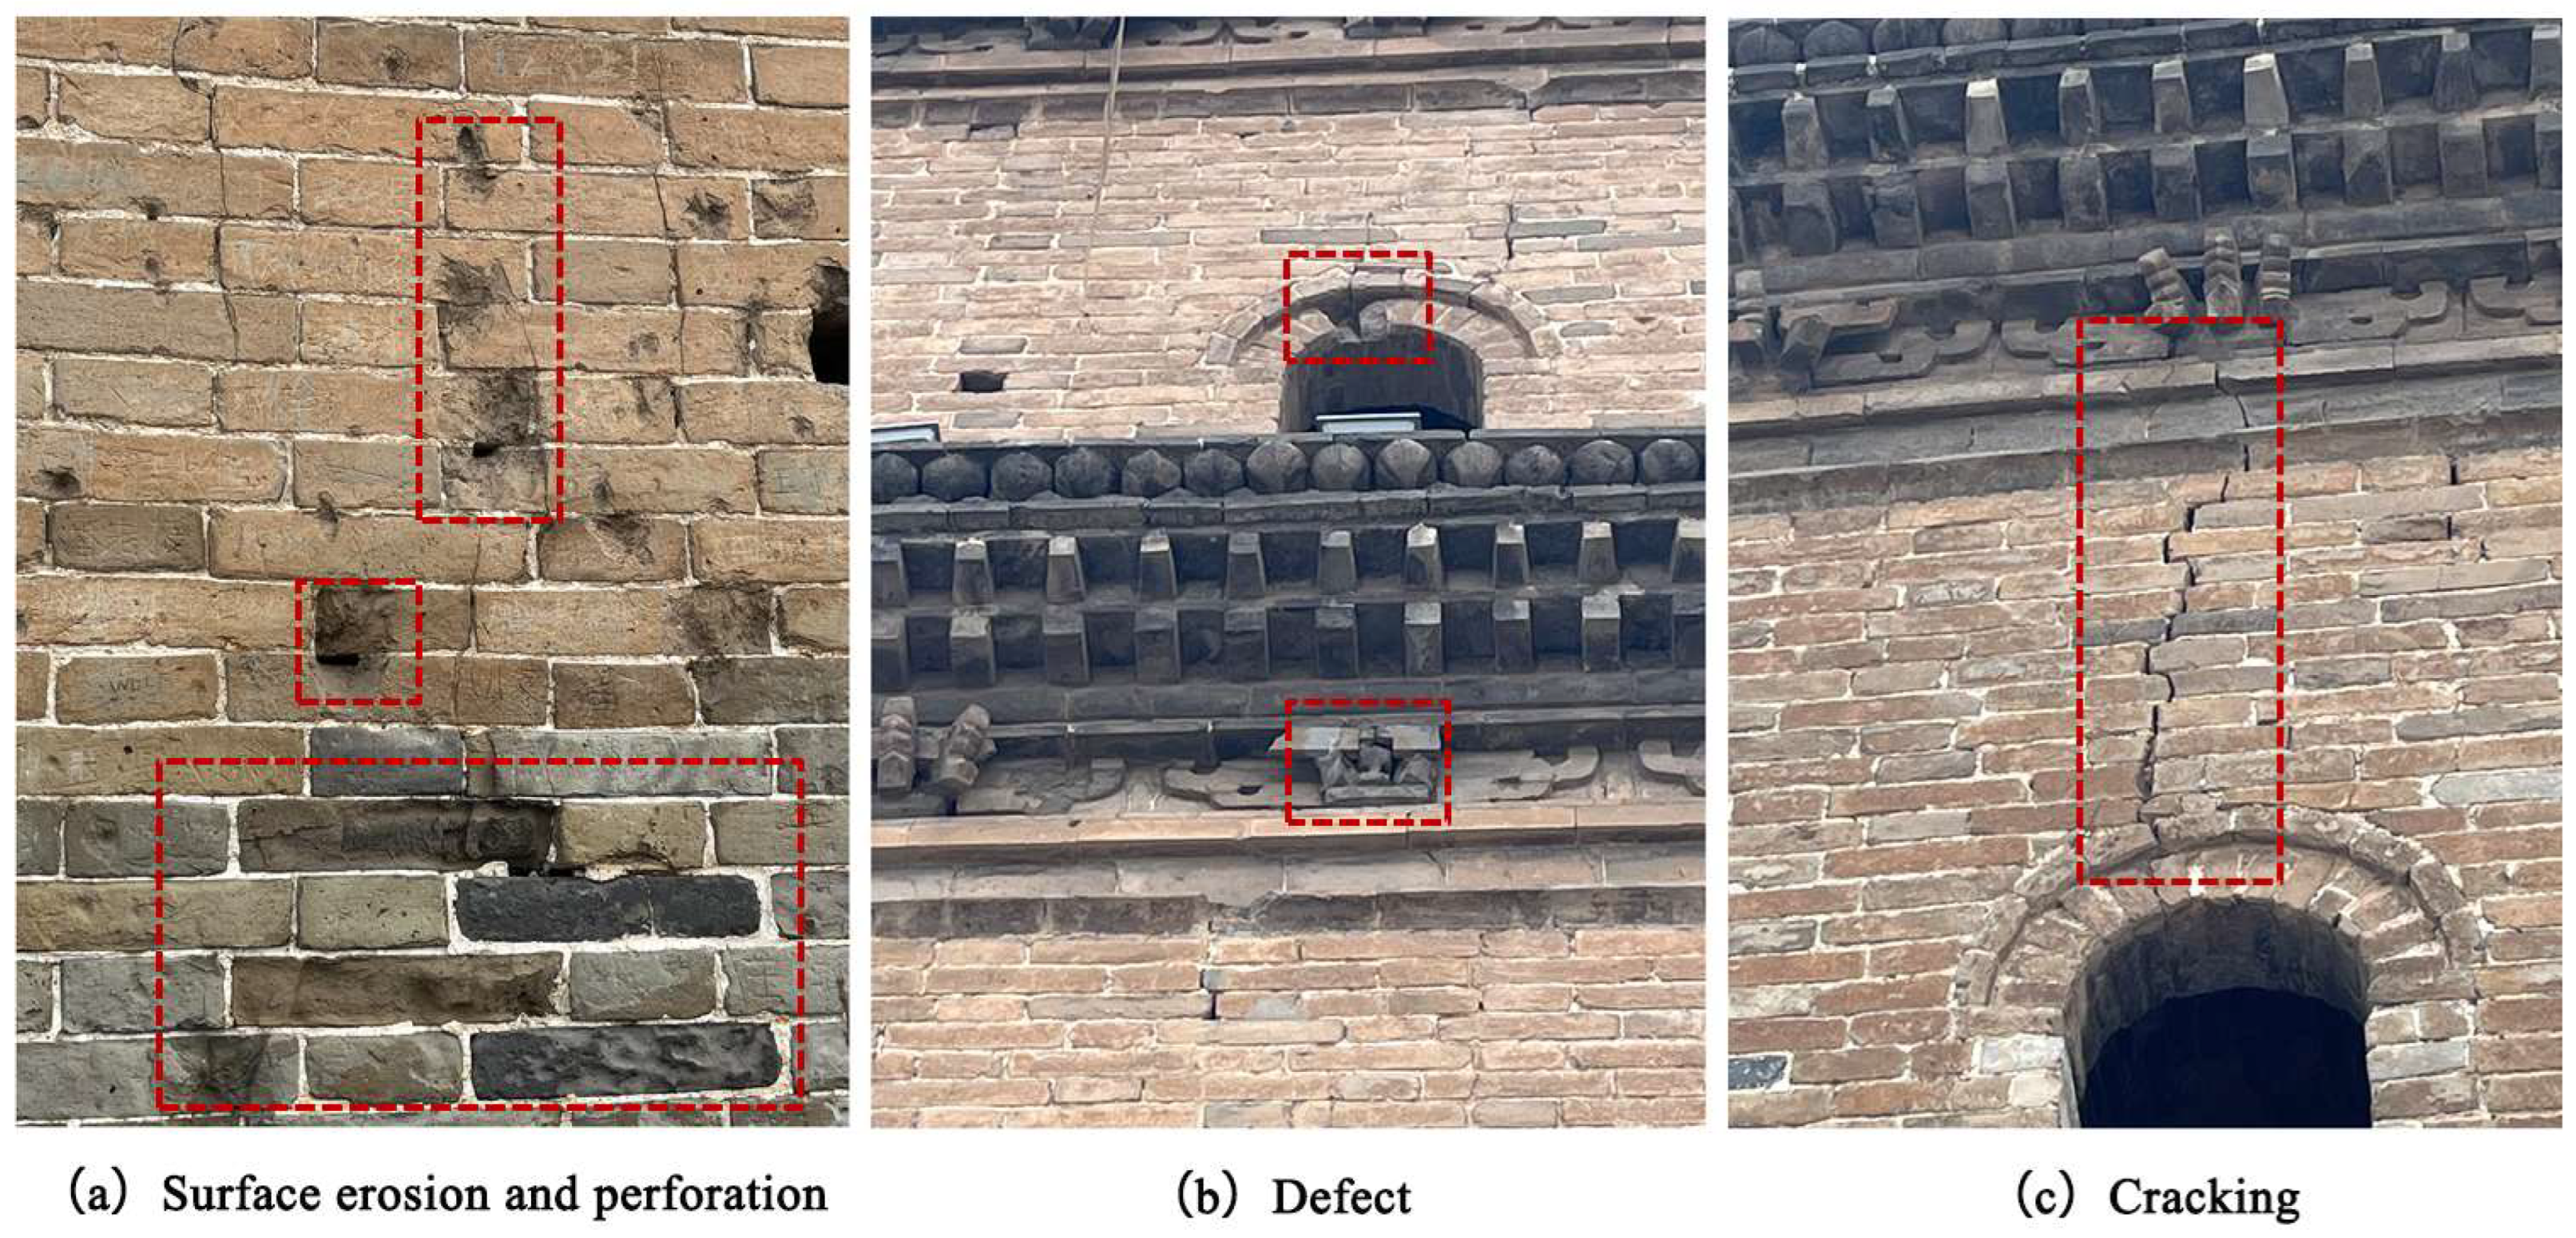
For the assessment of structural deterioration, the three-dimensional reconstruction was performed using Bentley ContextCapture 10.18. A total of 452 high-resolution images captured by a DJI Mini 4 Pro UAV were processed through four main steps: (1) an automatic camera calibration and distortion correction, (2) the extraction and matching of key points to generate a sparse point cloud, (3) the construction of a dense point cloud and triangular mesh, and (4) a volumetric reconstruction with texture mapping. The resulting model achieved an average ground resolution of approximately 6 mm/pixel and a mean reprojection error of 0.67 pixels, ensuring a sufficient accuracy to detect surface defects on the heritage tower (Figure 4). This model enabled the identification, measurement, and statistical analysis of the material loss, cracking, and surface degradation. The investigation revealed a high concentration of structural defects, particularly on the north and northeast façades of the tower (Table 1). According to the 2019 ICOMOS report on climate change and its impact on heritage structures [26], the primary wind-related deterioration types observed on the Zhen Guo Tower include the following:
  • Surface erosion and perforation (Figure 5a): characterized by pitting and holes on the brick surface;
  • Defects (Figure 5b): including partial damage to decorative elements or missing bricks;
  • Cracking (Figure 5c): defined as fractures occurring either within bricks or along mortar joints.
The above findings indicate that the structure has likely been subjected to long-term wind exposure, resulting in significant deterioration and highlighting the urgent need for a systematic preventive conservation strategy.

2.2. Wind Environment and Meteorological Data

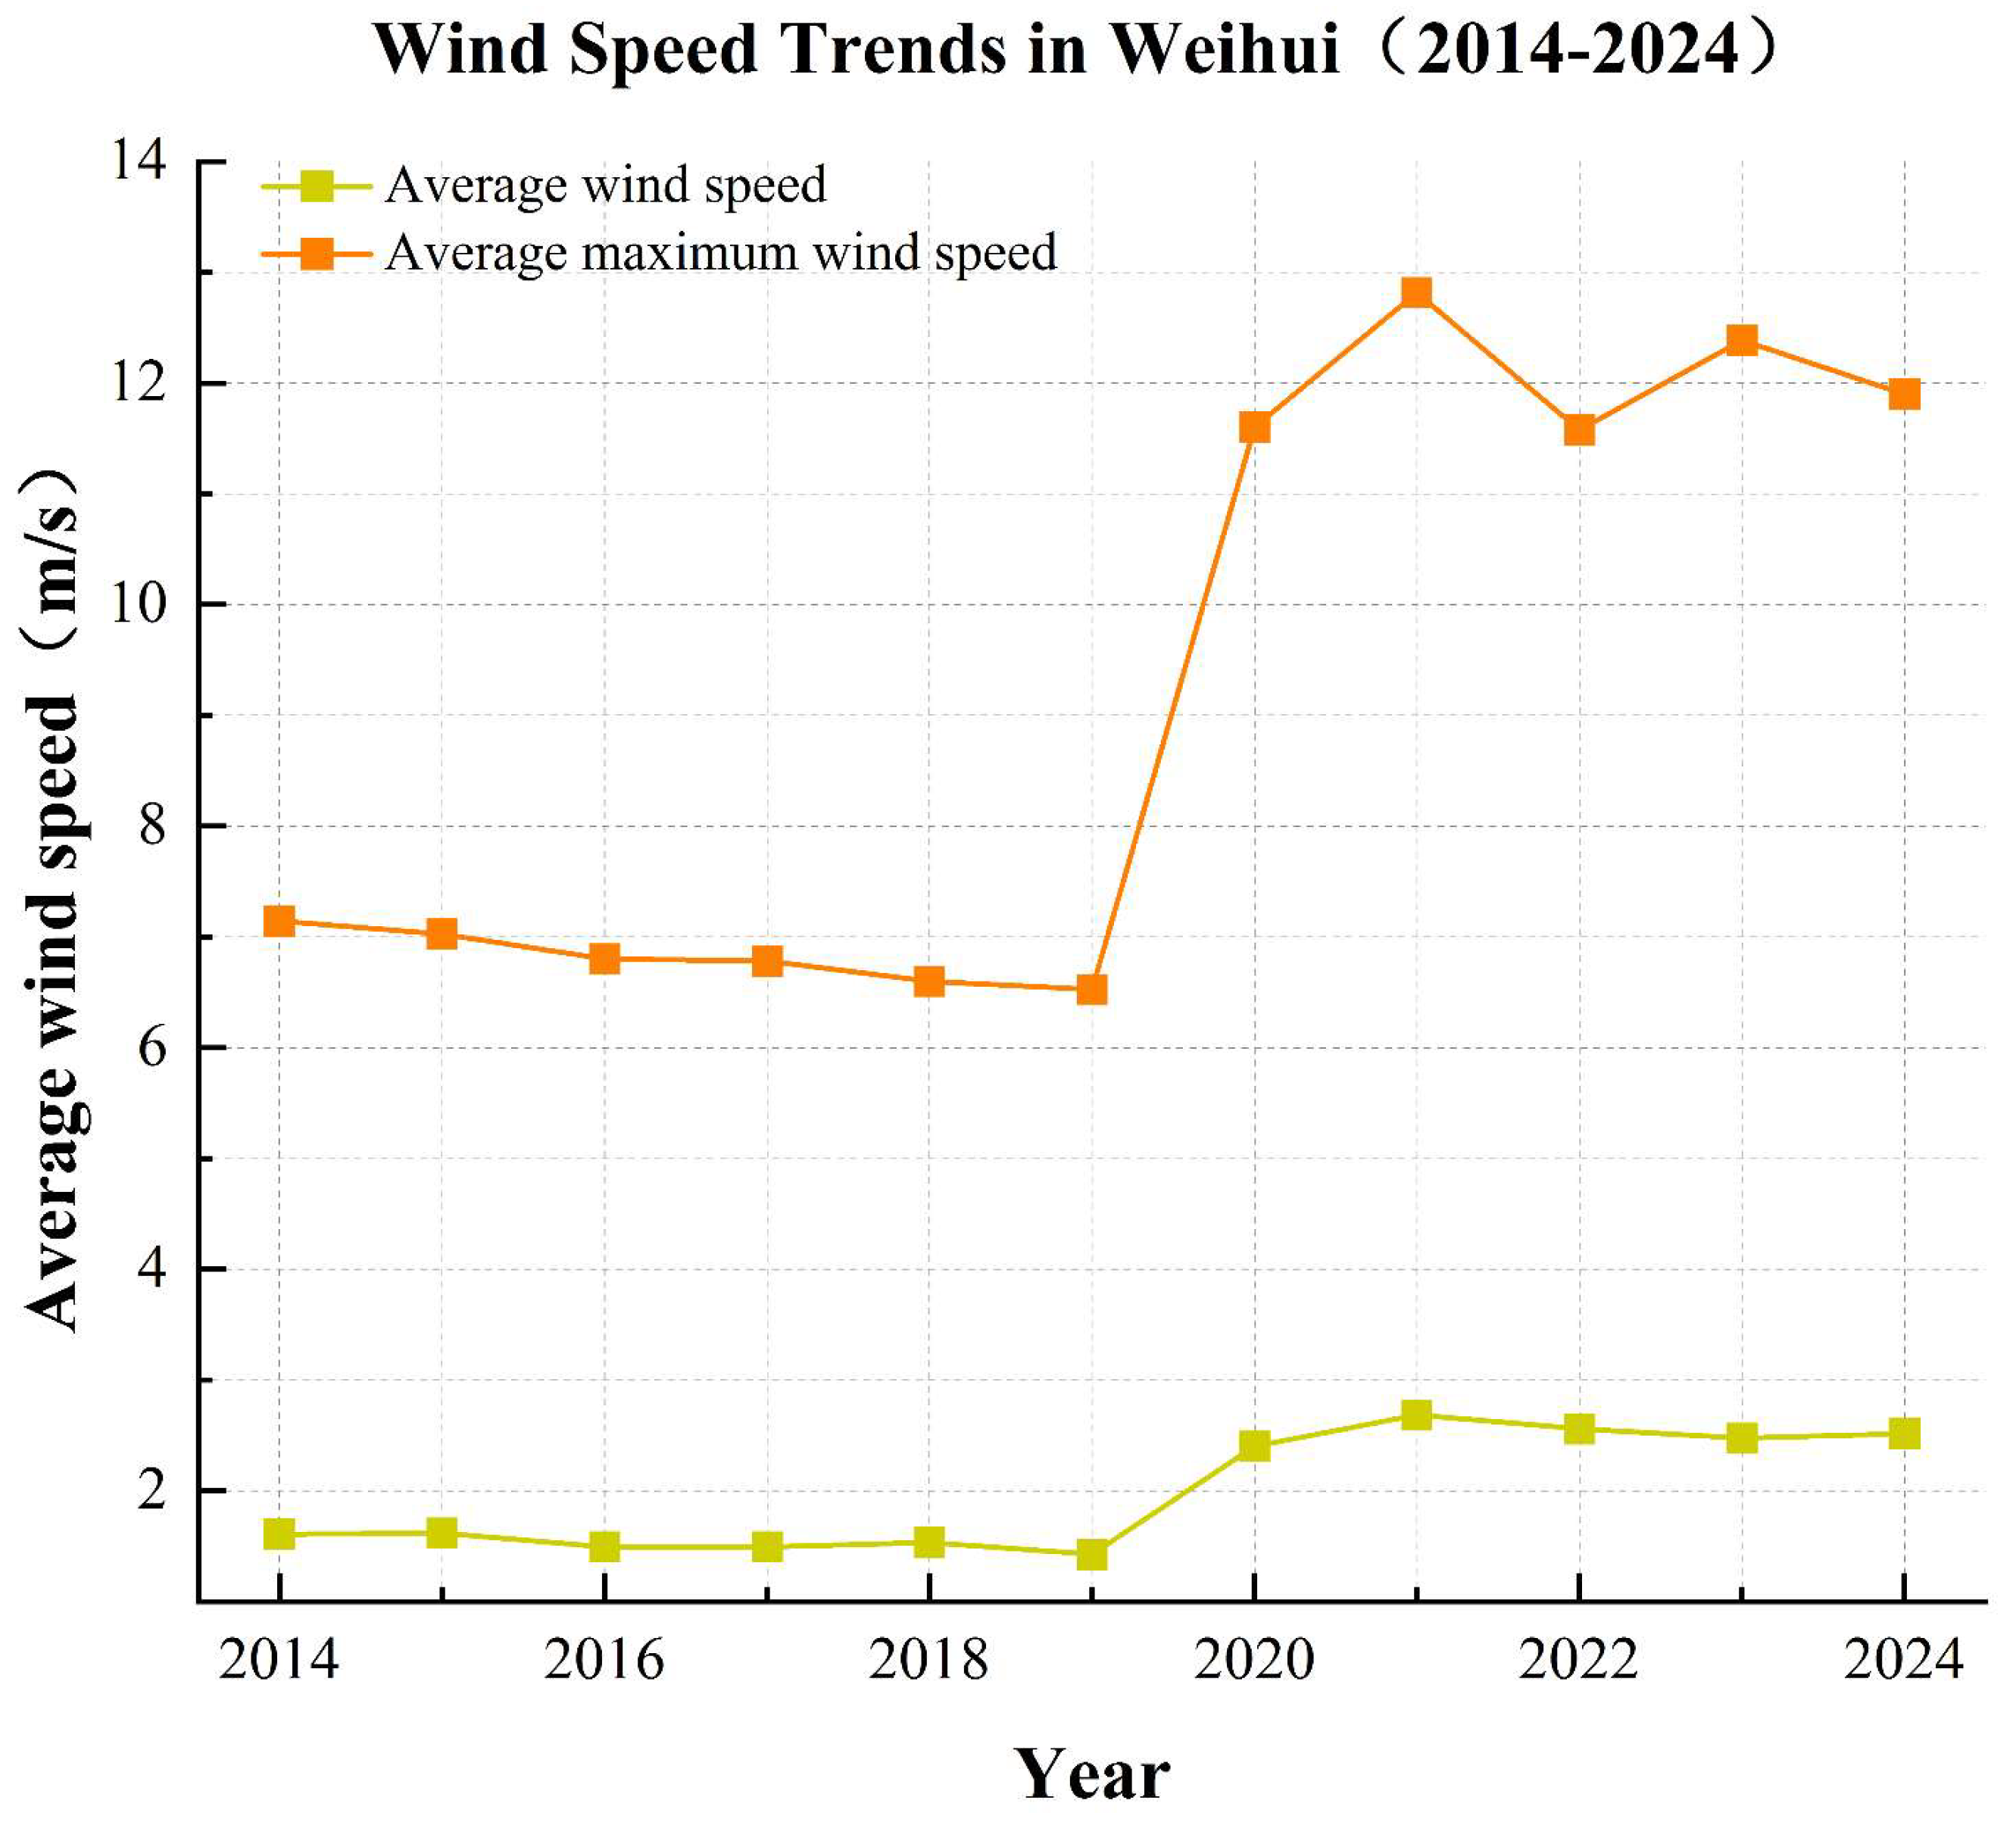
According to wind speed monitoring data from the Weihui Meteorological Station spanning from 2014 to 2024 (Figure 6), the region exhibits an average annual wind speed of approximately 2.0 m/s. Between 2014 and 2019, the maximum recorded wind speed remained relatively stable at approximately 7.0 m/s. However, a notable increase has been observed since 2020, with a peak value reaching 12.8 m/s in 2021.
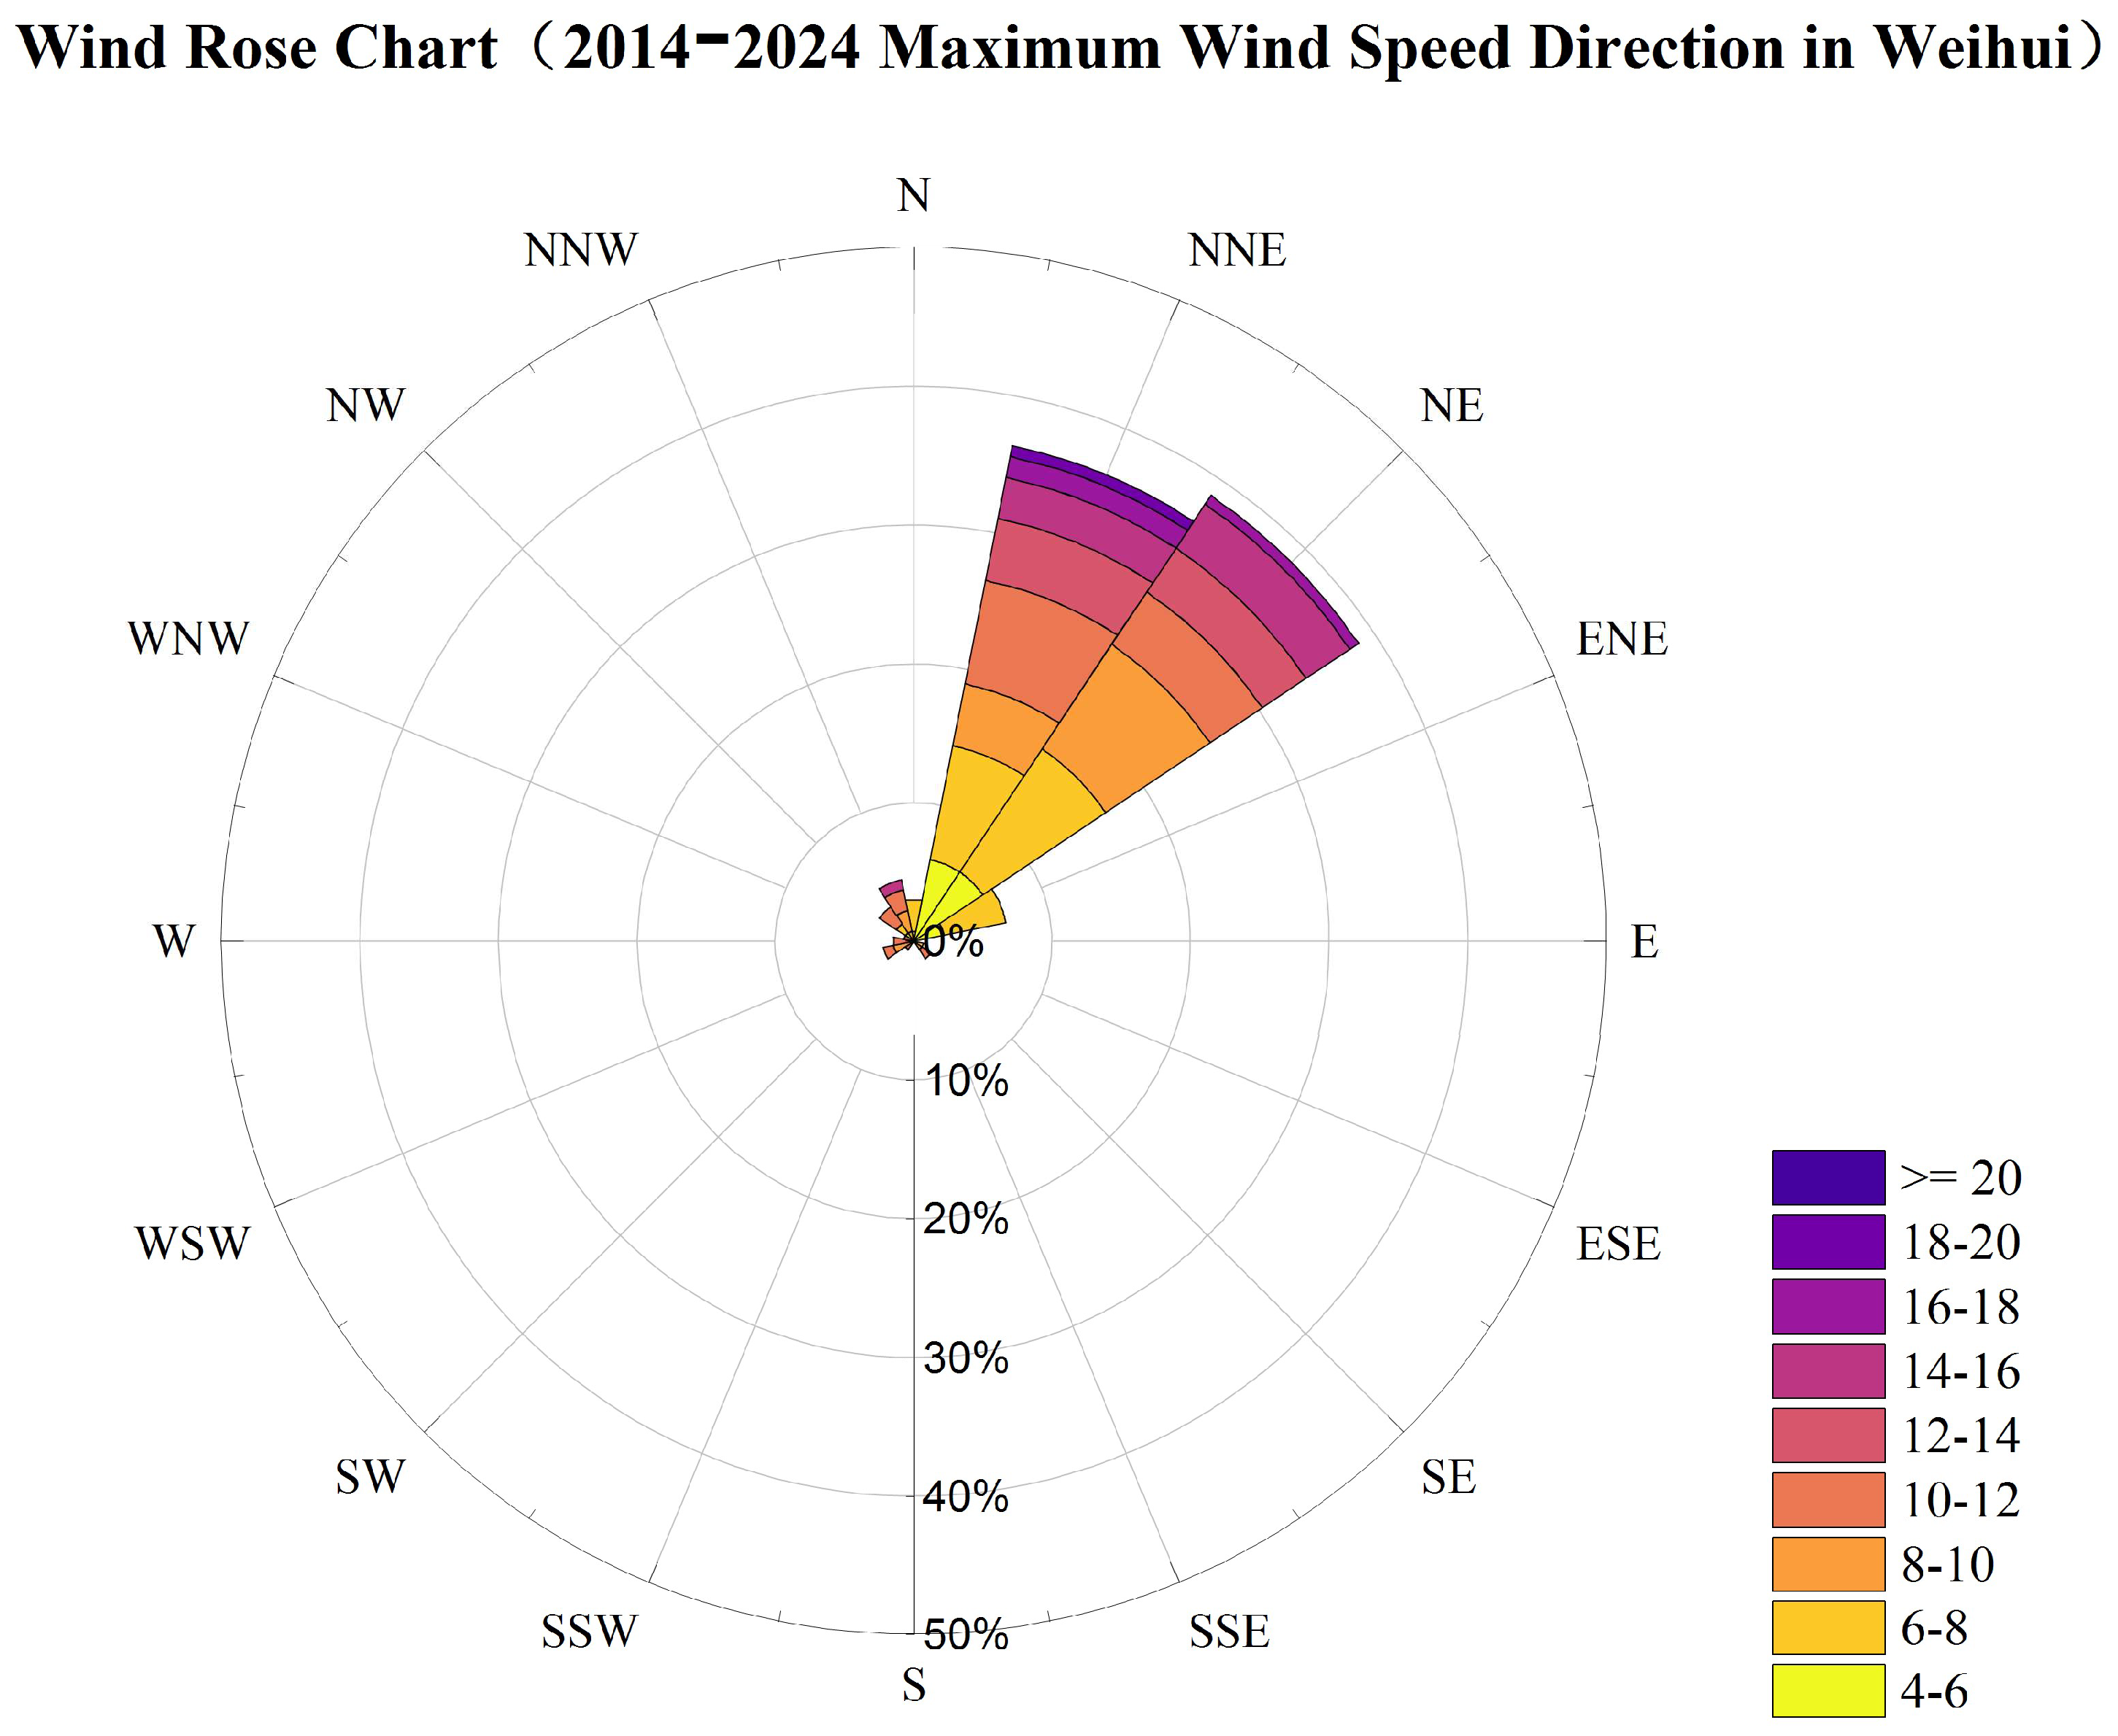
From the statistical distribution of the wind direction frequency (Figure 7), it is evident that maximum wind speeds predominantly occur during the spring months (March to May), with prevailing wind directions from the north–northeast and northeast (NNE, NE). This pattern shows a strong spatial correlation with the heavily deteriorated northeastern façade of Zhen Guo Tower. The findings suggest that frequent and high-velocity northeasterly winds are likely a major contributing factor to the extensive degradation observed on the tower’s northeast-facing surfaces.

2.3. Existing Vegetation Layout Around Zhen Guo Tower

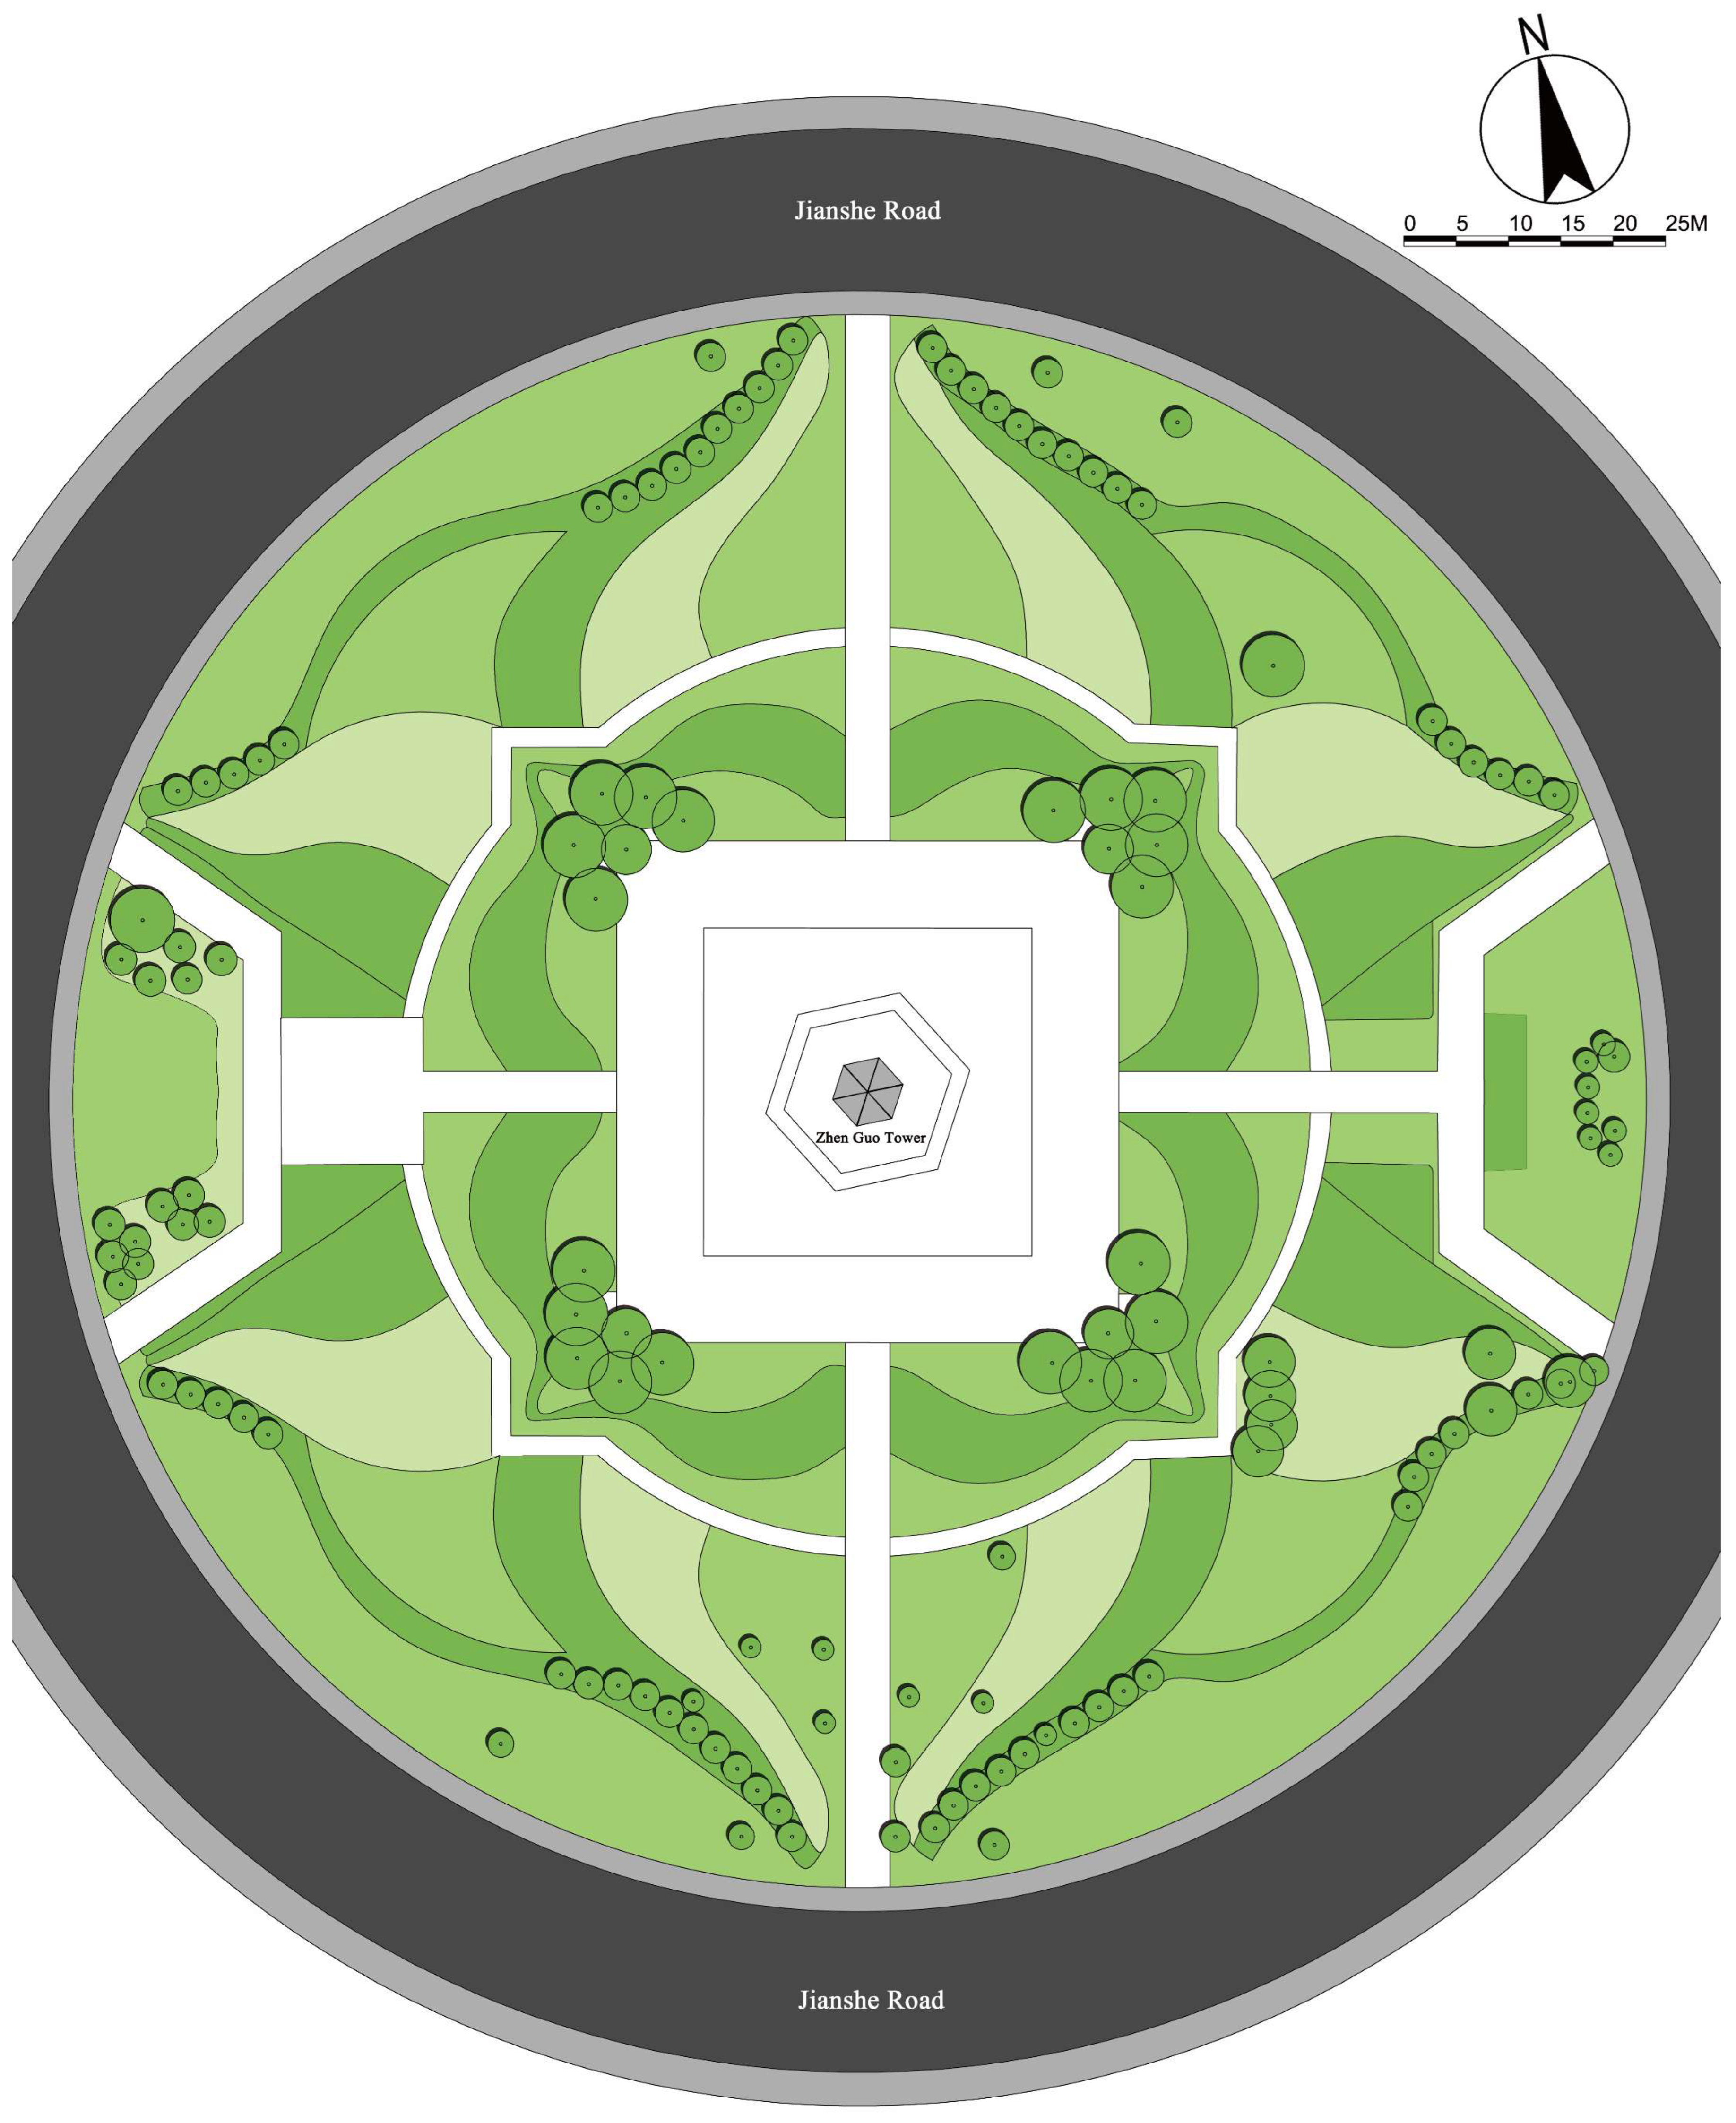
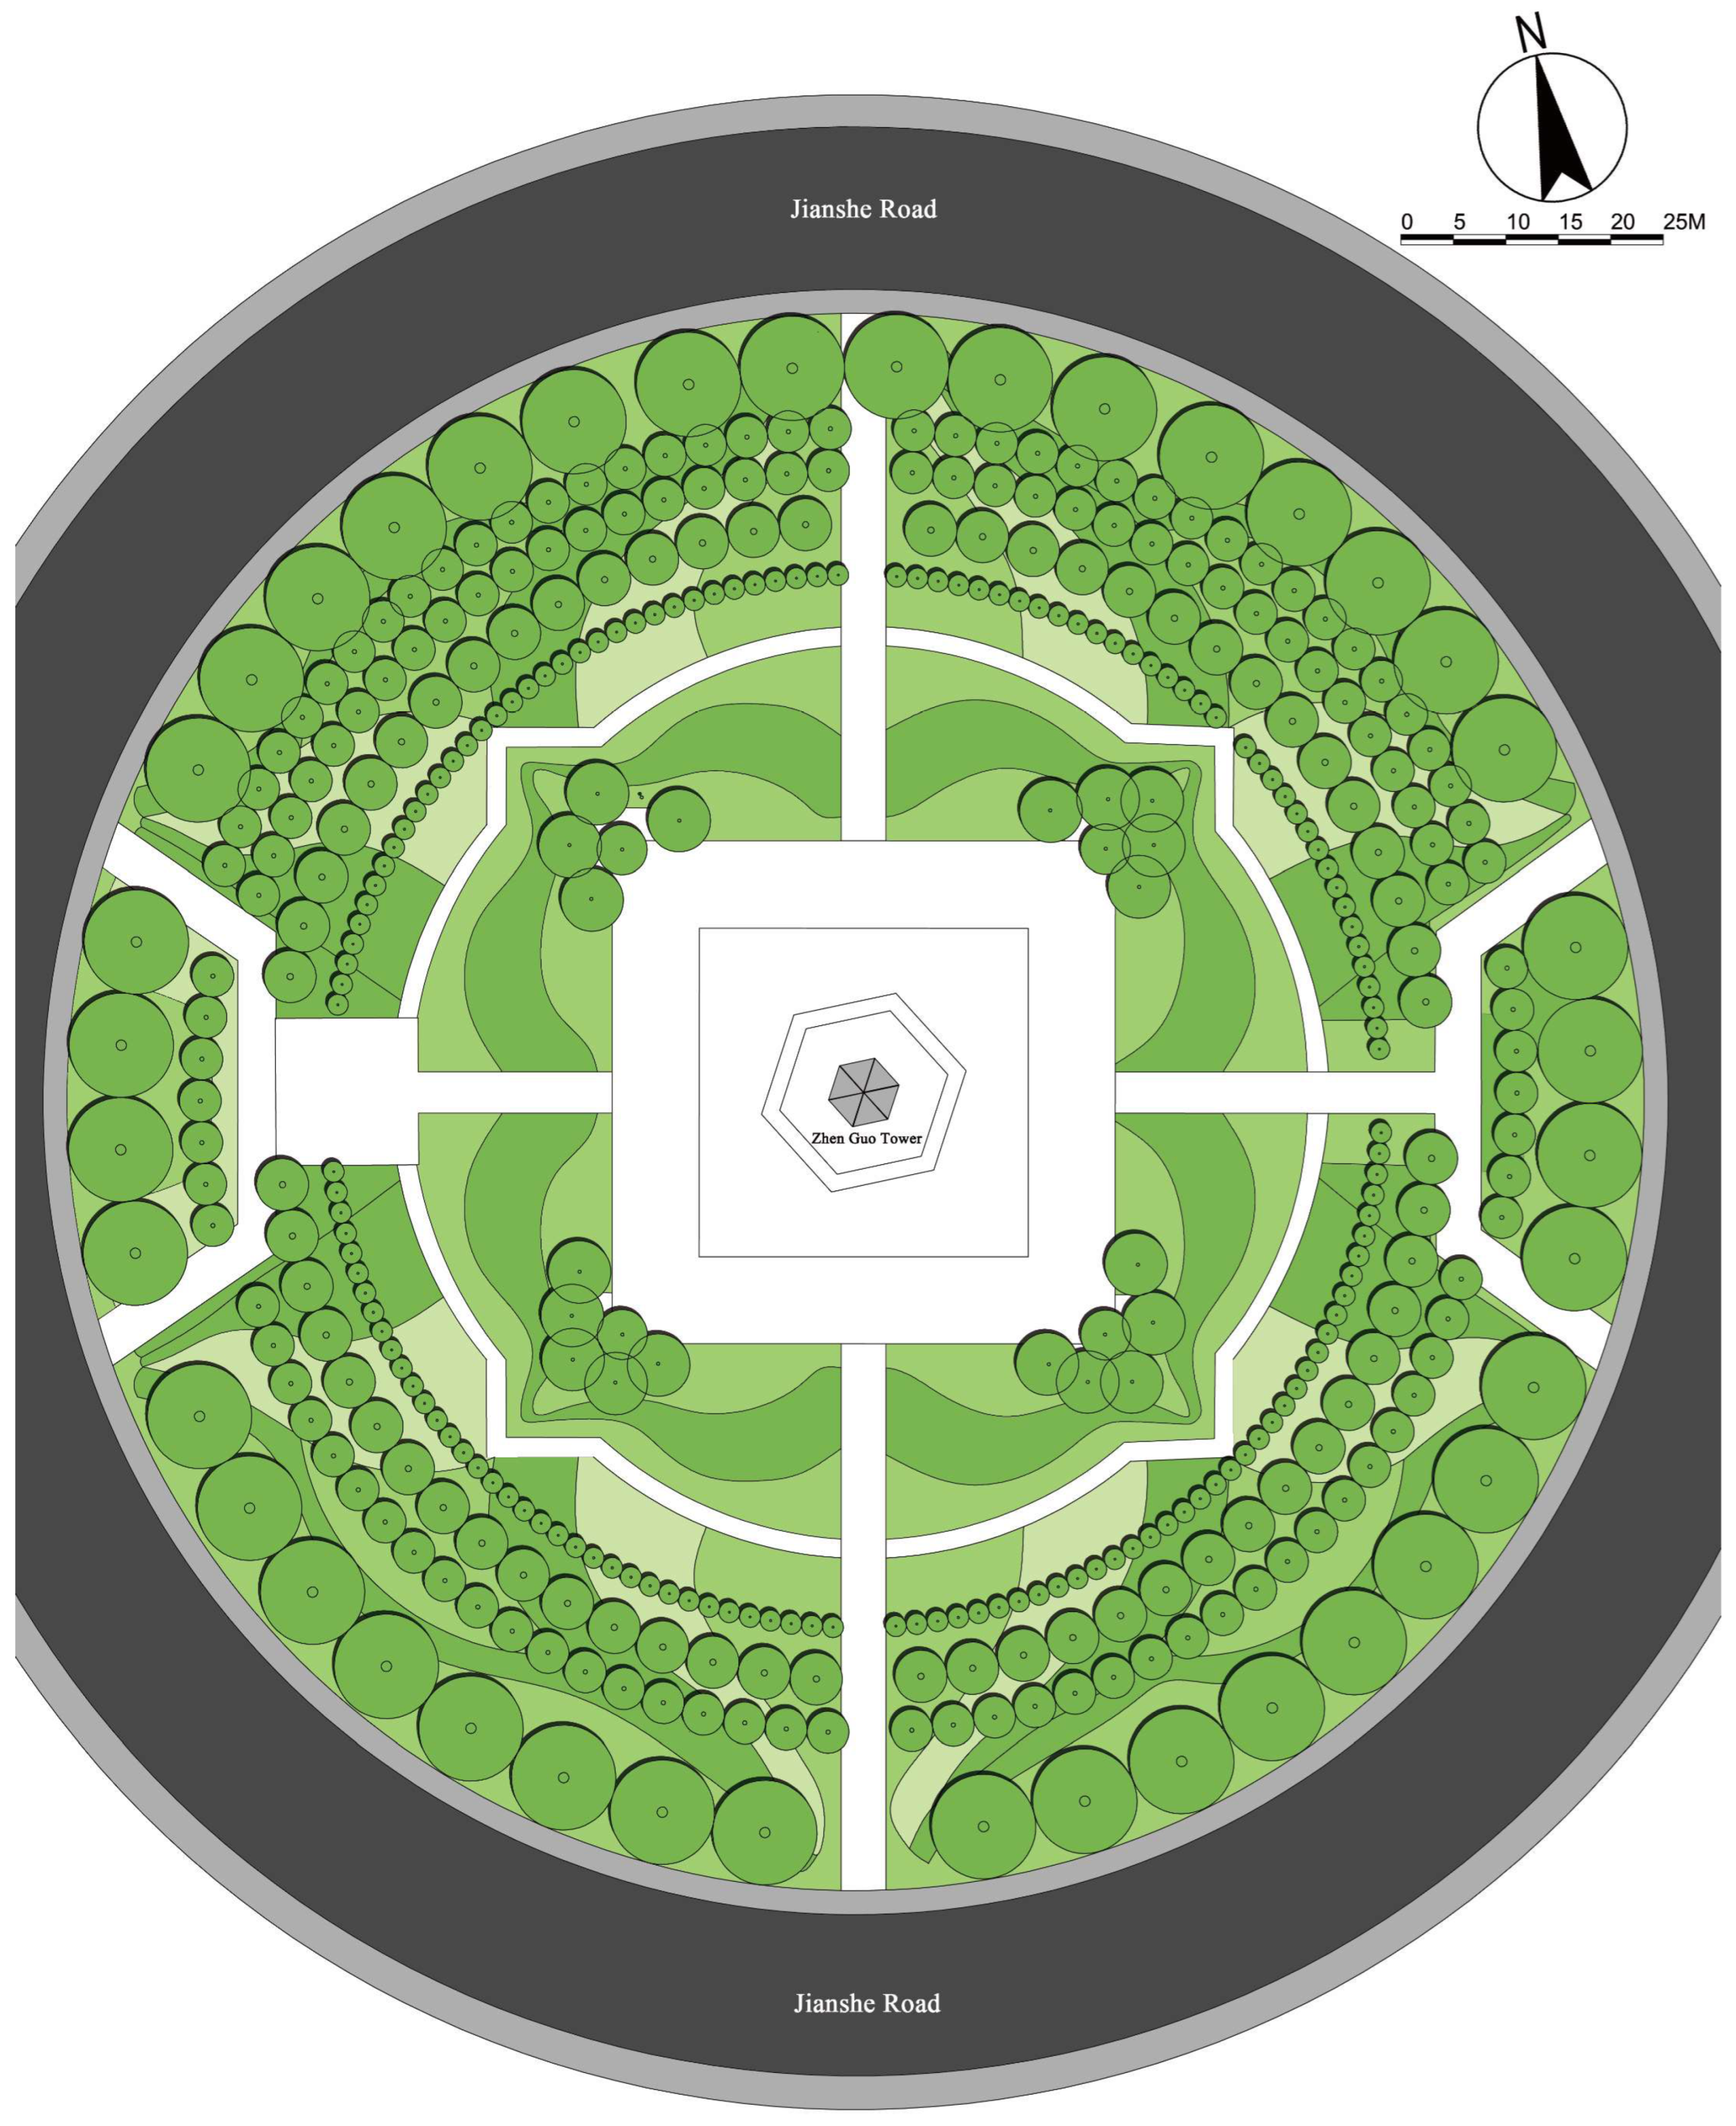
Zhen Guo Tower is surrounded by a 48 m wide paved plaza, which is encircled by an approximately 50 m wide ring-shaped greenbelt. Based on on-site vegetation surveys and spatial measurements, the primary plant species distribution (Figure 8) and configuration details (Table 2) are summarized as follows.
Overall, the surrounding vegetation of Zhen Guo Tower exhibits a relatively balanced vertical stratification of trees, shrubs, and ground cover. However, tall trees and large shrubs are sparsely distributed, with a generally low planting density.

3. Methodology

3.1. Wind Damage Threshold Determination

Fujita (1971) proposed the first standardized tornado classification system [27], which has been widely adopted for assessing wind-induced damage to buildings and vegetation. In 2013, Environment Canada revised the Enhanced Fujita (EF) scale [28], introducing wind speed threshold criteria specifically for evaluating damage levels to traditional masonry structures. These threshold values are summarized in Table 3 [29].
Based on the aforementioned wind damage threshold criteria—and with the additional consideration of the physical and mechanical properties of masonry heritage structures, such as material hardness and age-related degradation [5,19]—this study defines the following graded wind speed thresholds:
  • Warning wind speed: 10–18 m/s;
  • Hazardous wind speed: ≥18 m/s.
These thresholds serve as the basis for identifying risk zones in the subsequent numerical simulations. Previous studies have shown that under high wind speed conditions, masonry structures are prone to surface erosion, wall cracking, and structural instability, especially for elevated components such as spires and towers. These elements are particularly vulnerable to the combined effects of windward pressure and leeward suction forces [30]. Moreover, because of aerodynamic pressure scales with the square of the wind speed (qU2), the CFD-predicted reductions in the local wind speed (U) imply proportionally larger reductions in pressure (q) and associated base overturning effects at slender towers; hence graded wind speed thresholds are used as a proxy for structural vulnerability [25].

3.2. CFD Simulation Method

To quantitatively evaluate the wind mitigation effects of vegetation around Zhen Guo Tower, computational fluid dynamics (CFD) simulations were conducted using ANSYS Fluent 2024 R2. A steady-state, incompressible flow approach was employed to simulate the micro-scale wind environment, based on the Reynolds-Averaged Navier–Stokes (RANS) equations. This modeling framework is well-suited for high-Reynolds-number flows over complex geometries, such as heritage masonry structures and heterogeneous vegetation landscapes [31].
The Standard k–ε turbulence model was selected due to its proven reliability in architectural-scale wind simulations and its favorable balance between computational efficiency and prediction accuracy. Compared with more advanced models like the Large Eddy Simulation (LES), the Standard k–ε model requires significantly fewer computational resources while maintaining an acceptable accuracy in urban wind environment studies [32].

3.2.1. Computational Domain, Boundary Conditions, and Grid Settings

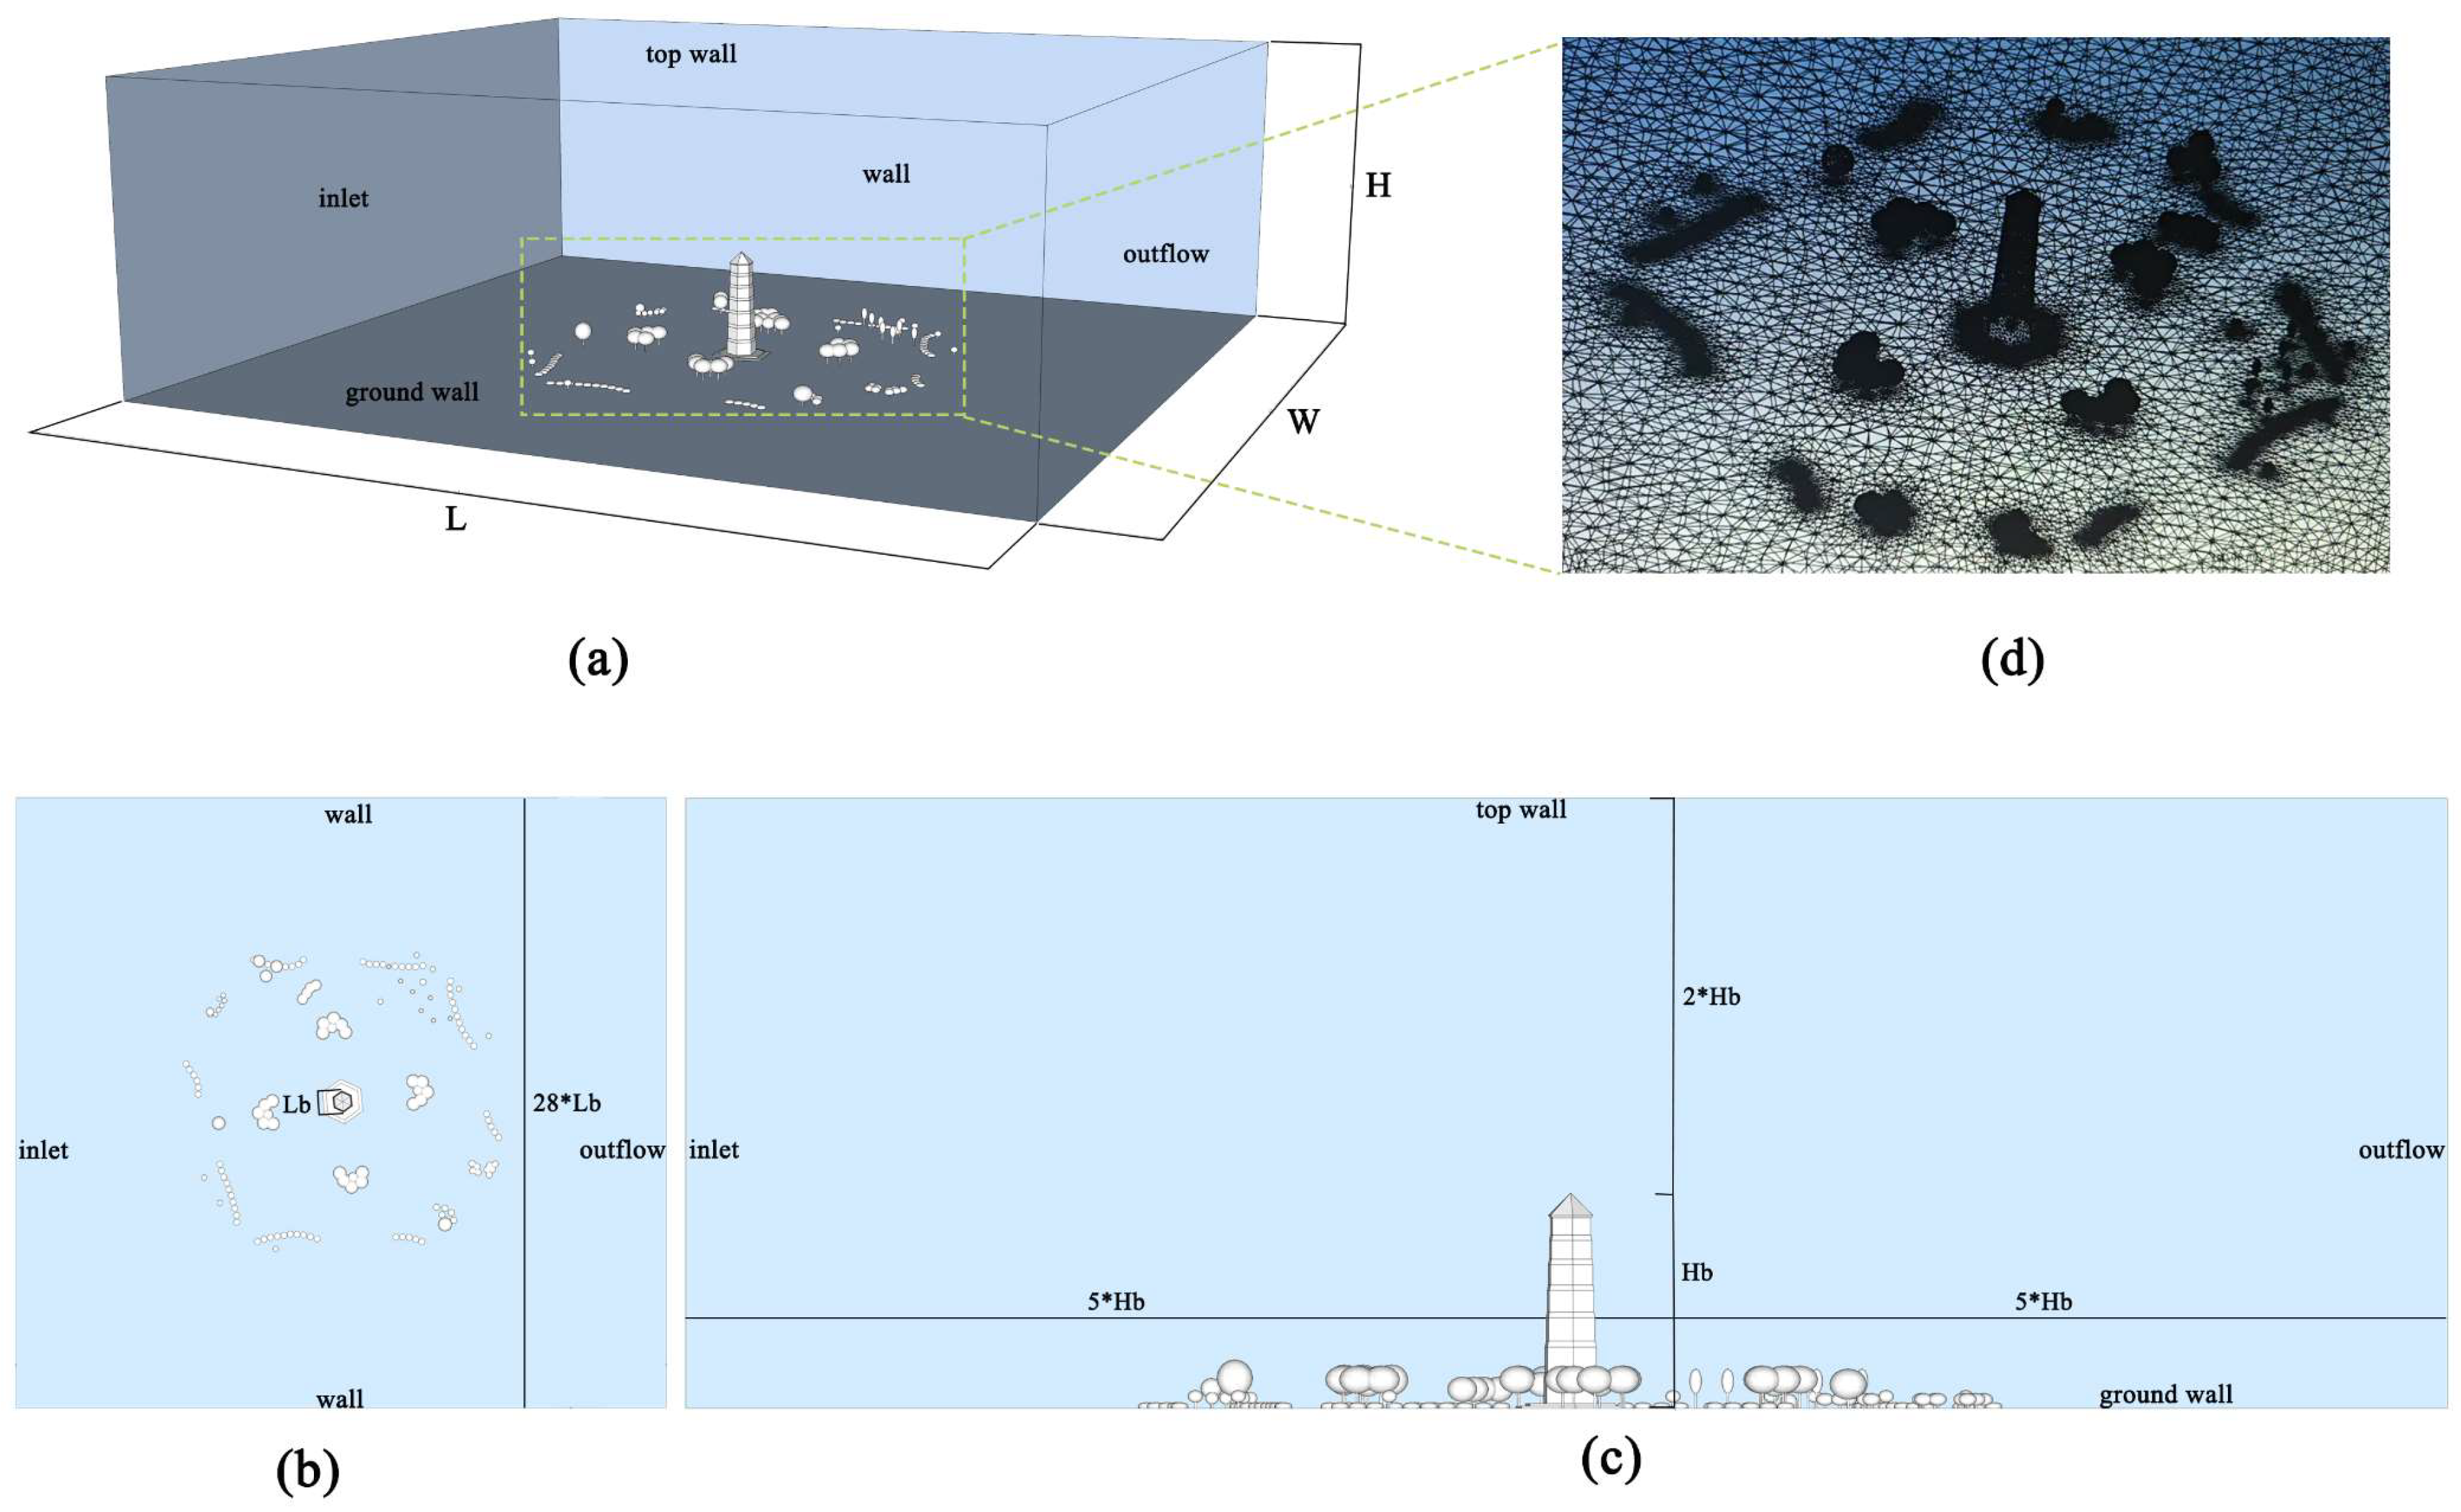
The computational domain was constructed based on aerial oblique photogrammetry and Rhino-based architectural modeling, encompassing the Zhen Guo Tower, the surrounding vegetation, and its local wind influence zone. Figure 9 illustrates the domain structure, boundary condition assignments, and mesh refinement regions.
To ensure the adequate simulation accuracy for the building-scale external flow, the domain dimensions were defined according to the tower’s maximum height (Hb = 34.5 m) and windward maximum width (Lb = 9.5 m) as follows [33]:
  • Inlet and outlet boundaries were set at approximately 5 × Hb (≈170 m) from the tower to allow for a fully developed flow and to minimize wake interference;
  • The domain width was set to approximately 28 × Lb (≈270 m);
  • The top boundary height was defined as 2 × Hb to ensure upper-level flow development.
The velocity inlet condition was applied at the inflow boundary, with wind speeds set at 12.8 m/s and 20.0 m/s to represent typical and extreme wind scenarios [34]. Given this study’s focus on evaluating the impact of different vegetation configurations on vertical wind patterns around the tower—rather than simulating urban-scale atmospheric boundary layer development—a uniform velocity profile was adopted to reduce confounding variables and emphasize vegetation effects. The outlet boundary was defined as a zero-gauge pressure outlet to ensure continuity [35]; the ground and building surfaces were modeled as rough, no-slip walls with a surface roughness length of z0 = 0.5 m; top and side walls were assigned symmetry boundary conditions to reduce artificial reflections; and standard wall functions were applied to all solid surfaces [36].
The geometry used for CFD was not the raw photogrammetric mesh; instead, geometric dimensions were extracted from the reconstruction, and the tower was re-modeled as watertight NURBS solids in Rhinoceros (Rhino), then imported into ANSYS Fluent. The solids were first triangulated to produce a surface mesh, which then served as the starting boundary for automatically generating a volumetric unstructured tetrahedral mesh across the computational domain using Fluent Meshing. The mesh generation was governed by user-defined size controls: a global minimum element size of 0.2 m and local refinements applied to (1) windward facades and eaves, (2) anticipated separation/recirculation regions on the leeward side, and (3) vegetation canopies/porous subdomains. Depending on the vegetation configuration, the final meshes contained approximately 5.3–6.0 million cells. The mesh quality was checked with the solver’s standard diagnostics (skewness, orthogonal quality, aspect ratio, growth rate) and satisfied the recommended thresholds [37]. The principal CFD settings are summarized in Table 4.

3.2.2. Vegetation Modeling Method

To simplify computations while ensuring simulation accuracy, vegetation was modeled as a porous medium within the CFD framework [38,39]. The modeling assumptions are as follows.
Vegetation classification: Based on field survey data, the surrounding vegetation was classified into three categories: trees, tall shrubs, and herbaceous plants. Only vegetation taller than 1.5m was included in the model; shorter plants were treated as low-resistance or surface-level vegetation. Sophora japonica (Chinese scholar tree) and Photinia × fraseri were selected as representative species for trees and shrubs, respectively. For each species, 10 individual samples were measured using an LAI-2200 Plant Canopy Analyzer to obtain average leaf area index (LAI) values. The canopy porosity (ε) of the representative species was estimated using the LAI-based attenuation method, expressed as follows:
ε = e k · L A I
where
  • ε : canopy porosity (dimensionless);
  • k : extinction coefficient, typically taken as 0.5 for trees and 0.6 for shrubs;
  • LAI: leaf area index.
Tree and tall shrub modeling: The plant canopy was modeled as a homogeneous spherical porous resistance body, positioned in the geometric domain according to the actual location, height, and crown diameter of the vegetation. Within the plant canopy, viscous drag is generally negligible compared to inertial drag and is therefore often omitted in CFD modeling [40]. The inertial drag coefficient ( C d ) was calculated based on the estimated canopy porosity using the following empirical formula [41]:
C d = 1.08 ( 1 ε 1.8 )
Based on the above method, the canopy porosity of the tree layer was set to 0.42, with an inertial drag coefficient of 0.85, while the shrub layer had a porosity of 0.18 and a drag coefficient of 1.02. Given that this study focuses on the impact of the spatial configuration of vegetation on the wind environment around heritage buildings, the plant species and their porosity parameters were kept consistent before and after optimization. This approach eliminates the confounding effects of species differences, thereby ensuring clarity in the analysis of variables and the reliability of the results.

3.3. Wind Protection Efficiency Calculation

To quantitatively assess the wind speed reduction effect of vegetation at different heights around Zhen Guo Tower, the tower was divided into six key vertical intervals: 1.5 m, 5 m, 10 m, 15 m, 20 m, and 30 m. For each height level, the wind protection efficiency of the vegetation was calculated and compared between the baseline and optimized vegetation configurations. The wind protection efficiency ( E h ) was computed using the following equation [36]:
E h = v 0 h v h v 0 h × 100 %
where
  • E h : represents the percentage reduction in wind speed at height hhh (in meters) owing to vegetation;
  • v 0 h : the wind speed at height hhh under the non-vegetated (control) condition (m/s);
  • v h : the wind speed at the same height with vegetation present (m/s).
The value of E h indicates the effectiveness of vegetation in reducing the wind speed at a given height. Higher values denote greater wind attenuation, which is particularly critical for vertical structures like tall heritage towers.

3.4. Model Validation

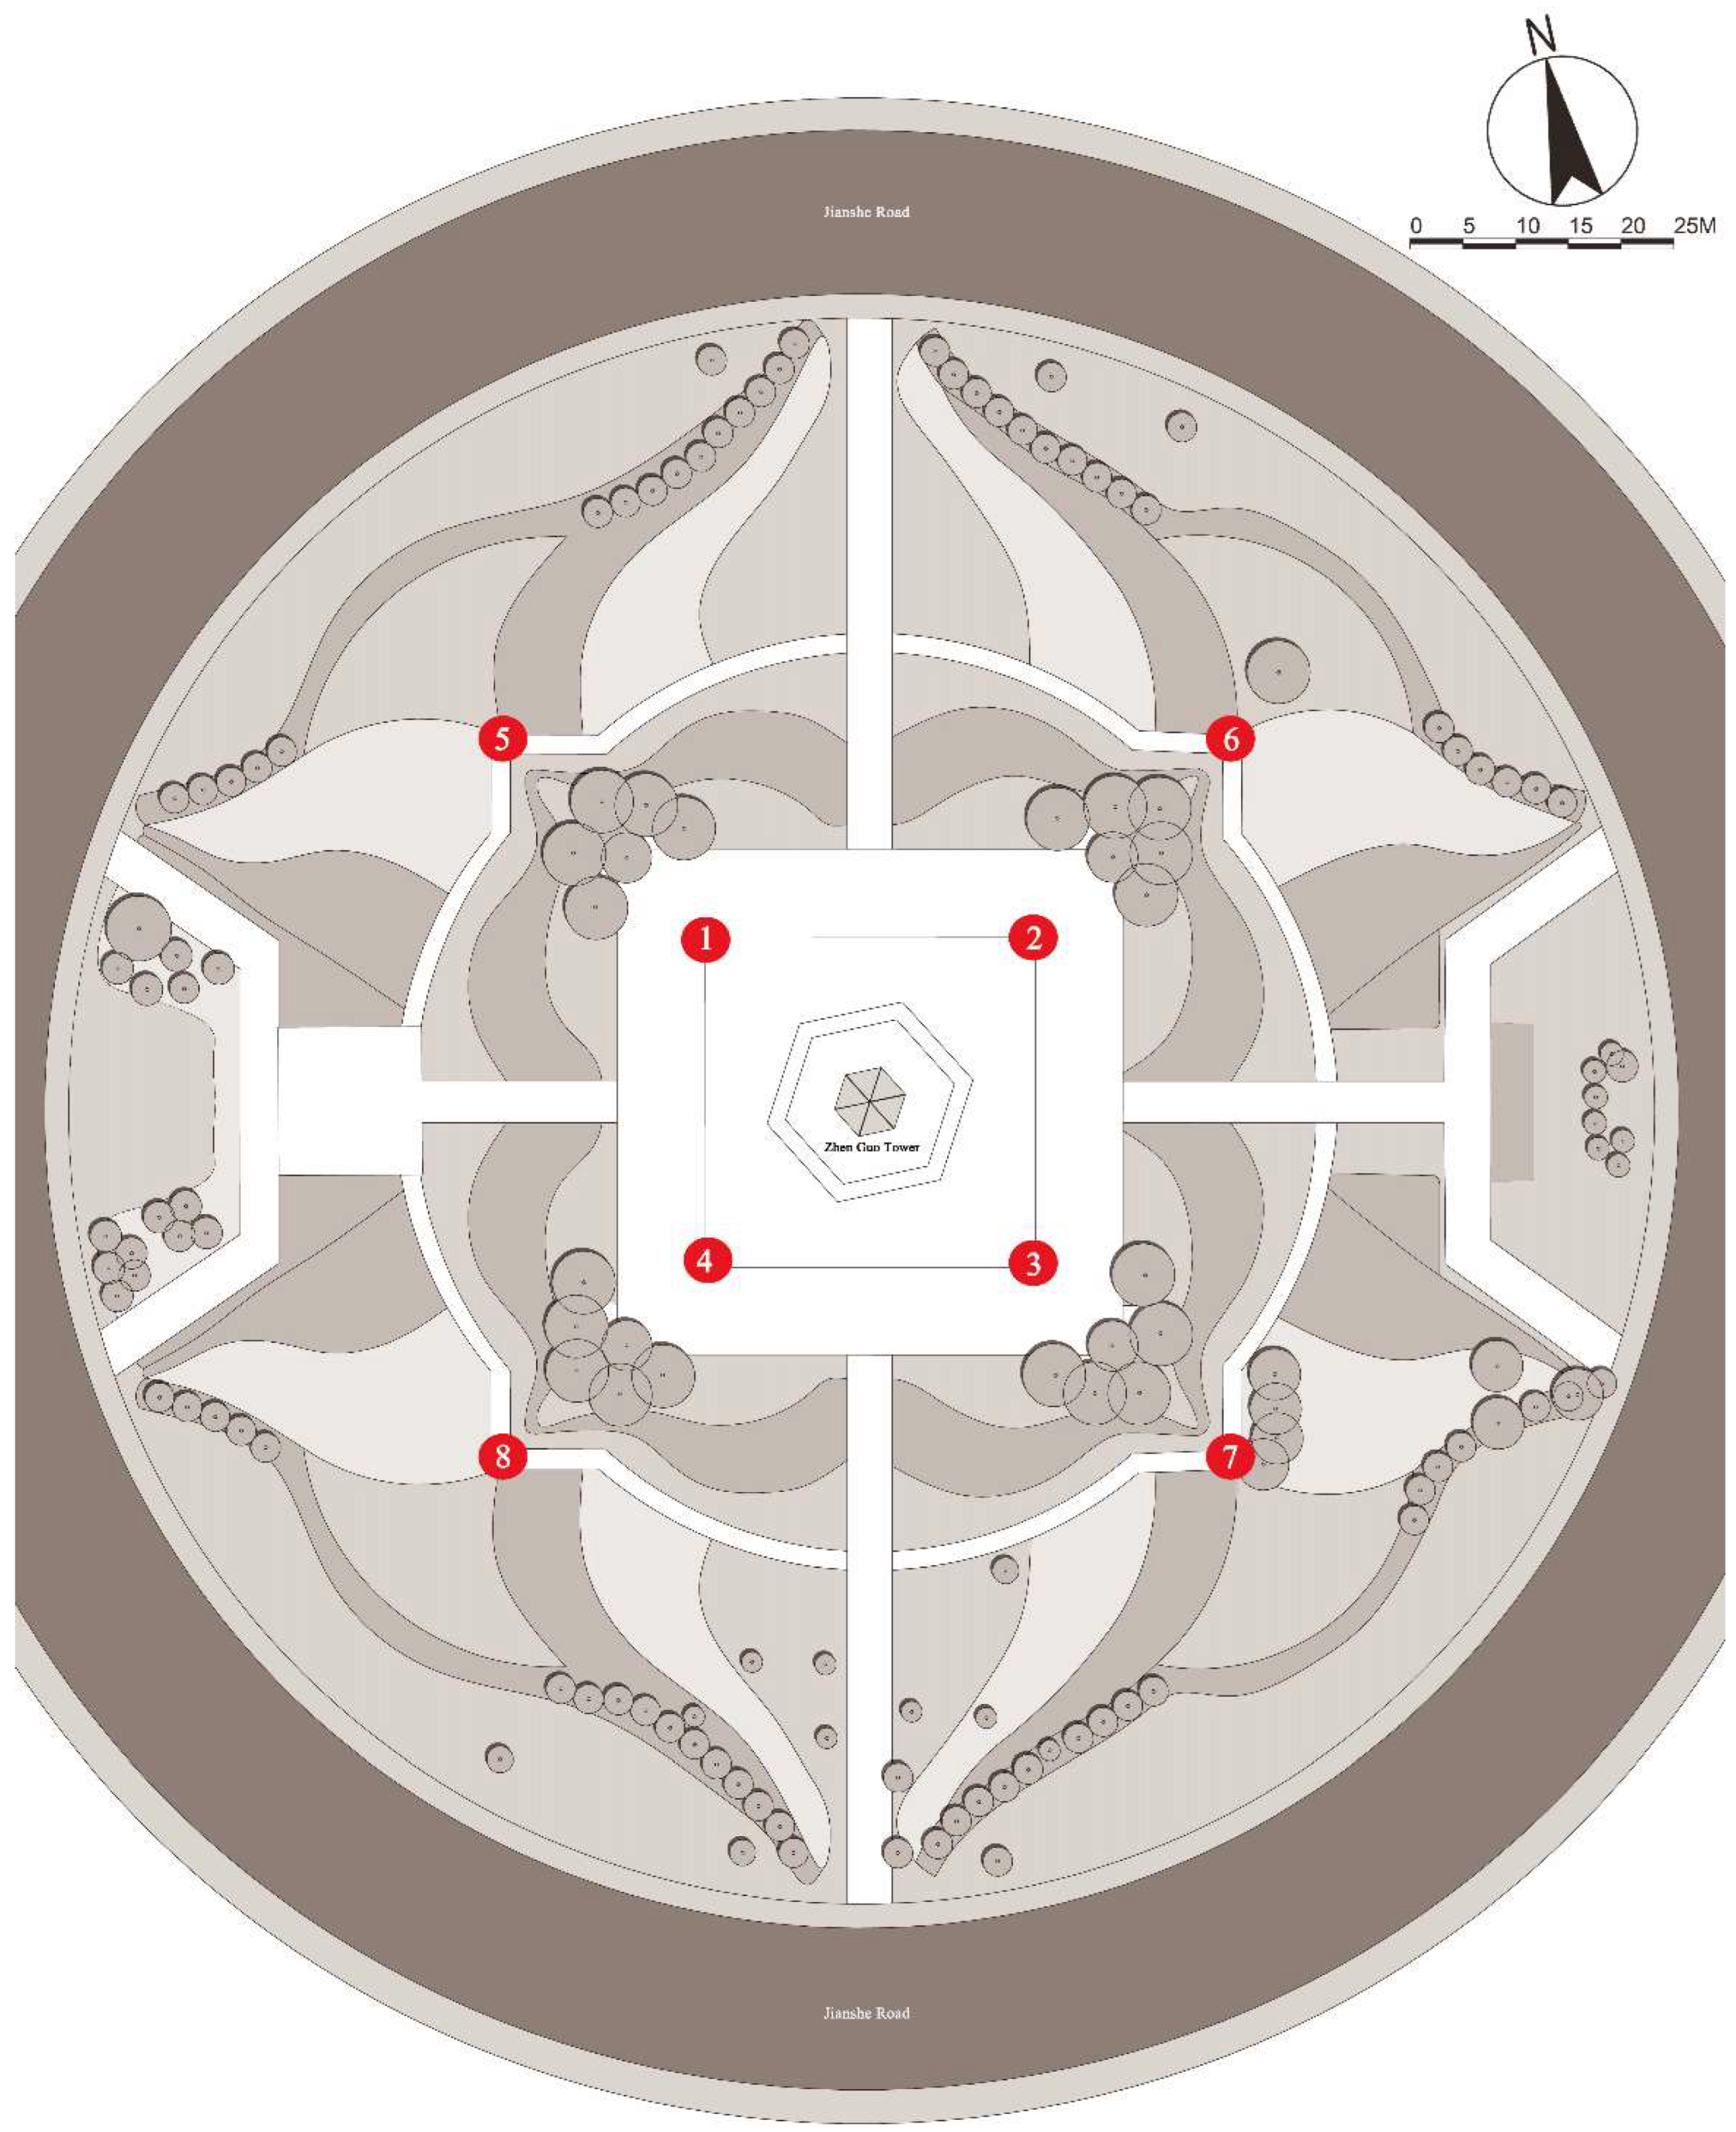
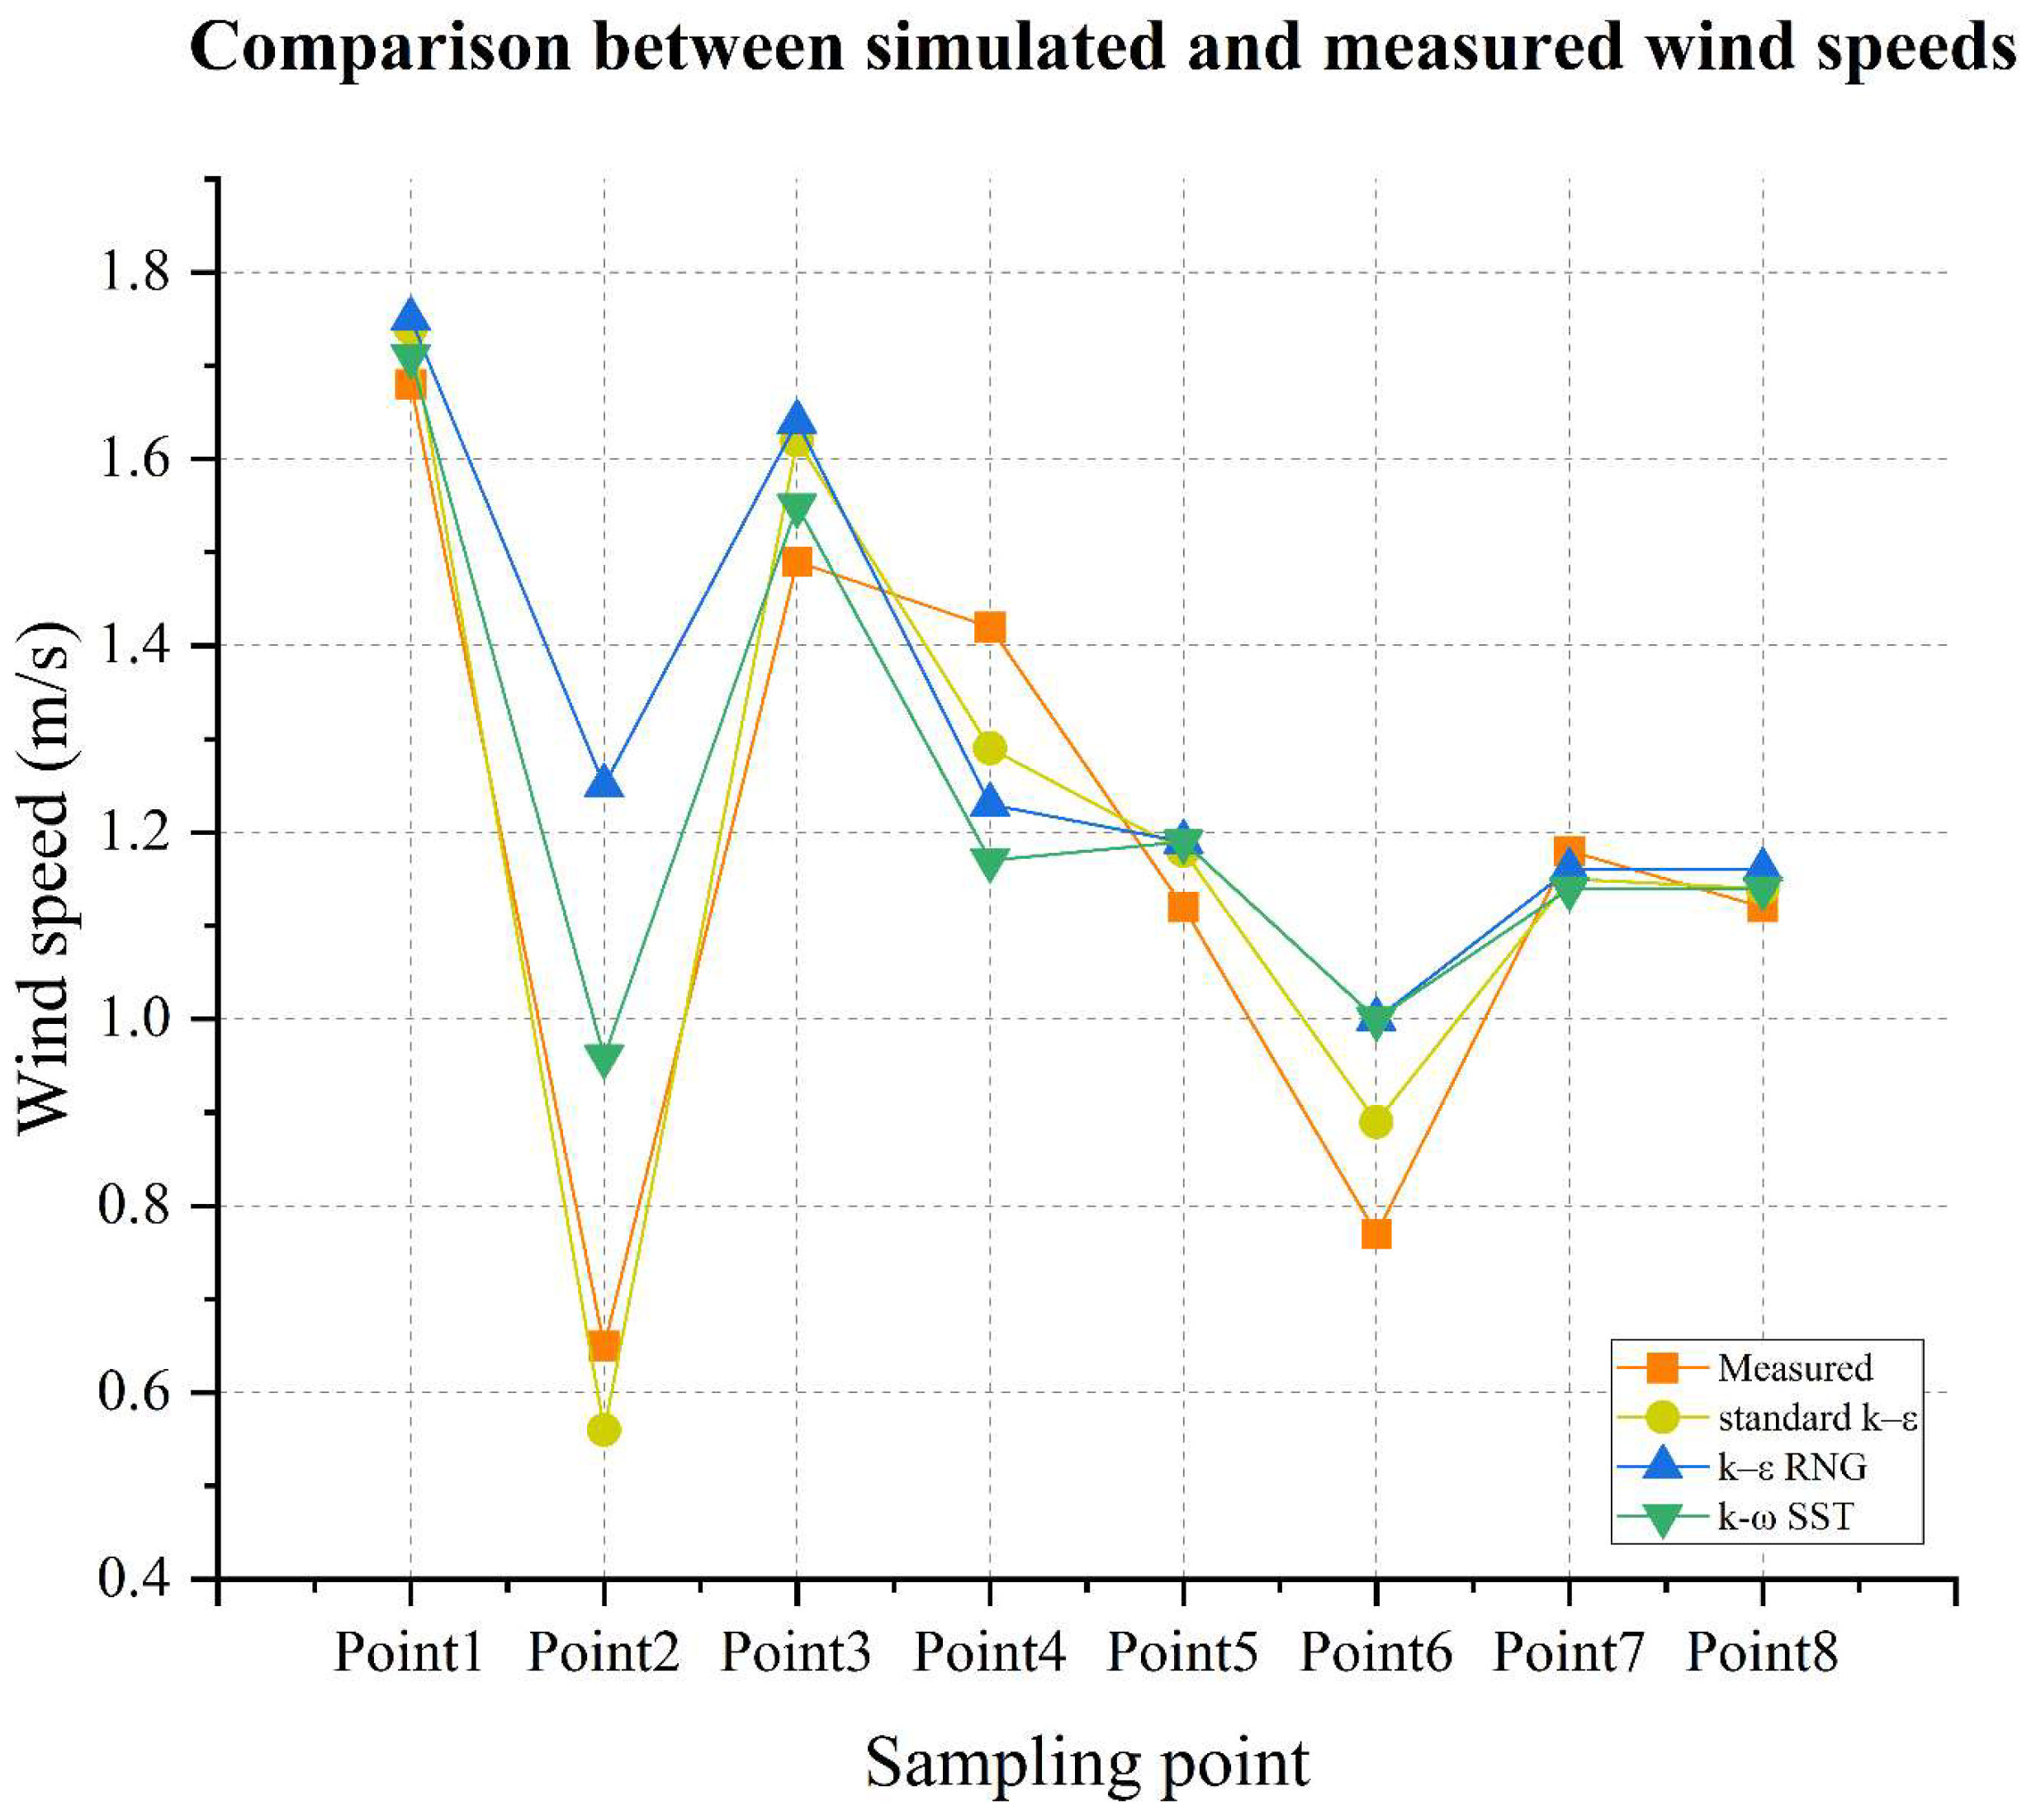
To further evaluate the robustness and reliability of the CFD simulation results, a sensitivity analysis was conducted using three commonly adopted turbulence models: Standard k–ε, RNG k–ε, and k–ω SST. Under identical boundary conditions, wind speeds at eight sampling points (1.5 m height, as shown in Figure 10) were simulated and compared with measured field data.
The wind speed measurements were obtained using a PH450 portable weather station, which features a measurement accuracy of ±0.3 m/s and a resolution of 0.1 m/s. Field observations were conducted on 11 April 2025, from 09:00 to 12:00 under stable wind conditions. All sampling points were placed at a height of 1.5 m, and wind speed readings were recorded every 30 min. Each point was measured three times and averaged to ensure data stability and reliability. During the measurement period, the average wind speed was 2.1 m/s with a southwest wind direction, as recorded by the Weihui Meteorological Station. These values were used to define the boundary conditions for the CFD simulations.
As shown in Figure 11 and Table 5, the three turbulence models produced generally consistent overall wind speed distribution patterns, but notable discrepancies were observed in localized predictions. The Standard k–ε model yielded the lowest average relative error (8.57%), with six out of eight points exhibiting errors below 10%. The RNG k–ε model significantly overestimated the wind speed at Point P2 (error: 92.3%), likely due to its known sensitivity to low-speed recirculation zones. The k–ω SST model did not demonstrate clear advantages in accuracy (average error: 14.06%) and incurred higher computational costs.
In summary, the Standard k–ε model provided the best trade-off between accuracy and efficiency for steady-state simulations in building-scale wind environments. Accordingly, this model was selected as the primary turbulence scheme for the subsequent analysis of wind environments under optimized vegetation configurations.

4. Simulation Results and Analysis

4.1. Wind Field Simulation Under Existing Vegetation Configuration

The wind environment surrounding Zhen Guo Tower, under the current vegetation layout, was first simulated using CFD to identify wind speed distribution patterns and potential wind risk zones. The simulations were performed using ANSYS Fluent, with meteorological parameters derived from the local data collected in Weihui City between 2014 and 2024. Two wind scenarios were defined: a maximum wind speed condition of 12.8 m/s and an extreme wind speed condition of 20 m/s. The Standard k-ε turbulence model was applied throughout the simulation.

4.1.1. Wind Field Distribution and Risk Zone Identification

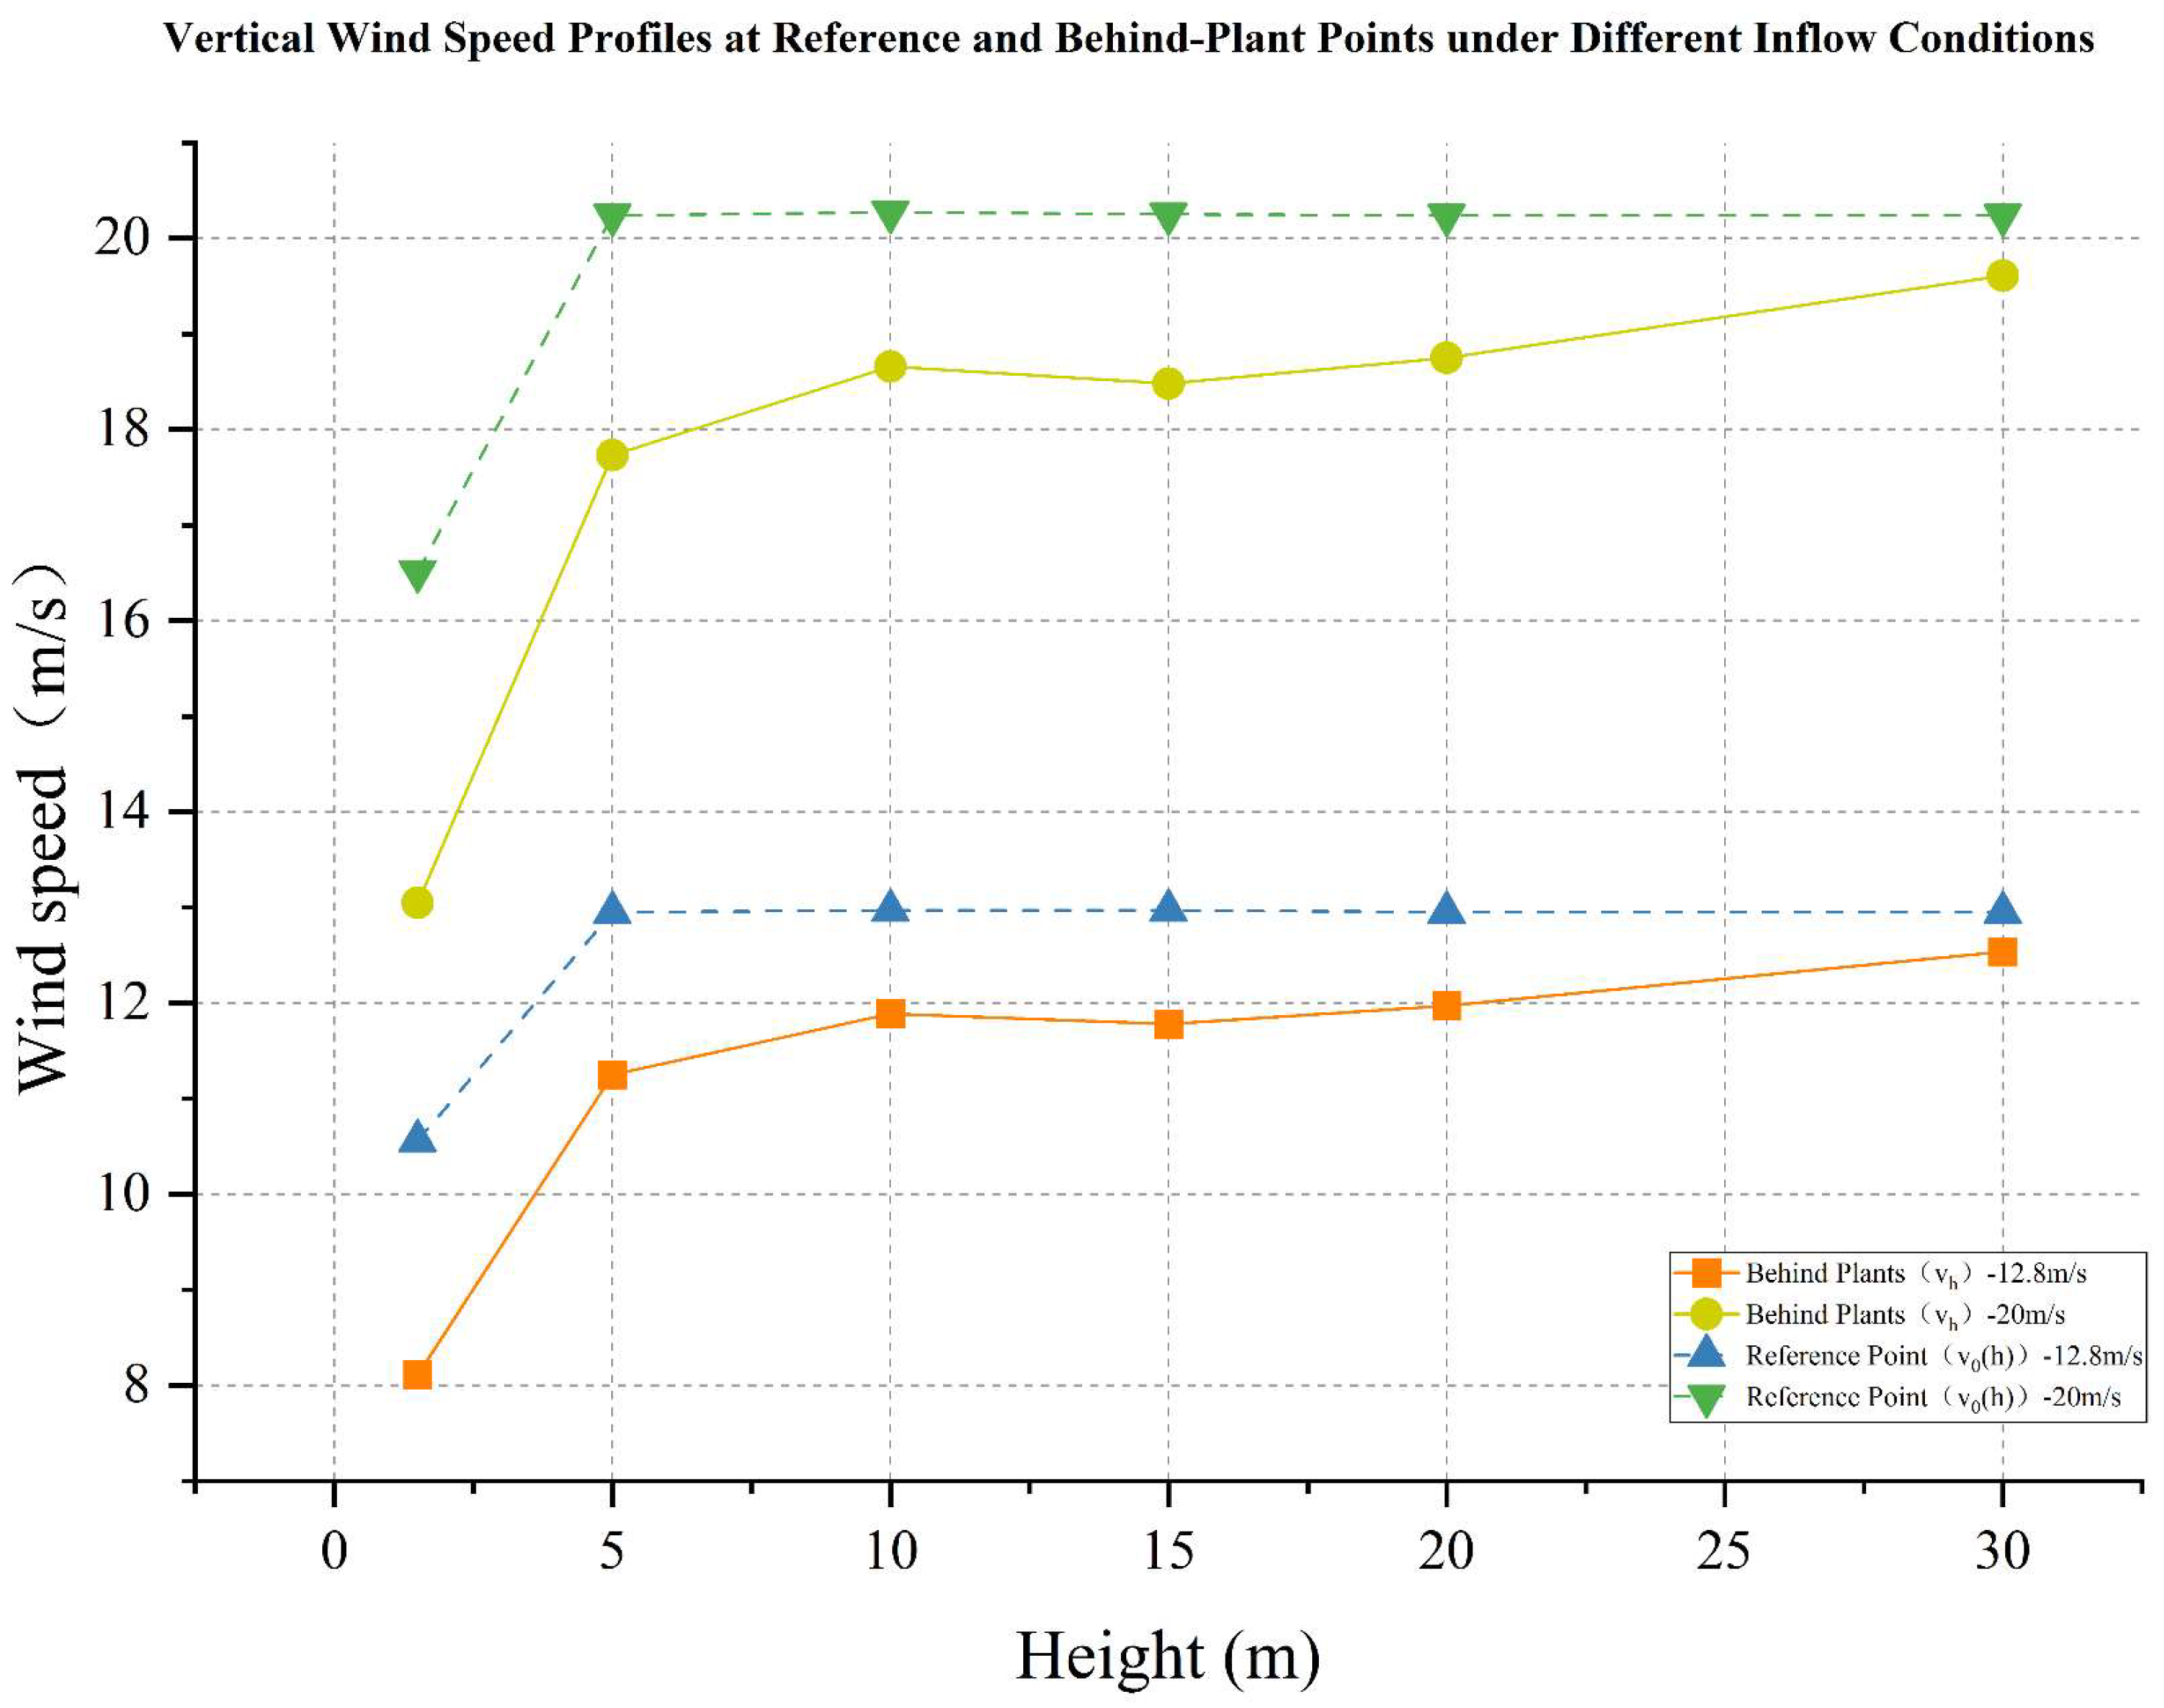
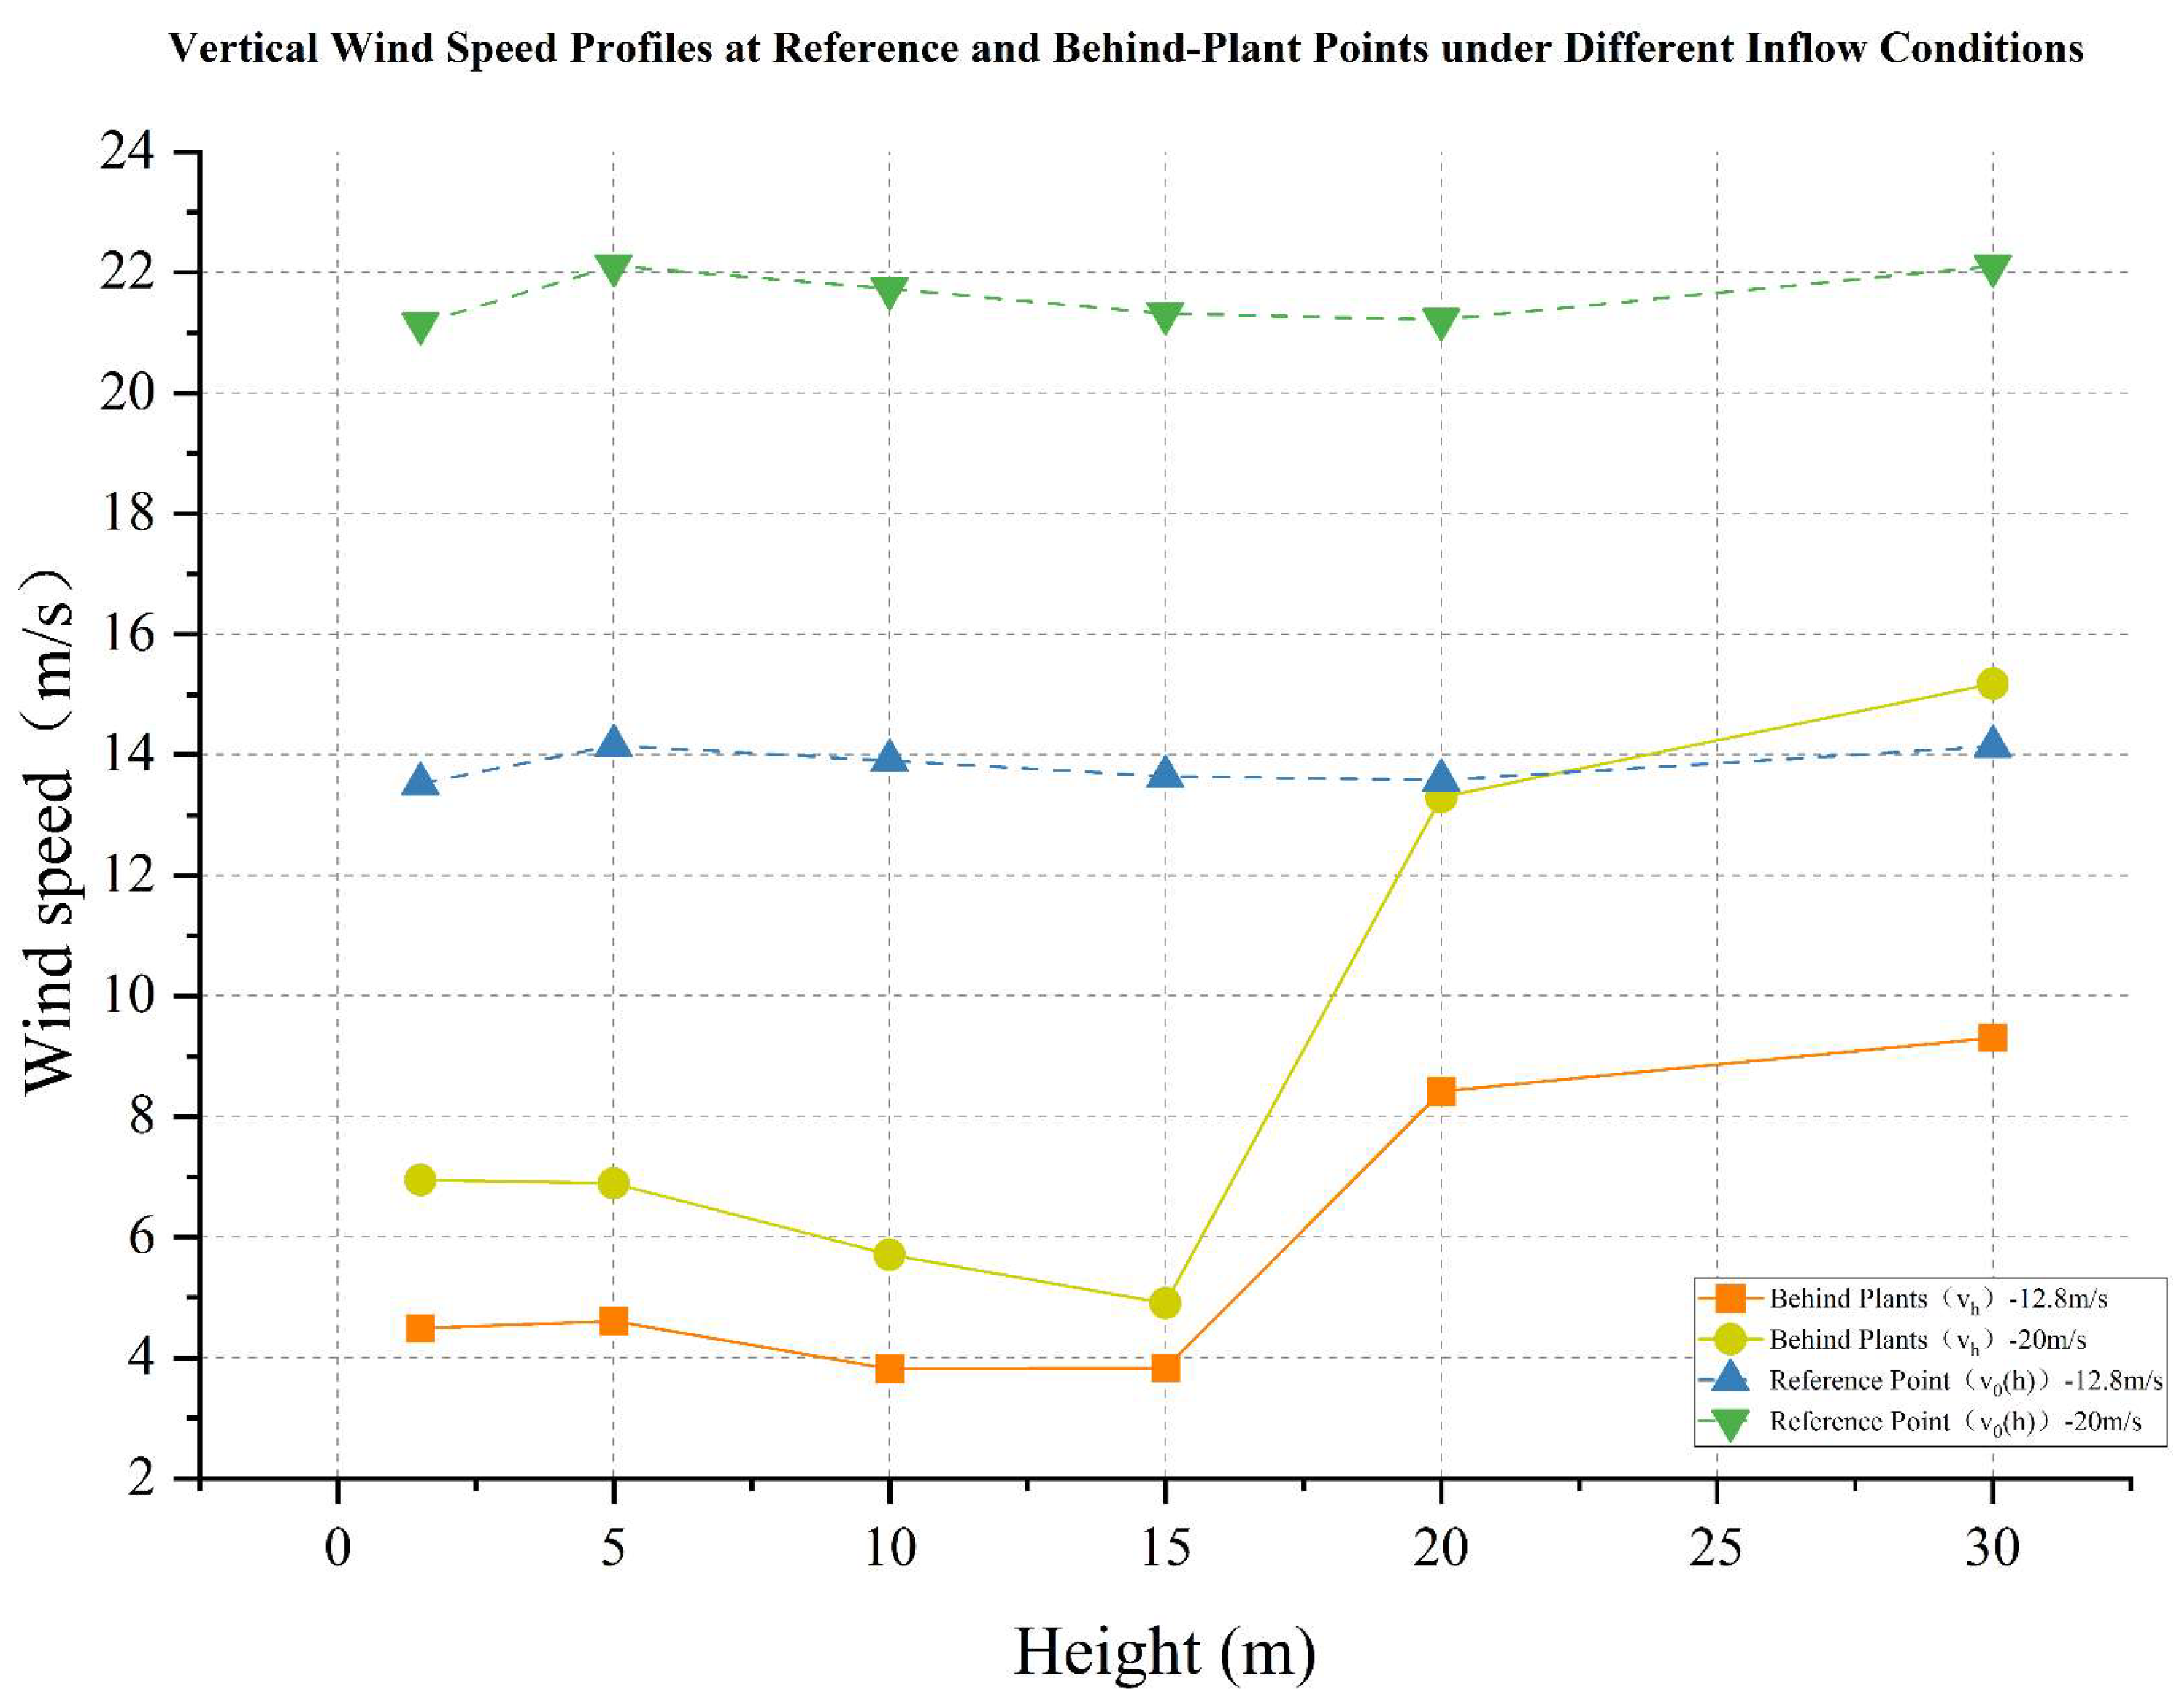
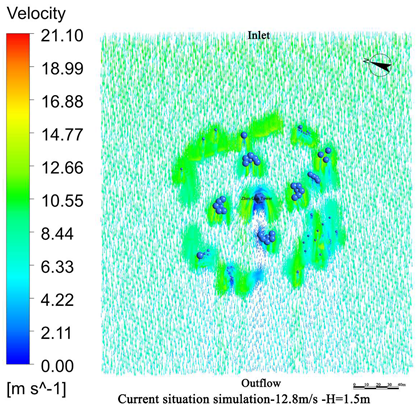
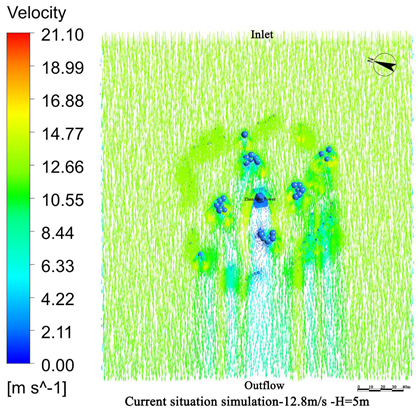
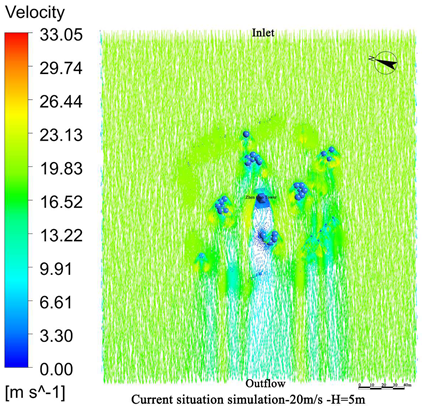
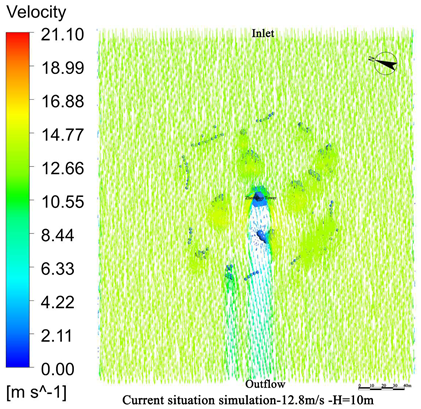
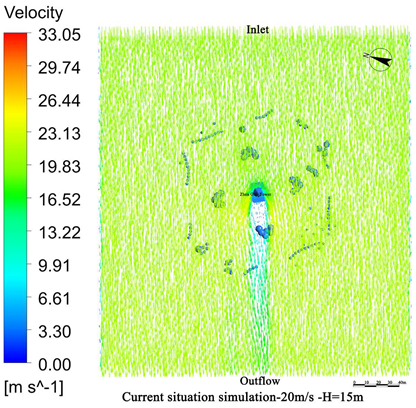
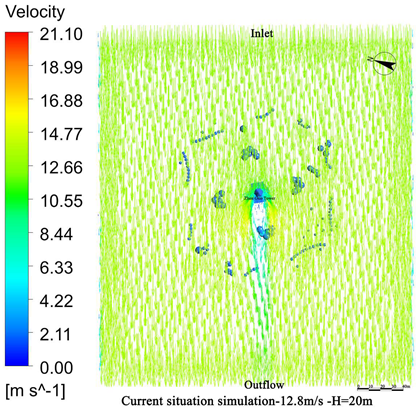
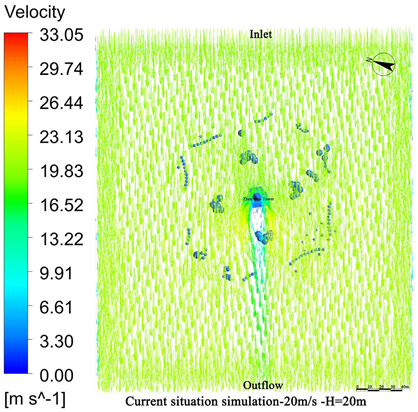
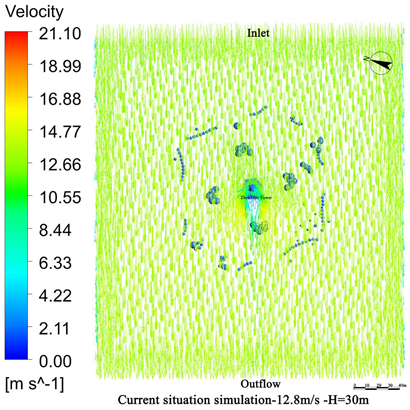
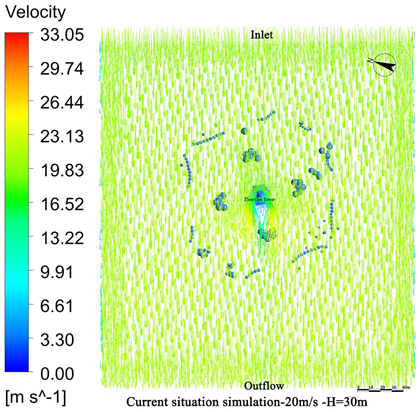
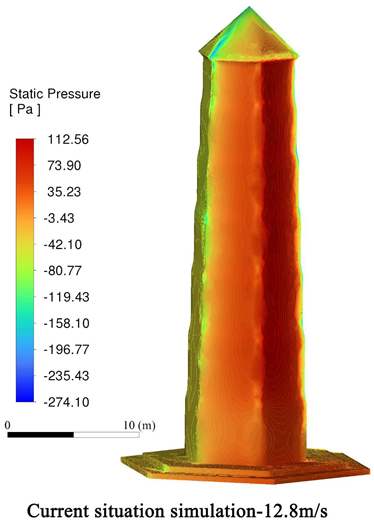
Based on the CFD simulation results, the wind field distribution around Zhen Guo Tower was analyzed at multiple vertical heights: 1.5 m, 5 m, 10 m, 15 m, 20 m, and 30 m (Table 6). The results indicate that under the current vegetation configuration, noticeable wind speed attenuation occurs at lower heights (1.5 m and 5 m), whereas little to no attenuation is observed in the mid-to-upper levels (above 10 m), where wind directly impacts the tower surface. Under the 12.8 m/s wind condition, the wind speed on most of the windward surfaces above 10 m exceeds the warning threshold of 10 m/s, suggesting a high potential for wind erosion. Under the extreme wind conditions of 20 m/s, the wind speed in the same areas exceeds the hazardous threshold of 18 m/s, indicating a significant risk of direct structural damage (Figure 12). Therefore, the regions above 10 m on the windward side of Zhen Guo Tower are identified as the most wind-vulnerable zones.
In addition to the wind speed analysis, surface pressure distributions were examined to reinforce the identification of high-risk areas. As shown in Table 6, under both 12.8 m/s and 20 m/s wind conditions, the windward side of the tower experiences a clear concentration of high positive pressure, while the leeward side exhibits strong negative pressure zones (suction effects). The overall pressure difference across the tower significantly increases under the 20 m/s scenario, indicating elevated aerodynamic loading on the structure.

4.1.2. Wind Protection Efficiency of Existing Vegetation

According to the calculated wind protection efficiency at different heights under the current vegetation configuration (Table 7), the results show that vegetation provides approximately a 20% reduction in wind at a height of 1.5 m. However, the effectiveness drops significantly at 5 m and becomes negligible above 10 m.
This limited performance may be attributed to two main factors:
  • The average height of the trees planted around Zhen Guo Tower is approximately 6–7 m, while most shrubs are below 1.5 m. Consequently, the vegetation exerts a wind-blocking effect at lower heights (around 1.5 m) but offers little to no attenuation at higher levels, where wind directly impacts the tower surface.
  • The tree layout surrounding the tower primarily adopts a “clustered” configuration, while the shrubs, though arranged in “row-wise” patterns, are planted at a relatively low density. The substantial gaps between the plants prevent the formation of an effective windbreak barrier. Consequently, even in the 1.5 m and 5 m height zones, the wind protection effect remains limited.
These findings suggest that the current vegetation layout was designed primarily for visual and esthetic purposes, without adequate consideration for preventing wind damage.

4.2. Optimized Vegetation Configuration Design

Based on the preceding wind field simulation analysis, this study proposes an optimized vegetation configuration scheme. The core objective of the optimization is to reduce wind speeds through a strategic plant arrangement, thereby mitigating the adverse effects of wind on the heritage structure [42,43,44].
  • Vegetation structure adjustment:
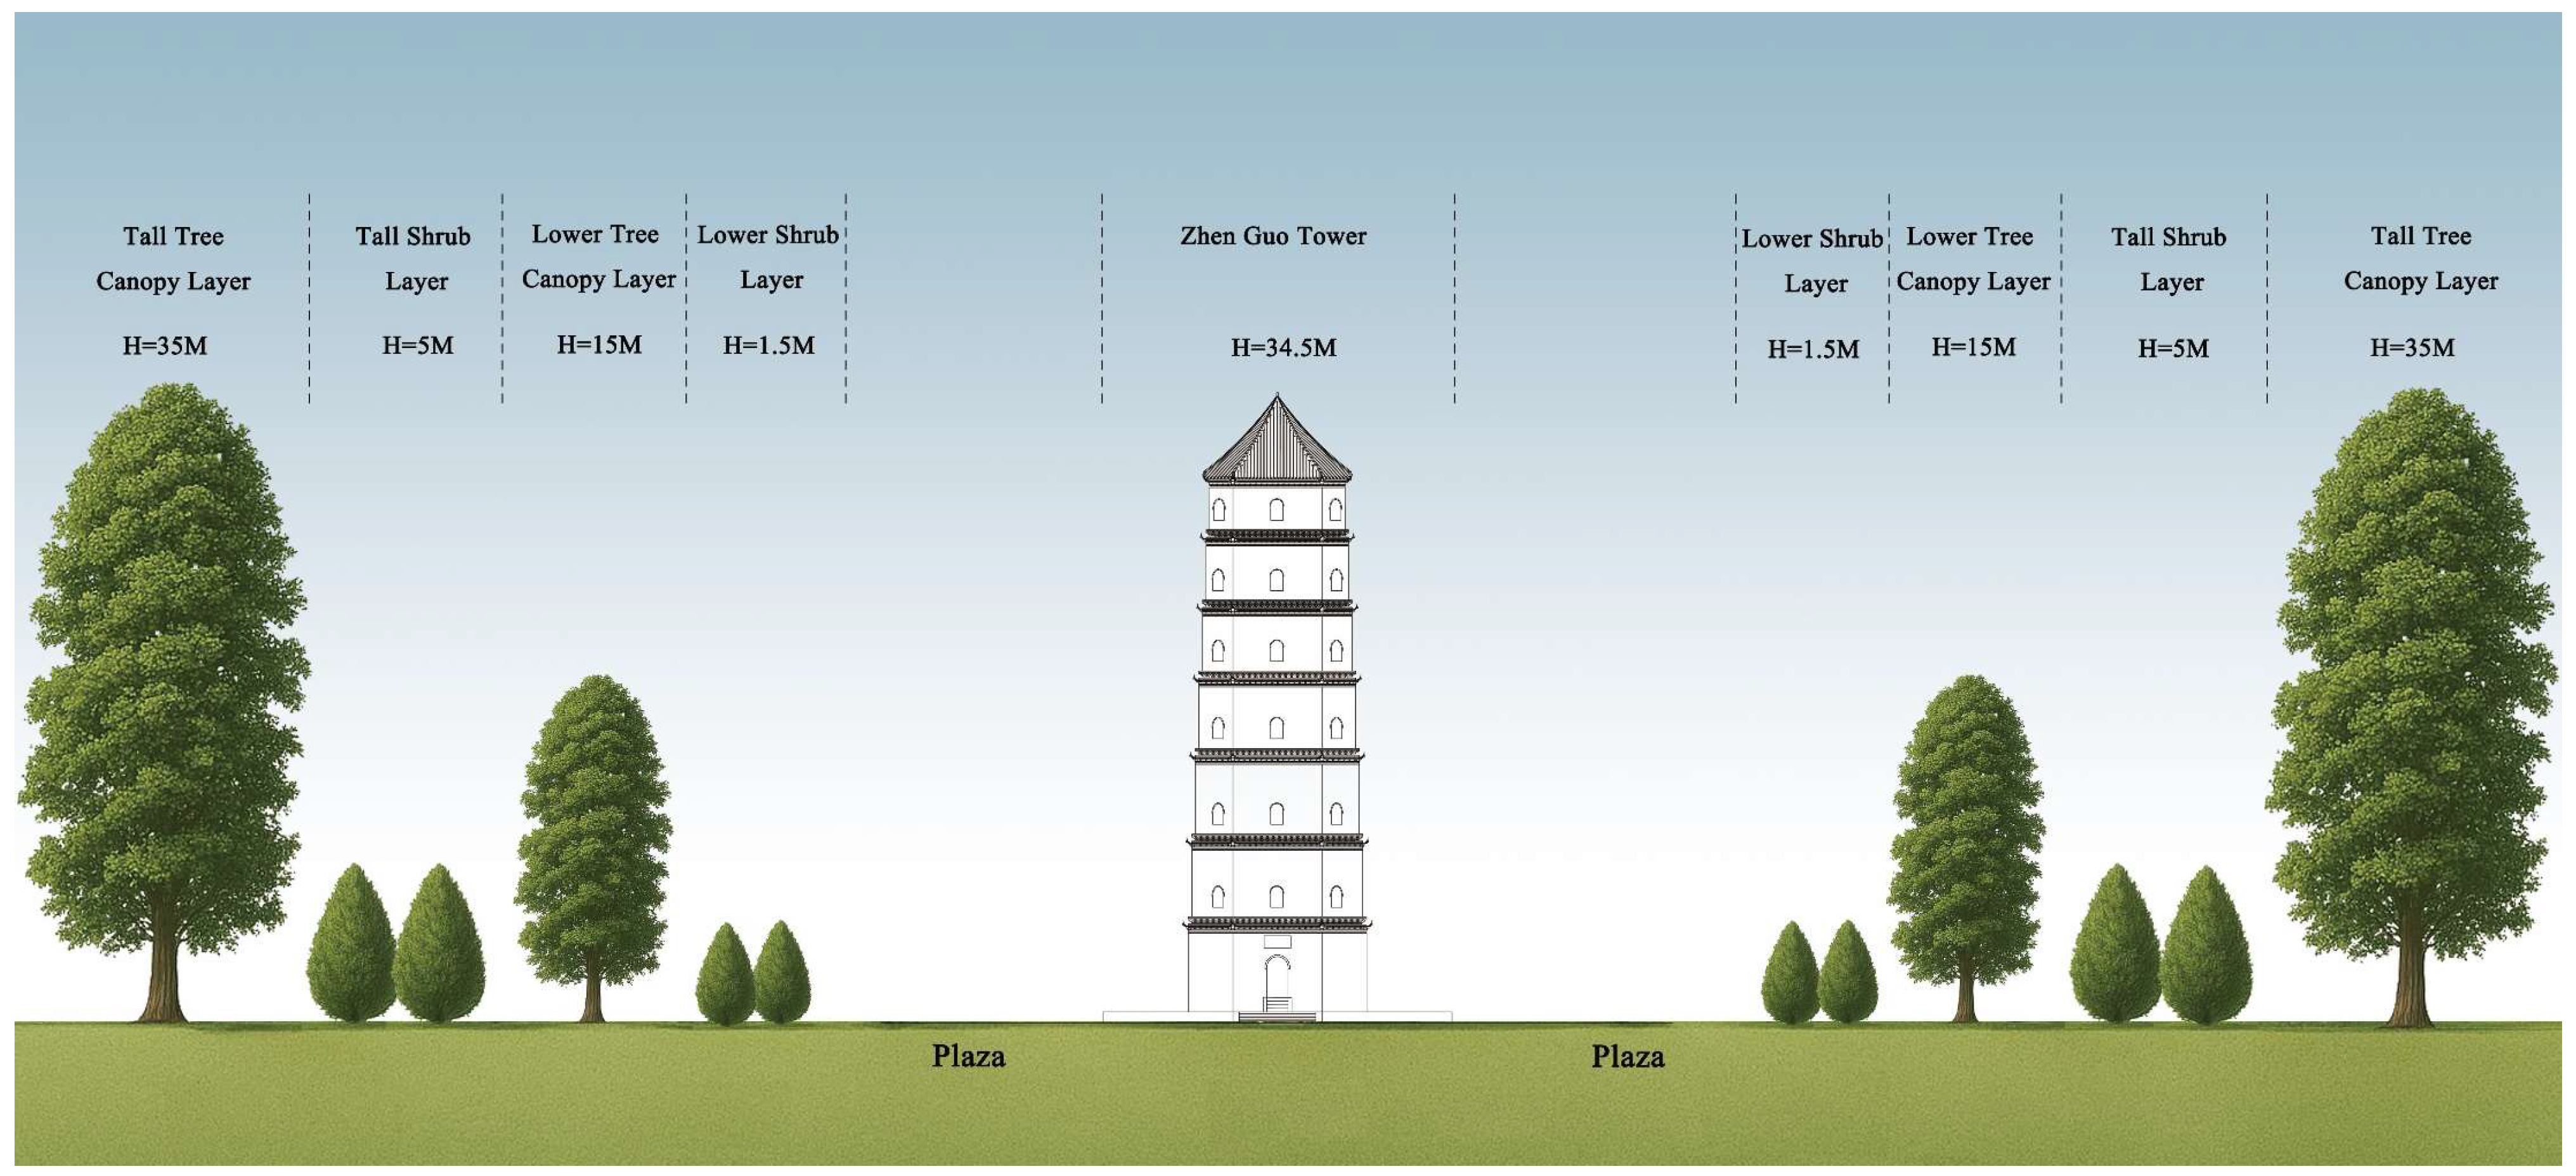
    Tall trees (covering the 3.5 m–15 m height range) and densely planted tall shrubs (covering the 1.5 m–5 m range) are added around the tower. A stratified vegetation structure composed of trees and shrubs is used to create a progressive wind speed attenuation zone, thereby enhancing the overall effectiveness of the windbreak (Figure 13).
  • Vegetation density enhancement:
    The planting density is increased, particularly in areas exposed to high-frequency and high-velocity winds. Densely planted vegetation acts as an effective “green barrier” to obstruct the incoming airflow.
  • Vegetation layout adjustment:
    The existing “clustered” layout, primarily designed for esthetic purposes, is replaced with a “row-wise” layout oriented toward wind protection. A concentric, layered windbreak forest belt is formed to encircle the tower and improve the wind shielding performance (Figure 14).

4.3. Comparative Analysis of Pre- and Post-Optimization Results

To evaluate the effectiveness of the optimized vegetation design in regulating the wind environment around Zhen Guo Tower, a new CFD simulation was conducted based on the optimized plant configuration. A comparative analysis was then conducted between the pre- and post-optimization wind field results. In addition, the wind protection efficiency was recalculated for each height level to quantitatively assess the impact of vegetation optimization on the wind attenuation performance.

4.3.1. Wind Speed Reduction Before and After Optimization

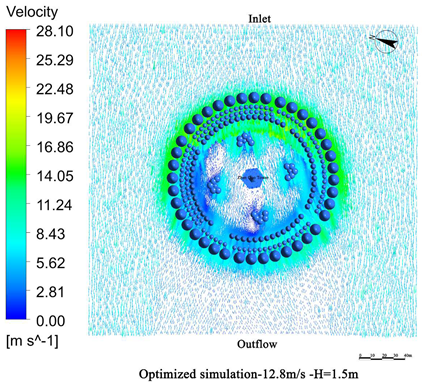
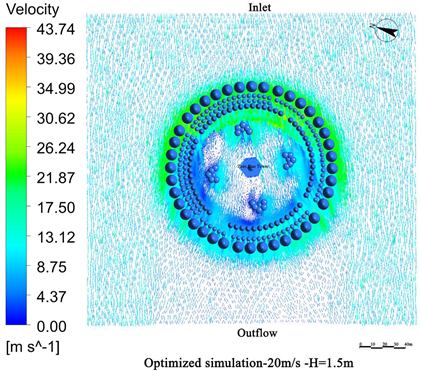
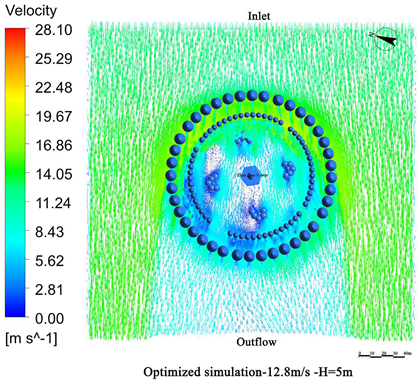
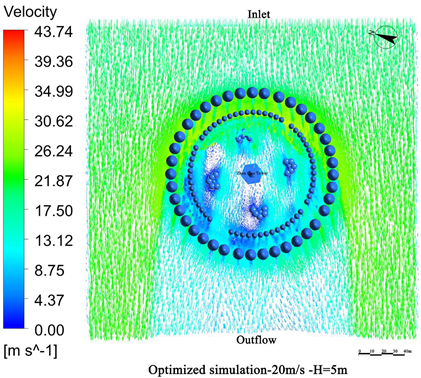
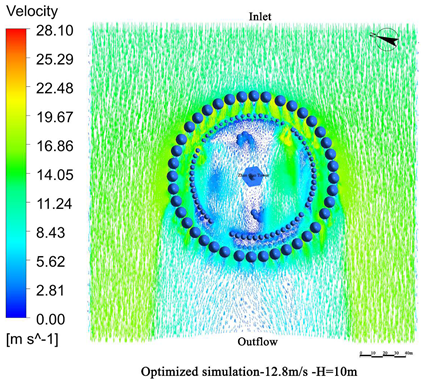
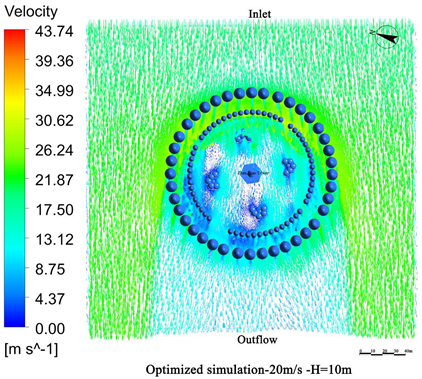
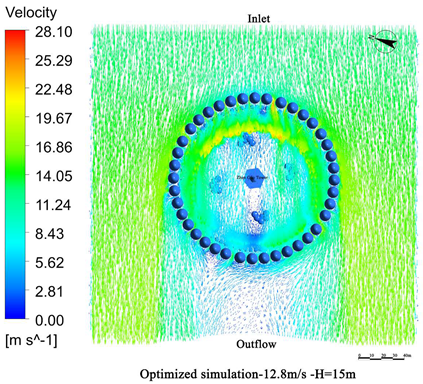
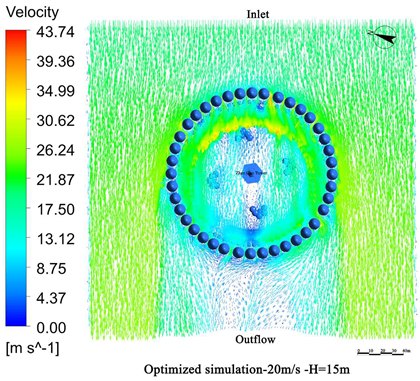
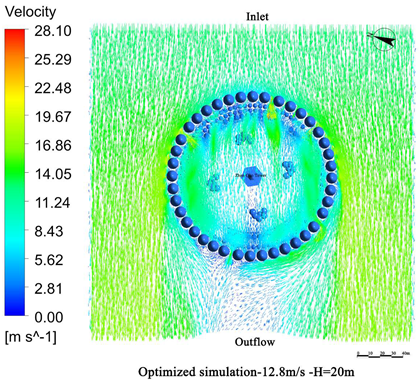
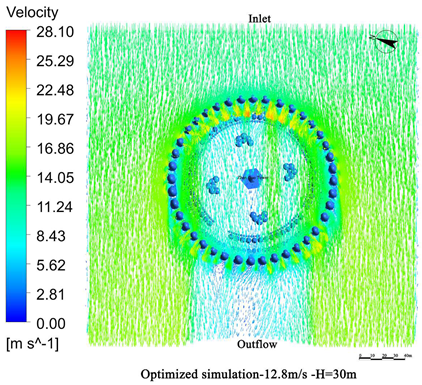
Significant differences in the wind speed distribution at various heights around the tower were observed between the pre- and post-optimization scenarios (Table 8). After optimization, wind speeds on the windward façade of the tower decreased substantially, particularly in the mid-height range of 5–15 m. Under the two simulation conditions, wind speeds were reduced by approximately 6–8 m/s and 10–13 m/s, respectively, compared to the baseline scenario. In the 12.8 m/s simulation condition, wind speeds on the windward side were effectively reduced to within the safe wind speed threshold. Under the extreme wind conditions of 20 m/s, wind speeds below 15 m in height were also attenuated to safe levels, with only localized areas above 20 m slightly exceeding the warning wind speed threshold (Figure 15).
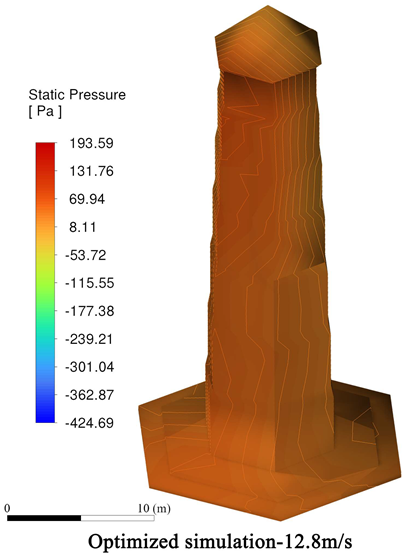
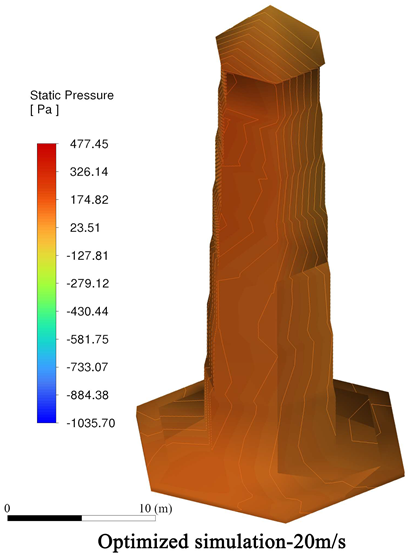
In addition to wind speed attenuation, the surface pressure distributions further highlight the effectiveness of the optimized vegetation configuration. As shown in Table 8, both the 12.8 m/s and 20 m/s conditions exhibit a significant decrease in the peak positive pressure on the windward surface and negative suction pressure on the leeward side of the tower. The optimized vegetation layout effectively reduced the overall pressure differential across the tower surface, thereby lowering the aerodynamic loading on the structure.

4.3.2. Comparison of Wind Protection Efficiency Before and After Optimization

The comparison of the wind protection efficiency before and after optimization (Table 9) shows notable improvements at multiple height levels. In the lower regions of the tower (1.5 m and 5 m), the wind protection efficiency increased by approximately 50%. In the mid-height range of 10–15 m, the efficiency index improved by about 60%. However, in the upper levels (20–30 m), the improvement was less significant, with the efficiency increasing by approximately 30%. This reduced effectiveness at higher elevations may be attributed to the limited height of the shrub layer, which is insufficient to contribute to the multi-level wind attenuation in that vertical range.
These data and visualized results demonstrate the significant effectiveness of the optimized vegetation configuration in attenuating wind speeds, confirming the protective role of an optimized vegetation layout along the vertical windward surface of the Zhen Guo Tower, specifically as follows:
  • Under elevated wind speed conditions, the risk of wind erosion on the tower façade is notably reduced;
  • Under extreme wind scenarios, the likelihood of direct structural damage to the tower is significantly reduced.
Although this study did not implement a structural finite element model, the identification of high-wind-speed zones via the CFD simulation, combined with graded wind speed thresholds, provides a feasible pathway for the early warning of wind-induced risks in masonry heritage buildings. This approach emphasizes preventive, non-invasive, and sustainable conservation strategies.

5. Discussion

5.1. Limitations of Wind Protection Performance and Potential Adverse Scenarios

This study demonstrates the effectiveness of optimized vegetation configurations in reducing the vertical wind around Zhen Guo Tower. Although the optimization significantly reduces wind speeds in the tower’s surrounding environment, certain limitations and potential adverse outcomes under extreme wind conditions remain.
  • Limitations in vertical wind protection
    While the optimized vegetation layout shows a considerable wind mitigation capacity at low and mid-height levels, localized wind speed exceedances persist in the upper parts of the tower owing to the height limitations of the vegetation. This indicates that although optimized vegetation can effectively regulate wind at specific elevations, its performance is inherently constrained by the plant height. For tall heritage structures, further design refinements are needed, such as optimizing the height ratio between the vegetation and the building or integrating supplementary wind protection measures for upper-level zones.
  • Potential risks under extreme wind conditions
    The current simulation assumes an ideal structural integrity of the vegetation during high-wind events. However, under extreme wind conditions, vegetation itself is susceptible to damage, which could lead to two adverse outcomes:
    • First, the loss or destruction of vegetation would reduce the wind protection performance;
    • Second, damaged or uprooted plants may collapse onto the heritage structure, causing additional physical harm.
To address this, future vegetation design should incorporate a safety offset distance between tall trees and heritage buildings, ensuring an optimal balance between wind protection and structural safety.

5.2. Comparison with Existing Studies

Most existing studies on vegetation-based wind mitigation focus on urban environments, with the primary goal of improving pedestrian-level (1.5 m) comfort. For instance, prior research [23,24] has evaluated the impact of various plant configurations on near-ground airflow to enhance microclimate conditions and thermal comfort in high-density urban areas. However, these studies primarily target surface-level wind flow and do not address the wind-induced degradation of tall masonry structures.
In contrast, this study focuses on wind damage prevention for masonry heritage buildings, emphasizing vertical wind profiles around the structure—particularly in the 5–15 m range, where wind erosion, cracking, and material deterioration are commonly observed. CFD simulations demonstrate that optimized vegetation arrangements significantly reduce wind speeds in these critical zones, thereby mitigating potential deterioration risks.
In the field of heritage conservation, previous studies have often centered on post-disaster structural interventions, such as the reinforcement and retrofitting of damaged components [30]. While effective, such engineering measures are typically invasive and may not be suitable for preserving the authenticity of cultural heritage structures.
This study proposes a preventive, ecologically based protection strategy—reducing wind loads before they act upon the building surface by optimizing vegetation layouts. This non-invasive and sustainable approach serves as a valuable complement to conventional structural reinforcement, offering a resilient wind mitigation framework for masonry heritage buildings. This study highlights the potential of nature-based solutions to enhance the wind resistance and longevity of cultural heritage assets.

5.3. The Generalization of the Vegetation-Based Wind Mitigation Approach for Masonry Heritage Buildings

This study develops a vegetation-based wind mitigation strategy, optimized for Zhen Guo Tower—a high-rise masonry heritage building. This strategy prioritizes vegetation-based solutions for their ecological sustainability and compatibility with heritage conservation principles. However, the wind protection requirements of heritage buildings vary significantly depending on their height, morphology, and surrounding environment. Therefore, the application of such strategies should be customized to suit specific spatial and contextual characteristics.
  • High-rise buildings (>20 m)
    Due to the relatively unobstructed airflow at upper elevations, wind mitigation vegetation should be concentrated in the 5–15 m range, using stratified arrangements of trees and shrubs to reduce ground-level wind speeds. For upper zones, green-compatible measures, such as tall-canopy species, reversible climbing plant systems, or facade-integrated greenery, can be considered. If simulation results indicate that these are insufficient, carefully selected supplementary interventions may be explored—provided they adhere to principles of reversibility, minimal intrusion, and heritage compatibility.
  • Low-rise buildings (<10 m)
    For low-rise structures, an effective wind reduction can generally be achieved across the full height using only vegetation, provided that appropriate species selection, layout design, and planting density are applied—making additional interventions unnecessary in most cases.
  • Medium-rise or architecturally complex buildings (10–20 m)
    A hybrid yet vegetation-dominant strategy is recommended, combining a CFD-based diagnosis with layered vegetation configurations. Design adjustments should be flexibly tailored to accommodate the architectural features, site topography, and local wind conditions. Where critical wind zones cannot be effectively mitigated through vegetation alone, auxiliary interventions may be cautiously introduced—strictly adhering to principles of sustainability, reversibility, and minimal impact on heritage integrity.

6. Conclusions

This study employed CFD simulations to investigate the wind-regulating effects of vegetation configurations surrounding Zhen Guo Tower and proposed an optimized vegetation layout for mitigating wind damage. The main findings are as follows:
  • The optimized vegetation configuration significantly reduces wind speeds, particularly in the lower and mid-height regions of the tower. Under extreme wind conditions, the maximum wind speed reduction reached 13.57 m/s.
  • The wind protection efficiency on the windward side was substantially improved after optimization, especially along the vertical profile of the tower, with efficiency increases ranging from 28% to 68%.
  • Wind attenuation in the upper regions of the tower remained limited, and the effects of high wind speeds could not be completely eliminated.
Although this study primarily focuses on wind-induced hazards, future research may extend to explore the role of vegetation in regulating other climatic stressors and their coupled effects. Further investigations could also examine the seasonal variability and directional sensitivity of vegetation-based wind regulation and explore integrated protection strategies that combine vegetation with structural measures, such as wind barriers and shielding walls. Such multi-factor approaches may contribute to a more comprehensive and resilient protection system for heritage buildings. Future studies can build on this methodology to develop a parameterized vegetation configuration framework that integrates building characteristics and site parameters, thereby enhancing applicability and decision-making efficiency.

Author Contributions

Z.M.: methodology, software, data curation, investigation, writing—original draft preparation. K.M.: investigation, project administration, visualization, writing—review and editing. D.H.: data curation, investigation, software. Z.G.: data curation, investigation. X.Z.: data curation, investigation. Y.Z.: supervision, resources. All authors have read and agreed to the published version of the manuscript.

Funding

This research was funded by the following projects: the Key Science and Technology Research and Development Program of Henan Province, China (232102320022), and the Key Science and Technology Research and Development Program of Henan Province, China (232102320071).

Data Availability Statement

Data will be made available on request.

Conflicts of Interest

The authors declare that they have no known competing financial interests or personal relationships that could have appeared to influence the work reported in this paper.

References

  1. Cassar, M. Preventive conservation and building maintenance. Mus. Manag. Curatorsh. 1994, 1, 39–47. [Google Scholar] [CrossRef]
  2. Sesana, E.; Gagnon, A.S.; Ciantelli, C.; Cassar, J.; Hughes, J. Climate change impacts on cultural heritage: A literature review. Wire’s Clim. Change 2021, 12, e710. [Google Scholar] [CrossRef]
  3. Bertolin, C. Preservation of cultural heritage and resources threatened by climate change. Geosciences 2019, 9, 250. [Google Scholar] [CrossRef]
  4. Ipekoglu, B.; Boke, H.; Cizer, O. Assessment of material use in relation to climate in historical buildings. Build. Environ. 2007, 42, 970–978. [Google Scholar] [CrossRef]
  5. Li, T.; Zhang, M. An assessment for the conservation mechanism of masonry architectural heritage based on material deterioration analysis: A case study of the Xuhai Dao Shu screen wall (Xuzhou, China). J. Asian Archit. Build. Eng. 2023, 22, 3403–3413. [Google Scholar] [CrossRef]
  6. Xie, Q. Study on the Risk Assessment and Prediction of Deterioration of the Bottom Wall of Xi’an Dayan Pagoda. Master’s Thesis, Southeast University, Nanjing, China, 2021. [Google Scholar] [CrossRef]
  7. Blavier, C.L.S.; Huerto-Cardenas, H.E.; Aste, N.; Del Pero, C.; Leonforte, F.; Della Torre, S. Adaptive measures for preserving heritage buildings in the face of climate change: A review. Build. Environ. 2023, 245, 110832. [Google Scholar] [CrossRef]
  8. Wang, X.; Meng, J.; Zhu, T.; Zhang, J. Prediction of wind erosion over a heritage site: A case study of Yongling Mausoleum, China. Built Herit. 2019, 3, 41–57. [Google Scholar] [CrossRef]
  9. Hegyi, D.; Armuth, M.; Halmos, B.; Marotzy, K. The effect of wind on historical timber pagodas analyzed by plastic limit analysis in the focus of a collapse. Eng. Fail. Anal. 2022, 134, 105852. [Google Scholar] [CrossRef]
  10. Erkal, A.; D’Ayala, D.; Sequeira, L. Assessment of wind-driven rain impact, related surface erosion and surface strength reduction of historic building materials. Build. Environ. 2012, 57, 336–348. [Google Scholar] [CrossRef]
  11. Hadzima-Nyarko, M.; Ademovic, N.; Pavic, G.; Sipos, T.K. Strengthening techniques for masonry structures of cultural heritage according to recent Croatian provisions. Earthq. Struct. 2018, 15, 473–485. [Google Scholar] [CrossRef]
  12. Artesani, A.; Di Turo, F.; Zucchelli, M.; Traviglia, A. Recent advances in protective coatings for cultural heritage—An overview. Coatings 2020, 10, 217. [Google Scholar] [CrossRef]
  13. Liao, J.S. Retrofitting of cracked and damaged walls of historical buildings with reinforced concrete materials. Int. J. Eng. Res. Afr. 2020, 51, 71–78. [Google Scholar] [CrossRef]
  14. Karakul, Ö. An integrated methodology for the conservation of traditional craftmanship in historic buildings. Int. J. Intang. Herit. 2015, 10, 135–144. [Google Scholar]
  15. Shan, M.; Chen, Y.F.; Zhai, Z.; Du, J. Investigating the critical issues in the conservation of heritage building: The case of China. J. Build. Eng. 2022, 51, 104319. [Google Scholar] [CrossRef]
  16. Prieto, A.J.; Macías-Bernal, J.M.; Chávez, M.J.; Alejandre, F.J.; Silva, A. Impact of maintenance, rehabilitation, and other interventions on functionality of heritage buildings. J. Perform. Constr. Facil. 2019, 33, 04019011. [Google Scholar] [CrossRef]
  17. Ribera, F.; Nestico, A.; Cucco, P.; Maselli, G. A multicriteria approach to identify the highest and best use for historical buildings. J. Cult. Herit. 2020, 41, 166–177. [Google Scholar] [CrossRef]
  18. Yi, X.; Lu, S.; Zhong, Y.; Guo, Y.; Liu, L. Numerical Analysis of Roof Wind Pressure Distribution in Renovated Historical Buildings: Preventive Protection Measures to Mitigate Typhoon Damage. Appl. Sci. 2024, 14, 6136. [Google Scholar] [CrossRef]
  19. Pineda, P.; Iranzo, A. Analysis of sand-loaded air flow erosion in heritage sites by computational fluid dynamics: Method and damage prediction. J. Cult. Herit. 2016, 25, 75–86. [Google Scholar] [CrossRef]
  20. Li, H.; Yan, Z.; Zhang, Z.; Lang, J.; Wang, X. A numerical study of the effect of vegetative windbreak on wind erosion over complex terrain. Forests 2022, 13, 1072. [Google Scholar] [CrossRef]
  21. Nord, M. Shelter effects of vegetation belts—results of field measurements. Bound. Layer Meteorol. 1991, 54, 363–385. [Google Scholar] [CrossRef]
  22. Luo, Q.; Zhen, L.; Xiao, Y.; Wang, H. The effects of different types of vegetation restoration on wind erosion prevention: A case study in Yanchi. Environ. Res. Lett. 2020, 15, 115001. [Google Scholar] [CrossRef]
  23. Milosevic, D.D.; Bajsanski, I.V.; Stevan, S.M. Influence of changing trees locations on thermal comfort on street parking lot and footways. Urban For. Urban Green. 2017, 23, 113–124. [Google Scholar] [CrossRef]
  24. Bartesaghi-Koc, C.; Osmond, P.; Peters, A. Quantifying the seasonal cooling capacity of ‘green infrastructure types’ (GITs): An approach to assess and mitigate surface urban heat island in Sydney, Australia. Landsc. Urban Plan. 2020, 203, 103893. [Google Scholar] [CrossRef]
  25. Li, Y.; Deng, Y.; Li, A. Nondestructive Tree Planting for Reducing the Wind Loads of a Historical Wooden Pagoda. ASCE 2024, 38, 04024033. [Google Scholar] [CrossRef]
  26. ICOMOS Climate Change and Cultural Heritage Working Group. The Future of Our Pasts: Engaging Cultural Heritage in Climate Action; International Council on Monuments and Sites: Paris, France, 2019; Available online: https://openarchive.icomos.org/id/eprint/2459/1/CCHWG_final_print.pdf (accessed on 21 August 2025).
  27. Fujita, T.T. Proposed Characterization of Tornadoes and Hurricanes by Area and Intensity; University of Chicago SMRP Research Project: Chicago, IL, USA, 1971. [Google Scholar]
  28. Stevenson, S.A.; Miller, C.S.; Sills, D.M.L.; Kopp, G.A.; Rhee, D.M.; Lombardo, F.T. Assessment of wind speeds along the damage path of the Alonsa, Manitoba EF4 tornado on 3 August 2018. J. Wind Eng. Ind. Aerodyn. 2023, 238, 105422. [Google Scholar] [CrossRef]
  29. Environment Canada. Environment and Climate Change Canada: Enhanced Fujita Scale. 2013. Available online: https://ec.gc.ca/meteo-weather/default.asp?lang=En&n=41E875DA-1 (accessed on 21 August 2025).
  30. Mosoarca, M.; Keller, A.I.; Bocan, C. Failure analysis of church towers and roof structures due to high wind velocities. Eng. Fail. Anal. 2019, 100, 76–87. [Google Scholar] [CrossRef]
  31. Blocken, B. Computational fluid dynamics for urban physics: Importance, scales, possibilities, limitations and ten tips and tricks towards accurate and reliable simulations. Build. Environ. 2015, 91, 219–245. [Google Scholar] [CrossRef]
  32. Blocken, B. LES over RANS in building simulation for outdoor and indoor applications: A foregone conclusion? Build. Simul. 2018, 11, 821–870. [Google Scholar] [CrossRef]
  33. Tominaga, Y.; Mochida, A.; Yoshie, R.; Kataoka, H.; Nozu, T.; Yoshikawa, M.; Shirasawa, T. AIJ guidelines for practical applications of CFD to pedestrian wind environment around buildings. J. Wind Eng. Ind. Aerodyn. 2008, 96, 1749–1761. [Google Scholar] [CrossRef]
  34. Blocken, B.; Hout, A.V.; Dekker, J.; Weiler, O. CFD Simulation of Wind Flow over Natural Complex Terrain: Case Study with Validation by Field Measurements for Ria de Ferrol, Galicia, Spain. J. Wind Eng. Ind. Aerod. 2015, 147, 43–57. [Google Scholar] [CrossRef]
  35. Qi, Y.; Ishihara, T. Numerical Study of Turbulent Flow Fields around of a Row of Trees and an Isolated Building by Using Modified K–Model and LES Model. J. Wind Eng. Ind. Aerod. 2018, 177, 293–305. [Google Scholar] [CrossRef]
  36. Li, C.; Zhou, S.; Xiao, Y.; Huang, Q.; Li, L.; Chan, P.W. Effects of Inflow Conditions on Mountainous/Urban Wind Environment Simulation. Build. Simul. 2017, 10, 573–588. [Google Scholar] [CrossRef]
  37. Richards, P. Appropriate Boundary Conditions for Computational Wind Engineering Models Using the K–Turbulence Model. J. Wind Eng. Ind. Aerod. 1993, 46, 145–153. [Google Scholar] [CrossRef]
  38. Yang, Y.; Gatto, E.; Gao, Z.; Buccolieri, R.; Morakinyo, T.E.; Lan, H. The “plant evaluation model” for the assessment of the impact of vegetation on outdoor microclimate in the urban environment. Build. Environ. 2019, 159, 106151. [Google Scholar] [CrossRef]
  39. Buccolieri, R.; Santiago, J.-L.; Rivas, E.; Sanchez, B. Review on urban tree modelling in CFD simulations: Aerodynamic, deposition and thermal effects. Urban For. Urban Green. 2018, 31, 212–220. [Google Scholar] [CrossRef]
  40. Ren, X.; Zhang, G.; Chen, Z.; Zhu, J. The influence of wind-induced response in urban trees on the surrounding flow field. Atmosphere 2023, 14, 1010. [Google Scholar] [CrossRef]
  41. Sun, H.; Liu, J.; Huang, Q.; Zhao, K. Research on the windproof efficiency of polygonal straw sand barrier. J. Beijing For. Univ. 2017, 39, 90–94. [Google Scholar] [CrossRef]
  42. Vacek, Z.; Řeháček, D.; Cukor, J.; Vacek, S.; Khel, T.; Sharma, R.P.; Kučera, J.; Král, J.; Papaj, V. Windbreak efficiency in agricultural landscape of the Central Europe: Multiple approaches to wind erosion control. Environ. Manag. 2018, 62, 942–954. [Google Scholar] [CrossRef]
  43. Wang, J.; Patruno, L.; Zhao, G.; Tamura, Y. Windbreak effectiveness of shelterbelts with different characteristic parameters and arrangements by means of CFD simulation. Agric. For. Meteorol. 2024, 61, 315–332. [Google Scholar] [CrossRef]
  44. Wang, J.; Patruno, L.; Chen, Z.; Yang, Q.; Tamura, Y. Windbreak Effectiveness of Single and Double-Arranged Shelterbelts: A Parametric Study Using Large Eddy Simulation. Forests 2024, 344, 109813. [Google Scholar] [CrossRef]
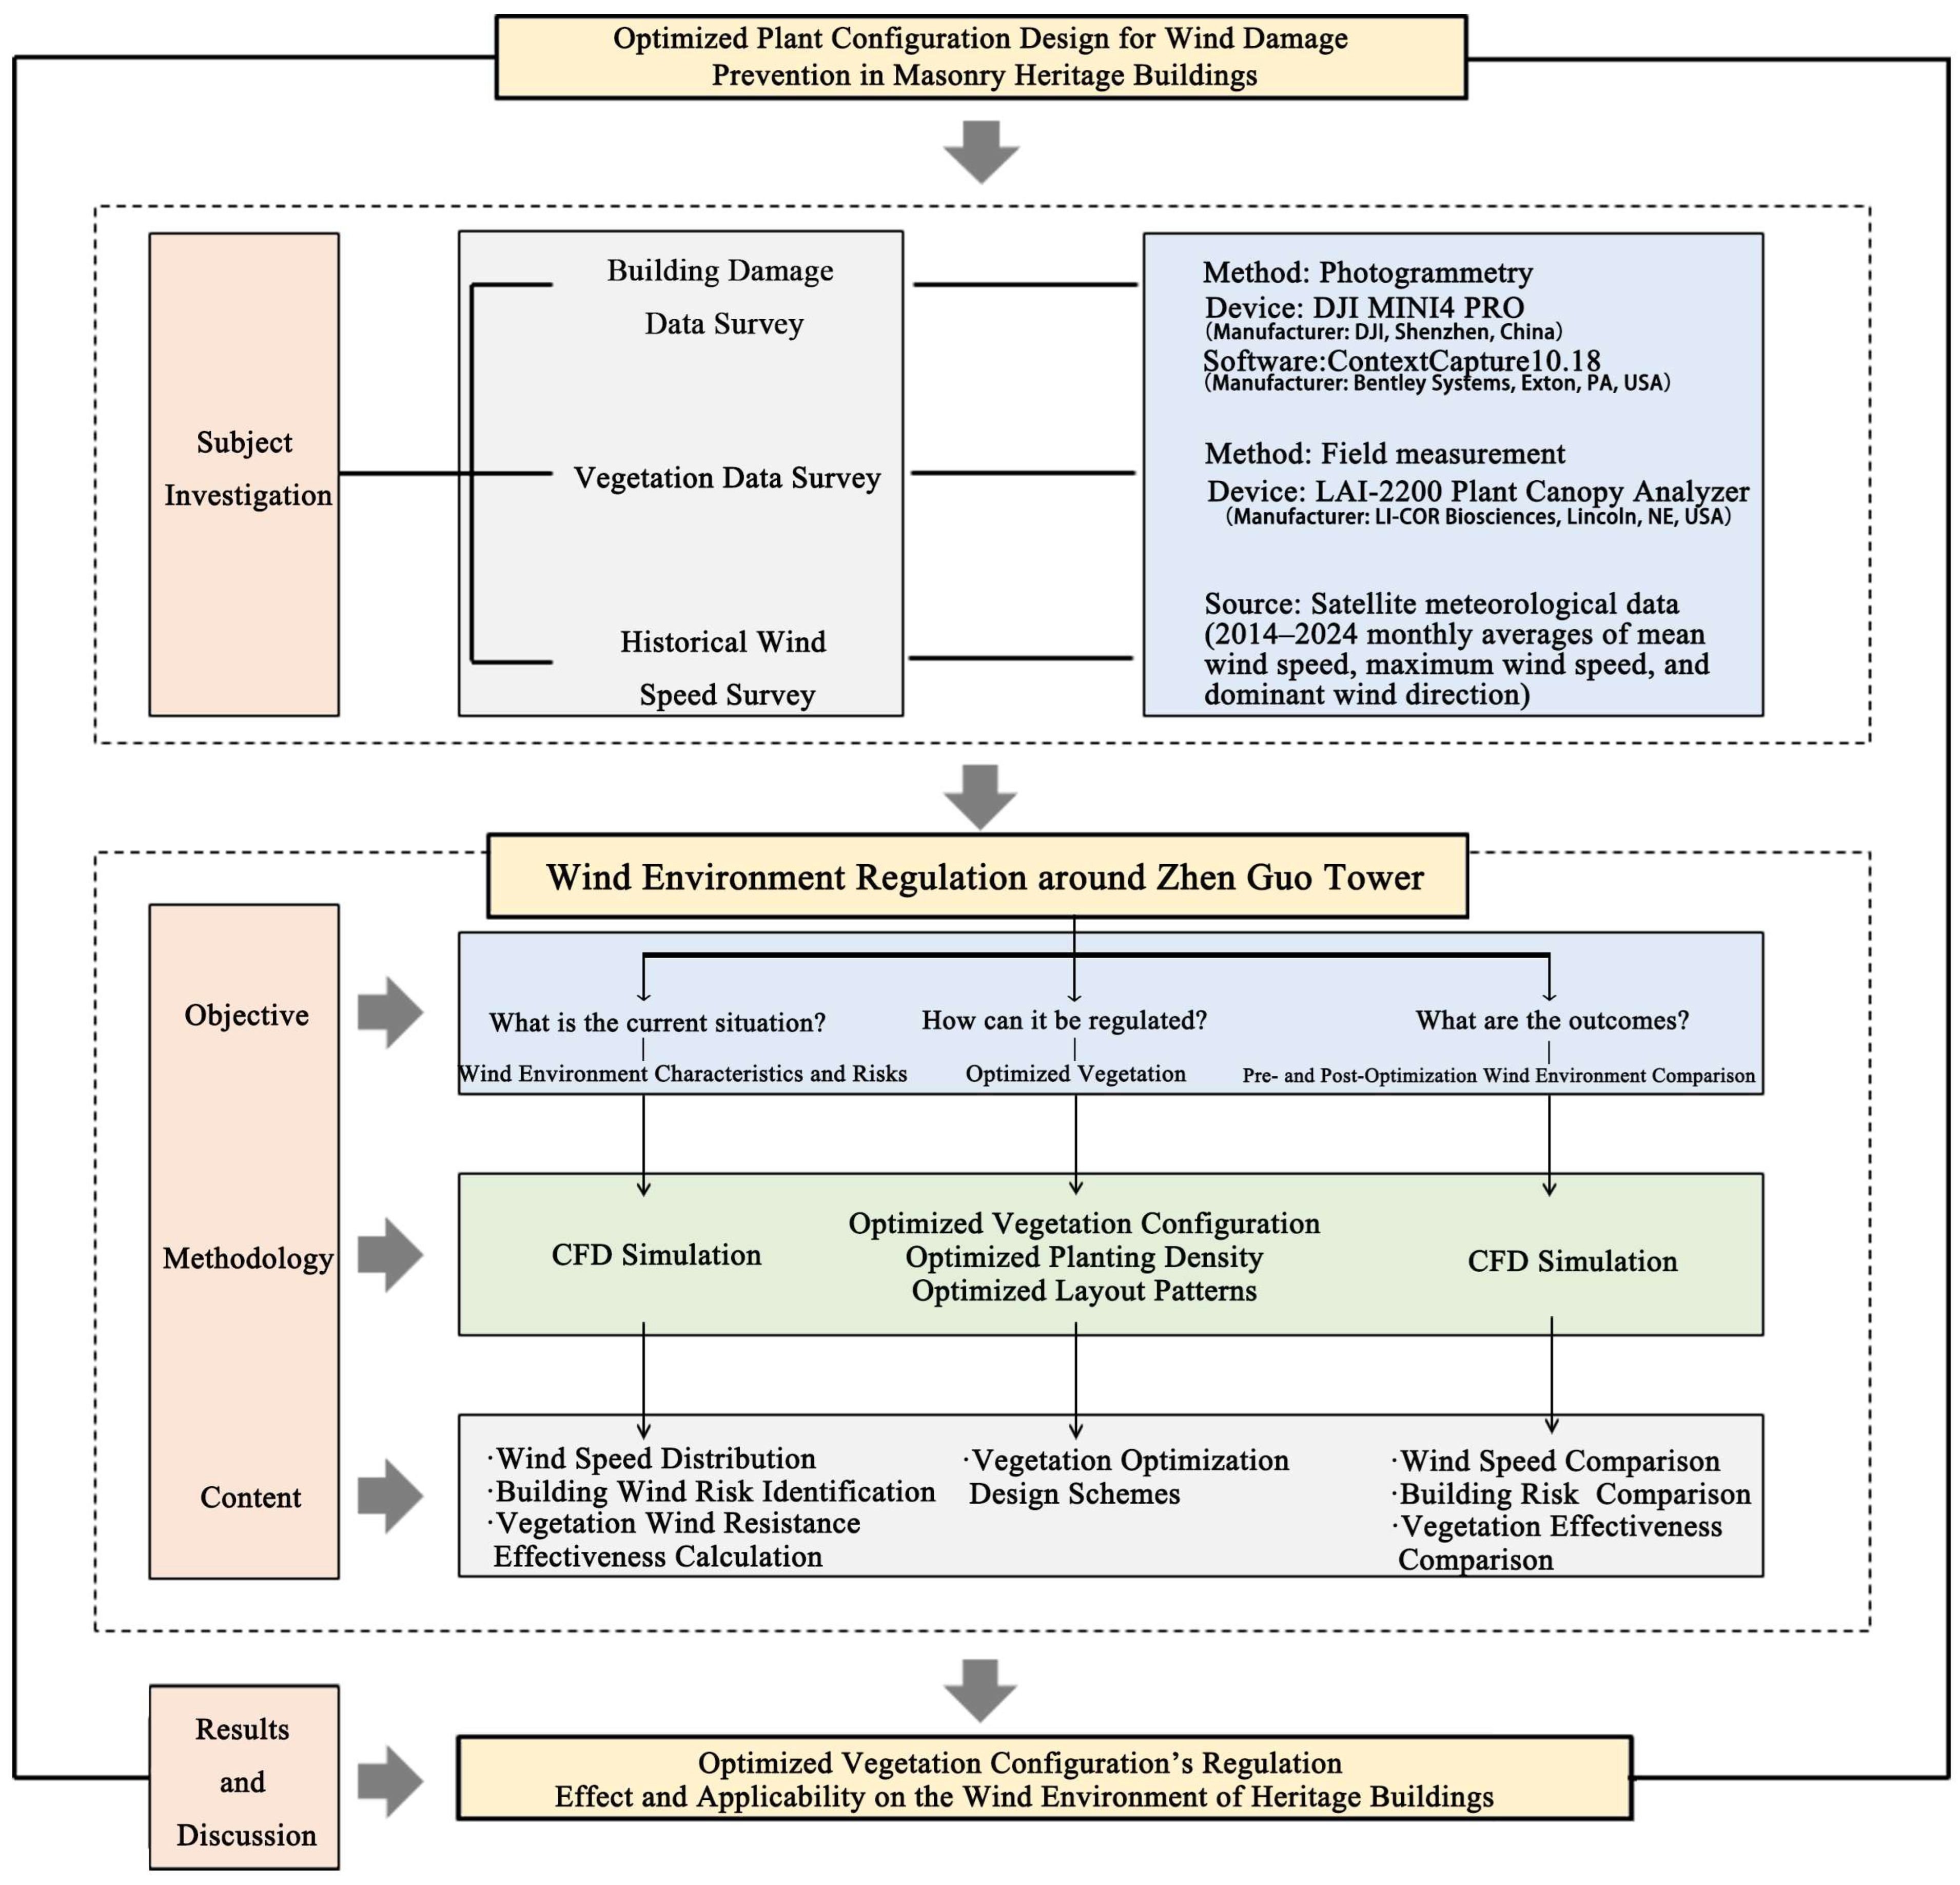
Figure 1. Research framework.
Buildings 15 02999 g001
Figure 2. Geographical location of Zhen Guo Tower.
Buildings 15 02999 g002
Figure 3. Aerial view of Zhen Guo Tower.
Buildings 15 02999 g003
Figure 4. Three-dimensional reality model of Zhen Guo Tower.
Buildings 15 02999 g004
Figure 5. Major wind-induced deterioration types.
Buildings 15 02999 g005
Figure 6. Wind speed trend in Weihui (2014–2024).
Buildings 15 02999 g006
Figure 7. Wind rose of maximum wind speeds in Weihui (2014–2024).
Buildings 15 02999 g007
Figure 8. Existing vegetation layout around Zhen Guo Tower.
Buildings 15 02999 g008
Figure 9. Computational domain and mesh details: (a) computational domain; (b) top view; (c) side view; and (d) computational grids.
Buildings 15 02999 g009
Figure 10. Sampling point layout.
Buildings 15 02999 g010
Figure 11. Comparison between simulated and measured wind speeds at eight sampling points using three turbulence models (Standard k–ε, RNG k–ε, and k–ω SST).
Buildings 15 02999 g011
Figure 12. Vertical wind speed profiles at reference and behind-plant points under different wind conditions in the current vegetation layout.
Buildings 15 02999 g012
Figure 13. Analysis of layered vegetation layout.
Buildings 15 02999 g013
Figure 14. Optimized vegetation layout.
Buildings 15 02999 g014
Figure 15. Vertical wind speed profiles at reference and behind-plant points under different wind conditions in the optimized vegetation layout.
Buildings 15 02999 g015
Table 1. Damage investigation of Zhen Guo Tower.
OrientationDamage DescriptionDefect Points (Count)Cracks (Count)Deteriorated Wall Area (m2)
NorthThere is a waterline at the base of the tower, where the brickwork has turned black owing to moisture staining. The main body of the tower shows extensive material deterioration, with significant discoloration and surface spalling. Five major cracks are clearly visible on the tower surface, and nearly all the projecting eaves feature noticeable structural defects or missing components.32589
NorthwestThere is a visible waterline at the base of the tower, where the bricks have turned black owing to prolonged moisture exposure. At the upper part of the tower, particularly on the north-facing side, the bricks exhibit signs of deterioration, including mottling and discoloration. Three prominent cracks are present on the tower body, and the ornamental eaves display substantial localized damage with numerous missing or broken components.16335
SouthwestThere is a waterline at the base of the tower, where the brick surface has darkened owing to moisture staining. The upper part of the tower shows partial deterioration and discoloration, with minor, inconspicuous cracks and slight material loss observed on the brickwork. Localized damage is also present on sections of the ornamental eaves.9021
SouthThere is a visible waterline at the base of the tower, with brick surfaces darkened owing to moisture exposure. Minor and inconspicuous cracks and small-scale material loss are observed on the tower body. Partial damage is present on the ornamental eaves.6020
SoutheastThere is a waterline at the base of the tower, with the bricks exhibiting blackening owing to moisture exposure. The brickwork on the tower body shows minor, inconspicuous cracks and slight material loss. Localized damage is also observed on parts of the ornamental eaves.9014
NortheastThere is a waterline at the base of the tower, with bricks darkened owing to moisture exposure. The brickwork on the tower body shows extensive deterioration, with severe mottling and discoloration. One prominent crack is visible, and the ornamental eaves exhibit significant structural loss with numerous damaged or missing sections.14179
Note: Defect Points: Refers to areas where brick material has fallen off or detached. Cracks: Gaps or fissures greater than 50 cm in length and with a noticeable depth. Deteriorated Wall Area: Refers to the significant mottling and discoloration observed on the wall surface.
Table 2. Existing primary vegetation configuration.
Plant TypeSpeciesAverage Height (m)Crown Diameter (m)Number of PlantsAverage Height Below Canopy (m)Planting Distance (m)
TreeSophora japonica6.56.0202.24.22
TreeGinkgo biloba6.5272.57
TreePinus massoniana2.72.261.22.45
ShrubLigustrum quihoui2.53140.452.8
ShrubPhotinia fraseri1.52.8642.8
Table 3. DOD descriptions and wind speed estimates for the C-3 DI, as adopted from Environment and Climate Change Canada (2013).
DODDescription of DamageWind Speed Estimates [km/h]
Lower BoundExpectedUpper Bound
1Threshold of visible damage7090110
2Loss of roof covering material (up to 20%)90115140
3Loss of significant roof covering material (more than 20%); light damage on the bell pagoda summit115145175
4More than 50% of roof structure removed; collapse of the bell pagoda summit (spire); walls remain standing150185220
5More than 80% of roof structure removed; walls partly collapsed; bell pagoda structure damaged190225260
6Roof structure totally removed and blown away; many walls collapsed; bell pagoda structure mostly destroyed230270310
7Complete destruction of building275315355
Note: Typical Construction: Built with bricks and/or stones; solidly built roof structure; may also have one or more bell pagodas.
Table 4. Summary of key CFD simulation parameters.
ProjectParameter ValueDescription
Simulation typeSteady stateChosen for convergence efficiency and suitability for mean flow analysis
Inlet conditionUniform velocity inletConstant inlet velocity (12.8 m/s and 20.0 m/s); vertical profile simplified for comparative analysis
Wind directionNNERepresents prevailing wind in the region
Turbulence intensity10%Typical value for low-rise urban or suburban terrain
Surface roughnessz0 = 0.5 mReflecting conditions of vegetated surfaces and low-rise buildings
Outlet boundaryPressure outletAtmospheric pressure outlet to ensure numerical continuity
Wall conditionNo-slip rough wall + standard wall functionApplied to ground and building surfaces
Top and sidesSymmetry boundaryMinimize reflection and maintain domain stability
Mesh typeUnstructured tetrahedralLocal refinement near tower façade and vegetation canopy
Minimum mesh size0.2 mEnhanced resolution in critical zones
Mesh count~5.3–6.0 millionSlight variation depending on vegetation configuration
Geometry sourceMeasured dataThe building and vegetation geometry was modeled in Rhino
Table 5. Relative errors (%) between simulated and measured wind speeds at eight sampling points for different turbulence models.
Sampling PointStandard k–ε Model
Error (%)
RNG k–ε Model
Error (%)
k–ω SST Model
Error (%)
P13.574.171.79
P213.8592.3147.69
P38.7210.074.03
P49.1513.3817.61
P55.366.256.25
P615.5829.8729.87
P72.541.693.39
P81.793.571.79
Average Error8.5721.4114.06
Table 6. Simulation of the wind field under the existing vegetation layout.
12.8 m/s Wind Condition Simulation20 m/s Wind Condition Simulation
Buildings 15 02999 i001Buildings 15 02999 i002
Buildings 15 02999 i003Buildings 15 02999 i004
Buildings 15 02999 i005Buildings 15 02999 i006
Buildings 15 02999 i007Buildings 15 02999 i008
Buildings 15 02999 i009Buildings 15 02999 i010
Buildings 15 02999 i011Buildings 15 02999 i012
Buildings 15 02999 i013Buildings 15 02999 i014
Table 7. Windbreak effectiveness of existing vegetation.
12.8 m/s Wind Condition Simulation20 m/s Wind Condition Simulation
Height (m)Windbreak Effectiveness (%)Height (m)Windbreak Effectiveness (%)
1.523%1.521%
513%512%
108%108%
159%159%
208%207%
303%303%
Table 8. Wind field simulation after vegetation optimization.
12.8 m/s Wind Condition Simulation20 m/s Wind Condition Simulation
Buildings 15 02999 i015Buildings 15 02999 i016
Buildings 15 02999 i017Buildings 15 02999 i018
Buildings 15 02999 i019Buildings 15 02999 i020
Buildings 15 02999 i021Buildings 15 02999 i022
Buildings 15 02999 i023Buildings 15 02999 i024
Buildings 15 02999 i025Buildings 15 02999 i026
Buildings 15 02999 i027Buildings 15 02999 i028
Table 9. Wind protection performance after vegetation optimization.
12.8 m/s Wind Condition Simulation20 m/s Wind Condition Simulation
Height (m)Windbreak Effectiveness (%)Increment (%)Height (m)Windbreak Effectiveness (%)Increment (%)
1.567%44%1.567%46%
567%54%569%56%
1073%64%1074%66%
1572%63%1577%68%
2038%30%2037%30%
3034%31%3031%28%
Note: Increment: Refers to the difference in wind protection performance at various heights before and after vegetation optimization.
Disclaimer/Publisher’s Note: The statements, opinions and data contained in all publications are solely those of the individual author(s) and contributor(s) and not of MDPI and/or the editor(s). MDPI and/or the editor(s) disclaim responsibility for any injury to people or property resulting from any ideas, methods, instructions or products referred to in the content.