Article

Study on Mesoscopic Evolution Mechanism and Influencing Factors of Concrete Blasting Damage Based on PFC

1
School of Transportation and Civil Engineering, Nantong University, Nantong 226019, China
2
Department of Mechanical Engineering, Huzhou University, Huzhou 313002, China
*
Authors to whom correspondence should be addressed.
Buildings 2025, 15(17), 3000; https://doi.org/10.3390/buildings15173000 (registering DOI)
Submission received: 24 July 2025 / Revised: 13 August 2025 / Accepted: 22 August 2025 / Published: 23 August 2025
(This article belongs to the Section Building Structures)

Abstract

In urban construction, the efficient demolition of concrete structures imposes high-precision requirements on blasting technology. The mesoscopic evolution mechanism of concrete blasting damage is the key to optimizing blasting parameters. In this study, a numerical model of concrete blasting is established using Particle Flow Code (PFC). By comparing it with an experimental model containing a blast hole and a horizontal single fissure, the rationality and reliability of the model in simulating blasting damage evolution are verified. On this basis, four groups of control variable schemes are designed (concrete particle size distribution, aggregate content, prefabricated fissure inclination angle, and fissure length) to systematically explore the effects of mesoscopic structures and macroscopic defects on blasting damage. The results show that larger concrete particles make it easier for damage cracks to avoid large particles, forming sparse and irregular crack networks. A higher aggregate content enhances the “obstruction-guidance” effect of aggregate distribution on damage. When the aggregate content is 40%, the vertical damage expansion is the most prominent, reaching up to 3.05 cm. Fissure inclination angle affects the damage direction by guiding the propagation path of stress waves. Fissures inclined at 30°~60° serve as preferential damage channels, while 90° vertical fissures make vertical damage more significant. An increased fissure length expands the damage range, and the damage degree is the highest for a 40 mm long fissure, being 1.29 times that of a 30 mm fissure. The research results reveal the mesoscopic evolution laws of concrete blasting damage, providing a theoretical basis for the optimization of engineering blasting parameters and safety control.

1. Introduction

In the process of modern urban construction and infrastructure renewal, a large number of old and damaged large-scale concrete structures (such as high-rise buildings, bridge piers, etc.) are in urgent need of efficient demolition. Traditional manual or mechanical methods often face problems such as high safety risks, noise and dust pollution, and uncontrollable secondary risks when dealing with structures with large volumes, complex structures, or those located in environmentally sensitive areas (such as dense urban areas, adjacent protected buildings, and pipelines) [1,2]. Against this background, concrete blasting demolition technology, with its high efficiency, economy, and controllability advantages, has become a key means to solve such problems [3,4]. Although there are many successful cases of blasting demolition [5,6,7,8], the theoretical system in this field is still incomplete. The design mostly relies on empirical technologies [9], especially research on instability and collapse mechanisms, while precise control of high-rise concrete buildings is insufficient. There are scientific and technological problems such as unclear mechanisms, difficult process control, and insufficient protection against harmful effects [10,11]. Therefore, in-depth research and optimization of the mechanism and control technology of concrete blasting demolition are of important practical engineering value and theoretical significance for improving the demolition efficiency of major projects, ensuring public safety, and promoting sustainable urban development.
In research on concrete blasting damage, Wang et al. [12] explored the cumulative damage effect of initial support concrete under cyclic blasting loads and found that the damage degree of specimens increased with the number of blasts. Moreover, the closer to the explosion source, the more serious the damage was. Chen et al. [13] established a failure assessment method for concrete shear walls based on the dynamic response characteristics and damage features of concrete shear walls under such loads. Chu et al. [14] conducted damage accumulation tests on high-strength concrete specimens and revealed the damage accumulation laws of high-strength concrete under multiple blasts. Although blasting inevitably causes irreversible damage to concrete materials, existing studies mostly focus on the macro-mechanical properties. Few studies have deeply explored changes in microstructure, which are the fundamental reason for the evolution of macro-properties. In terms of microstructure factors, Peng et al. [15] studied the influence of aggregate distribution on concrete properties and the initiation and propagation paths of cracks. Duarah et al. [16] investigated the effect of aggregate content on the mechanical and wear properties of concrete. It was found that with an increase in aggregate content, both the strength and wear resistance of concrete specimens were enhanced. Huang et al. [17] pointed out that the addition of aggregates increased the inhomogeneity of materials and adversely affected the interface bonding performance. Aggregates with a particle size of 5~10 mm had a more significant impact on bonding performance than those with a particle size of 10~15 mm. Yu et al. [18] explored the influence of concrete components and internal defects on the brittleness index. The results showed that the brittleness index of concrete with two prefabricated fissures was 48.8% lower than that of intact specimens.
The explosive fragmentation process of concrete structures is instantaneous and destructive, making full-process observation difficult. Meanwhile, due to the heterogeneity and anisotropy of concrete materials, laboratory tests cannot accurately simulate the real fragmentation state of full-scale components under explosion [19,20]. Numerical simulation technology can effectively overcome the above limitations. It can completely simulate the concrete fragmentation process and facilitate the quantification of the overall damage morphology of components after explosions. In recent years, a large number of achievements have been made in research on blasting damage behavior based on numerical simulation [21,22,23,24]. Qu et al. [25] conducted a finite element analysis on RC beams using the finite element code LS-DYNA, investigating the effects of explosive weight and position, initial crack location, width, and depth on the dynamic behavior of concrete beams with initial cracks under blast loads. Kong et al. [26] proposed a refined nonlinear finite element model to simulate the structural response of AFRP-strengthened reinforced concrete slabs under blasting loads. Jiang et al. [27] simulated blasting in fissured rock masses using the finite element method. The propagation characteristics of blasting stress waves and the mechanism of damage evolution around the blast hole were revealed. Wu et al. [28] established a numerical calculation model for concrete columns by the finite element method. The damage and failure mechanisms of concrete columns under explosion were investigated. However, the traditional finite element method (FEM) struggles to simulate the cracking and separation processes induced by blasting [29,30]. In contrast, PFC based on the discrete element method (DEM) can effectively achieve such simulations. Compared with grid-based methods represented by the FEM, the core advantage of the DEM lies in its ability to handle complex inter-particle interactions and nonlinear mechanical behaviors without relying on grids [31]. For example, Hajibagherpour et al. [32] simulated the mechanism of rock fragmentation caused by explosion-induced shock waves in a single blast hole using the two-dimensional discrete element code. The results showed that the proposed numerical model could be effectively used to simulate the crack propagation process around blast holes. He et al. [33] applied the PFC software to simulate rock explosions triggered by blasting stress waves (dynamic disturbances), aiming to determine their impact on deep-buried tunnels in jointed rock masses. Shen et al. [34] established a jointed rock mass blasting model using PFC and discussed crack propagation behavior at the microscale.
This study focuses on the simulation of the blasting damage evolution mechanism of concrete specimens based on the PFC method. Firstly, a typical blasting experiment is conducted. The results are systematically compared and verified with the corresponding numerical simulation results, fully confirming the rationality and reliability of the constructed PFC numerical model in characterizing the dynamic response and damage evolution of concrete under blasting. On this basis, four groups of control variable schemes are systematically designed and simulated in this study. The influence of key factors, such as the particle size of concrete, aggregate content, prefabricated fissure inclination angle, and fissure length, on the blasting fracture morphology of specimens is explored. Through in-depth analysis of the fracture modes under different schemes, the significant influence mechanisms of the mesoscopic structural characteristics and macroscopic prefabricated defects of concrete on its dynamic damage evolution process and final failure mode under explosion are further revealed. The research results deepen the understanding of the concrete blasting damage mechanism and provide an important theoretical basis and reference for the simulation of concrete blasting dynamics based on PFC and the optimization of engineering blasting parameters.

2. Materials and Methods

PFC is a numerical simulation tool developed based on the discrete element method (DEM) [35]. It is mainly used to simulate the mechanical behaviors (such as movement, deformation, fragmentation, flow, etc.) of discrete particle systems (such as sand, rock, bulk materials, etc.). Its core idea is to regard the research object as a collection of a large number of discrete particles. The mesoscopic mechanism of macroscopic phenomena is revealed by describing the interaction and movement laws between particles [36].
Traditional continuum mechanics (FEM) treats materials as “continuums”. It assumes no internal voids within materials and describes overall behavior through continuous field variables (such as stress and strain). However, it is difficult to simulate material discontinuities (such as crack propagation), discreteness (such as particle flow), and failure processes (such as collapse) [37]. In contrast, the DEM regards materials as a collection of discrete particles. It does not require the continuity assumption. Each particle serves as an independent research unit. The macroscopic mechanical response is finally obtained by superposition after calculating the contact forces and motion states between particles. For concrete with a multiphase heterogeneous structure and a failure process characterized by significant discontinuity, the limitations of traditional continuous models are more pronounced. In contrast, the DEM, through discrete particle modeling and contact mechanics analysis, can not only naturally capture the initiation and propagation of cracks, but also quantitatively reveal the influence mechanism of micro parameters such as aggregates and pores on macroscopic performance.

2.1. Basic Principles of PFC

In the process of simulating material motion, the core principle of PFC relies on the force–displacement law and Newton’s second law. By defining the contact constitutive relationship, the quantitative calculation of the process where contact forces change with particle displacements can be realized. Newton’s second law is used to explain the evolution of the motion state of objects over time. That is, by applying forces to each particle and calculating the acceleration, the motion state of particles in the time dimension can be determined. The specific simulation process is as follows: First, based on the current positions of particles, the contact forces are calculated using the force–displacement law. Then, the obtained contact forces are applied to the particles. Newton’s second law is used to solve for the acceleration, thereby updating the positions and contact states of particles at the next moment. After that, the above steps are repeated to form a cyclic iteration until the system reaches an equilibrium state.
(1)
Force–displacement law
The force–displacement law characterizes the relationship between the contact force and the relative displacement between particles or between a particle and a wall. The equation for calculating the unit vector n i of the normal contact between particles is as follows:
n i = x i [ B ] x i [ A ] d
where x i [ A ] denotes the center position of particle A; x i [ B ] denotes the center position of particle B; and d represents the straight-line distance between the centers of particles A and B.
d = | x i [ B ] x i [ A ] | = ( x i [ B ] x i [ A ] ) ( x i [ B ] x i [ A ] )
The contact force vector F i between two spheres is the sum of the normal component and the tangential component, as follows:
F i = F i n + F i s
F i n = K n U n n i
F i s = F i s rot.2 + F i s = F i 1 s + F i s
where F i n represents the normal component; F i s represents the tangential component; K n denotes the normal stiffness between particle contact points; U n refers to the overlap between particles; F i 1 s is the tangential contact force from the previous time step; and F i s is the tangential component generated in one time step.
(2)
Motion equation
Since the motion of particles is governed by the resultant force and resultant torque, when contact forces are generated between particles, the translational acceleration can be derived based on Newton’s second law, as follows:
m x ¨ = F + m g
Here, m denotes mass, F represents the resultant force, and g is the gravitational acceleration.
For PFC2D, the equation of motion for particles is as follows:
M = I ω ˙ = ( 1 2 m R 2 ) ω ˙
where M denotes the resultant moment; ω ˙ represents the angular acceleration of particle rotation; and R is the particle radius.

2.2. Particle Expansion Loading Method

Shi et al. [38] characterized the wave characteristics of dynamic loads using a half-sine wave form. This allows for intuitive observation and analysis of characteristics and laws during the blasting process. Its expression is given as follows [39]:
P ( t ) = A 2 1 cos ( 2 π f t )
In the formula, A denotes the peak pressure in the blasthole; f represents the frequency of the half-sine wave; and P(t) is the gas pressure.
Figure 1 shows the particle blasting process in the PFC model. The circle in the middle represents the explosive particle and the outer circles represent concrete particles. As the explosive particle expands, it overlaps with the surrounding concrete particles. Based on the principle of particle contact, assuming that the original charge radius is r0 and the variation of the expansion radius of the explosive particle is dr, we adjust the value of dr to simulate different forms of blasting loads. The radial thrust F1 exerted by the explosive particle on the surrounding particles is given by the following:
F 1 = K i d r
Ki denotes the normal stiffness of the explosive particle. Assuming that the initial pressure transmitted from the impact energy to the surrounding particles during actual blasting is Pm, the resultant force acting on the surrounding particles is given by the following [40]:
F = 2 π r 0 P m
Here, r0 is the blasthole radius. By equating Equations (8) and (9) (F1 = F), the following can be obtained:
d r = 2 π r 0 P m K i
Therefore, different forms of blasting loads can be simulated by varying the magnitude of dr.

3. Generation of PFC Blasting Model

3.1. Selection of Contact Model

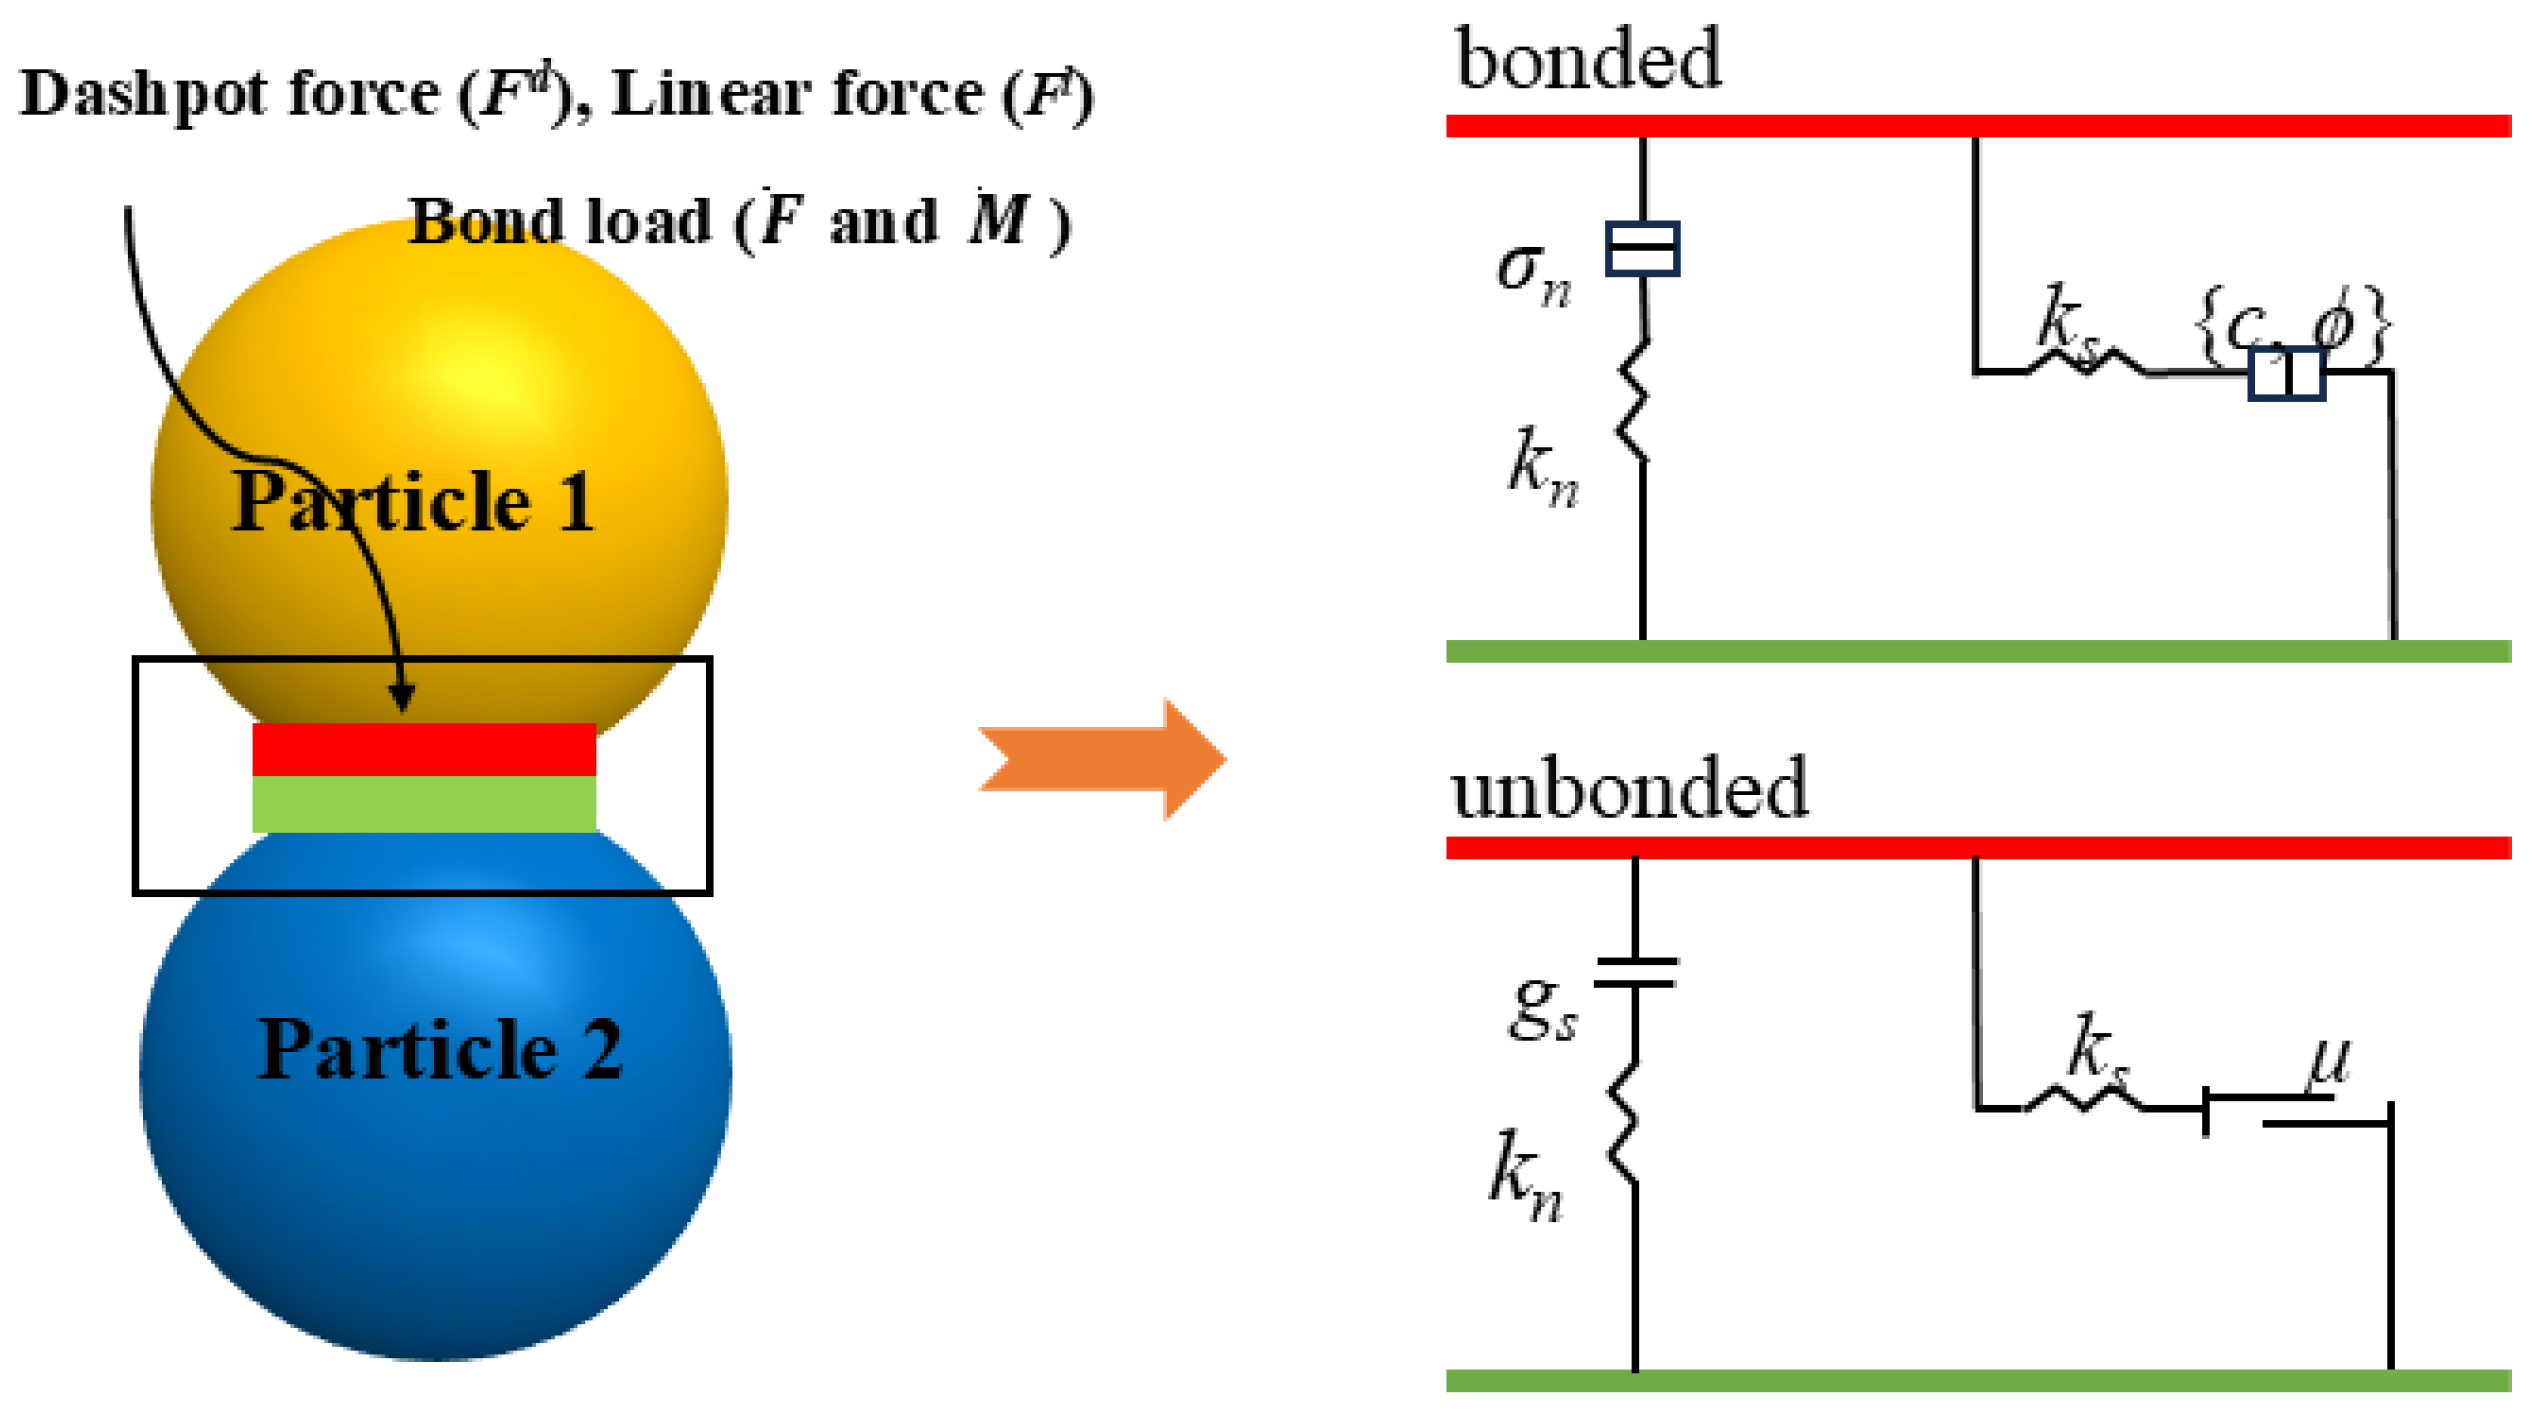
Since the parallel bond can transmit forces and moments between particles, and there is a good correspondence between the parallel bond strength and the strength of rock materials [41], the parallel bond contact model is adopted in this paper. A schematic diagram of the parallel bond contact model is shown in Figure 2.
When using the parallel bond contact model, the contact force F c is divided into the linear elastic force F l , the damping force F d , and the parallel bond force F ¯ , as follows:
F c = F l + F d + F ¯
M c = M ¯

3.2. Model Establishment

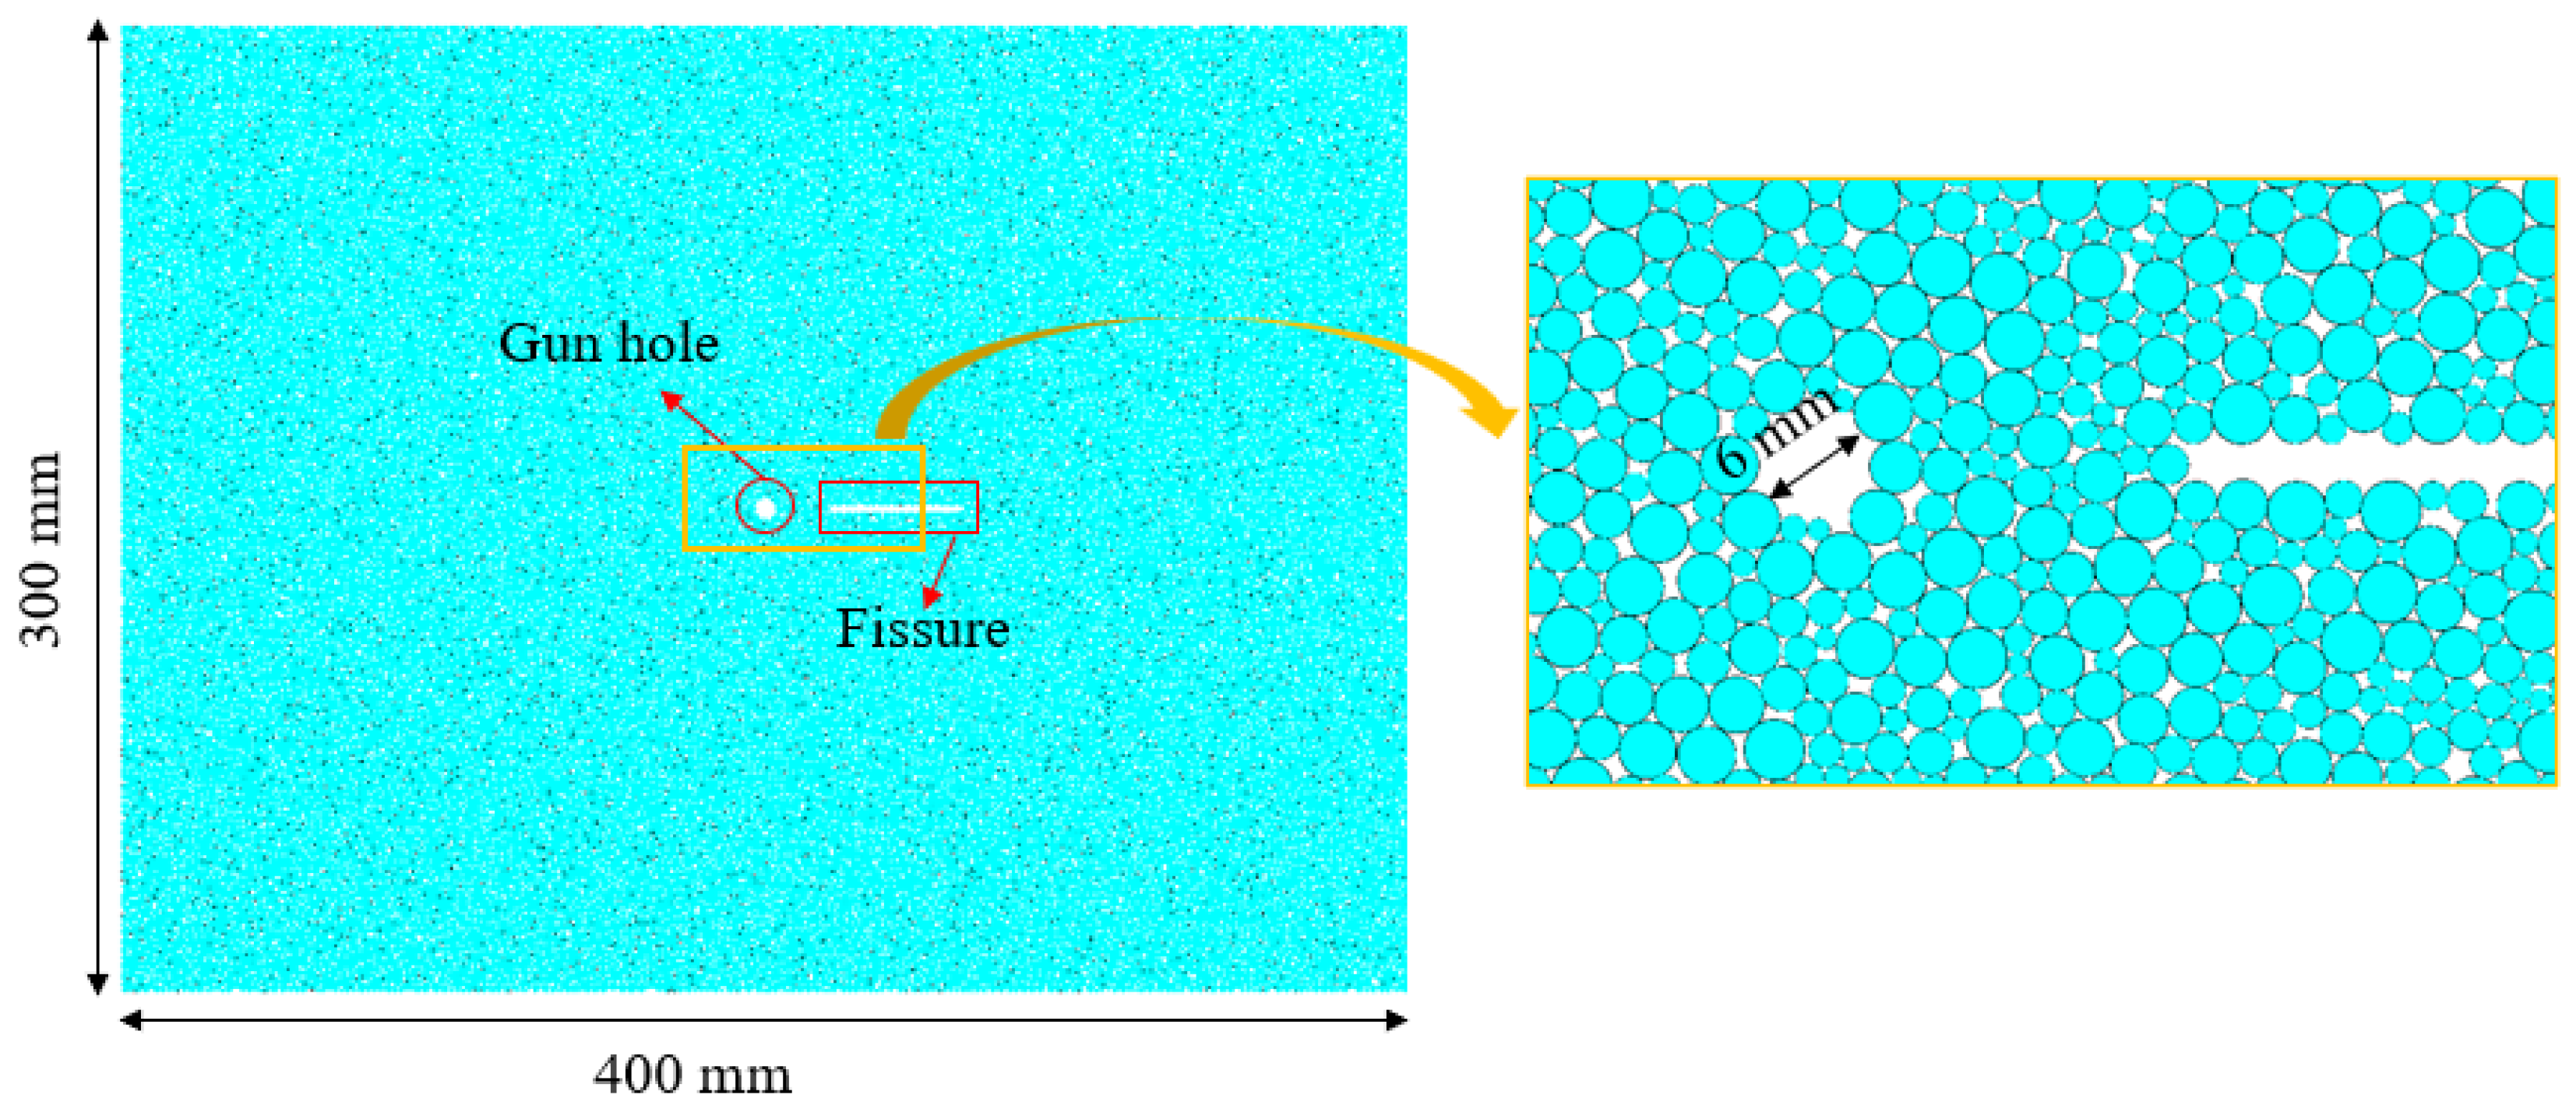
The numerical model in this section is based on the experimental model with a blast hole and a horizontal single fissure from reference [42]. A numerical model with dimensions of 400 × 300 mm is established, where the blast hole radius is 3 mm, the horizontal prefabricated fissure has a length of 40 mm, and the distance from the fissure center to the blast hole center is 40 mm, as shown in Figure 3. This model consists of 24,538 particles. The mesoscopic parameters are listed in Table 1.

3.3. Model Validation

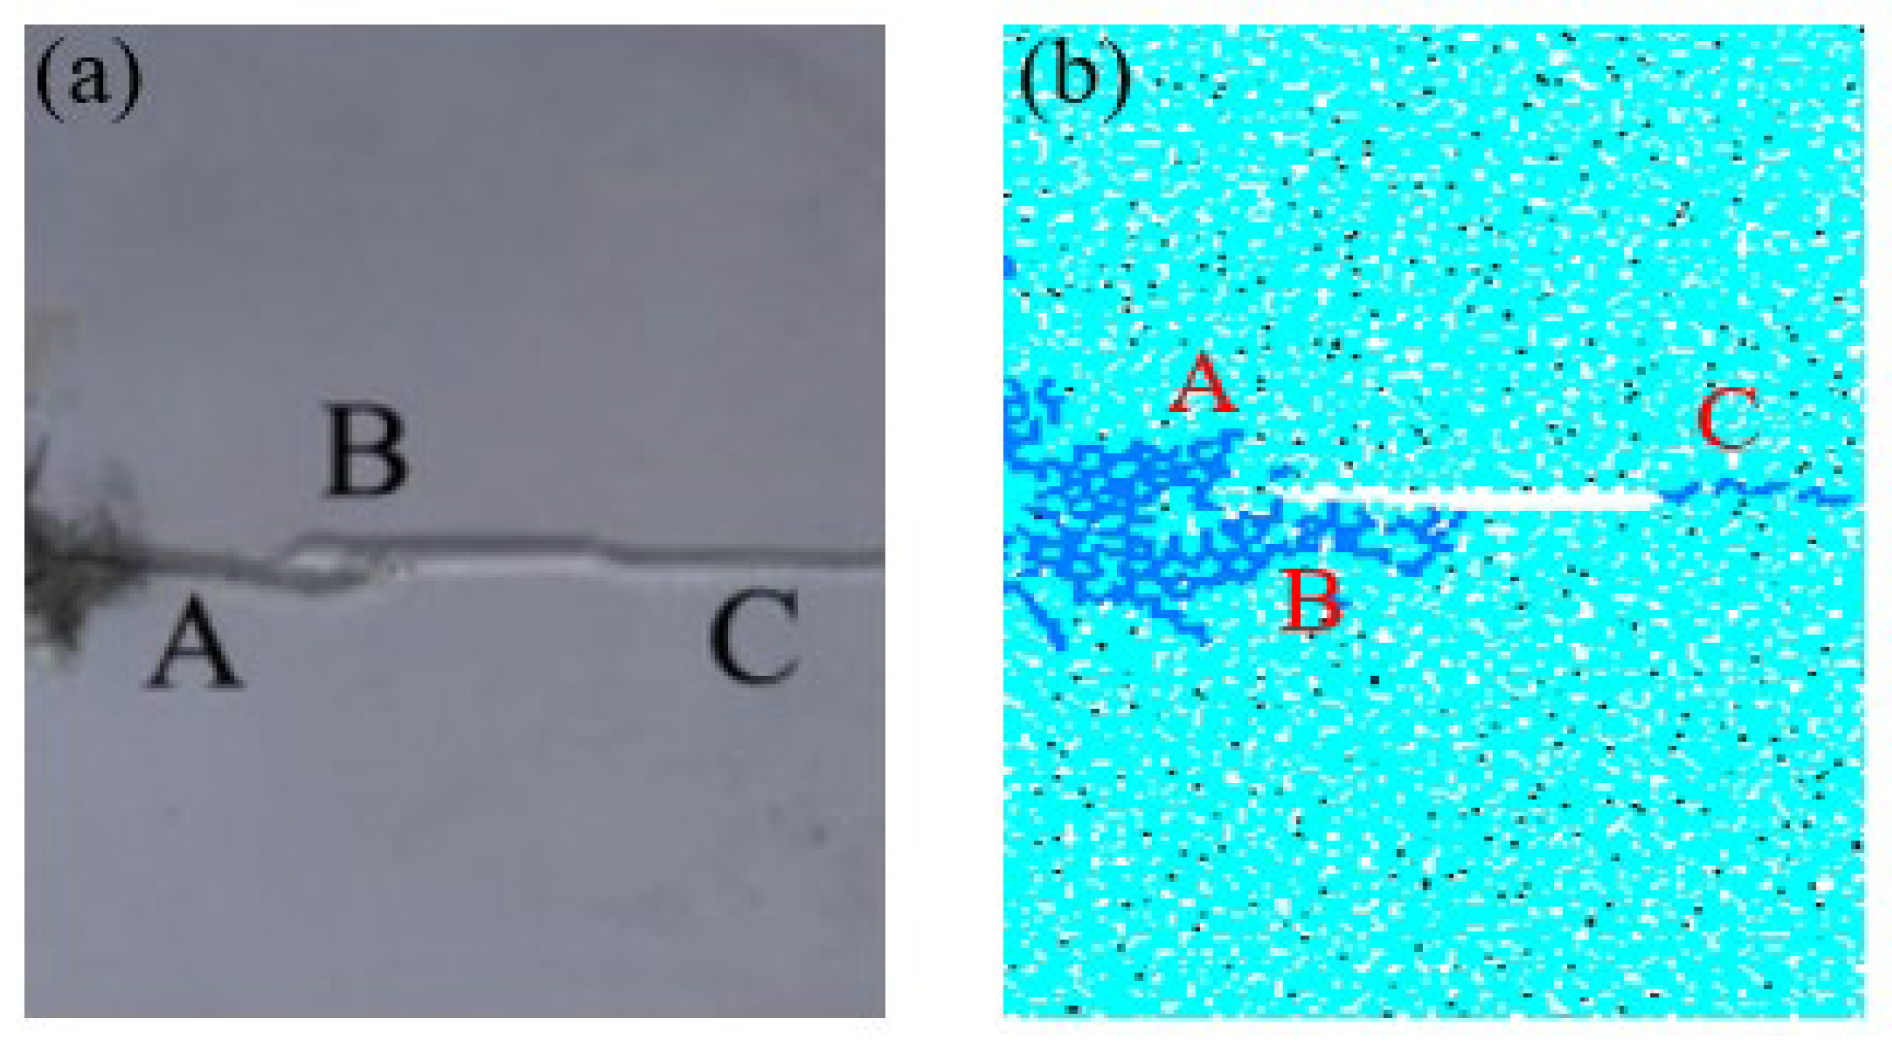
Figure 4 illustrates the blasting damage process of the model containing a blast hole and a horizontal single fissure. It can be observed that cracks first initiate around the blast hole and expand radially. Among them, crack A propagates toward the left tip of the fissure and connects with it. Subsequently, crack B extends to the middle of the prefabricated fissure, while crack C initiates from the right tip of the fissure until the specimen fails. Meanwhile, Figure 5 presents a comparison between the final failure mode and the experimental results. Both failure modes involve interaction between cracks A and B (generated from the blast hole) and the fissure, as well as crack C (generated from the prefabricated fissure). The numerical simulation result is consistent with the experimental result.

4. Simulation Results of Concrete Blasting Damage Evolution

4.1. Concrete Model Establishment

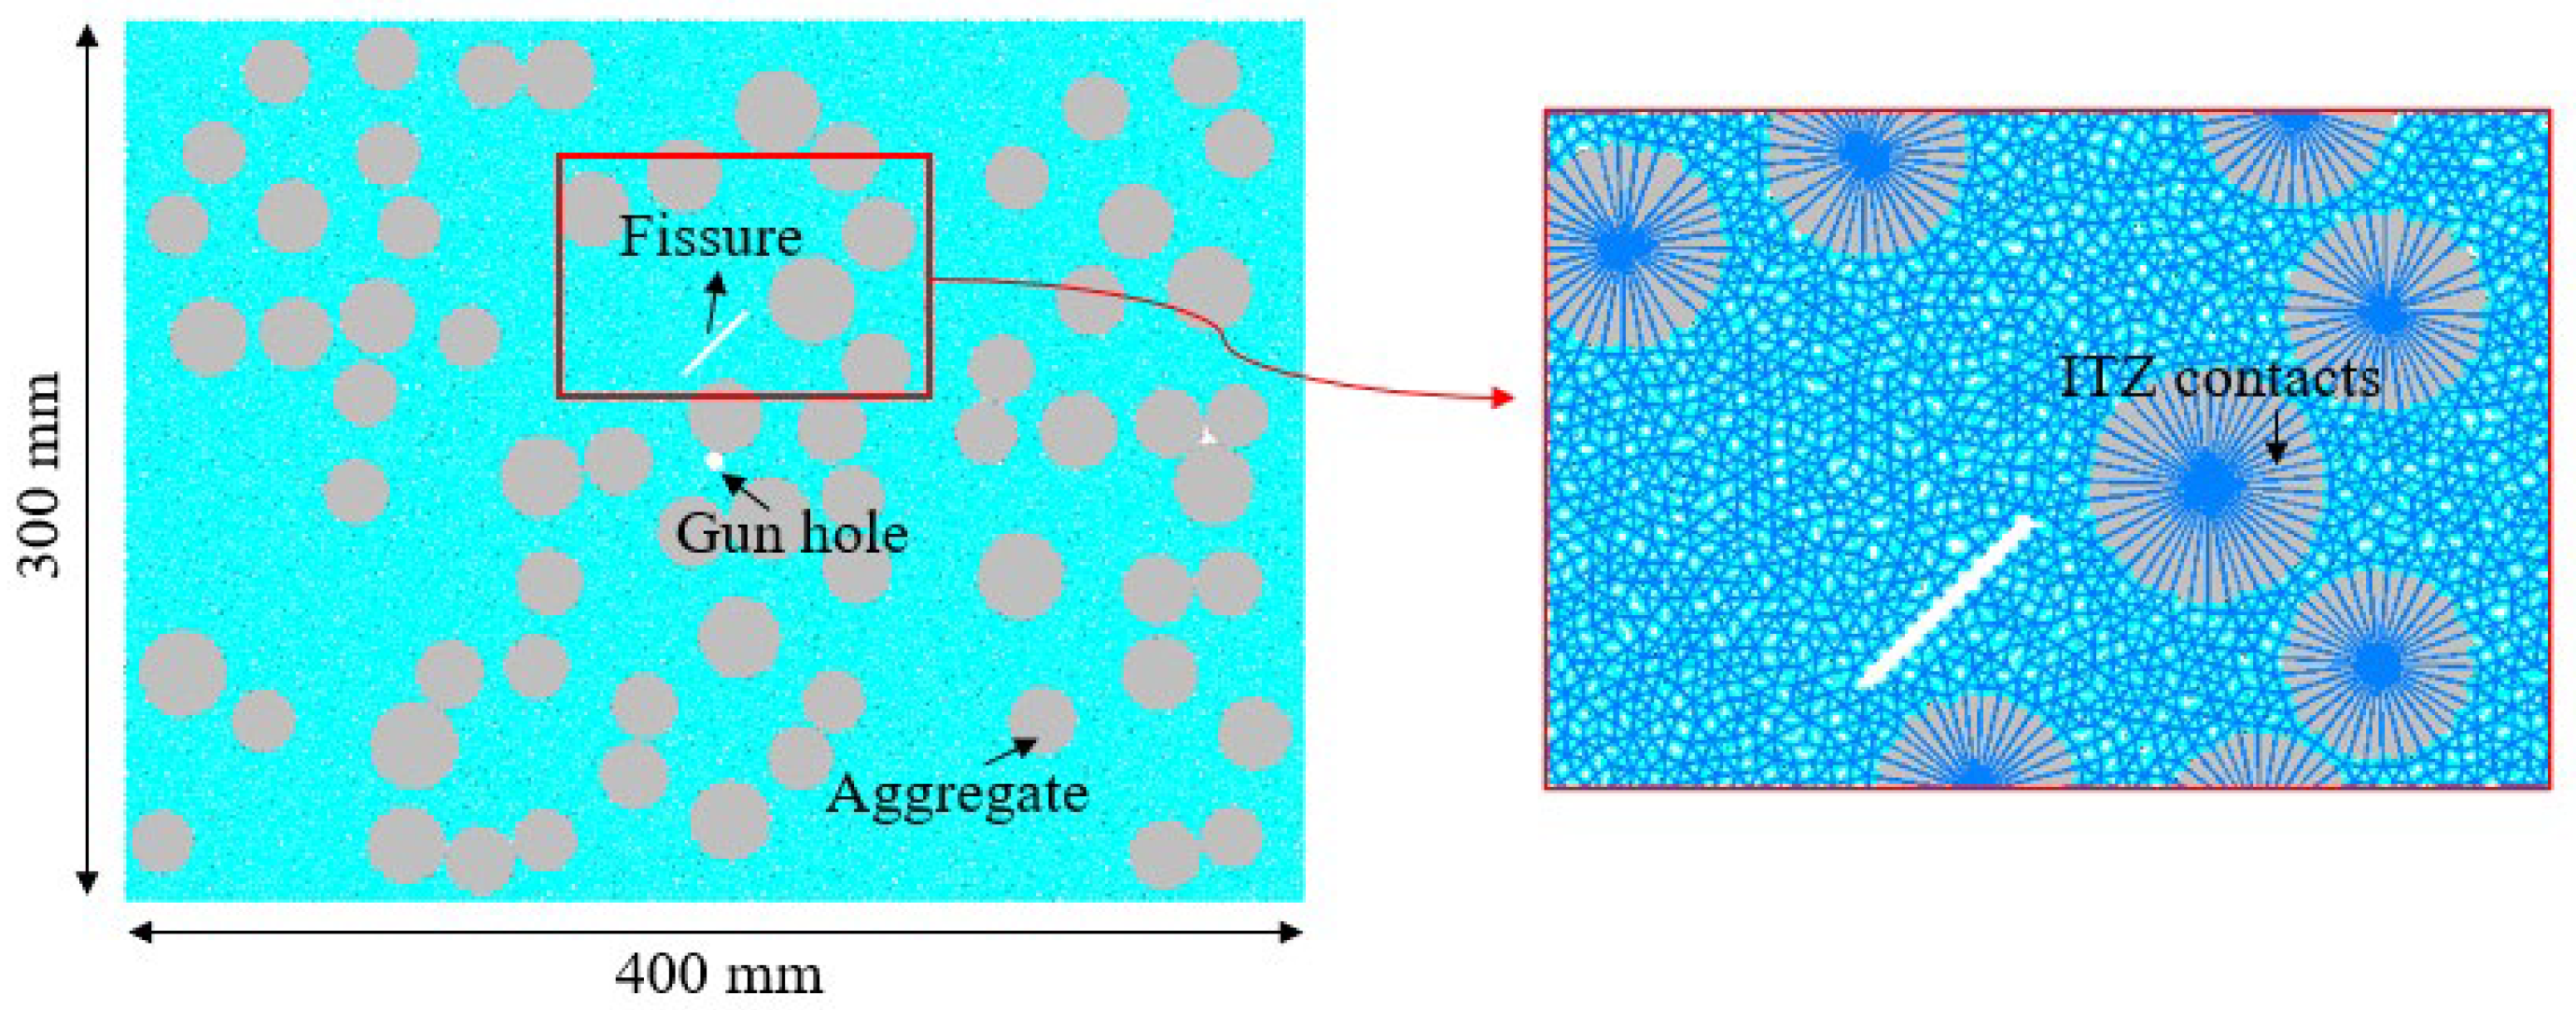
Concrete is a multiphase composite material that consists of aggregates, cement mortar, and an interfacial transition zone (ITZ). The ITZ refers to the thin layer between aggregate particles and the cement matrix [43]. Due to its porous nature and low strength, it often becomes the initial region where concrete damage occurs, exerting a significant impact on the overall strength and durability of concrete [44,45]. As an indispensable component of concrete, aggregates provide the necessary volume and skeletal support, reduce volume shrinkage of the cement matrix, and enhance the durability of concrete [46].
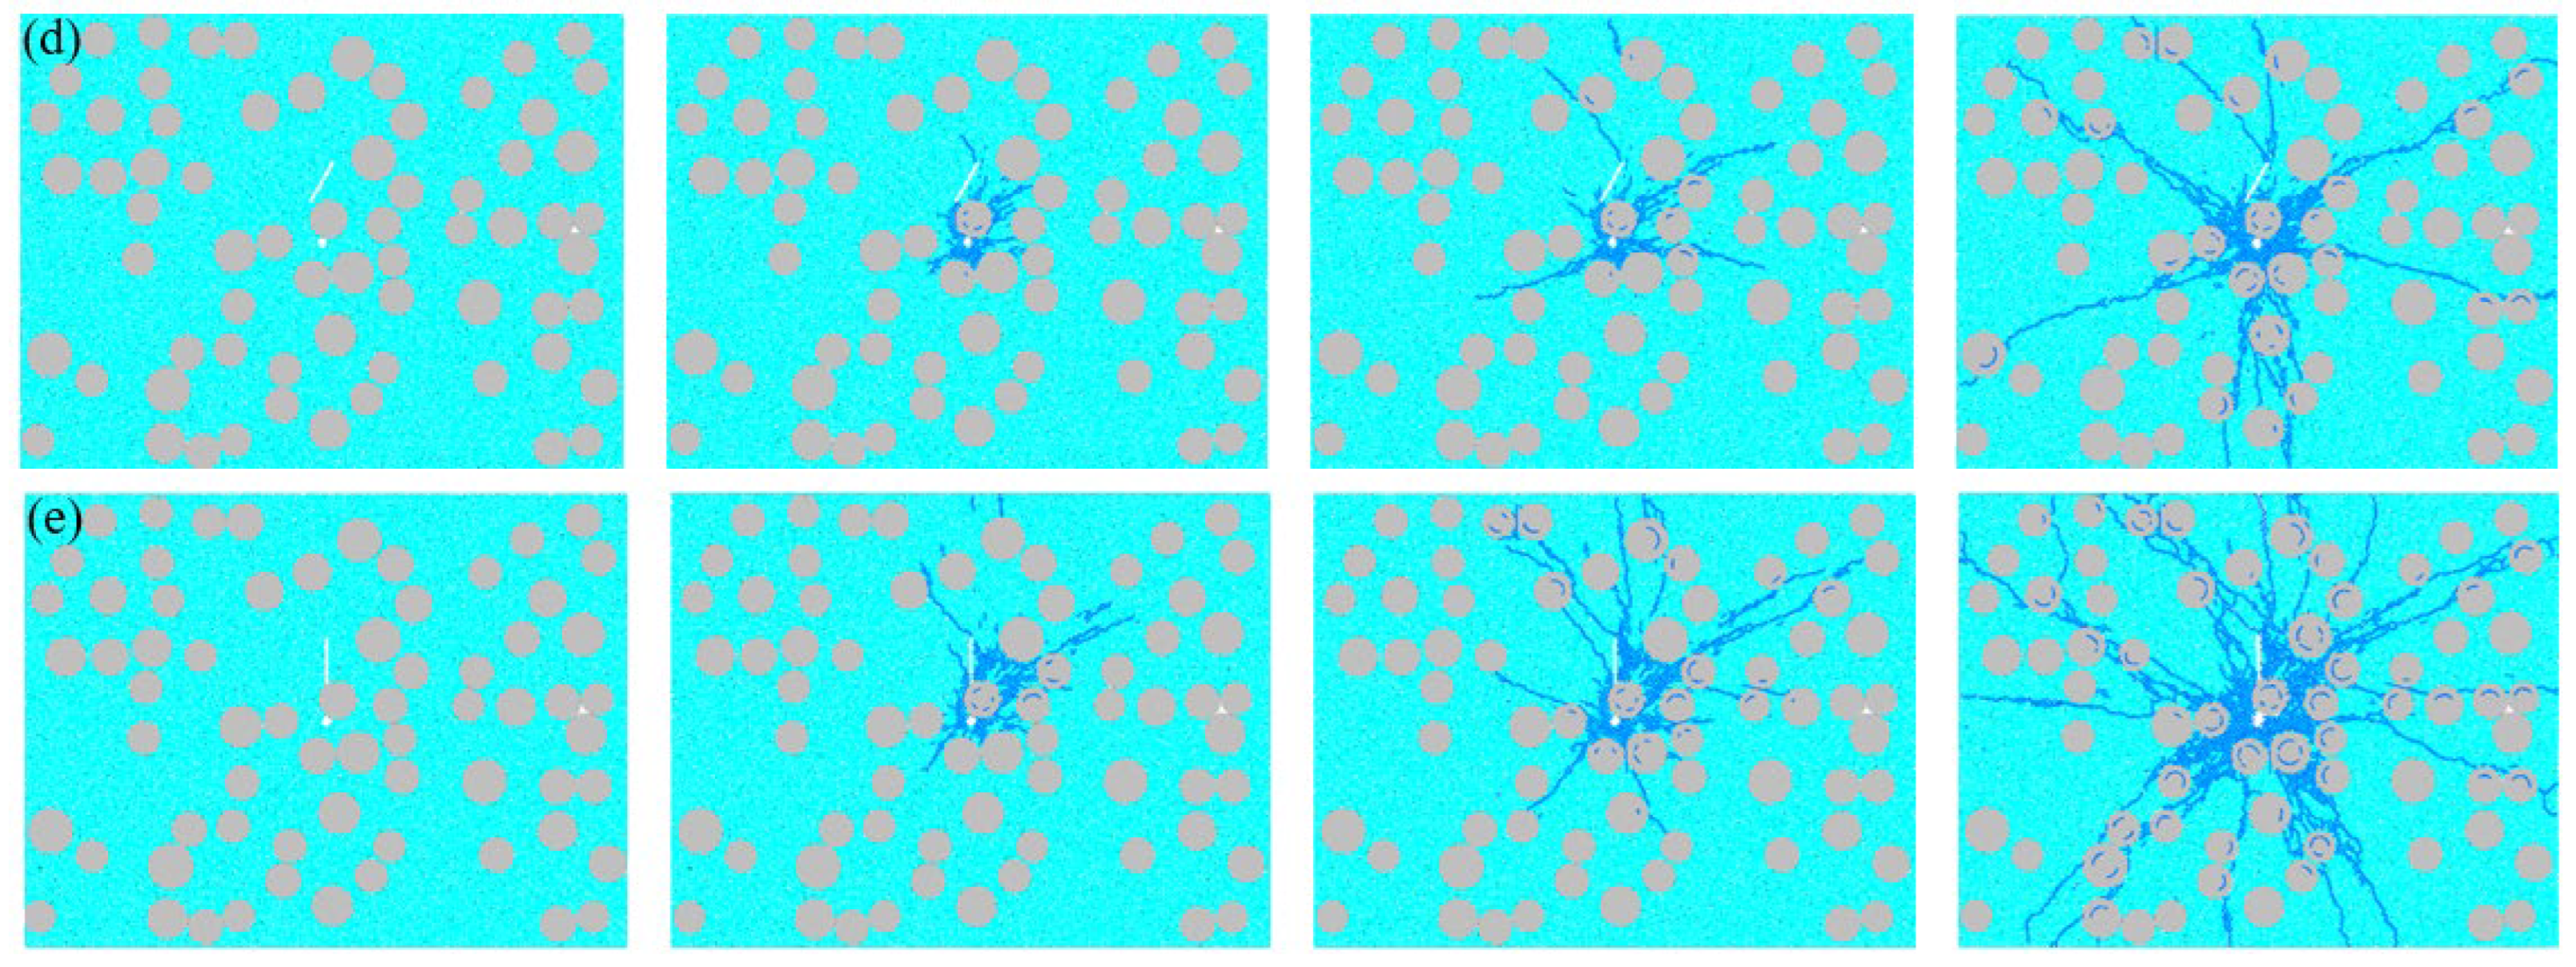
To explore the significant influence mechanisms of the meso-structural characteristics of different concretes and macroscopic prefabricated defects on their dynamic damage evolution process and final failure mode under explosion, a mesoscopic concrete model is established, as shown in Figure 6. The model has a size of 400 × 300 mm, with a blast hole with a radius of 3 mm set at the center and a fracture located 40 mm above the center of the blast hole. The light blue area represents the cement mortar zone and the gray area represents the aggregate zone. The porosity of the model is 0.02, and the radii of cement particles are uniformly distributed between 1 mm and 1.5 mm. Since the ITZ is essentially a porous mortar zone, to reduce the number of parameters that need to be calibrated, the ITZ is described as a weak contact between the cement matrix and aggregates without actual physical thickness. In this study, the following four typical numerical simulation schemes are carried out: A: different particle size distributions of concrete; B: different aggregate contents of concrete; C: different inclination angles of prefabricated fissures; and D: different lengths of prefabricated fissures. The specific test schemes are shown in Table 2, and the mesoscopic parameters of the concrete blasting model are shown in Table 3.

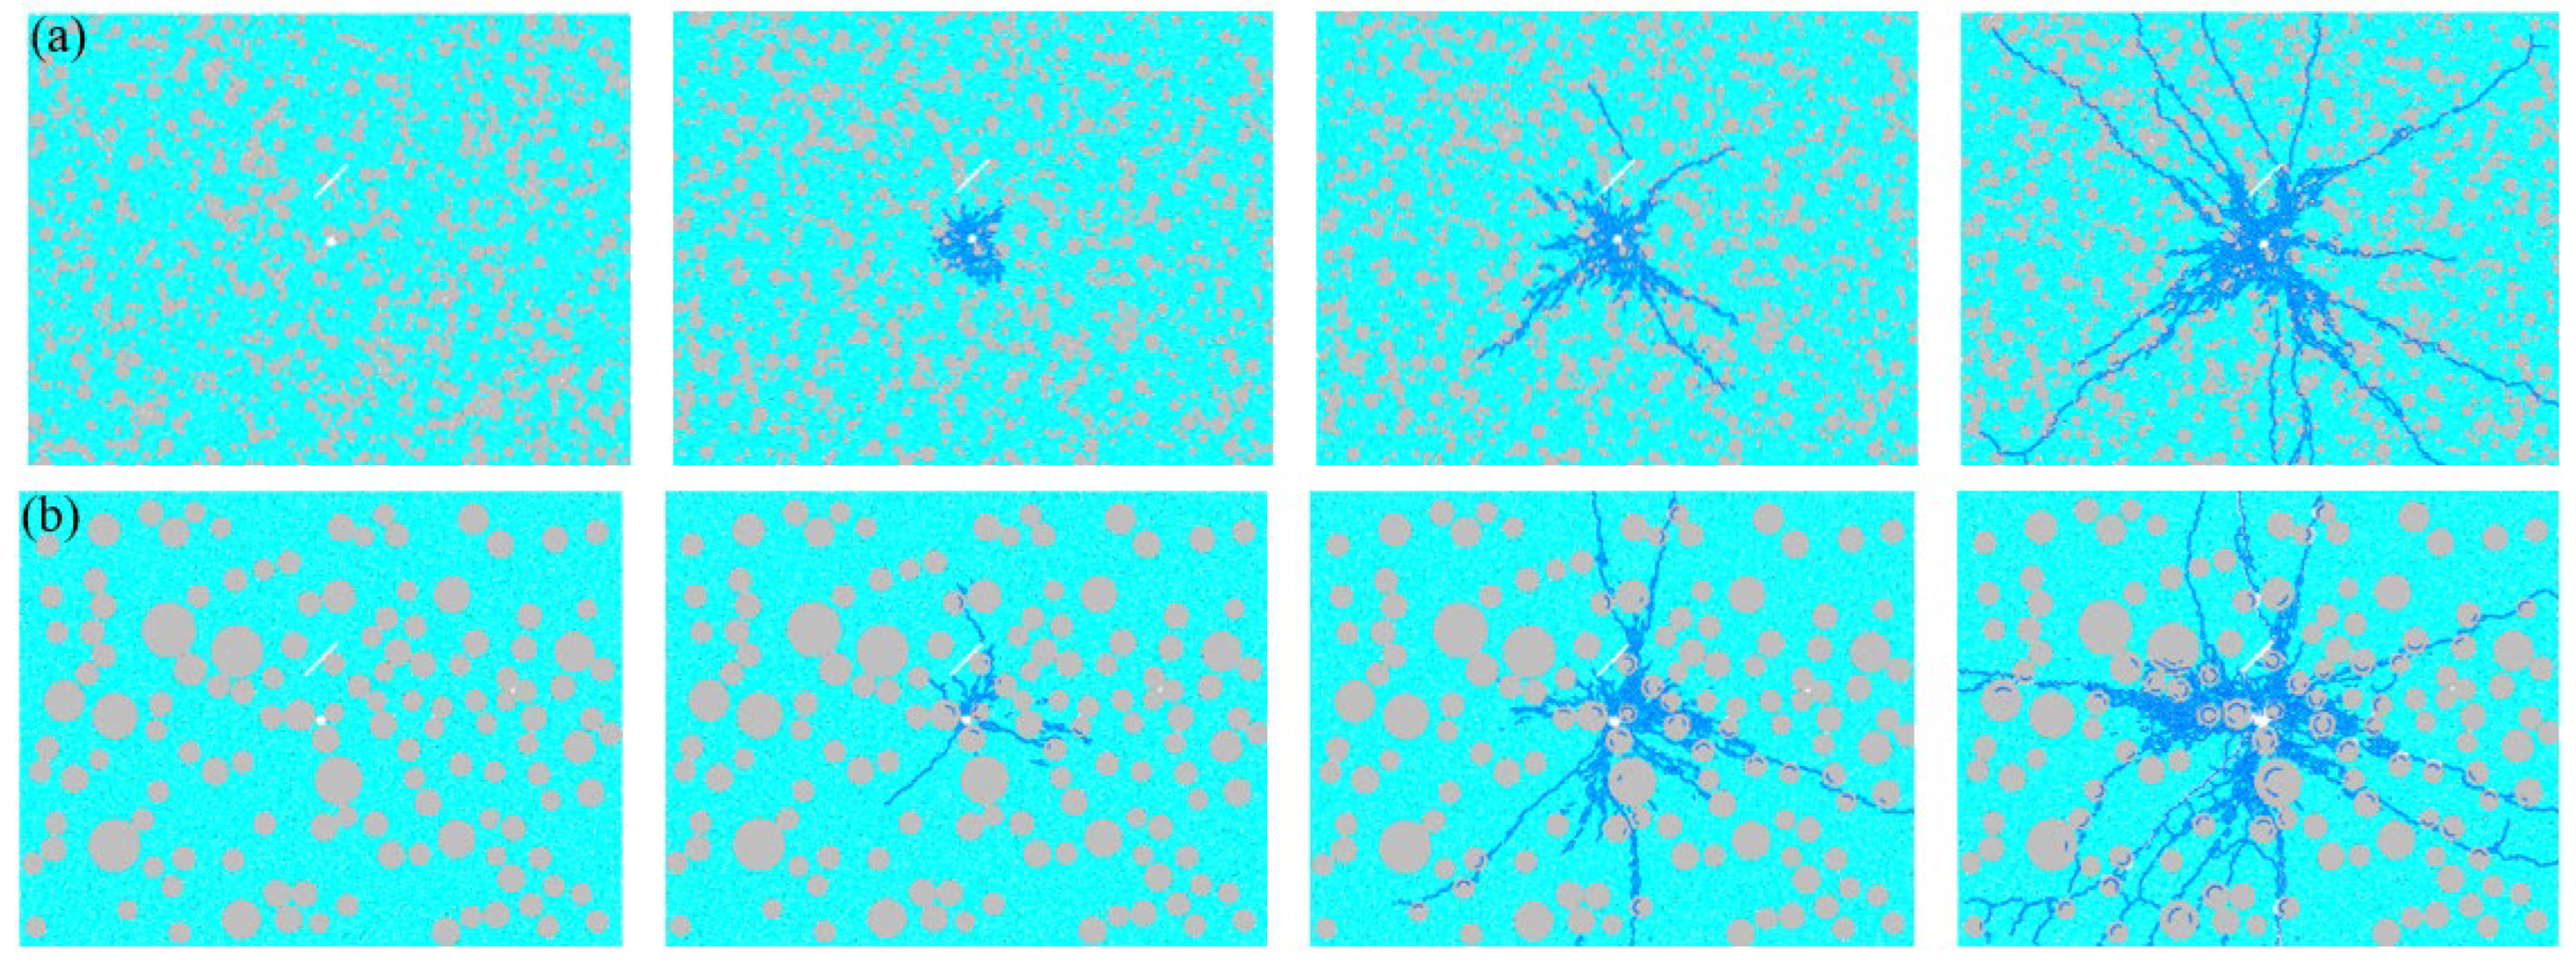
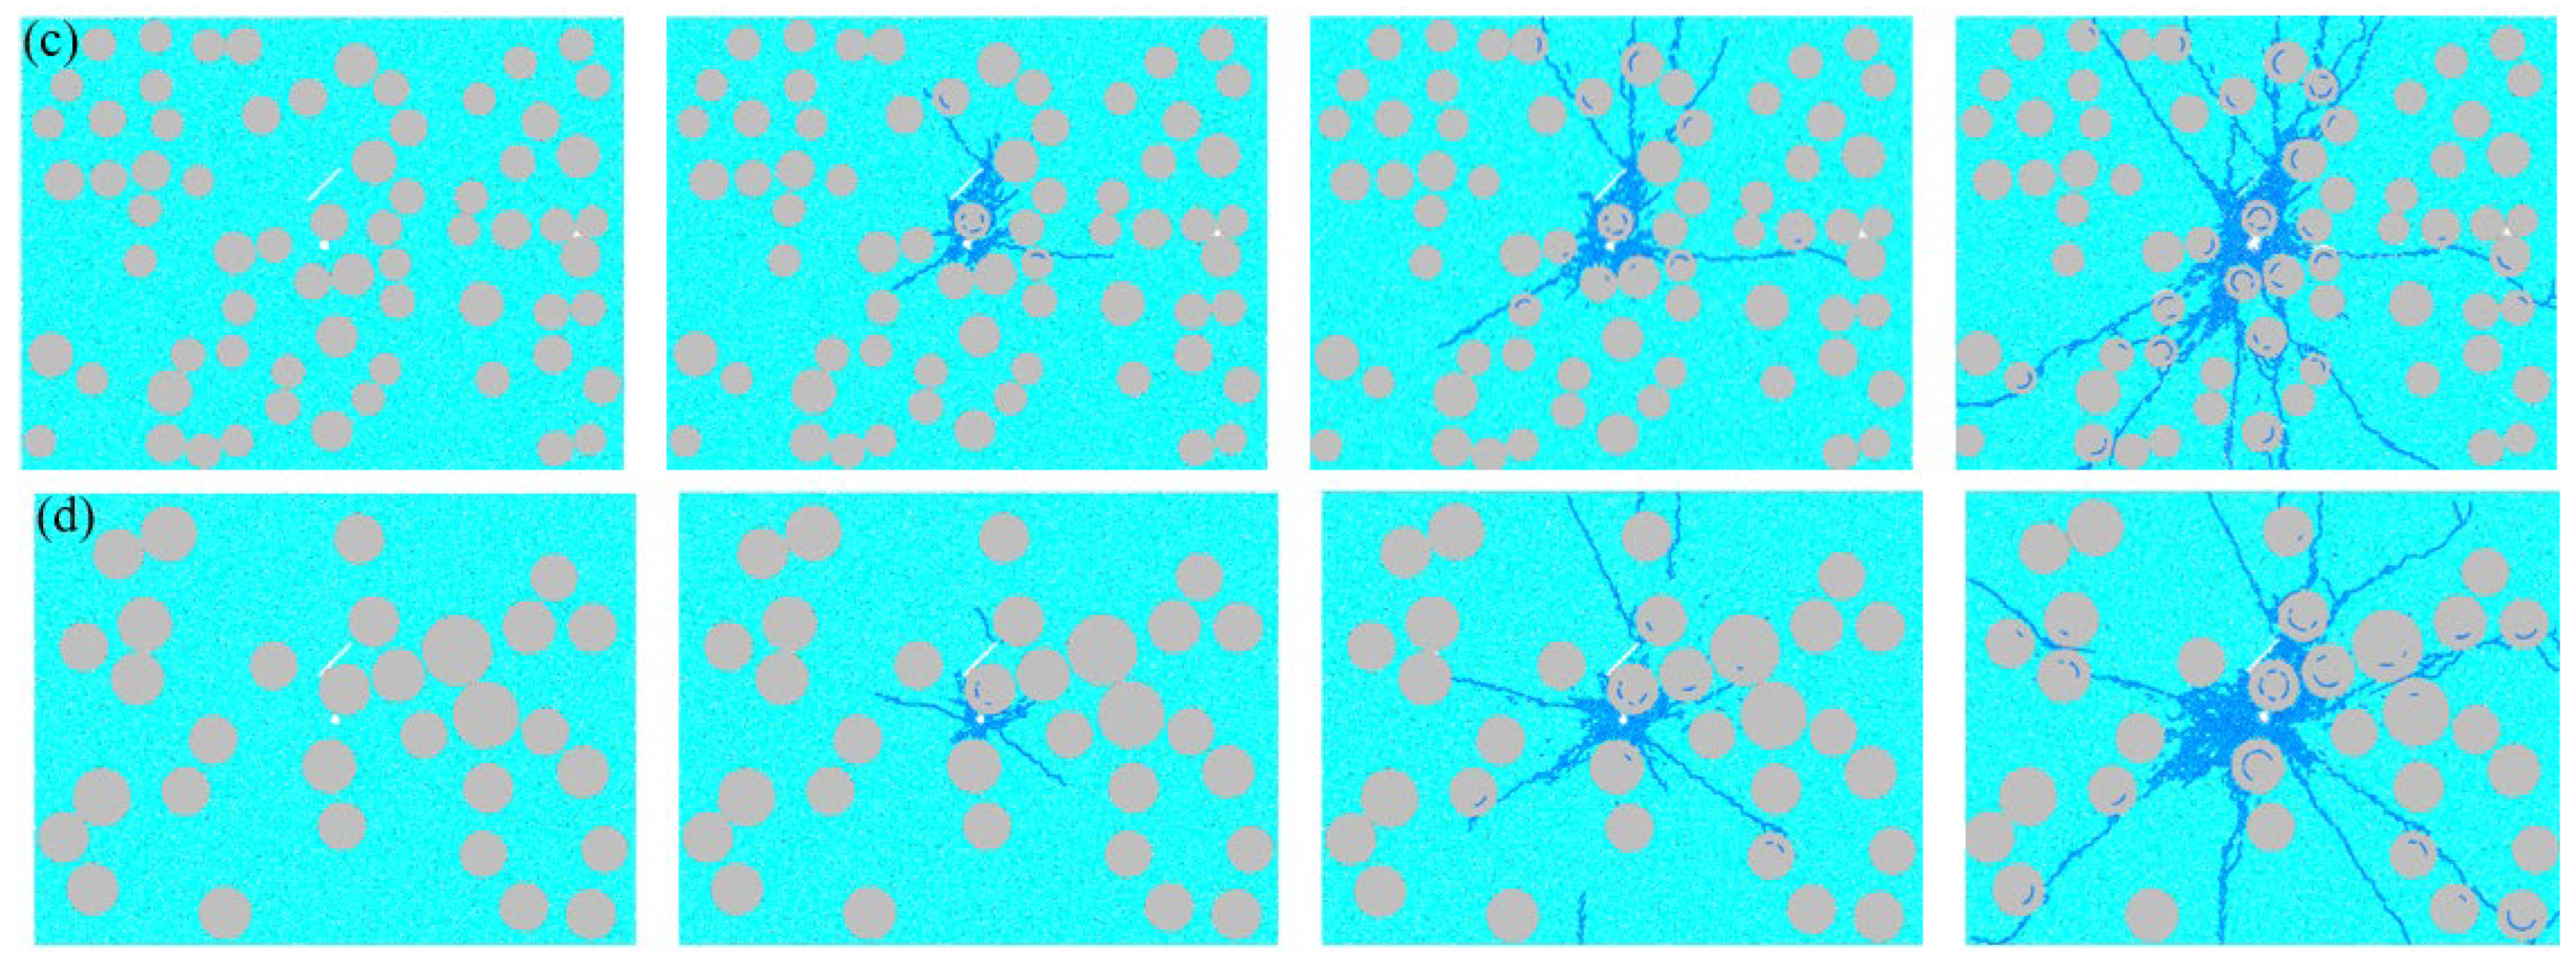
4.2. The Impact of Different Particle Size Distributions on the Evolution of Concrete Blasting Damage

Figure 7 shows the evolution process of blasting damage in mesoscopic concrete with different particle size distributions. It can be seen from the figure that blasting damage starts from the blast hole and gradually expands outward. In the initial stage, the damage range is small and concentrated near the blast hole; as the concrete particle size increases (from (a) to (d)), the damage development process shows differences. When the particle size is small (0~5 mm), the damage expands relatively uniformly, the damaged area gradually becomes coherent, and the crack network formed after damage evolution is relatively denser. When the particle size is large (15~20 mm), damage is more likely to expand rapidly along weak points such as interfaces between particles, and the damage branches are significantly reduced. At this time, damage cracks are more likely to bypass large particles, forming relatively sparse but large-span cracks. The damage morphology is significantly affected by the particle size: the larger the particle size, the more obvious the avoidance of damage cracks, and the more irregular the crack network morphology. In general, the concrete particle size affects the crack network morphology of blasting damage. The larger the particle size, the more irregular the damage crack morphology, while the damage development of concrete with a small particle size is relatively uniform and dense.

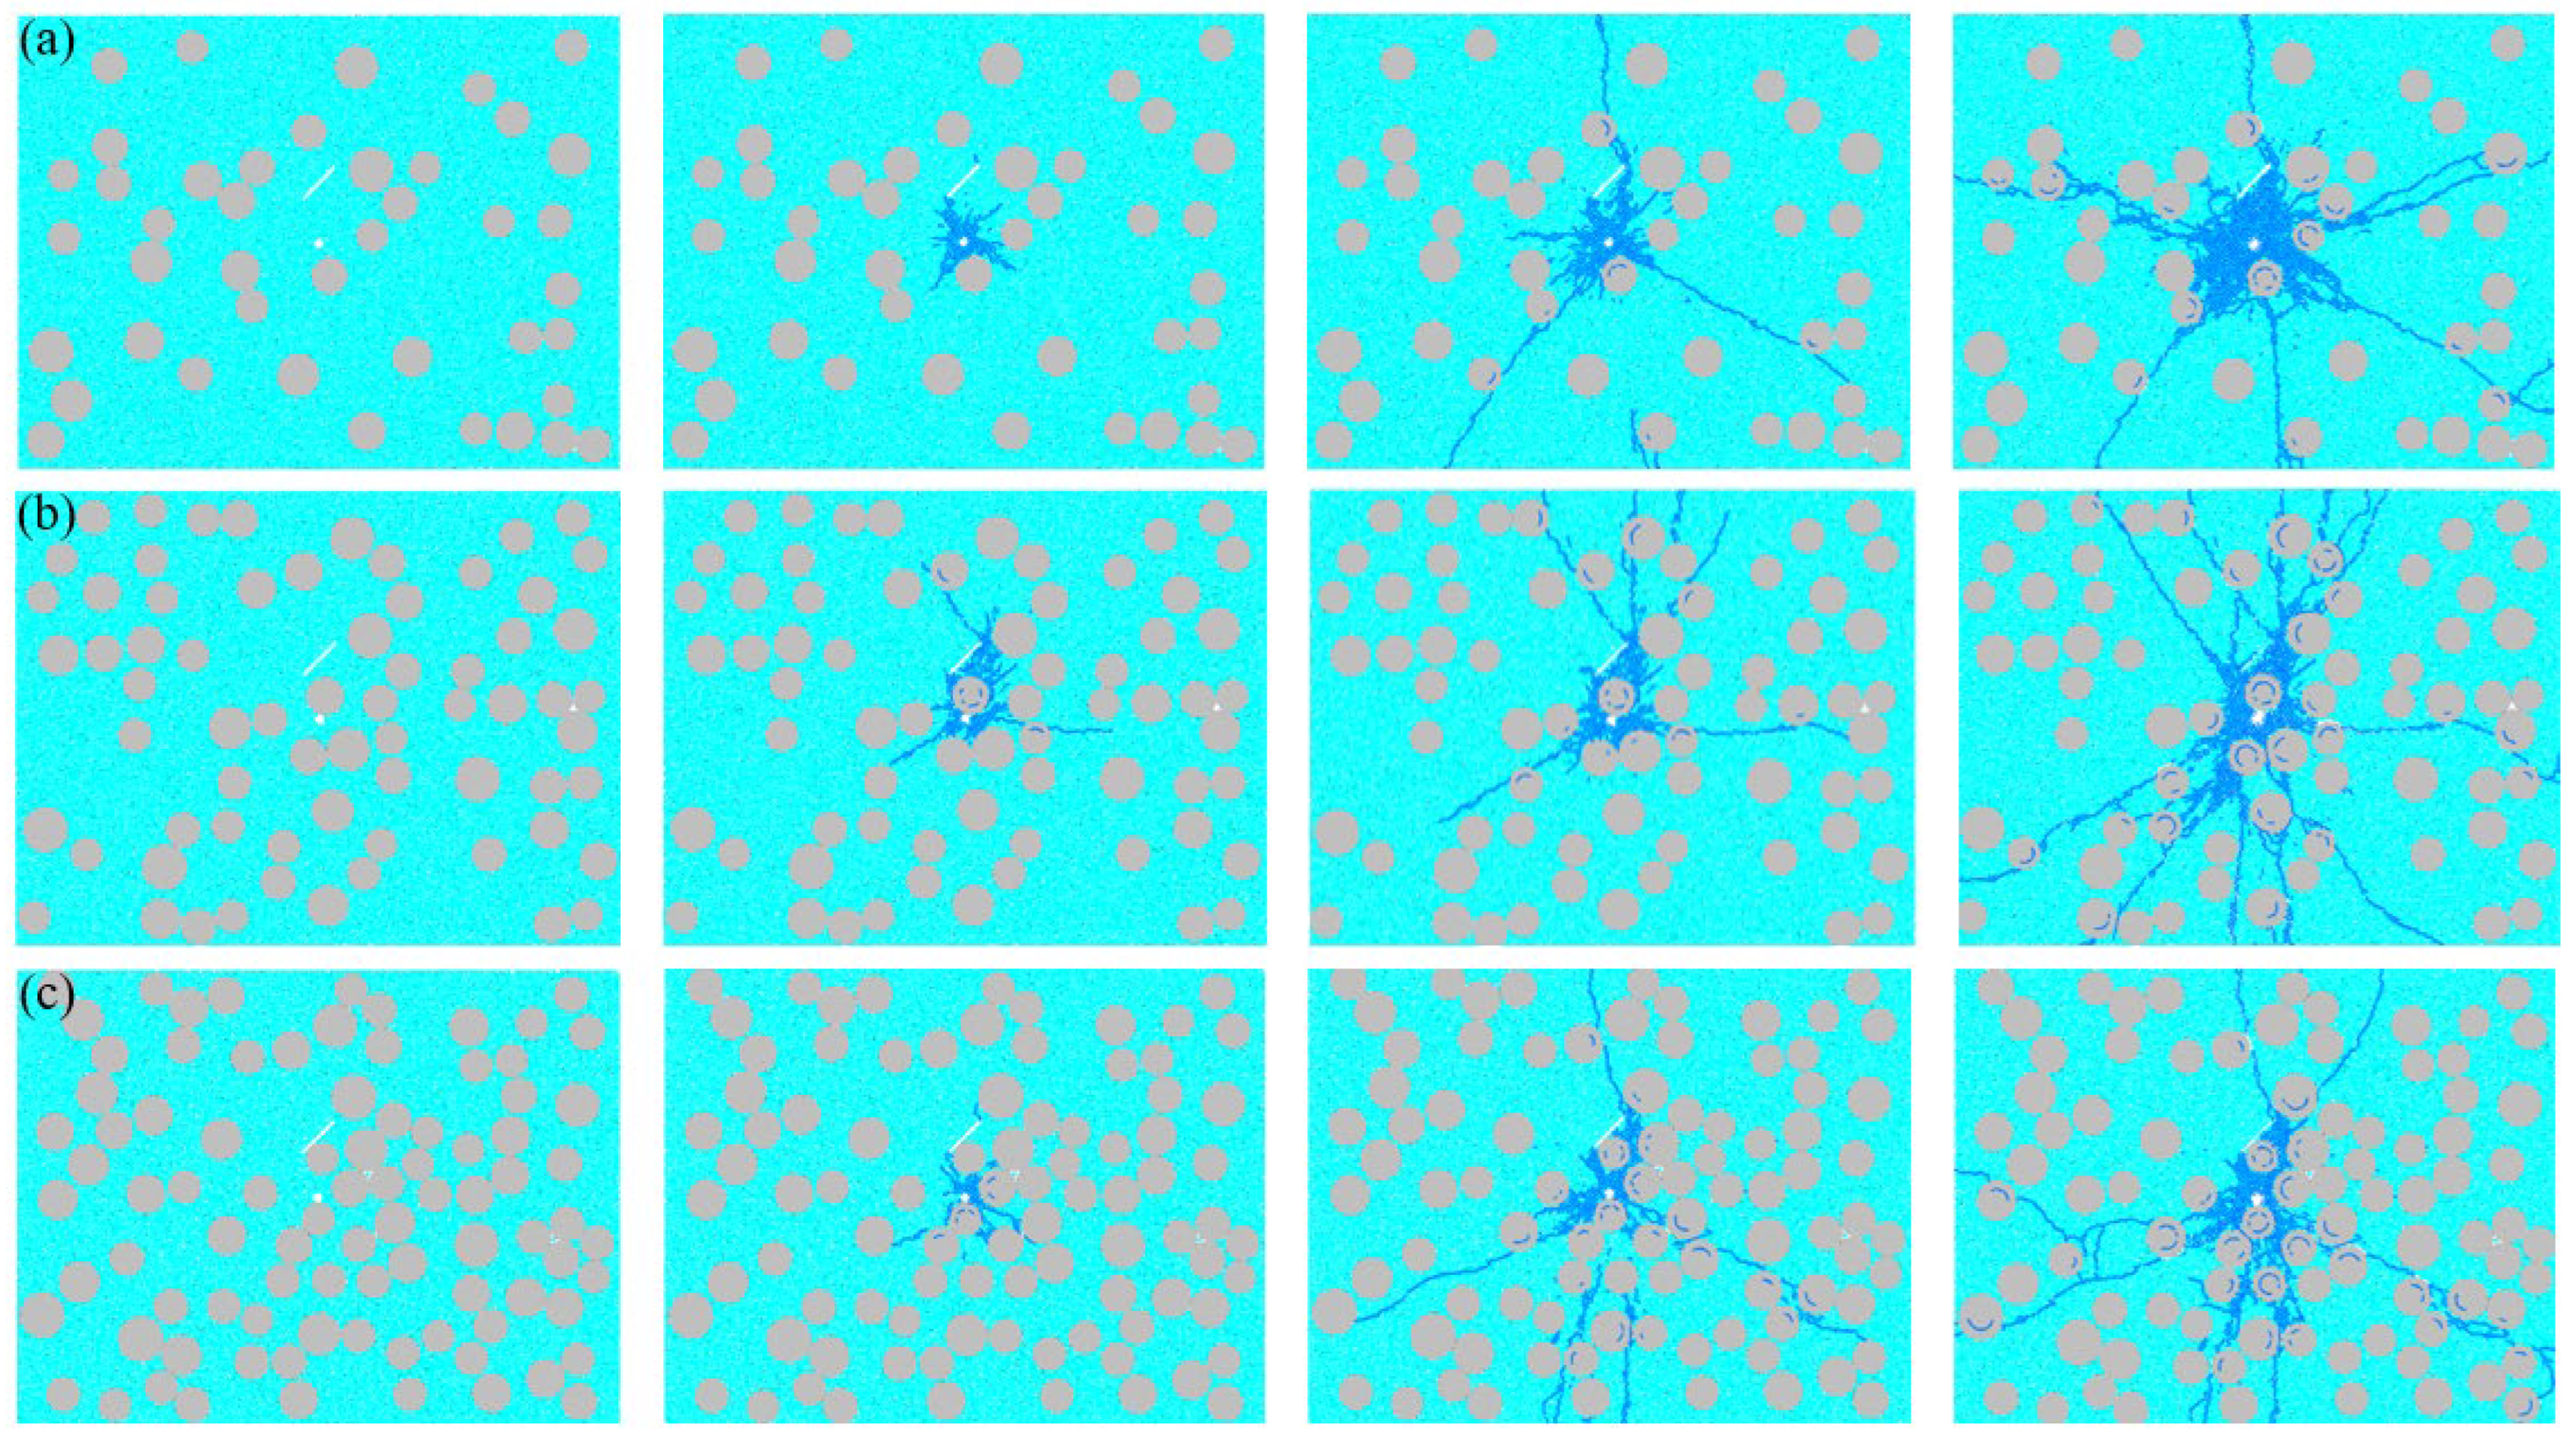
4.3. The Influence of Different Aggregate Contents on the Evolution of Concrete Blasting Damage

Figure 8 illustrates the evolution process of blasting damage in mesoscopic concrete with different aggregate contents. It can be observed from the figure that initial damage occurs around the blast hole and the prefabricated fissure, and cracks first initiate at the right tip of the fissure. As the blasting stress wave is released, the damage breaks through the local area and expands toward the gaps between aggregates or along the transition layer, eventually forming a penetrating damage network. Moreover, the higher the aggregate content, the more prominent the influence of aggregate layout on the damage morphology at each stage, and the more obvious the randomness of damage development. In conclusion, the higher the aggregate content, the more complex the evolution of concrete blasting damage, and the more significant the “obstruction-guidance” effect of aggregates on damage propagation. The damage morphology is greatly affected by the aggregate distribution. When the aggregate content is low, the damage expands relatively smoothly. When the aggregate content is high, the expansion is more tortuous.

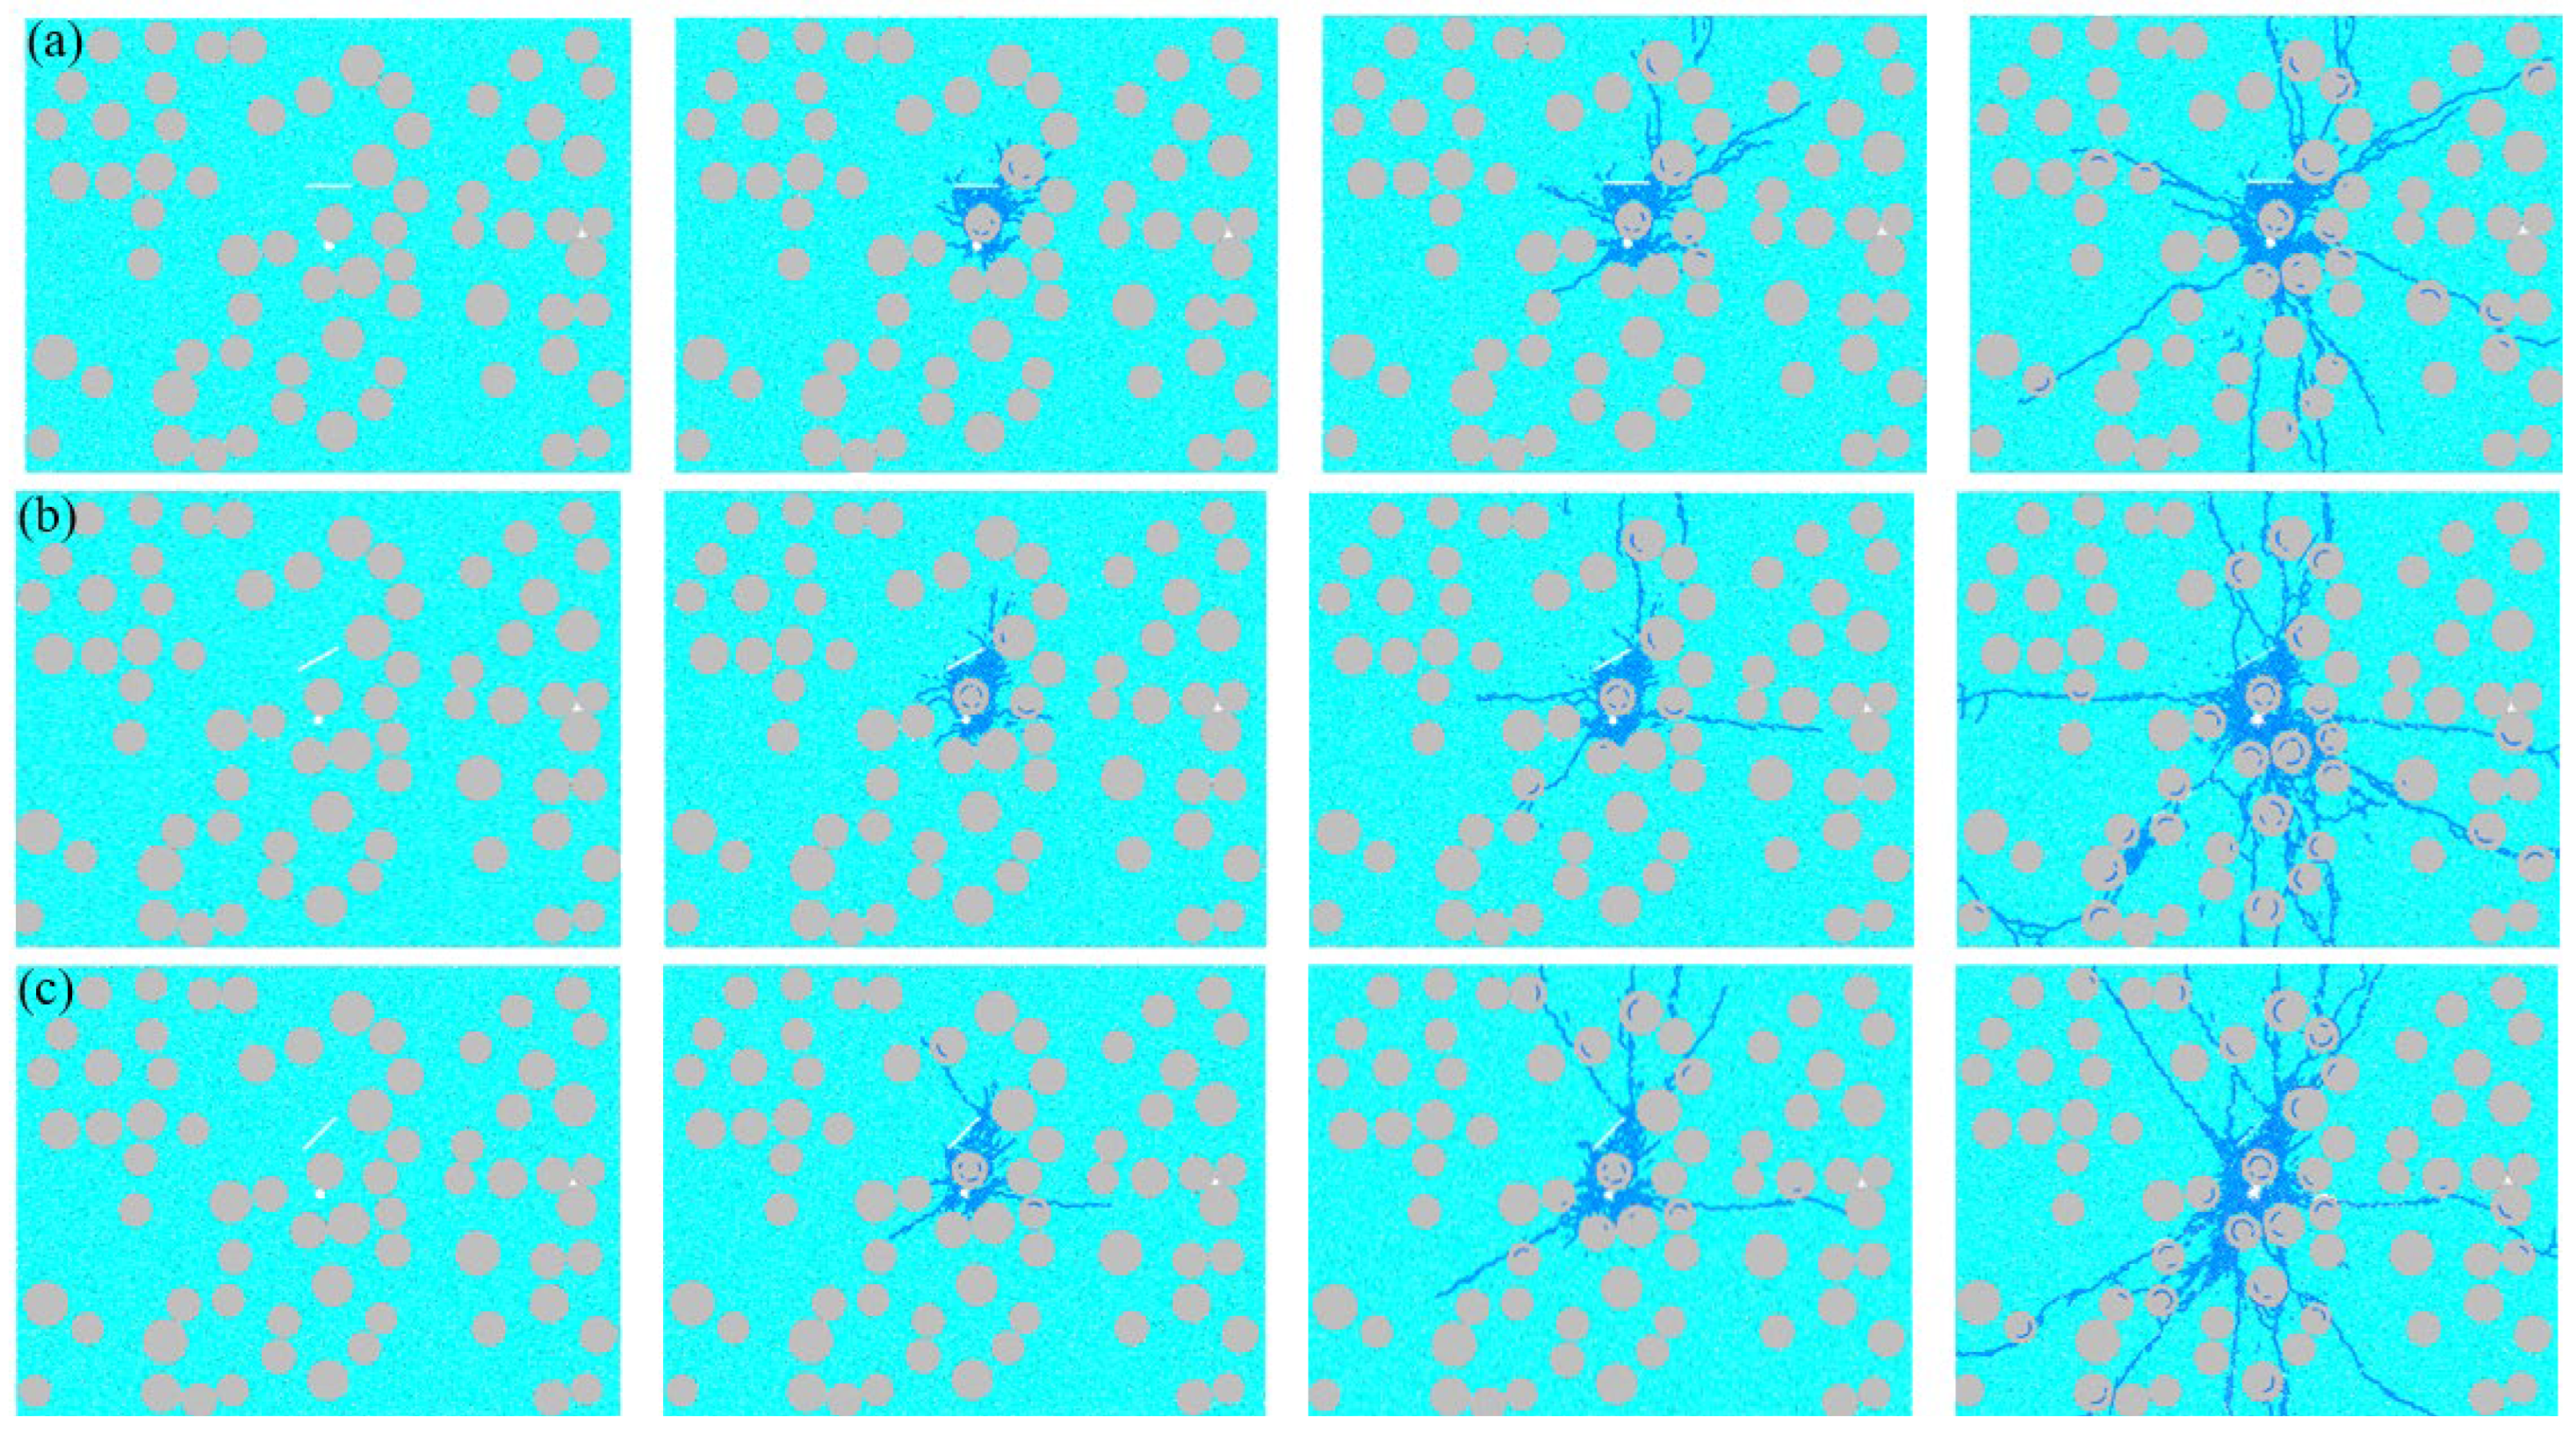
4.4. The Influence of Different Fissure Inclination Angles on the Evolution of Concrete Blasting Damage

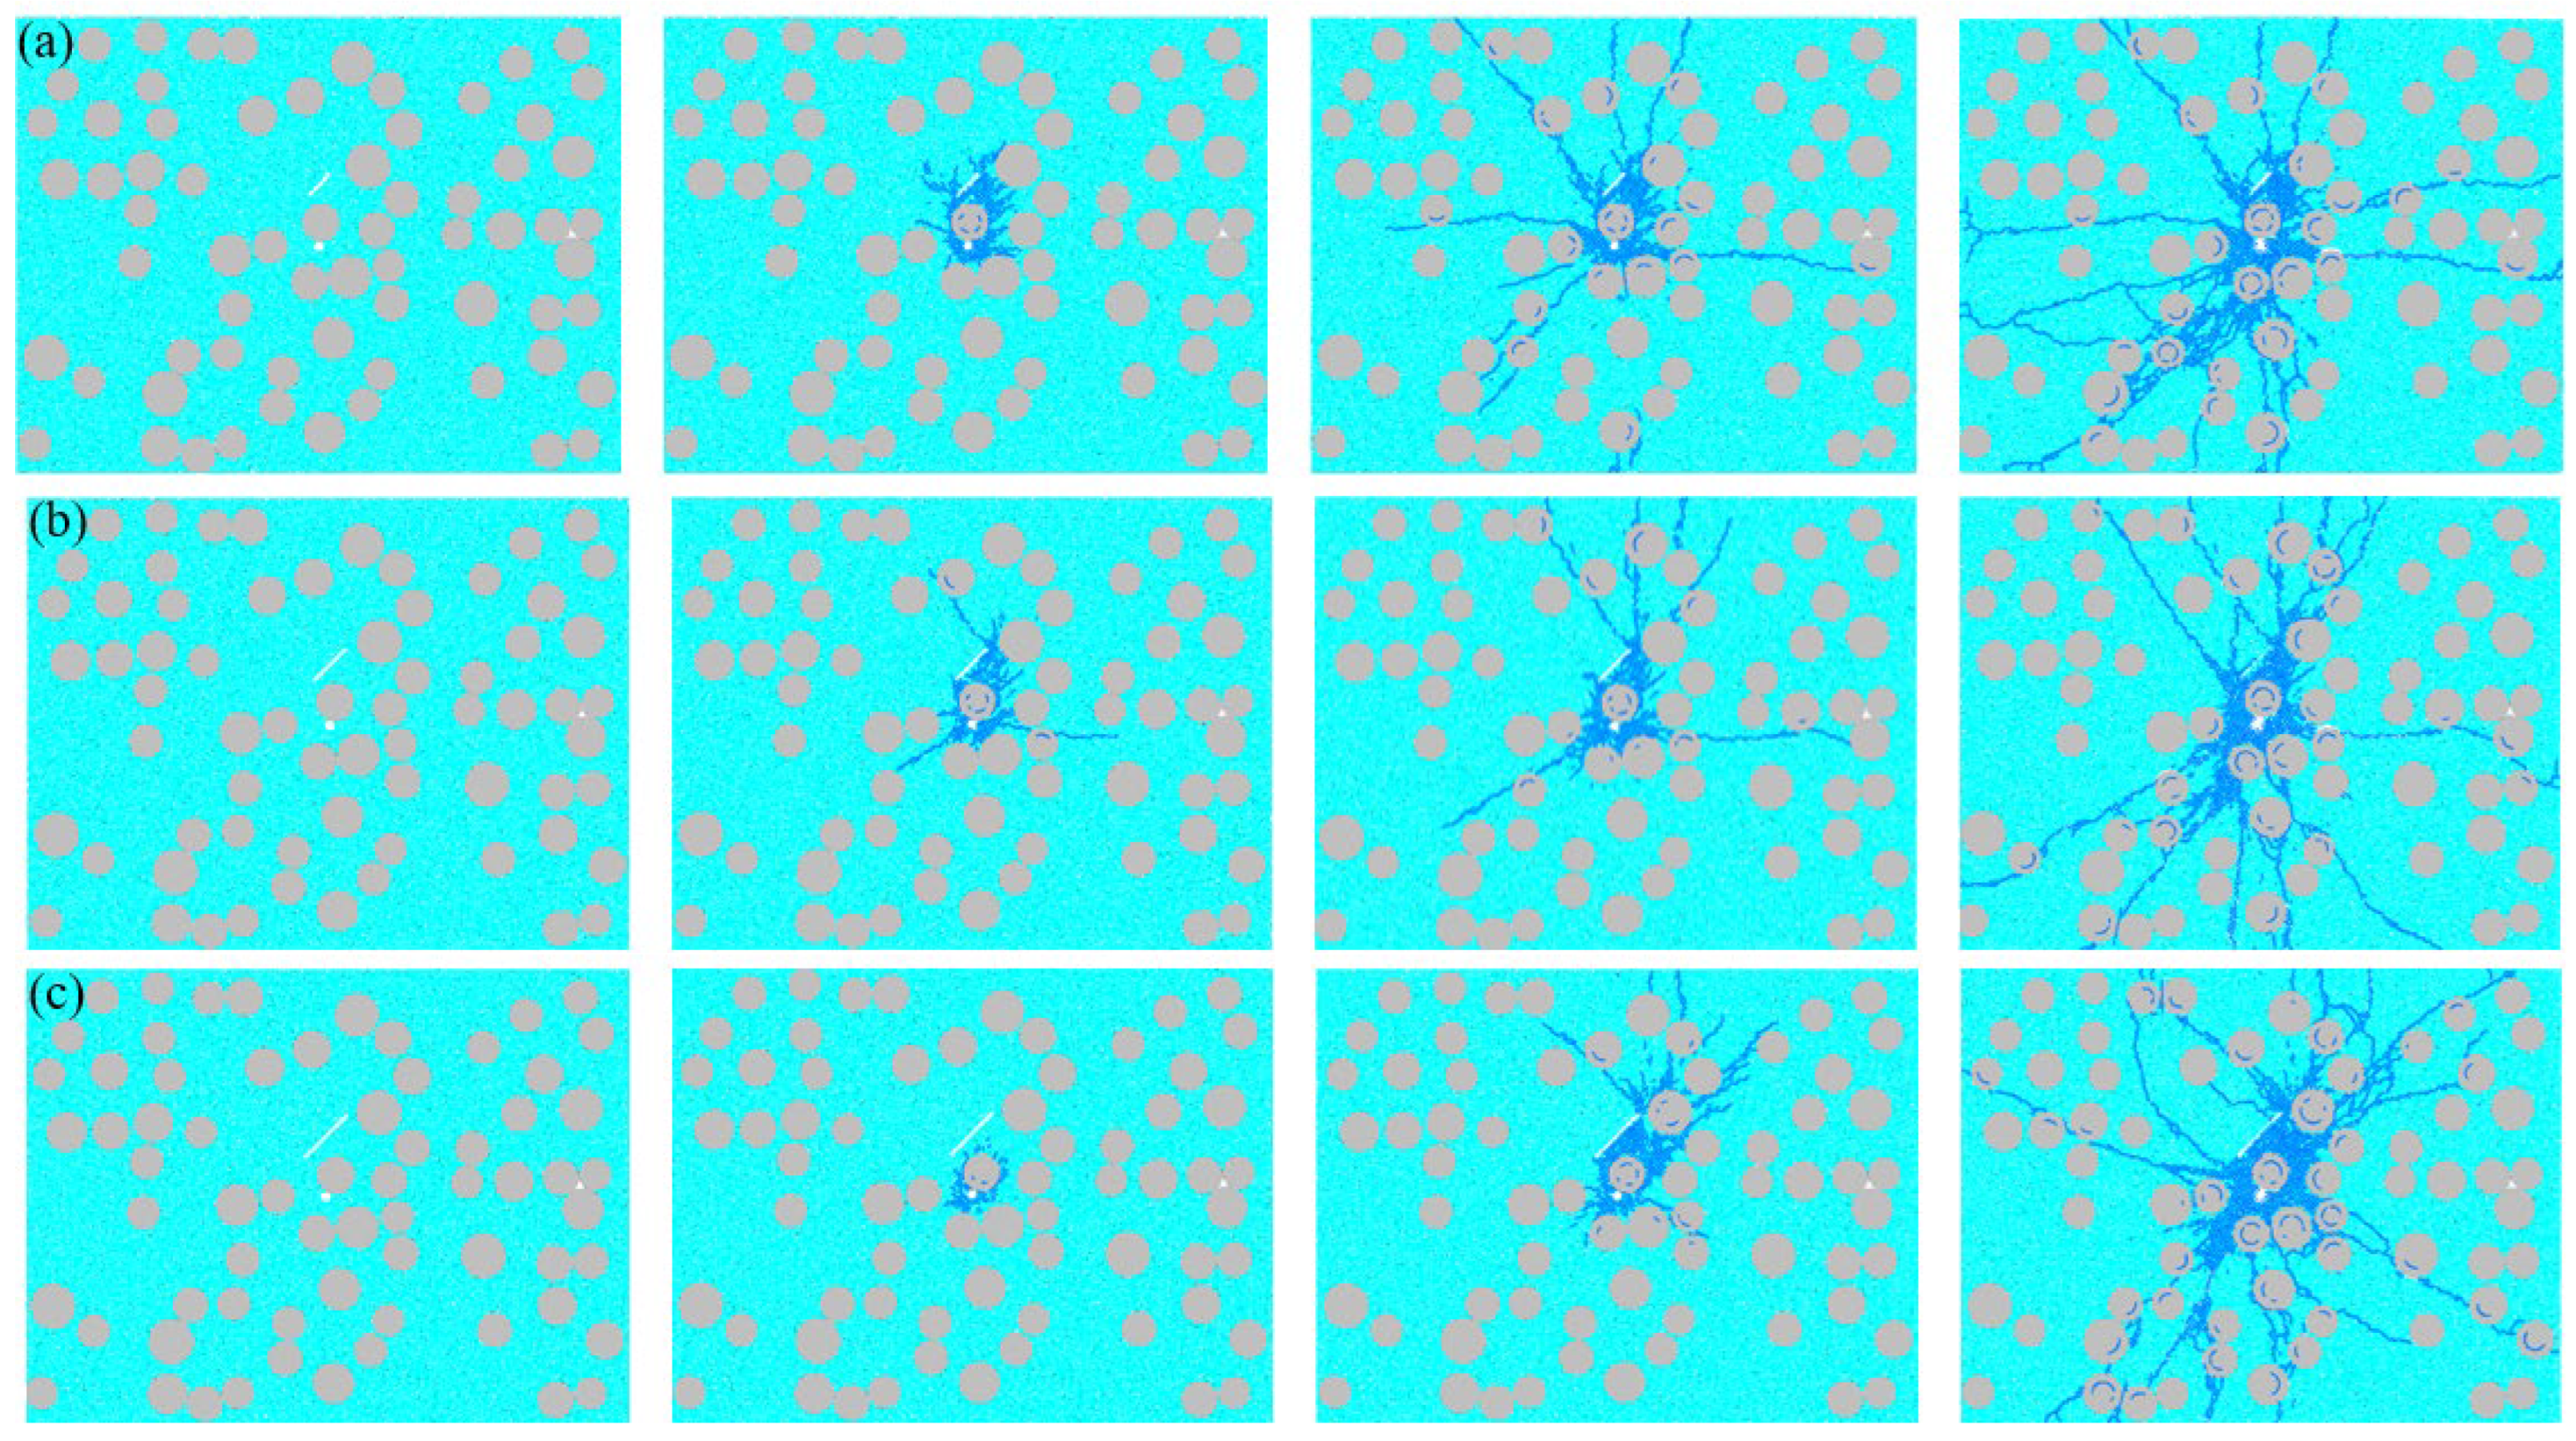
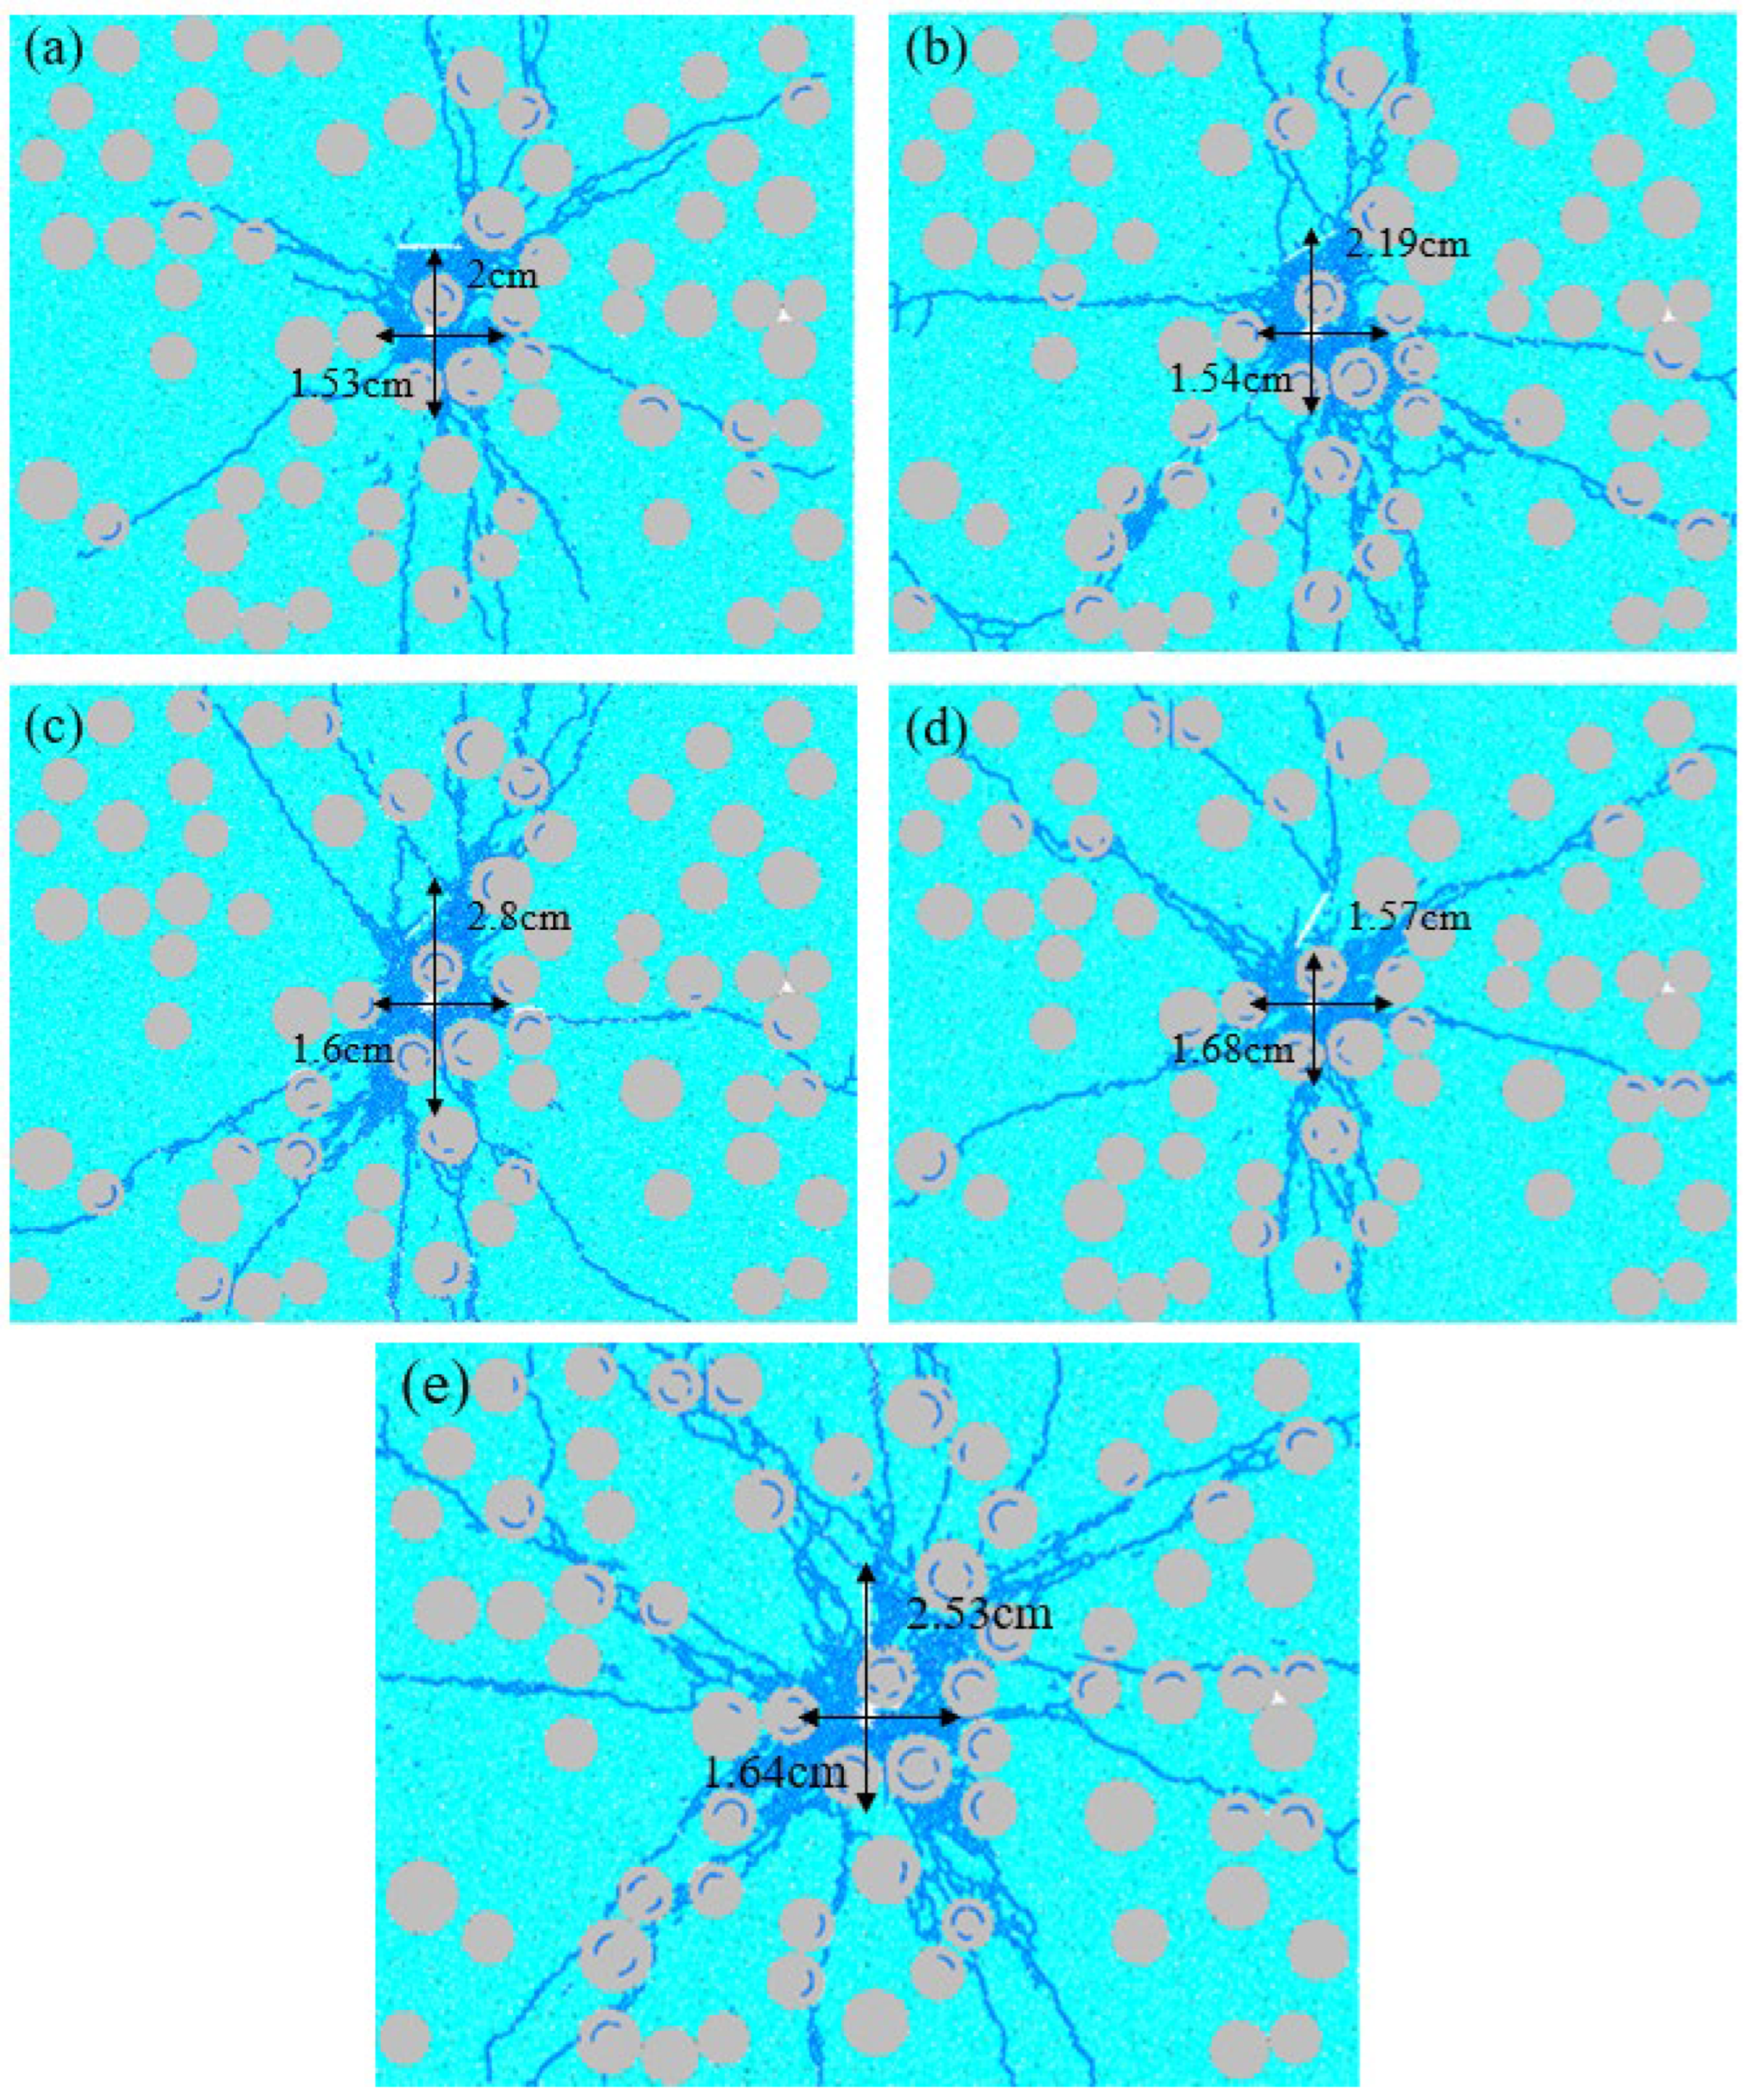
Figure 9 shows the evolution process of blasting damage in mesoscopic concrete with different fissure inclination angles. It can be seen from the figure that at 0° (horizontal fissure), cracks expand uniformly around the blast hole and the fracture has a relatively weak guiding effect on damage. The morphology of the damaged area is more similar to a divergent pattern centered on the blast hole. At 30–60° (inclined fissures), damage shows an obvious tendency to expand along the direction of the fissure, and the fissure becomes a preferential channel for damage development. As the inclination angle changes, the “bias” of the damage path alters. For example, at 45°, the oblique expansion of damage along the fissure is more prominent. This is because the inclined fissure forms a specific angle with the propagation direction of the blasting stress wave, guiding damage cracks to develop along the fissure surface. At 90° (vertical fracture), damage develops both along the direction of the vertical fissure (vertical direction) and the horizontal direction. The fissure acts as a vertical guiding zone, making the vertical expansion of damage more obvious, forming a morphology that extends upward and downward along the fissure and spreads to the surrounding area. In general, the fissure inclination angle significantly affects the development direction, range, and degree of blasting damage in mesoscopic concrete by guiding the propagation paths of blasting stress waves and crack expansion, showing the characteristic of a damage evolution law that differs with changes in inclination angle.

4.5. The Influence of Different Fissure Lengths on the Evolution of Concrete Blasting Damage

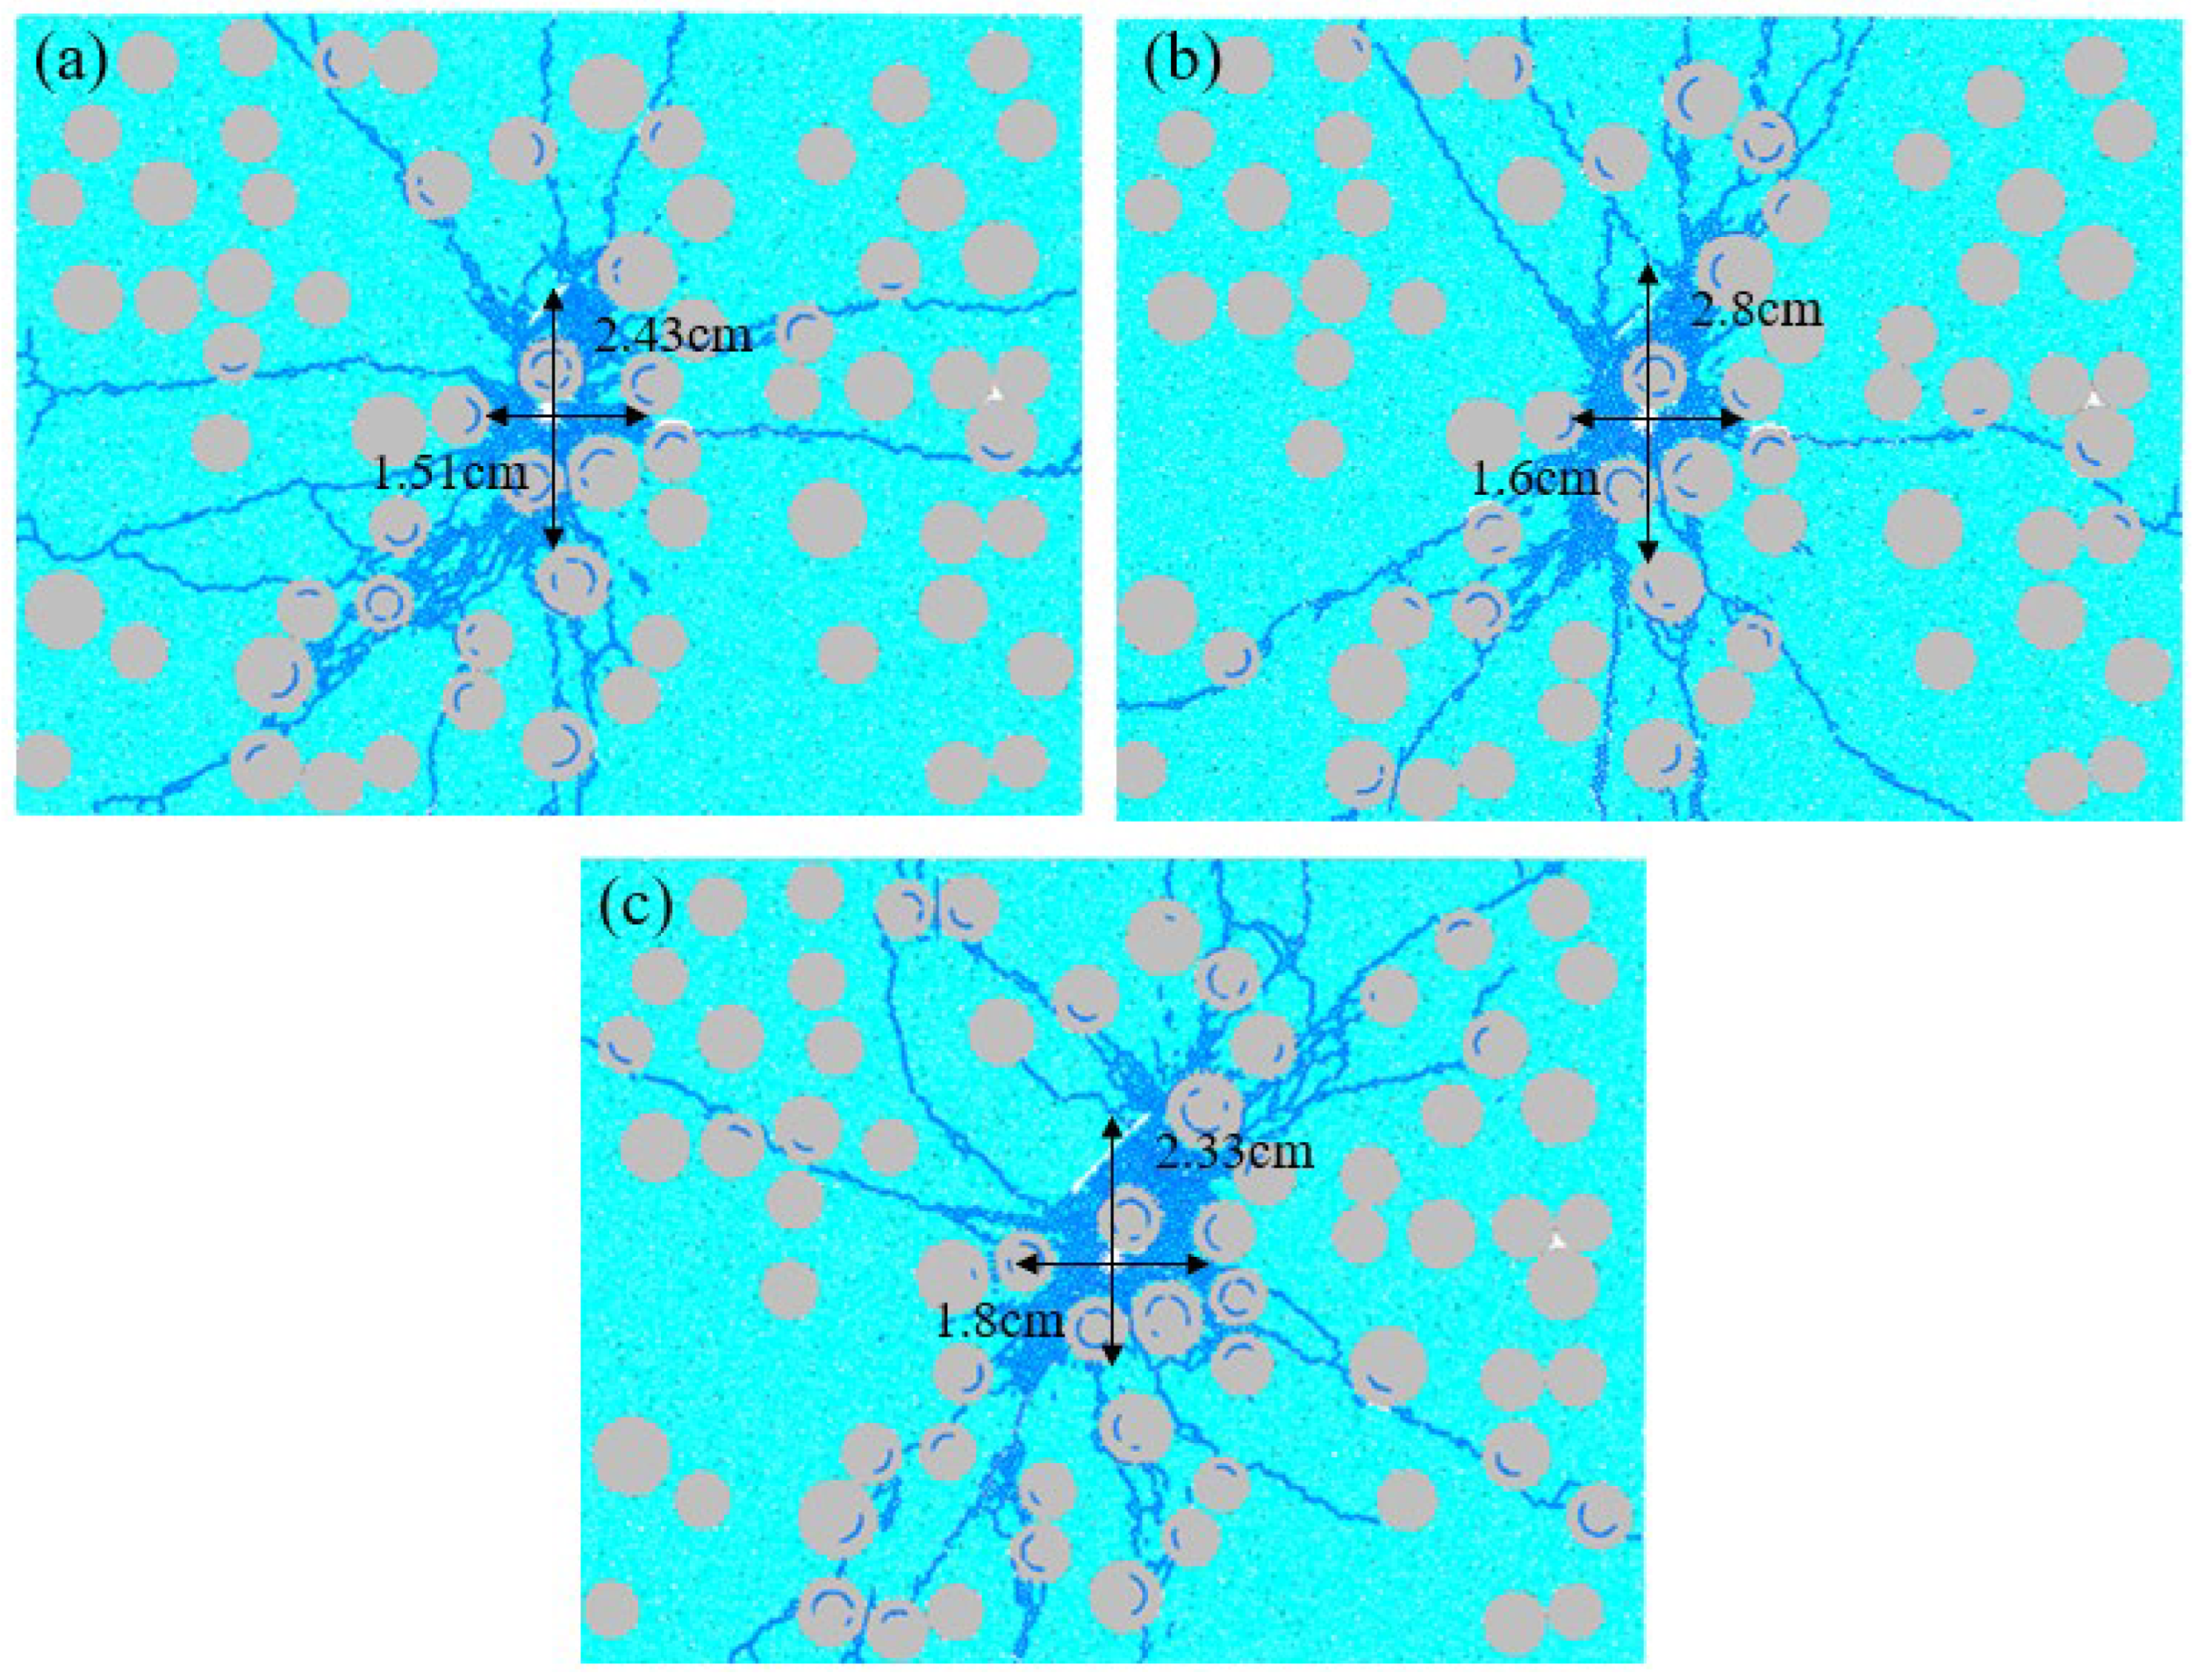
Figure 10 illustrates the evolution process of blasting damage in mesoscopic concrete with different fissure lengths. It can be observed from the figure that in the initial stage of blasting, damage initiates near the blast hole and at the tips of the prefabricated fissure. As the blasting proceeds, the longer the prefabricated fissure, the more the damage morphology tends to expand along the direction of the fissure, resulting in more cracks generated above the blast hole in the model. In general, during the evolution of blasting damage in mesoscopic concrete, the longer the prefabricated fissure, the more easily the blasting damage expands along the direction of the fissure, the larger the damage range, and the higher the degree of damage to the mesoscopic structure of concrete.

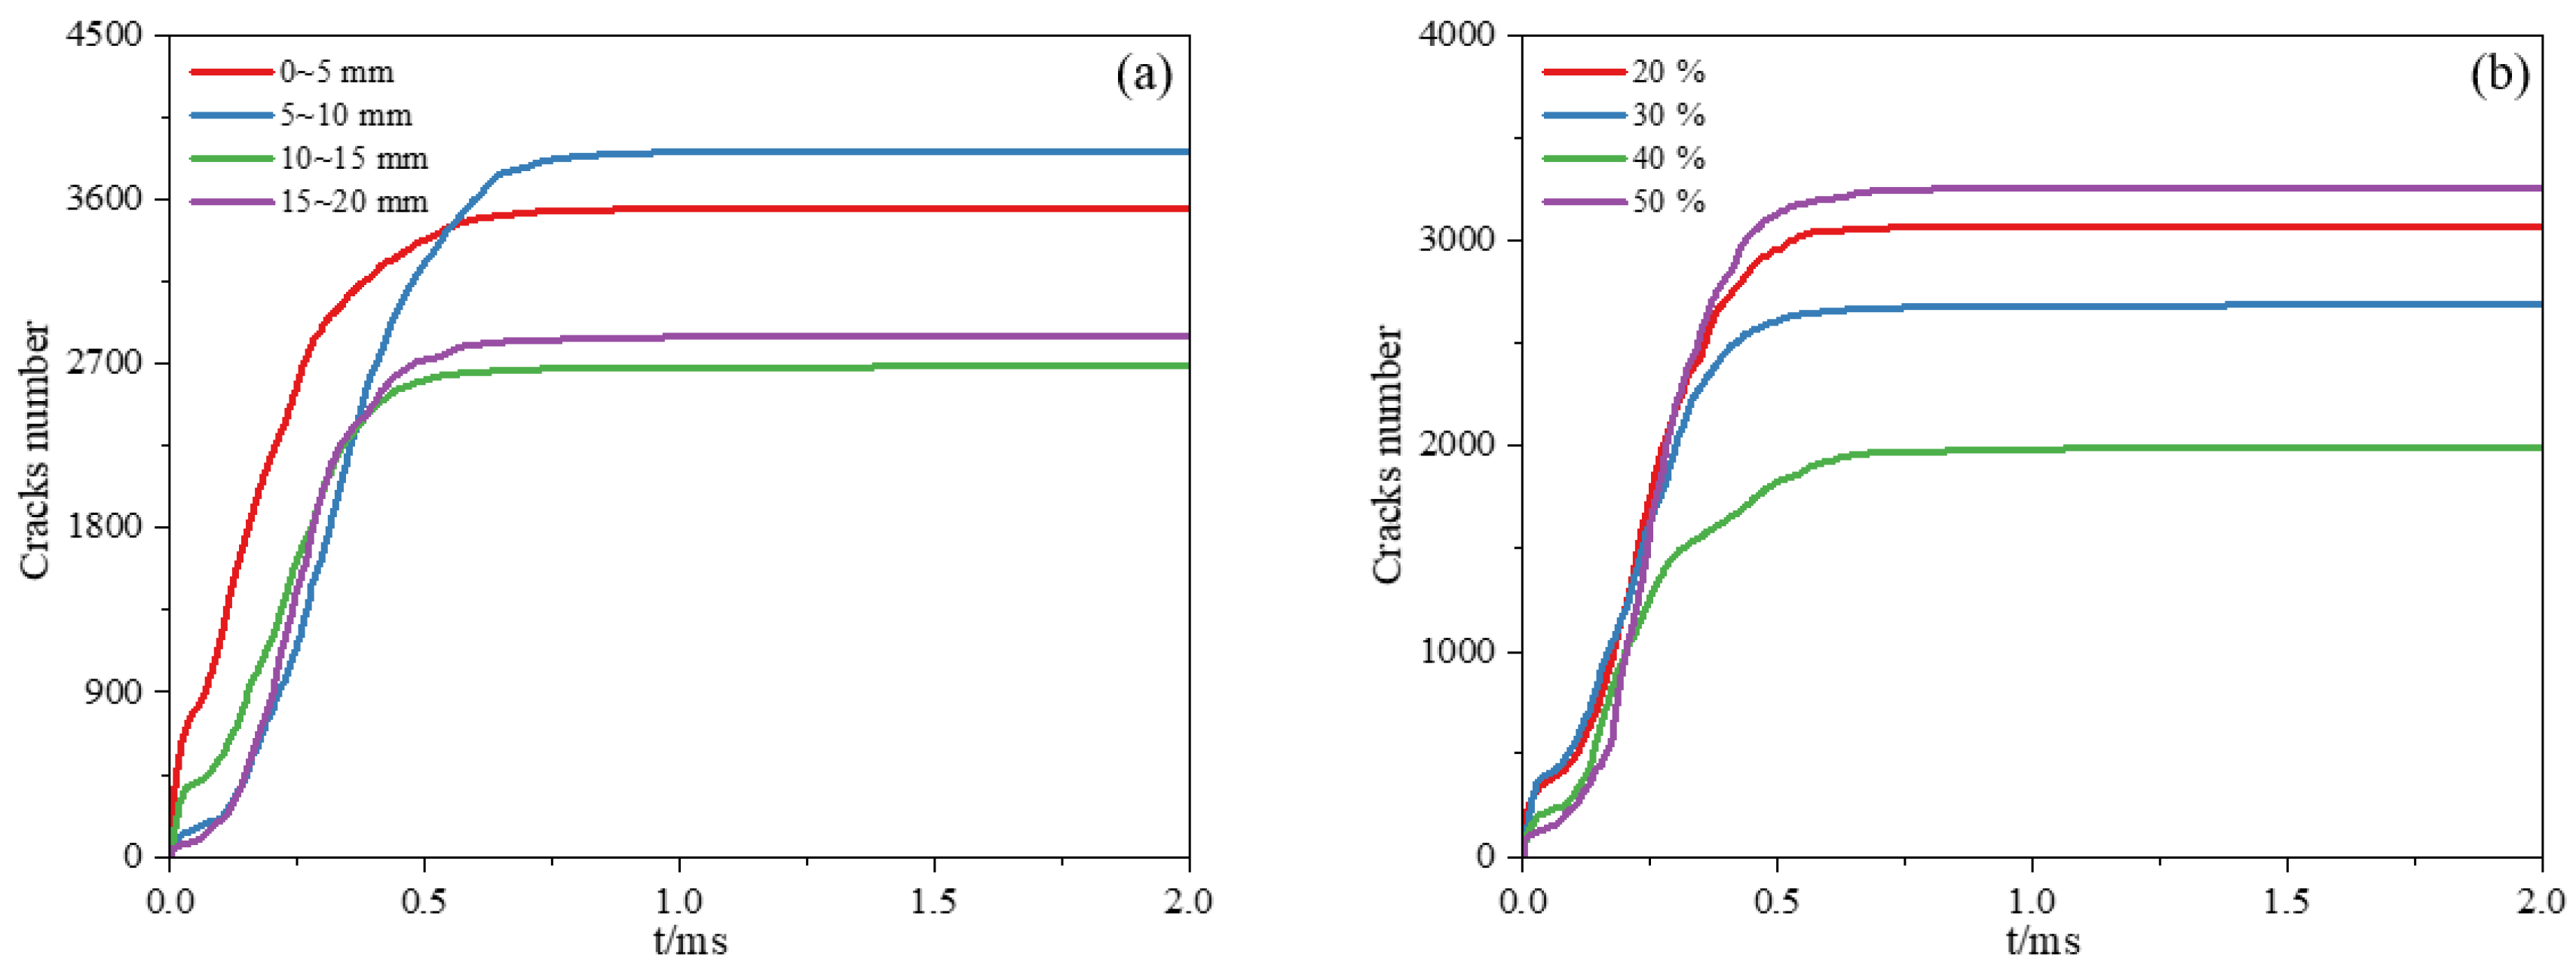
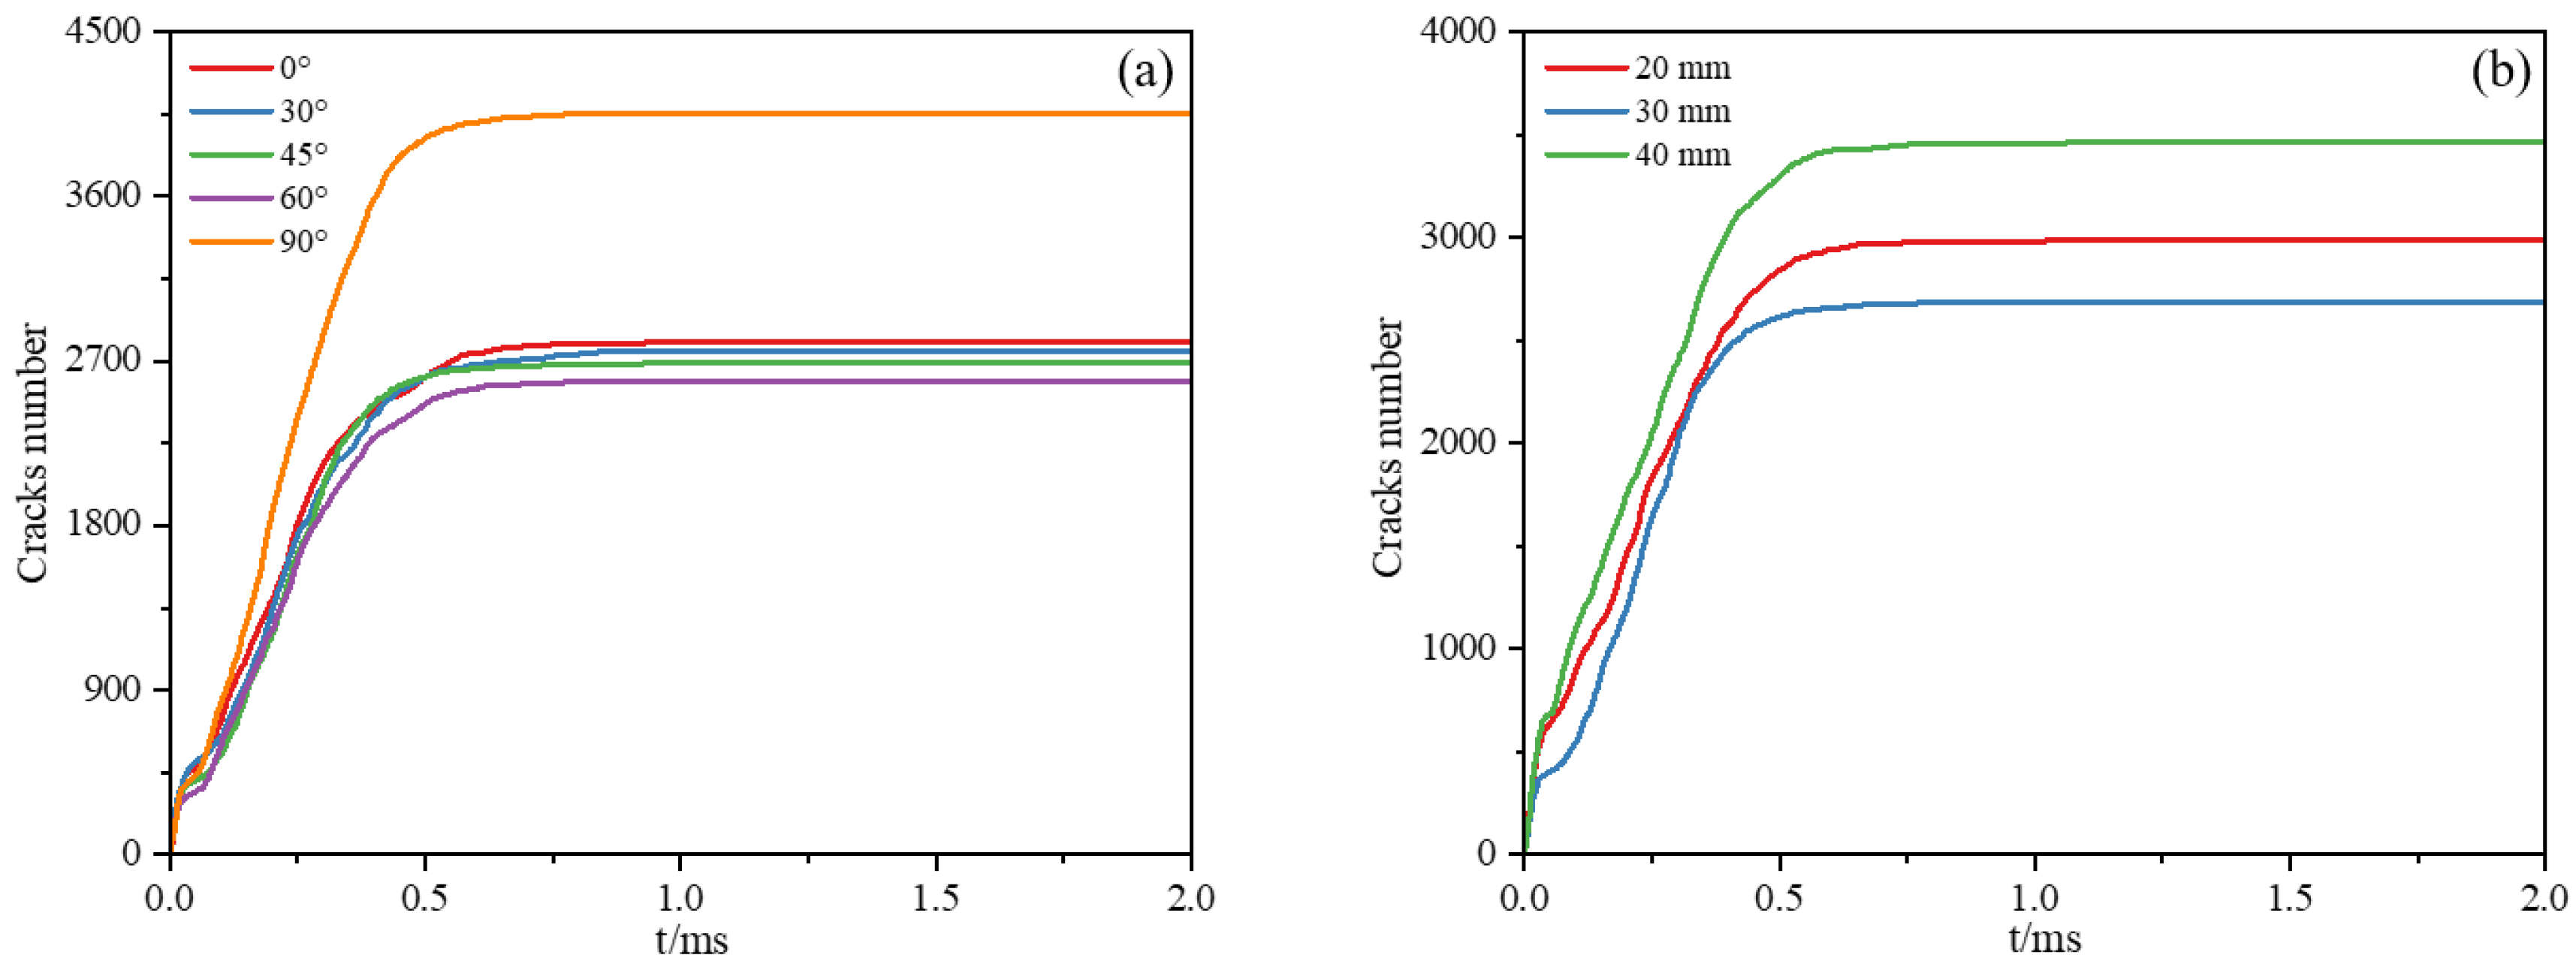
4.6. Counting Rules of Concrete Blasting Damage Under Different Influencing Factors

Figure 11 and Figure 12 present the laws of blasting damage with different meso-structural parameters of concrete and different macroscopic prefabricated fissure parameters of concrete. It can be observed from Figure 11a that the concrete model with a particle size of 0~5 mm generates the largest number of cracks in the early stage of blasting, and the growth slope of the corresponding curve is relatively large. This indicates that in this stage, the internal damage initiation and development rate of concrete with small-sized aggregates is faster. Due to the denser distribution of small-sized aggregates, stress concentration easily triggers the rapid generation of microcracks. In the later stage of damage, the growth rates of the curves for each particle size distribution slow down and gradually stabilize. Among them, the damage count of concrete with a particle size distribution of 5~10 mm finally reaches the highest value, while that with a particle size distribution of 15~20 mm is the lowest. This shows that concrete configured with small-sized (5~10 mm) aggregates undergoes more severe damage development within this loading period, resulting in a higher degree of concrete damage. However, the damage degree of concrete with large-sized aggregates is relatively low. This reflects that the aggregate particle size distribution affects the damage evolution process and final damage state by changing the internal mesoscopic stress transmission and concentration modes.
It can be observed from Figure 11b that in the early stage of blasting, the damage counts of concrete with different aggregate contents all rise rapidly, and the initial growth stages of each curve overlap to a high degree. This indicates that the influence of aggregate content on the initial stage of damage (microcrack initiation) is relatively insignificant. The initial internal defects of concrete and the initial action of stress waves dominate the initiation of damage, with aggregate content not yet a major influencing factor. As the blasting stress wave is released, when the aggregate content is 40%, the growth slope of the curve decreases to some extent and the damage amount is the smallest; the curve with a 50% aggregate content has the largest growth slope and the highest damage count. This may be because the aggregates in the concrete are densely distributed, the number of interfacial transition zones between aggregates and the mortar is large, and the stress concentration effect is significant, causing a large number of microcracks to initiate and expand at the interfaces, driving the rapid development of damage.
It can be observed from Figure 12a that in the initial stage of crack propagation, the number of cracks in the model with a 90° fissure increases the fastest, significantly quicker than the other models. The initial growth stages of the curves for 0°~60° overlap highly, and when the damage stabilizes, the number of cracks is roughly similar. This indicates that when the fissure is at 90°, the damage development of the concrete model is fast and the final damage degree is high.
It can be observed from Figure 12b that in the early stage of blasting, when the fissure length is 40 mm, the growth rate of the number of cracks is the fastest and the increment is the most significant. As the blasting stress wave is released, the number of cracks in the models enters a stable stage. When stable, the law of the number of cracks is 40 mm > 20 mm > 30 mm. This indicates that the influence of fissure length on the evolution of concrete damage is not simply linearly related. This may be because the fissure length changes the complexity of the internal stress field distribution of concrete. Under the condition of a 30 mm fissure, the synergistic effect of stress concentration and dispersion inhibits the development of damage. However, for a 40 mm fissure, due to its larger initial defect, it accelerates the initiation and expansion of early damage, resulting in the highest cumulative damage degree. The damage degree of the 20 mm fissure is between the two. This reflects that the length of macroscopic prefabricated fissures affects the dynamic damage evolution of concrete by regulating the distribution of the stress field.

5. Discussion

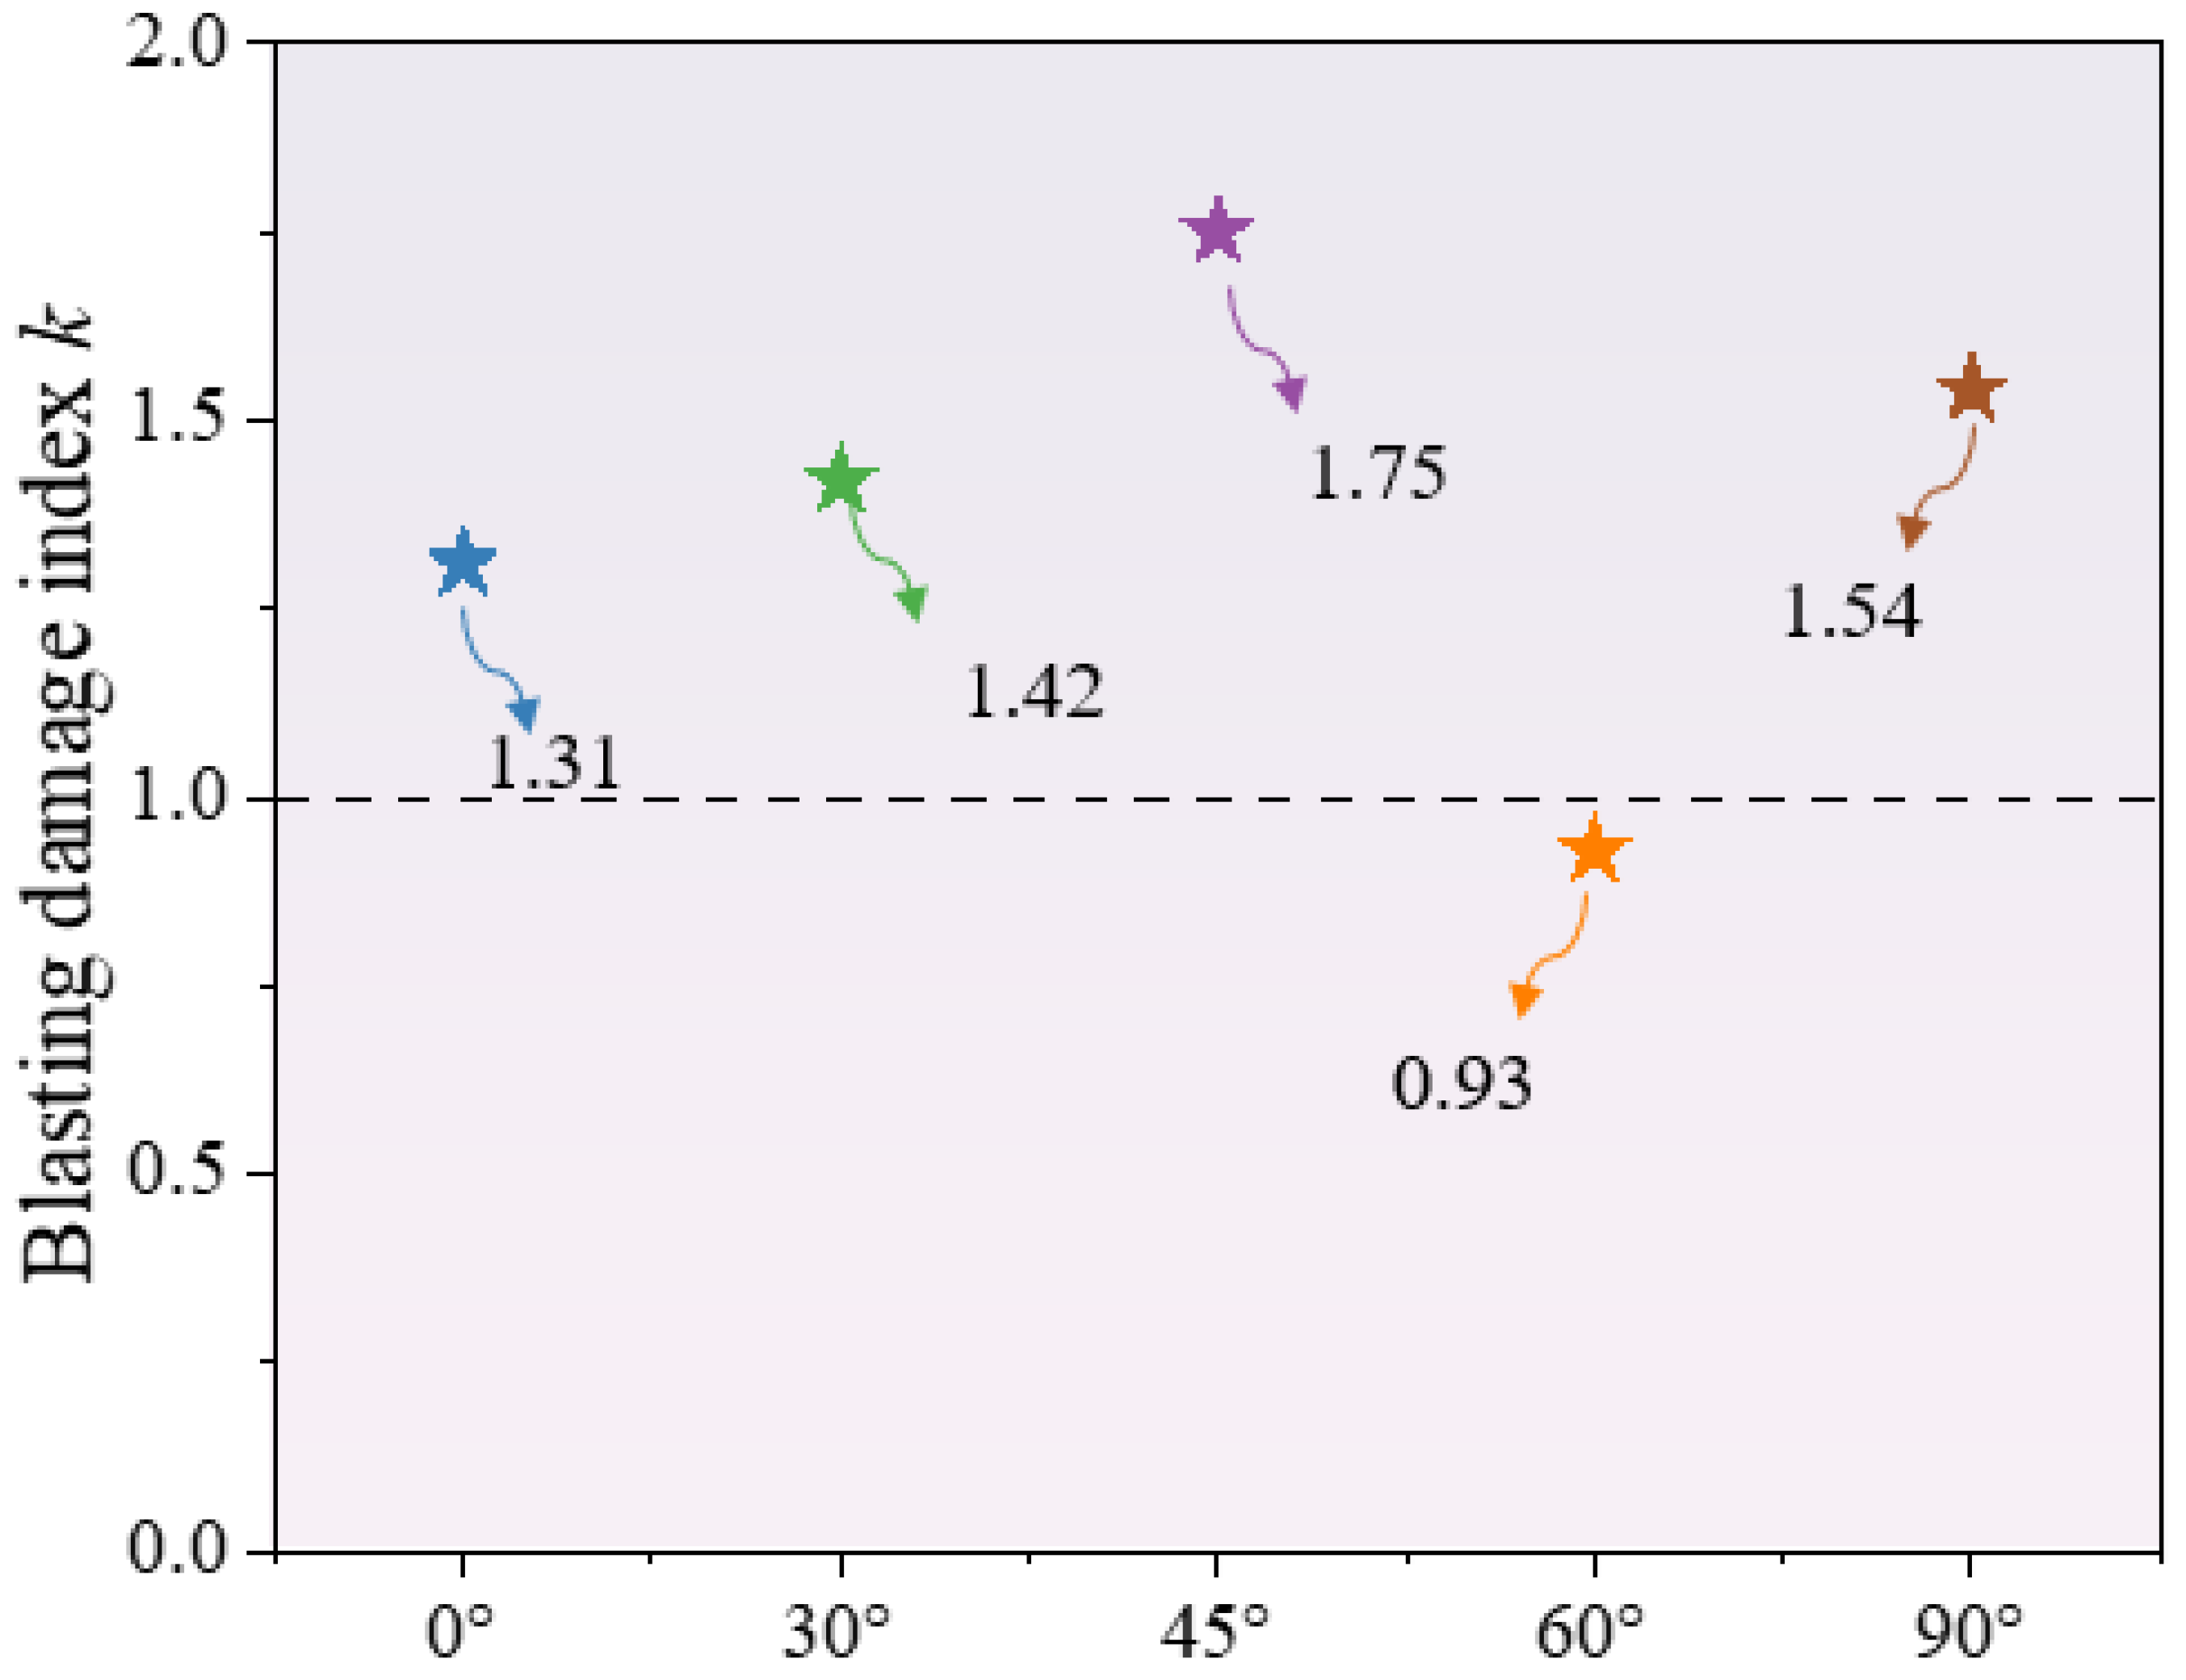
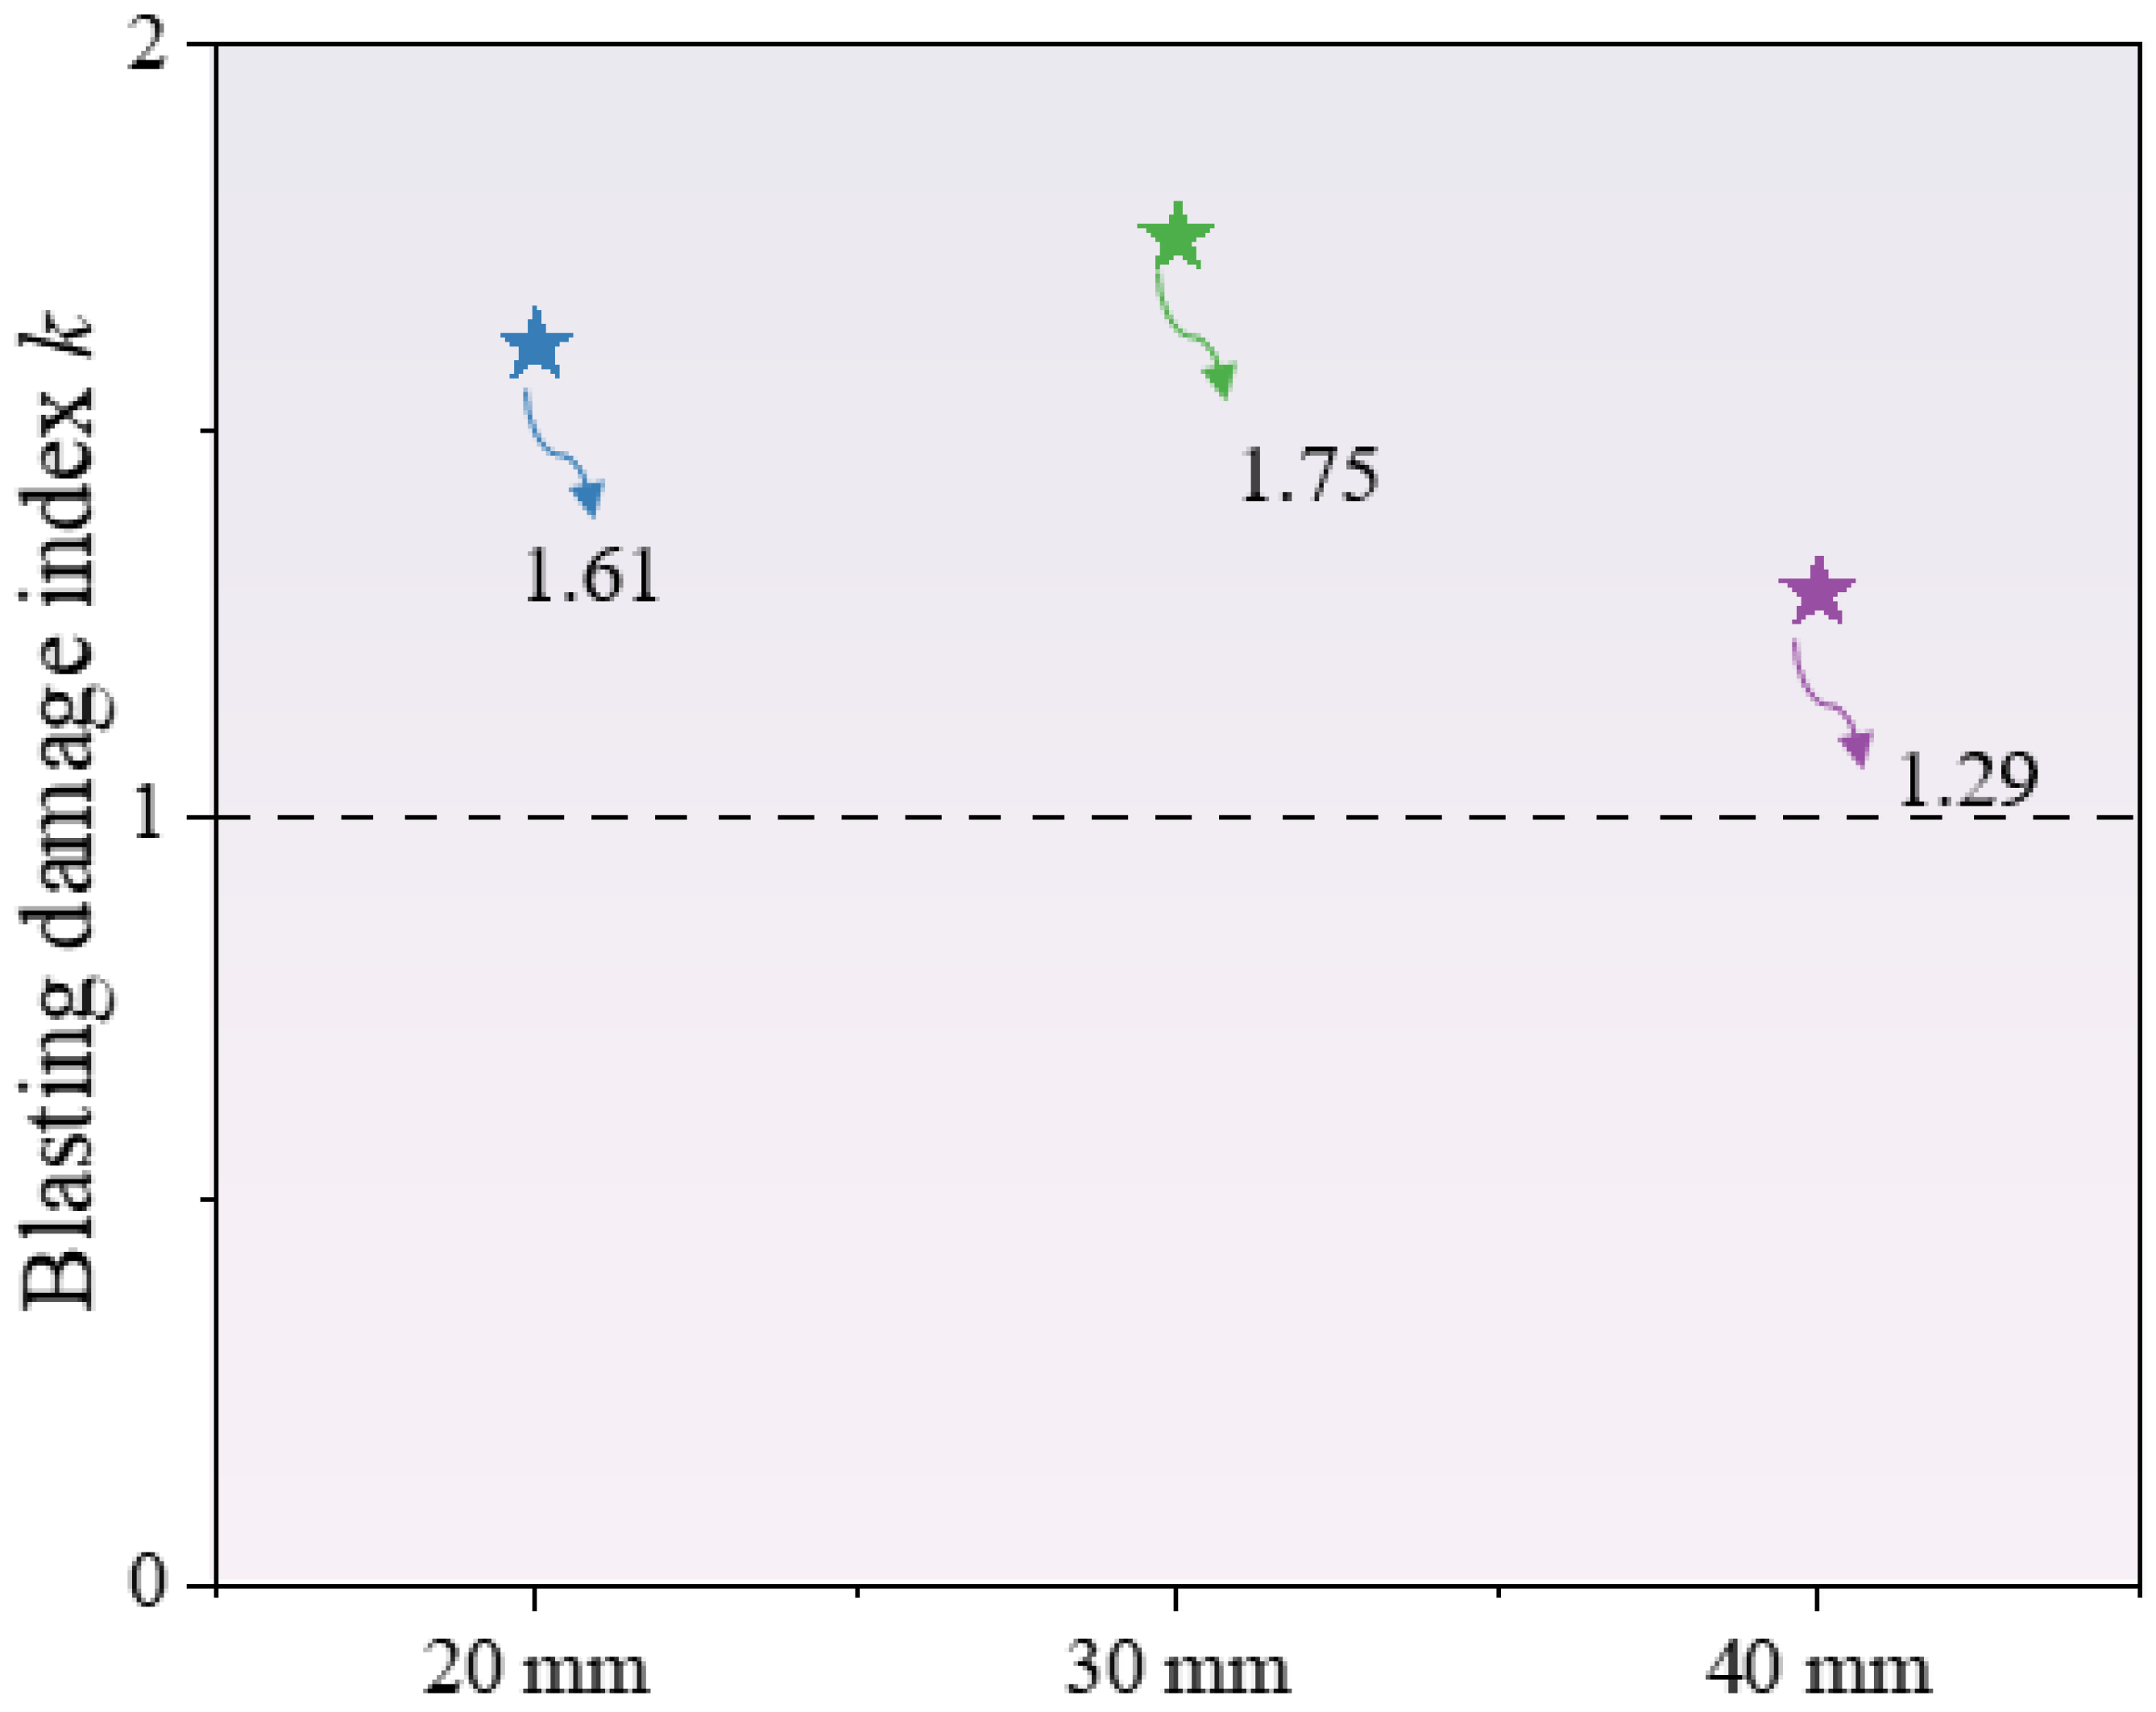
To further investigate the mechanism of action of different variables on the concrete blasting effect, the blasting damage index k is defined, as follows, based on the blasting damage range around the blast hole (main damaged area):
k = h l
where h represents the main height of the blasting damage range and l represents the main length of the blasting damage range.

5.1. Analysis of Concrete Blasting Damage Index Under Different Particle Size Distributions

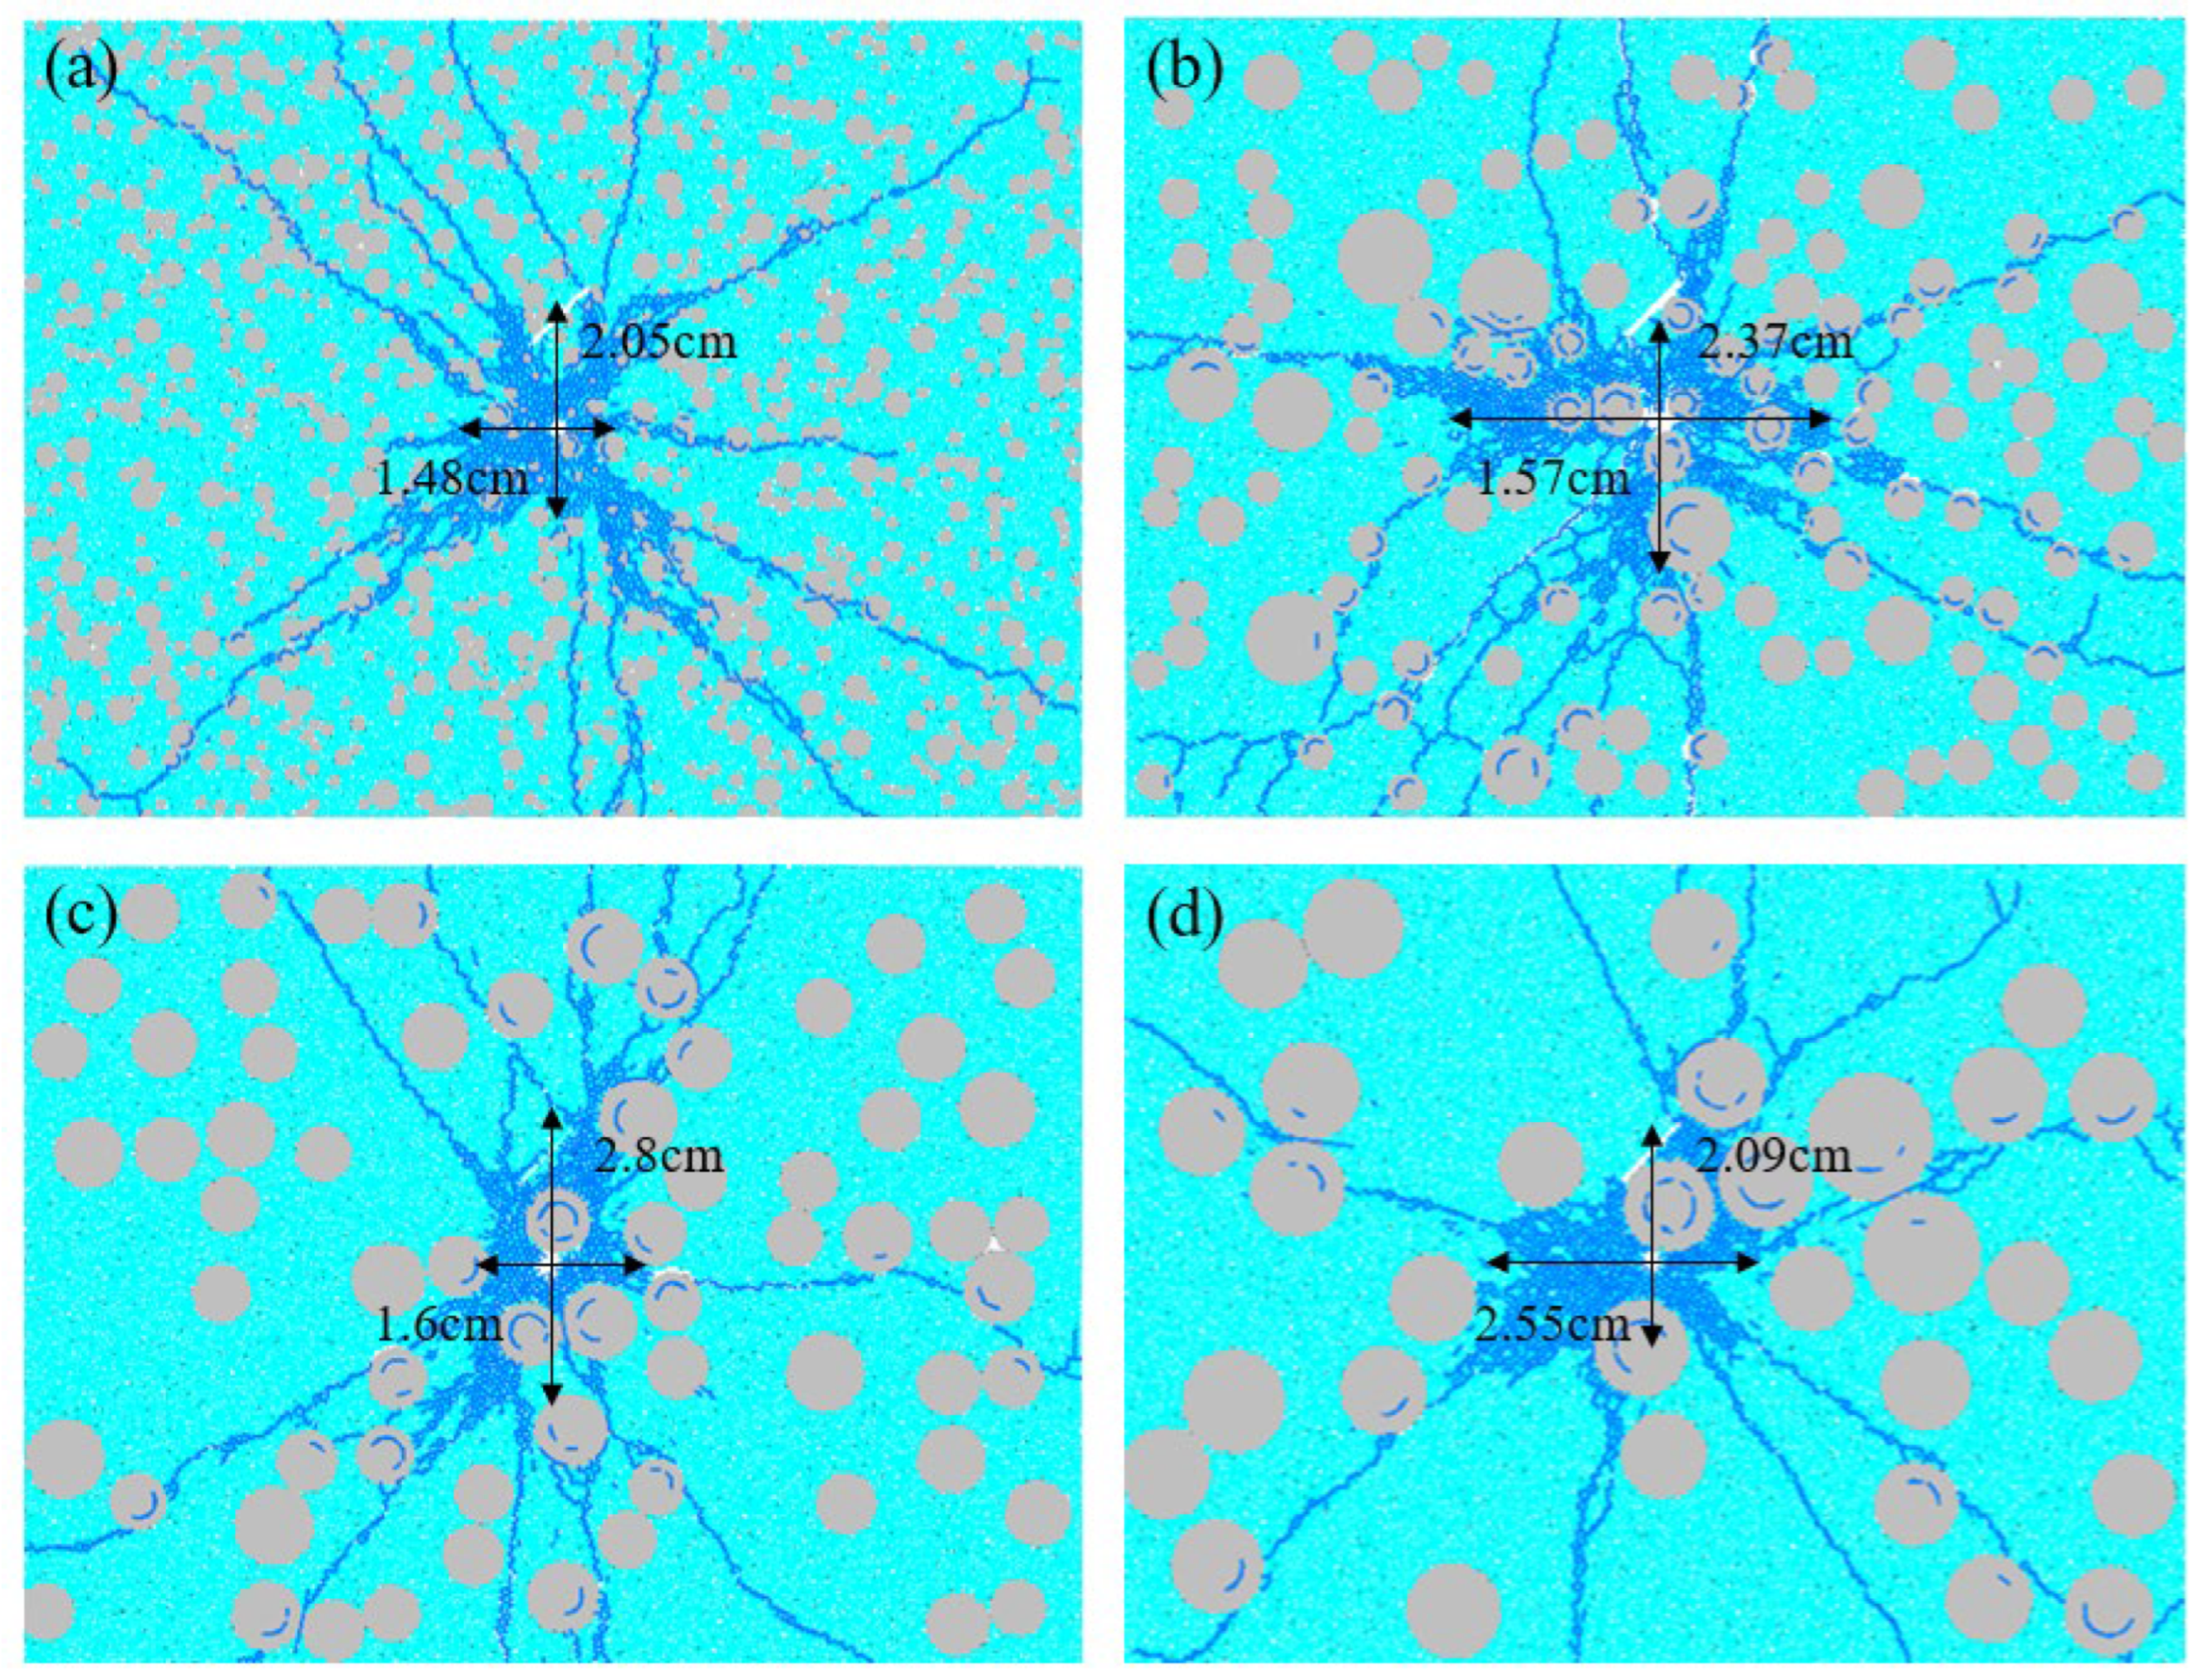
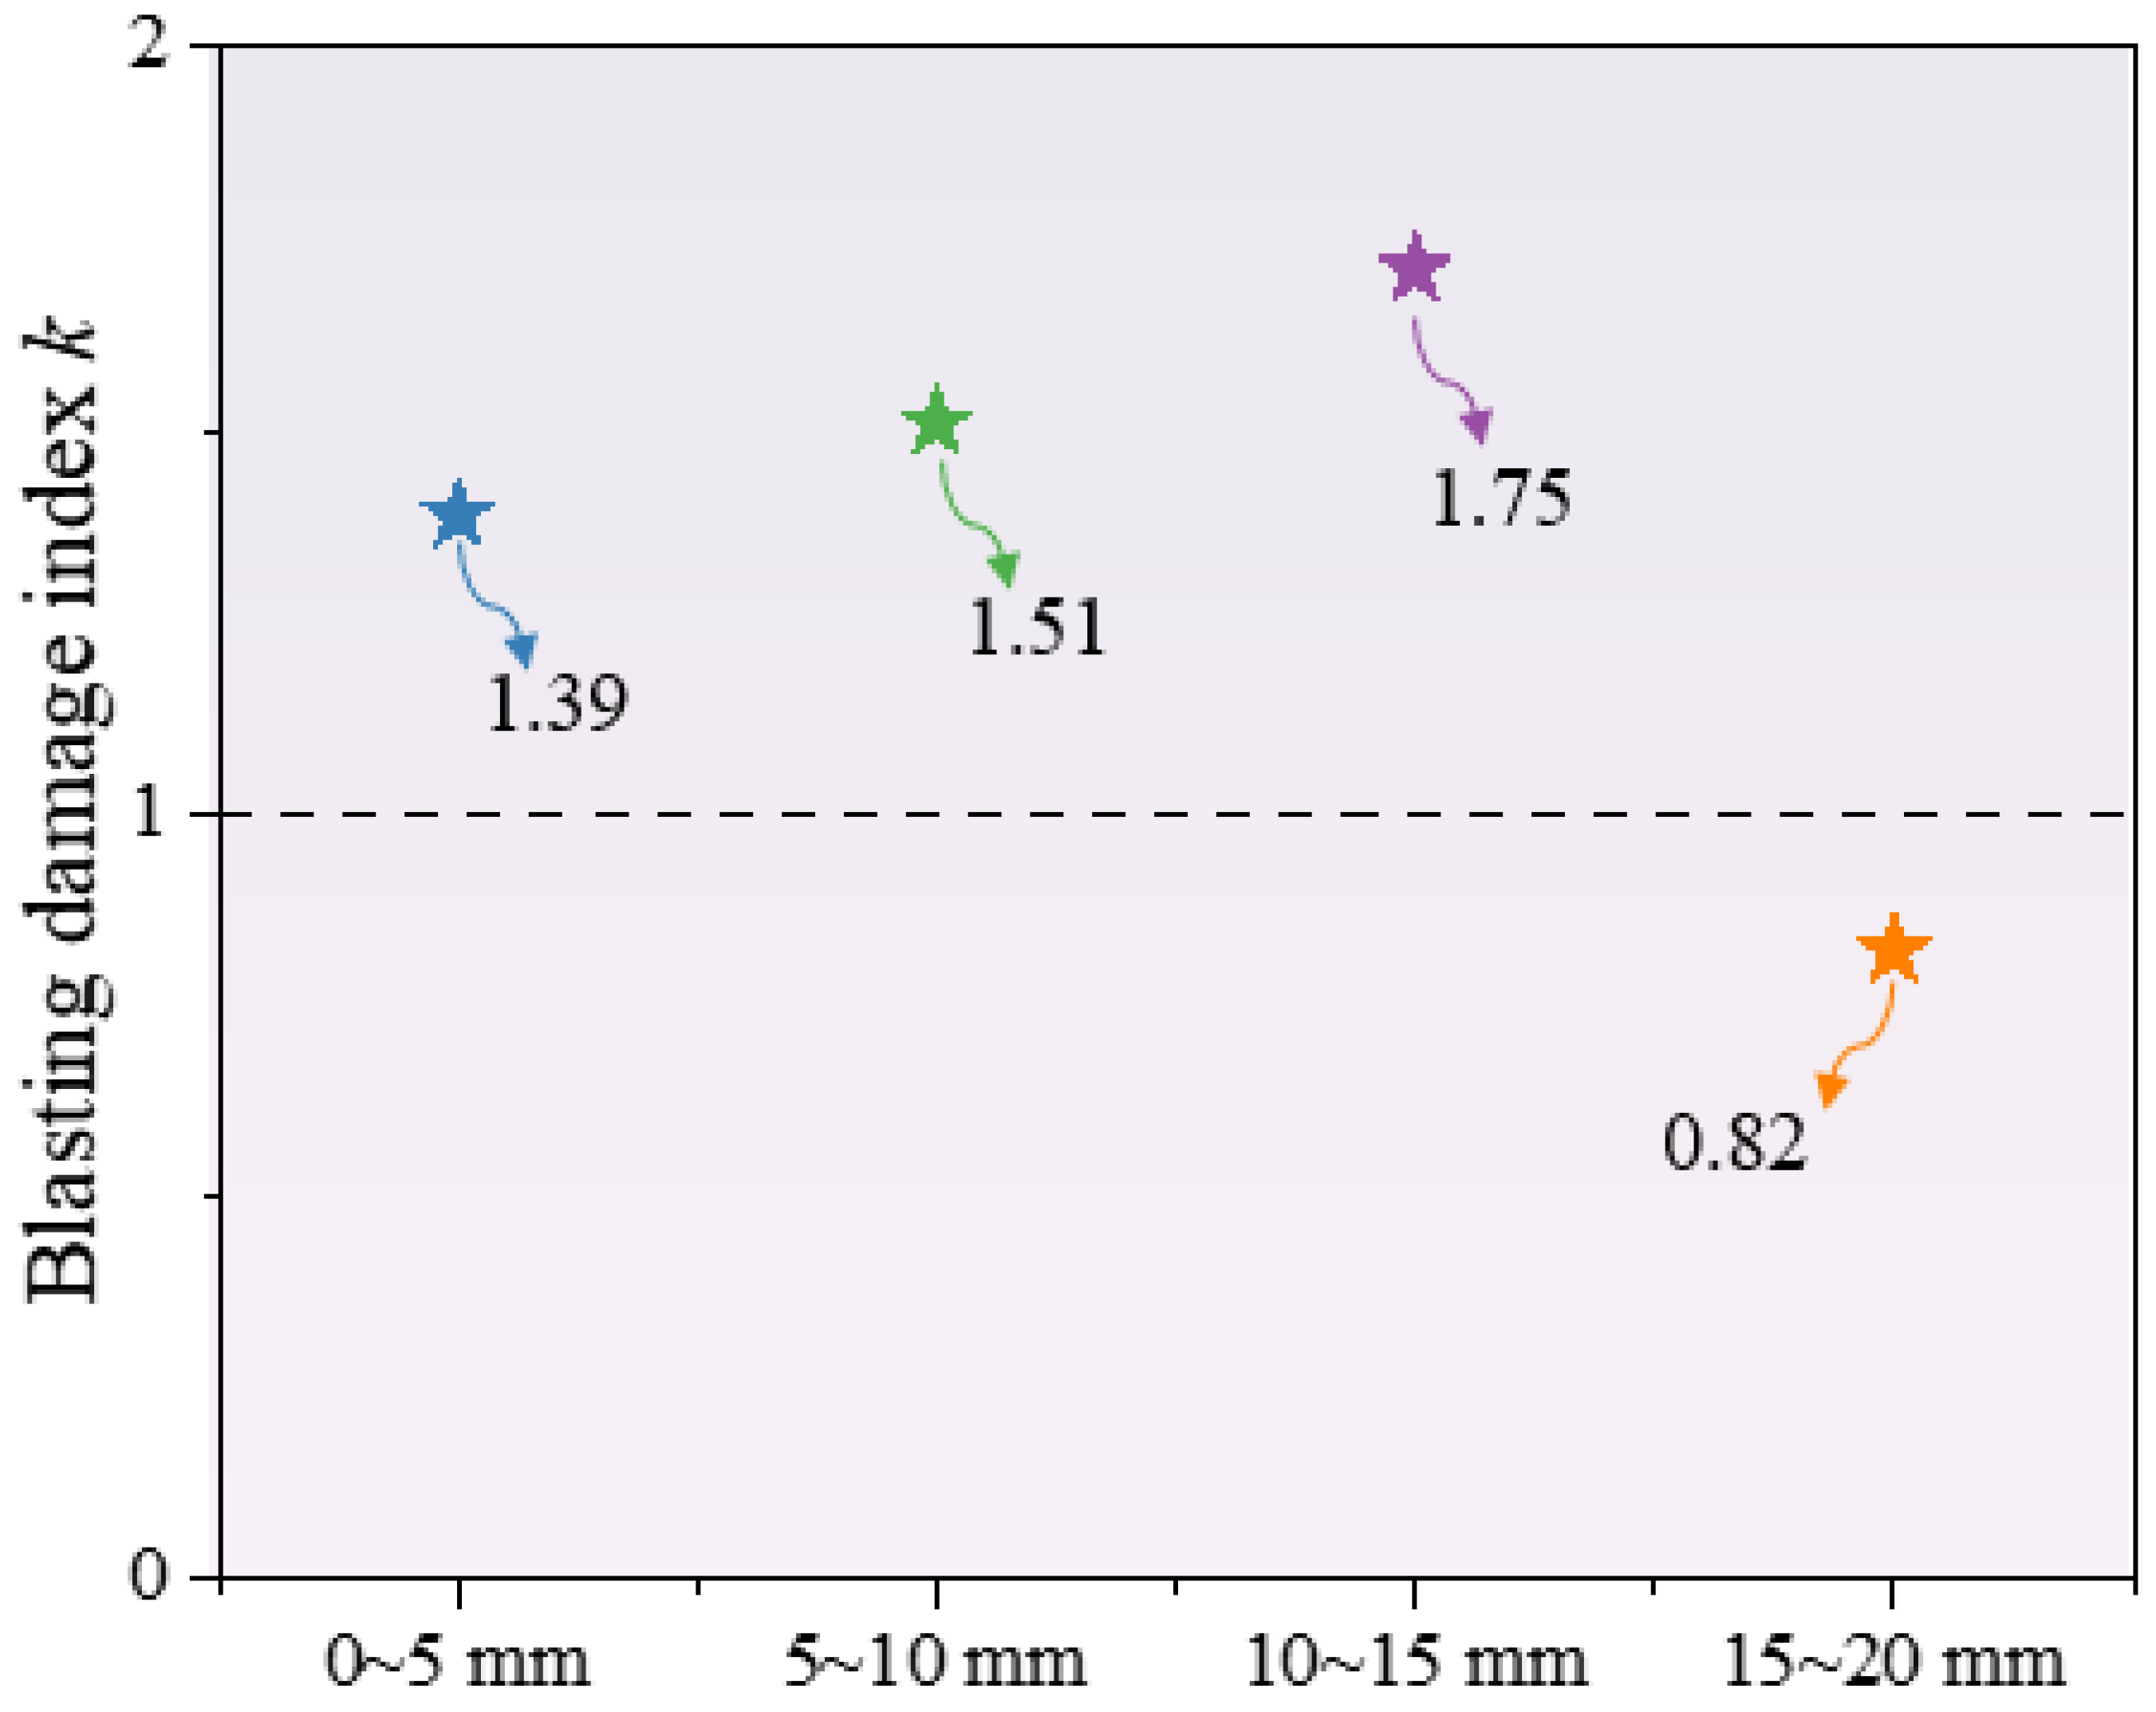
Figure 13 and Figure 14 present data on the concrete blasting damage ranges and the corresponding distribution of k under different particle size distributions. It can be seen that only when the particle size is 15~20 mm is k < 1, indicating that the blasting damage range in the horizontal direction is larger than that in the vertical direction with this particle size, showing a unique damage expansion mode. In other particle size cases, k > 1, and the damage expands more significantly in the vertical direction. As the aggregate particle size increases, its distribution tends to be discrete. It can be seen from Figure 13d that there is a small area range without aggregate obstruction on the left side of the blast hole, which causes the damage to develop rapidly in this area, thus resulting in a situation where k < 1.

5.2. Analysis of Concrete Blasting Damage Index Under Different Aggregate Contents

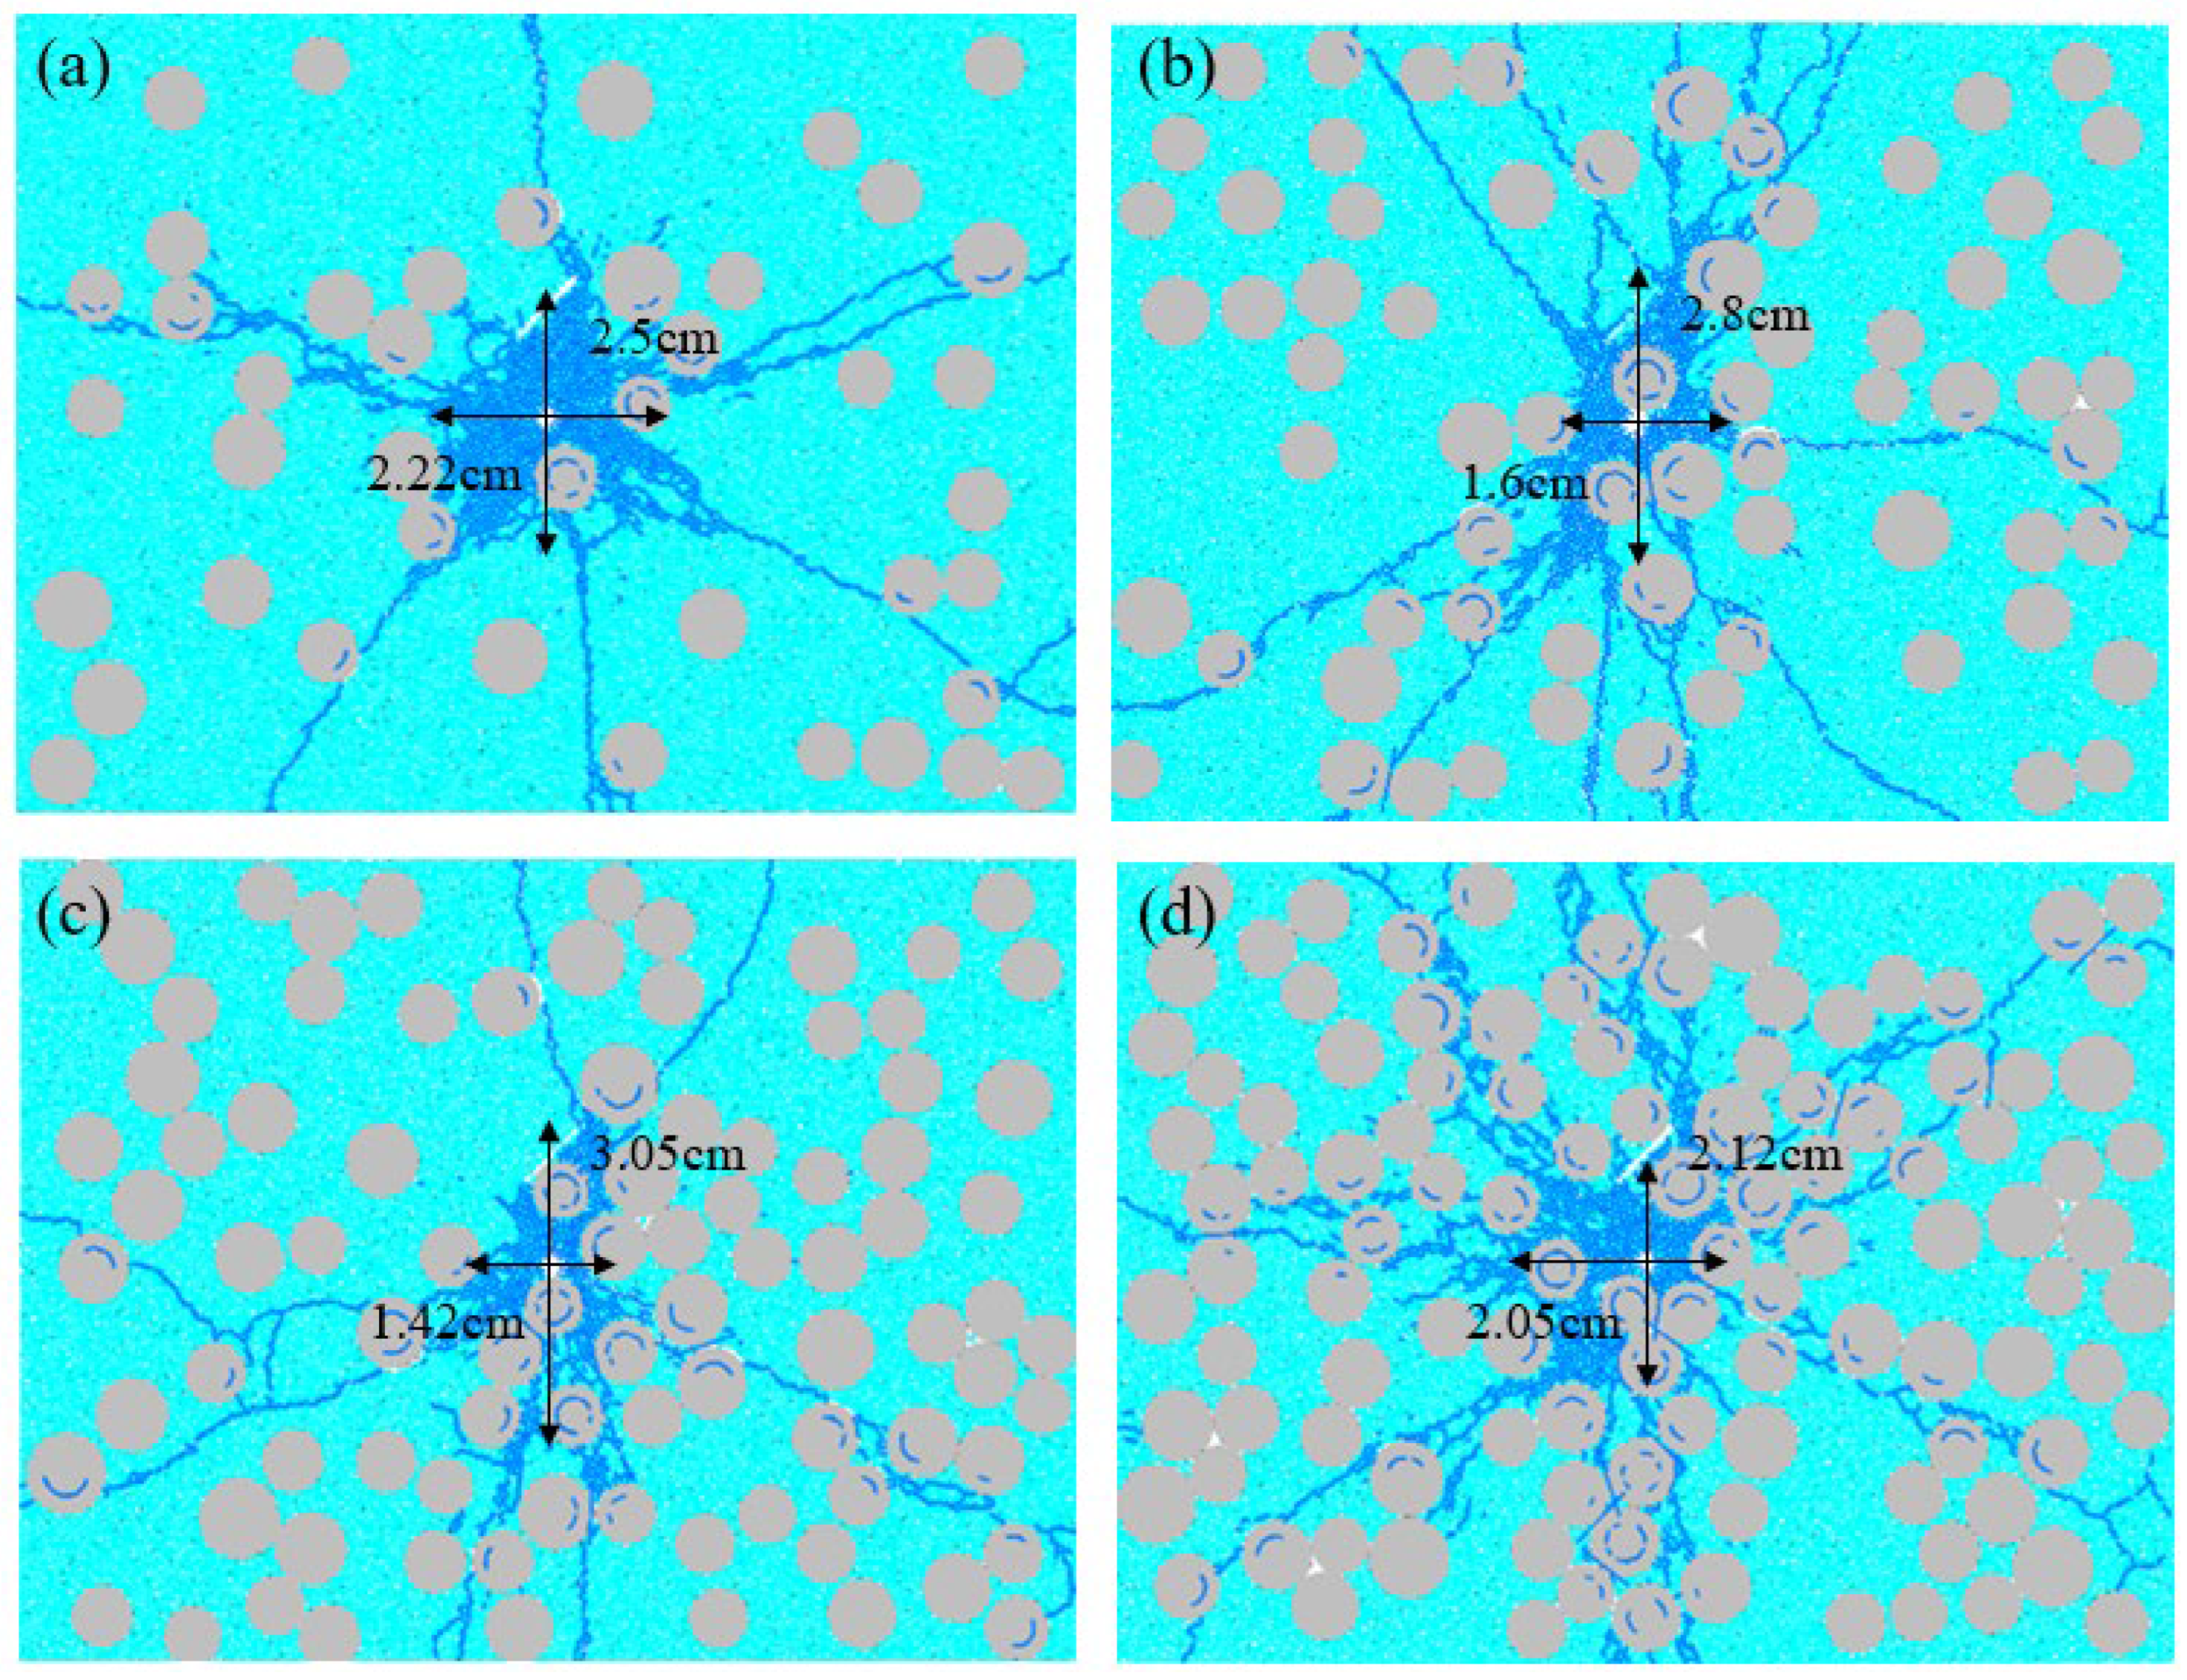
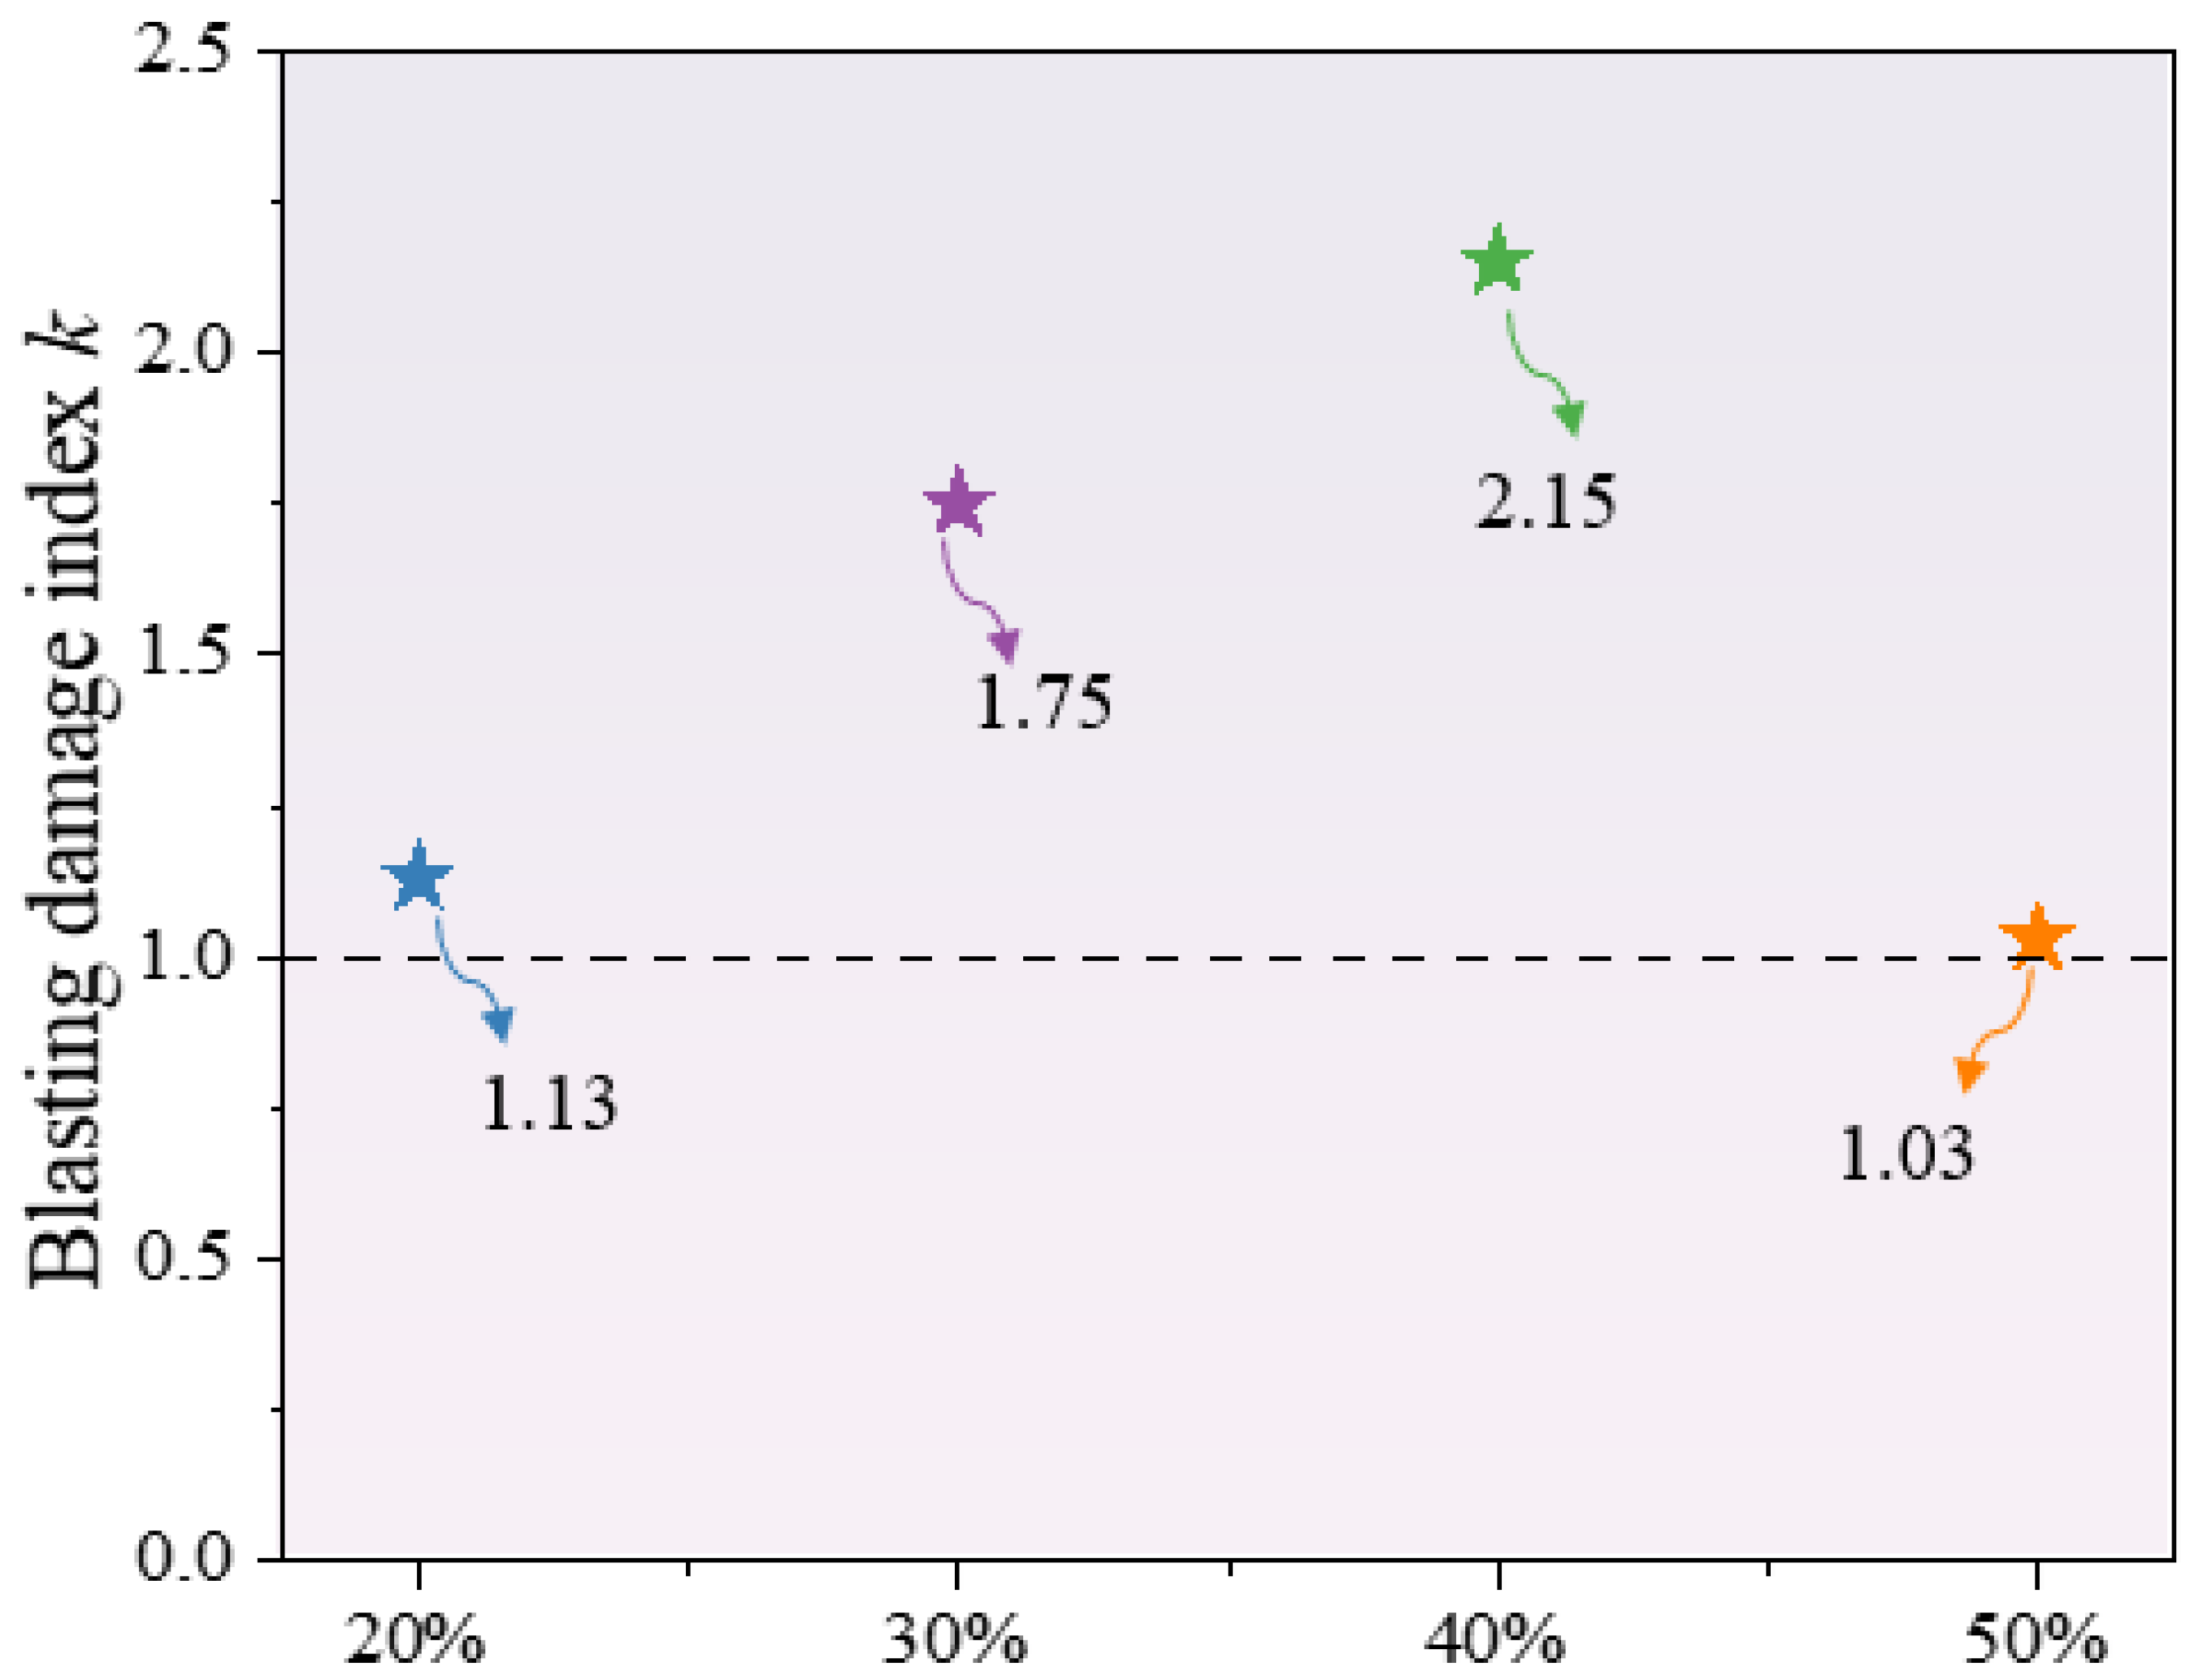
Figure 15 and Figure 16 present data on the concrete blasting damage ranges and the corresponding distribution of k under different aggregate contents. It can be seen that all k values are greater than one. Concrete with an aggregate content of 40% has the largest k value. It can also be observed from the corresponding Figure 15c that the blasting damage expands significantly in the vertical direction at this time. The k values of concrete with aggregate contents of 20% and 50% are closest to one, indicating that the damage expansion is relatively uniform in the vertical and horizontal directions.

5.3. Analysis of Concrete Blasting Damage Index Under Different Fissure Inclination Angles

Figure 17 and Figure 18 present data on the concrete blasting damage ranges and the corresponding distribution of k with different fissure inclination angles. It can be observed that when the fissure inclination angle is between 0° and 45°, an increase in the angle will guide the oblique expansion of damage, resulting in an increasing trend of k. At 90°, the damage in the vertical direction is significantly greater than that in the horizontal direction. This is because the 90° fissure forms a “vertical guiding zone”, thereby enhancing the damage degree in the vertical direction.

5.4. Analysis of Concrete Blasting Damage Index Under Different Fissure Lengths

Figure 19 and Figure 20 present data on the concrete blasting damage ranges and the corresponding distribution of k with different fissure lengths. It can be observed that all k values are greater than one, and when the fissure length is 30 mm, k is the largest; when the fissure length is 40 mm, k is closest to one, indicating that the damage distribution around the blast hole is relatively uniform at this time.

6. Conclusions

This study utilized the PFC method to reveal the mesoscopic evolution mechanism of concrete blasting damage, broke through the limitations of macroscopic research, integrated the collaborative influence of micro and macro factors, and verified the reliability of the PFC model; at the same time, it provided a quantitative basis for blasting parameter optimization and safety control, promoting the development of efficient and sustainable demolition technologies. However, the limitations of model simplification and the limited parameter range point out directions for subsequent research (such as introducing irregular aggregates, optimizing ITZ simulation, and expanding the parameter range).
  • The numerical model based on PFC can effectively simulate the evolution process of concrete blasting damage, and its damage morphology is consistent with the experimental results, which verifies the reliability of the model in characterizing the dynamic response and damage evolution of concrete under blasting.
  • The particle size distribution of concrete significantly affects the characteristics of blasting damage. For small particle sizes (0~5 mm), the damage expands uniformly with a dense crack network. For large particle sizes (15~20 mm), damage tends to expand rapidly along particle interfaces, resulting in irregular crack morphologies. The damage degree of concrete with a particle size of (5~10 mm) is 1.44 times that of concrete with a particle size of (10~15 mm).
  • Aggregate content influences damage evolution by changing the ITZ distribution. The higher the aggregate content, the greater the impact of the randomness of aggregate layout on damage. When the aggregate content is 50%, damage develops the fastest due to significant interfacial stress concentration.
  • The inclination angle of prefabricated fissures regulates the damage direction by guiding the propagation path of stress waves. A 0° horizontal fissure has a weak guiding effect on damage, while 30°~60° inclined fissures become preferential channels for damage. A 90° vertical fissure makes vertical damage more prominent, with the damage length reaching 2.53 cm. The damage development rate of the 90° fissure model is the fastest.
  • The length of prefabricated fissures affects the damage range and degree. An increase in fissure length accelerates the expansion of damage along the fissure direction, and a 40 mm long fissure results in the highest final damage degree, which is 1.29 times that of a 30 mm long one.
  • Analysis of the damage index shows that various factors significantly affect the difference in damage expansion between the vertical and horizontal directions by changing the mesoscopic stress transmission and concentration modes. It provides mesoscopic theoretical support for the precise control of concrete blasting damage.

Author Contributions

Conceptualization, X.H. and P.G.; Methodology, X.H. and S.Y.; Validation, X.H.; Formal analysis, S.Y.; Investigation, Y.L., Y.T., Y.S. and P.G.; Writing – original draft, X.H., S.Y., Y.L., Y.T., Y.S. and P.G.; Writing – review & editing, X.H., S.Y. and P.G.; Supervision, P.G. All authors have read and agreed to the published version of the manuscript.

Funding

This work is supported by the Social Welfare Science Project of Nantong (MS2023064); the Natural Science Foundation of Jiangsu Province (Grant No. BK20240942); the Natural Science Foundation of the Jiangsu Higher Education Institutions of China (Grant No. 24KJB130005); College Students’ Innovation and Entrepreneurship Training Program (Grant No. 2025240).

Data Availability Statement

The data presented in this study are available in the article.

Conflicts of Interest

The authors declare no conflicts of interest.

References

  1. Wang, X.; Li, J.; Zhao, X.; Liang, Y. Propagation characteristics and prediction of blast-induced vibration on closely spaced rock tunnels. Tunn. Undergr. Space Technol. 2022, 123, 104416. [Google Scholar] [CrossRef]
  2. Sun, L.; Shi, W.; Tian, X.; Li, J.; Zhao, B.; Wang, S.; Tan, J. A plane stress measurement method for CFRP material based on array LCR waves. NDT E Int. 2025, 151, 103316. [Google Scholar] [CrossRef]
  3. Chai, Y.; Luo, N.; Zhang, H.; Duan, Y.; Mou, G.; Sun, W.; Dong, J. Application of controlled blasting demolition technology in ultra-high coaxial thin-walled steel inner cylinder reinforced concrete chimney. Case Stud. Constr. Mater. 2023, 18, e01936. [Google Scholar]
  4. Yan, Y.; Hou, X.; Zheng, W.; Fei, H. The damage response of RC columns with considering different longitudinal and shear reinforcement under demolition blasting. J. Build. Eng. 2022, 62, 105396. [Google Scholar] [CrossRef]
  5. Hu, Z.; Zhang, Z.; Zhang, Y.; Chen, C.; Liu, H.; Du, W. Investigation of explosive collapse process and mechanism of girder bridgesn with double-column piers. China J. Highw. Transp. 2024, 37, 67–79. [Google Scholar]
  6. Fang, T.; Chai, Y.; Luo, N.; Wu, X.; Quan, S.; Jiang, Y.; Chen, L. Directional folding blasting and demolition of a 210 m ultra-high reinforced concrete chimney. Eng. Blasting 2025, 31, 58–64+72. [Google Scholar]
  7. Wen, C.; Li, J.; Zhu, W. Blasting demolition technology of cofferdam at inlet of expansion project of Wuqiangxi Hydropower station. Blasting 2023, 40, 117–122. [Google Scholar]
  8. Sun, J.; Jia, Y.; Yao, Y.; Xie, X. Experimental investigation of stress transients of blasted RC columns in the blasting demolition of buildings. Eng. Struct. 2020, 210, 110417. [Google Scholar] [CrossRef]
  9. Uenishi, K.; Takahashi, H.; Yamachi, H.; Sakurai, S. PC-based simulations of blasting demolition of RC structures. Constr. Build. Mater. 2010, 24, 2401–2410. [Google Scholar] [CrossRef]
  10. Hu, H.; Chi, E.; Yue, S.; Wei, X. Analysis of collapse failure of building explosive demolition. Blasting 2010, 27, 99–102. [Google Scholar]
  11. Kumar, M.; Murthy, V. Assessment of blasting impacts in underwater concrete berth demolition and development of a Hybrid Controlled Blasting (HCB) technique—A case study. Structures 2022, 40, 420–433. [Google Scholar] [CrossRef]
  12. Wang, H.; Li, S.; Zhao, Y. Research on blasting damage law of initial concrete support under cumulative effect. Eng. Blasting 2021, 27, 29–33+50. [Google Scholar]
  13. Chen, X.; Wu, L.; Zhou, C.; Zhao, Q.; Yu, G. Failure assessment method of reinforced concrete shear walls under close-in blast loads. Eng. Fail. Anal. 2025, 177, 109660. [Google Scholar] [CrossRef]
  14. Chu, H.; Ye, H.; Yang, X.; Liang, W.; Yu, Y. Experimental study on accumulation law of blasting damage on high-strength concrete block. Blasting 2016, 33, 1–5+60. [Google Scholar]
  15. Peng, Z.; Liu, Q.; Gao, X.; Zhao, X.; Xia, J.; Xiong, Q. Effects of aggregate distribution on the cracking behavior of concrete: A discrete element method study. Cem. Concr. Compos. 2025, 162, 106119. [Google Scholar] [CrossRef]
  16. Duarah, R.; Leon, R.; Amongnaro; Deori, S.; Basumatari, D. Inclusive approach for mix proportioning of dry lean concrete based on the experimental study on the effect of cement and coarse aggregate content on strength and abrasion characteristics. Constr. Build. Mater. 2025, 486, 141935. [Google Scholar] [CrossRef]
  17. Huang, Y.; Wu, R. Study on bonding performance of ultra-high performance concrete with coarse aggregate and reinforcement bars. J. Hunan Univ. Nat. Sci. 2025, 52, 170–179. [Google Scholar]
  18. Yu, J.; Yao, Y.; Wang, K.; Zhou, J.; Zhou, W.; Zhang, C.; Gao, Y. Experimental investigation of effects of multi-fissures on brittleness of ordinary Portland cement concrete and rubberized concrete. Eng. Fract. Mech. 2024, 306, 110254. [Google Scholar] [CrossRef]
  19. Wang, X. Analytical theory on instability sliding of surrounding rock blocks in tunnel roof under stress wave actions. Chin. J. Theor. Appl. Mech. 2024, 56, 183–197. [Google Scholar]
  20. Wang, X.; Zhang, X.; Li, W.; Jiang, Y.; Li, Z.; Wang, C. Analytical theoretical study on ultra-low friction characteristics of coal rock interfaces under stress wave action. J. China Coal Soc. 2024, 49, 4495–4507. [Google Scholar]
  21. Yang, S.; Liang, Z.; Xu, X.; Ning, J. A numerical simulation method for fragments distribution of concrete subjected to blast loading. Eng. Fail. Anal. 2025, 176, 109606. [Google Scholar] [CrossRef]
  22. Liu, C.; Hao, Y.; Li, J.; Huang, Y. A macro-scale constitutive model of low-density cellular concrete for blast simulation. Eng. Struct. 2024, 314, 118393. [Google Scholar] [CrossRef]
  23. Zhu, W.; Yang, C.; Yin, T.; Jia, J.; Yu, J.; Song, J. Blast resistant performance and damage mechanism of steel reinforced concrete beams under contact explosion. Eng. Struct. 2024, 315, 118472. [Google Scholar] [CrossRef]
  24. Wang, X.; Li, Z.; Li, W.; He, C.; Wang, Z. Analysis and prediction of dynamic stress concentration in jointed coal using boundary element method. Theor. Appl. Fract. Mech. 2025, 140, 105136. [Google Scholar] [CrossRef]
  25. Qu, Y.; Li, X.; Kong, X.; Zhang, W.; Wang, X. Numerical simulation on dynamic behavior of reinforced concrete beam with initial cracks subjected to air blast loading. Eng. Struct. 2016, 128, 96–110. [Google Scholar] [CrossRef]
  26. Kong, X.; Qi, X.; Gu, Y.; Lawan, I.; Qu, Y. Numerical evaluation of blast resistance of RC slab strengthened with AFRP. Constr. Build. Mater. 2018, 178, 244–253. [Google Scholar] [CrossRef]
  27. Jiang, X.; Xue, Y.; Ren, X.; Kong, F.; Liao, X. Dynamic response characteristics and damage calculation method of fractured rock mass under blasting disturbance. Int. J. Impact Eng. 2024, 192, 105036. [Google Scholar] [CrossRef]
  28. Wu, W.; Lu, W. Analysis of explosion damage factors in reinforced concrete columns. Eng. Blasting 2021, 27, 58–65. [Google Scholar]
  29. Thamburaja, P.; Sarah, K.; Srinivasa, A.; Reddy, J. Fracture of viscoelastic materials: FEM implementation of a non-local & rate form-based finite-deformation constitutive theory. Comput. Methods Appl. Mech. Eng. 2019, 354, 871–903. [Google Scholar]
  30. Shin, H.; Thamburaja, P.; Srinivasa, A.; Reddy, J. Modeling impact fracture in a quasi-brittle solids using a 3D nonlocal graph-based finite element analysis: Theory, finite element simulations, and experimental verification. J. Mech. Phys. Solids 2023, 170, 105097. [Google Scholar] [CrossRef]
  31. Ji, P.; Zhang, X.; Zhang, Q. A new method to model the non-linear crack closure behavior of rocks under uniaxial compression. Int. J. Rock Mech. Min. Sci. 2018, 112, 171–183. [Google Scholar] [CrossRef]
  32. Hajibagherpour, A.; Mansouri, H.; Bahaaddini, M. Numerical modeling of the fractured zones around a blasthole. Comput. Geotech. 2020, 123, 103535. [Google Scholar] [CrossRef]
  33. He, M.; Ding, M.; Yuan, Z.; Zhao, J.; Luo, B.; Ma, X. Numerical simulation of rock bursts triggered by blasting disturbance for deep-buried tunnels in jointed rock masses. Comput. Geotech. 2023, 161, 105609. [Google Scholar] [CrossRef]
  34. Shen, Y.; Lin, B.; Lin, M.; Liu, T.; Zhang, X.; Yang, W.; Zhang, C. Experiments and discrete element simulations on the influence of symmetrical forms of joints on the propagation of blasting cracks. Eng. Fract. Mech. 2025, 320, 111072. [Google Scholar] [CrossRef]
  35. Cundall, P.; Hart, R. Numerical modeling of discontinua. In Analysis and Design Methods; Elsevier: Amsterdam, The Netherlands, 1993; pp. 231–243. [Google Scholar]
  36. Peng, S.; Li, X.; Li, C.; Liang, L.; Huang, L. Crack-closure behavior and stress-sensitive wave velocity of hard rock based on flat-joint model in particle-flow-code (PFC) modeling. Comput. Geotech. 2024, 170, 106320. [Google Scholar] [CrossRef]
  37. Yu, R.; Zhang, Z.; Gao, W.; Li, C.; Wu, C. Numerical simulation of rock mass blasting vibration using particle flow code and particle expansion loading algorithm. Simul. Model. Pract. Theory 2023, 122, 102686. [Google Scholar] [CrossRef]
  38. Shi, C.; Zhang, Q.; Wang, S. Particle flow (PFC5.0) numerical simulation technology and its applications. Rock Soil Mech. 2018, 39, 36. [Google Scholar]
  39. Zhang, Z.; Gao, W.; Li, K.; Li, B. Numerical simulation of rock mass blasting using particle flow code and particle expansion loading algorithm. Simul. Model. Pract. Theory 2020, 104, 102119. [Google Scholar] [CrossRef]
  40. Luo, R.; Li, Q.; Huang, Y.; Yang, G.; Yu, M.; Zu, G.; Yao, Q. Numerical simulation and safety analysis of foundation pit blasting based on PFC. Acta Sci. Nat. Univ. Sunyatseni 2023, 62, 107–114. [Google Scholar]
  41. Potyondy, D.; Cundall, P. A bonded-particle model for rock. Int. J. Rock Mech. Min. Sci. 2004, 41, 1329–1364. [Google Scholar] [CrossRef]
  42. Yang, R.; Wang, Y.; Ding, C. Laboratory study of wave propagation due to explosion in a jointed medium. Int. J. Rock Mech. Min. Sci. 2016, 81, 70–78. [Google Scholar] [CrossRef]
  43. Lu, C.; Yu, Q.; Wei, J.; Niu, Y.; Zhang, Y.; Lin, C.; Chen, P.; Shi, C.; Yang, P. Influence of interface transition zones (ITZ) and pore structure on the compressive strength of recycled aggregate concrete. Constr. Build. Mater. 2024, 456, 139299. [Google Scholar] [CrossRef]
  44. Liu, C.; Yue, S.; Zhou, C.; Sun, H.; Deng, S.; Gao, F.; Tan, Y. Anisotropic mechanical properties of extrusion-based 3D printed layered concrete. J. Mater. Sci. 2021, 56, 16851–16864. [Google Scholar] [CrossRef]
  45. Wang, J.; Deng, J.; Ren, S.; Qu, G.; Wang, C.; Guo, R.; Zhao, X. Acoustic wave propagation characteristics and spontaneous combustion warning of coal during oxidative warming of loose coal. Fuel 2025, 398, 135528. [Google Scholar] [CrossRef]
  46. Yang, L.; Li, K.; Hu, X.; Peng, Z.; Liu, Q.; Shi, C. Mesoscopic discrete modeling of compression and fracture behavior of concrete: Effects of aggregate size distribution and interface transition zone. Cem. Concr. Compos. 2024, 147, 105411. [Google Scholar] [CrossRef]
Figure 1. Schematic diagram of PFC blasting. (a): Construct the area of the blast hole; (b): Filler explosive particle; (c): Explosive particle expansion; (d): Concrete particles outward.
Buildings 15 03000 g001
Figure 2. Linear parallel bond contact model.
Buildings 15 03000 g002
Figure 3. Model schematic diagram.
Buildings 15 03000 g003
Figure 4. The evolution process of blasting damage for the model containing blast holes and a horizontal single fissure.
Buildings 15 03000 g004
Figure 5. The comparison between the numerical simulation results and the experimental results of the model with blast hole and horizontal single fissure. (a) Experimental result and (b) numerical simulation result.
Buildings 15 03000 g005
Figure 6. Concrete mesoscopic structure.
Buildings 15 03000 g006
Figure 7. The evolution process of the blasting damage of microscale concrete under different particle size distributions. (a) 0~5 mm; (b) 5~10 mm; (c) 10~15 mm; and (d) 15~20 mm.
Buildings 15 03000 g007aBuildings 15 03000 g007b
Figure 8. The blasting damage evolution process of microscale concrete under different aggregate contents. (a) 20%; (b) 30%; (c) 40%; and (d) 50%.
Buildings 15 03000 g008aBuildings 15 03000 g008b
Figure 9. The blasting damage evolution process of microscale concrete under different fissure angles. (a) 0°; (b) 30°; (c) 45°; (d) 60°; and (e) 90°.
Buildings 15 03000 g009aBuildings 15 03000 g009b
Figure 10. The blasting damage evolution process of microscale concrete under different fissure lengths. (a) 20 mm; (b) 30 mm; and (c) 40 mm.
Buildings 15 03000 g010
Figure 11. Damage counts under different meso-structural parameters of concrete. (a) Different particle size distributions and (b) different aggregate contents.
Buildings 15 03000 g011
Figure 12. Damage counts of concrete macroscopic prefabricated fissures under different parameters. (a) Different inclination angles and (b) different fissure lengths.
Buildings 15 03000 g012
Figure 13. Data on the blasting damage range of concrete under different particle size distributions. (a) 0~5 mm; (b) 5~10 mm; (c) 10~15 mm; and (d) 15~20 mm.
Buildings 15 03000 g013
Figure 14. Blasting damage index of concrete with different particle size distributions.
Buildings 15 03000 g014
Figure 15. Data on the blasting damage range of concrete with different aggregate contents. (a) 20%; (b) 30%; (c) 40%; and (d) 50%.
Buildings 15 03000 g015
Figure 16. Blasting damage index of concrete with different aggregate contents.
Buildings 15 03000 g016
Figure 17. Data on the blasting damage range of concrete with different fissure inclination angles. (a) 0°; (b) 30°; (c) 45°; (d) 60°; and (e) 90°.
Buildings 15 03000 g017
Figure 18. Blasting damage index of concrete with different fissure inclination angles.
Buildings 15 03000 g018
Figure 19. Data on the blasting damage range of concrete with different fissure lengths. (a) 20 mm; (b) 30 mm; and (c) 40 mm.
Buildings 15 03000 g019
Figure 20. Blasting damage index of concrete with different fissure lengths.
Buildings 15 03000 g020
Table 1. Micro-parameters.
Micro-ParametersValueMicro-ParametersValue
Emod (Pa)20 × 109Rmin (m)6 × 10⁻⁴
Pb_emod (Pa)20 × 109Rmax(m)1.68 × 10⁻³
Pb_ten (Pa)10 × 107density2.5 × 103
Pb_coh (Pa)10 × 107fric0.5
Pb_fa (°)10damp0.7
Table 2. Test schemes.
Test SchemesParticle Size
Distribution
Aggregates ContentFissure Inclination AnglesFissure Length
Experimental variable0~5 mm20%20 mm
5~10 mm30%30°30 mm
10~15 mm40%45°40 mm
15~20 mm50%60°
90°
Table 3. Mesoscopic parameters of the concrete blasting model.
Parameters of MortarParameters of Aggregates
Emod (Pa)20 × 109Emod (Pa)555 × 108
Pb_emod (Pa)20 × 109Pb_emod (Pa)555 × 108
Pb_ten (Pa)10 × 107Pb_ten (Pa)20 × 106
Pb_coh (Pa)10 × 107Pb_coh (Pa)25 × 106
Pb_fa (°)10Pb_fa (°)40
Kratio1.5Kratio2
Disclaimer/Publisher’s Note: The statements, opinions and data contained in all publications are solely those of the individual author(s) and contributor(s) and not of MDPI and/or the editor(s). MDPI and/or the editor(s) disclaim responsibility for any injury to people or property resulting from any ideas, methods, instructions or products referred to in the content.