Article

Study on Finite Element Modeling Method and Seismic Performance of Hybrid Connection Joints of Large-Span Frames

1
Ministry of Education, Key Laboratory of New Technology for Construction of Cities in Mountain Area, Chongqing 400045, China
2
School of Civil Engineering, Chongqing University, Chongqing 400045, China
*
Author to whom correspondence should be addressed.
Buildings 2025, 15(17), 2992; https://doi.org/10.3390/buildings15172992
Submission received: 18 March 2025 / Revised: 4 August 2025 / Accepted: 16 August 2025 / Published: 22 August 2025

Abstract

Compared to traditional connection joints, hybrid connection joints are more suitable for large-span frames, especially for prefabricated buildings. This study aims to investigate the seismic performance of novel hybrid connection joints using the proposed innovative finite element modeling method based on the cohesion zone model (referred to as the CZM method). The crack development mechanism of the beam–column interface and the bond–slip mechanism of mild steel were investigated in this work; the performances of self-centering and energy dissipation were also studied using the CZM method. It is demonstrated that the CZM method can be used to accurately and efficiently estimate the performance of hybrid connection joints. This study also shows that the damage of mild steel, post-tensioned steel (referred to as PT steel), and concrete of the innovative hybrid connection joint is slight, the residual deformation of the joint is small, and the equivalent viscous damping coefficient ξ e q is between 7.8% and 14.85%, which shows good self-resetting and energy dissipation performance.

1. Introduction

Concrete frame structures are one of the most widely used structural forms in engineering, and large-span prestressed concrete frame structures have significant advantages. They are commonly used in industrial and civil buildings, such as large shopping malls, convention centers, terminals, logistics warehouses, and industrial plants, and these application scenarios often require multi-hazard resistance [1]. However, large-span prestressed concrete frame structures mostly use cast-in-place frames or traditional prefabricated rows of frames, and large-span assembly members are mostly concentrated in large-span floor slabs [2]. To promote the development of more efficient prefabricated building technology, this paper proposes a new type of hybrid connection joint for a large-span prestressed concrete prefabricated frame (referred to as the hybrid connection joint of a large-span frame). Compared with the common hybrid connection frame [3,4,5,6], the new large-span hybrid connection frame has a significant increase in span. According to the Chinese Code for Seismic Design of Buildings (GB50011-2010) [7], large-span frames refer to frames with a span of not less than 18 m, reaching 2 to 3 times that of the common frame. In addition, there is an obvious change in the form of the frame reinforcement, which will lead to a significant difference in anti-cracking demand and seismic performance.
The hybrid connection frame exhibits good seismic performance and is a prefabricated frame structural system with great potential for development in high-intensity seismic areas. The hybrid connection joint is a prestressed dry connection joint developed by the National Institute of Standards and Technology (NIST) and further refined in the PRESSS research project between the U.S. and Japan [5,6,8,9,10]. As shown in Figure 1 [4], the hybrid connection joint uses unbonded PT steels for the splicing of prefabricated members and additional mild steels at the top and bottom edges of the beam ends, where the PT steels provide a self-resetting force for the structure after an earthquake. The mild steels improve the energy dissipation performance of the hybrid connection joint. Similar energy dissipation principles have been validated in seismic studies of cable-stiffened systems with buckling-restrained braces [11].
Beam–column joints are of great significance in the seismic resistance of RC structures [12,13]. However, previous experimental studies have shown that the assembled hybrid connection joints are prone to crushing of the protective layer of concrete at the end of the beams at the beam–column bonding surfaces, the prestressing tendons are in turn exposed to the risk of plastic deformation and loss of prestressing, and mild steel enters into the reinforcement stage prematurely, among other problems. Existing research on hybrid connection joints has mainly focused on ordinary span frames. Meeting the post-seismic self-resetting requirements of a structure is a basic design principle. Therefore, in the existing research, the PT steels are arranged in a straight line along the center of the beam section, and the effective stress of the PT steels is taken at a relatively low level (typically below 0.5 fptk) [8,9,10,14]. Recent advances in prestressed system optimization, such as genetic algorithm-based approaches for steel columns, highlight the importance of balancing prestress efficiency [15]. The objective is to control excessive plastic deformation of the PT steels, minimize prestress loss, and ensure post-seismic recovery capacity. A large-span hybrid connection frame, while satisfying its self-centering performance, should also perform crack control, which is an important part of the large-span prestressed structure design. Therefore, considering the dual control of cracking resistance and self-resetting, a curvilinear arrangement of PT steel is preferred, utilizing the moment of the girder and higher tension control stresses.
The key to the finite element analysis of the seismic performance of hybrid connection joints is to effectively simulate crack development of the beam–column joint surface and the bond–slip of mild steel. However, the conventional finite element model (FEM) does not consider the initial tensile contribution of concrete in the beam–column joint surface and fails to effectively consider the bond–slip of mild steel. This causes the finite element simulation and test results to have a large error in the key indicators of seismic performance, such as stiffness degradation, pinching effect, residual deformation, and energy dissipation [16,17,18].
In order to resolve the limitations of the conventional finite element method (FEM) and the many problems and challenges faced by prefabricated hybrid connection joints, a hybrid connection joint was considered as the research object, and a finite element modeling method based on the cohesive zone model (CZM) was used to study the crack development mechanism of the beam–column joint surface and the bond–slip mechanism of mild steel in this study. The CZM method proposed in this study was validated by comparing it with conventional FEM methods and existing hybrid connection joint tests.
Meanwhile, a series of hybrid connection joints for large-span frames were designed according to the Chinese Code for Prestressed Concrete Structure Seismic Design (JGJ/T 140-2019) [19] (referred to as the Prestressed Seismic Code), and the self-resetting and energy dissipation performances of these joints were investigated using the CZM method. It should be noted that the anti-cracking performance is also an important part of the study of large-span hybrid connection frames. This study mainly focuses on seismic performance; anti-cracking performance will be studied in future work. In addition, it is also worthwhile to study how to identify structural damages, such as residual deformation of hybrid joints under seismic action, using accurate and effective methods [20,21,22,23] in actual projects.

2. Comparison Between the CZM Method and Conventional Modeling Methods

The key to establishing the FEM of the hybrid connection joint is to effectively simulate the crack development and bond–slip of mild steel at the beam–column joint surface. Currently, there are three main FEM methods for considering the bond–slip of mild steel in hybrid connection joints: method 1 does not consider the bond–slip of mild steel; method 2 adjusts the actual hysteretic constitutive relation of mild steel to consider its bond–slip; and method 3 artificially increases the length of the unbonded section of mild steel to consider its bond–slip, and this increased length is the bond–slip length ( Δ l ). However, the finite element simulation and test results have a large error in the key indicators of seismic performance, such as stiffness degradation, pinching effect, residual deformation, and energy dissipation. To resolve the limitations of the above conventional finite element method (FEM), a finite element modeling method based on the cohesive zone model (CZM) was developed, and the effectiveness of the CZM method proposed in this study was validated by comparing and analyzing it with reference to the conventional finite element modeling method as well as existing hybrid connecting joint tests.

2.1. Introduction to the CZM Theory

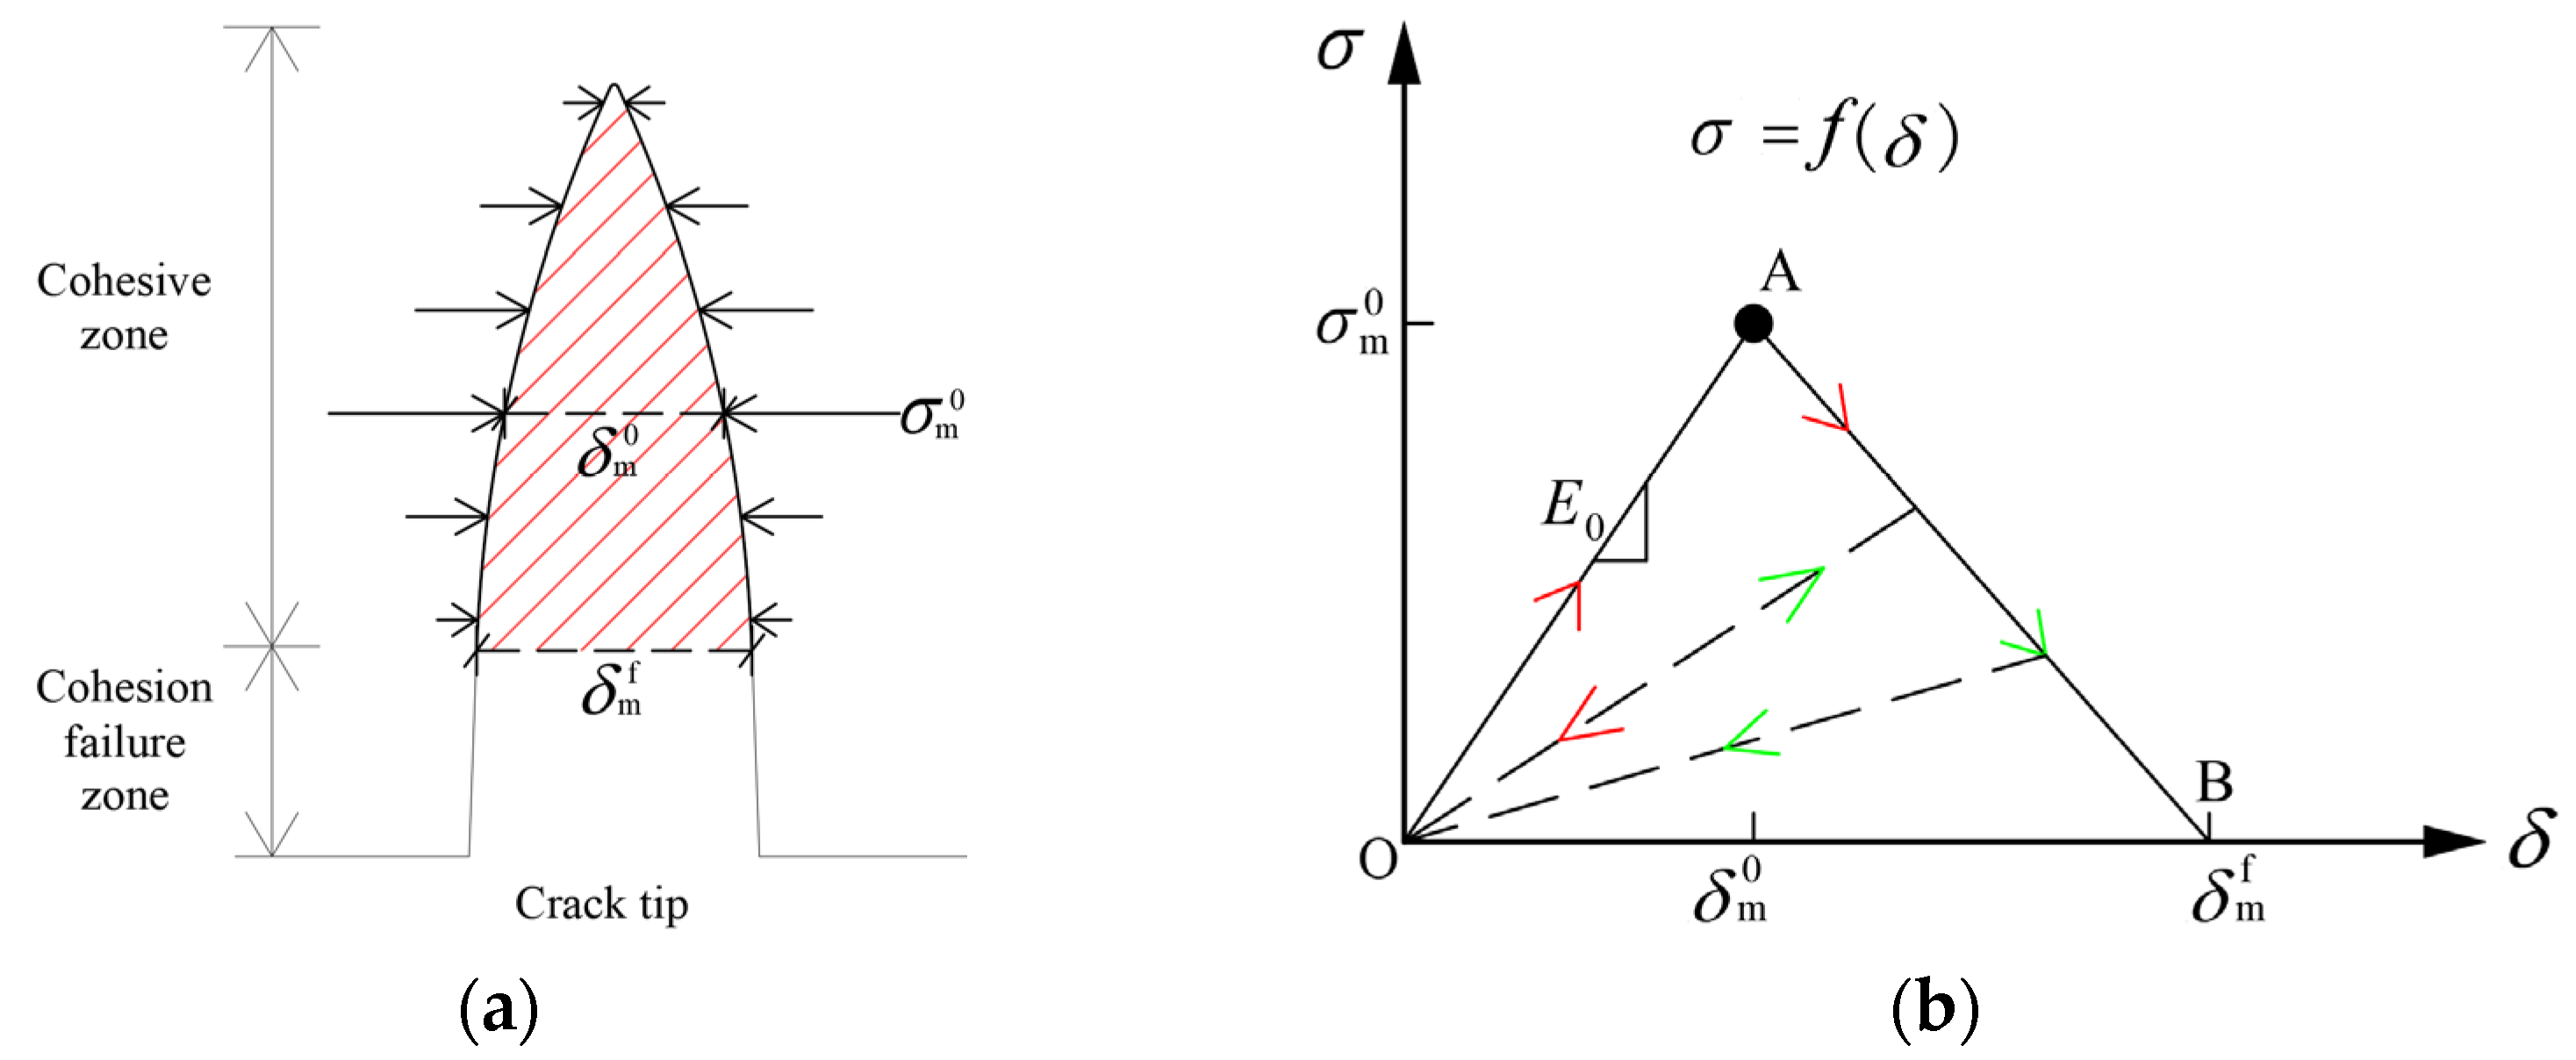
According to the CZM theory [24,25], the cohesive force at the micro level is distributed between two separated free joint surfaces, which means that the contact surface is not completely separated immediately after cracking. As shown in Figure 2a, δ is the opening displacement of the joint surface, σ is the cohesive force, and the relationship between them is called the traction–separation law. When the equivalent displacement of the joint surface reaches δ m 0 , the cohesive force reaches its maximum value σ m 0 , and the joint surface begins to be damaged. When the equivalent displacement of the joint surface reaches δ m f , the cohesive force is completely destroyed, and a crack is initiated on the joint surface. The constitutive relation of CZM is shown in Figure 2b, where the hysteresis behavior of cohesive force is represented by arrows and dashed lines. The constitutive model consisted of three stages: traction–separation, damage initiation, and damage evolution. The traction–separation corresponds to section OA, the damage initiation corresponds to point A, and the damage evolution corresponds to section AB. When the strain or stress state of the cohesive element satisfies the damage initiation criterion, damage evolution begins, and the cohesive element finally reaches the failure criterion and is removed. The CZM constitutive relation used in this study is characterized by a damage initiation criterion based on the maximum nominal stress and damage evolution based on effective displacement.

2.2. Introduction to the CZM Method and Conventional Modeling Methods

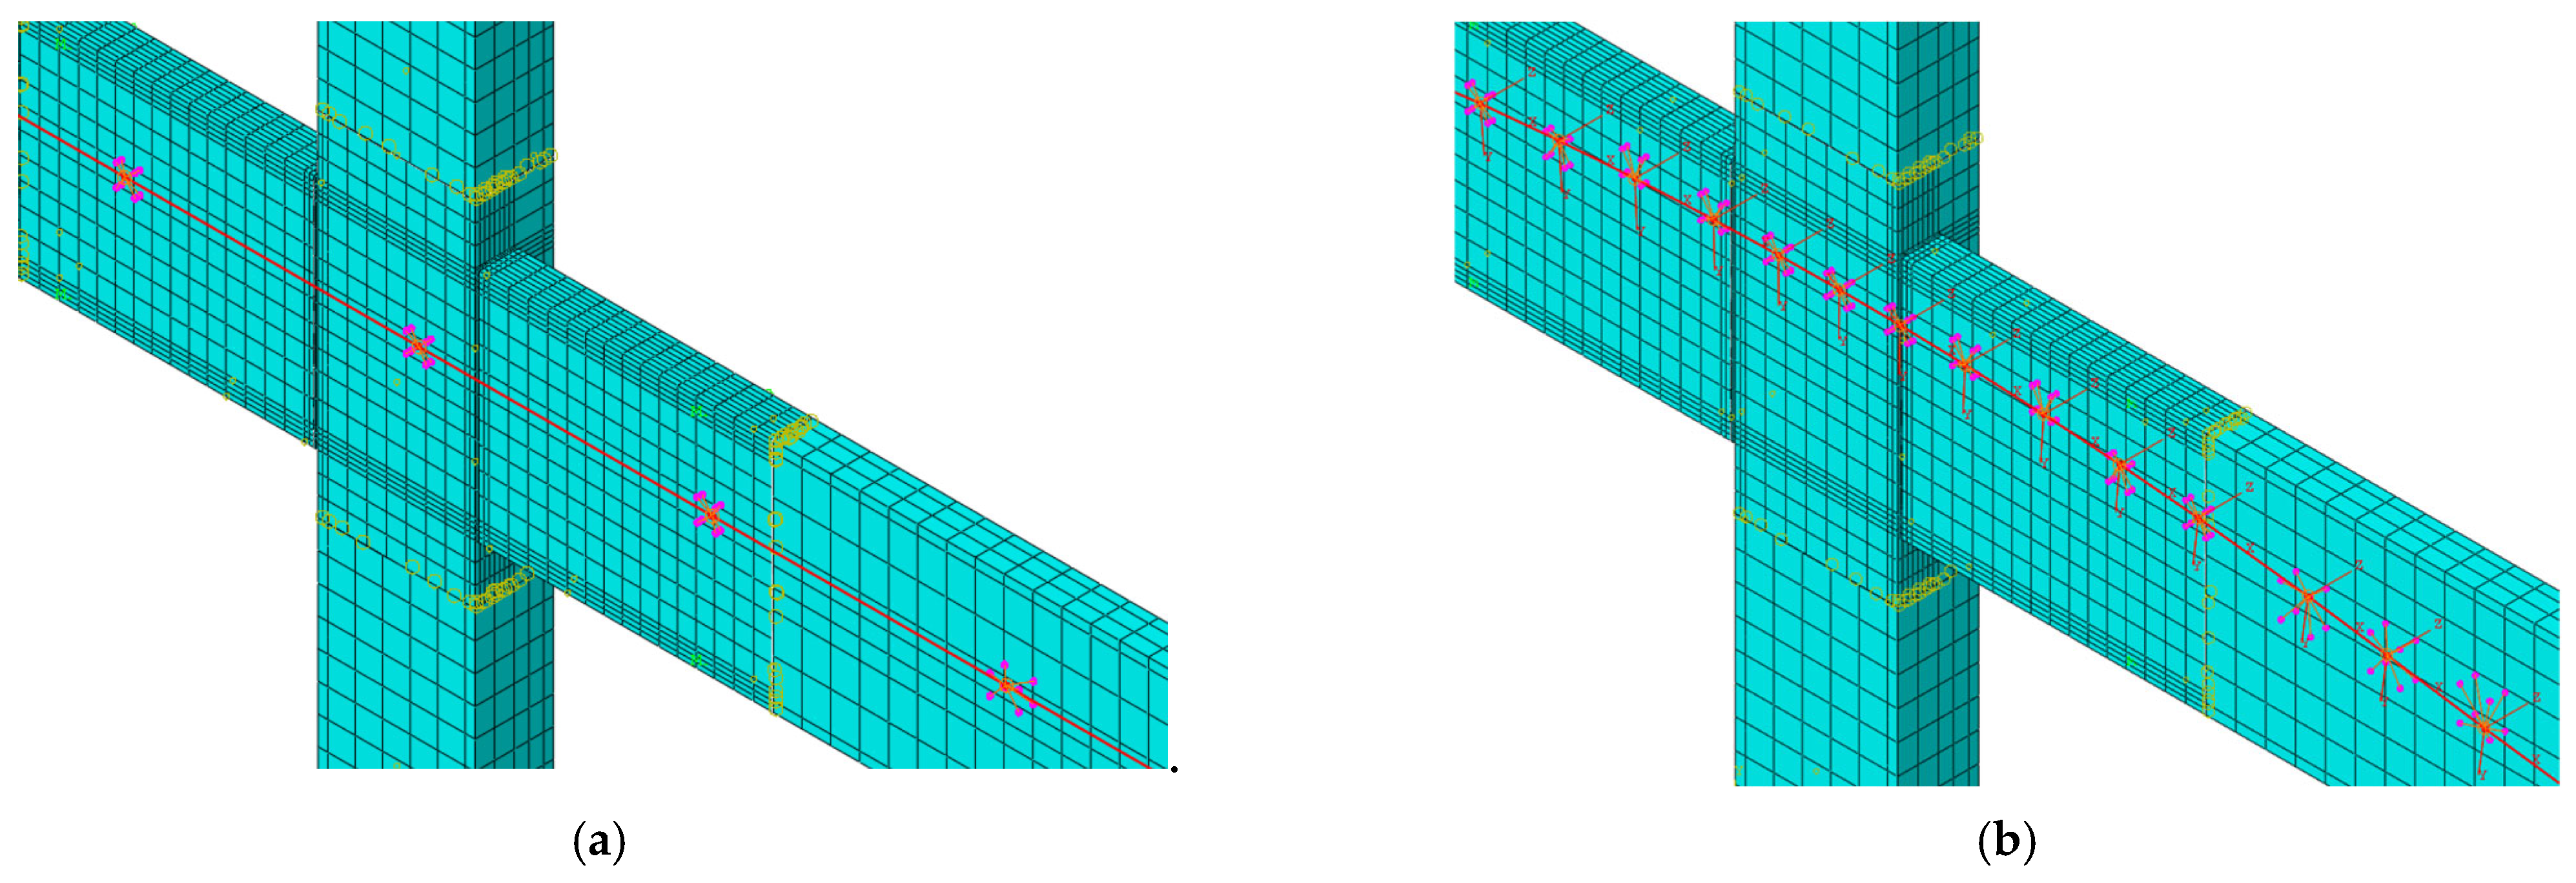
In all three methods, linear reduced integral entity units (referred to as C3D8R) were used for the beam–column concrete (including grout), and linear 3D truss units (referred to as T3D2) were used for all reinforcements and PT steels. The plastic damage model (CDP) was used for concrete. The constitutive stress–strain relationship for unconfined concrete was determined according to the Chinese code, whereas that for confined concrete was determined according to the Mander model [26]. Except for the mild steels used in method 2, a bilinear constitutive model was used for the reinforcement and PT steels [27]. The prestressed tension effect was simulated by choosing the equivalent cooling method, and the unbonded sections of mild steels and PT steels were simulated equivalently using the coupling constraint by releasing only the translational degrees of freedom along the tangential direction of the reinforcement. As shown in Figure 3, the simulation method for the unbonded sections of straight and curved PT steels is the same; however, PT steels need to create a local coordinate system and use it as a reference to release the translational degree of freedom along the tangential direction.
In this study, the CZM method refers to the FEM method of analyzing hybrid connection joints by setting cohesive elements to consider the crack development of the beam–column joint surface and the bond–slip of mild steel. The basic idea behind this method is that the T3D2 element is used for ordinary reinforcement and PT steels, whereas the C3D8R element is used for mild steels. A zero-thickness cohesive element was embedded between the contact surface of the mild steel and concrete, and the beam–column joint surface was used to describe the separation and sliding phenomenon between the surfaces. In addition, there was no difference between the CZM method and the three conventional modeling methods.
In the modeling process, the CZM can be set based on the surface and surface contact properties of the interaction module. As shown in Figure 4a, the direction of the CZM includes a pure normal direction and two pure tangential directions. For the bonded interface between mild steel and concrete, the parameters of the CZM in two tangential directions (including viscous behavior and damage) can be obtained by the conversion of the bond–slip constitutive relation between the reinforcement and concrete in the Code for Design of Concrete Structures (GB/T 50010-2010) (referred to as the Concrete Code) [28]. In the normal direction, the cohesive force has little effect on the bond failure behavior of the reinforcement, and its value is consistent with that in two tangential directions. The specific values of the CZM parameters in the tangential direction are as follows: the viscous behavior (including the stiffnesses K ss and K tt ) corresponds to the slope of the dotted line OA segment in Figure 4b; the damage initiation (including the maximum stress S max and T max ) corresponds to τ u in the figure; and the maximum relative displacement in the damage initiation ( δ m 0 ) corresponds to s u in the figure.
It should be noted that while setting the direction of action of the cohesive elements, it is also necessary to set the normal and tangential behavior of the surfaces. The normal behavior adopts hard contact and allows separation after contact, while the tangential behavior adopts Coulomb friction. The friction coefficient is generally taken as 0.2 to 0.6 [29] to avoid penetration between the two types of surfaces; after considering the damage of the cohesive elements, specific definitions of contact properties are shown in Table 1.
In addition, for the unbonded interface between mild steel and concrete, only the normal and tangential contact behaviors must be defined, with the normal direction being hard contact and allowing separation after contact, and the tangential direction being frictionless. For the crack development of the beam–column joint surface, the parameters were the same as those of the bonded section of the mild steel except that the cohesive parameters were obtained from the tensile strength test of the beam–column joint surface. It is no longer necessary to create a common reference point at the center of the surface because the coupling constraints for mild steels are modeled with entity units that can withstand forces in all directions, which can better simulate the crack development of the surface.

2.3. Simulation Results and Analysis

In this section, the FEM simulation and test results are compared and analyzed with reference to the hybrid connection joints of Thai scholar Yooprasertchai [14], NIST [11], and Dongyan Wang [30]. The Yooprasertchai test included the edge (EHJ) and middle joints (IHJ). The NIST project test included the middle joints M-P-Z4, N-P-Z4, and O-P-Z4. The Dongyan Wang test included the edge joints HCB1, HCB2, and HCB3. The Dongyan Wang test adopted quasi-static beam-end loading, whereas the other tests adopted quasi-static column-end loading. The PT steels in all three tests were linear and arranged at the center of the beam section. In the NIST project tests, the PT steel was set as partially unbonded, whereas in the remaining two tests, the PT steel was set as fully unbonded. To validate the applicability of the CZM method, eight test joints were simulated and analyzed in this study and compared with the conventional models as well as the test results.

2.3.1. Hysteresis and Skeleton Curves

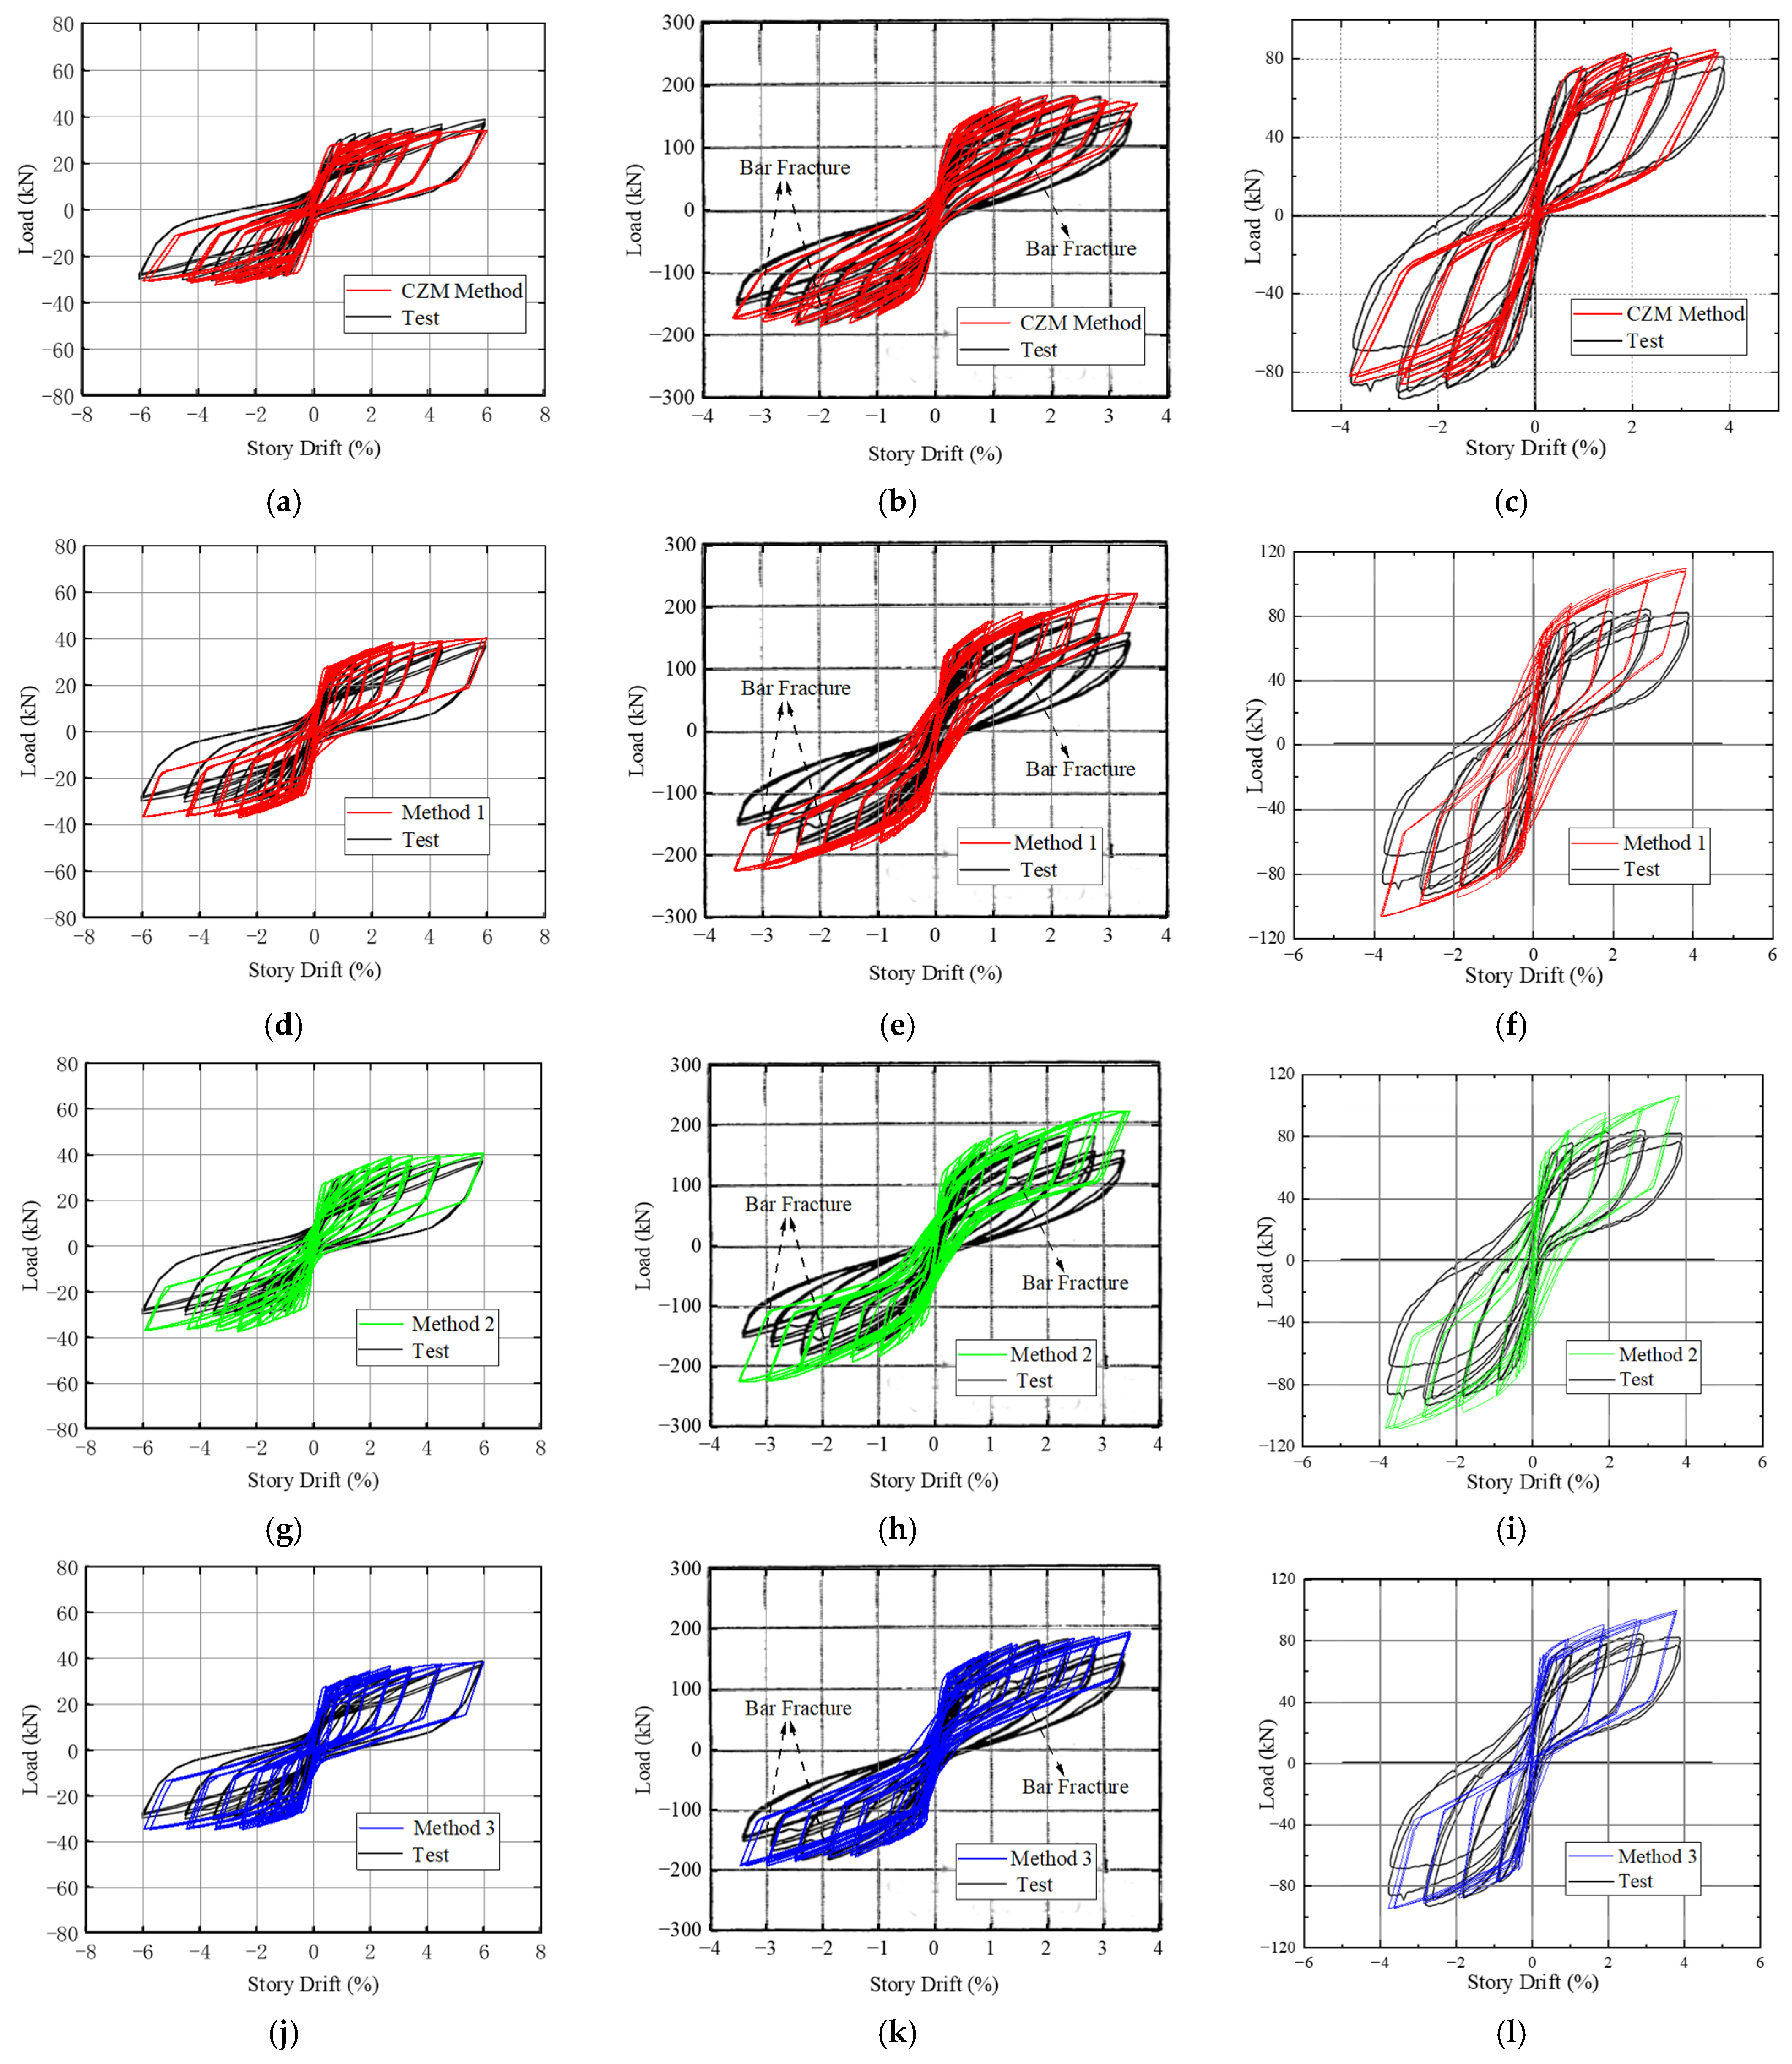
In this subsection, one representative joint from each of the Yooprasertchai, NIST, and Dongyan Wang tests is selected to compare the hysteresis and skeleton curves simulated by the CZM method and the conventional methods; the remaining joints can be found in Reference [31]. A comparison of the simulated and experimental hysteresis and skeleton curves of EHJ, M-P-Z4, and HCB1 are shown in Figure 5 and Figure 6, respectively. It is worth noting that the hysteresis curve of the edge joint EHJ is certainly asymmetric owing to the column end loading (asymmetric load effect), whereas the simulation is basically symmetrical. Therefore, the simulation value of the negative bearing capacity is always larger than the test value. Consequently, the three existing methods cannot effectively simulate the asymmetric effects of loads.
However, in the simulation of the CZM method, the simulated hysteresis curve shape, pinch tendency, and stiffness of the specimens were consistent with the test results, as shown in the figures, except for HCB1, whose negative pinch of the test hysteresis curve was weakened at the late stage of loading. In addition, the simulated yield load, ultimate load, and ductility of all specimens were in good agreement with the test results [31].
It should be noted that the CZM method can also effectively reflect the hysteresis and skeleton curve asymmetry caused by the load asymmetry effect of the EHJ, whereas the first three methods cannot be effectively simulated. In addition, some specimens had bar fractures in the later stage of the test, resulting in a rapid decline in the bearing capacity, which is difficult to simulate using FEM.

2.3.2. Residual Deformation

The residual deformation of the joint can be used to directly evaluate its self-centering performance, which is usually expressed by the residual deformation rate ( μ r ) and can be calculated as
μ r = Δ r / Δ u
where Δ u is the maximum displacement of the current cyclic loading, and Δ r is the residual deformation after unloading of the current cyclic loading.
The results of the simulated and tested residual deformation at each joint are shown in Table 2, where δ μ r represents the relative error between the simulated value μ r and the experimental value μ r . As indicated in the table, specimens HCB1, HCB2, and HCB3 were highly asymmetrical in the test hysteresis curves (center symmetrical in the simulation), resulting in a larger positive δ μ r and smaller negative δ μ r . The simulation effect of method 1 was the worst, with δ μ r in the range of 17.8% to 284.3% and δ ˜ μ r of 61.7%. The improvement effect of method 2 was not obvious, and δ μ r was in the range of 7.8% to 214.9%, while δ ˜ μ r was 55.7%. The simulation results of method 3 were relatively good after equivalently increasing the unbonded length of mild steel, with δ μ r in the range of 5.0% to 85.1% and δ ˜ μ r of 26.7%.
According to the residual deformation indexes simulated for each joint using the CZM method, it can be seen that the HCB series had a large δ μ r , and the analysis showed that during the loading process, there may be some systematic deviations in the test, resulting in a high degree of asymmetry in the test hysteresis curve of the HCB series. In contrast, the simulation was centrosymmetric, and the test hysteresis curves of other specimens were centrosymmetric.
The δ μ r of the positive and negative directions of N-P-Z4 was too large, and the analysis showed that in the later stage of loading, the simulated PT steels underwent serious plastic deformation, whereas the experimental PT steels exhibited little plastic deformation owing to the deformation of the anchorage [31]. In addition, the large errors of the four specimens N-P-Z4, HCB1, HCB2, and HCB3 simulated using the CZM method were also related to the small absolute value of Δ r in the table.
Briefly, the CZM was used to simulate the residual deformation of the joint. The relative error was close to 2/3 of the value within 15%, and it was concentrated at approximately 10%. This improvement was clearly better than that of the third method. Therefore, this method can reasonably reflect the residual deformation of the joint. In short, the δ μ r simulated by the CZM method is mostly within 15% and concentrated in about 10%, and the improvement effect is obviously better than that of method 3, indicating that the CZM method can reflect the residual deformation of such joints more reasonably.

2.3.3. Energy Dissipation Performance

The energy dissipation performance of joints can be evaluated by calculating the equivalent viscous damping coefficient ( ξ eq ). The results of the simulated and tested ξ eq at each joint are shown in Table 3, where δ ξ eq represents the relative error between the simulated value ξ eq and the experimental value ξ eq . As indicated in the table, the simulation effect of method 1 was the worst, the δ ξ eq of method 1 was in the range of 20.2% to 31.5%, and δ ˜ ξ eq was 26.3%. The performance of method 2 was slightly better, with δ ξ eq in the range of 14.9% to 28.7% and δ ˜ ξ eq of 21.7%. In contrast, the simulation effect of method 3 was relatively good. For method 3, δ ˜ ξ eq was in the range of 4.5% to 34.0%, and δ ˜ ξ eq was 15.2%.
According to the energy dissipation performance indexes simulated for each joint using the CZM method, it can be seen that except for HCB1, the effect of using the CZM method to simulate the energy dissipation performance of the joint was clearly better than that of method 3. Even if the effects of the EHJ and IHJ were relatively good in method 3, the CZM method was better than method 3. Except for N-P-Z4 and HCB1, which had larger δ ξ eq (by more than 20%) simulated by the CZM method, the δ ξ eq of the rest of the joints could be basically controlled at approximately 10%. Therefore, the CZM can more accurately reflect the energy dissipation performance of such joints.
For the failure mode, ductility, and PT steel stress growth of the specimens, a comparison between the simulation results of the four methods and the experimental results can be found in [31].
In summary, method 1 does not consider the bond–slip of mild steels, and the simulation effect is the worst. Method 2 adjusts the actual hysteretic constitutive relation of mild steel to consider its bond–slip, and the effect is basically the same as that of method 1. Method 3 artificially increases the unbonded length of the mild steel to consider its bond–slip, and its effect is slightly improved compared to methods 1 and 2, but the error in key performance indicators such as residual deformation is still large. In addition, other studies [32,33] have added bond elements between concrete and reinforcement to consider their bond–slip, but since the hysteresis rule of bond elements is that the unloading path “returns” along the loading path, they can only be used for the analysis of linear elastic structures.
However, the CZM method can effectively simulate the bond–slip of mild steel and the crack development of the beam–column joint surface. In addition, it can accurately reflect seismic performance indices such as the failure mode, energy dissipation performance, and PT steel stress growth of hybrid connection joints. In particular, in terms of residual deformation, the simulation effect of the CZM method was clearly better than that of method 3. Therefore, the CZM method can better satisfy the demand for FEM analysis of the seismic performance of hybrid connection joints.

3. Example Design of the Hybrid Connection Joints of Large-Span Frames

Compared to the hybrid connection joint of an ordinary-span frame, the hybrid connection joint of a large-span frame, which is based on the dual control principles of anti-cracking and self-centering performance (Figure 7), has three unique characteristics. First, PT steels are placed in a curved manner, with the curve near the beam–column joint surface located at the section center (or slightly above) and the curve at the mid-span of the beam located at the bottom of the beam. The purpose is to improve the anti-cracking performance of the beam mid-span and the beam end at the beam–column joint surface. Secondly, due to the large span-to-height ratio of the hybrid connection joint of a large-span frame, the effective stress of PT steels can be significantly increased, thereby fully utilizing the PT steels’ effect and improving the self-centering performance of the joints. Third, the concrete in the plastic hinge zone located at the beam ends can be replaced by fiber-reinforced concrete to avoid premature crushing of the concrete at this location and improve its anti-cracking performance (fiber-reinforced concrete was not used in the joint examples in this study).

3.1. Basic Information

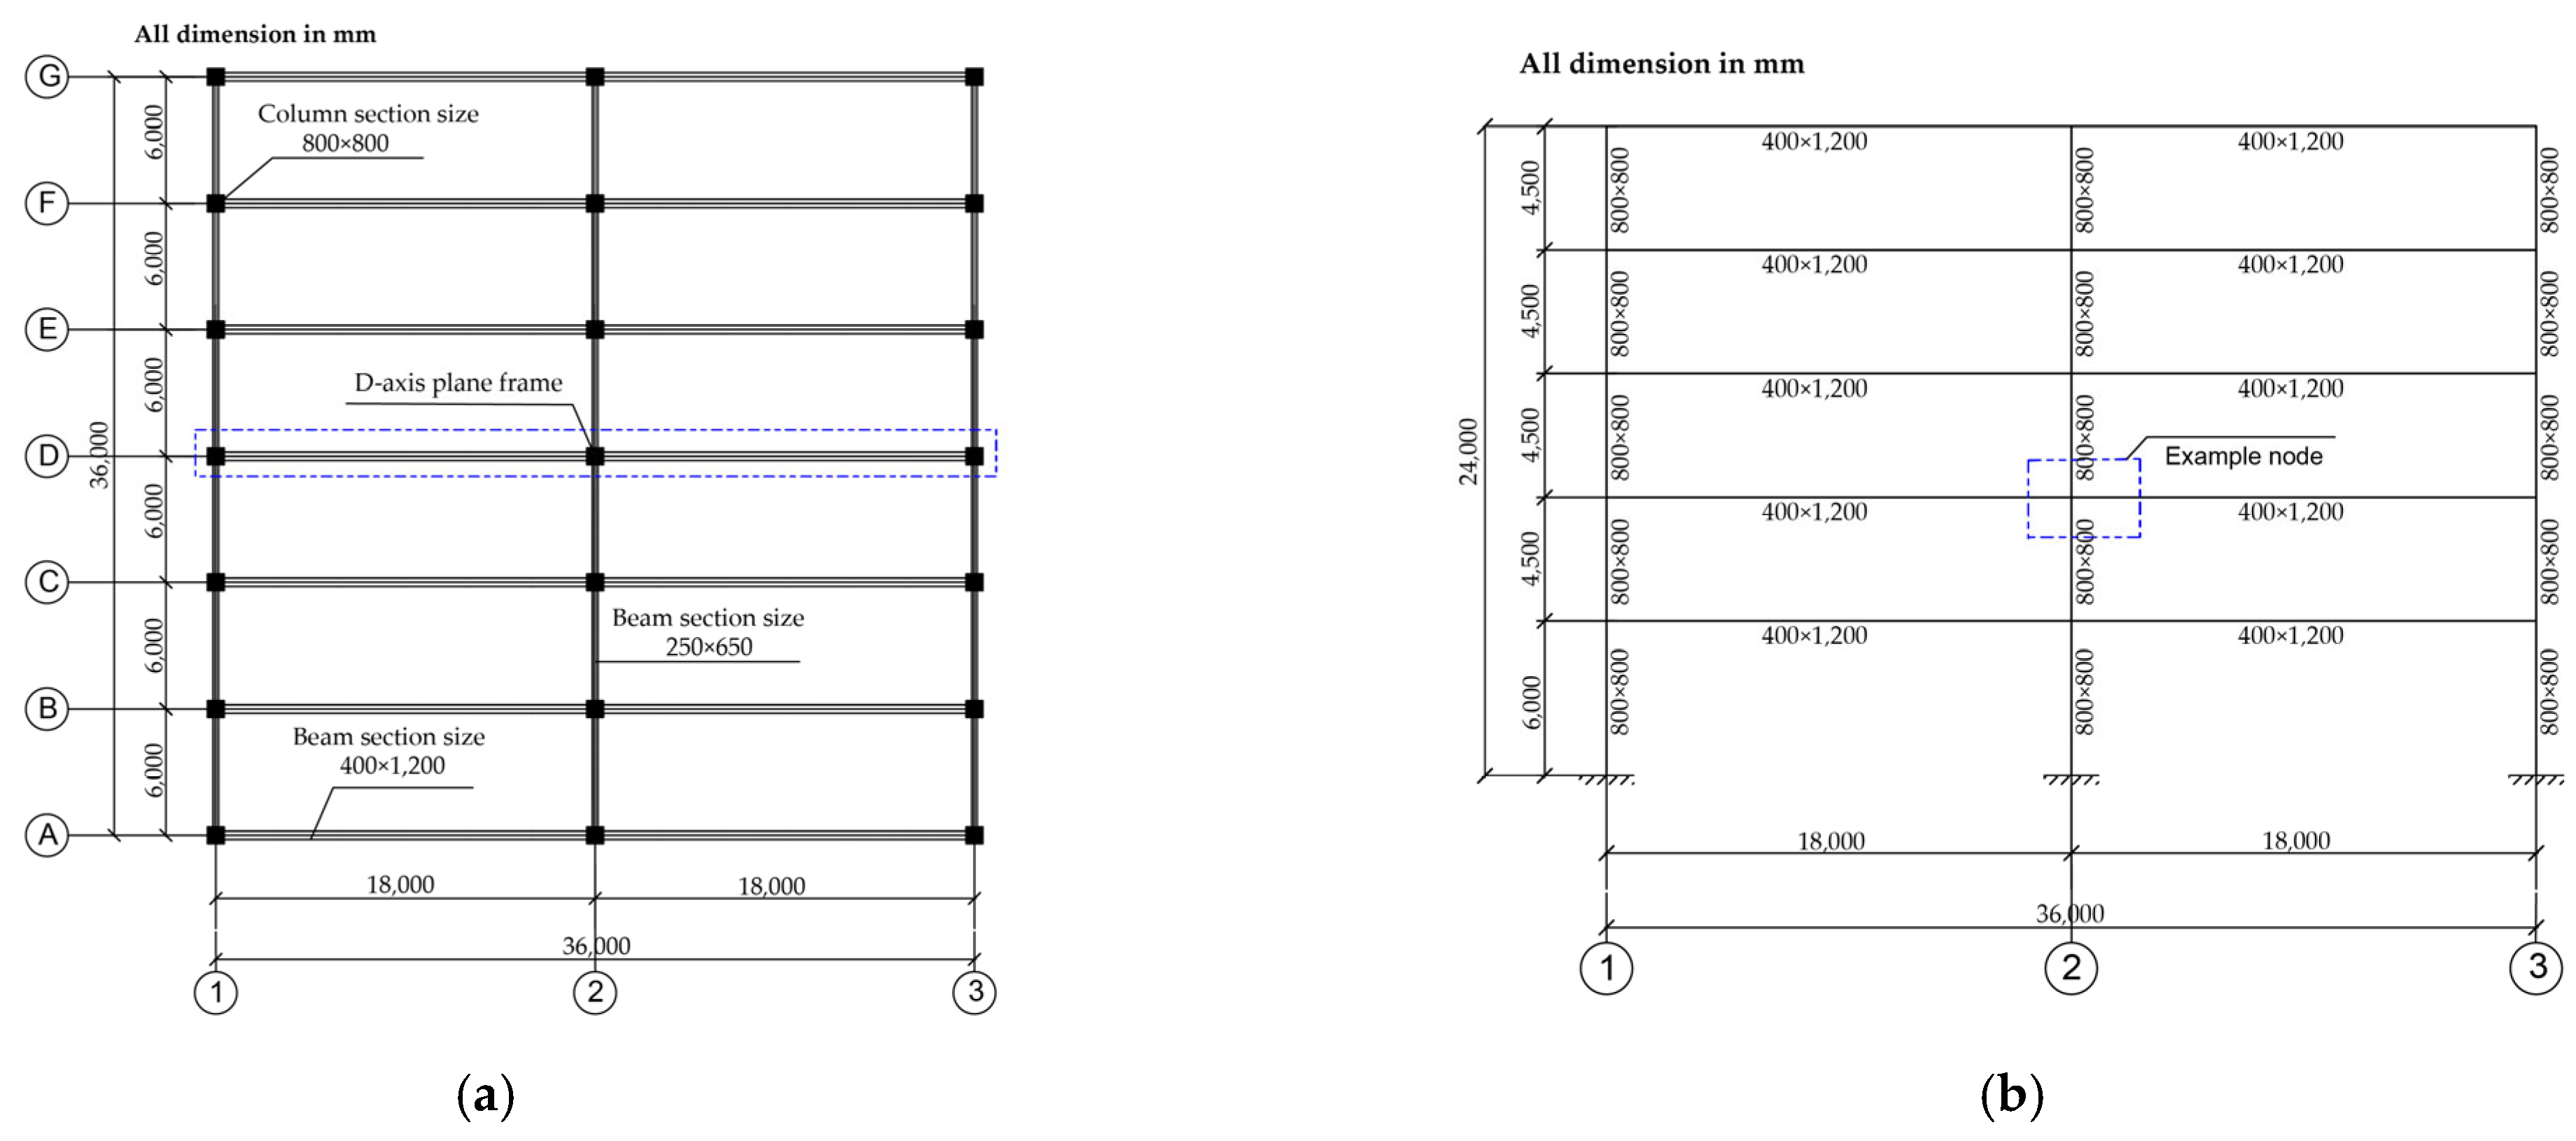
The hybrid connection joint of a large-span frame investigated in this study is based on a five-story large-span hybrid connection frame structure. It is assumed that the structural cases are in the Code for Seismic Design of Buildings (GB 50011-2010) (referred to as the Seismic Code) [7]. The design working life of the structure is 50 years, the importance coefficient of the structure is 1.0, and the plane and elevation of the structure are regular. The structure is located in seismic intensity region 8 (PGA = 200 gal) and is set at the site of class II with design seismic group II and environmental category class II. As shown in Figure 8, the total size of the structural plane is 36 m × 36 m. Two full-length unbonded or partially unbonded prestressed frame beams with a span of 18 m are arranged longitudinally, and six ordinary frame beams with a span of 6 m are arranged horizontally. The total height of the structure is 24 m, the height of the bottom layer is 6 m, and the heights of layers 2 to 5 are 4.5 m. The section sizes of the longitudinal frame beam, transverse frame beam, and frame column are 400 mm × 1200 mm, 250 mm × 650 mm, and 800 mm × 800 mm, respectively. In this study, a plane frame on the D-axis was selected for the internal force calculation of the structure, and the middle joint of the second floor was considered as the analysis object.

3.2. Load Distribution

The roof and floor panels of the structure are made of prefabricated hollow slabs. The roof has a dead load of 4.1 kN/m2 and a live load of 2.0 kN/m2, while the floor has a dead load of 3.4 kN/m2 and a live load of 3.0 kN/m2. Additionally, the parapet walls are arranged around the perimeter of the roof with a line load of 7.2 kN/m. The infill walls are arranged around the perimeter of the floor with a transverse line load of 8.2 kN/m and a longitudinal line load of 6.8 kN/m. It should be noted that compared with the seismic action, the wind load is small and does not play a controlling role. Therefore, the horizontal load only considered the seismic action to better study the mechanical properties of a large-span hybrid frame under seismic action.

3.3. Load Combinations

To better investigate the effects of seismic actions on the structure, this study considered load combinations that included only the effects of seismic actions. According to the relevant Chinese codes for load combination, the load combination effect at the beam–column joint surface of the joint examples in this paper is 1942 KN⋅m, so the design of subsequent joint examples will adopt this value uniformly.

3.4. Material Properties

C40-grade concrete was used for all precast beams and columns. The longitudinal reinforcement of the beams and columns was HRB400E-grade hot-rolled ribbed bars; the stirrup was HPB300-grade hot-rolled plain bars; and the mild steel was HRB400E, HRB500E, or HRB600E-grade hot-rolled ribbed bars. Large-span prestressed frame beams were configured with an 1860-degree tendon with a diameter of 15.2 mm. The mechanical properties of steel and concrete are shown in Table 4 and Table 5, respectively.

3.5. Design of Joint Examples

The reinforcement design of a hybrid connection joint includes the reinforcement design of the precast beam, the precast column, and the reinforcement design of the beam–column interface. Since the prefabricated frame of the large-span hybrid connection joint has a similar initial stiffness to the corresponding cast-in-place frame [34], the reinforcement design of the beam and column can be carried out using the same design methods as the cast-in-place frame. The reinforcement design of the beam–column joint surface refers to the design method for the Prestressed Seismic Code [35]. This study focuses on the self-centering performance and energy dissipation performance of the joints in the design of joint examples. The factors considered for self-centering performance include the bending capacity ratio ( φ des ), effective stress ( σ pe ), and unbonded length of the PT steels ( L ups ), as well as the eccentricity between the PT steels and the section center at the beam–column joint surface (referred to as the eccentricity of the PT steels, e p ). The factors considered for energy dissipation performance include φ des , the grade of the mild steels and the unbonded length of the mild steels ( L u ).
Taking all the factors into consideration, the design of the joint examples in this study was divided into six groups (groups A to F), with a total of 16 joint examples, as shown in Table 6. Joints LHJ and LHJ-SL are the basic examples, with LHJ-SL using a straight arrangement for the PT steel, whereas the rest of the examples use a curved arrangement. Each group of joints has only one changed parameter. Specifically, group A changes the parameter φ des and is named the LHJ-C series; group B changes the parameter σ pe and is named the LHJ-PE series; group C changes the parameter e p and is named the LHJ-E series; group D changes the parameter L ups and is named the LHJ-UP series; group E changes the strength grade of the mild steels and is named the LHJ-G series; and group F changes the parameter L u and is named the LHJ-U series.
It is worth noting that the reinforcement area of the cross section in the examples in this study is the calculated area to avoid errors caused by the selection of the reinforcement diameter. In addition, some seismic measures of the structure are implemented in accordance with the Prestressed Seismic Code [19].

4. Seismic Performance Analysis of the Hybrid Connection Joints of Large-Span Frames

4.1. Establishment of FEM

The size and loading method of the joint examples are shown in Figure 9a, where the FEM is a 1:1 scale model compared with the prototype frame. An FEM of the hybrid connection joint of a large-span frame established using the CZM method is shown in Figure 9b. In the model, the material properties of the concrete, reinforcement, and PT steels are all average values, and the fiber-reinforced grout joint used for the precast beam–column interface adopts the same material properties as C40 concrete.
As shown in Figure 9a, the joint examples in this study were subjected to quasi-static column-end loading. First, a vertical load with a constant axial pressure (axial compression ratio μ = 0.26 ) was applied to the top of the column. Then, a horizontal reciprocating load was applied to the column end. The horizontal reciprocating load was controlled by displacement. According to the seismic requirements of the joints under different θ, seven levels of variable amplitude loading were considered, and each level was cycled three times. The loading systems are presented in Table 7.

4.2. Self-Centering Performance

This section discusses four groups of sample joints (groups A to D). By comparing and analyzing the hysteresis curve, stress growth of PT steels, and residual deformation of the example joints, a summary of the self-centering performance and stress growth rules of PT steels was obtained.

4.2.1. Hysteresis Curves

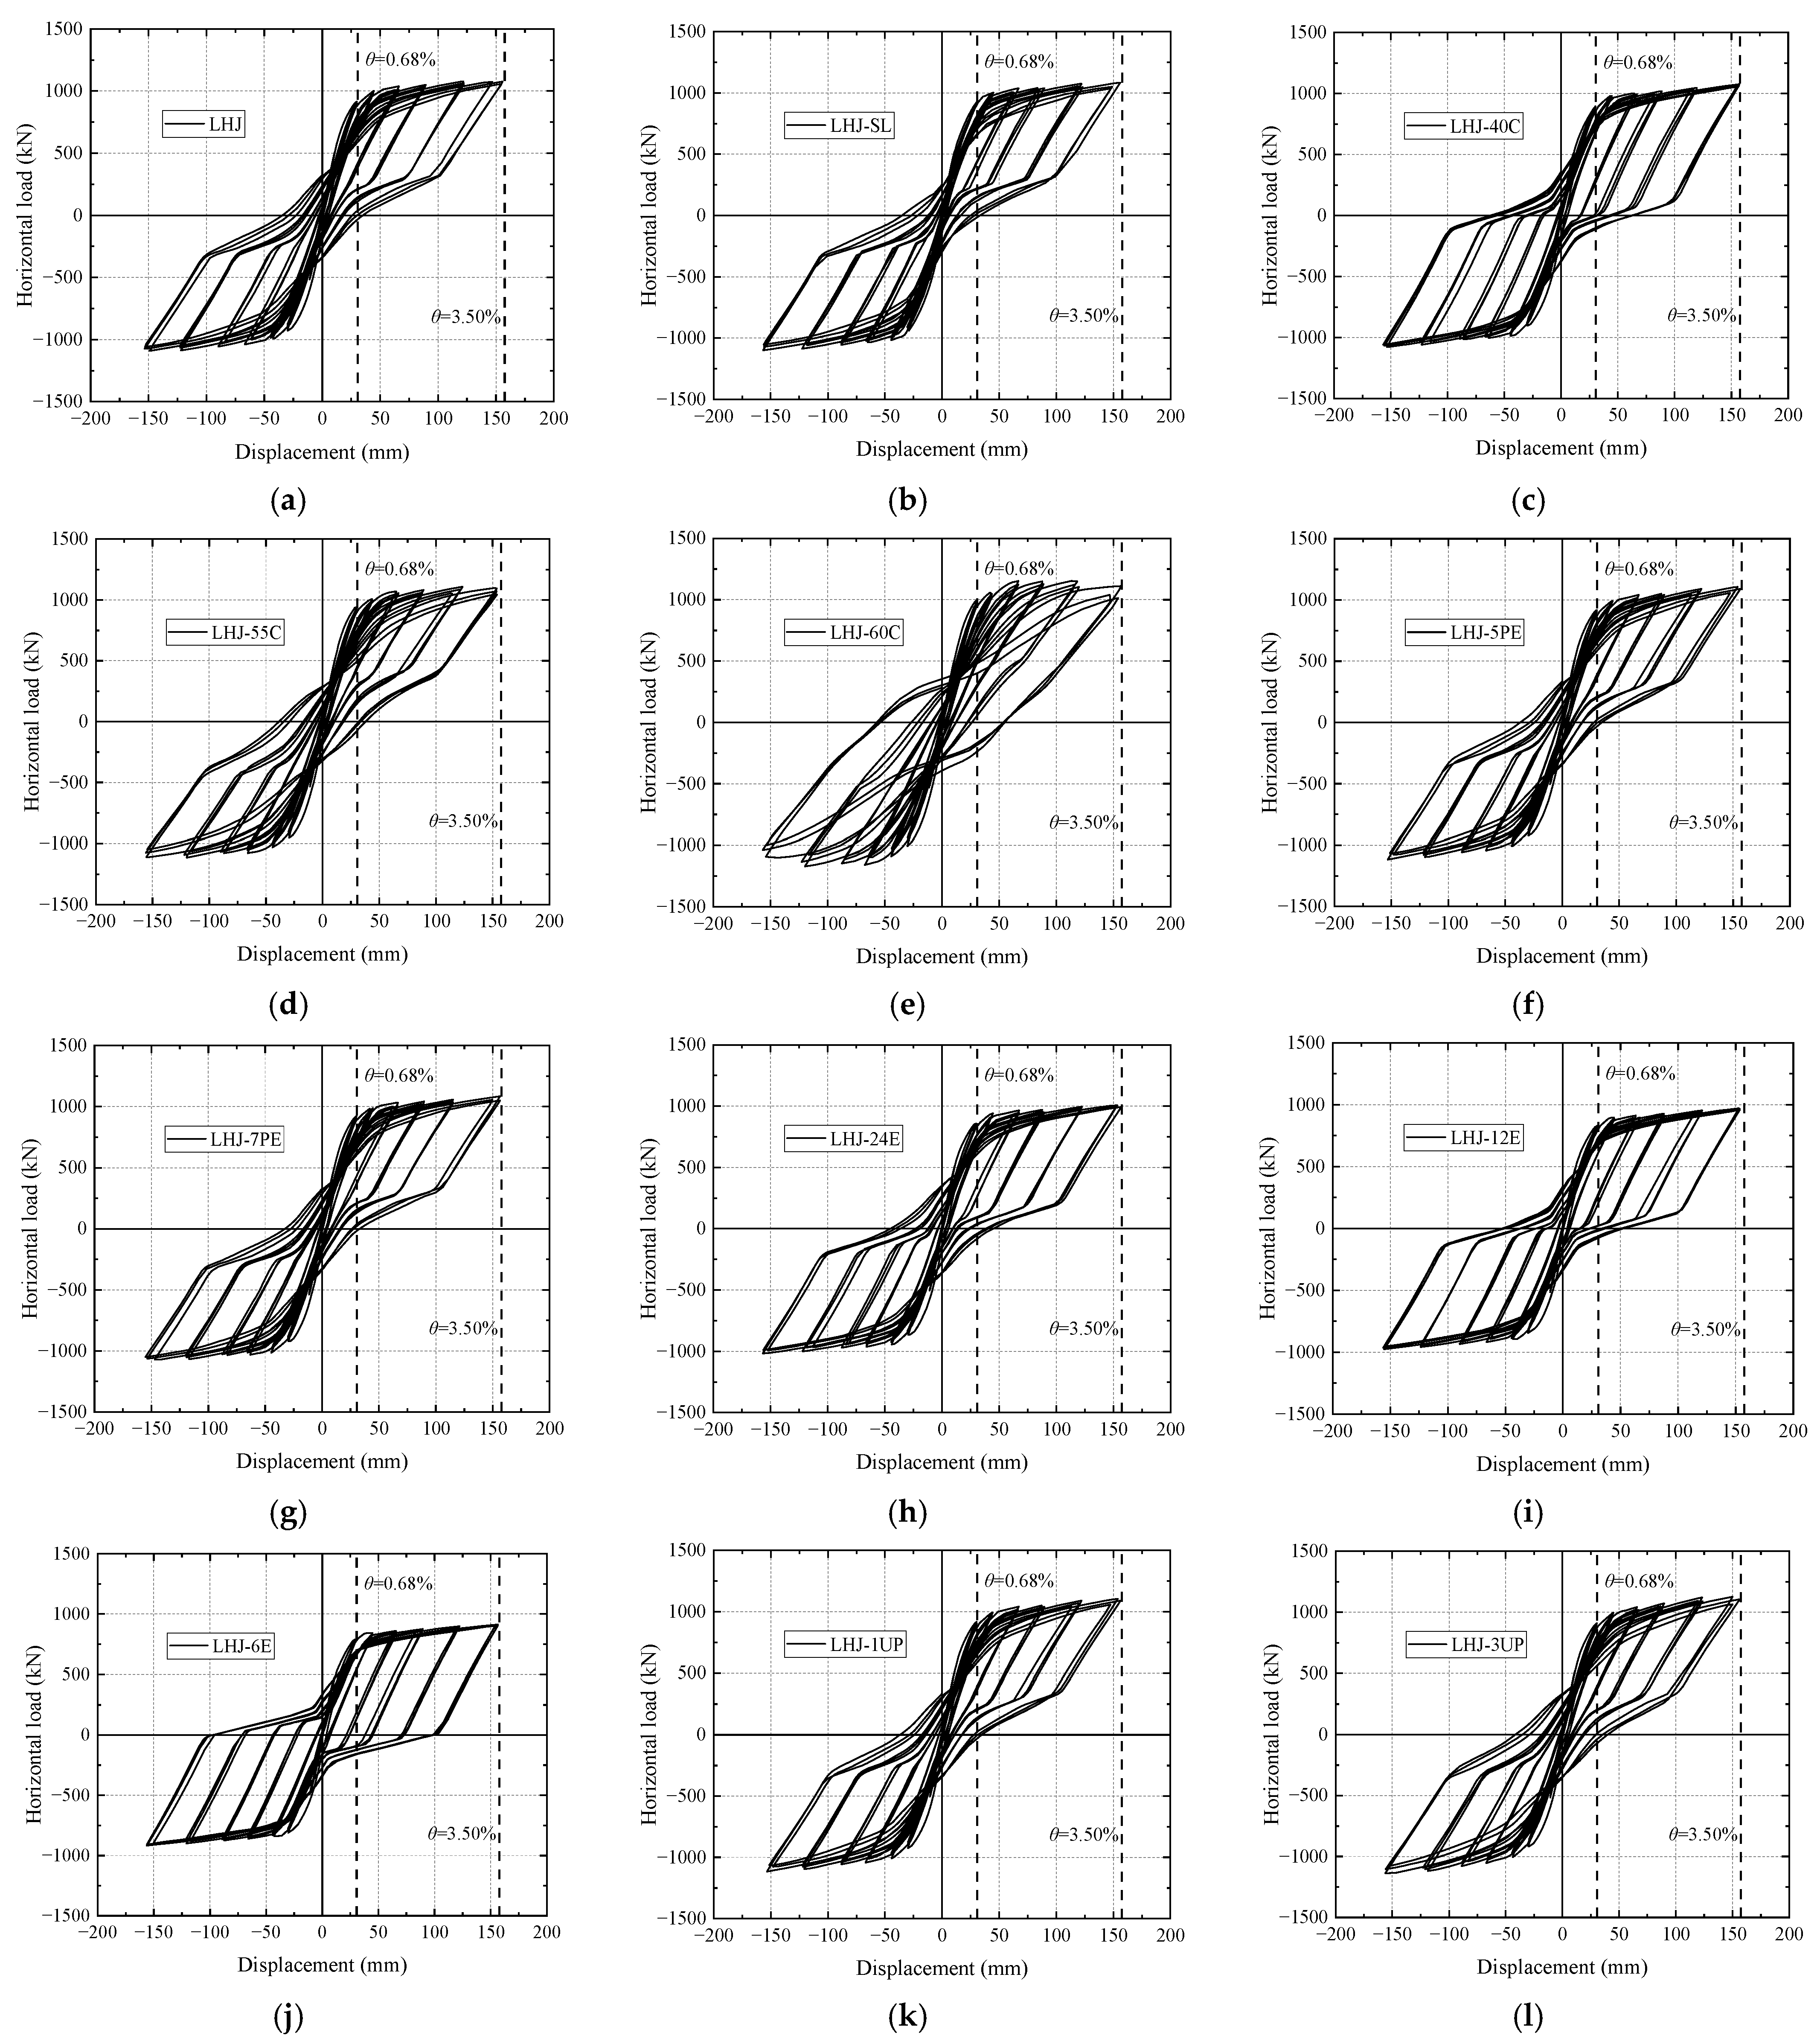
The hysteresis curves of the example joints from groups A, B, C, and D under seismic loads are shown in Figure 10. It can be observed in the figure that the hysteresis curves of the hybrid connection joints are similar to a flag, which indicates an obvious pinch effect and small residual deformation. The difference in the design bearing capacity of each example joint is less than 8%, and the ultimate bearing capacity of the simulated result is generally 38% to 42% larger than the design bearing capacity [31], indicating that such joints have a certain safety reserve. This is because the material properties in the finite element simulation used the average values, whereas the design bearing capacity was calculated using the design value.
(1)
Bending bearing capacity ratio of PT steels φ des . Comparing Figure 10a, Figure 10c, Figure 10d, and Figure 10e with the decrease in φ des , the figures show a more obvious flag feature. Meanwhile, the unloading stiffness of the two-fold line is more notable, and the unloading of the two-fold line reflects the stress characteristics of the hybrid connection joint.
(2)
Effective stress in PT steel σ pe . By comparing Figure 10a, Figure 10f, and Figure 10g, it can be seen that the change has no effect on the shape of the hysteresis curve of the joint, and its loading and unloading stiffness, bearing capacity, and pinch trends are basically the same.
(3)
Calculation of the PT steel eccentricity e p . Comparing Figure 10a, Figure 10b, Figure 10h, Figure 10i, and Figure 10j, when e p = 0 , the mechanical performance of the joint is almost the same, regardless of whether the PT steels are placed in a curved or straight manner. The pinch trend, stiffness, and bearing capacity of the hysteresis curve are basically the same. For the joint which PT steels is placed in a curve manner, as e p increases, there are obvious differences in the hysteresis curve among the joint examples, such as the reduction in bearing capacity, the degradation of unloading stiffness, and the weakening of pinch.
(4)
Unbonded length of the PT steels. Comparing Figure 10a, Figure 10k, and Figure 10l, as L ups increases from L / 3 to L , this does not cause significant changes in the mechanical properties of the joints, and the pinching trend of the hysteresis curve, bearing capacity, and loading and unloading stiffness are basically the same.

4.2.2. Stress Growth of PT Steels

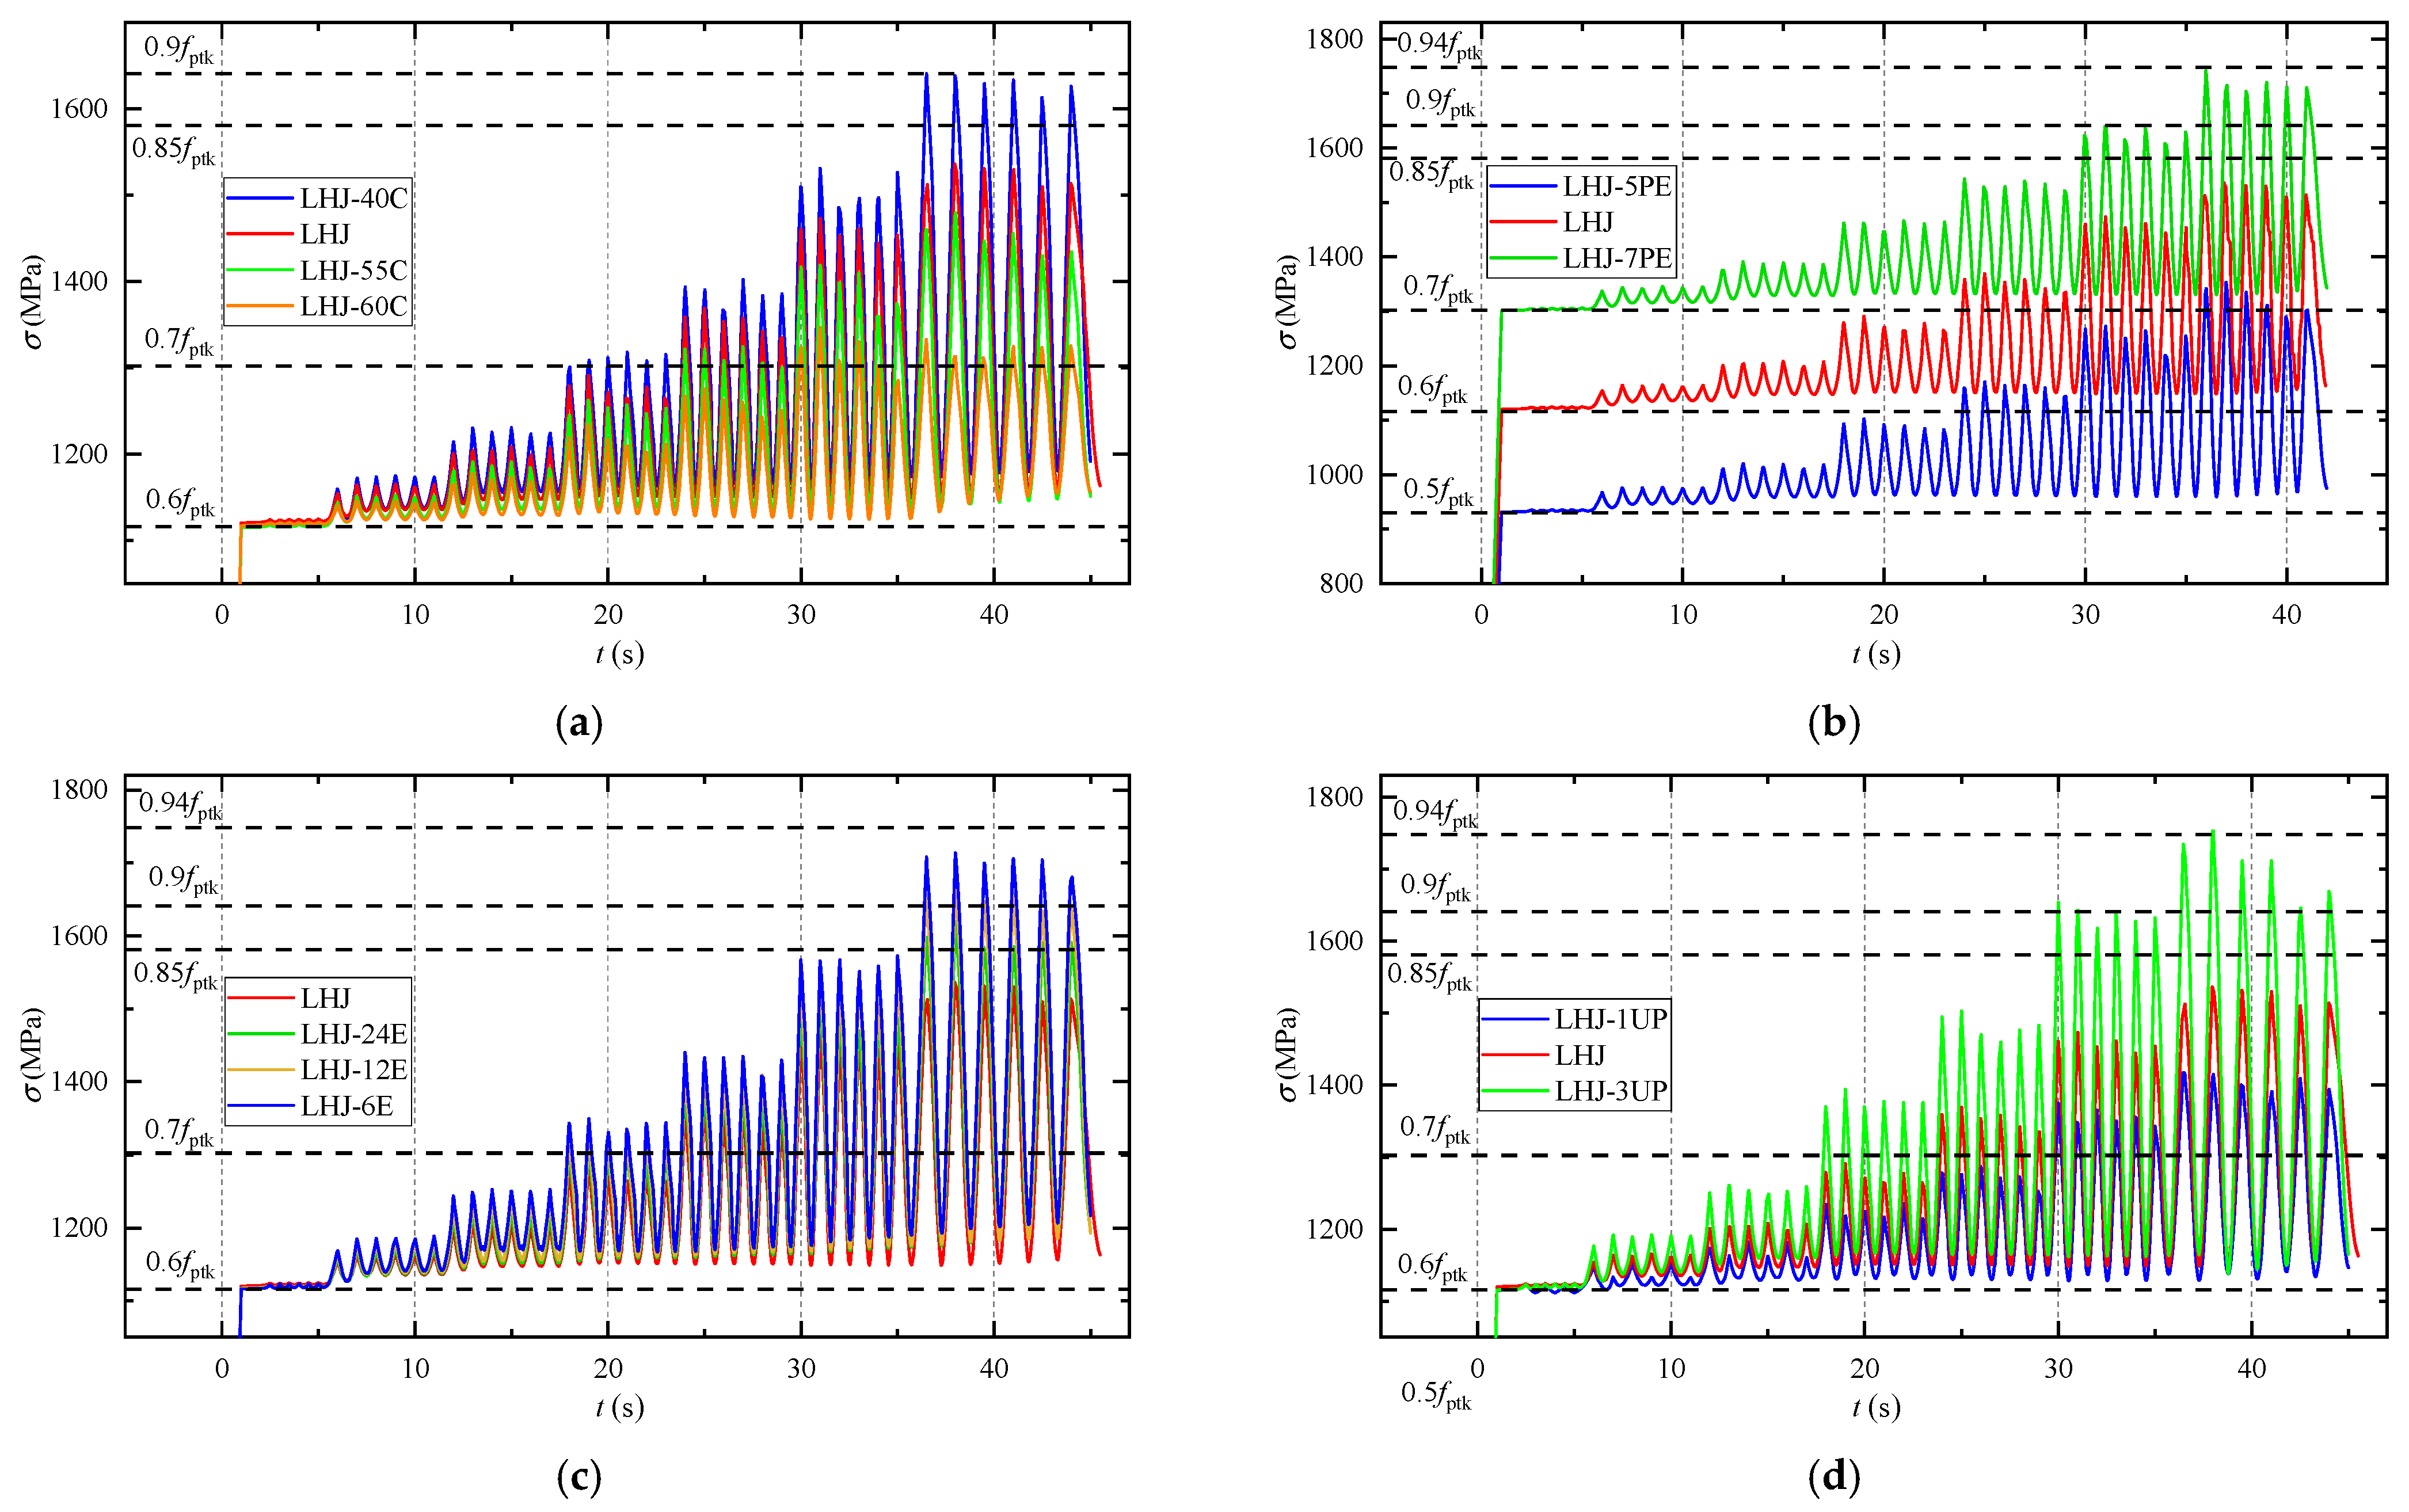
The stress changes in the PT steels under an earthquake are shown in Figure 11, and the stress eigenvalues are listed in Table 8. This shows that the decrease in φ des , increase in e p , and decrease in L ups all lead to an increase in the stress increment of the PT steels, but the change in σ pe has little effect on the stress growth trend. When θ = 2.0 % , the stress increment of PT steels is 0.08 fptk to 0.21 fptk, and the maximum stress of PT steels is 0.83 fptk, which is less than the specified limit of 0.9 fptk in the Prestressed Seismic Standard [19]. When θ = 3.5 % , although the maximum stress of PT steels in some joints exceeds its conditional yield value (0.85 fptk), which is about 0.94 fptk (Table 4), the residual stress value is still greater than the initial effective stress, as there is residual deformation in the joints, and the material properties of the model adopt the average value, so the plasticity of PT steels is not obvious. In short, the example joint designed according to this study will not undergo obvious plastic deformation even with θ = 3.5 % and can provide excellent self-centering ability for the joint.

4.2.3. Residual Deformation

The residual deformations of each joint are listed in Table 9. The following can be observed from the table: (1) The residual deformation of each joint under forward loading (located at the top of the column to the right) is generally larger than that under reverse loading; however, with an increase in θ , the difference between the two gradually decreases. This is because the concrete has accumulated deformation damage, and with an increase in θ , the damage to the concrete in the positive and negative directions tends to be consistent. (2) Compared with LHJ, LHJ-40C, LHJ-55C, and LHJ-60C, the residual deformation of the joint decreases gradually as φ des varies from 0.4 to 0.55, but the residual deformation increases instead when φ des = 0.6 , especially for the increase trend of the latter two-stage loading. This is because the shear deformation of concrete in the core area of the joint is tremendous, and serious damage can occur during a large earthquake [31]. (3) In contrast, in joints LHJ, LHJ-SL, and the LHJ-E series of joints, if PT steels are curved ( e p = 0 ) or straight ( e p = 0 ), the residual deformation is quite the same, but with the increase in e p , the residual deformation of the joint increases significantly. Under the limit displacement state, the maximum value of μ r reaches 60.83%. (4) Compared with the joints LHJ, LHJ-1UP, and LHJ-3UP, the residual deformation of the joints is almost not affected by the increase, and the maximum increment in μ r is no more than 5%.
The safety of the structure was evaluated based on the Code for Civil Building Reliability Appraisal Standard (GB 50292-2015) [35]. Under a large earthquake ( θ = 0.68 % ), the residual story drift (residual deformation Δ r ) of all joints is less than the H i / 150 ( H i is the story height), and the safety can be evaluated as A u , which means there is no effect on the bearing capacity of the structure. Even under the limit value of large earthquake in the Seismic Code ( θ = 2.0 % ), except for node LHJ-6E, the residual story drift of remaining joints is less than H i / 150 , and the safety can still be evaluated as A u or B u , which does not affect the overall bearing capacity of the structure and can be used without taking any treatment measures.

4.3. Energy Dissipation Reinforcement

In this section, the hysteretic curves, damage to mild steels, and energy dissipation performance of the three groups (groups A, E, and F) are compared and analyzed, and the energy dissipation performance law, concrete damage law, and strain growth law of mild steels of such joints are summarized.
Simultaneously, to evaluate the deformation capacity reserve of energy-consuming steel bars and ensure that they can resist a second large earthquake again without replacement, the example of LHJ-30U with the most serious degree of damage of mild steel was used as the object to study the seismic performance of joints under a second large earthquake. An example node of secondary earthquake action was named LHJ-30U-SE. For example, after the first earthquake action of LHJ-30U, the state after complete unloading was considered as the initial state of the second earthquake action loading, and the loading system of the second earthquake action was the same as that of the first earthquake action (Table 7).

4.3.1. Hysteresis Curves

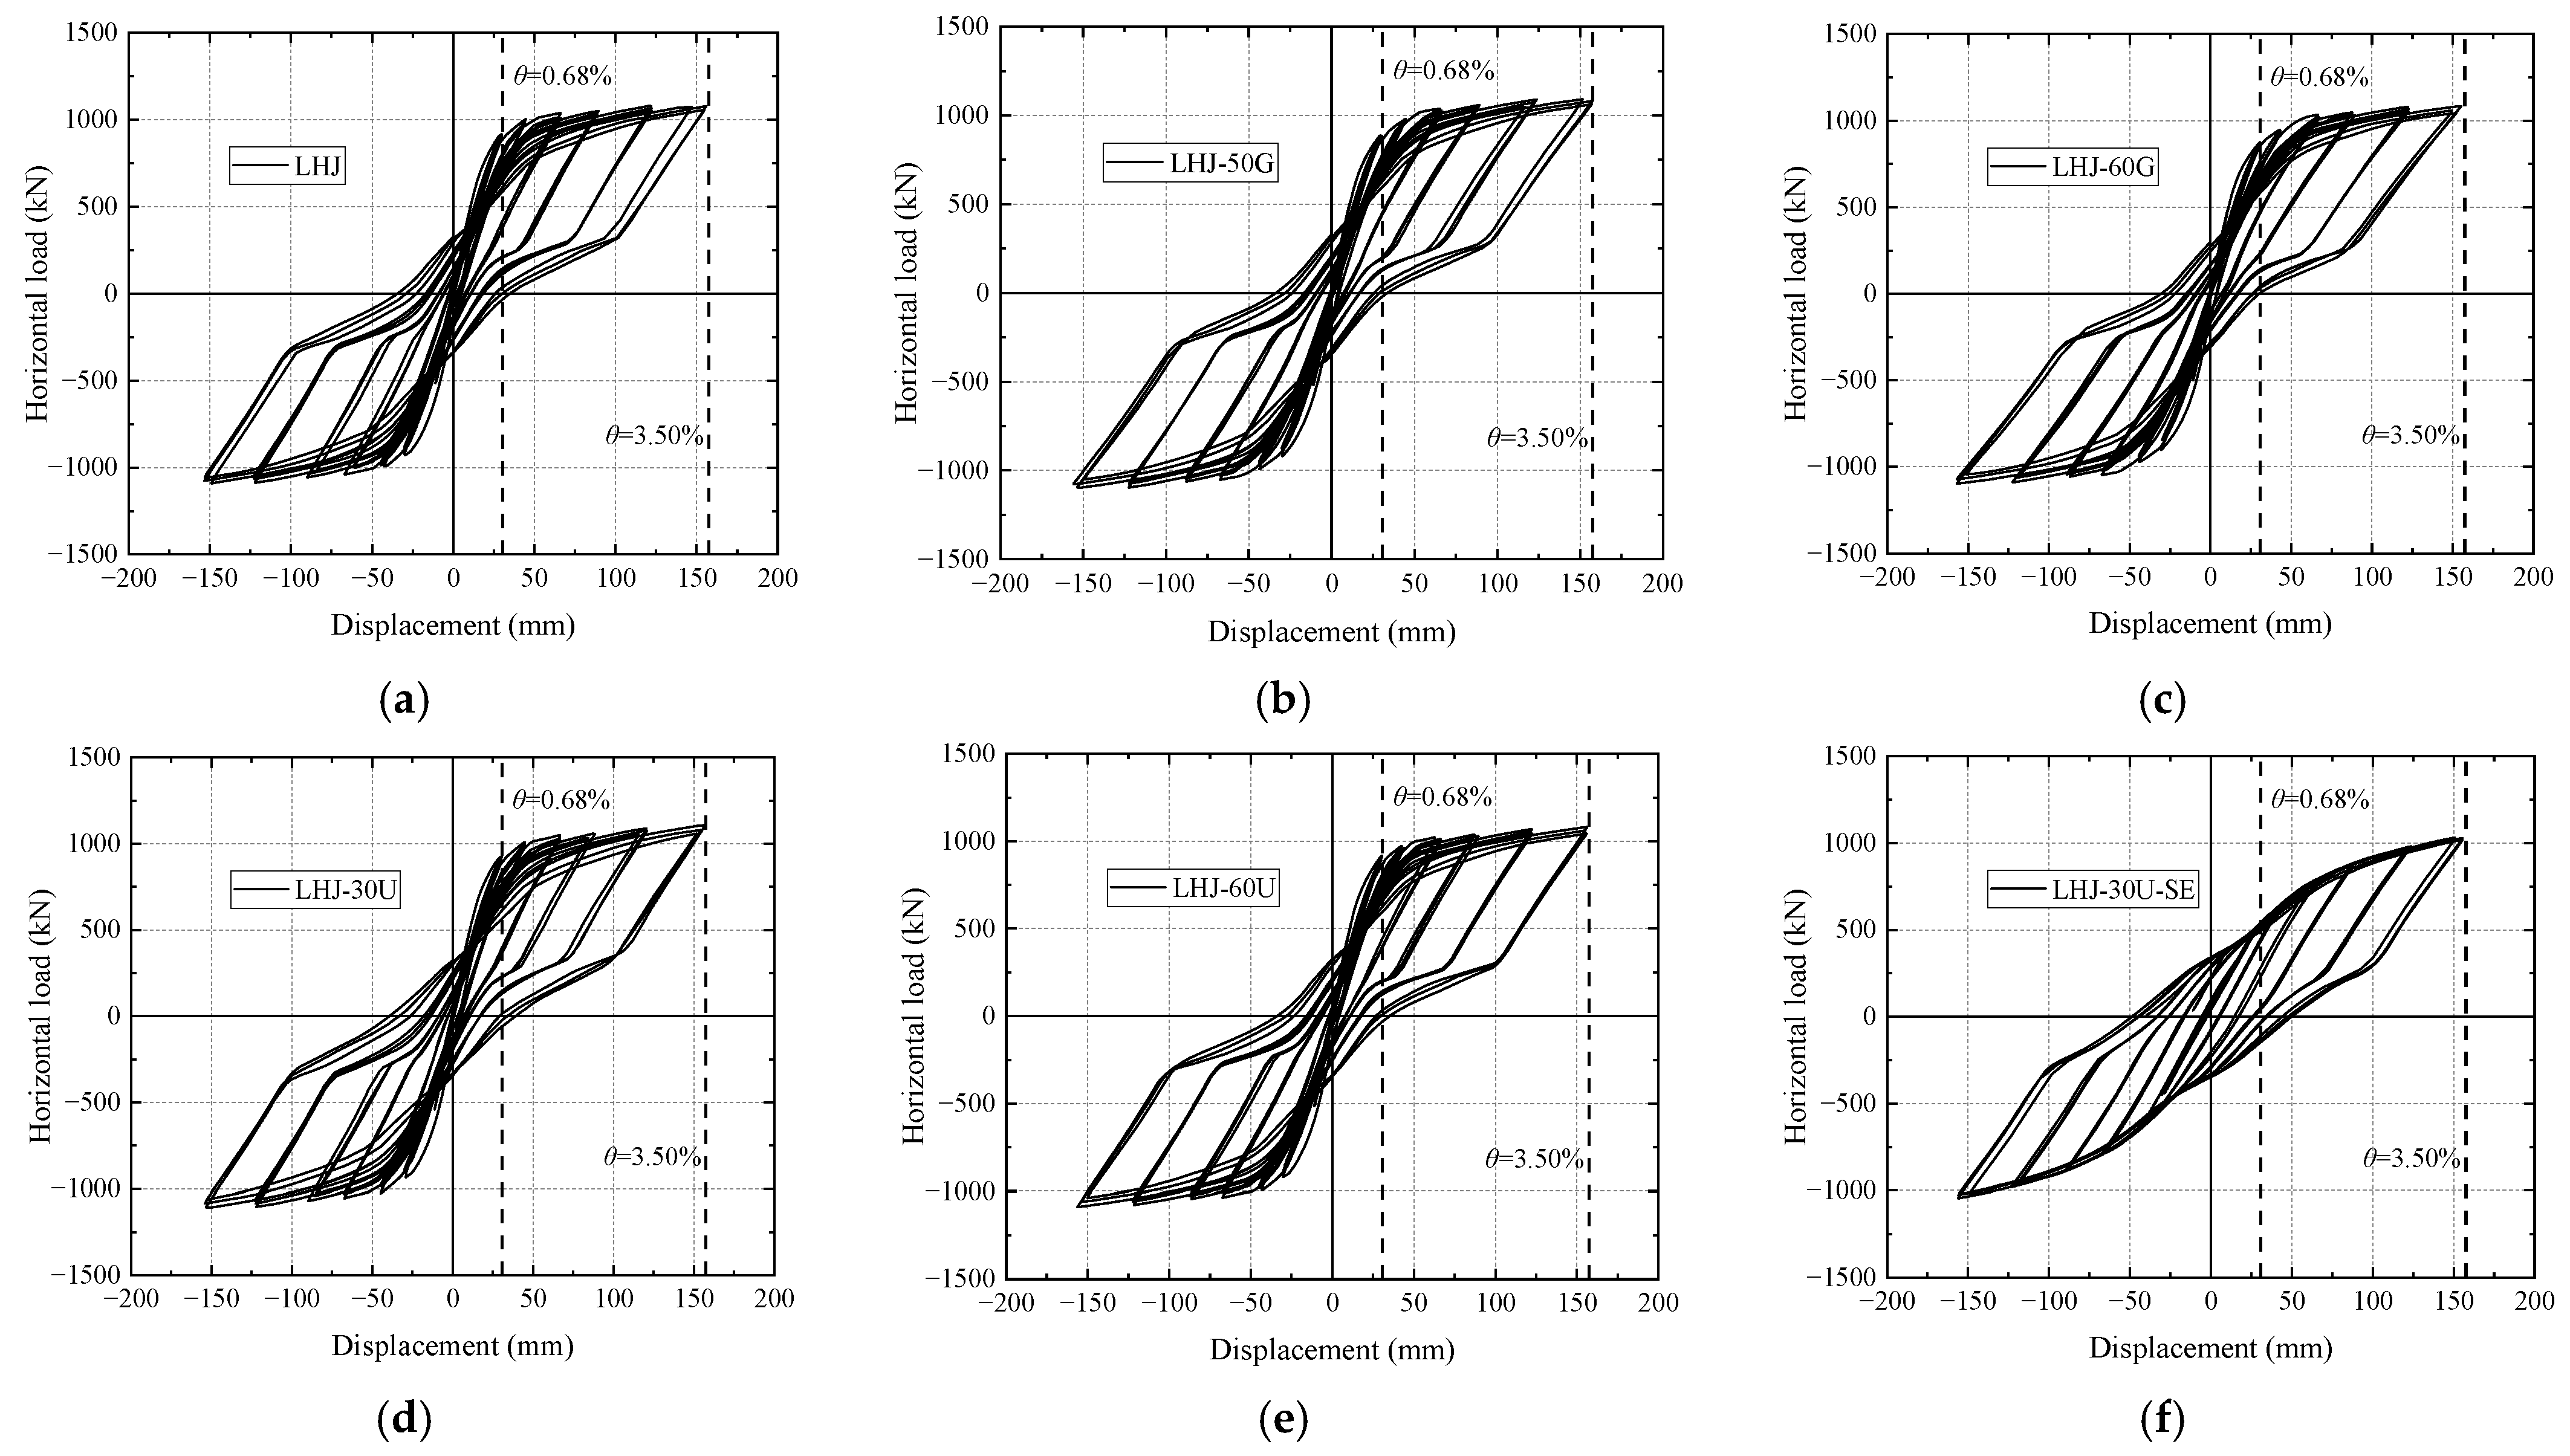
The hysteretic curves of the nodes in group A under the action of an earthquake are shown in Figure 10, and those of the nodes in groups E and F are shown in Figure 12. It can be seen from the figure that, except for node LHJ-30U-SE, the hysteresis loop area of each node hysteresis curve is very small at and before the large earthquake level ( θ = 0.68 % ); however, with an increase in θ , the hysteresis loop area increases significantly. The analysis showed that the energy-consuming steel bar dissipated energy through tension and compression yielding, and its size was reflected by the hysteresis loop area of the hysteresis curve, whereas the energy-consuming steel bar was in an elastic state during large earthquakes (Table 10). The influence of various factors on the hysteretic energy dissipation of the joint was analyzed as follows:
(1)
Bending-bearing capacity ratio of PT steel ( φ des ). Compared with LHJ, LHJ-40C, LHJ-55C, and LHJ-60C, with an increase in φ des , the hysteresis loop area gradually decreased because the increase in φ des led to a decrease in the reinforcement area of the mild steel.
(2)
Strength grade of the mild steel. Compared with LHJ, LHJ-50G, and LHJ-60G, the strength grade of the mild steel had little effect on the hysteretic energy dissipation of the joints; however, with an increase in the strength grade of the mild steel, the area surrounded by the hysteretic loop of the joints decreased slightly.
(3)
Unbonded mild-steel length ( L u ). Compared with LHJ, LHJ-30U, and LHJ-60U, L u increased from 300 to 600 mm, and there was no significant difference in the hysteretic curve of each joint. Its bearing capacity, hysteretic shape, pinching trend, and loading and unloading stiffness are basically the same.
In addition, after the second earthquake, compared with LHJ-30U and LHJ-30U-SE, the residual deformation of LHJ-30U-SE increased, the hysteresis loop area decreased, the plastic yield characteristics were not evident, the loading stiffness degraded, and the bearing capacity decreased; however, with the increase in θ , the bearing capacity decreased.

4.3.2. Damage of Mild Steel

The damage to mild steel can be measured by its strain. The strains of the mild steel in groups A, E, and F are listed in Table 10. In the table, ε max represents the maximum strain of the mild steel obtained by the simulation analysis under the current θ ; ε s represents the ultimate strain of mild steel calculated according to the prestressed seismic code; δ ε denotes the relative error between ε max and ε s ; and η s represents the percentage of the safety reserve of mild steel, and the calculation methods of δ ε and η s are as follows:
δ ε = ε max ε s ε s × 100 %
η s = 0.065 ε s 0.065 × 100 %
From Table 10, it can be seen that at the displacement limit level ( θ = 3.5 % ), the ε max of each joint did not exceed the limit value of 0.065 specified in the Prestressed Seismic Code, and there was a deformation reserve of 22.31% to 59.84% compared with this limit. With the increase in φ des , the strength grade of mild steel, L u , ε max , and the damage degree was obviously reduced. Except for LHJ-60C and LHJ-60G, the δ ε of other nodes did not exceed 15% and most were less than 10%, indicating that the CZM method has high accuracy in simulating the bond–slip of mild steel. According to the analysis, the δ ε of LHJ-60 C was larger because the simulated concrete in the core area was seriously damaged [31]. The relative error δ ε of LHJ-60G was large because the Prestressed Seismic Code does not include the value of the strain permeability coefficient ( α b ) of HRB600, and the calculation used the value of HRB500 ( α b = 5.0 ) [19].
In addition, after the second earthquake, when θ = 0.68 % , compared with LHJ-30U, the ε max of LHJ-30U-SE clearly increased; however, when θ 2.0 % , the ε max of LHJ-30U-SE and LHJ-30U were basically the same. The analysis showed that because the joint had experienced an earthquake, mild steel underwent strengthening and produced obvious plastic deformation. Mild steel had a residual strain ε r that led to an increase in strain at the initial stage of loading. The reinforcement of the steel bar also led to a decrease in the strain growth rate at a later stage of loading. At the same time, at θ = 3.0 % , not all the mild steel of LHJ-30U-SE was fractured by tension, and ε max was still less than 0.065.

4.3.3. One-Cycle Energy Dissipation Area and Equivalent Viscous Damping Coefficient

The one-cycle energy dissipation area ( S 1 ) is shown in Figure 13, and the equivalent viscous damping coefficient ( ξ eq ) is shown in Figure 14. The specific values of the energy dissipation parameters are listed in Table 11. The analysis revealed the following:
(1)
At the level of a large earthquake ( θ = 0.68 % ), the S 1 and ξ eq of each joint are similar, and the energy dissipation capacity is weak. With the increase in θ , the energy dissipation capacity of the joints is continuously improved.
(2)
Compared with the LHJ-40 C, LHJ, LHJ-55 C, and LHJ-60 C in group A, with the increase in φ des , the S 1 and ξ eq of the joints decrease, and the energy dissipation performance is obviously weakened. When θ = 2.0 % , ξ eq is in the range of 7.8% to 14.85%.
(3)
Compared with the LHJ, LHJ-50G, and LHJ-60G in group E, with the increase in the strength grade of mild steel, the S 1 and ξ eq of the joints decrease, and the energy dissipation performance is obviously weakened. However, with the increase in θ , the energy dissipation difference of the joints gradually decreases. When θ = 2.0 % , ξ eq is in the range of 8.86% to 11.47%.
(4)
Comparing the LHJ-30U, LHJ, and LHJ-60U in group F, when θ < 2.0 % , with the increase in L u , the S 1 and ξ eq of the joints decrease slightly, indicating that the energy dissipation capacity is weakened. When θ > 2.0 % , L u has little effect on the energy dissipation performance of the joints. For θ = 2.0 % , ξ eq is in the range of 10.79% to 12.06%.
In addition, compared with LHJ-30U and LHJ-30U-SE, after the second earthquake, the S 1 and ξ eq of LHJ-30U-SE decreased slightly; however, with an increase in θ , the ξ eq of both tended to be consistent.

5. Conclusions

In this study, a hybrid connection joint was considered as the object, and a refined FEM method was used to study the crack development mechanism of the beam–column joint surface and the bond–slip mechanism of mild steel. A new finite modeling method for hybrid connection joints based on CZM is proposed. Based on an FEM, the self-resetting and energy dissipation performances of the hybrid connection joint of a large-span frame were studied. The main conclusions are as follows.
(1)
For the bond–slip of mild steel, the three existing conventional FEM methods cannot effectively simulate the seismic response. The CZM method proposed in this study can effectively simulate the bond–slip mechanism of mild steel and the crack development mechanism of the beam–column joint surface and can more accurately reflect the seismic performance indicators of such joints. It can also meet the requirements of finite element analysis of the seismic performance of hybrid connection joints.
(2)
For the hybrid connection joint of a large-span frame, when the bending capacity ratio of the PT steels φ des is 0.4 to 0.6, the effective stress of the PT steels σ pe is 0.5 fptk to 0.7 fptk, the unbonded length of the PT steels L ups is L/3 to L, and the eccentricity of the PT steels e p < h / 6 ; the residual deformation is small, showing good self-resetting performance. Before the loading level of large earthquakes ( θ = 0.68 % ), the damage to the joint is small, and energy dissipation is not evident. However, with an increase in θ , the mild steels undergo yield strengthening, and the energy dissipation performance is significantly improved. When subjected to large earthquakes, it does not affect the overall function of the structure, and the entire structure can be used without treatment. Even if it reaches the limit for large earthquakes ( θ = 2.0 % ), it does not affect the overall bearing capacity of the structure.
(3)
At the same level of θ , with an increase in φ des , the residual deformation obviously decreases; however, when φ des is close to 0.6, the residual deformation may increase. With an increase in φ des , the stress growth of the PT steels accelerates. When σ pe is 0.5 fptk to 0.7 fptk, even if θ reaches 3.5%, the PT steels of hybrid connection joints in the large-span frame still have no large plastic strain. When L ups decreases from L to L / 3 , there is no evident plastic strain on the PT steels, which has little effect on the self-resetting performance of the joints.
(4)
At the same level of θ , with an increase in φ des , the energy dissipation capacity of the joint is weakened, and with an increase in the strength grade of the mild steels, the energy dissipation capacity of the joint decreases; however, with an increase in θ , the energy dissipation difference gradually decreases. When the unbonded length of the mild steels increases from 300 to 600 mm, the energy dissipation capacity decreases at a small level of θ , but when θ 2.0 % increases further, the increase in L u has little effect on the energy dissipation performance of the joint.
(5)
After the first earthquake, the concrete damage in the core area of precast beams, precast columns, and joints (beam–column overlap area) is small, the maximum strain of mild steels is less than 0.065, and there is a deformation reserve of 22.31% to 59.84%. After experiencing a large earthquake action of the displacement limit value ( θ = 3.5 % ) again, no joint failure occurs, and the bearing capacity of the joint is not significantly reduced in the later period. The maximum strain of the mild steels is still less than 0.065, and there is no risk of fracture.

Author Contributions

Conceptualization, B.J.; data curation, S.Y.; formal analysis, X.C. and S.Y.; methodology, B.J.; software, X.C. and P.L.; supervision, B.J. and P.L.; validation, B.J. and P.L.; writing—original draft, X.C.; writing—review and editing, B.J. and P.L. All authors have read and agreed to the published version of the manuscript.

Funding

This research was funded by the National Natural Science Foundation of China [grant number: 52078078]. This document is the result of a research project funded by the National Science Foundation.

Data Availability Statement

All data generated or analyzed during this study are included in this published article.

Conflicts of Interest

The authors declare no conflicts of interest.

Nomenclature

Notation list
Δ l Length of the bond–slip f tm Average value of axial tensile strength of concrete
δ m 0 , δ m f The opening displacement of the joint surface f cm Average value of axial compressive strength of concrete
σ m 0 Maximum value the cohesive force φ des Bending capacity ratio of the PT steel
K ss , K tt The stiffnesses in the viscous behavior σ pe Effective stress of the PT steel
S max , T max The maximum stress in the damage initiation L ups Unbonded length of the PT steel
f t , r The representative value of the uniaxial tensile strength of concrete, which can be taken as f t , f tk , or f tm according to the actual structural analysis requirements e p Eccentricity of the PT steel
ε t , r Concrete peak tensile strain corresponding to the single-axis tensile strength representative value f t , r L u Unbonded length of the mild steel
ψ t The reduction factor for the tensile strength of concrete at the joint surfaceLLength of the precast beam span
d Diameter of steel reinforcementhHeight of the precast beam span
μ r The residual deformation rateAsCalculated area of mild steel.
Δ u The maximum displacement of the current cyclic loadingApCalculation area of the PT steel
Δ r The residual deformation after unloading of the current cyclic loading θ Interstory displacement angle
δ μ r The relative error between the simulated value μ r and the experimental value μ r Δ Interstory displacement corresponding to the θ
δ ˜ μ r Average value of the δ μ r σ max Maximum stress of the PT steel
ξ eq The equivalent viscous damping coefficient Δ σ Stress increments of the PT steel
δ ξ eq The relative error between the simulated value ξ eq and the experimental value ξ eq σ pr Residual stress of the PT steel
δ ˜ ξ eq Average value of the δ ξ eq ε max Maximum strain of the mild steel obtained by the simulation analysis under the current θ
f yk Standard value of yield strength of steel reinforcement ε s Ultimate strain of mild steel calculated according to the prestressed seismic code
f stk Standard value of ultimate strength of steel reinforcement δ ε Relative error between ε max and ε s
f ptk Standard value of ultimate strength of the PT steel η s Percentage of the safety reserve of mild steel
f ym Average value of yield strength of steel reinforcement α b Value of the strain permeability coefficient
f stm Average value of ultimate strength of steel reinforcement ε r Residual strain of mild steel
f tk Standard value of the axial tensile strength of concrete S 1 Area of the one-cycle energy dissipation
f ck Standard value of axial compressive strength of concrete

References

  1. Song, S.; Chen, G.; Li, P.; Ying, Z.; Zhang, T. Investigation into wind resistance performance of cable-stiffened spherical latticed shells. J. Constr. Steel Res. 2025, 229, 109507. [Google Scholar] [CrossRef]
  2. Xiong, X.; Ge, Y.; Yao, G. Experimental study on flexural behavior of full-scale precast prestressed concrete double-tee members. J. Build. Struct. 2022, 43, 127–136, 172. [Google Scholar]
  3. Fan, J.; Wu, G.; Xu, A.; Feng, D.; Chen, Z. Experimental study on the seismic performance of novel precast reinforced concrete grid moment-resisting frames. Struct. Concr. 2020, 21, 2028–2043. [Google Scholar] [CrossRef]
  4. Yooprasertchai, E.; Warnitchai, P. Seismic performance of precast hybrid moment-resisting frame/rocking wall systems. Mag. Concr. Res. 2018, 70, 1118–1134. [Google Scholar] [CrossRef]
  5. Priestley, M.; Sritharan, S.; Conley, J.; Pampanin, S. Preliminary results and conclusions from the PRESSS five-story precast concrete test building. PCI J. 1999, 44, 42–67. [Google Scholar] [CrossRef]
  6. Nakaki, S.; Stanton, J.; Sritharan, S. An Overview of the PRESSS Five-Story Precast Test Building. PCI J. 1999, 44, 26–39. [Google Scholar] [CrossRef]
  7. GB/T 50011-2010; Seismic Design Standard for Building Structures. China National Standards: Beijing, China, 2010.
  8. Stone, W.; Cheek, G.; Stanton, J. Performance of hybrid moment-resisting precast beam-column concrete connections subjected to cyclic loading. ACI Struct. J. 1995, 92, 229–249. [Google Scholar]
  9. Cheok, G.; Stone, W. Performance of 1/3-Scale Model Precast Concrete Beam-Column Connections Subjected to Cyclic Inelastic Loads. Report. No. 4; National Institute of Standards and Technology: Gaithersburg, MD, USA, 1994.
  10. Stanton, J.; Stone, W.; Cheok, G. A hybrid reinforced precast frame for seismic regions. PCI J. 1997, 42, 20–23. [Google Scholar] [CrossRef]
  11. Li, P.; Li, H.; Song, S.; Zhang, T.; Zhang, Y. Seismic response analysis of cable-stiffened latticed shells with buckling-restrained braces. J. Constr. Steel Res. 2025, 228, 109437. [Google Scholar] [CrossRef]
  12. Nicoletti, V.; Carbonari, S.; Gara, F. Nomograms for the pre-dimensioning of RC beam-column joints according to Eurocode 8. Structures 2022, 39, 958–973. [Google Scholar] [CrossRef]
  13. Shen, X.; Li, B.; Chen, Y.; Tizani, W.; Jiang, Y. Relocating plastic hinges in reinforced concrete beam-column joints by mechanically anchored diagonal bars. Eng. Struct. 2021, 251, 113468. [Google Scholar] [CrossRef]
  14. Yooprasertchai, E.; Warnitchai, P. An application of precast hybrid moment-resisting frames for seismic improvement. Mag. Concr. Res. 2016, 68, 1051–1069. [Google Scholar] [CrossRef]
  15. Li, P.; Chu, S.; Qin, S.; Ding, H.; Luo, N.; Yu, Y.; Zhang, T.; Xiong, G. Optimisation of prestressed stayed steel columns based on strengthen elitist genetic algorithm. J. Constr. Steel Res. 2025, 227, 109324. [Google Scholar] [CrossRef]
  16. Fan, J.; Wu, G.; Cao, Y. Seismic behavior of a precast prestressed beam-column joint with energy dissipation bars. Mag Concr. Res. 2019, 72, 365–378. [Google Scholar] [CrossRef]
  17. Girgin, S.; Misir, I.; Kahraman, S. Seismic performance factors for precast buildings with hybrid beam-column connections. Procedia Eng. 2017, 199, 3540–3545. [Google Scholar] [CrossRef]
  18. Li, P.; Chen, G.; Qiu, J.; Qian, J.; Ding, D.; Jian, B.; Zhang, X.; Xiong, G. Experimental and numerical investigation into the load-carrying capacity of aluminium alloy H-sectional stocky columns under axial compression. J. Build. Eng. 2024, 87, 108777. [Google Scholar] [CrossRef]
  19. JGJ/T 140-2019; China Association for Engineering Construction Standardization. Seismic Design Standard for Prestressed Concrete Structures. China Architecture & Building Press: Beijing, China, impending publication.
  20. Huang, M.; Gul, M.; Zhu, H. Vibration-based structural damage identification under varying temperature effects. J. Aerosp. Eng. 2018, 31, 3. [Google Scholar] [CrossRef]
  21. Huang, M.; Ling, Z.; Sun, C.; Lei, Y.; Xiang, C.; Wan, Z.; Gu, J. Two-stage damage identification for bridge bearings based on sailfish optimization and element relative modal strain energy. Struct. Eng. Mech. 2023, 86, 715–730. [Google Scholar]
  22. Huang, M.; Zhang, J.; Li, J.; Deng, Z.; Luo, J. Damage identification of steel bridge based on data augmentation and adaptive optimization neural network. Struct. Health Monit. 2024, 24, 1674–1699. [Google Scholar] [CrossRef]
  23. Zhang, J.; Huang, M.; Wan, N.; Deng, Z.; He, Z.; Luo, J. Missing measurement data recovery methods in structural health monitoring: The state, challenges and case study. Measurement 2024, 231, 114528. [Google Scholar] [CrossRef]
  24. Dong, J.; Chen, M.; Jin, Y.; Hong, G.; Zaman, M.; Li, Y. Study on micro-scale properties of cohesive zone in shale. Int. J. Solids Struct. 2019, 163, 178–193. [Google Scholar] [CrossRef]
  25. Xie, H. Study on Failure Process and Mechanism of Concrete with Mesostructure Based on Cohesive Zone Model. Ph.D. Thesis, China University of Mining & Technology, Beijing, China, 2020. [Google Scholar]
  26. Mander, J.; Priestley, M. Theoretical stress-strain model for confined concrete. Aus. J. of Struct. Eng. 1988, 114, 1804–1826. [Google Scholar] [CrossRef]
  27. Menegotto, M.; Pinto, P. Method of analysis for cyclically loaded reinforced concrete plane frames including changes in geometry and non-elastic behavior of elements under combined normal force and bending. In Proceedings of the Conference on Resistance and Ultimate Deformability of Structures Acted on by Well Defined Repeated Loads, IABSE Reports Volume 13, Lisbon, Protugal, 13 September 1973; pp. 15–22. [Google Scholar]
  28. GB/T 50010-2010; Code for Design of Concrete Structures. China National Standards: Beijing, China, 2010.
  29. Baltay, P.; Gjelsvik, A. Coefficient of friction for steel on concrete at high normal stress. J. Mater. Civ. Eng. 1990, 2, 46–49. [Google Scholar] [CrossRef]
  30. Wang, D. Research of Seismic Performance and Reinforcement Performance of Precast Prestressed Concrete Connections with Unbonded Post-Tensioned Tendons. Ph.D. Thesis, Beijing University of Technology, Beijing, China, 2008. [Google Scholar]
  31. Yang, S. Research of Finite Element Modeling Method and Seismic Performance of Large-Span Hybrid Connection Frame Joints. Master’s Thesis, Chongqing University, Chongqing, China, 2023. [Google Scholar]
  32. Girard, C.; Bastien, J. Finite-element bond-slip model for concrete columns under cyclic loads. Aus. J. Struct. Eng. 2002, 128, 1502–1510. [Google Scholar] [CrossRef]
  33. Lowes, L. Finite Element Modeling of Reinforced Concrete Beam-Column Bridge Connections; University of California: Berkeley, CA, USA, 1999. [Google Scholar]
  34. Priestley, M.; Tao, J. Precast frames connected with unbonded prestressing tendons (PRESSS). PCI J. 1993, 38, 58–69. [Google Scholar] [CrossRef]
  35. GB 50292-2015; Reliability Appraisal Standard for Civil Building. China National Standards: Beijing, China, 2015.
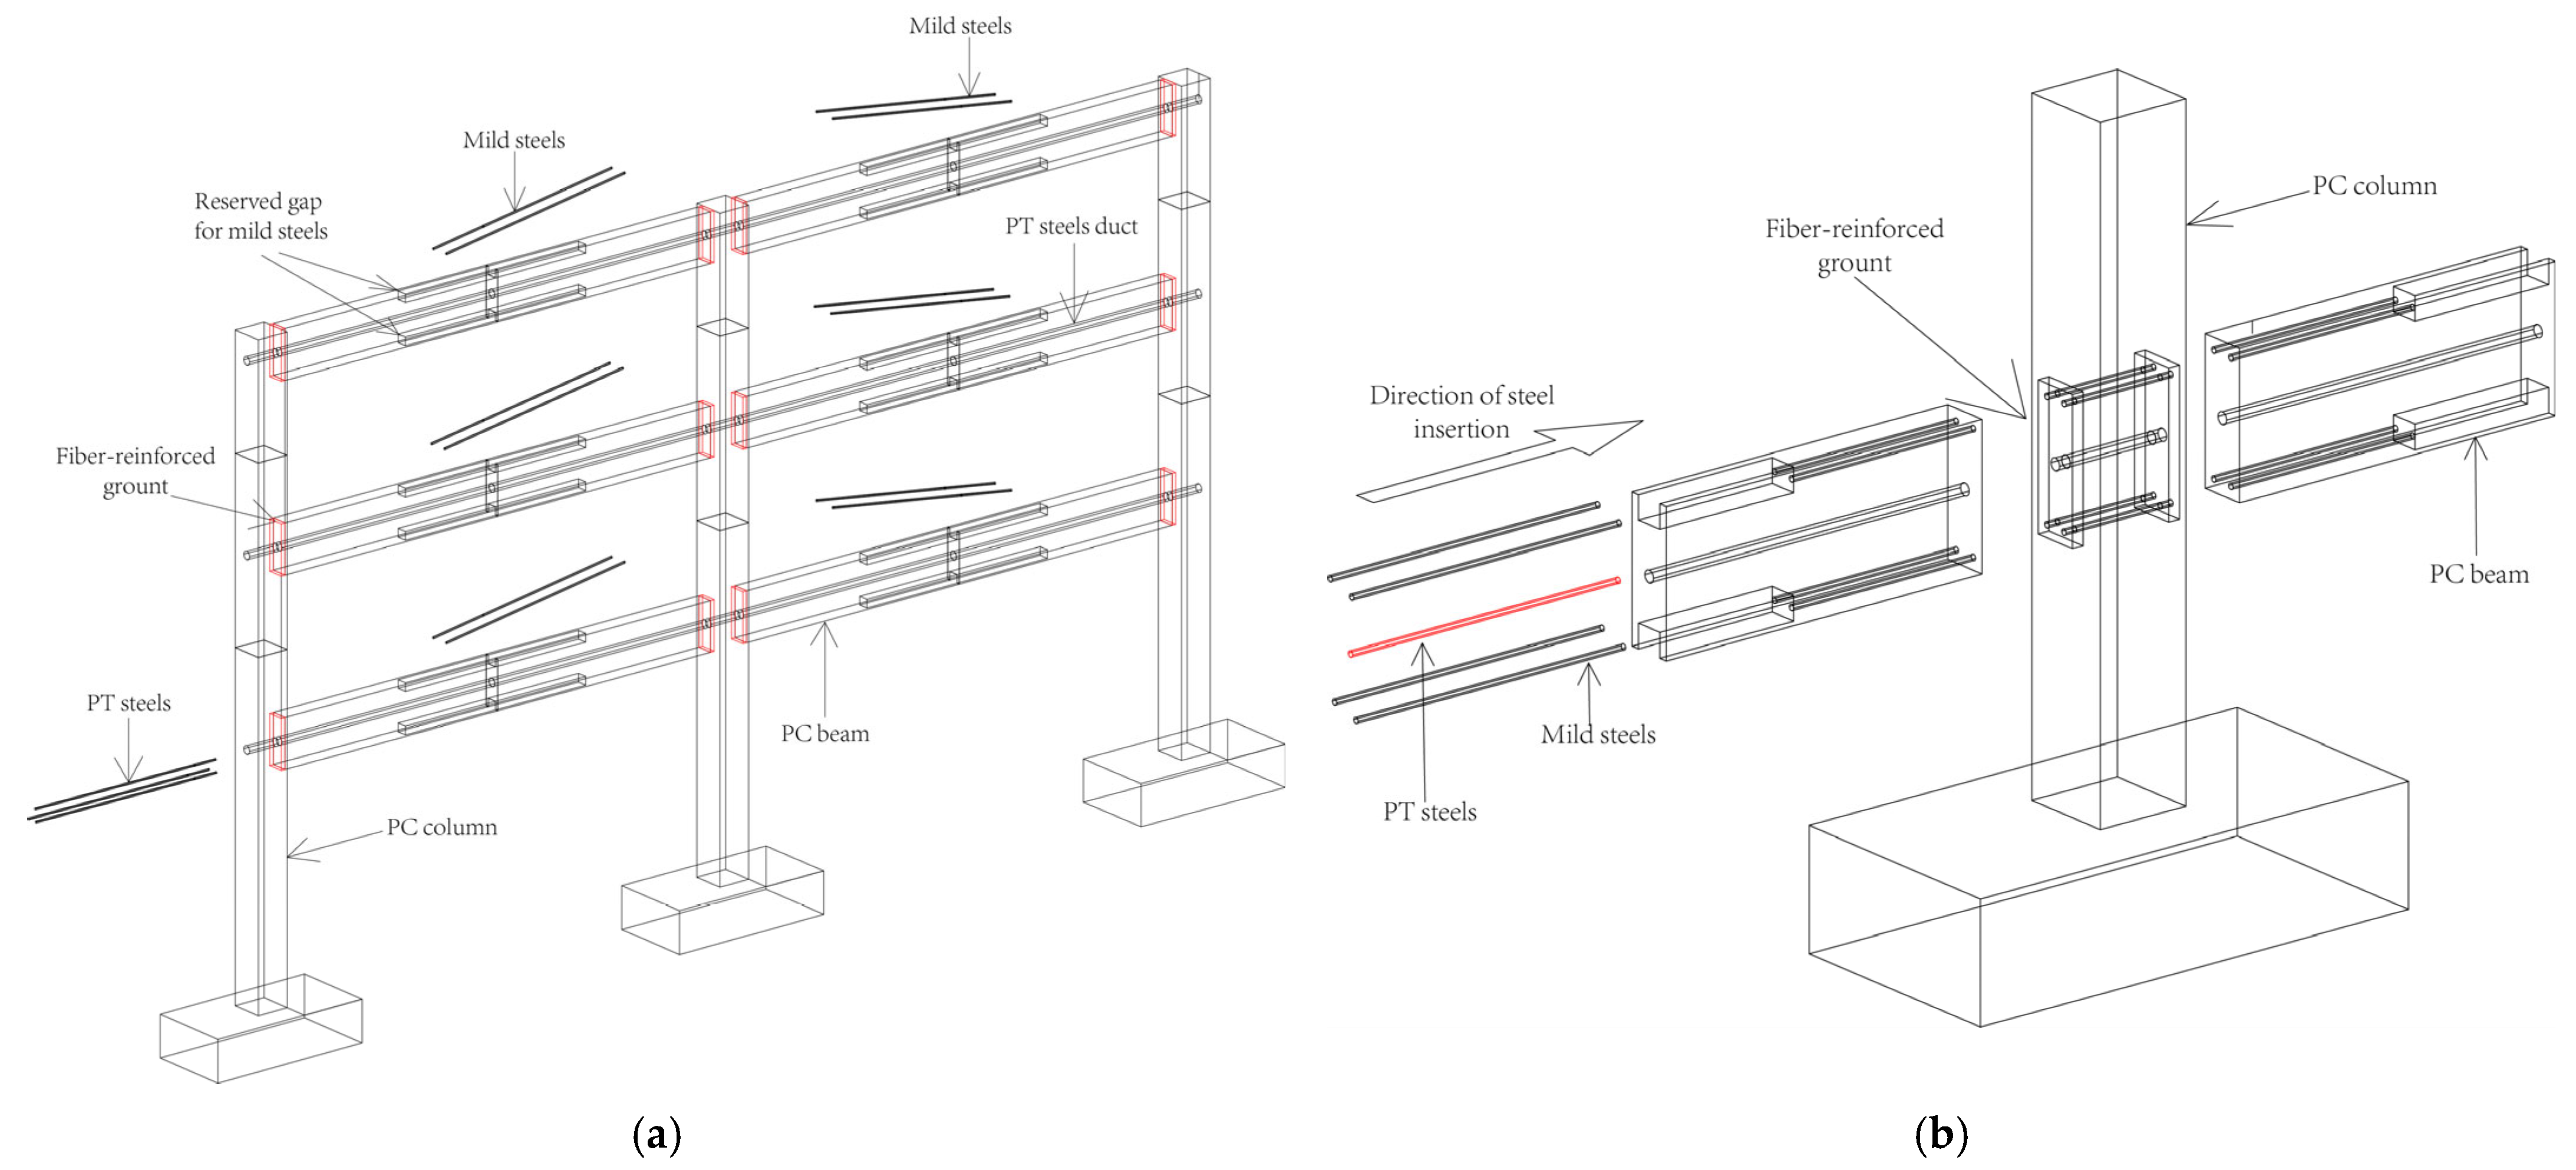
Figure 1. Schematic diagram of hybrid connection frame: (a) frame; (b) joint.
Buildings 15 02992 g001
Figure 2. The (a) action and (b) constitutive relation diagram of CZM.
Buildings 15 02992 g002
Figure 3. Simulation of unbonded section of PT steel: (a) straight line; (b) curve.
Buildings 15 02992 g003
Figure 4. (a) Direction of action and (b) constitutive relation of CZM.
Buildings 15 02992 g004
Figure 5. Hysteresis curve simulation based on the CZM method and three conventional methods: (a) EHJ CZM method; (b) M-P-Z4 CZM method; (c) HCB1 CZM method; (d) EHJ method 1; (e) M-P-Z4 method 1; (f) HCB1 method 1; (g) EHJ method 2; (h) M-P-Z4 method 2; (i) HCB1 method 2; (j) EHJ method 3; (k) M-P-Z4 method 3; (l) HCB1 method 3.
Buildings 15 02992 g005
Figure 6. Skeleton curve simulation based on the CZM method and three conventional methods: (a) EHJ; (b) M-P-Z4; (c) HCB1.
Buildings 15 02992 g006
Figure 7. General form of the hybrid connection joint of a large-span frame.
Buildings 15 02992 g007
Figure 8. Schematic diagram of large-span hybrid connection frame: (a) plane; (b) elevation of D-axis.
Buildings 15 02992 g008
Figure 9. (a) Loading method and (b) FEM of example joints.
Buildings 15 02992 g009
Figure 10. Hysteresis curves of example joints of groups A to D: (a) LHJ; (b) LHJ-SL; (c) LHJ-40C; (d) LHJ-55C; (e) LHJ-60C; (f) LHJ-5PE; (g) LHJ-7PE; (h) LHJ-24E; (i) LHJ-12E; (j) LHJ-6E; (k) LHJ-1UP; (l) LHJ-3UP.
Buildings 15 02992 g010
Figure 11. Comparison of stress of PT steels: (a) group A (b); group B; (c) group C; (d) group D.
Buildings 15 02992 g011
Figure 12. Hysteresis curves of example joints of groups E and F: (a) LHJ; (b) LHJ-50G; (c) LHJ-60G; (d) LHJ-30U; (e) LHJ-60U; (f) LHJ-30U-SE.
Buildings 15 02992 g012
Figure 13. Comparison of S ABC + CDA for example joints: (a) group A; (b) group E; (c) group F.
Buildings 15 02992 g013
Figure 14. Comparison of ξ eq for example joints: (a) group A; (b) group E; (c) group F.
Buildings 15 02992 g014
Table 1. Definition of contact properties of energy-dissipating reinforcement joint surface and beam–column joint surface.
Contact AreaContact PropertiesExplanation of ContactThe Type Selections and Parameter Values of Sub-Property
The bonded section of the mild steelBehavior of normal directionHard contactNo need to take a value
Behavior of tangential directionPenalized frictionFriction coefficient μ = 0.4
Viscous behaviorSpecified stiffness friction K ss = K tt = S max / δ m 0 = S max / ε t , r
The damage initiationMaximum nominal tensile stress criterion S max = T max = ψ t f t ,   r
The interface between fiber cement grouting and prefabricated beam end face Behavior of normal directionHard contactNo need to take a value
Behavior of tangential directionPenalized frictionFriction coefficient μ = 0.6
Viscous behaviorSpecified stiffness friction K ss = K tt = S max / δ m 0 = 75 f t ,   r / d
The damage initiationMaximum nominal tensile stress criterion S max = T max = 3 f t ,   r
f t , r : the representative value of the uniaxial tensile strength of concrete, which can be taken as f t , f tk , or f tm according to the actual structural analysis requirements. ε t , r : concrete peak tensile strain corresponding to the single-axis tensile strength representative value f t , r . ψ t : the reduction factor for the tensile strength of concrete at the joint surface is taken as 0.6. d : diameter of steel reinforcement.
Table 2. Comparison of residual deformation of specimens based on the CZM method.
Specimens μ r (%) δ μ r (%)
TestCZM MethodMethod 1Method 2Method 3CZM MethodMethod 1Method 2Method 3
EHJ25.5/35.425.0/29.321.1/17.420.9/14.922.9/23.6−2.1/−17.3−17.1/−50.8−18/−57.8−10.3/−33.3
IHJ28.3/22.925.3/23.322.4/27.217.3/16.923.8/25.3−10.6/1.6−21.1/19−39.1/−26.1−15.9/10.5
M-P-Z415.4/10.514.4/9.69.5/6.910.9/7.711.6/8.4−6.3/−8.5−38.1/−34.6−29.1/−26.1−24.9/−20.3
N-P-Z411.5/12.516.3/17.09.5/10.210.6/11.010.9/11.841.5/29.7−17.8/−18.2−7.8/−11.6−5.6/−5.0
O-P-Z441.2/37.335.3/33.721.8/17.324.5/15.527.5/21.7−14.2/−9.5−47/−53.4−40.4/−58.3−33.1/−41.8
HCB16.8/33.96.5/6.726.2/26.821.5/19.512.6/14.3−4.1/−80.1284.3/−20.7214.9/−42.585.1/−57.9
HCB25.0/11.74.9/6.97.8/8.17.2/8.76.2/6.4−2.5/−40.855.9/−30.544.0/−25.823.4/−45.5
HCB32.9/12.52.4/5.110.5/149.8/13.43.8/8.8−18.0/−59.3266.5/12.2242.1/7.931.9/−29.9
The values before and after ‘/’ represent the index values of specimens under forward and reverse loading, respectively.
Table 3. Comparison of energy dissipation performance of specimens based on the CZM method.
Specimens ξ eq (%) δ ξ eq (%)
TestCZM MethodMethod 1Method 2Method 3CZM MethodMethod 1Method 2Method 3
EHJ17.0517.4413.914.918.2−2.23−20.2−14.94.51
IHJ15.7216.5012.213.417.8−4.75−26.0−18.87.82
M-P-Z412.8114.9711.611.912.2−14.4−22.8−20.9−18.78
N-P-Z413.6910.9013.513.214.625.6123.921.234.02
O-P-Z417.9519.4113.314.216.7−7.52−31.5−26.7−13.74
HCB114.6818.4813.113.916.0−20.55−29.0−24.9−13.42
HCB211.3912.489.310.310.7−8.74−25.9−17.5−14.58
HCB310.9912.238.48.710.3−10.13−31.1−28.7−15.43
Table 4. Mechanical properties of steel materials.
Reinforcement f yk (MPa) f stk / f ptk (MPa) f ym (MPa) f stm (MPa)
HPB300300420351492
HRB400E400540443599
HRB500E500630554699
HRB600E600750665812
1860-degree tendon1581186017512060
Table 5. Mechanical properties of C40-grade concrete.
f tk (MPa) f ck (MPa) f tm (MPa) f cm (MPa)
2.3926.83.236.1
Table 6. Reinforcement design of beam–column joint surface of example joints.
ClassExamples φ des σ pe e p LupsGradeLu (mm)As (mm2)Ap (mm2)
BasicLHJ0.50.6 fptk0L/2HRB400E45020182216
LHJ-SL
ALHJ-40C0.50.6 fptk0L/2HRB400E45026241558
LHJ-55C0.5517372647
LHJ-60C0.614903270
BLHJ-5PE0.50.5 fptk0L/2HRB400E45020252607
LHJ-7PE0.7 fptk20131928
CLHJ-24E0.50.6 fptkh/24L/2HRB400E45021541754
LHJ-12Eh/1222721468
LHJ-6Eh/626481114
DLHJ-1UP0.50.6 fptk0LHRB400E45019742277
LHJ-3UPL/320282086
ELHJ-50G0.50.6 fptk0L/2HRB500E45017192184
LHJ-60GHRB600E14432176
FLHJ-30U0.50.6 fptk0L/2HRB400E30019992242
LHJ-60U60020392191
f ptk : standard value of the ultimate strength of a prestressed tendon. Grade: strength grade of mild steel. L: precast beam span length. h: precast beam span height. As: calculated area of mild steel. Ap: calculation area of PT steel.
Table 7. Load level of example joints.
Loading Level θ Δ (mm)Explanation
10.25%11.25/
20.68%30.60The calculated value of θ under a large earthquake
31.00%45.00/
41.50%67.50/
52.00%90.00Large earthquake limit value in the Seismic Code
62.75%123.75/
73.50%157.50displacement limit value in the Prestressed Seismic Code
θ : interstory displacement angle. Δ : interstory displacement corresponding to the θ . Large earthquakes are rare (PGA = 200 gal).
Table 8. Comparison of characteristic stresses of prestressed tendons in example joints.
Examples θ = % θ = 0.68 % θ = 2.0 % θ = 2.75 % θ = 3.5 %
σ pe σ max Δ σ σ max Δ σ σ max Δ σ σ max Δ σ σ pr
LHJ/LHJ-SL0.60 fptk0.62 fptk0.02 fptk0.74 fptk0.14 fptk0.79 fptk0.19 fptk0.82 fptk0.22 fptk0.62 fptk
LHJ-40C0.60 fptk0.66 fptk0.06 fptk0.75 fptk0.15 fptk0.82 fptk0.22 fptk0.88 fptk0.28 fptk0.64 fptk
LHJ-55C0.60 fptk0.63 fptk0.03 fptk0.71 fptk0.11 fptk0.76 fptk0.16 fptk0.80 fptk0.20 fptk0.63 fptk
LHJ-60C0.60 fptk0.61 fptk0.01 fptk0.68 fptk0.08 fptk0.72 fptk0.12 fptk0.72 fptk0.12 fptk0.62 fptk
LHJ-5PE0.50 fptk0.52 fptk0.02 fptk0.63 fptk0.13 fptk0.68 fptk0.18 fptk0.71 fptk0.21 fptk0.52 fptk
LHJ-7PE0.70 fptk0.72 fptk0.02 fptk0.83 fptk0.13 fptk0.88 fptk0.18 fptk0.92 fptk0.22 fptk0.72 fptk
LHJ-24E0.60 fptk0.63 fptk0.03 fptk0.75 fptk0.15 fptk0.81 fptk0.21 fptk0.85 fptk0.25 fptk0.63 fptk
LHJ-12E0.60 fptk0.63 fptk0.03 fptk0.76 fptk0.16 fptk0.83 fptk0.23 fptk0.89 fptk0.29 fptk0.64 fptk
LHJ-6E0.60 fptk0.64 fptk0.04 fptk0.77 fptk0.17 fptk0.84 fptk0.24 fptk0.92 fptk0.32 fptk0.65 fptk
LHJ-1UP0.60 fptk0.61 fptk0.01 fptk0.69 fptk0.09 fptk0.73 fptk0.13 fptk0.76 fptk0.16 fptk0.61 fptk
LHJ-3UP0.60 fptk0.64 fptk0.04 fptk0.81 fptk0.21 fptk0.89 fptk0.29 fptk0.94 fptk0.34 fptk0.62 fptk
σ max : the maximum stress of the PT steel. Δ σ : the stress increments of the PT. σ pr : the residual stress of the PT steel.
Table 9. Comparison of residual deformation for example joints.
Examples Δ r (mm) μ r (%)
θ = 0.68 % θ = 2.0 % θ = 2.75 % θ = 3.5 % θ = 0.68 % θ = 2.0 % θ = 2.75 % θ = 3.5 %
LHJ3.75/0.6011.10/8.5618.16/16.6035.31/34.7012.31/1.9812.34/9.5114.68/13.4422.42/22.08
LHJ-SL3.81/0.4410.08/7.5216.67/14.0832.81/35.2712.45/1.4311.20/8.3613.47/11.3720.83/22.40
LHJ-40C3.87/0.7029.86/28.644.71/43.7764.43/60.4512.64/2.2933.18/31.7836.13/35.3740.91/38.38
LHJ-55C3.77/0.6010.61/7.5517.67/15.6334.32/32.8412.31/1.9811.78/8.3914.28/12.6321.79/20.85
LHJ-60C3.72/0.6611.22/9.8425.55/26.5255.37/55.8512.15/2.1612.47/10.9320.64/21.4335.16/35.46
LHJ-24E3.74/0.6114.66/11.0623.73/22.1645.92/44.8512.23/1.9916.29/12.2919.18/17.9029.16/28.47
LHJ-12E3.73/0.7825.43/21.8636.49/35.4454.10/52.5412.21/2.5628.25/24.2929.49/28.6434.35/33.36
LHJ-6E3.67/1.0044.04/43.4970.70/71.66100.38/95.811.99/3.2648.93/48.3257.13/57.9063.73/60.83
LHJ-1UP3.90/0.5111.12/9.0517.68/16.6134.82/37.2912.74/1.6512.36/10.0614.28/13.4322.11/23.68
LHJ-3UP3.96/0.6211.15/9.3219.49/17.9239.22/41.1712.94/2.0312.39/10.3615.75/14.4824.90/26.14
The values before and after ‘/’ represent the index values of specimens under forward and reverse loading, respectively.
Table 10. Comparison of strain of mild steel in example joints.
Examples ε max ε s η s δ ε
θ = 0.68 % θ = 2.0 % θ = 2.75 % θ = 3.5 % θ = 3.5 %
LHJ0.001210.01850.03000.03950.042539.23%−7.06%
LHJ-40C0.001660.02140.03430.04470.047431.23%−5.70%
LHJ-55C0.0009170.01660.02740.03790.039741.69%−4.53%
LHJ-60C0.0006060.01180.02160.02610.035859.84%−27.37%
LHJ-50G0.001150.01560.02830.03830.041741.08%−8.15%
LHJ-60G0.001060.01310.02660.03650.043243.85%−15.51%
LHJ-30U0.001320.02310.03800.05050.057722.31%−12.48%
LHJ-60U0.001080.01390.02390.03310.033849.08%−2.07%
LHJ-30U-SE0.002180.02230.03650.0483///
For example LHJ-30U-SE, its residual strain ( ε r = 0.00149 ) was included when calculating ε max .
Table 11. Comparison of energy consumption parameters for example joints.
Examples S 1 (kN·m) ξ eq (%)
θ = 0.68 % θ = 2.0 % θ = 2.75 % θ = 3.5 % θ = 0.68 % θ = 2.0 % θ = 2.75 % θ = 3.5 %
LHJ4.4165.74117.27164.222.5711.4714.2916.02
LHJ-40C4.2181.12142.41213.412.4814.8518.3520.45
LHJ-55C4.6856.4298.95150.272.6510.1112.1114.40
LHJ-60C4.7347.6890.45132.682.527.8010.7312.04
LHJ-50G4.0558.37111.02157.612.4410.1713.5515.50
LHJ-60G3.7850.94102.04151.062.268.8612.5415.05
LHJ-30U4.7670.32113.73167.032.7512.0613.8915.96
LHJ-60U4.1461.43115.89169.222.3910.7914.3016.40
LHJ-30U-SE1.2663.63103.15159.241.3911.0913.3215.68
Disclaimer/Publisher’s Note: The statements, opinions and data contained in all publications are solely those of the individual author(s) and contributor(s) and not of MDPI and/or the editor(s). MDPI and/or the editor(s) disclaim responsibility for any injury to people or property resulting from any ideas, methods, instructions or products referred to in the content.