1. Introduction
Fiber-Reinforced Polymer (FRP) possesses exceptional properties, including lightweight characteristics, a high strength-to-weight ratio, and corrosion resistance. In civil engineering, it is predominantly employed for retrofitting or strengthening existing concrete structures [
1]. Two primary application methods exist:
- (1)
Confinement by FRP sheets: Wrapping FRP sheets around concrete columns to form externally bonded FRP-confined concrete members;
- (2)
Concrete-filled FRP tubes: Casting concrete into prefabricated FRP tubes to create integral FRP–concrete composite columns.
When utilizing FRP sheets for concrete confinement, the fiber orientation is exclusively aligned in the hoop direction. In contrast, FRP tubes can be engineered with diverse lamination sequences, necessitating the simultaneous optimization of both hoop and axial mechanical properties [
2]. Glass-fiber-reinforced polymer (GFRP) not only serves as confinement sheets for structural components but also enables the design and fabrication of multifunctional GFRP tubes with customizable configurations [
3].
Numerous researchers have conducted extensive investigations into the seismic performance of conventional reinforced concrete bridge piers strengthened with FRP. Existing studies demonstrate that FRP confinement significantly enhances the ductility and energy dissipation capacity of piers, while altering their failure modes—for instance, transforming brittle shear failure into ductile flexural failure, or mitigating lap-splice failure through improved fatigue resistance. Furthermore, FRP effectively increases the lateral deformation capacity but exhibits limited influence on the maximum lateral load-carrying capacity and negligible effects on flexural stiffness [
4,
5,
6].
Tan et al. [
7] investigated the seismic behavior of GFRP-confined ultra-high performance concrete (UHPC) composite columns through quasi-static cyclic tests. Their study characterized the structural skeleton curves, developed a finite element (FE) model for the composite columns, and quantitatively evaluated the effects of key parameters—including the GFRP tube diameter-to-thickness ratio, circular elastic modulus of GFRP, and concrete tensile strength—on seismic performance. Wang et al. [
8] explored the enhancement of seismic capacity in GFRP-UHPC columns by integrating H-shaped steel cores under quasi-static loading. Considering six design variables (steel section dimensions, steel yield strength, GFRP thickness, axial load ratio, shear connector configuration, and UHPC steel fiber content), they fabricated 14 specimens to analyze load–displacement hysteresis behavior and component strain evolution.
Although extensive research exists on the seismic performance of cast-in-place bridge piers incorporating various FRP types, concrete strength grades, or internal structural designs, experimental studies investigating GFRP tube-confined prefabricated assembled bridge piers remain limited in scope. This knowledge gap leads to significant constraints on deploying precast pier systems in moderate-to-high seismic regions, where achieving ductile failure modes and low residual displacements is critical for seismic resilience [
9,
10]. Sadeghian et al. [
11,
12] developed a novel moment-resisting connection by embedding concrete-filled GFRP tubes directly into concrete foundations or pile caps. Through parametric analysis, they characterized the effects of the tube diameter-to-thickness ratio, wall thickness, fiber architecture, and embedment depth on seismic performance. Their study demonstrates that a simplified design model can accurately predict failure modes, including bonding failure at the interface or bending failure of the GFRP tube, under cyclic loading conditions. Zhu et al. [
13] proposed a structural form with concrete-filled GFRP tubes embedded in pile caps; these piers exhibited excellent seismic behavior under low-cycle reversed loading.
Other studies primarily focus on post-tensioned precast segmental piers. Hassanli et al. [
14] employed FRP confinement at the base segments of unbonded post-tensioned prestressed concrete columns. Quasi-static tests revealed FRP fracture in all specimens at drift ratios exceeding 9%. A single-layer FRP confinement significantly enhanced the columns’ peak load (32% increase on average), ultimate drift capacity (69% improvement), and post-peak stiffness, with confined concrete achieving ultimate compressive strains up to 0.0056 under equivalent initial post-tensioning. Motaref et al. [
15] conducted shake table tests on 1:3-scale segmented piers constructed with varied materials. The results demonstrated that FRP confinement improves pier strength, ductility, and effectively mitigates joint damage. Zhang et al. [
16] utilized CFRP composites to repair earthquake-damaged prefabricated segmental piers. The repaired specimens exhibited higher energy dissipation and greater residual displacements than original specimens, with inter-segment sliding identified as the primary failure mode.
ElGawady et al. [
17,
18] evaluated the seismic performance of GFRP tube-confined post-tensioned precast piers via quasi-static tests, revealing that confined piers only had 25–50% of the residual displacement of RC piers but lower hysteretic energy dissipation. Moustaf and ElGawady [
19] designed a precast hollow pier with dual walls (GFRP tube + steel tube) filled internally with concrete; shake table tests demonstrated its capacity to withstand high accelerations without severe damage and superior self-centering capabilities. Dawood and ElGawady [
20] conducted finite element analysis on 84 FRP-confined self-centering post-tensioned prefabricated bridge piers with varied design parameters. They derived empirical equations based on idealized bilinear skeleton curves and validated their attainment of target performance levels across different seismic zones through a dedicated design procedure. Xue et al. [
21] and Ma et al. [
22] examined the effects of CFRP external reinforcement at the base segment on the seismic behavior of bridge piers via finite element modeling. The results indicated that CFRP reinforcement significantly increased the global stiffness and lateral load capacity, while reducing residual displacements substantially. The concrete at segment joints was identified as the critical failure zone, though the number of CFRP layers exhibited a negligible influence on seismic performance metrics.
As a primary connection method for precast assembled piers, the grouted sleeve splicing of rebars demonstrates mature technical specifications. Haber et al. [
23] performed low-cycle reversed loading tests on five half-scale bridge column specimens. Four novel column–foundation moment connection types—including head joints and grouted sleeve connections—were implemented. All prefabricated models simulated traditional cast-in-place structural behavior, demonstrating a comparable global mechanical response, damage patterns, and energy dissipation capacity to cast-in-place columns. Given that grouted sleeves may alter plastic hinge zone performance, Haber et al. [
24] further conducted low-cycle cyclic tests on 0.42-scale columns with dual-sleeve connections. By utilizing transition splices and high-strength rebars in foundations, the plastic hinge relocated above the sleeve region, effectively enhancing the piers’ plastic rotation capacity and ductility. Xu et al. [
25] established, through finite element analysis, that an increased sleeve diameter and length in grouted-sleeve connected piers proportionally amplified the pier body curvature and rebar strain at joints compared to sleeve-free cases. When sleeves are embedded within pile caps, piers exhibit plastic hinge behavior comparable to cast-in situ piers, with seismic performance meeting or exceeding that of conventional construction, thus satisfying prescribed seismic requirements [
26].
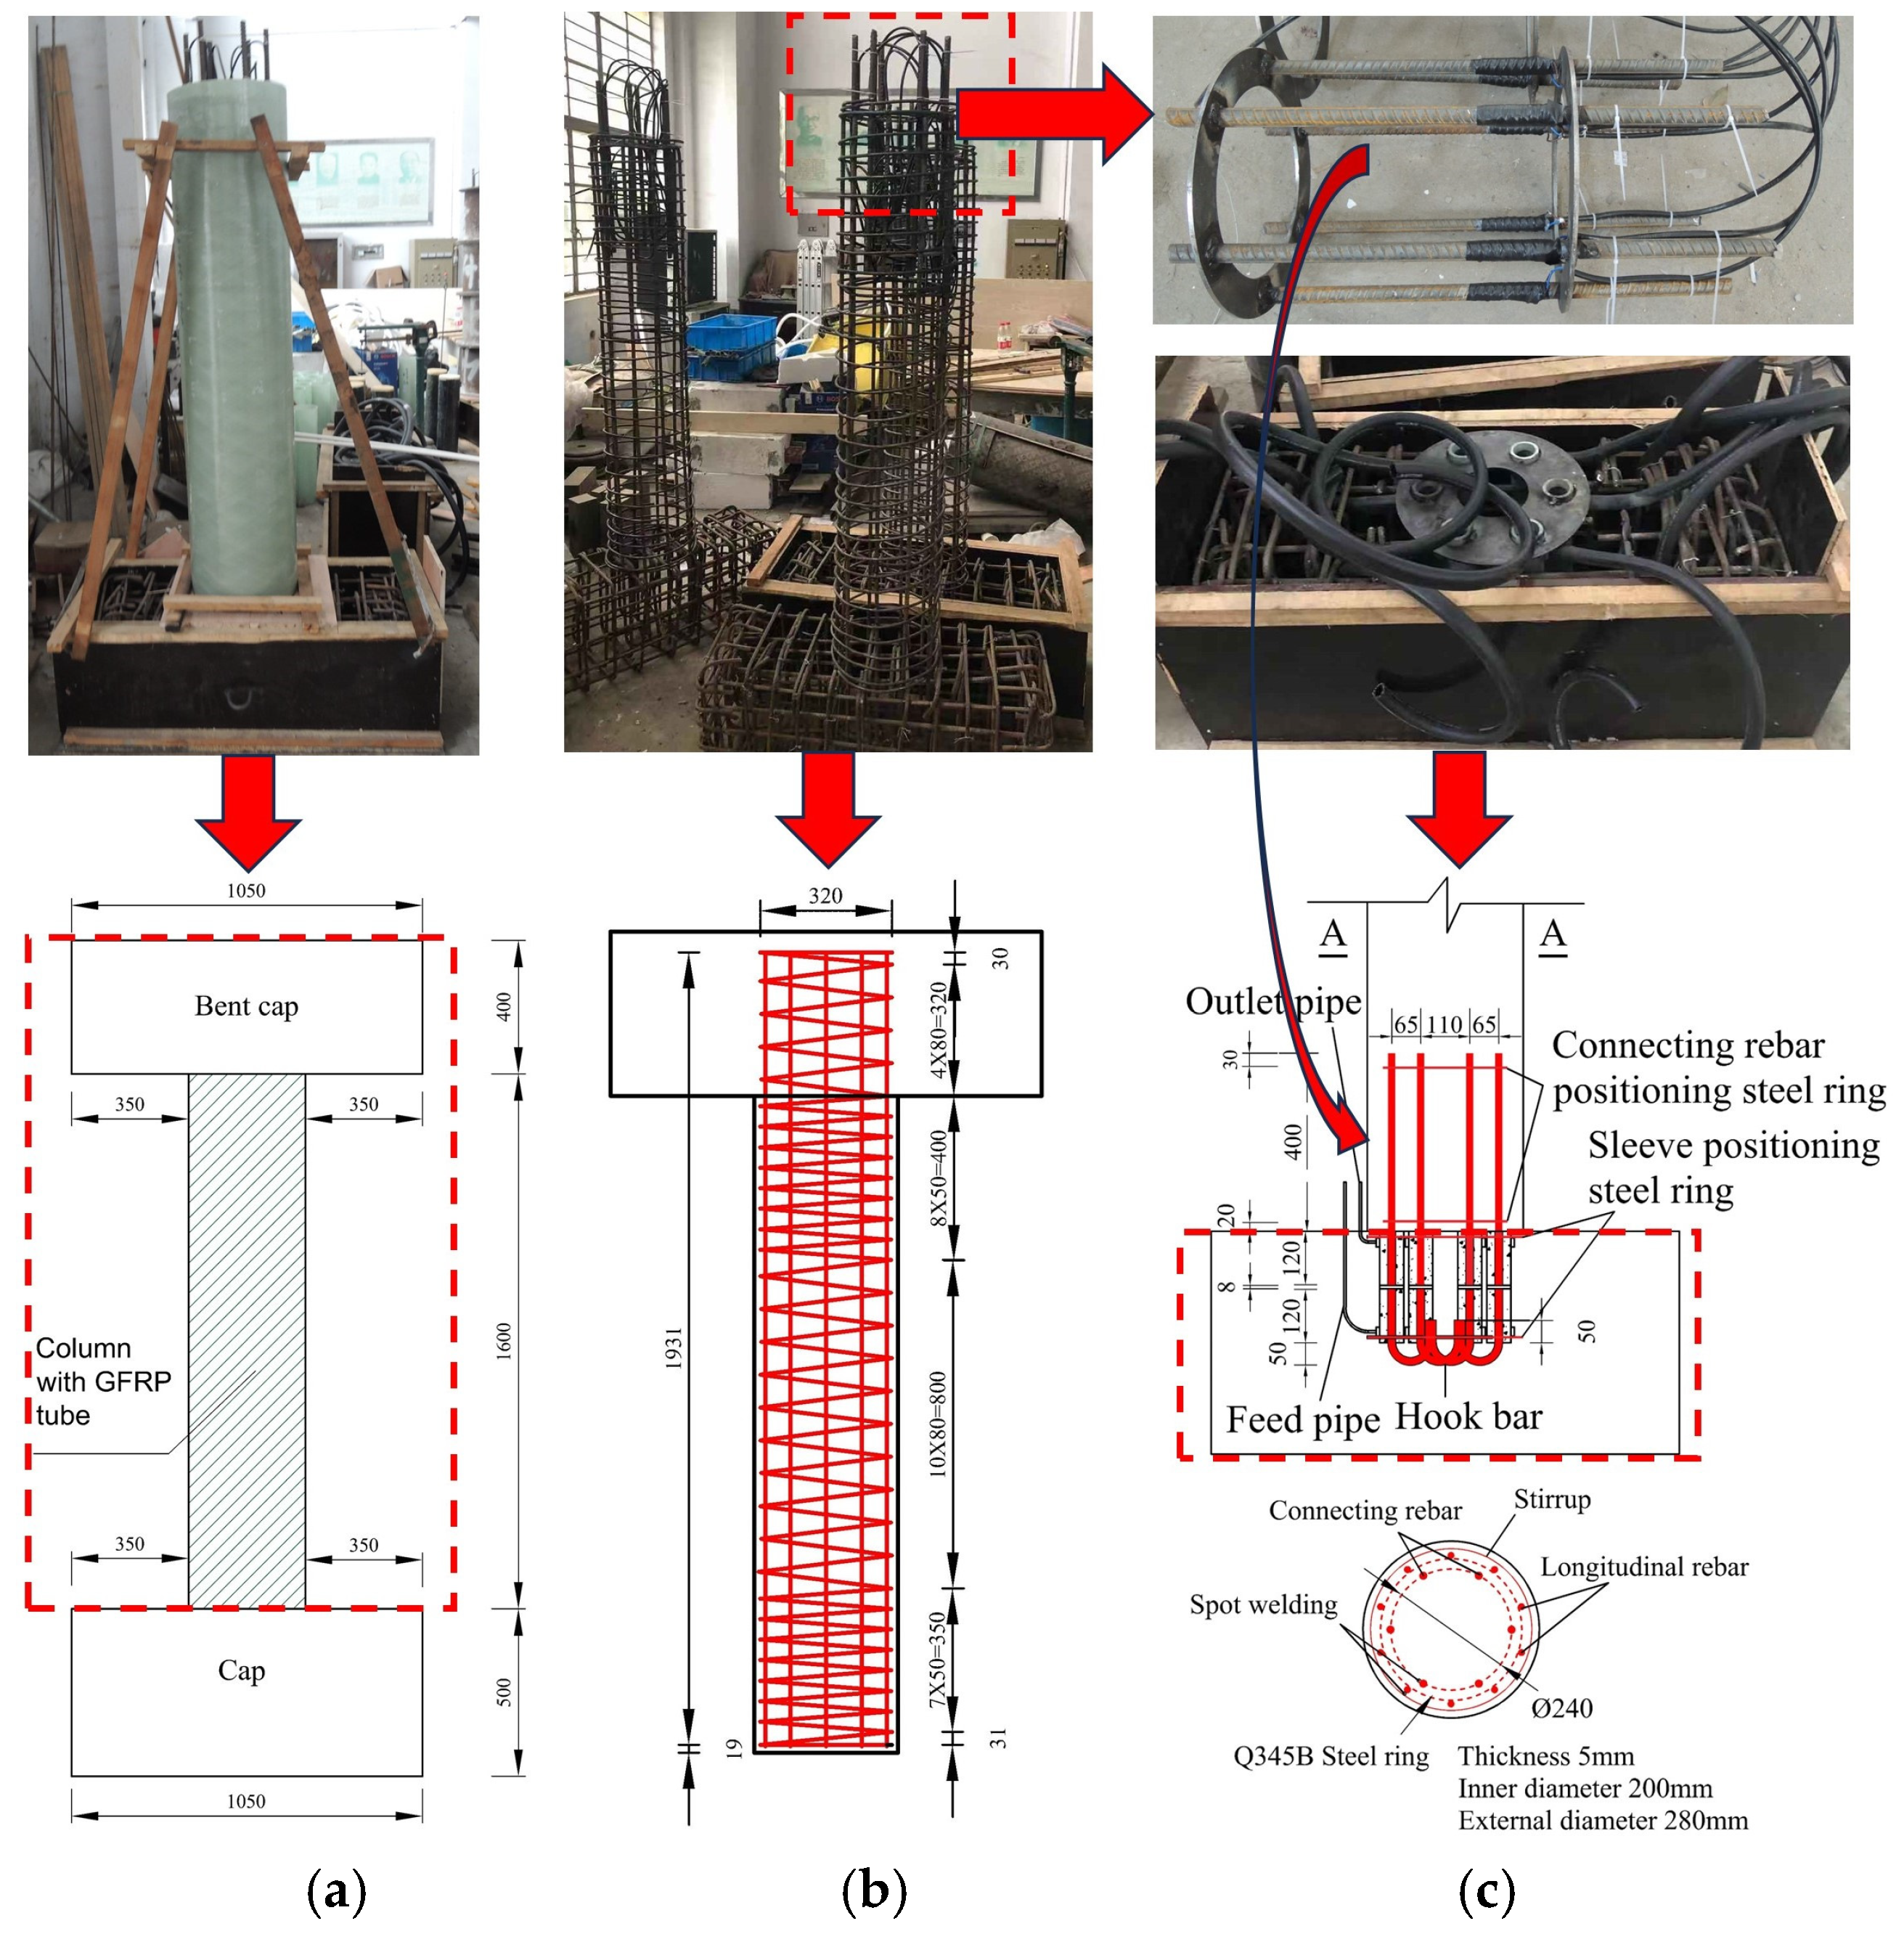
The existing literature indicates that seismic-induced damage in precast assembled piers primarily localizes at segment joints, manifesting as longitudinal reinforcement buckling or fracture. While GFRP tube confinement effectively mitigates this phenomenon, the extent of its enhancement on seismic performance metrics (e.g., load-bearing capacity, deformation, ductility, stiffness, hysteretic energy dissipation, and residual displacement) remains unexplored for “cast-in-place-equivalent” precast piers with grouted sleeve connections. To address this research gap, this study designed and fabricated 18 groups (54 specimens) of GFRP tube-confined concrete cylinders. Axial compression tests were conducted to investigate failure modes, bearing capacities, and stress–strain relationships. By optimizing the GFRP tube thickness and fiber orientation angles, a novel prefabricated pier system was developed: factory-precast GFRP tubes serve as concrete casting molds to form composite structures, which are assembled via connecting rebars embedded in grouted sleeves within caps. This design eliminates intermediate column joints, thereby circumventing adverse seismic effects. The system utilizes GFRP to provide circumferential confinement for core concrete while retaining longitudinal reinforcement to ensure flexural strength, achieving a strength–ductility balance. Quasi-static tests validated its seismic performance. In summary, this research integrates material–structure–design innovations based on the synergistic mechanism of GFRP confinement and grouted sleeve connections, concurrently enhancing bridge seismic safety and construction efficiency. It provides a reference for applying Accelerated Bridge Construction (ABC) technology in high-seismicity regions.
3. Axial Compression Test Results
3.1. Specimen Failure Phenomenon
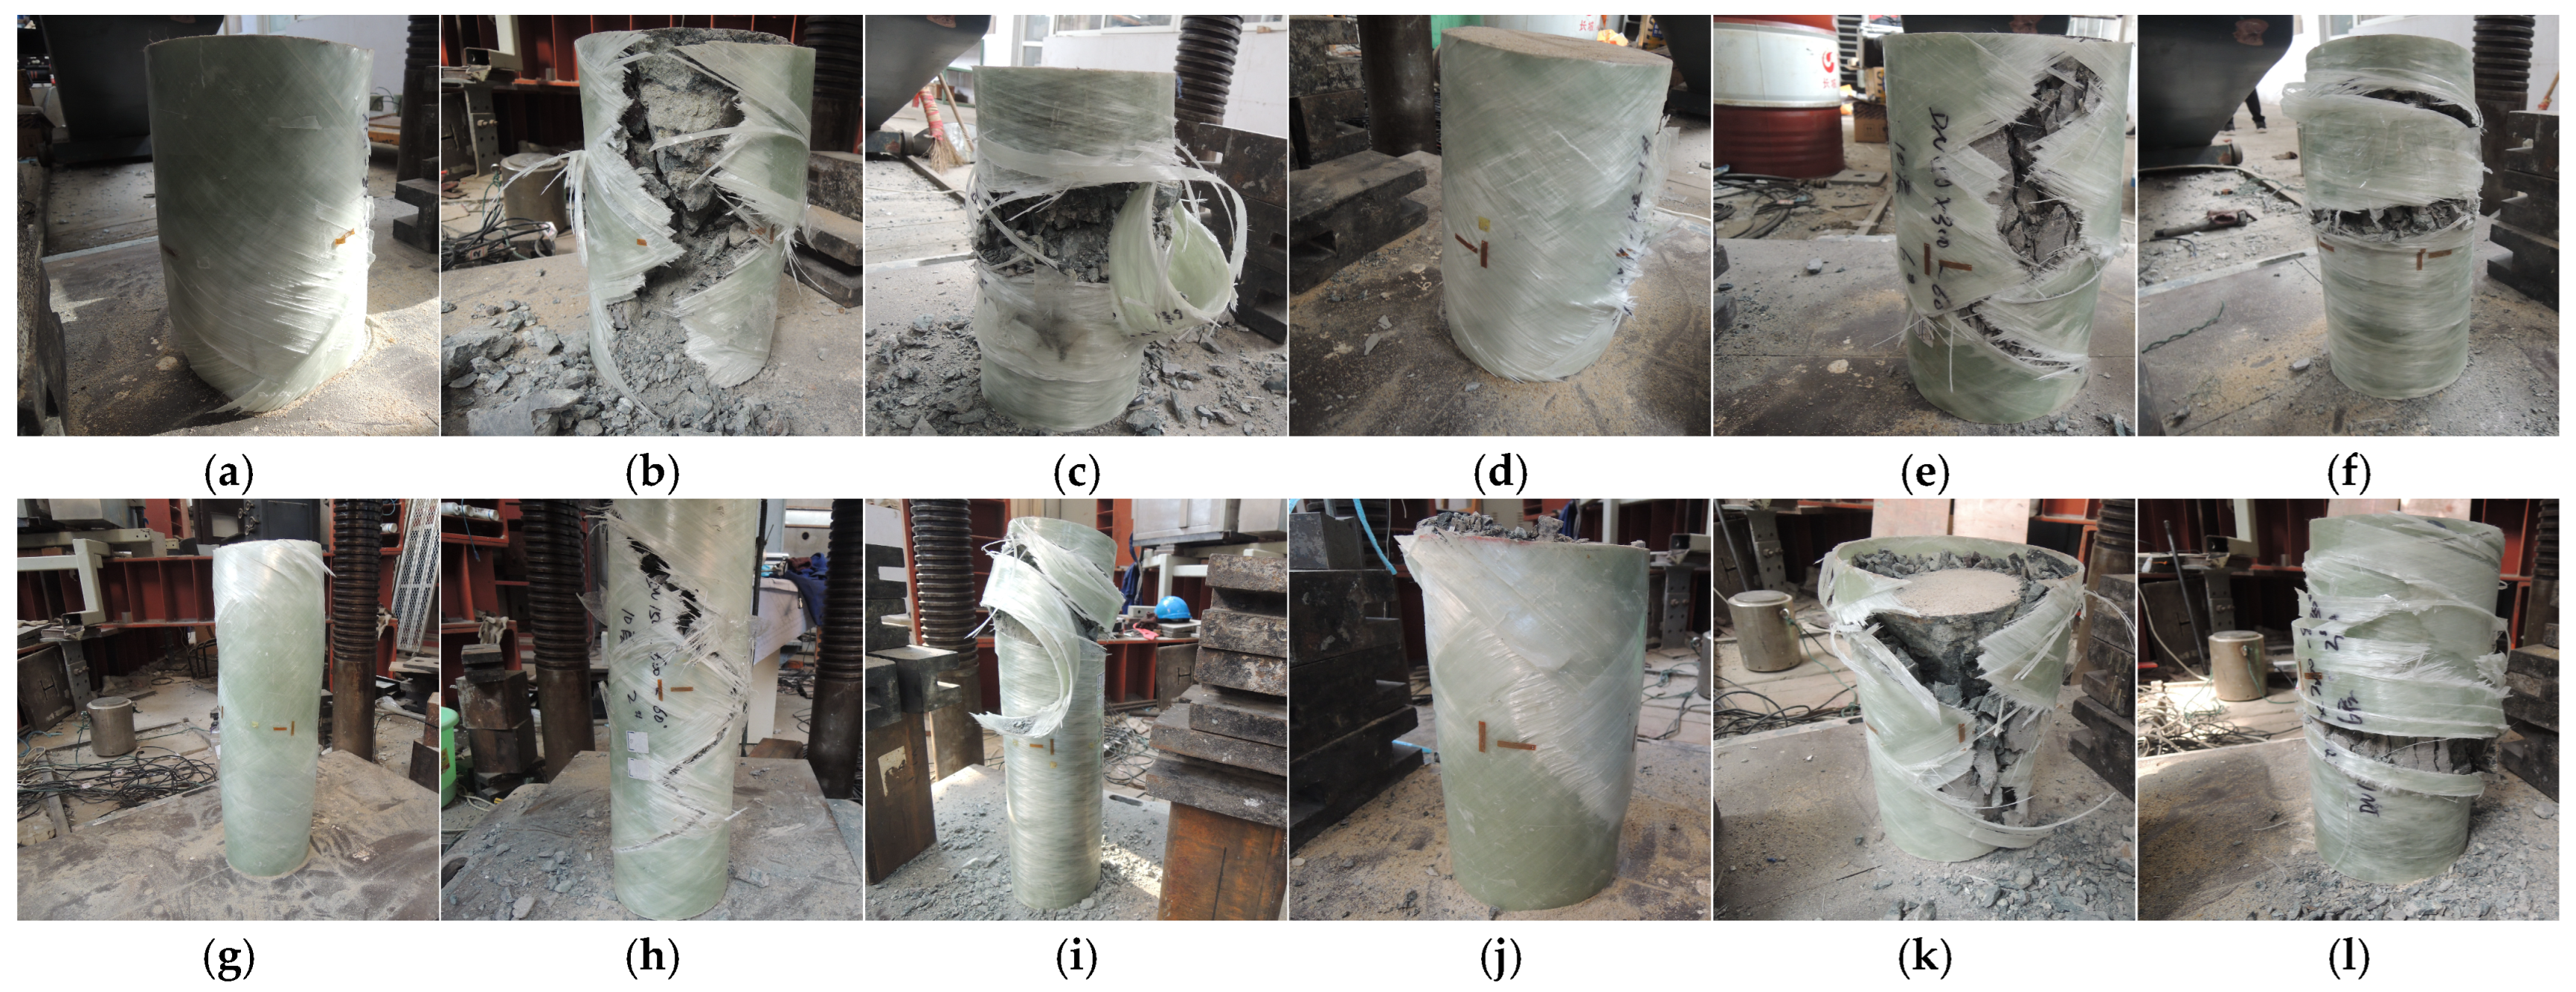
The representative failure modes of GFRP-confined concrete specimens are illustrated in
Figure 7. When the number of fiber layers
, the thinner GFRP tube wall underwent longitudinal splitting due to concrete expansion pressure, with cracks propagating from the ends toward the midspan until full penetration. For
, the thicker tube wall exhibited multi-stage failure: initial localized fiber fracture occurred, followed by strain accumulation leading to the delamination or fracture of the wall, accompanied by significant plastic deformation prior to ultimate failure.
Although all specimens failed through material fracture without instability-induced collapse, specimens with a slenderness ratio () of 4 displayed measurable lateral deflection at mid-height. Specimens with a lower of 2 demonstrated more effective lateral confinement compared to those with higher ratios, resulting in more uniform strain distribution across the section.
For specimens under full-section compression, failure manifested as coupled fracture of the GFRP tube and crushing of the concrete core. The GFRP tube directly carried axial loads, thereby weakening its hoop confinement capacity. In contrast, for specimens with only the concrete core under compression, the GFRP tube solely provided lateral confinement. Concrete crushing was more localized, and cracks in the GFRP tube primarily propagated from the midspan without preferential cracking induced by stress concentration at the ends. These specimens exhibited superior axial–hoop strain compatibility.
Crucially, the fiber failure direction aligned with the orientation, indicating that dominates the failure mechanism compared to the , , or compression section configuration.
- (1)
= . At approximately 50% of the peak strength, opacification (whitening) initiated on the GFRP surface and propagated along the fiber orientation, accompanied by audible fiber fracturing. Upon reaching peak load, catastrophic brittle failure occurred due to excessive tensile stress, resulting in instantaneous structural collapse. Simultaneously, hoop fracture of the GFRP tube coupled with concrete crushing was observed: Hoop fracture bands initiated at the tube midspan, while the confined concrete exhibited shear slip or conical crushing.
- (2)
= . Similar opacification and fiber fracturing phenomena were observed. Failure was governed by combined through-thickness tensile and interlaminar shear stresses, manifesting as longitudinal splits along the specimen height. This transitional failure mode exhibited minor bulging deformation prior to collapse, yet retained predominantly brittle characteristics.
- (3)
= . Post-peak, localized fiber whitening occurred without immediate rupture. The specimen underwent progressive damage degradation: bearing capacity decayed gradually, accompanied by the delamination of outer-layer fibers, widespread discoloration propagation, and pronounced lateral bulging due to insufficient confinement efficiency. No catastrophic hoop fracture was observed, and concrete crushing zones exhibited a dispersed distribution pattern.
3.2. Specimen Bearing Capacity
The axial stress
is calculated as the axial force (measured by the load cell) divided by the compressive cross-sectional area. The axial strain
and circumferential strain
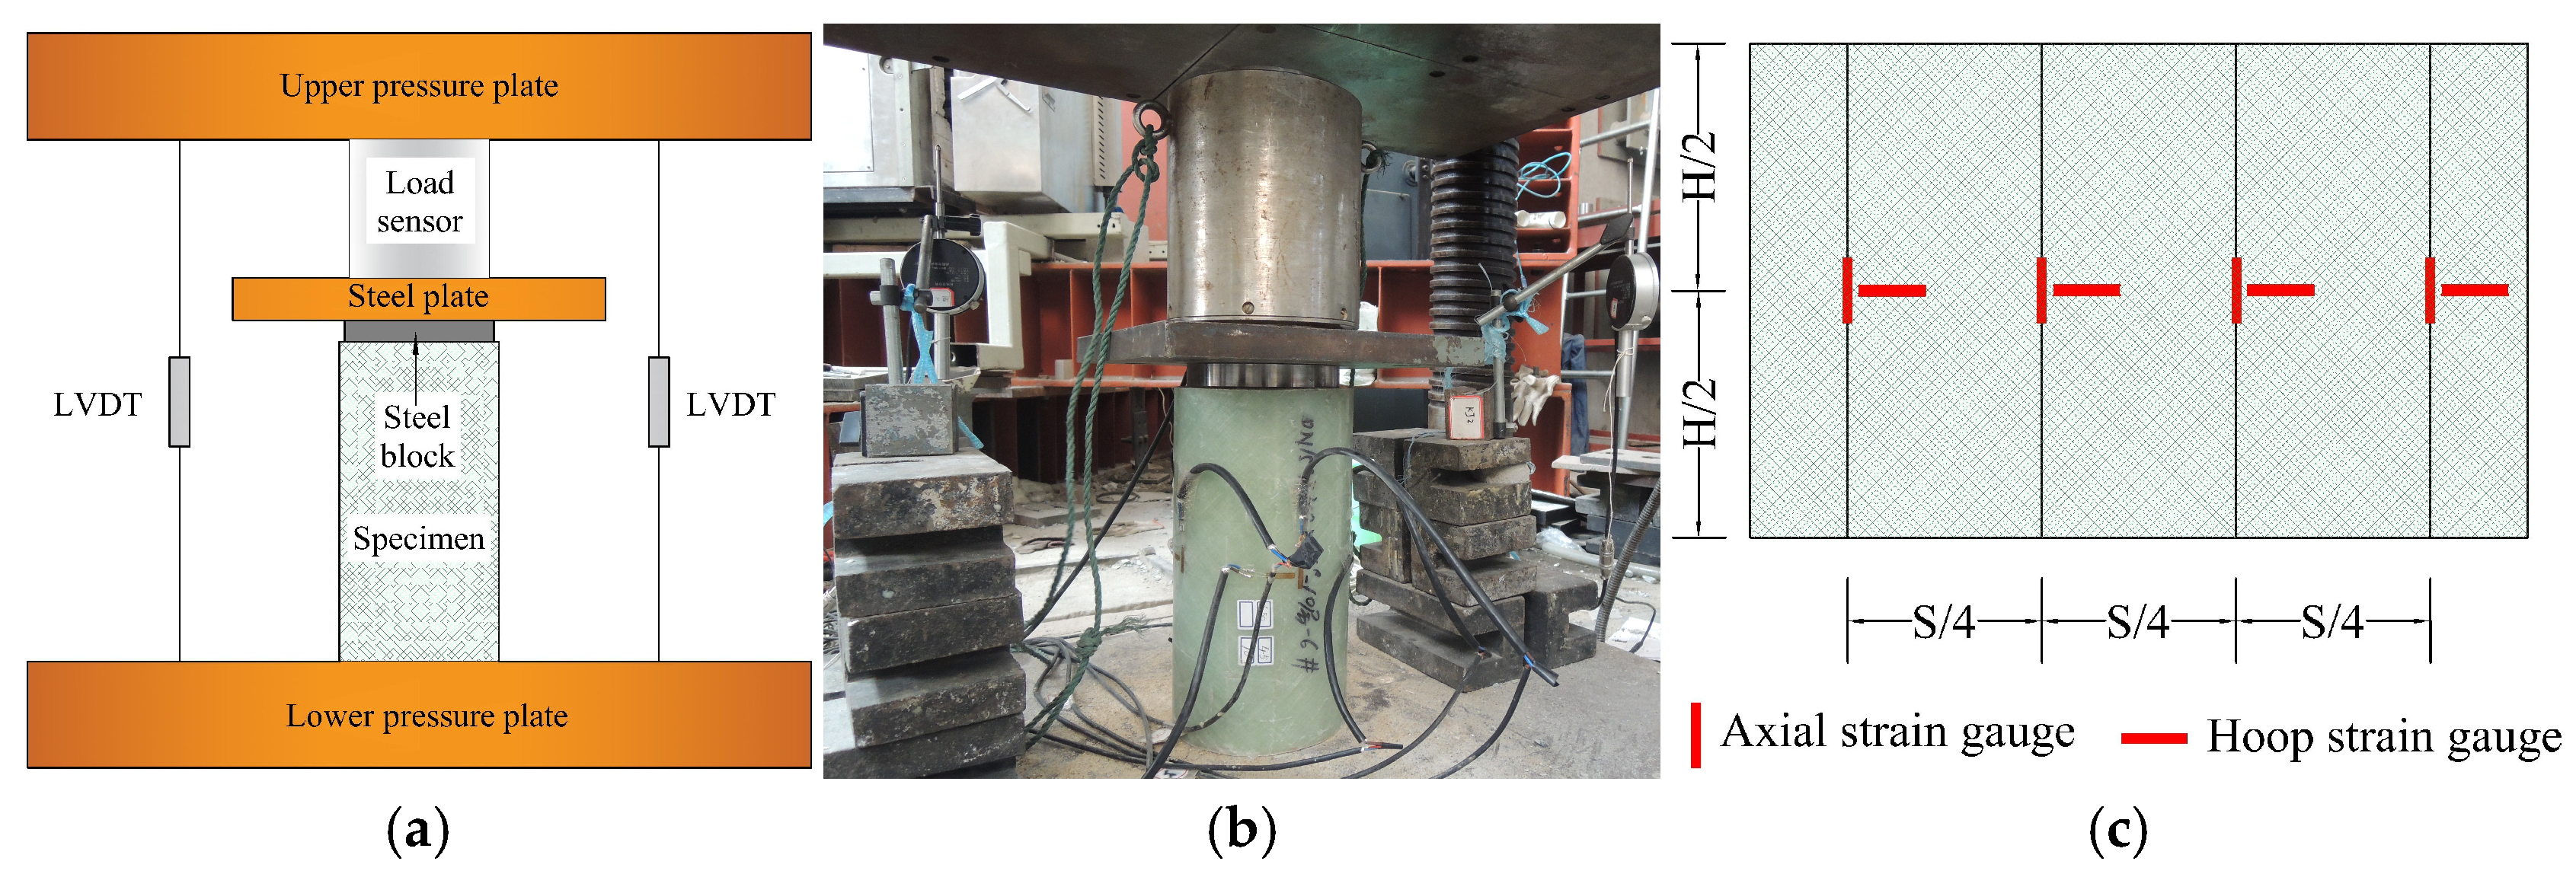
are derived from the averaged measurements of four longitudinal and transverse strain gauges, respectively, with LVDT data serving as the displacement reference. The test results for each specimen group are summarized in
Table 4. A comparative analysis of the peak strength (
) across specimen groups is presented in
Figure 8. The effective confinement strength (
) was calculated as follows [
30]:
where
is the hoop tensile secant modulus of GFRP;
is the fiber layers;
is the laminate thickness of GFRP tube;
is the effective confinement hoop strain; and
is the diameter of concrete cylinder.
When the increased from to , the increased by 115.1–173.1% (relative) and 50.0–101.0 MPa (absolute). Further increasing to yielded smaller gains of 10.7–27.1% (relative) and 17.7–33.6 MPa (absolute). Increasing the from 6 to 10 enhanced by 10.8–35.0% (relative) and 4.3–43.0 MPa (absolute). Specimens with a of 2 exhibited a 2.8–13.9% higher relative strength and a 3.4–12.5 MPa higher absolute strength than those with . Compared to full-section compression, core-concrete-loaded specimens showed significantly higher (16.4–33.6% relative increase; 13.0–41.7 MPa absolute increase). Relative to the unconfined concrete strength , (1) Group A/B/C specimens achieved 189.8%, 301.2%, and 258.7% mean enhancement, respectively; (2) specimens with , , and exhibited mean increases of 63.7%, 298.0%, and 388.0%, respectively; and (3) specimens with and showed mean improvements of 212.9% and 286.9%, respectively.
3.3. Stress–Strain Analysis
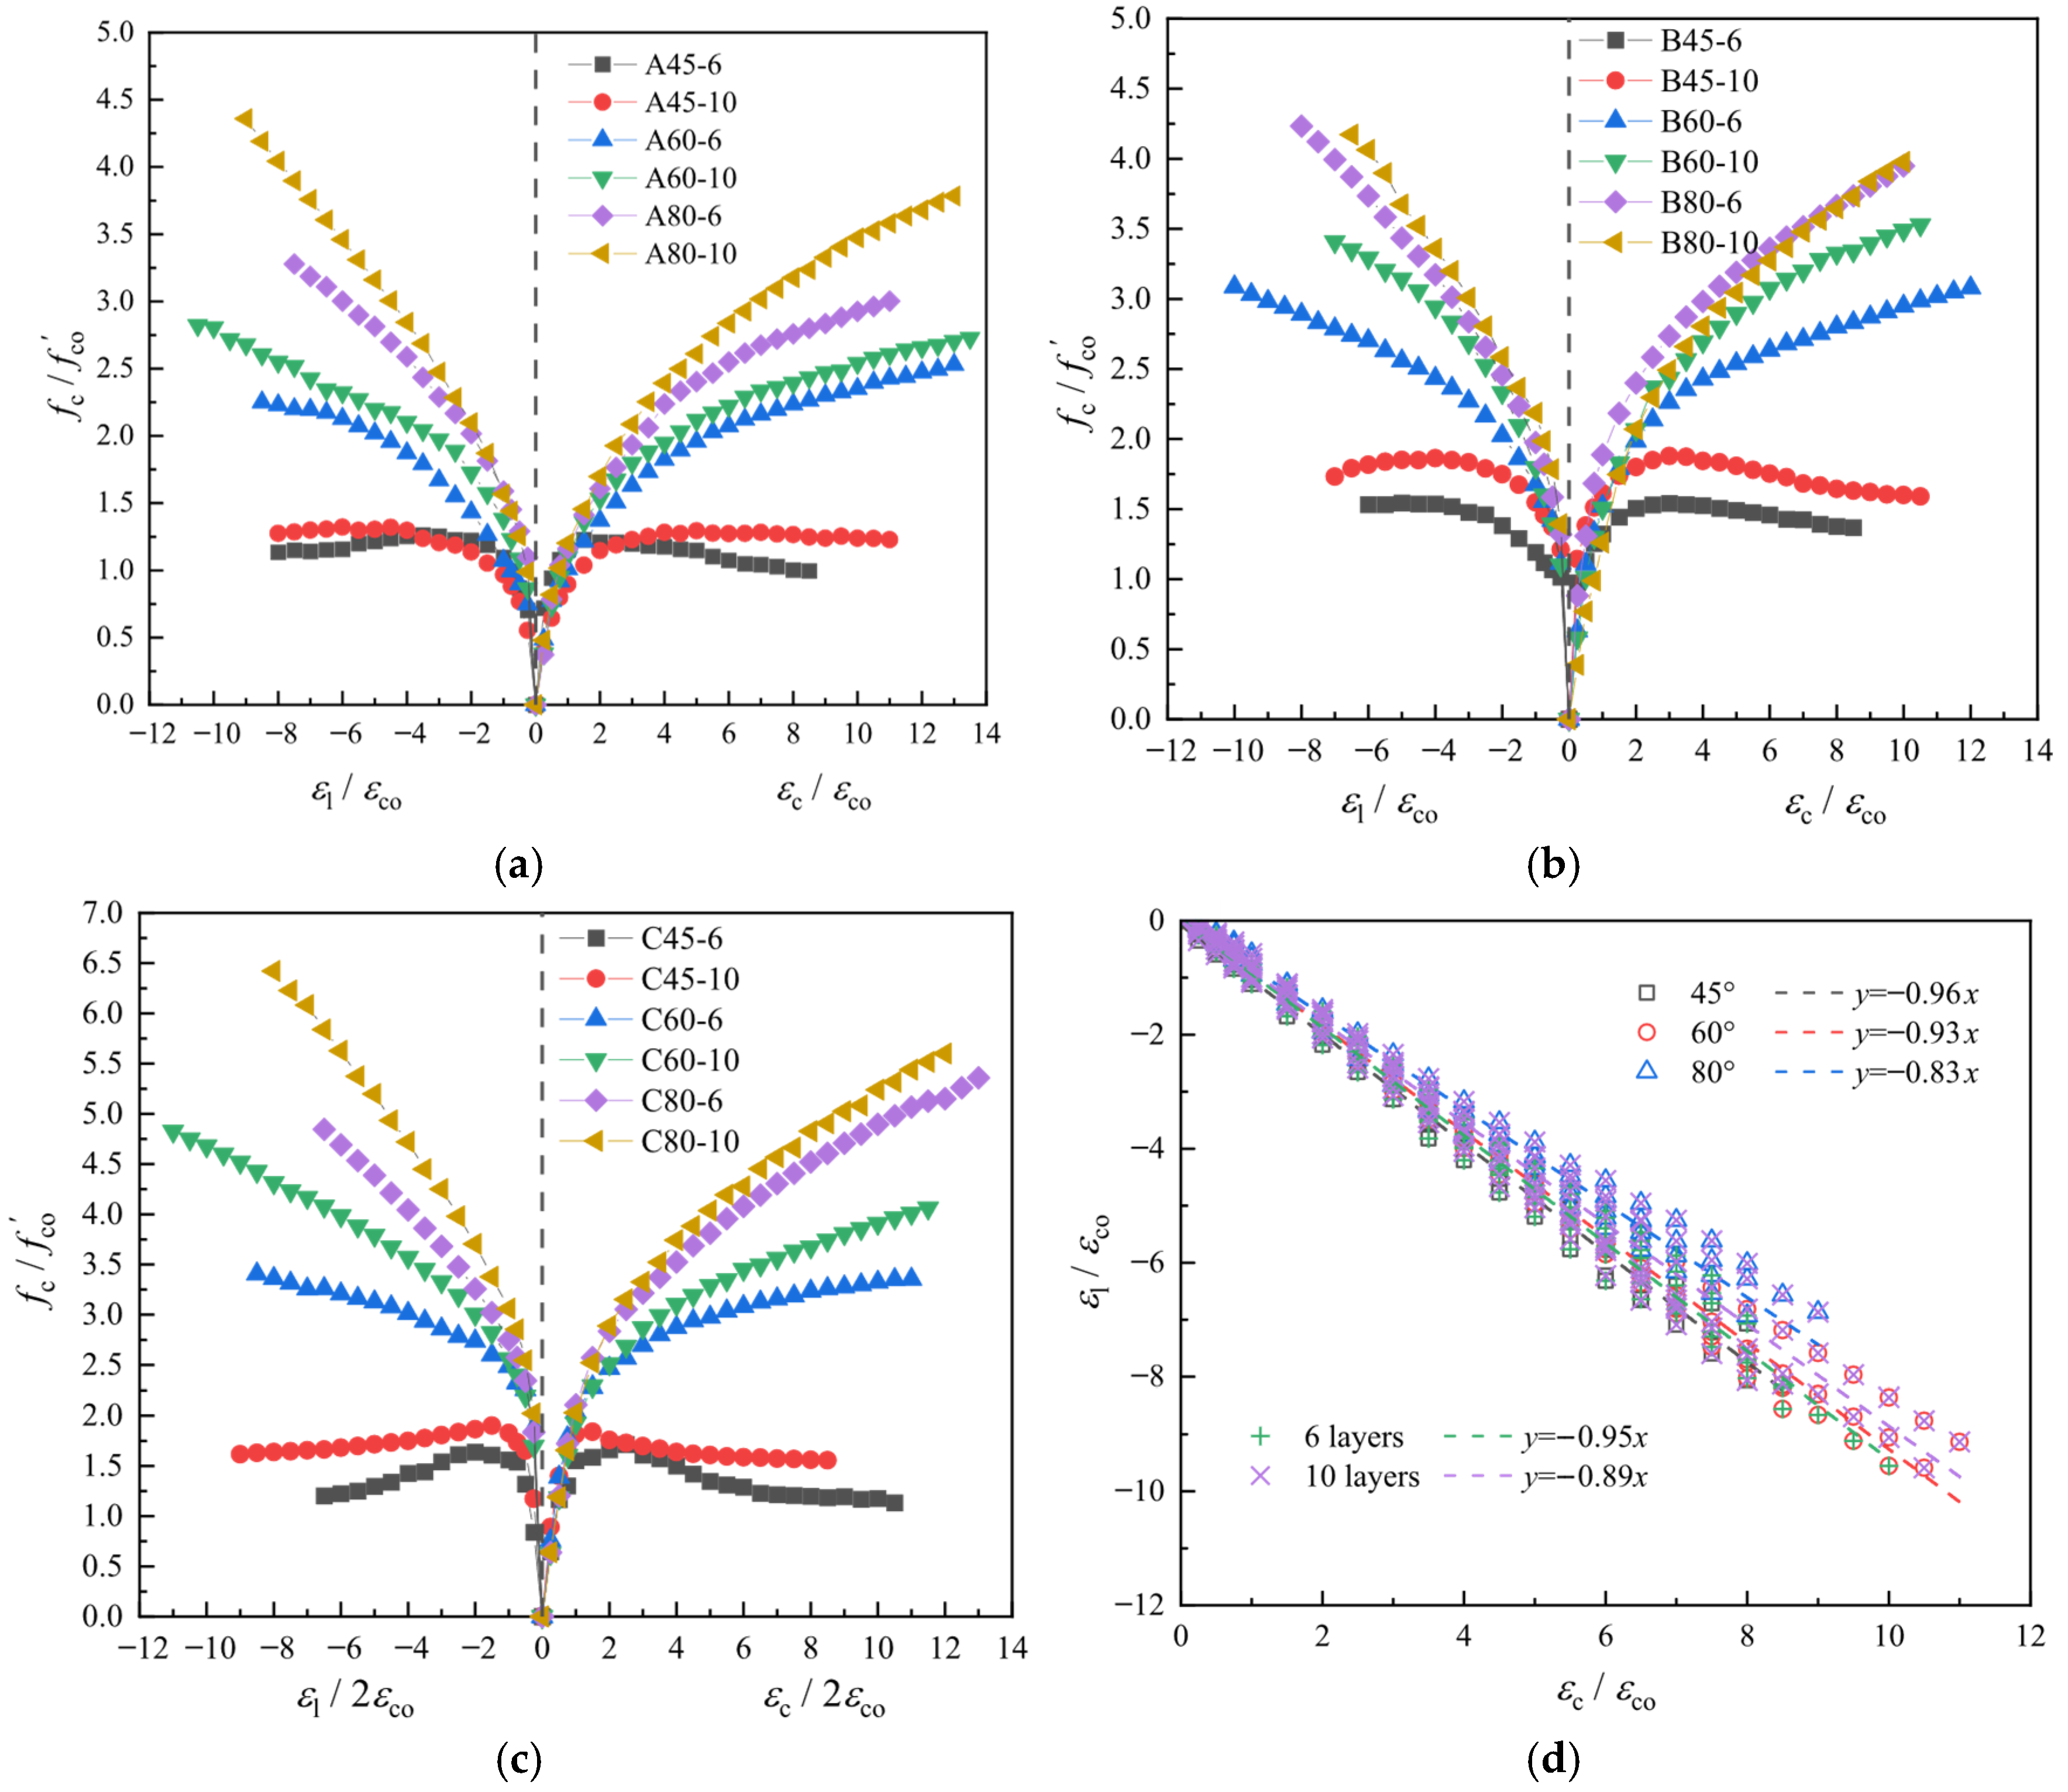
The normalized stress–strain curves for each specimen group are shown in
Figure 9, where
denotes the peak strain of unconfined concrete corresponding to
. Notably, the surface cracking of GFRP tubes during loading damaged strain gauges prior to specimen failure, necessitating reliance on peak stress data from
Table 4.
Figure 9 indicates that all GFRP-confined specimens exhibit near-linear stress–strain responses in the initial loading phase. As
approaches
, the GFRP confinement mechanism activates, inducing nonlinear curvature in the curves. Subsequent increases in
reduce tangent slope magnitudes, with significant variations observed across specimens—attributable primarily to GFRP confinement effectiveness.
The of GFRP-confined specimens increased by up to 530%, while the exhibited a maximum enhancement of 1600%. Although growth consistently outpaced during loading, specimens with higher and demonstrated an enhanced axial deformation capacity but reduced circumferential deformation performance. Critically, and maintained a near-linear correlation throughout the loading process.
For GFRP-confined concrete short columns, the and of Group A and B specimens exhibit minimal differences. However, since the of Group A is 50.0% higher than that of Group B, the normalized strength ratio () of Group B is significantly larger, demonstrating the enhanced confinement efficacy of GFRP tubes for specimens with higher .
After converting to the ultimate bearing capacity (accounting for differing compressive areas), Group A and C specimens show variation in load-carrying capacity, indicating close agreement. In contrast, the differs by 6.3–14.3%. This implies that compressing GFRP tubes with confined concrete (vs. core-concrete-only loading) minimally impacts axial performance but weakens the circumferential deformation capacity, particularly in specimens with a larger .
The stress–strain response exhibits a triphasic profile comprising an initial linear segment, a transitional phase, and a subsequent linear segment. Prior to reaching 0.8–0.9, specimens remain in the linear elastic regime with the negligible activation of GFRP confinement. During the elastoplastic transition, curves diverge significantly across specimens, characterized by a reduced tangent slope, rapid microcrack proliferation, and substantial core concrete expansion, which progressively activates the GFRP tube’s passive confinement mechanism. In the plastic stage, (1) for and , increases with , culminating in , where (indicating synchronized strength–failure). At this point, the measured substantially exceeds values from the GFRP material tests, whereas the is marginally lower; (2) for , plateaus or declines, resulting in and , signifying a significant residual deformation capacity.
The stress–strain curves of 6-layer specimens consistently demonstrate a superior mechanical performance compared to 10-layer specimens across all groups. This indicates that exerts a dominant influence over on specimen properties under the given parameters. Specifically, GFRP tubes provide relatively weak confinement, yielding minimal strength enhancement despite significantly improved ductility and clear ductile failure patterns; both and configurations effectively enhance strength and ductility through distinct axial–circumferential strain coupling mechanisms. Optimal selection should therefore prioritize based on the specific engineering requirements for strength–ductility balance.
4. Quasi-Static Test Results
4.1. Specimen Failure Mode and Structural Performance Levels
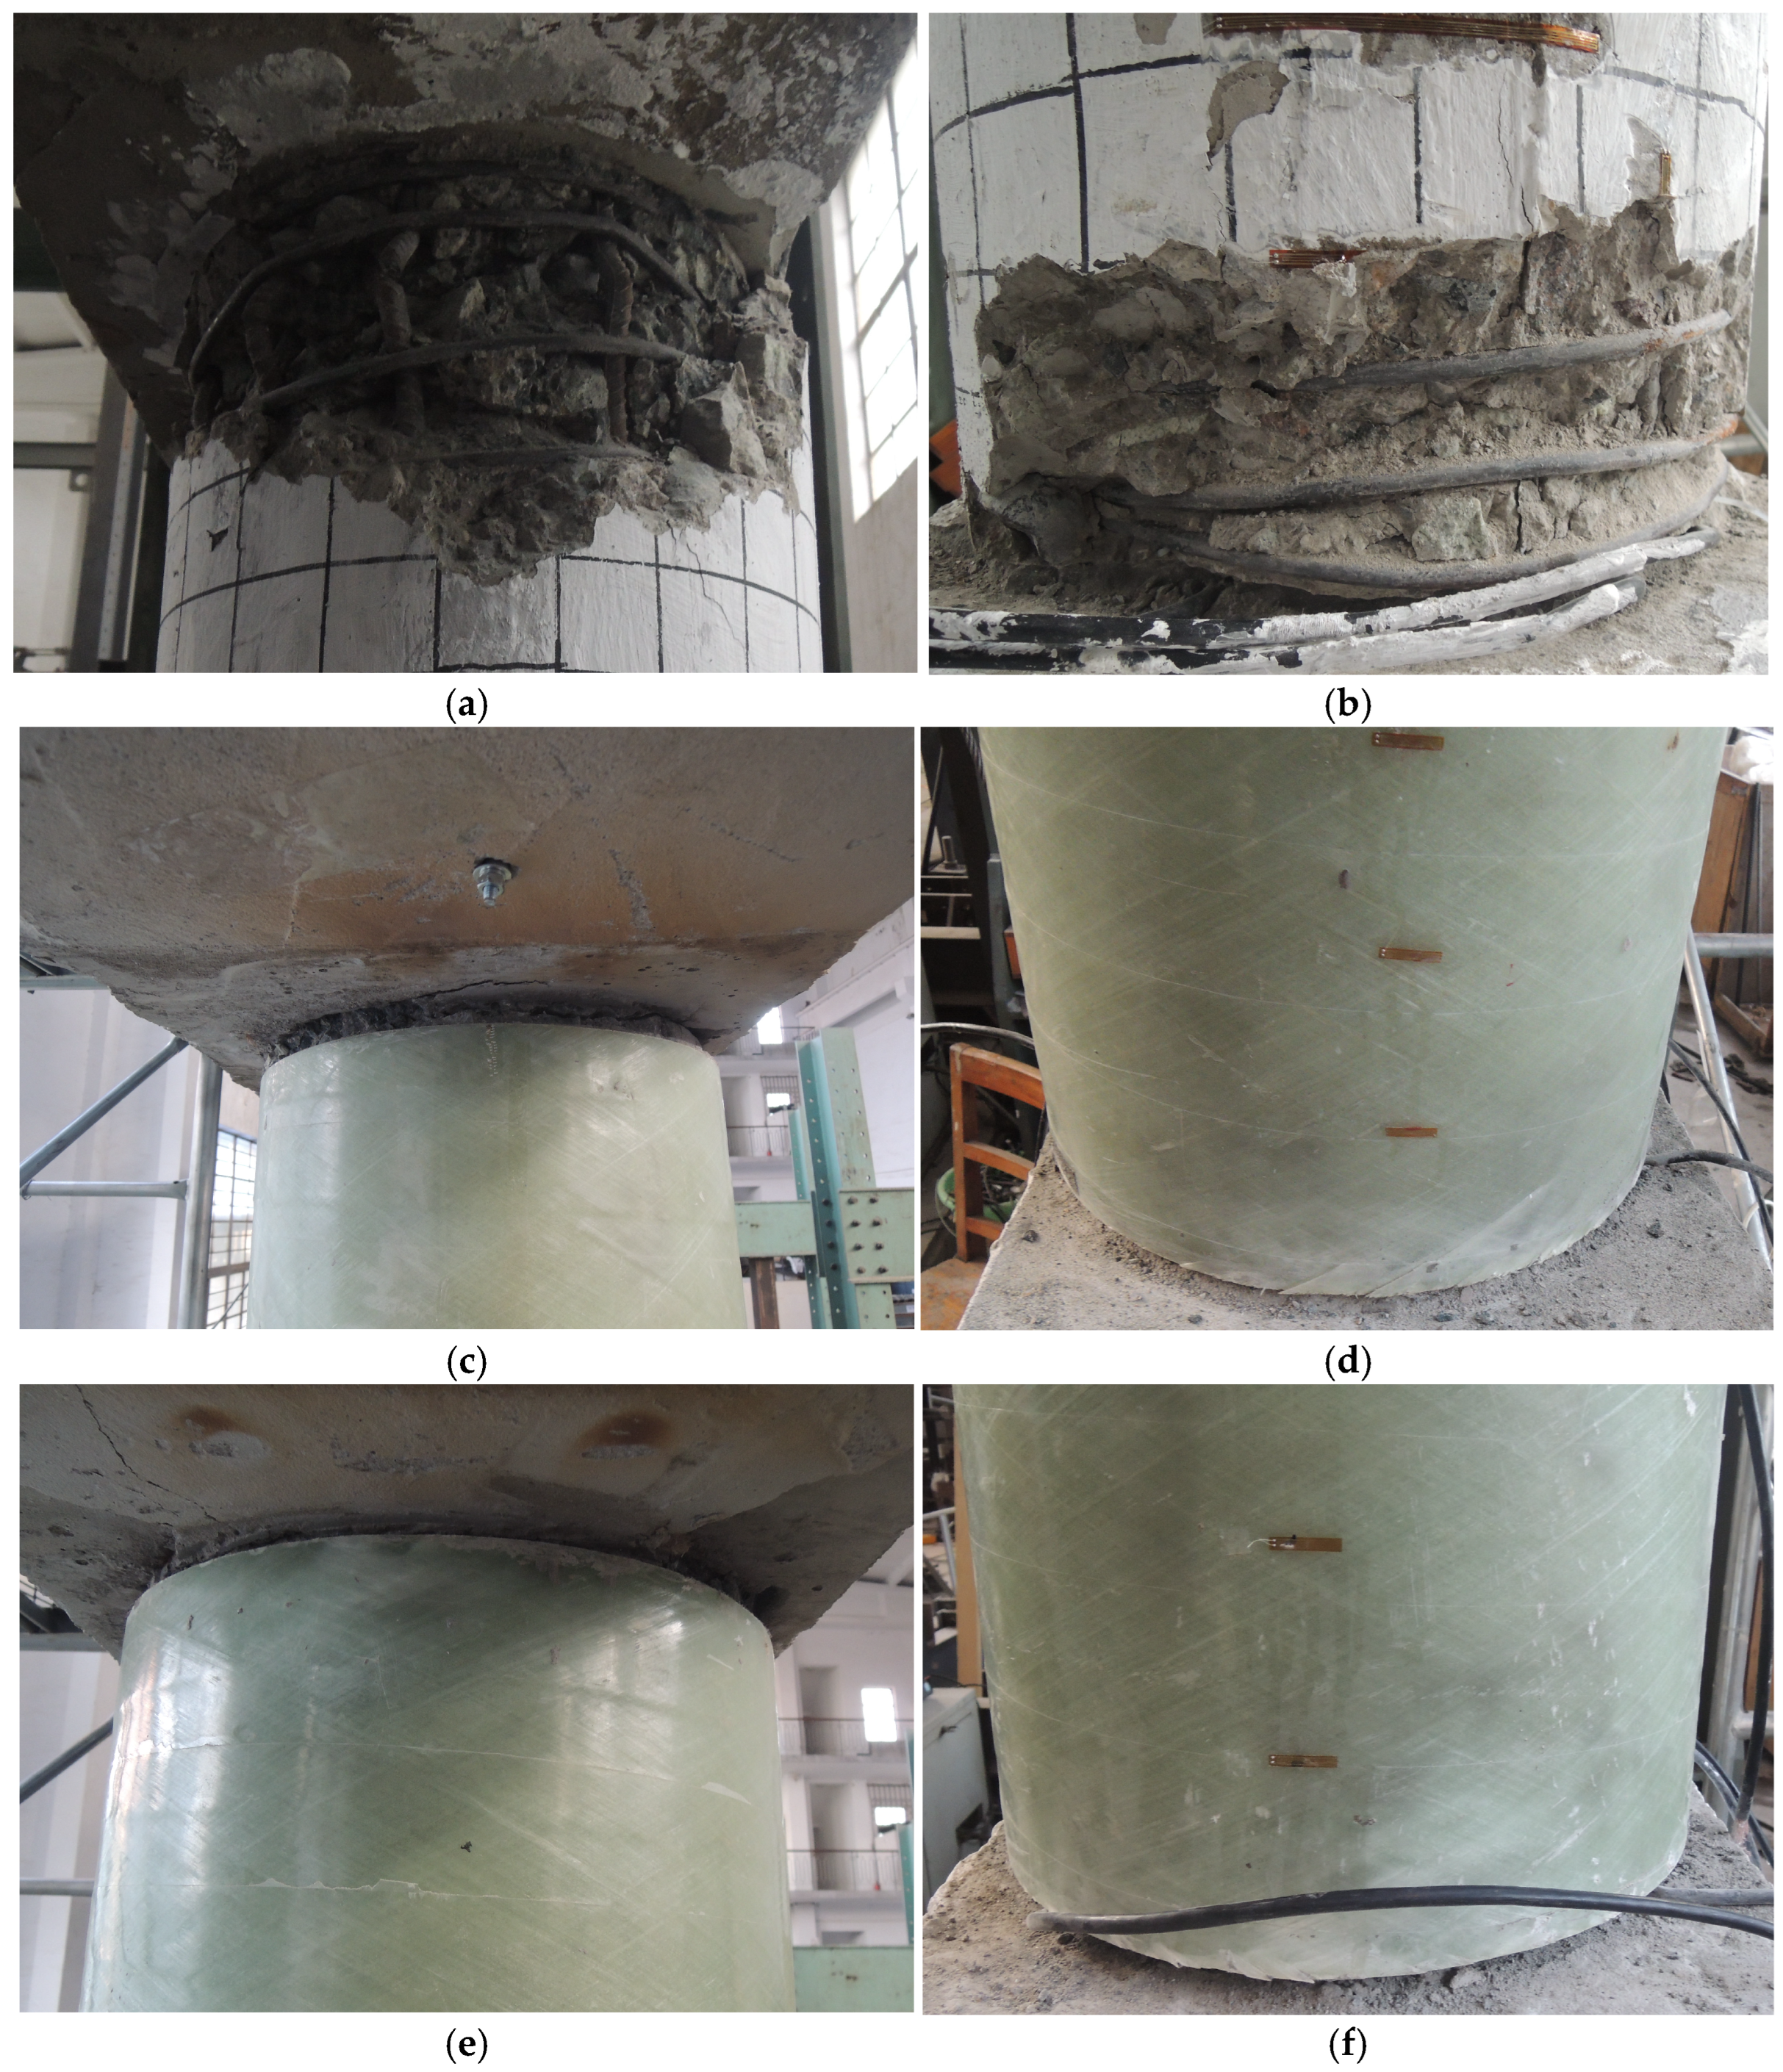
As illustrated in
Figure 10, the failure modes of each bridge pier specimen are characterized as follows:
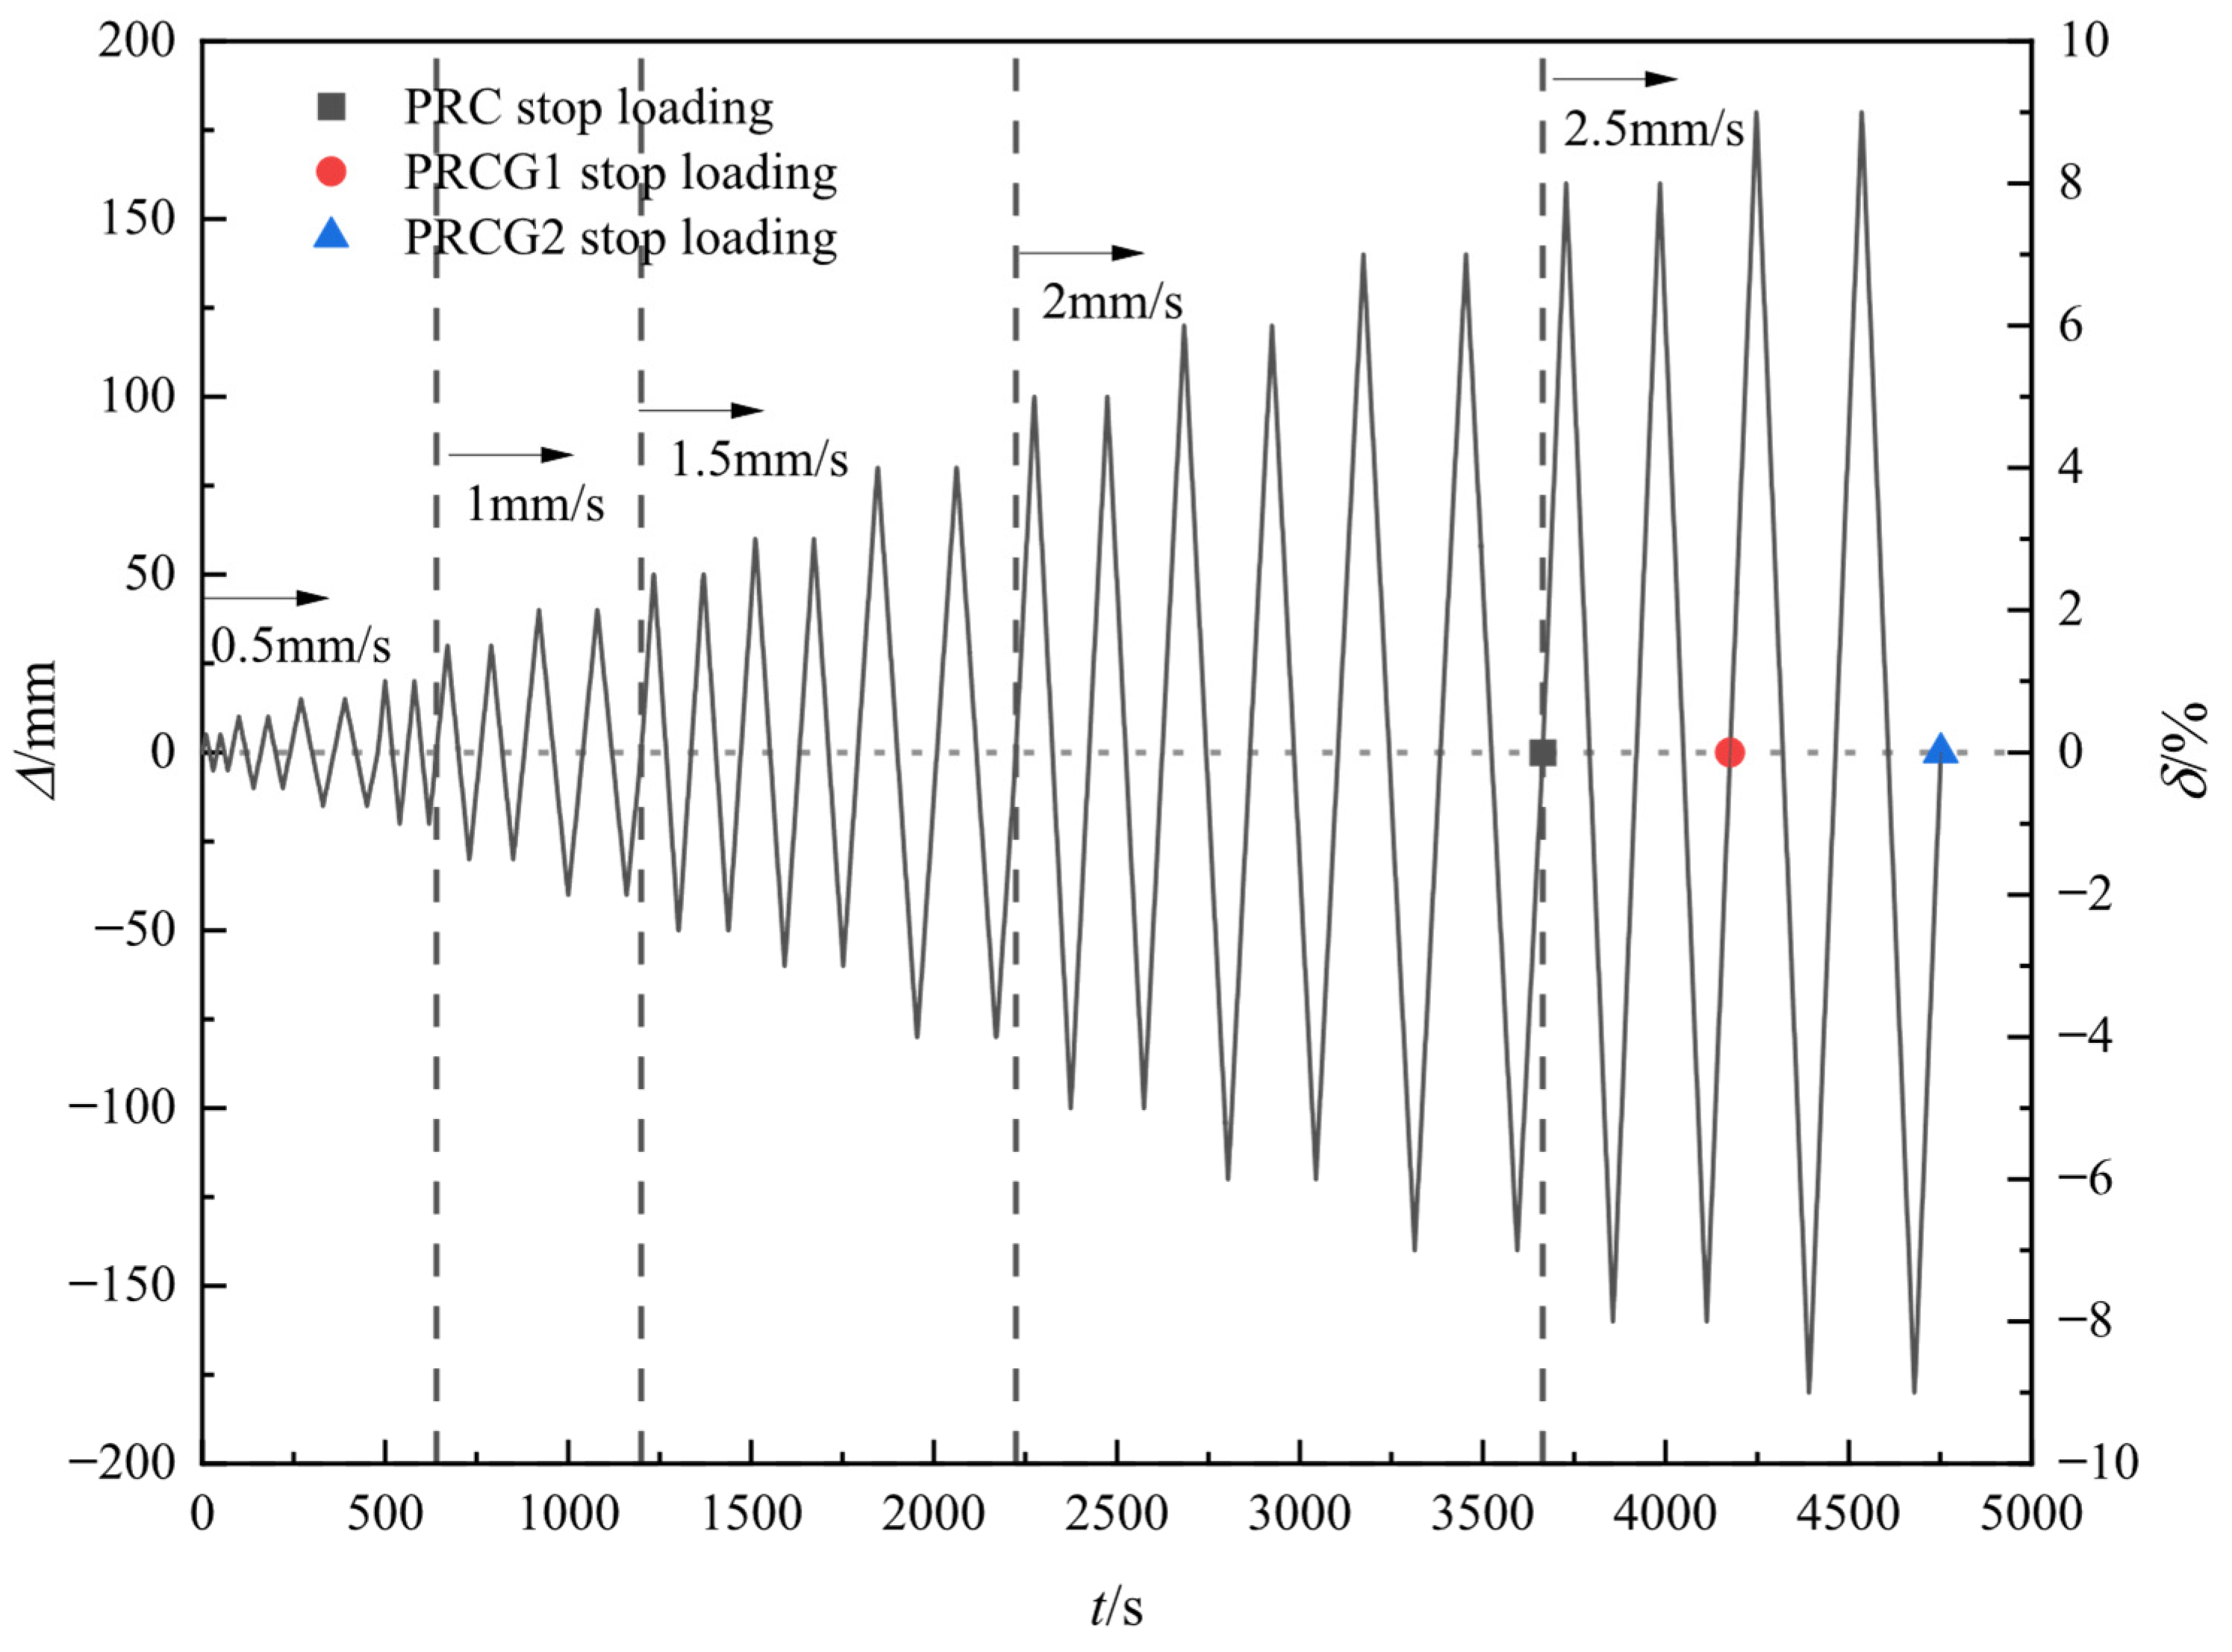
For the PRC specimen with grouted sleeve connectors embedded in caps, initial horizontal cracks (width < 0.2 mm) emerged in the pier shaft above the bottom joint at drift ratios ( < 1%). During the development phase ( = 1–2%), these cracks propagated diagonally, forming flexural–shear cracks. At > 2.5%, concrete cover spalling occurred in wedge-shaped or circular patterns, with a significantly lower damage height in the bottom region compared to the top cast-in-place section. Concurrently, extensive concrete spalling and reinforcement exposure were observed at the top. When > 4%, longitudinal bars in the loading direction yielded and buckled first, followed by adjacent bars perpendicular to loading. Stirrups exhibited outward bending, and ultimate failure was triggered by the fracture of sleeve-exposed rebars rather than sleeve connector failure.
PRCG1 and PRCG2 exhibited similar damage evolution. At < 3%, GFRP tubes effectively suppressed crack propagation through circumferential confinement, minimizing joint opening. Continuous increases in hoop tensile stress/strain within the plastic hinge zone (above the joint) significantly inhibited concrete dilation. At drift ratios > 5%, localized fiber whitening and delamination occurred on GFRP surfaces—particularly near caps—yet without circumferential rupture (distinct from the brittle fracture of traditional CFRP wraps). This demonstrates GFRP’s ductility advantage in:
- (1)
Blocking the “concrete-splitting-to-rebar-buckling” chain failure;
- (2)
Retarding concrete strength degradation;
- (3)
Validating the “confinement precedes reinforcement” design philosophy.
The allowable drift ratio
(defined as the ratio of pier-top horizontal displacement
to pier height
) is a critical performance indicator in seismic design. Its limits vary with failure modes, performance objectives, and code requirements. According to the JTG/T 2231-2020 [
31] and experimental studies herein, bridge piers must remain elastic under the E1 earthquake (frequent-level earthquake) and prevent collapse under the E2 earthquake (rare-level earthquake), with performance thresholds categorized into five levels as listed in
Table 5.
4.2. Hysteresis Performance
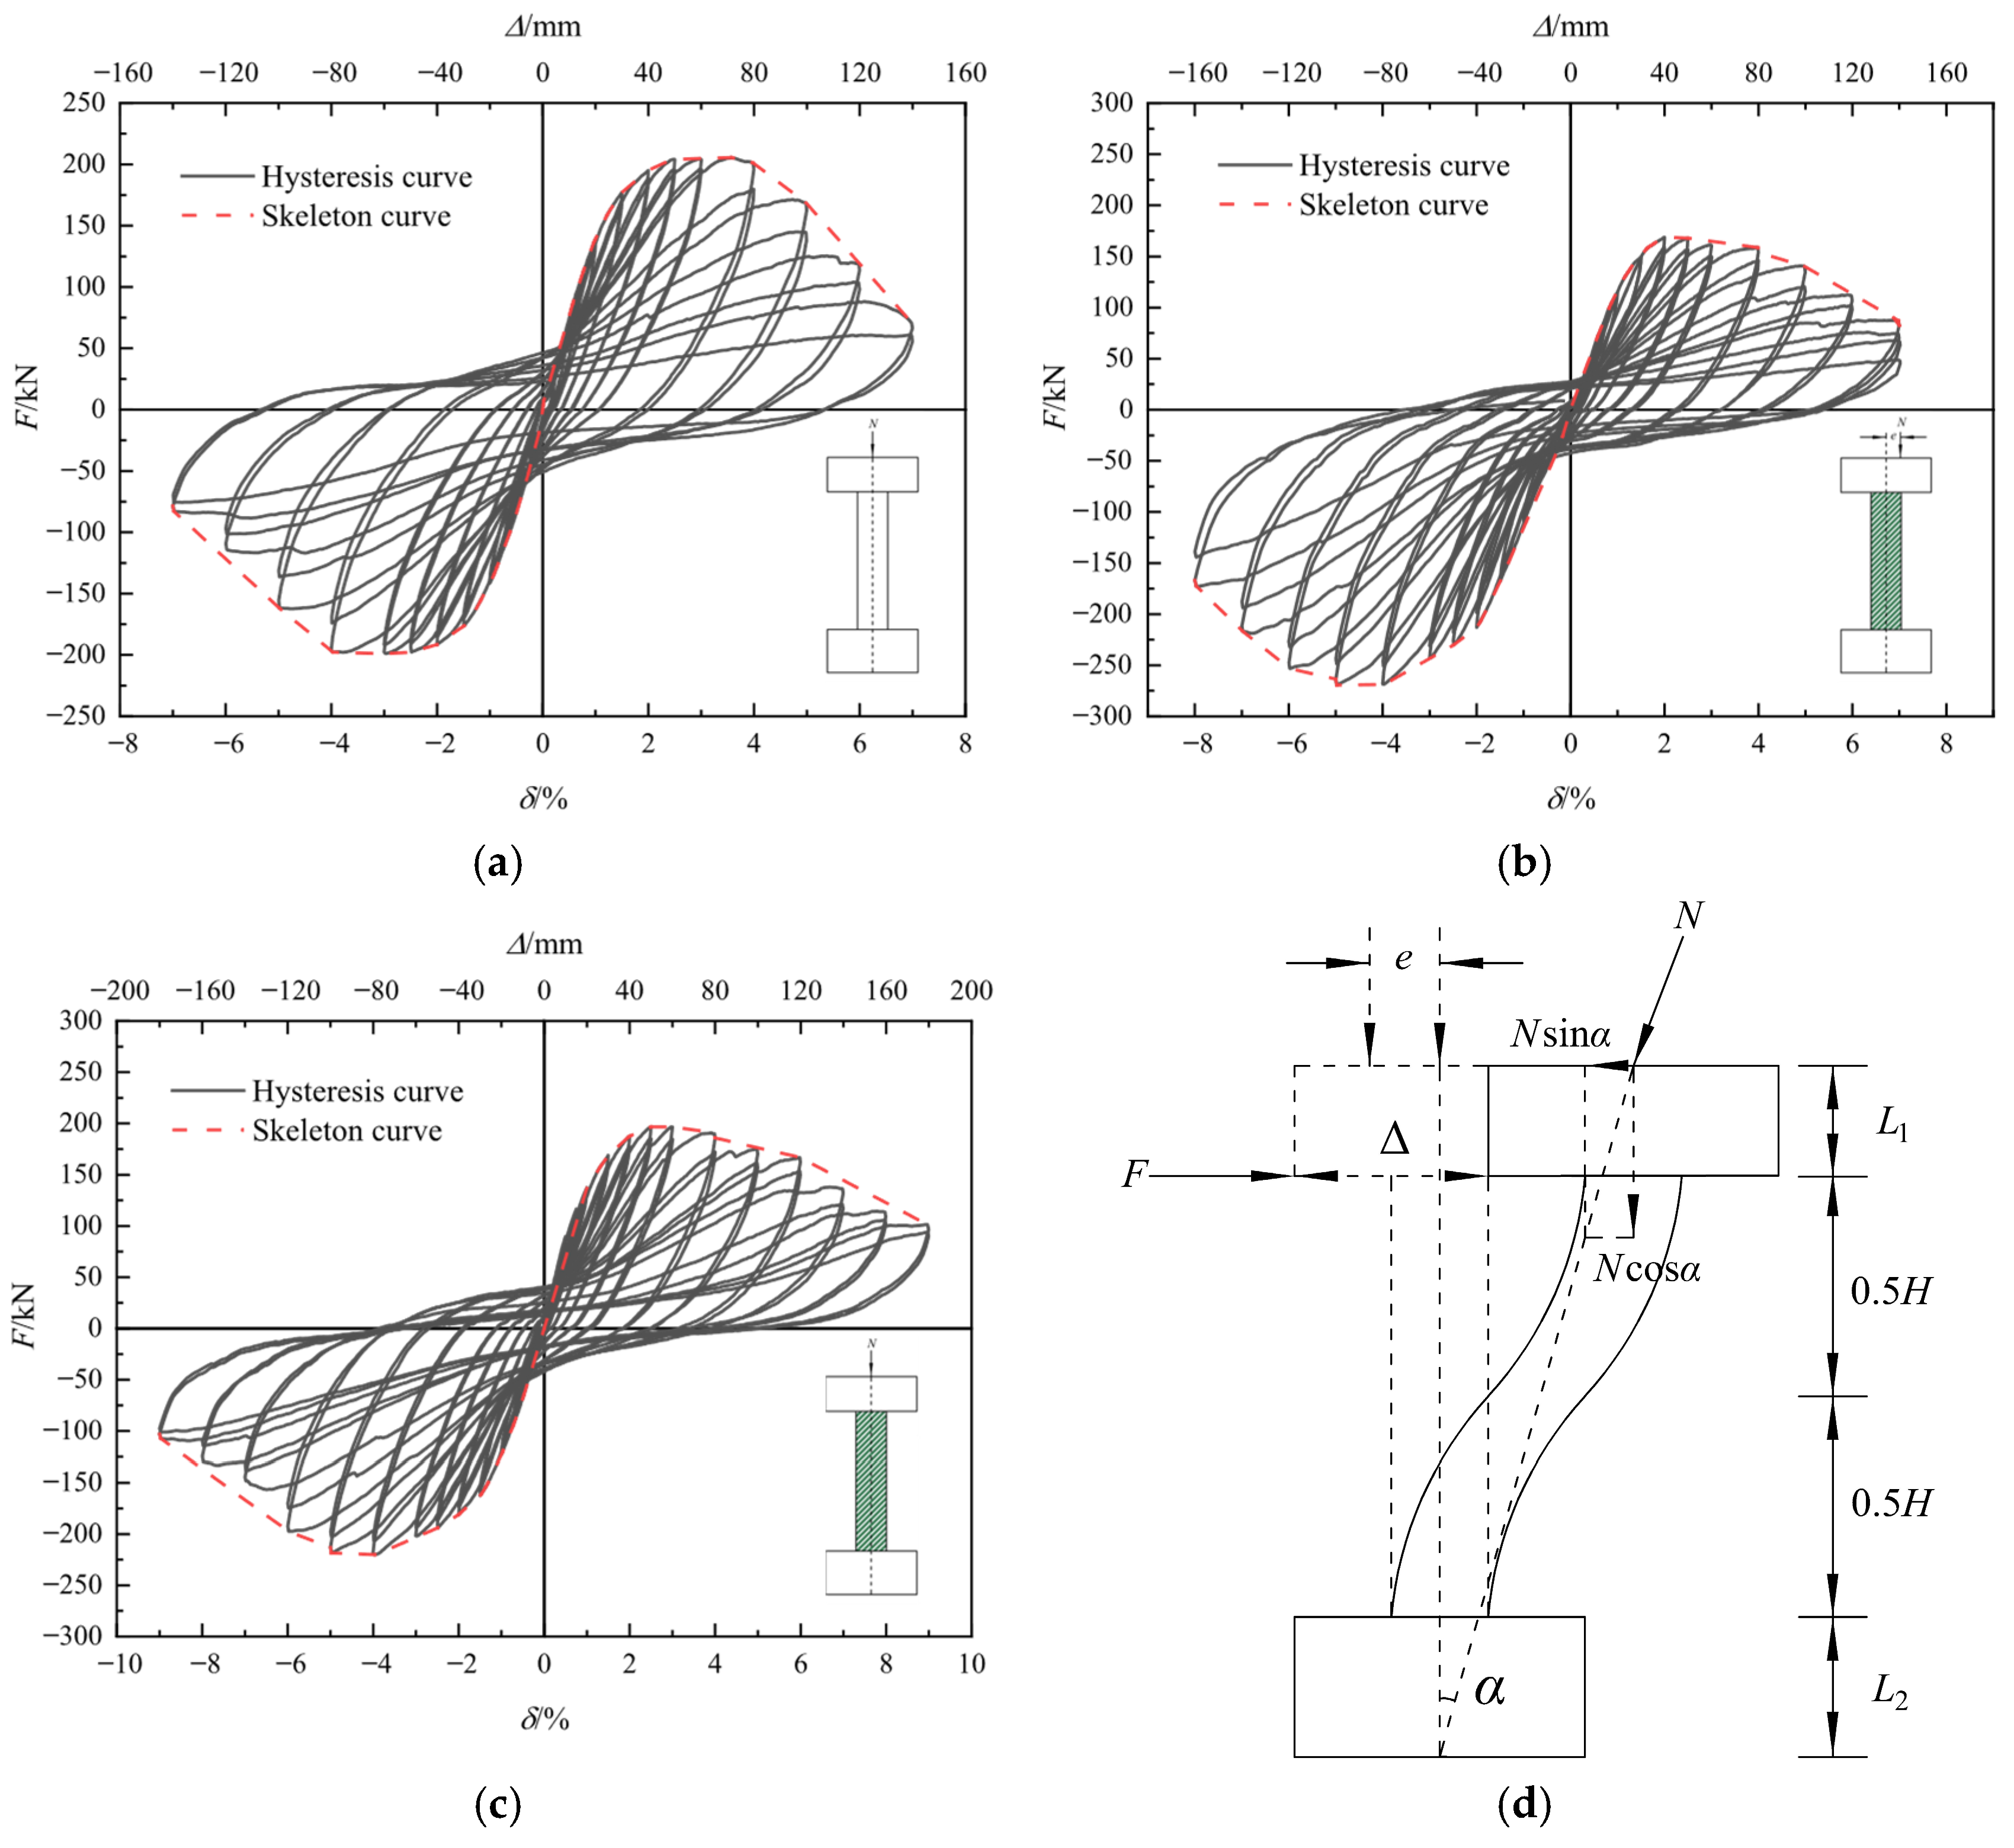
The hysteretic responses and skeleton curves of all specimens under quasi-static testing are presented in
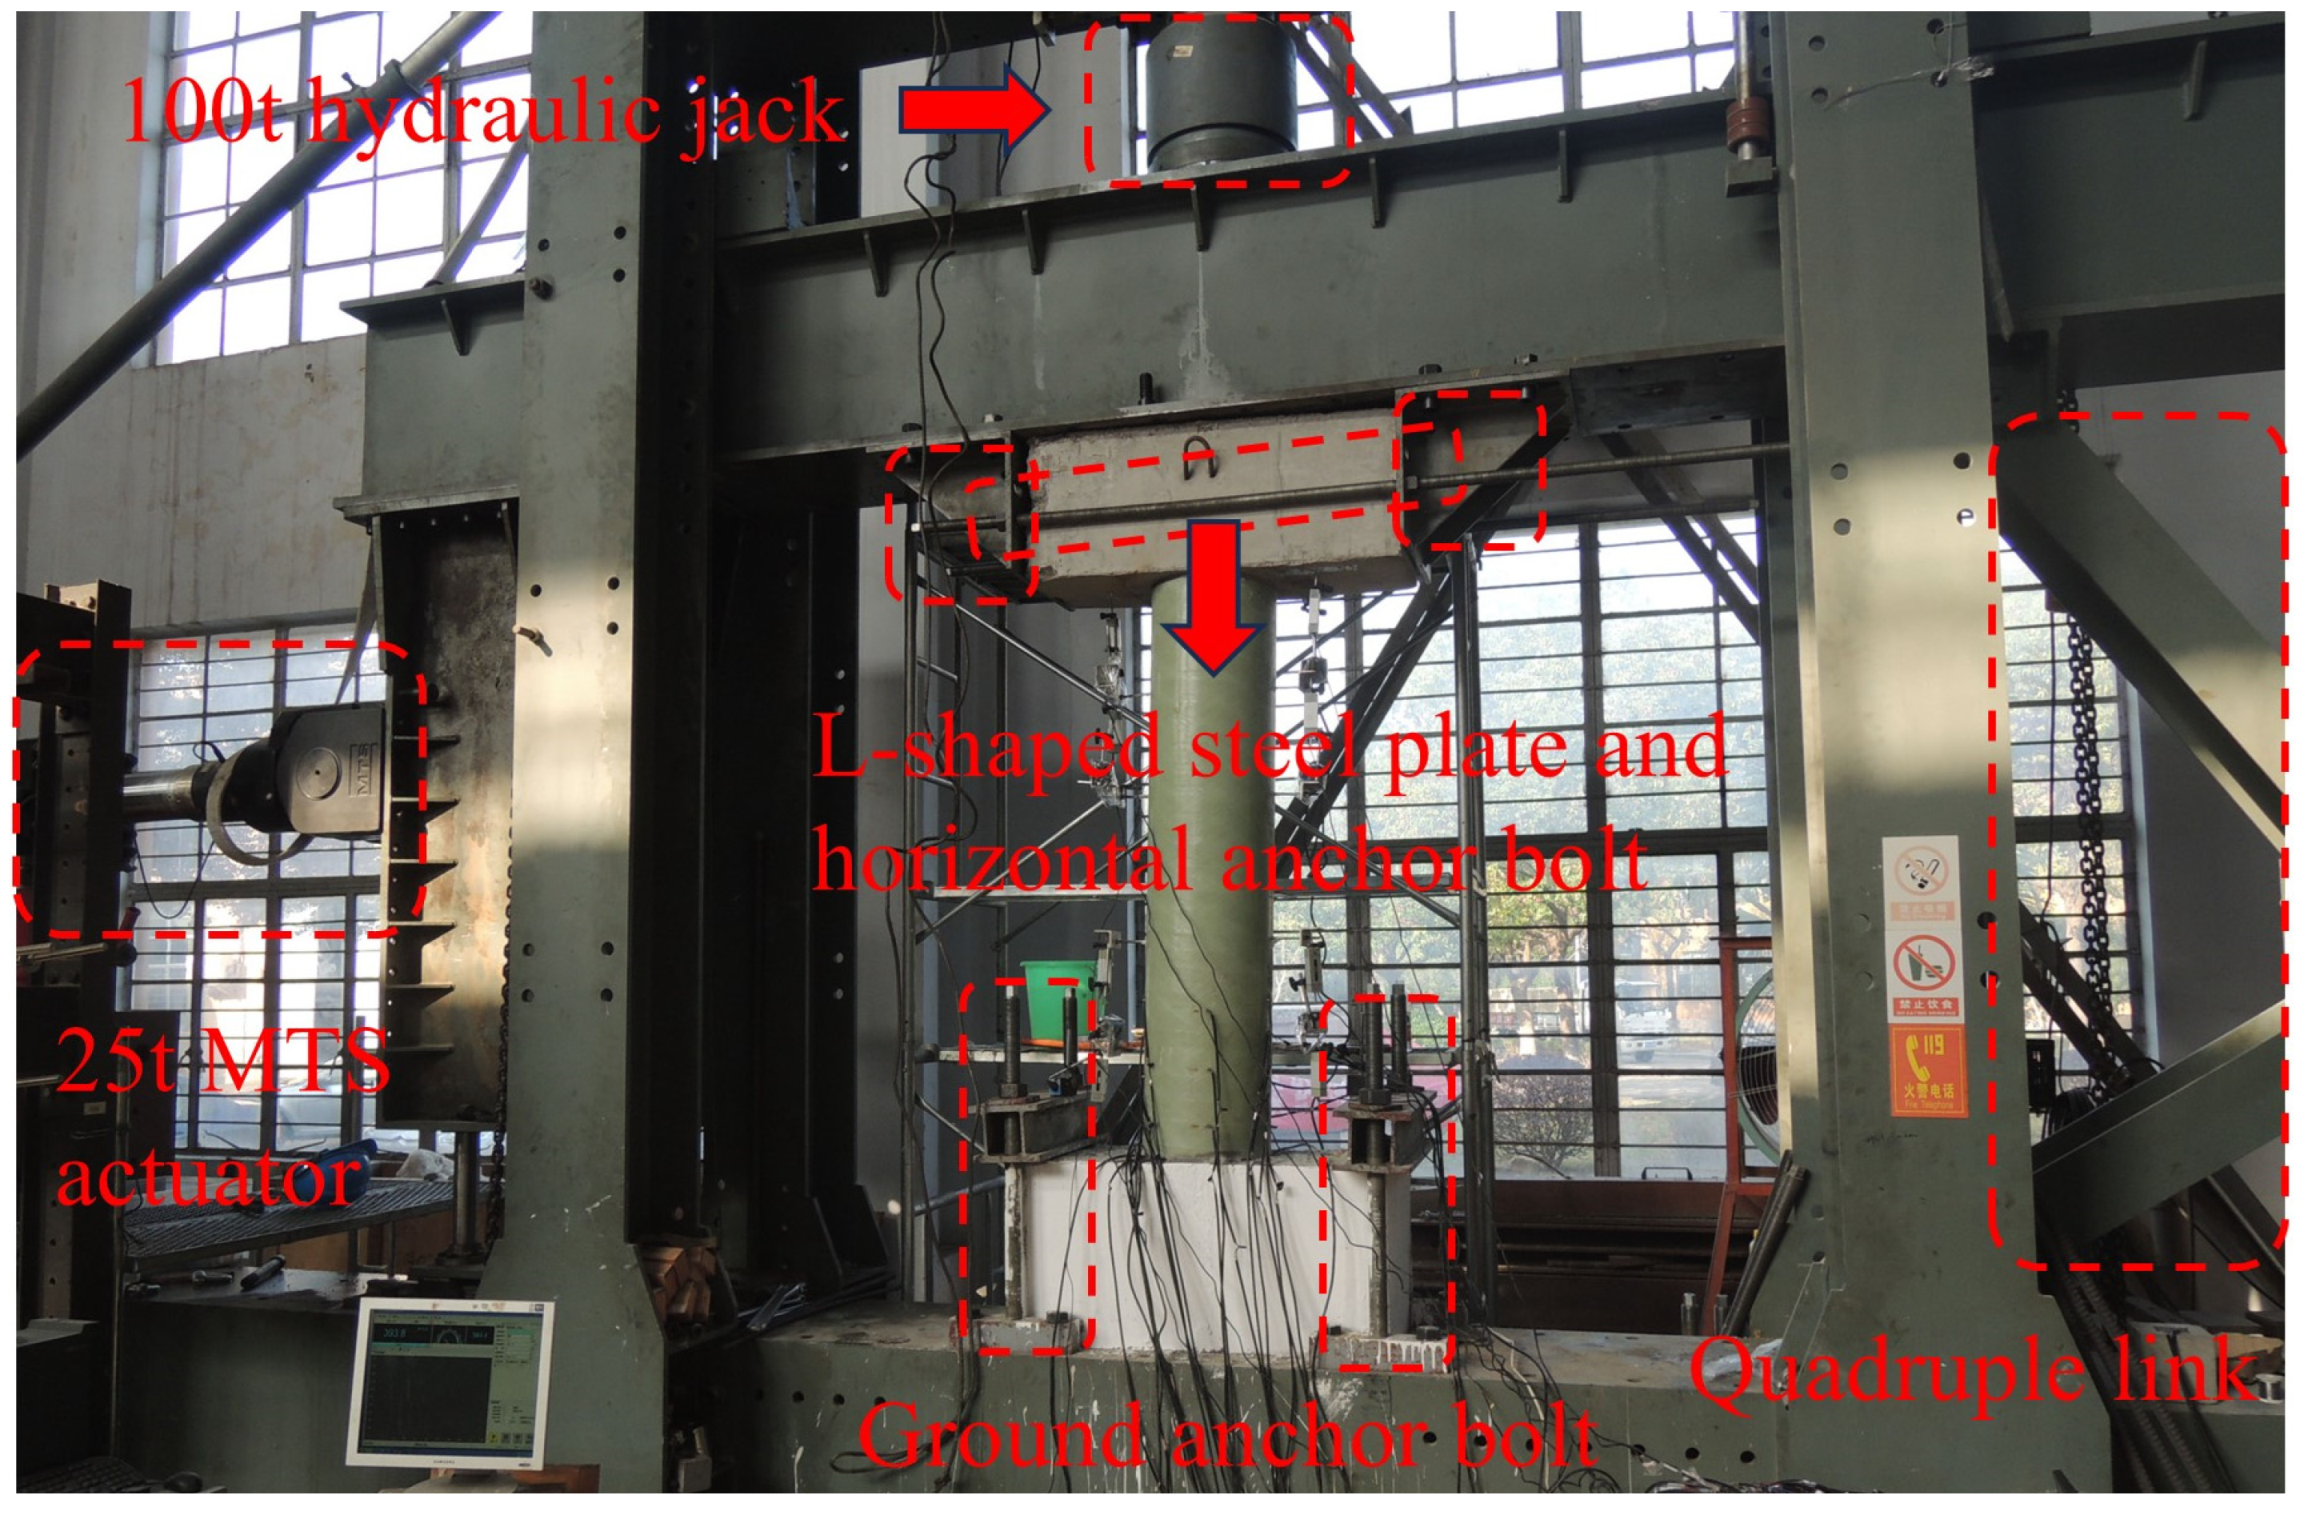
Figure 11. The skeleton curve was derived by constructing a tangent to the outermost points of each hysteresis loop. For double-curvature columns (i.e., columns fixed at both ends with lateral displacement applied horizontally), the inflection point of the pier column can be approximated at mid-height.
Figure 11d defines the key parameters:
denotes the lateral load,
is axial force,
represents the inclination angle between the axial force and vertical direction,
indicates eccentricity,
is column height,
and
are the bent cap and cap heights, respectively.
The hysteretic responses of all specimens exhibited predominantly fusiform to inverted S-shaped loops, characteristic of flexural failure mechanisms. During initial loading, hysteresis loops approached linear elasticity, whereas subsequent cycles demonstrated progressive fullness with minor pinching, accompanied by stiffness degradation and strength deterioration. The loading–unloading stiffness progressively declined, and the hysteretic energy dissipation (quantified by loop area) initially increased before diminishing. While PRC and PRCG2 displayed symmetric hysteresis in both loading directions, PRCG1 exhibited marked asymmetry due to the eccentric axial force () applied at the column top. This eccentricity induced differential stress states—compressive on one side and tensile on the opposite side—thereby offsetting adverse bidirectional force interactions. Consequently, averaging seismic performance indices across both directions remains methodologically valid for comparative analysis.
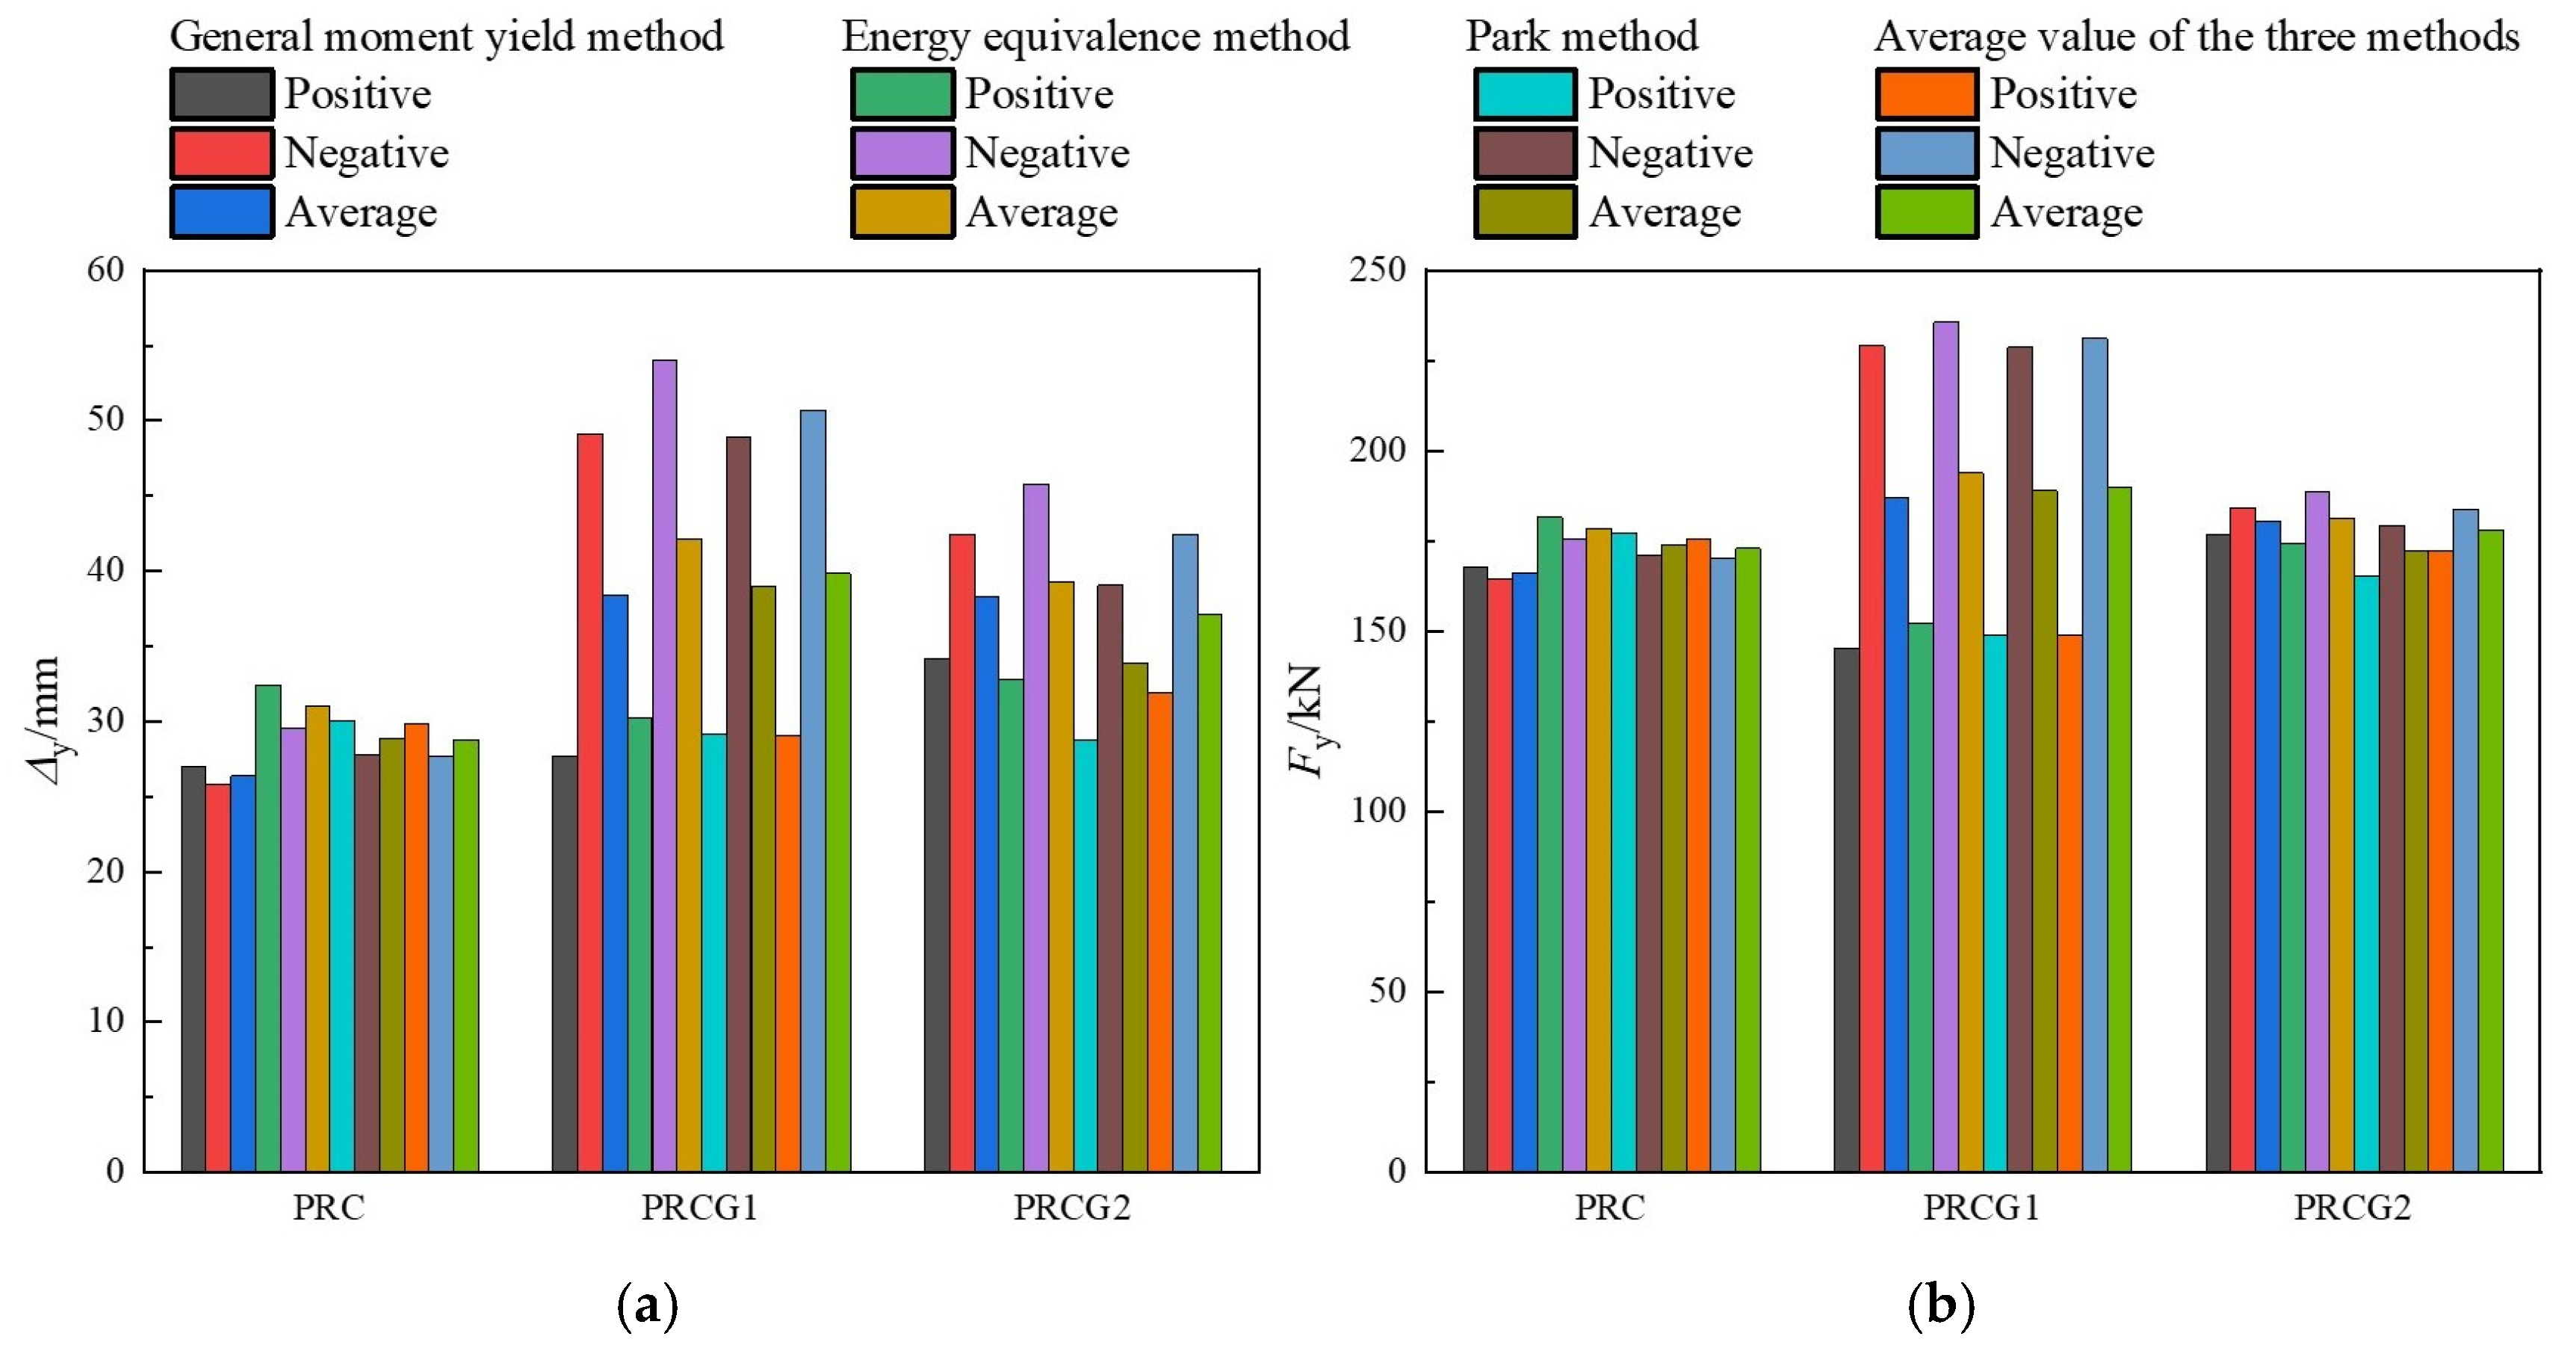
In this study, the equivalent yield force (
) and equivalent yield displacement (
) were derived from three methodologies: the generalized moment yield method, energy equivalence method, and Park method [
32]. With the Park method parameter set to 0.7, the results are illustrated in
Figure 12. The energy equivalence method yielded the maximum values for both
and
, while the generalized moment yield and Park methods produced comparable results. Averaged across both loading directions, the analysis demonstrates that PRCG1 and PRCG2 exhibited
increases of 9.86% and 2.98%, respectively, and
increases of 38.61% and 29.22%, respectively, relative to the PRC specimen.
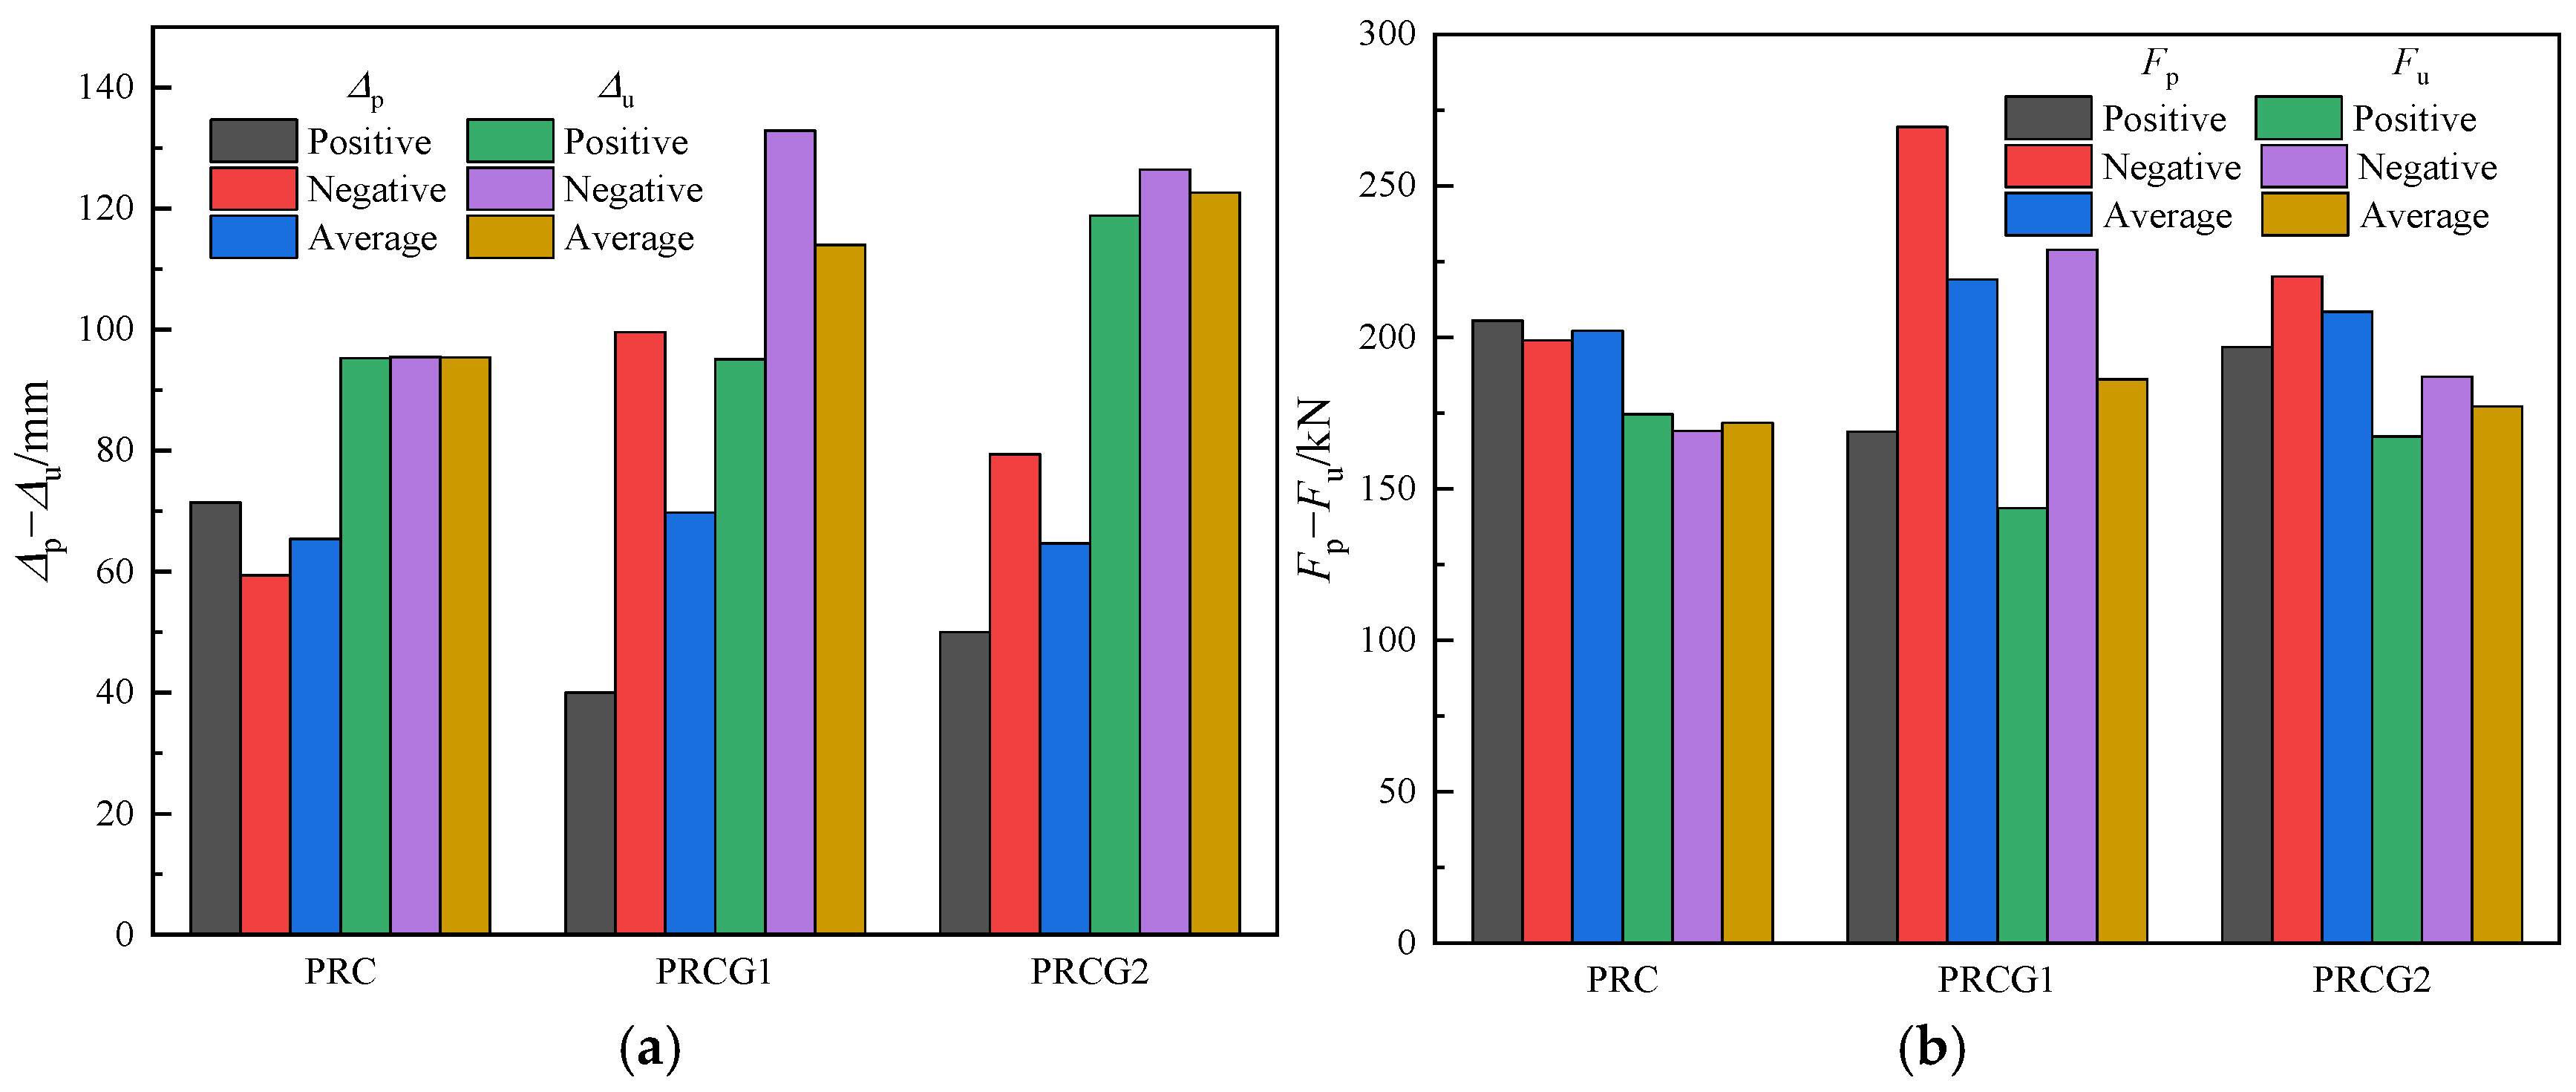
The peak force (
) and corresponding peak displacement (
) were determined experimentally. The ultimate bearing capacity (
) was defined as the load at which the force dropped to 85% of
(ultimate strength coefficient = 0.85), with the associated displacement denoted as
(
Figure 13). The analysis reveals minimal variation in
across specimens, whereas
and
increased in GFRP tube-confined piers. Post-peak displacement amplification activated the GFRP confinement mechanism, effectively suppressing concrete lateral expansion, preventing protective layer spalling, and delaying rebar buckling. Consequently, while the PRC specimen exhibited rapid post-peak strength degradation, PRCG1 and PRCG2 demonstrated gradual strength deterioration, resulting in substantially higher
. Bidirectional averaging shows that PRCG1 and PRCG2 achieved
increases of 8.36% and 3.07%, respectively, and
increases of 19.50% and 28.57%, relative to PRC.
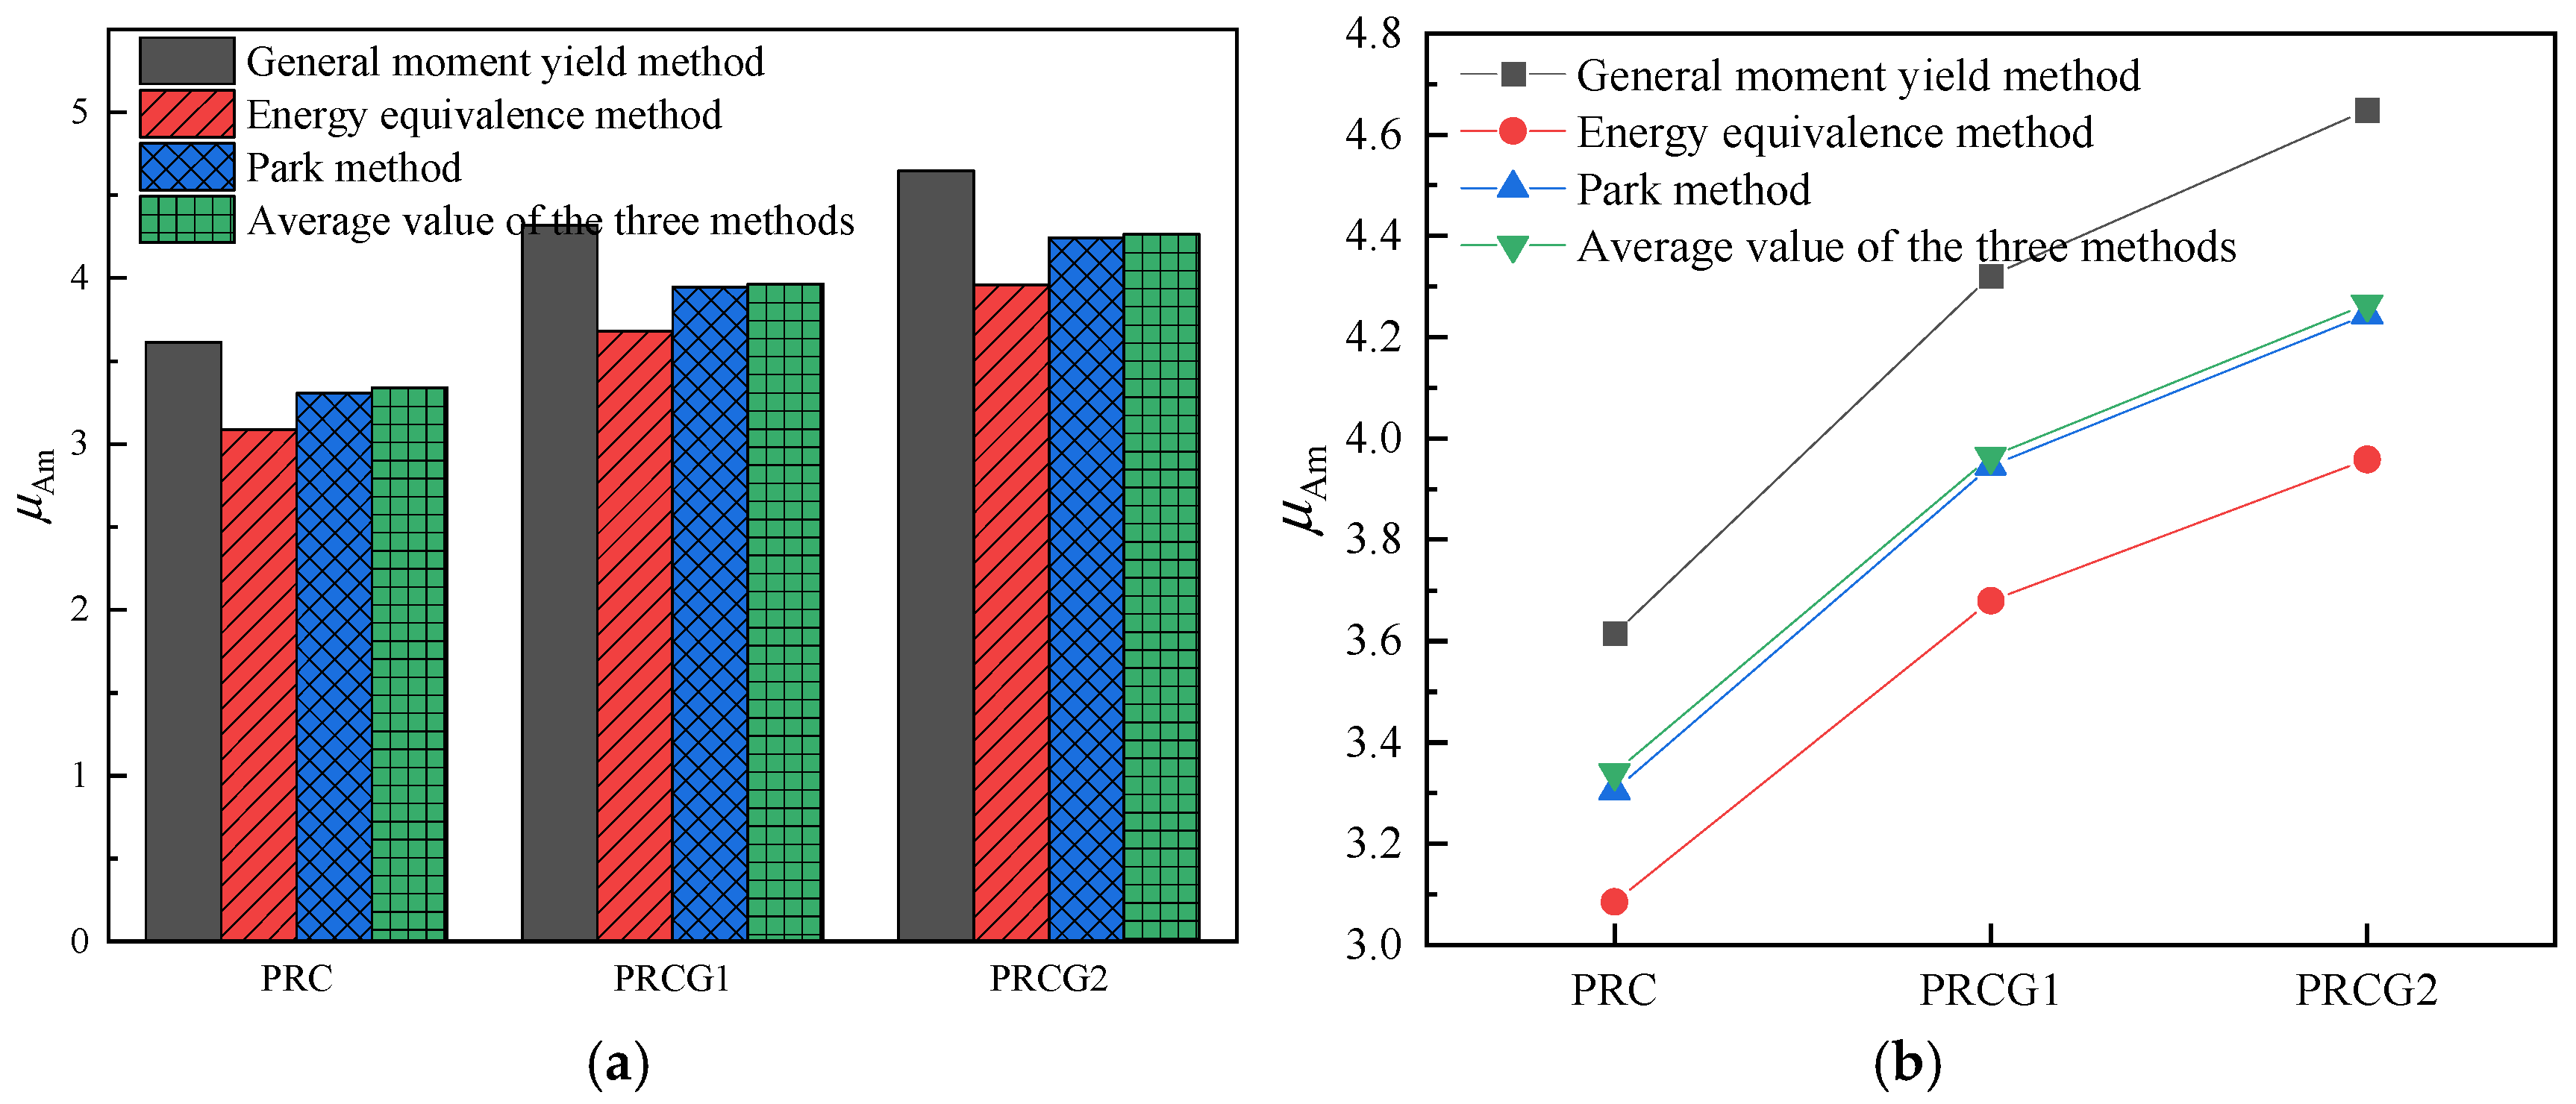
The ductility coefficient
of the unconfined prefabricated reinforced concrete pier is defined as follows:
where
and
denote the ultimate displacement and yield displacement of PRC, respectively.
For GFRP-confined prefabricated piers, the confinement effect significantly delays initial rebar yielding. Direct calculation of the conventional ductility coefficient
would underestimate the actual enhancement by 20–40% due to the artificially increased denominator (
>
,
is the yield displacement of PRCG1/PRCG2). Consequently, a modified ductility coefficient (
) is proposed to isolate the pure confinement-induced ductility gain:
where
is the ultimate displacement of the GFRP tube-confined pier (PRCG1/PRCG2).
A comparative analysis of ductility coefficients (
Figure 14) reveals that the generalized moment yield method yielded the highest
value, while the energy equivalence method produced the lowest; the Park method generated intermediate results, closely aligning with the tri-method average. Loading direction averaging demonstrates that PRCG1 and PRCG2 achieved
increases of 18.56% and 27.84%, respectively, relative to PRC.
4.3. Strain Analysis of GFRP Tubes
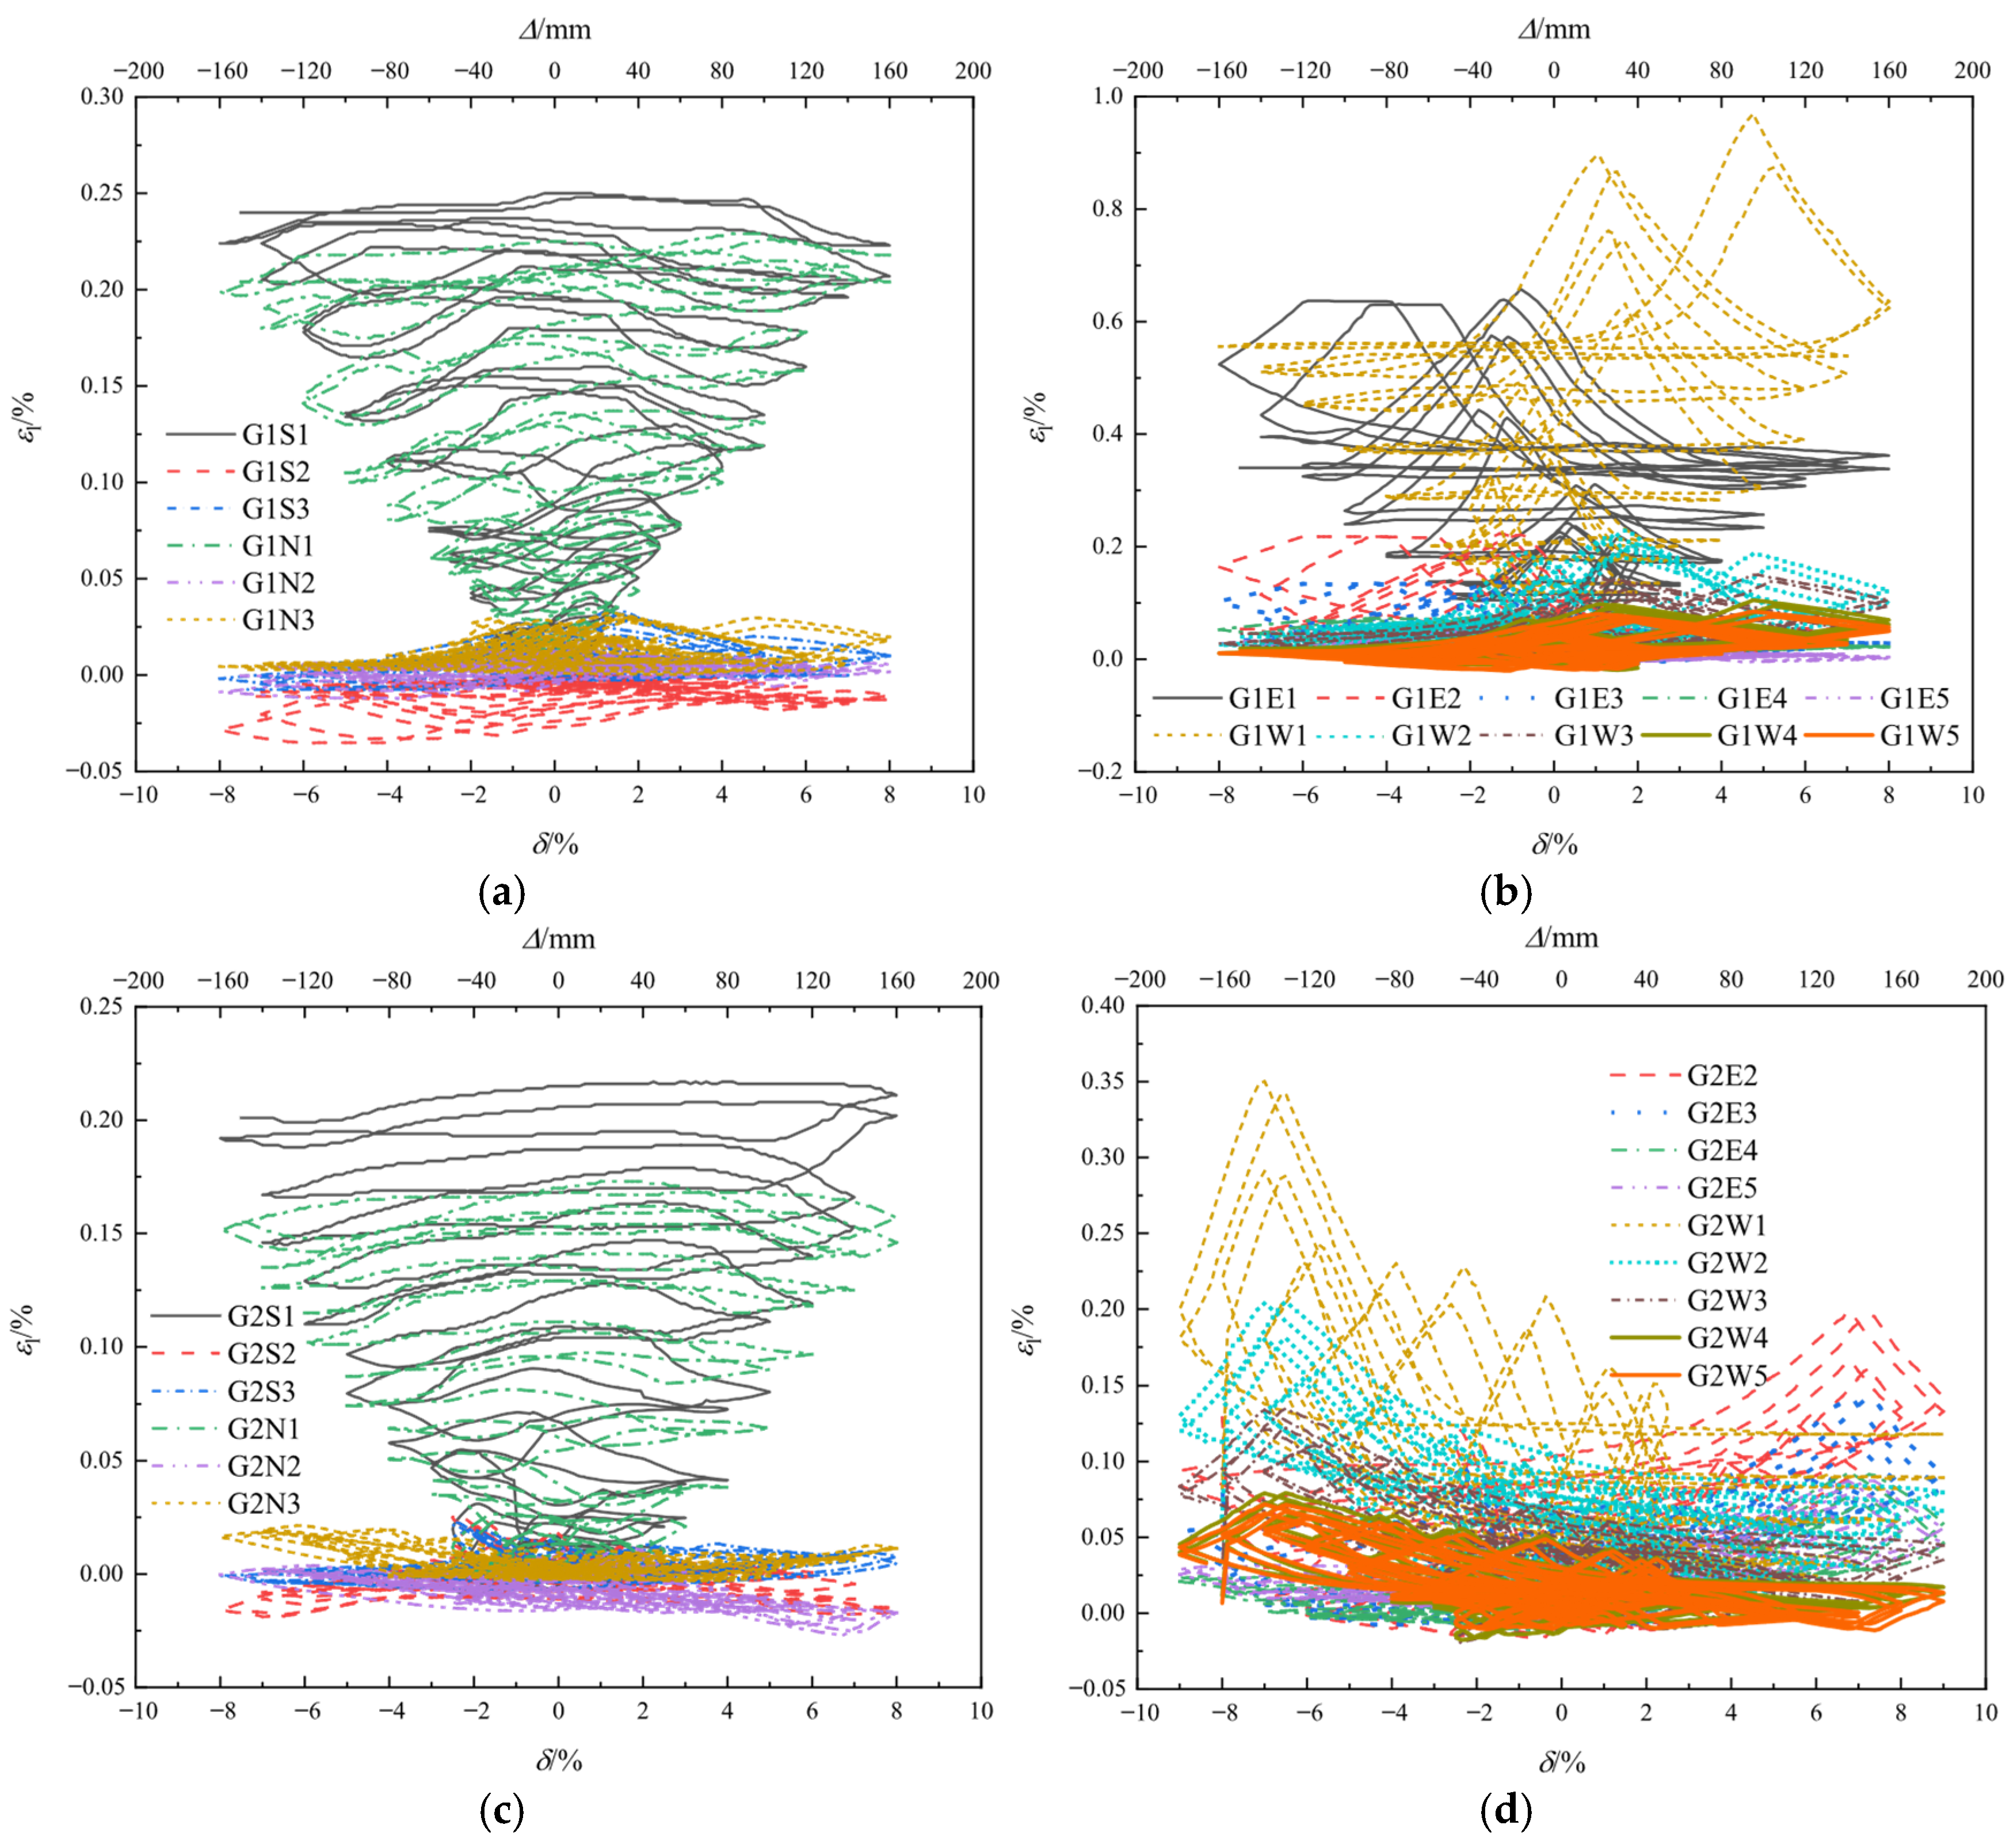
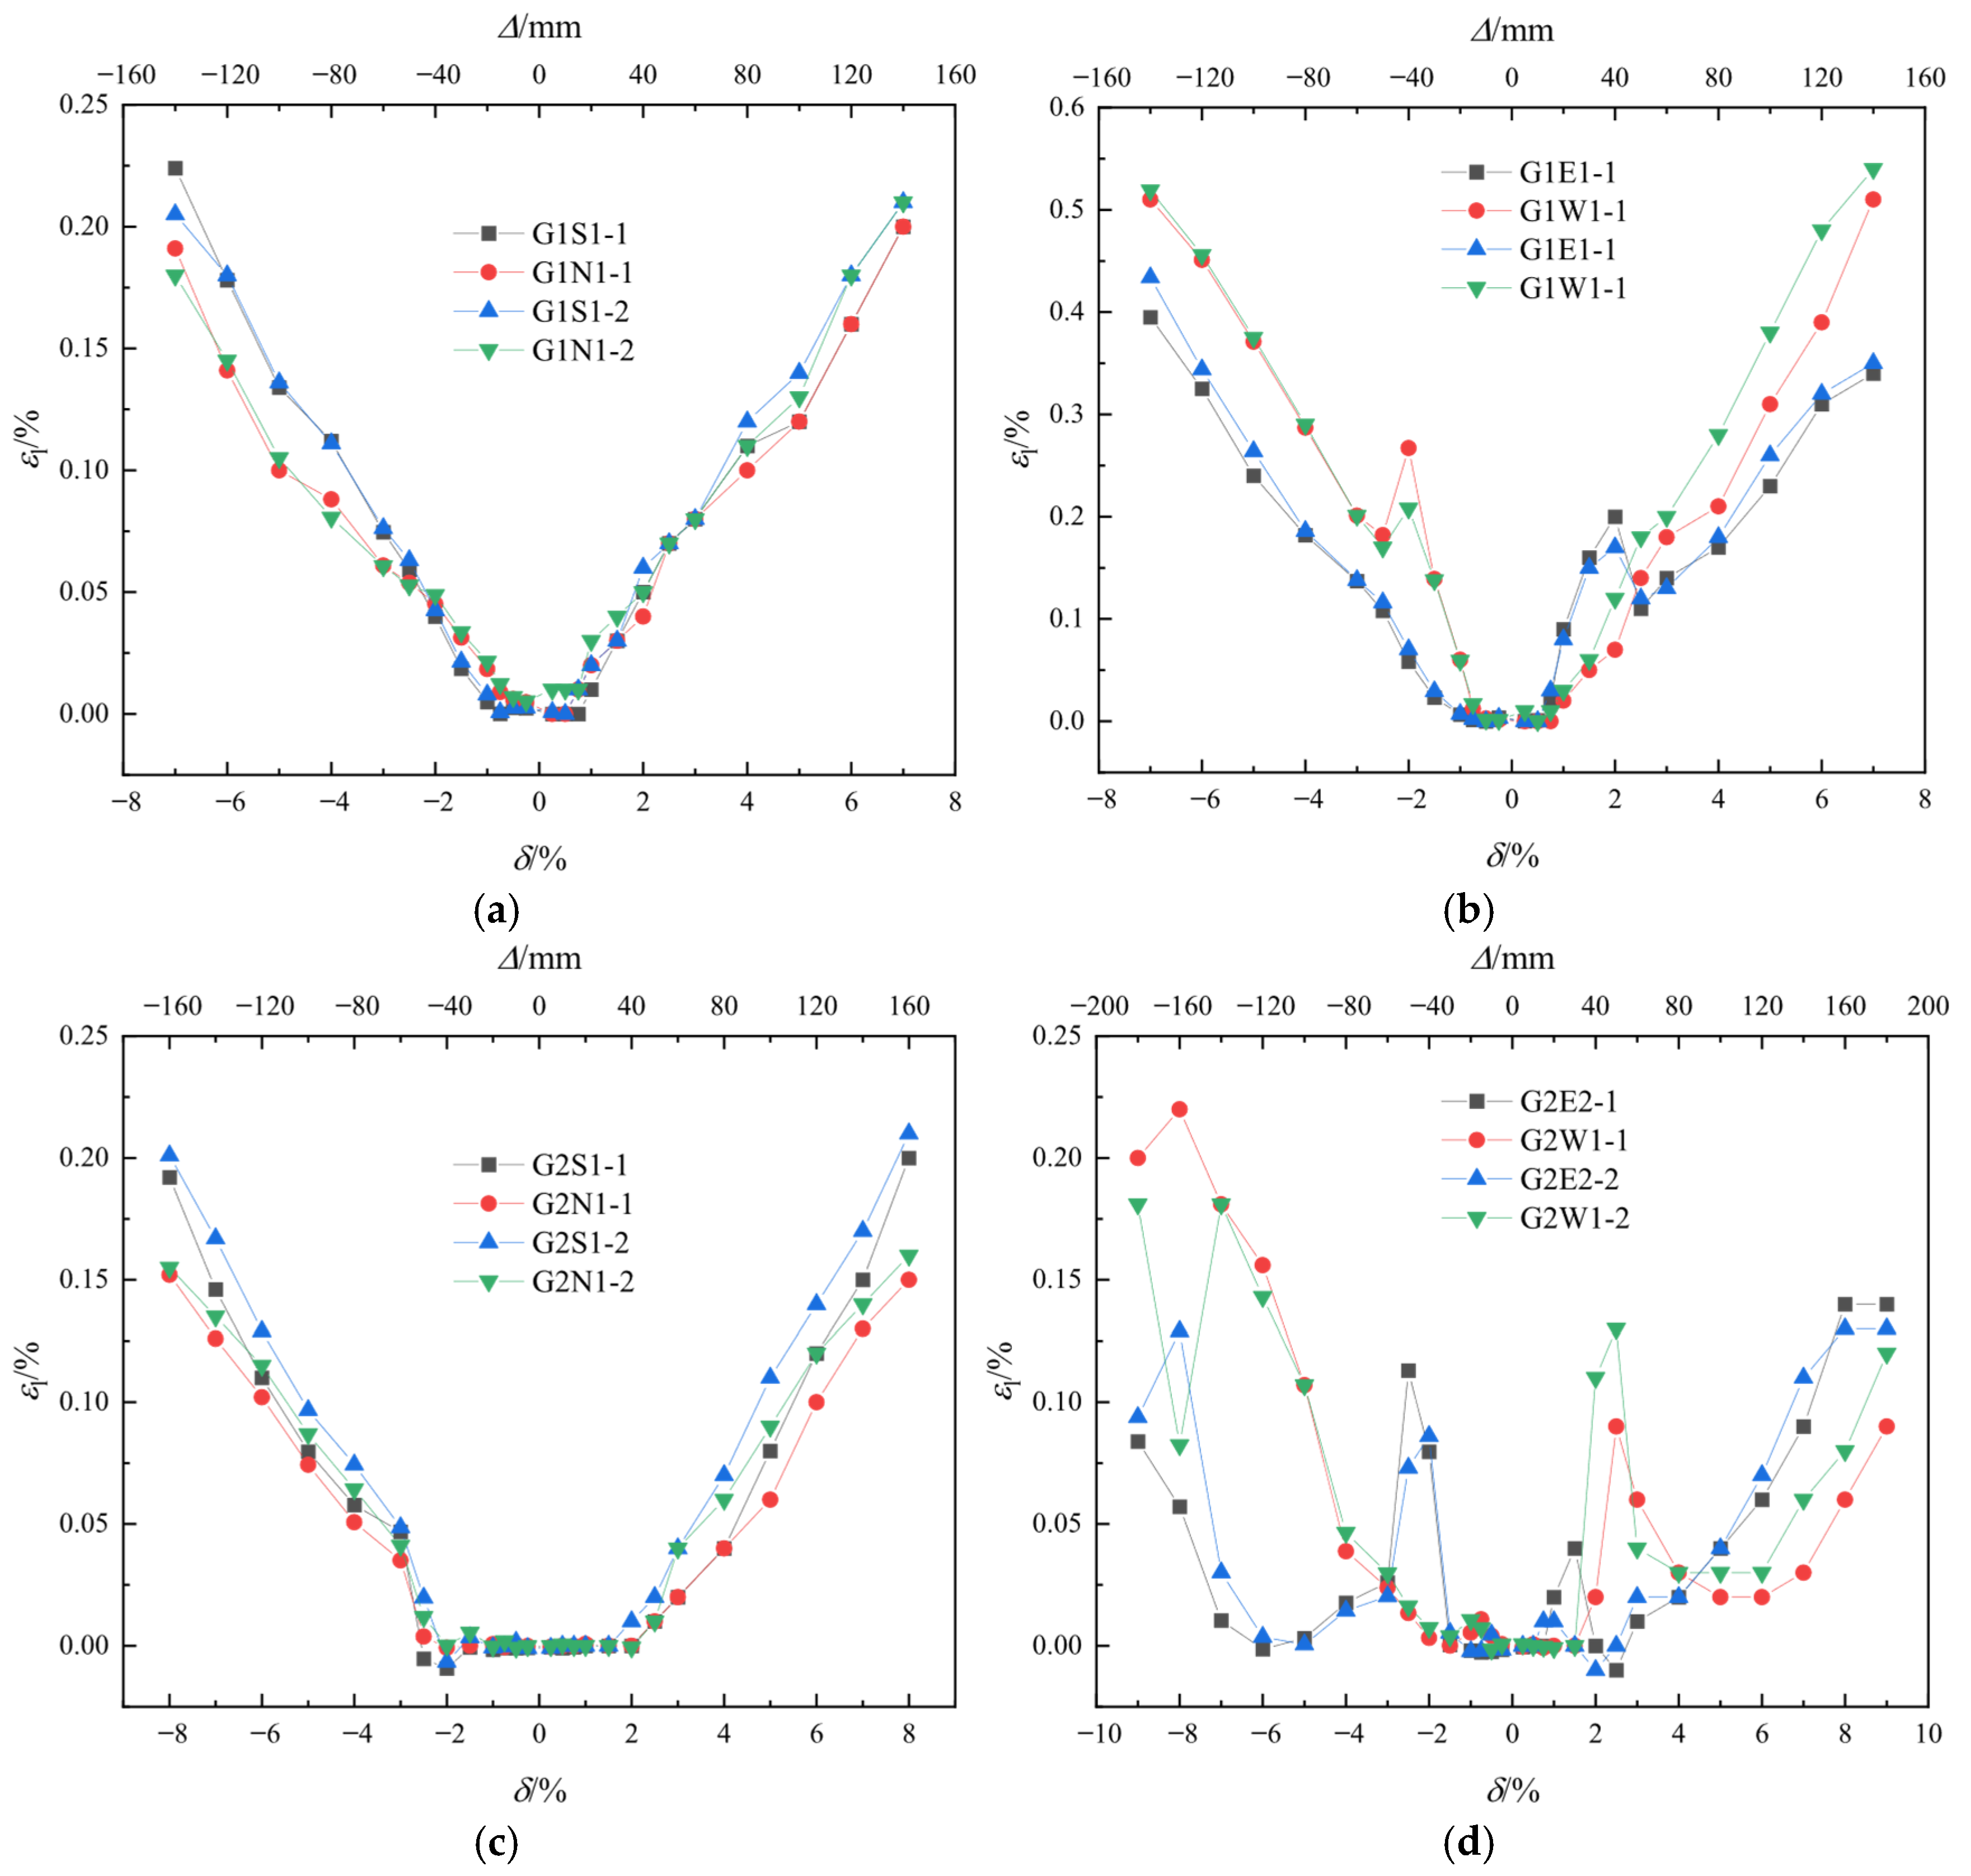
The circumferential strain evolution of GFRP tubes in specimens PRCG1 and PRCG2 is presented in
Figure 15, with tensile strain values designated as positive and compressive strains as negative. The strain data in
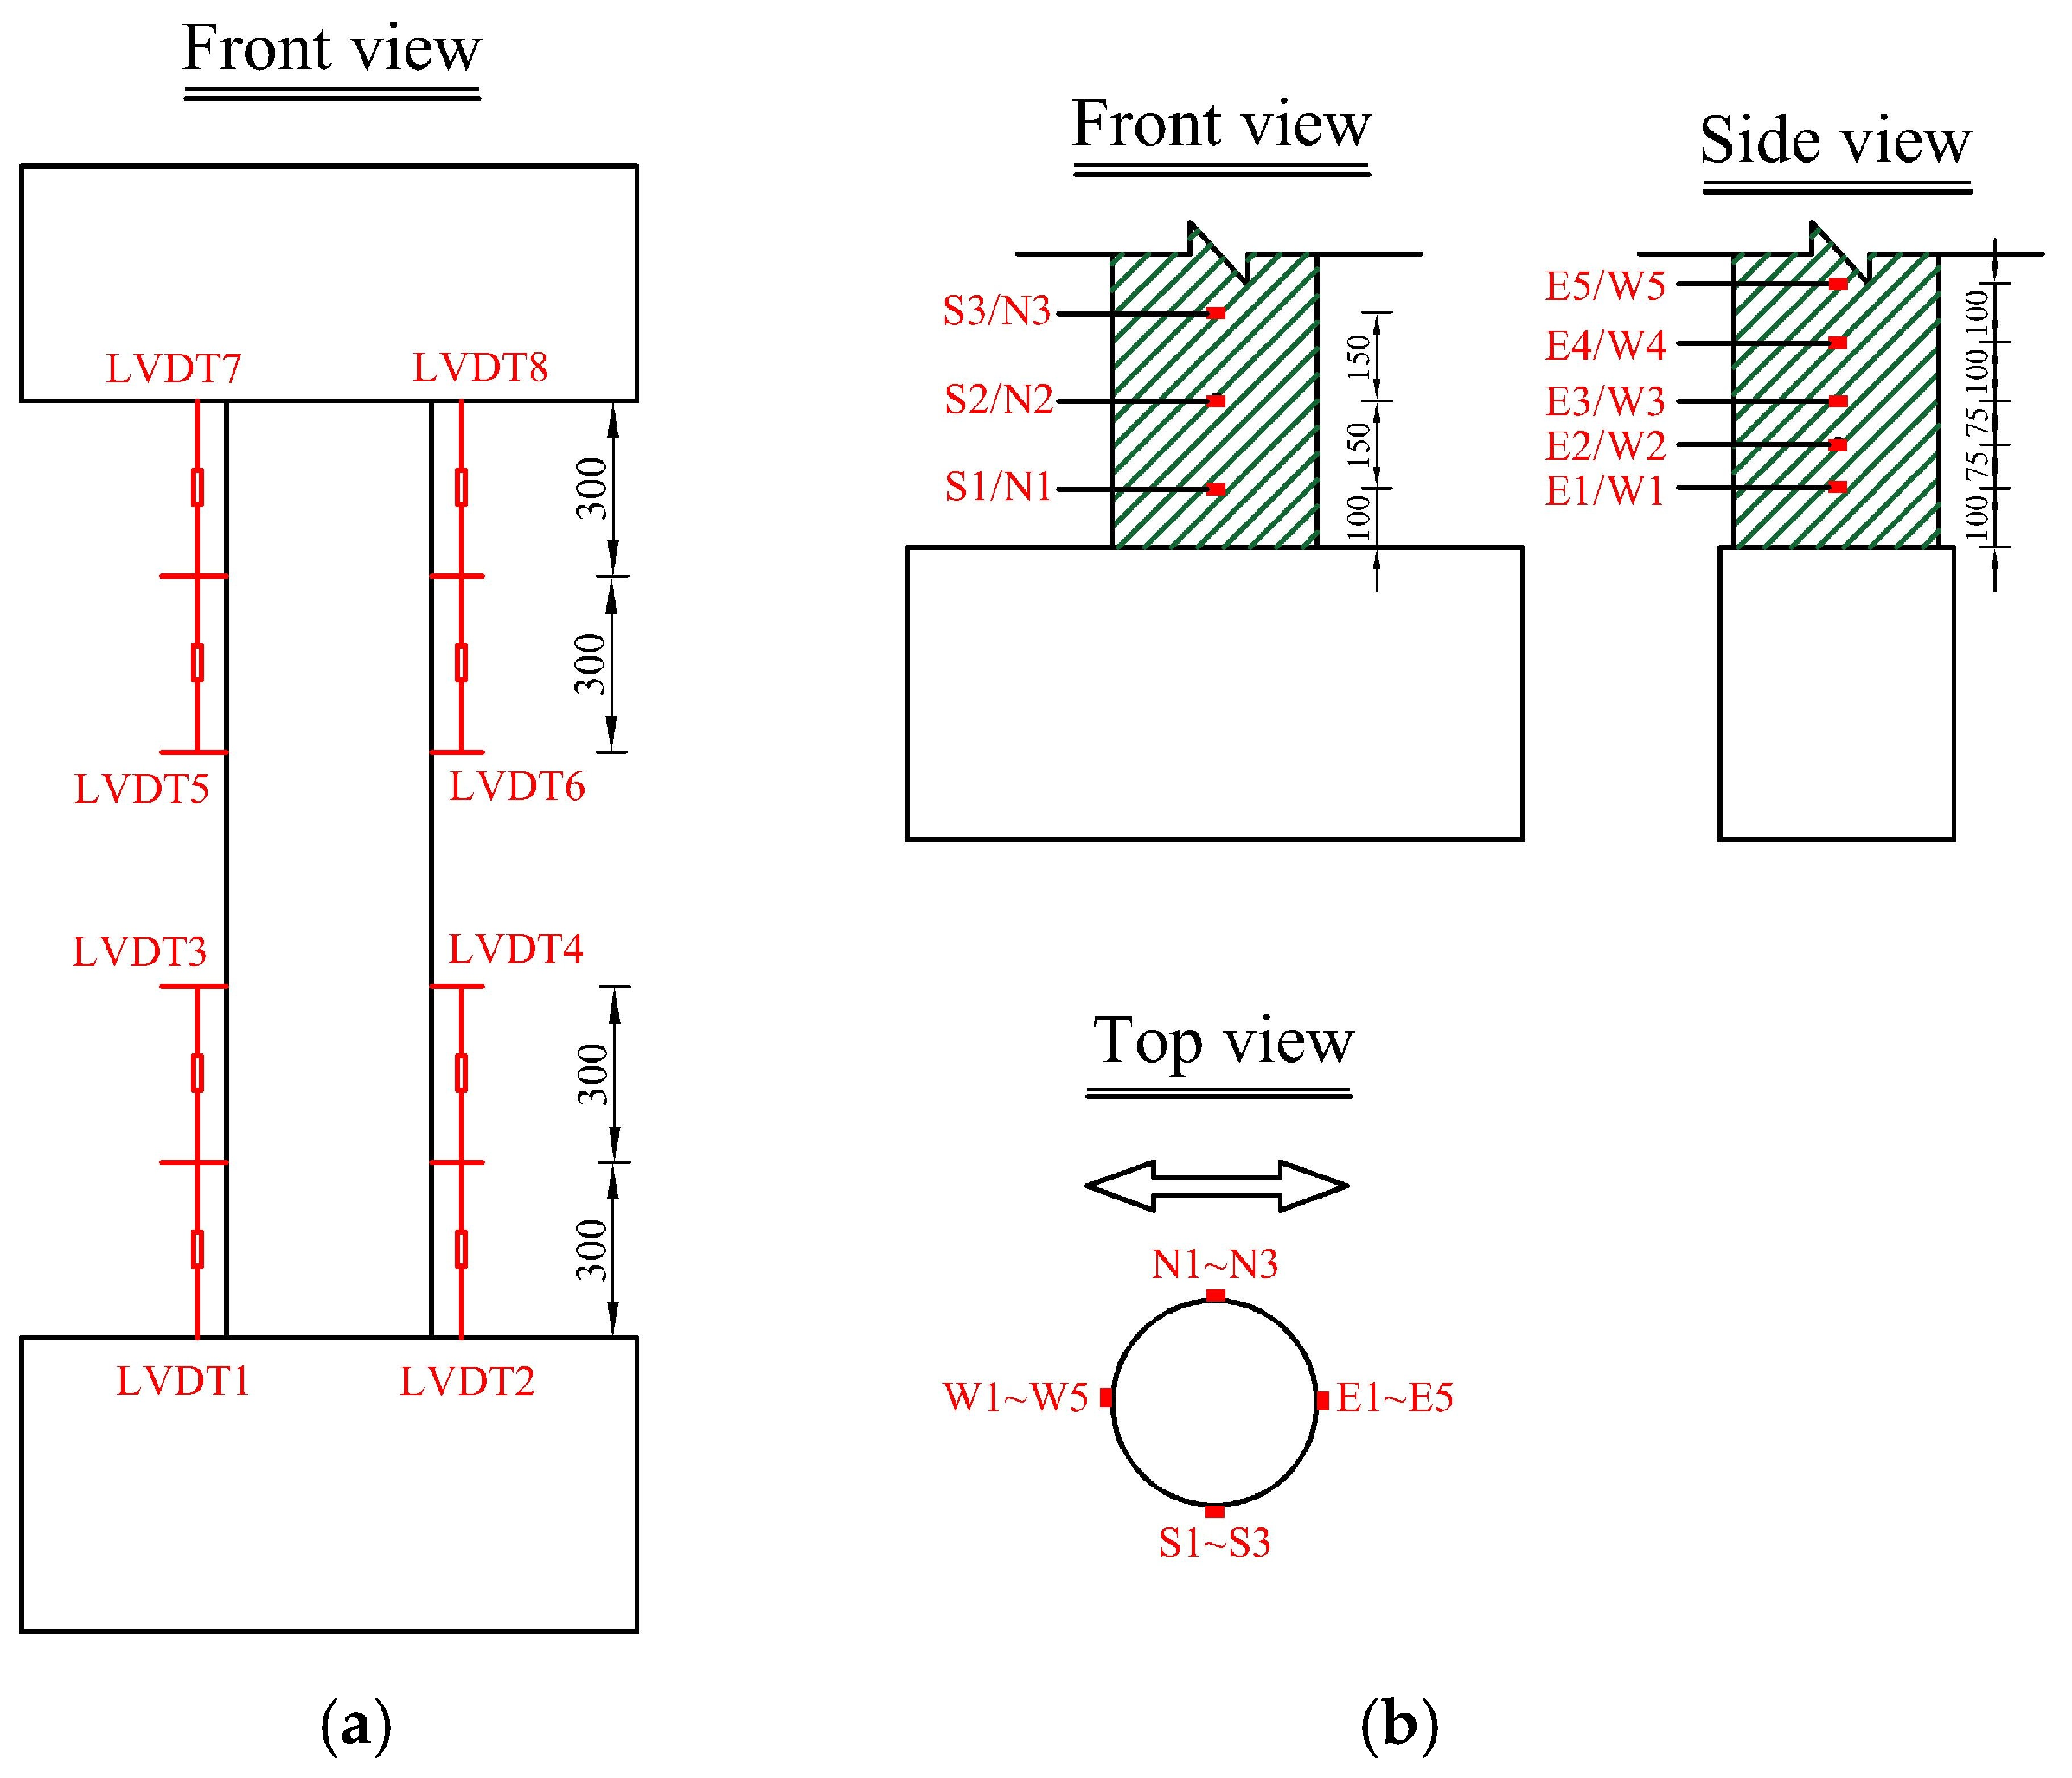
Figure 16 correspond to the maximum displacement during each stage of cyclic loading, measured at 100 mm above the pile cap. The notation “−1” and “−2” denotes the first and second cycles of the displacement stage, respectively. Due to the pre-loading damage of strain gauge G2E1, its data in
Figure 16d are substituted by G2E2.
Debonding inspection was performed by striking the GFRP tube surface with a rubber hammer at the start of every loading cycle. The consistent occurrence of dull acoustic signatures—contrasting with the hollow tones characteristic of delaminated zones—confirmed interfacial integrity throughout testing. The results indicate that the hoop strain perpendicular to the loading direction in GFRP tubes peaks at each cycle’s maximum displacement, exhibiting an approximately linear strain–displacement relationship at low magnitudes. PRCG1 and PRCG2 demonstrate comparable strain distributions, with localized elevation at the 100 mm height above the pier base—reaching maxima of 0.25% and 0.22%, respectively. Notably, the maximum hoop strain in the loading direction occurred prior to peak displacement. Critical strain measurements revealed values of 0.96% at 100 mm and 0.23% at 175 mm for PRCG1, compared to 0.35% and 0.20% for PRCG2 at corresponding heights. This strain localization indicates concrete damage concentration within the basal 100 mm zone, with rapid attenuation above 175 mm height, where concrete damage becomes negligible. While the ultimate circumferential strain of
GFRP tubes reaches 1.75% in material tests (
Table 1), the effective circumferential strains observed in confined concrete specimens range from 1.4% to 1.7% (
Table 4). This discrepancy arises because strain gauges capture localized deformations, and the combined effects of limited sample sizes and stress concentration phenomena introduce measurement variability. Consequently, maintaining a deformation reserve is critical to mitigate the risk of brittle fracture.
4.4. Analysis of Bridge Pier Curvature
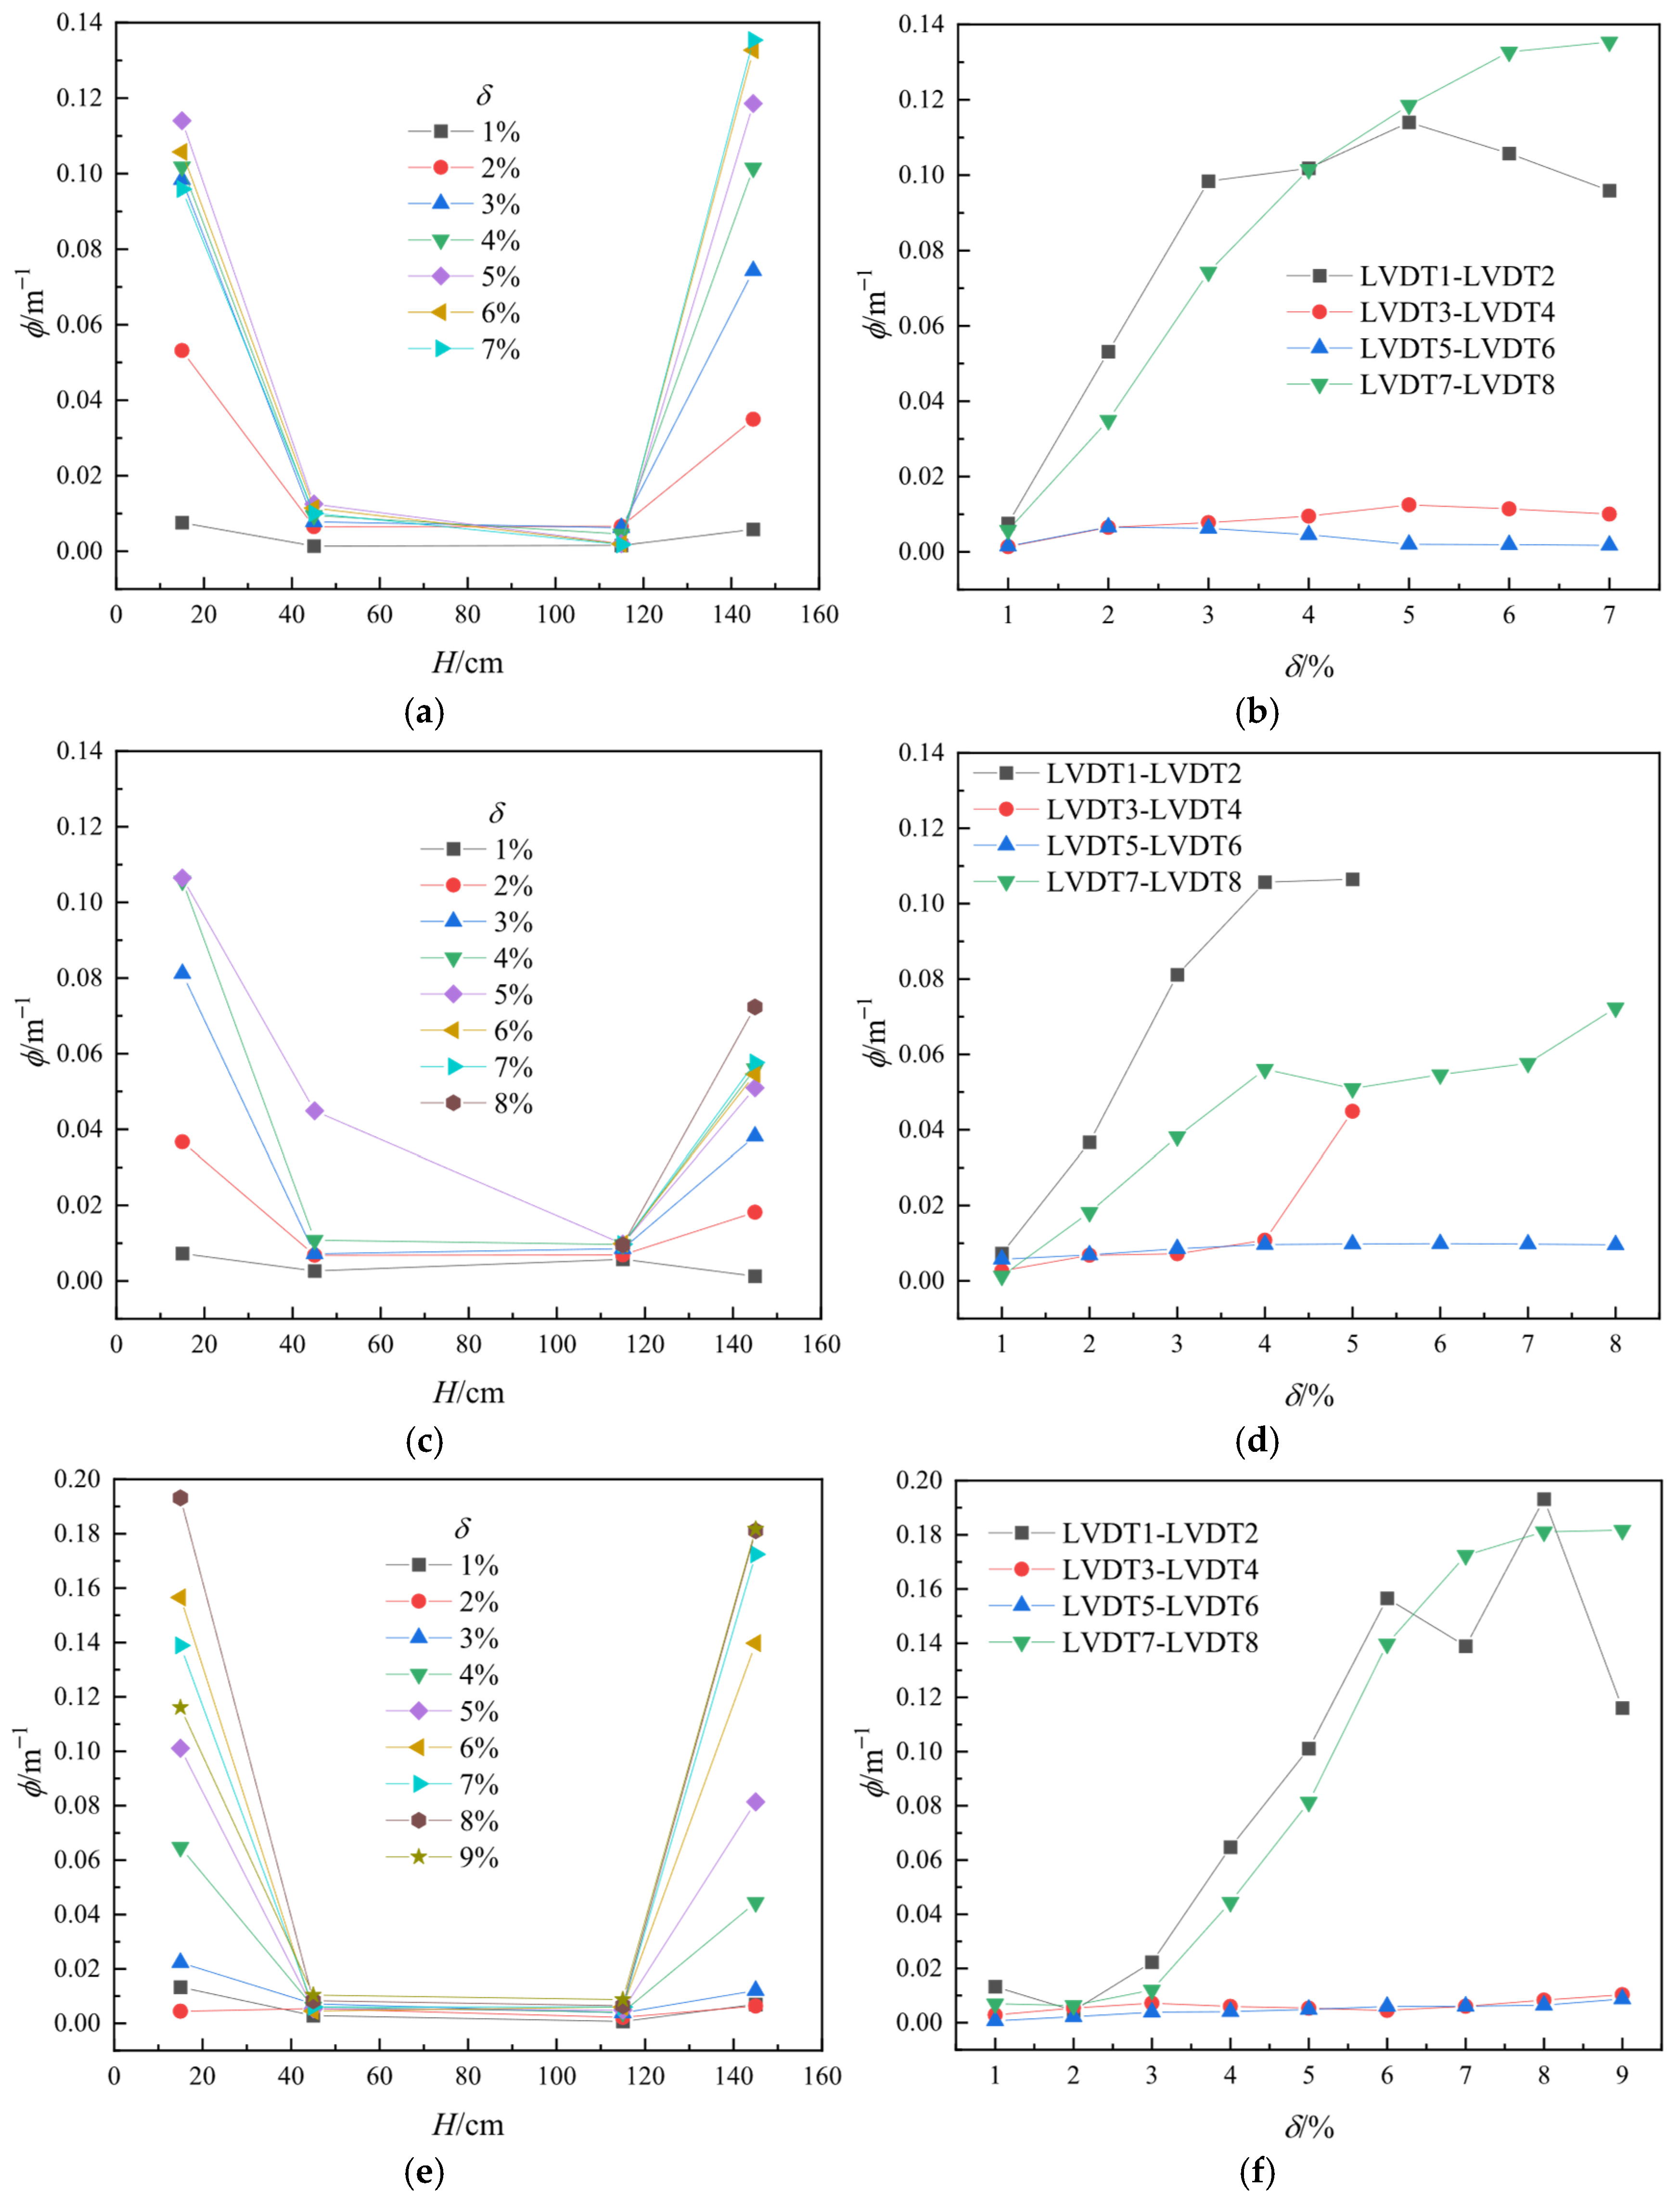
The curvature
of each layer of the specimen can be calculated based on the relative displacement difference
between layers measured by the displacement meters on both sides of the specimen loading direction:
where
denotes the horizontal spacing between gauges and
represents the vertical measurement height of the gauges.
Figure 17 illustrates the distribution of
along the column height at varying displacement levels, along with the
correlation (Note: data for LVDT1–LVDT2 and LVDT3–LVDT4 of PRCG1 are unavailable when
). The curvature exhibits approximate symmetry about the mid-span section, with peak values localized within the plastic hinge zones at the pier base and top, attenuating toward the mid-span region. At initial loading stages, the curvature differences among specimens were negligible. However, at
and 3%, the base curvature of the PRC pier reached 1.92 and 1.95 times that of PRCG1, and 5.50 and 6.17 times that of PRCG2, respectively. Subsequently, the curvature disparity between PRCG2 and PRC diminished. At
and 5%, the PRC base curvature was 1.81 and 2.33 times that of PRCG1, and 2.28 and 1.46 times that of PRCG2. Progressive displacement amplification induced a transition from near-linear to nonlinear
–
correlation. Crucially, at higher displacements, the base curvature of PRCG2 exceeded that of PRC due to severe damage-induced deformation degradation in PRC, whereas PRCG2 retained a partial deformation capacity. Collectively, GFRP-tube-confined piers (PRCG1/PRCG2) demonstrated significantly lower curvature than PRC at most
levels, confirming superior flexural performance.
4.5. Strength Variation and Stiffness Degradation
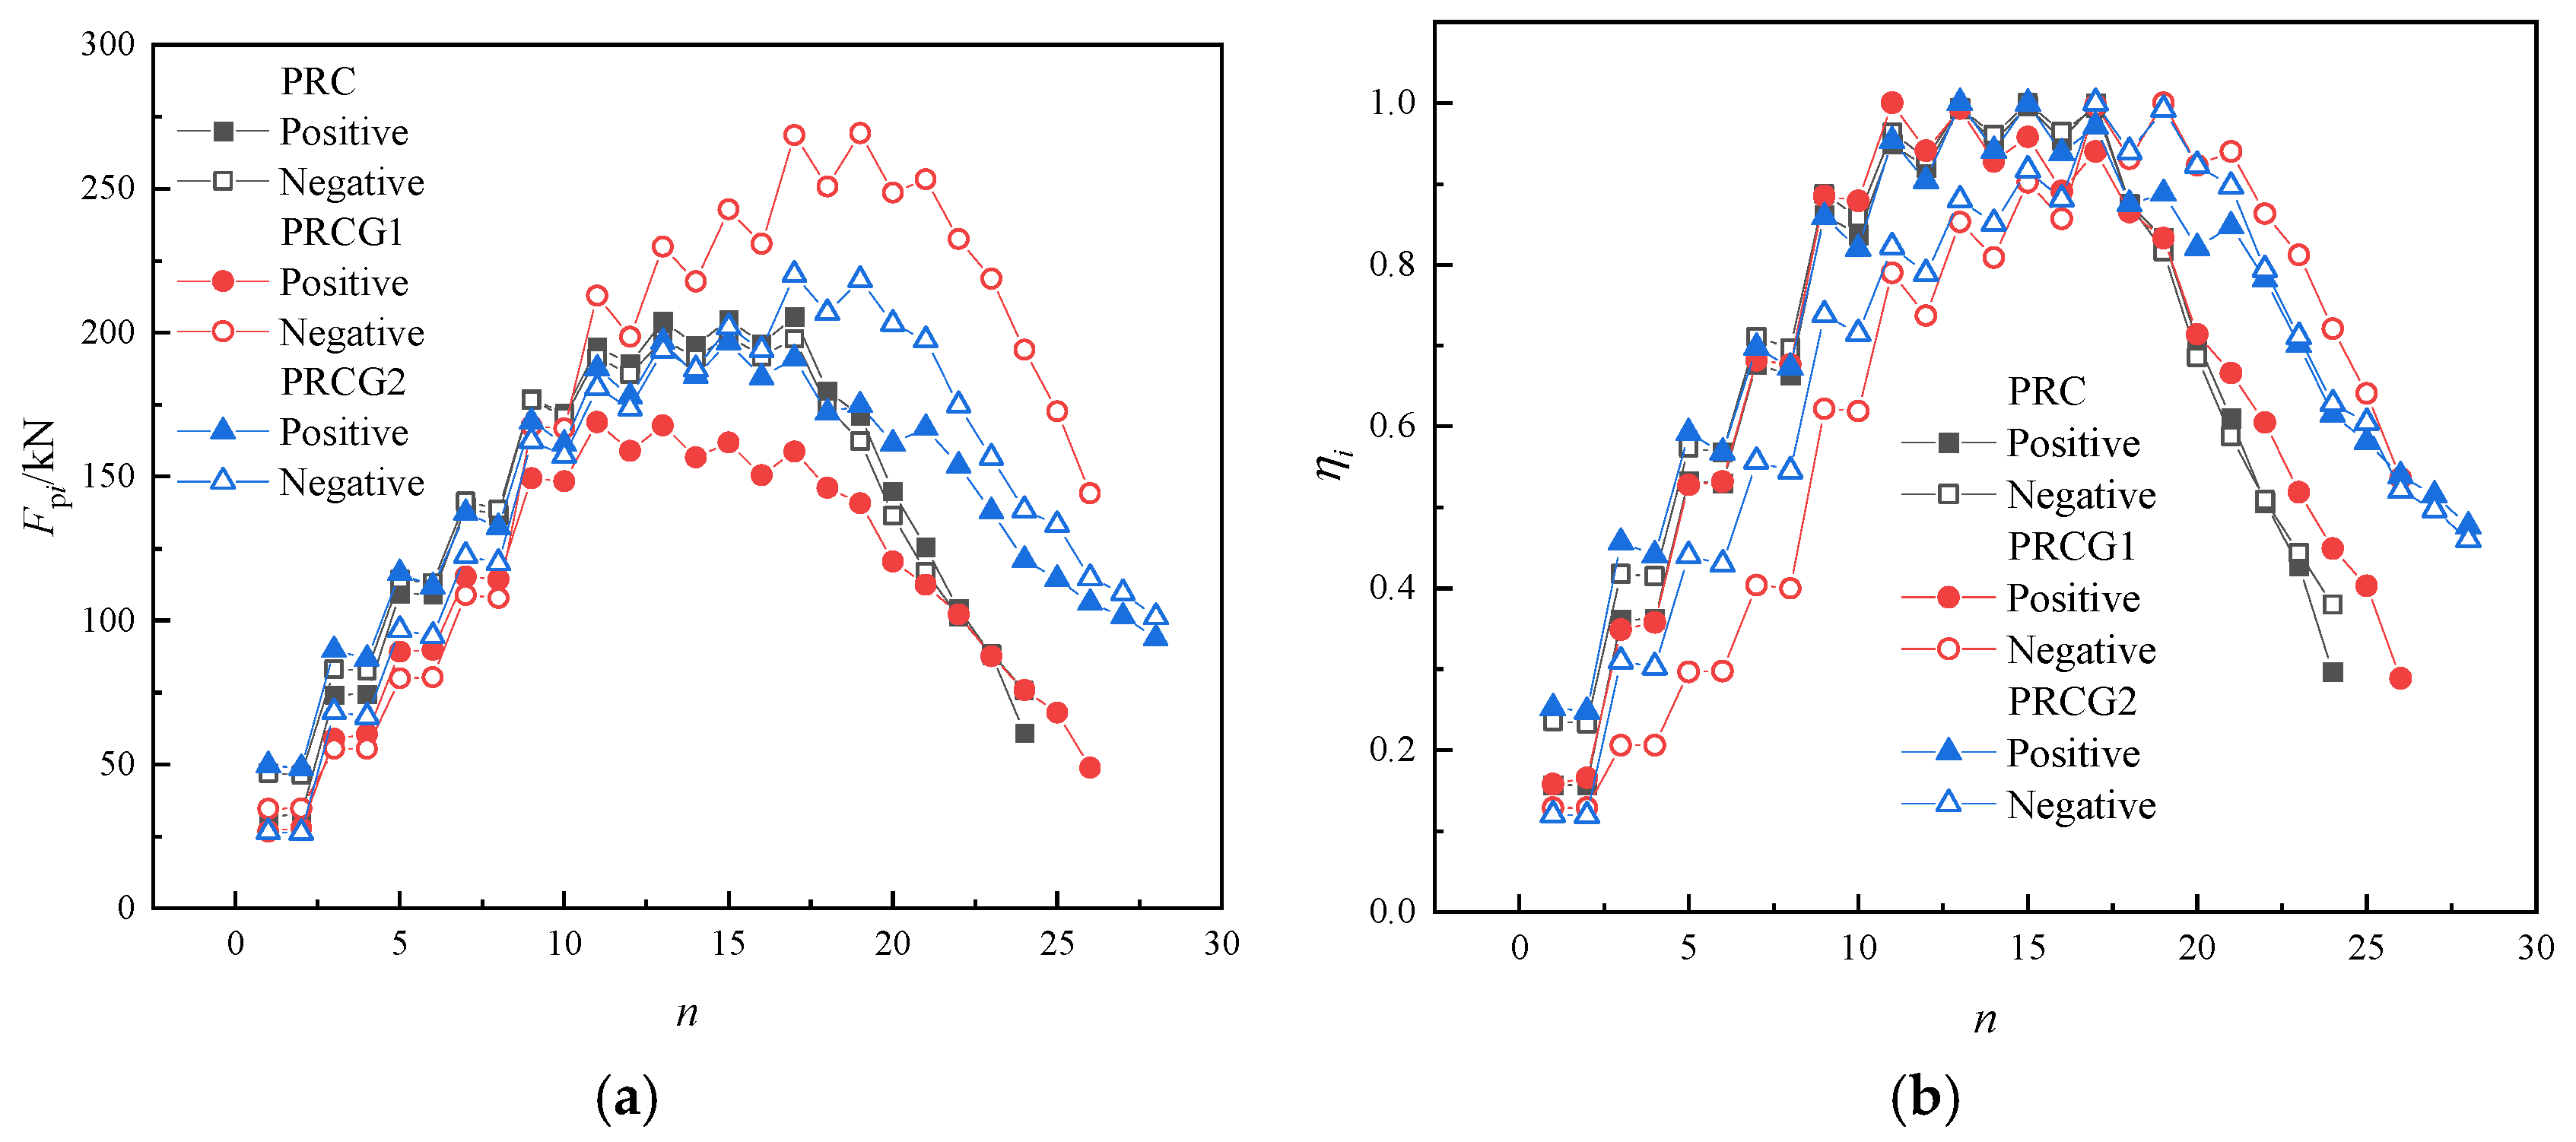
To compare the bearing capacity of distinct specimens at identical displacement levels, the hysteretic curves were decomposed to extract the first and second hysteresis loops per loading cycle. The peak bearing capacity (
) of each loop was quantified, and the corresponding bearing capacity coefficient (
) was derived, as depicted in
Figure 18. Here,
denotes the hysteresis loop index, and
is calculated using the following:
GFRP tube-confined specimens exhibit superior lateral resistance and enhanced safety reserves under large displacements. After averaging the positive/negative loading directions and first/second cycles, the bearing capacity of PRCG1 and PRCG2 increased by 26.74% and 23.25% (vs. PRC) at hysteresis loops 19–20 (), 56.46% and 54.84% at loops 21–22 (), and 84.05% and 76.91% at loops 23–24 (), respectively. Concurrently, the for PRC were 0.76, 0.56, and 0.39 at , , and , significantly lower than PRCG1 (0.87, 0.77, 0.63) and PRCG2 (0.91, 0.83, 0.67). This demonstrates that GFRP confinement effectively mitigates strength degradation in bridge piers under seismic action and ensures residual load-carrying capacity.
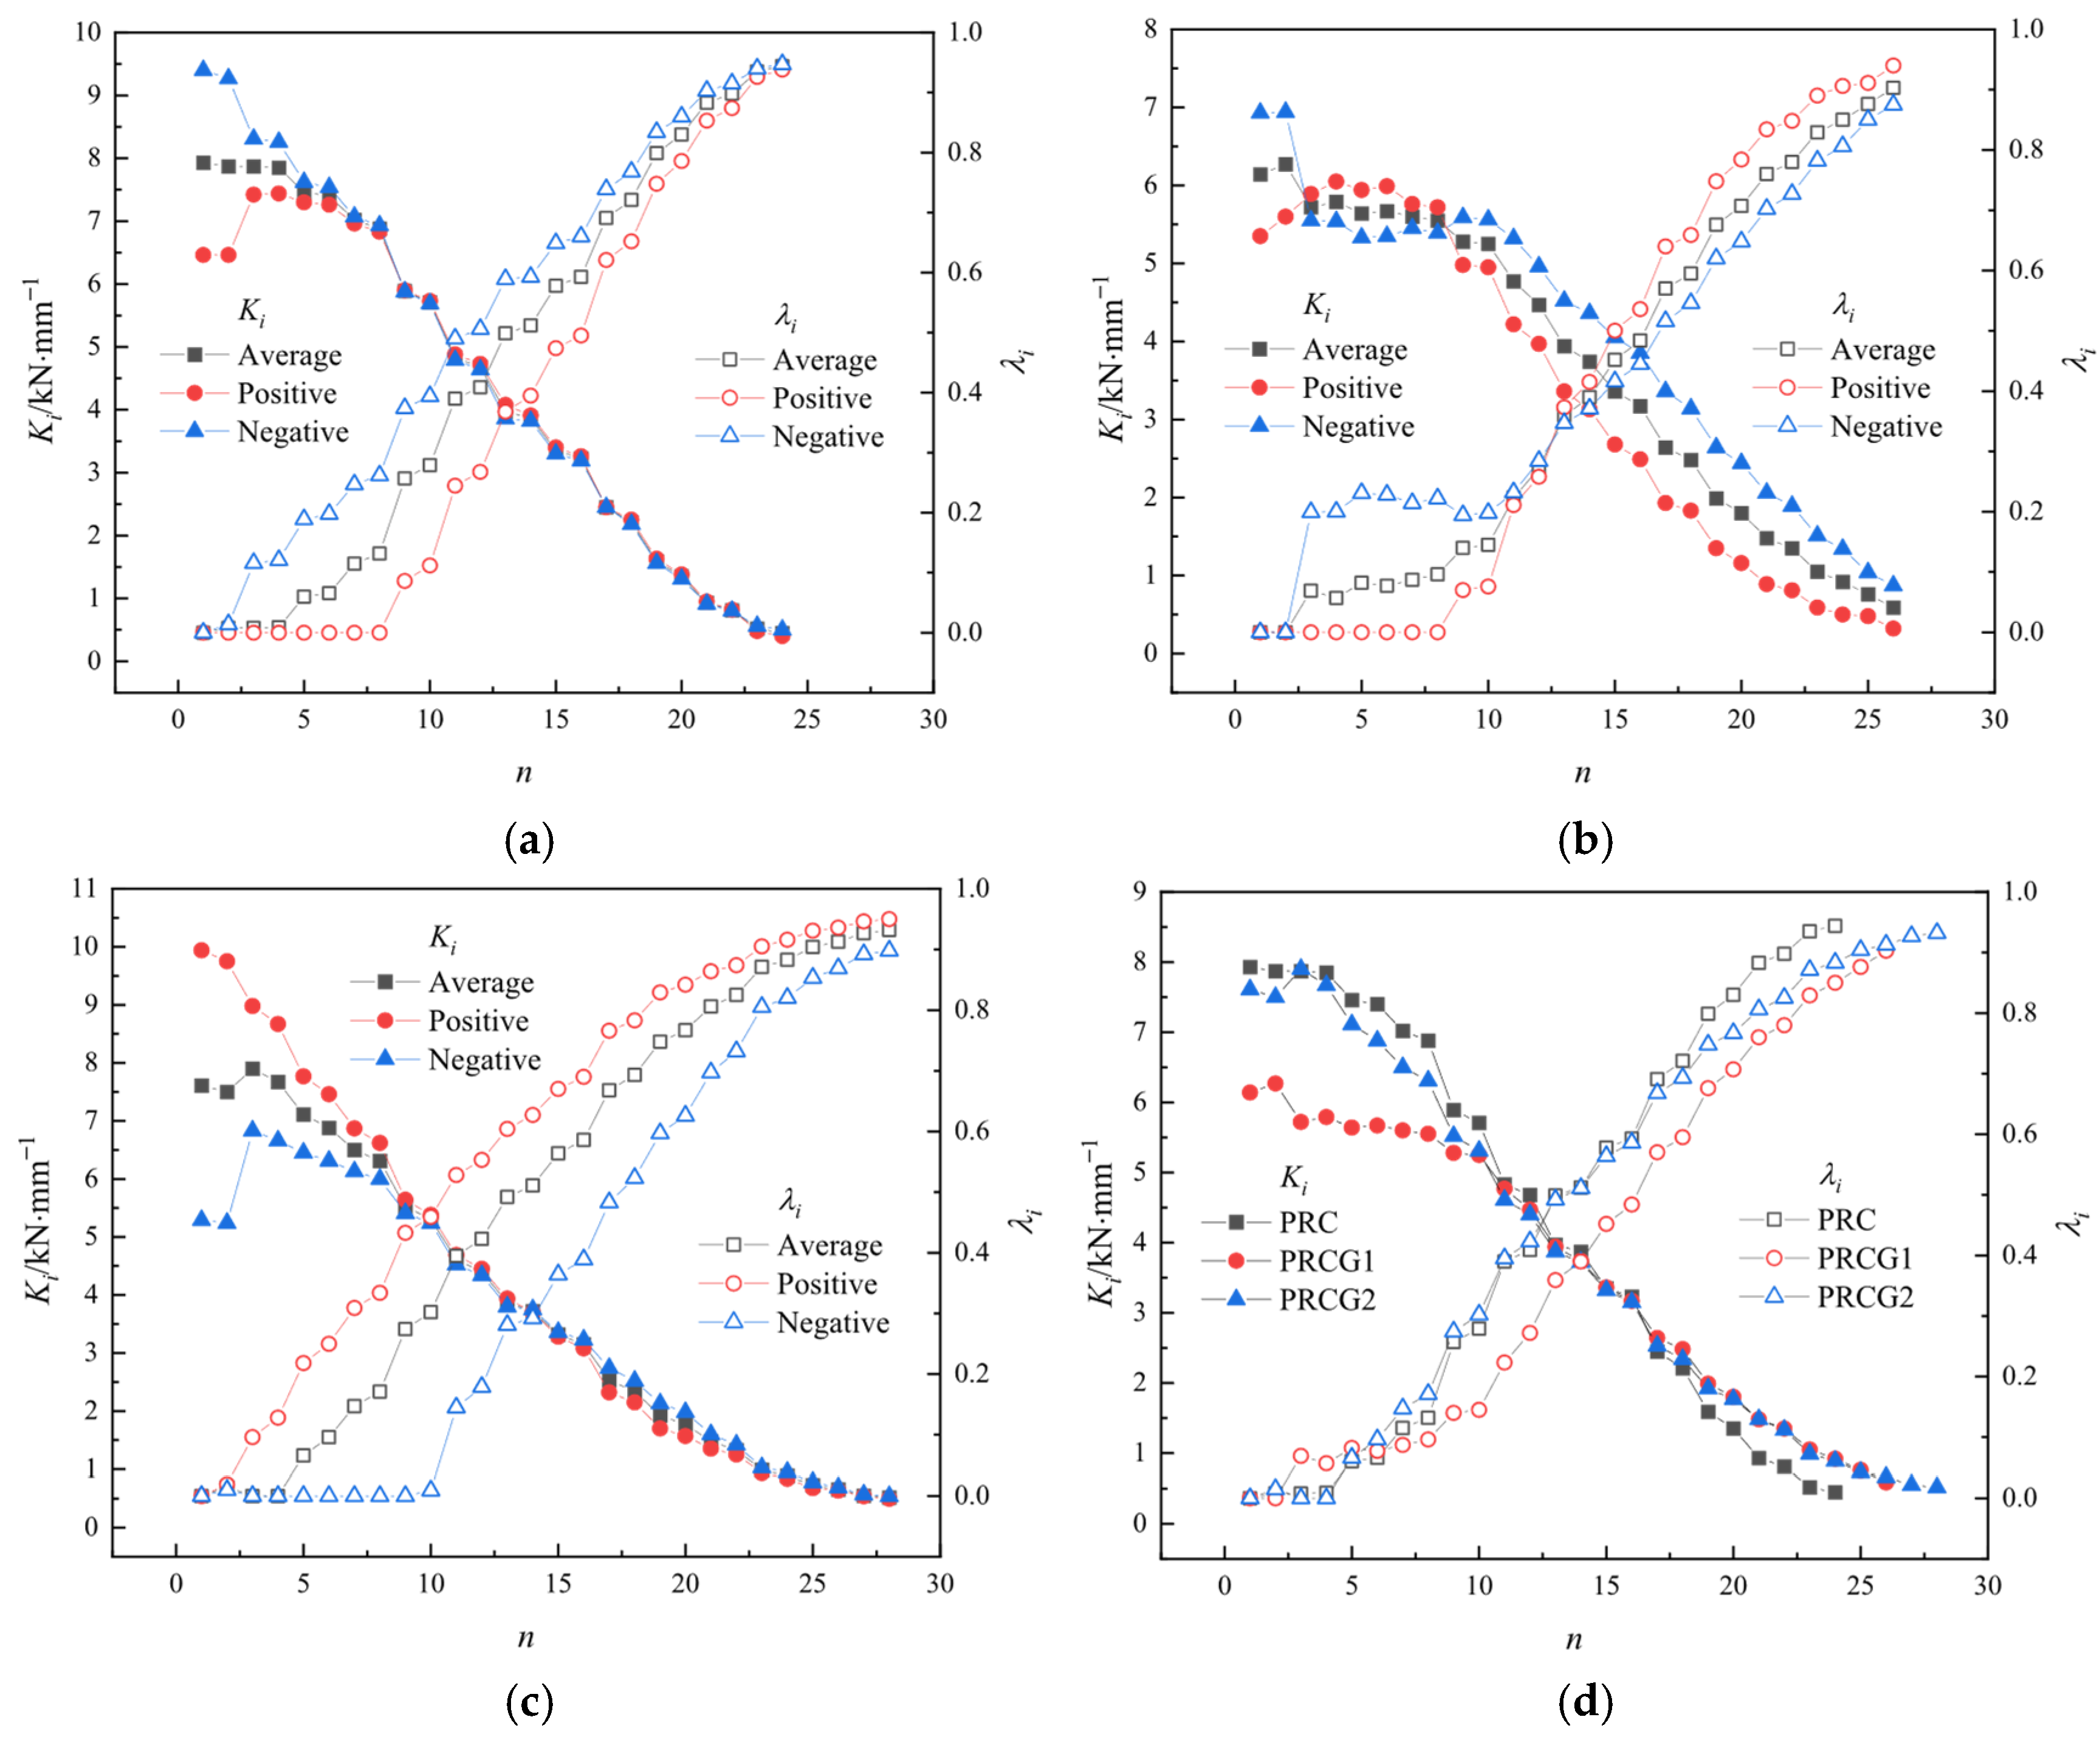
During quasi-static testing, the specimen exhibits progressive stiffness degradation due to accumulated damage mechanisms, including concrete cracking/crushing, steel-concrete bond slip, and reinforcement buckling. The stiffness
at each loading cycle is defined as follows:
where
denotes the peak displacement per hysteresis loop.
The stiffness degradation coefficient
is calculated by the following:
where
represents the initial undamaged stiffness.
Under small-to-medium displacement amplitudes, the GFRP tube exhibits negligible effects on specimen stiffness (
), as shown in
Figure 19. This is attributed to the concrete’s elastic deformation phase, wherein restrained transverse dilation fails to mobilize the tube’s tensile properties. With the GFRP tube contributing insignificantly to structural rigidity, axial compression is primarily resisted by concrete and internal steel reinforcement, which govern the initial stiffness response. However, under large displacements, GFRP confinement significantly enhances
and suppresses the stiffness degradation coefficient (
). Initially, PRC and PRCG2 display asymmetric
in positive/negative loading directions, but this anisotropy diminishes in mid-to-late loading stages. The directional discrepancy in
is pronounced early but converges progressively with loading progression. For PRCG1, load eccentricity induces persistently higher
in the negative direction. At
, the direction-averaged
of all specimens converges to comparable levels. Beyond this threshold, PRCG1 and PRCG2 exhibit higher
than PRC. Specifically, at
, the
of the reference specimen PRC decreased progressively to 2.33 kN/mm, 1.47 kN/mm, 0.87 kN/mm, and 0.49 kN/mm, respectively, reflecting severe mechanical degradation under cyclic loading. In contrast, GFRP tube confinement significantly enhanced structural integrity: PRCG1 exhibited stiffness increases of 9.87%, 28.91%, 64.88%, and 103.09% versus PRC, while PRCG2 showed increases of 4.51%, 25.51%, 61.49%, and 93.81% at the same
levels.
4.6. Dissipation Capacity and Residual Displacement
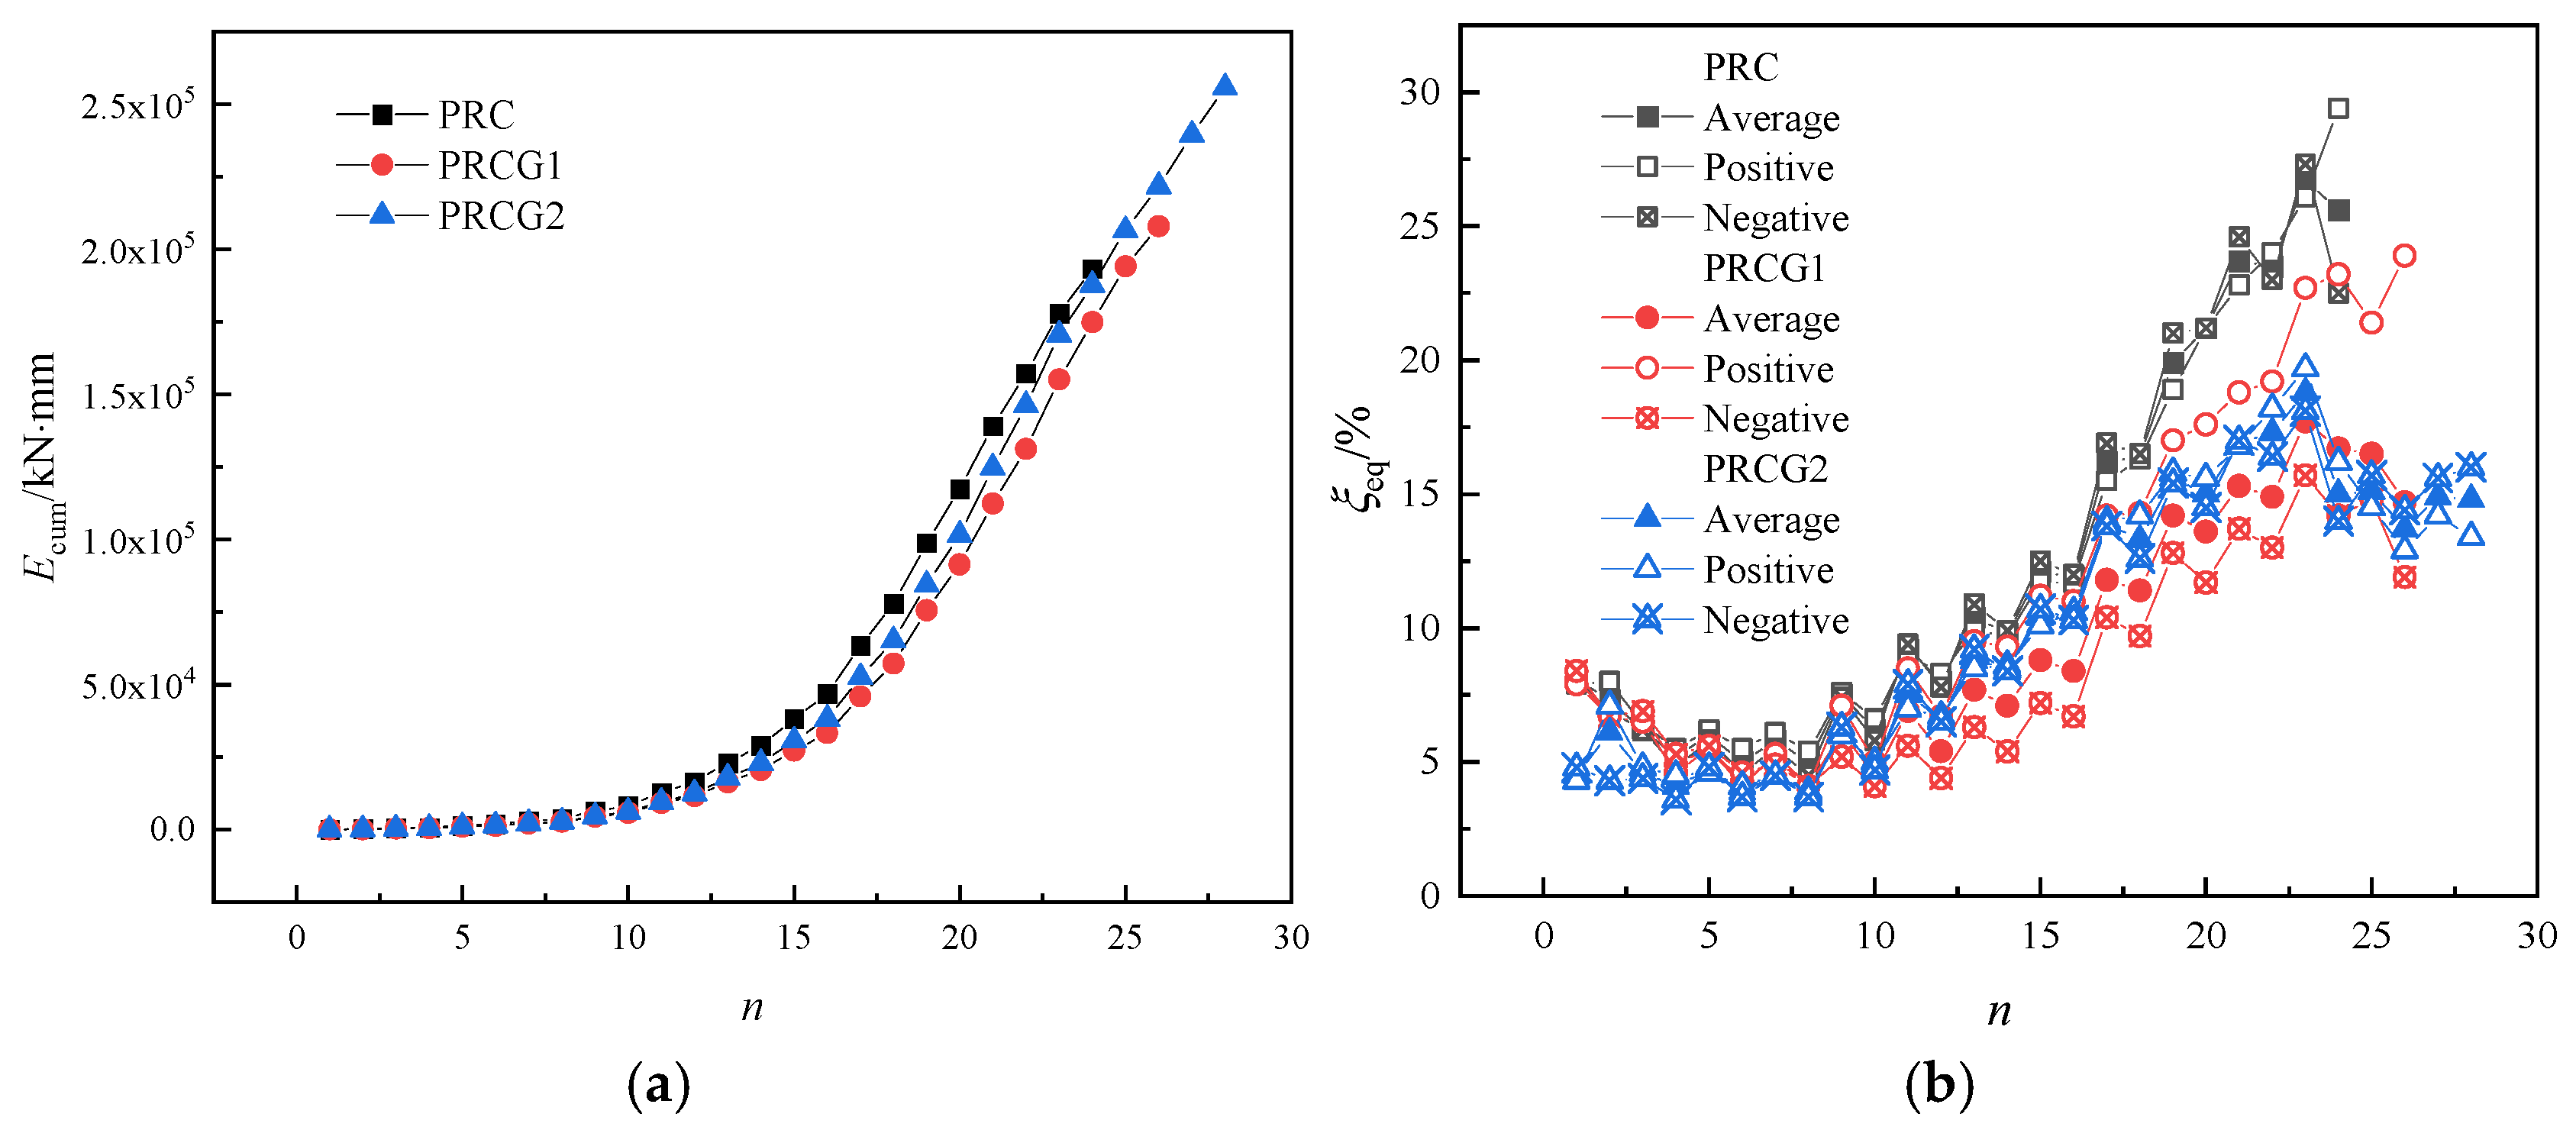
Figure 20 presents the cumulative hysteretic energy dissipation capacity (
) and equivalent viscous damping ratio (
) of the specimen under incrementally increased cyclic loading. The equivalent viscous damping ratio
is calculated as follows:
where
denotes the hysteresis loop area (representing cumulative energy dissipation per cycle), and
is the triangular area under the equivalent elastic deformation envelope (quantifying recoverable elastic strain energy).
Within the displacement range of = 0–7%, the follows the order PRC > PRCG2 > PRCG1. Notably, the energy dissipation disparity between PRC and GFRP-confined specimens (PRCG1/PRCG2) exhibits a non-monotonic trend: initially increasing, peaking near (indicating severe damage in PRC primarily through plastic hinge zone failure), then progressively decreasing. At their respective ultimate bearing capacities, PRCG1 and PRCG2 achieve 13.90% and 26.43% higher than PRC, demonstrating GFRP’s efficacy in enhancing energy absorption. For the , the relationship PRC > PRCG2 > PRCG1 persists across = 1.5–7%, with the gap widening as displacement increases. Beyond = 7%, declines due to the accelerated growth of elastic deformation energy relative to hysteretic dissipation. These findings demonstrate that GFRP tubes promote structural energy dissipation, correlating with improved ductility and reduced damage severity.
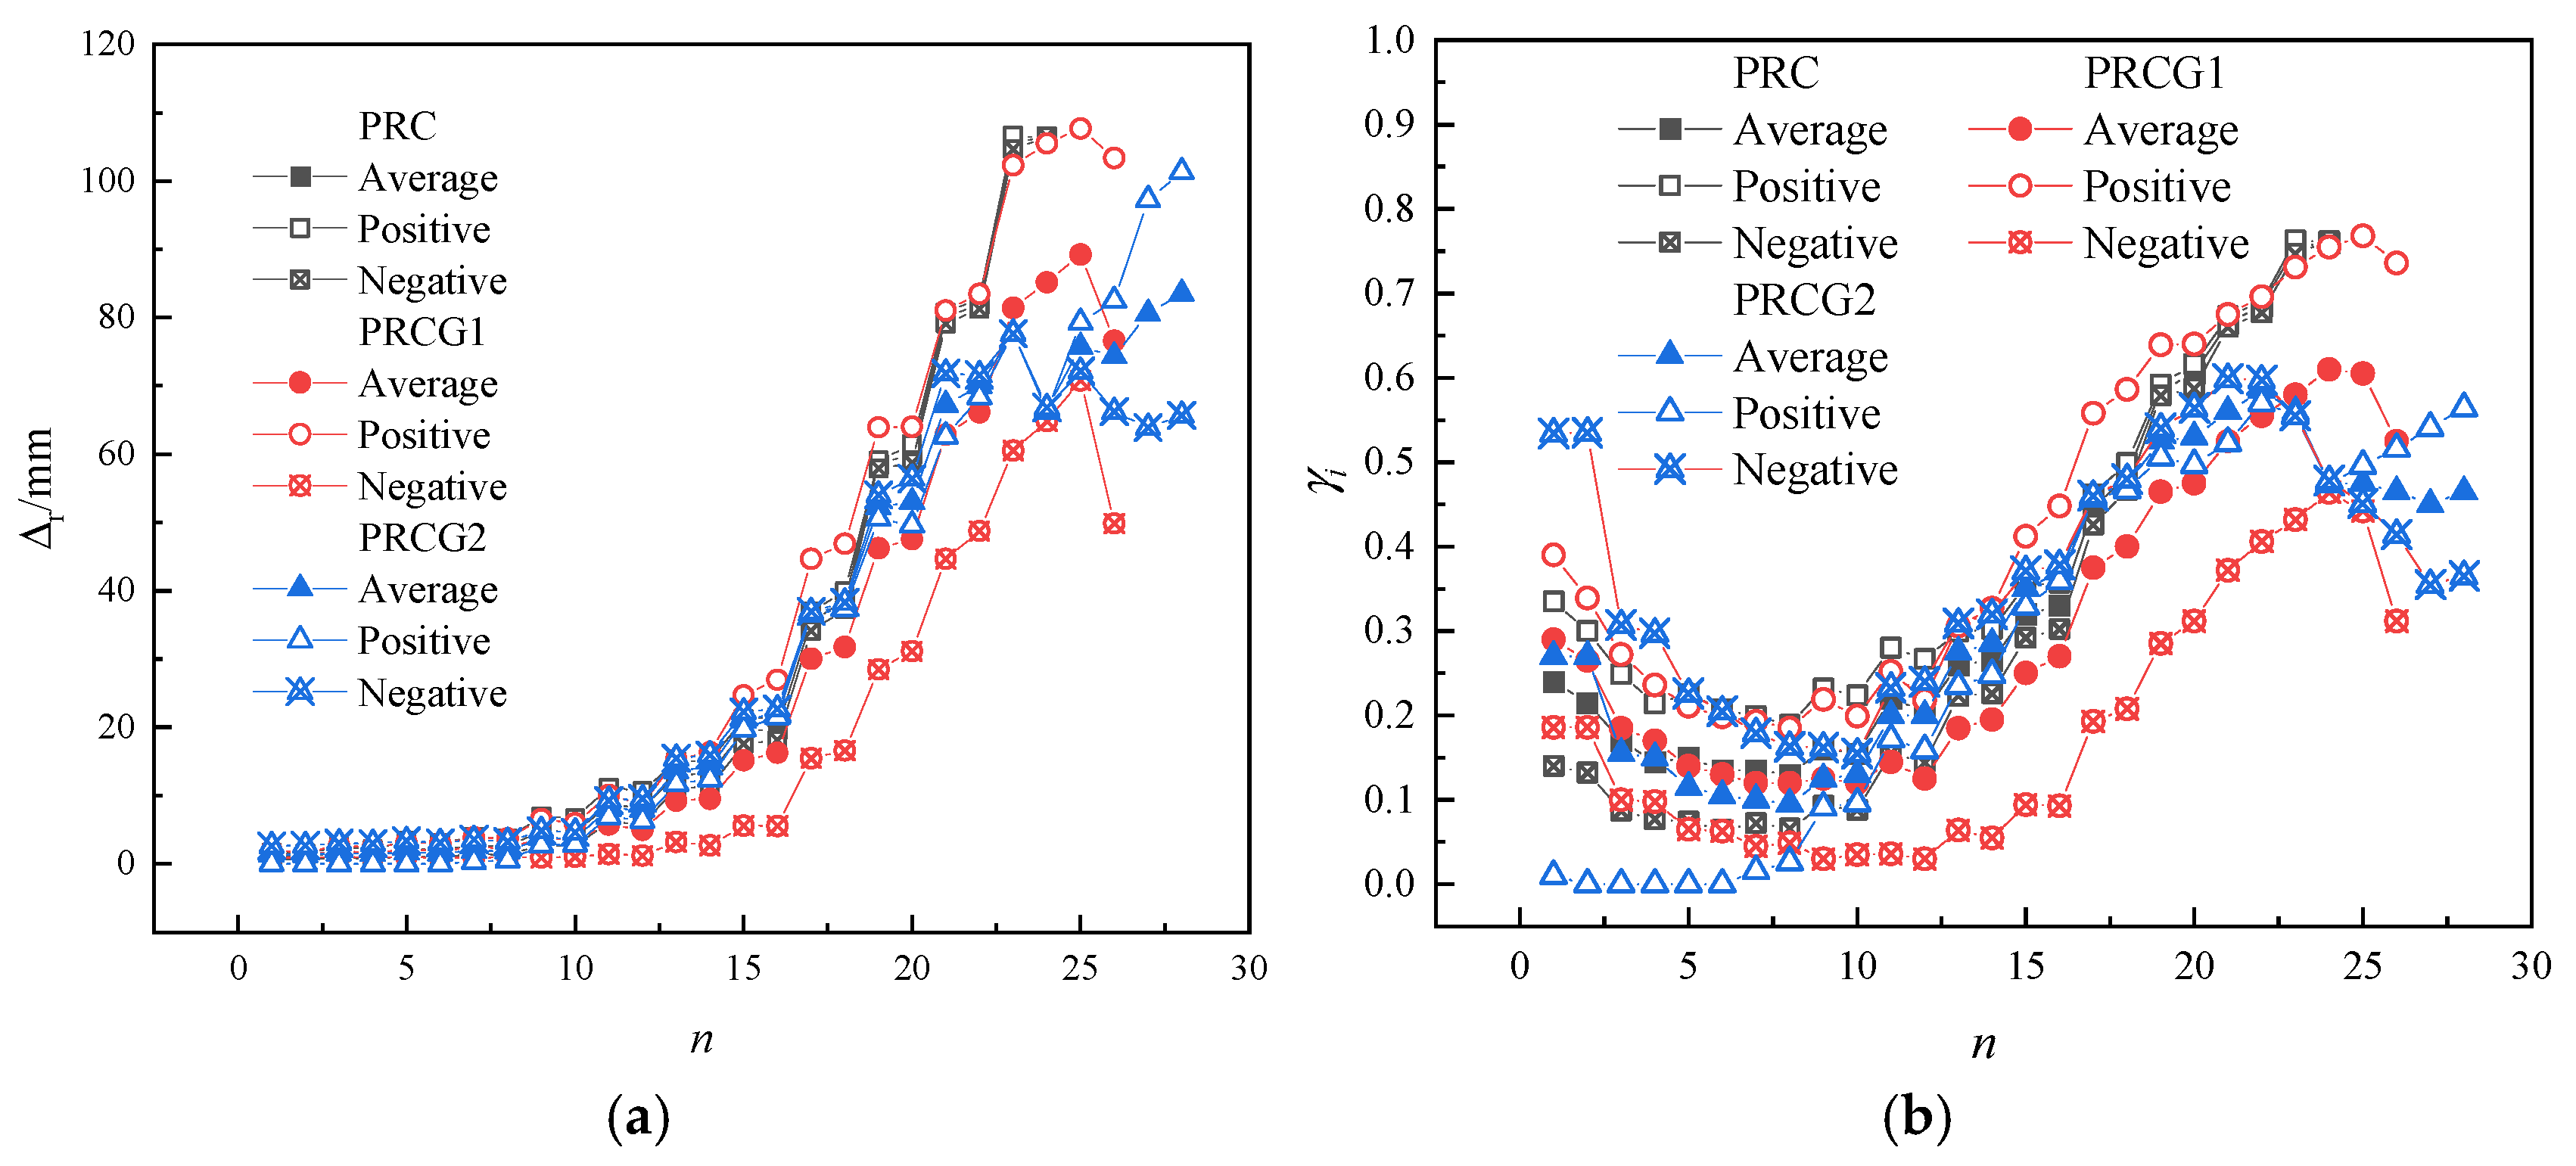
Residual displacement (denoted as
) is defined as the intercept of the unloading path on the hysteresis loop with the displacement axis (X-axis), representing the irrecoverable plastic deformation of the structure after seismic excitation. This parameter serves as a critical indicator for evaluating structural seismic resilience, as smaller
values correlate with lower post-earthquake repair costs and a reduced probability of secondary disasters. The residual deformation proportion (
), as illustrated in
Figure 21, is quantified by the following equation:
During the initial loading stage, the exhibited minimal variation across specimens. PRC showed symmetric in positive and negative directions, whereas PRCG2 displayed slight asymmetry, and PRCG1 demonstrated significantly larger directional discrepancies. As the displacement amplitude increased, accumulated progressively, while the initially decreased before rising. Notably, the second loading cycle at each level yielded higher and than the first cycle. Beyond = 4%, PRC exhibited accelerated growth, surpassing both GFRP-confined specimens (PRCG1 and PRCG2). At = 5%, the of PRCG1 and PRCG2 was 12.39 mm and 6.62 mm lower than PRC, respectively; at = 6%, these differences increased to 16.51 mm and 12.39 mm. At = 7%, reached 106.03 mm (PRC), 83.30 mm (PRCG1), and 72.12 mm (PRCG2), corresponding to values of 0.76, 0.60, and 0.52. Compared to PRC, GFRP confinement reduced by 21.44% (PRCG1) and 31.98% (PRCG2), and by 21.05% and 31.58%, respectively. This confirms that GFRP tube confinement enhances the self-centering capacity of bridge piers by constraining concrete dilation, thereby significantly mitigating post-seismic residual displacements.
4.7. GFRP Tube-Confined Concrete Model and Numerical Simulation
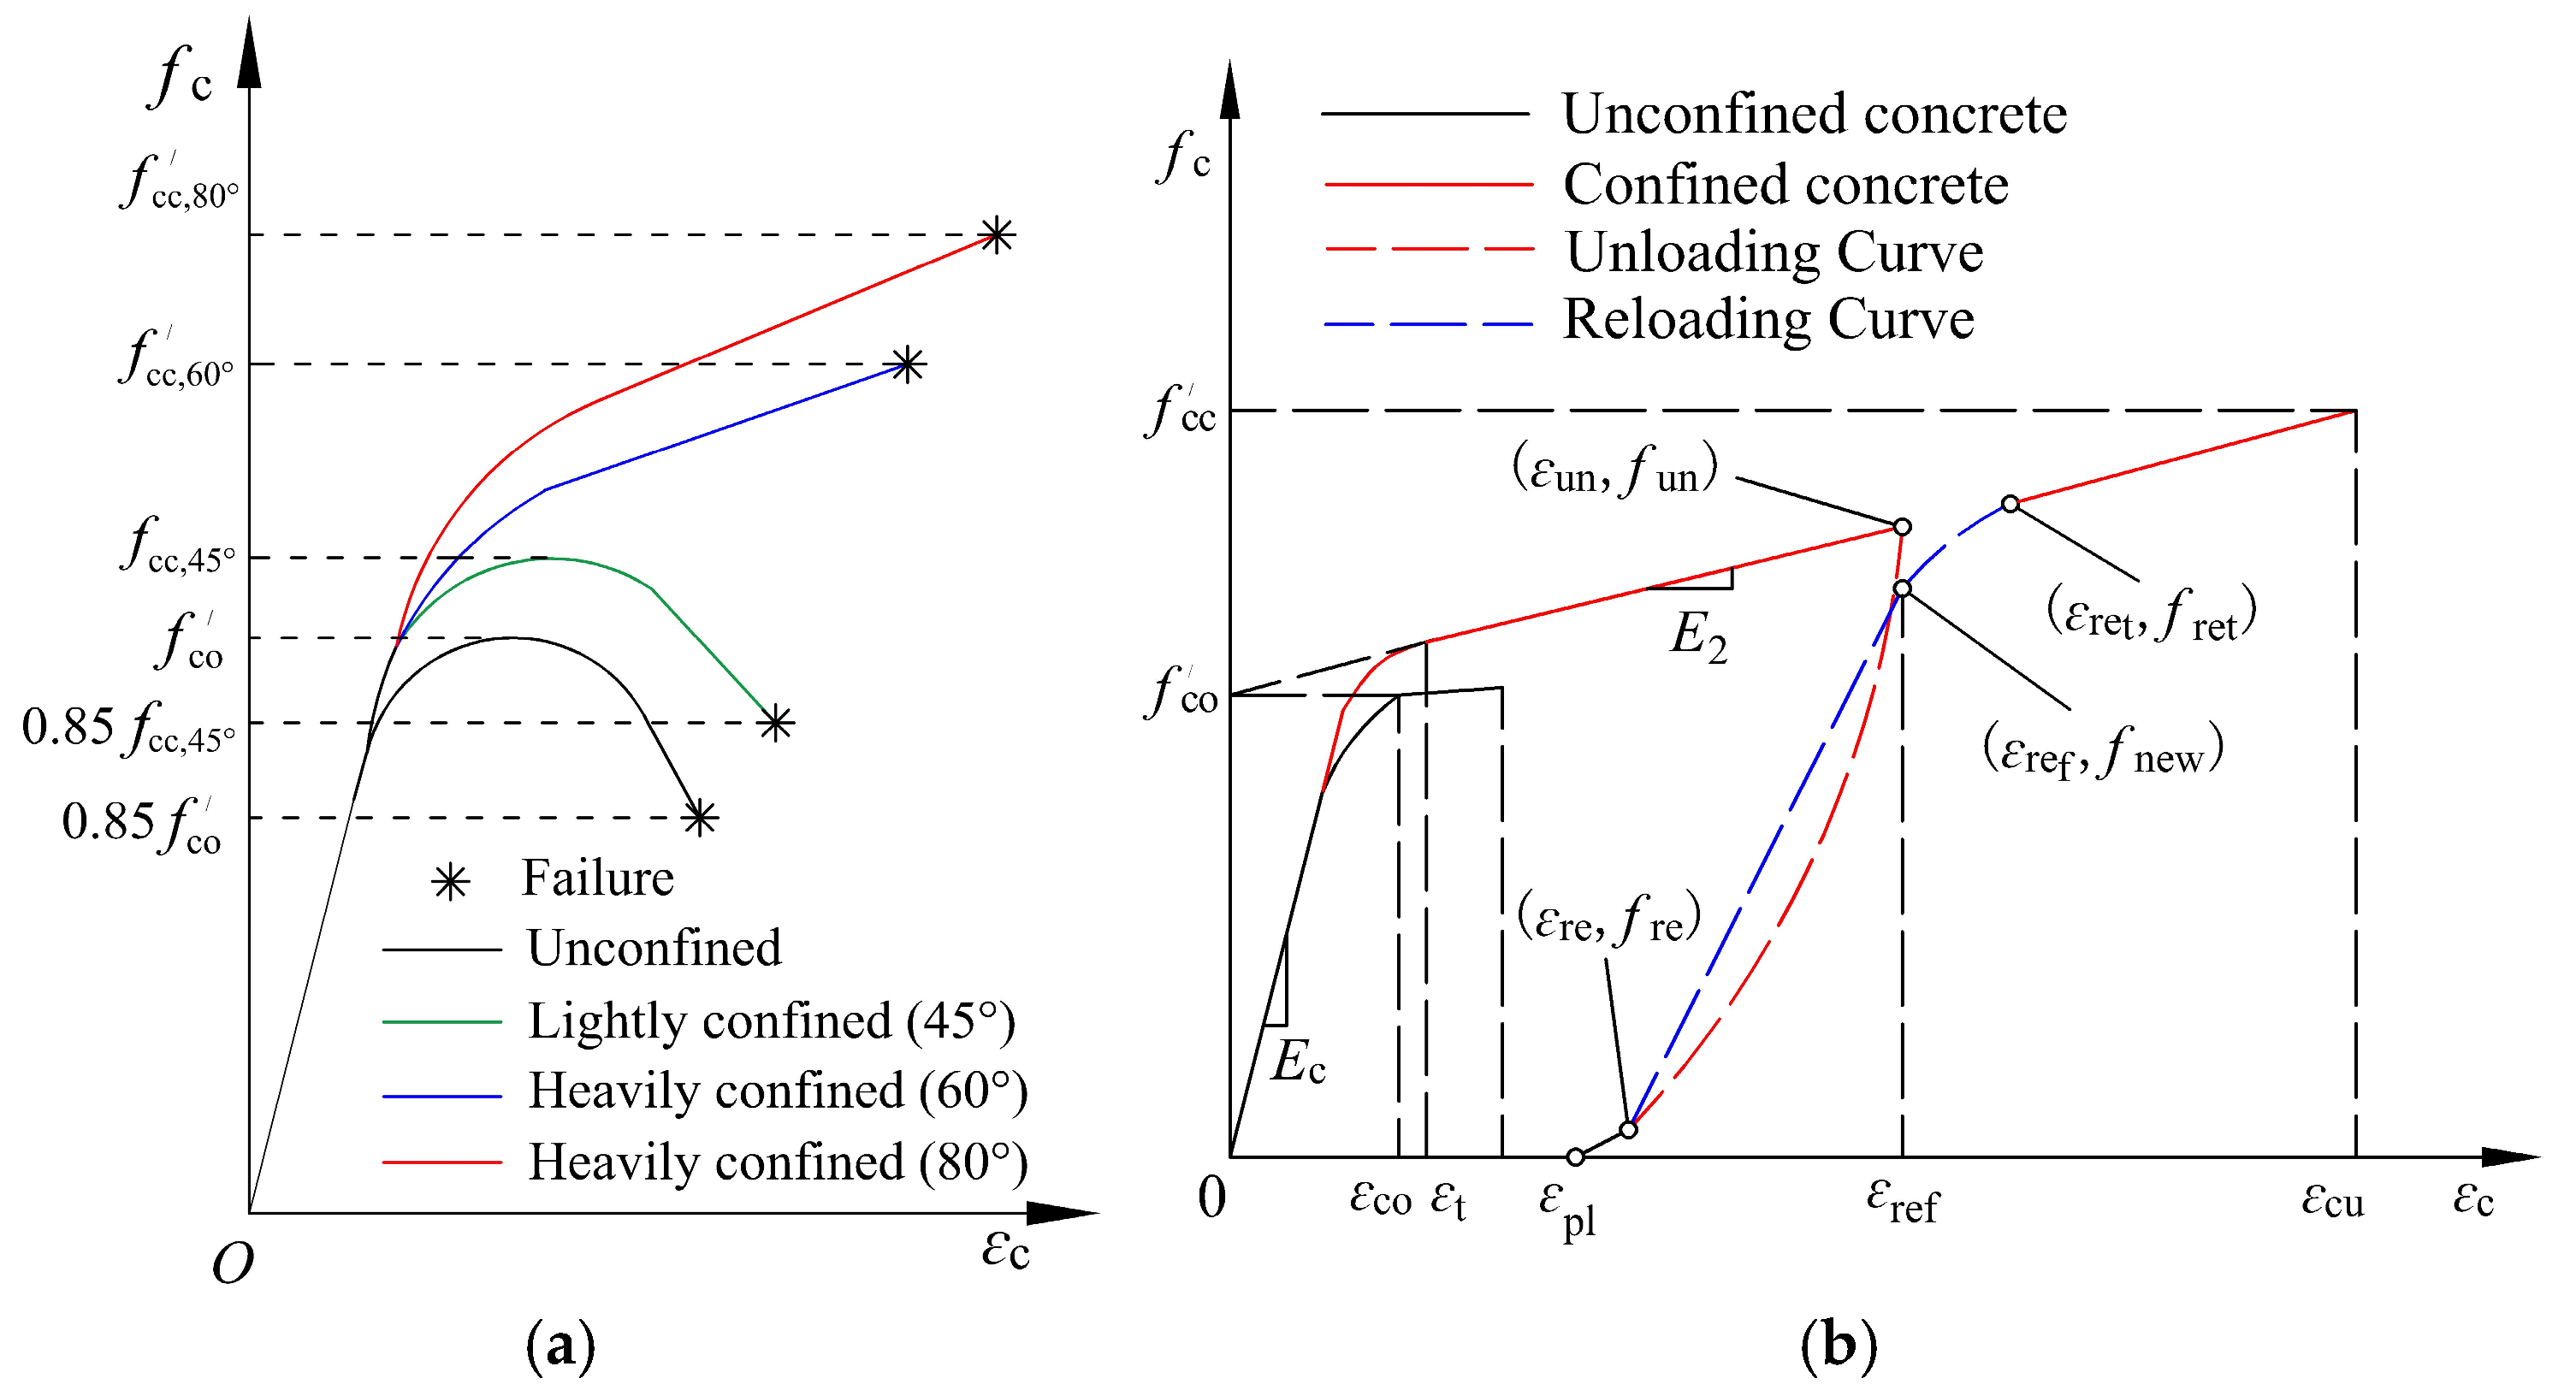
Depending on the confinement level provided by GFRP tubes, the uniaxial stress–strain behavior can be characterized by one of the curves in
Figure 22a. Notably,
GFRP tubes exhibit ineffective hoop confinement with limited strength enhancement, which should be avoided in practical engineering applications.
Figure 22b schematically illustrates the loading–unloading rules for GFRP-confined concrete under cyclic loading under strong confinement conditions, where
The stress and strain at the unloading initiation point are defined as unloading stress () and unloading strain (), respectively;
The strain at the intersection of the unloading curve and the strain axis is termed plastic strain ();
The stress and strain at the reloading initiation point are designated as reloading stress () and reloading strain (), respectively;
The stress and strain at the intersection of the reloading curve and the envelope curve are identified as return stress () and return strain (), respectively;
The reference strain () corresponds to the previous unloading strain () projected onto the reloading curve, with the stress at this point () serving as the key parameter for quantifying stress degradation.
The proposed constitutive model for GFRP tube-confined concrete, developed based on Lam and Teng’s theory [
33,
34], characterizes the uniaxial stress–strain relationship as follows:
where
denotes the elastic modulus of unconfined concrete;
represents the limiting axial compressive strain of confined concrete;
is the transitional strain at the intersection of the parabolic and linear segments of the stress–strain curve; and
defines the slope of the second linear branch post-transitional strain.
The unloading and reloading rules follow the Lam and Teng models [
35]. The reloading curve of this model comprises two distinct segments: a linear phase and a parabolic phase. The unloading curve employs a polynomial formulation, demonstrating higher accuracy than alternative models [
36,
37,
38], expressed as follows:
where
denotes the slope of the linear segment on the reloading curve. The specific coefficients
,
,
,
,
,
, and
are defined in reference [
35] and are not reiterated here.
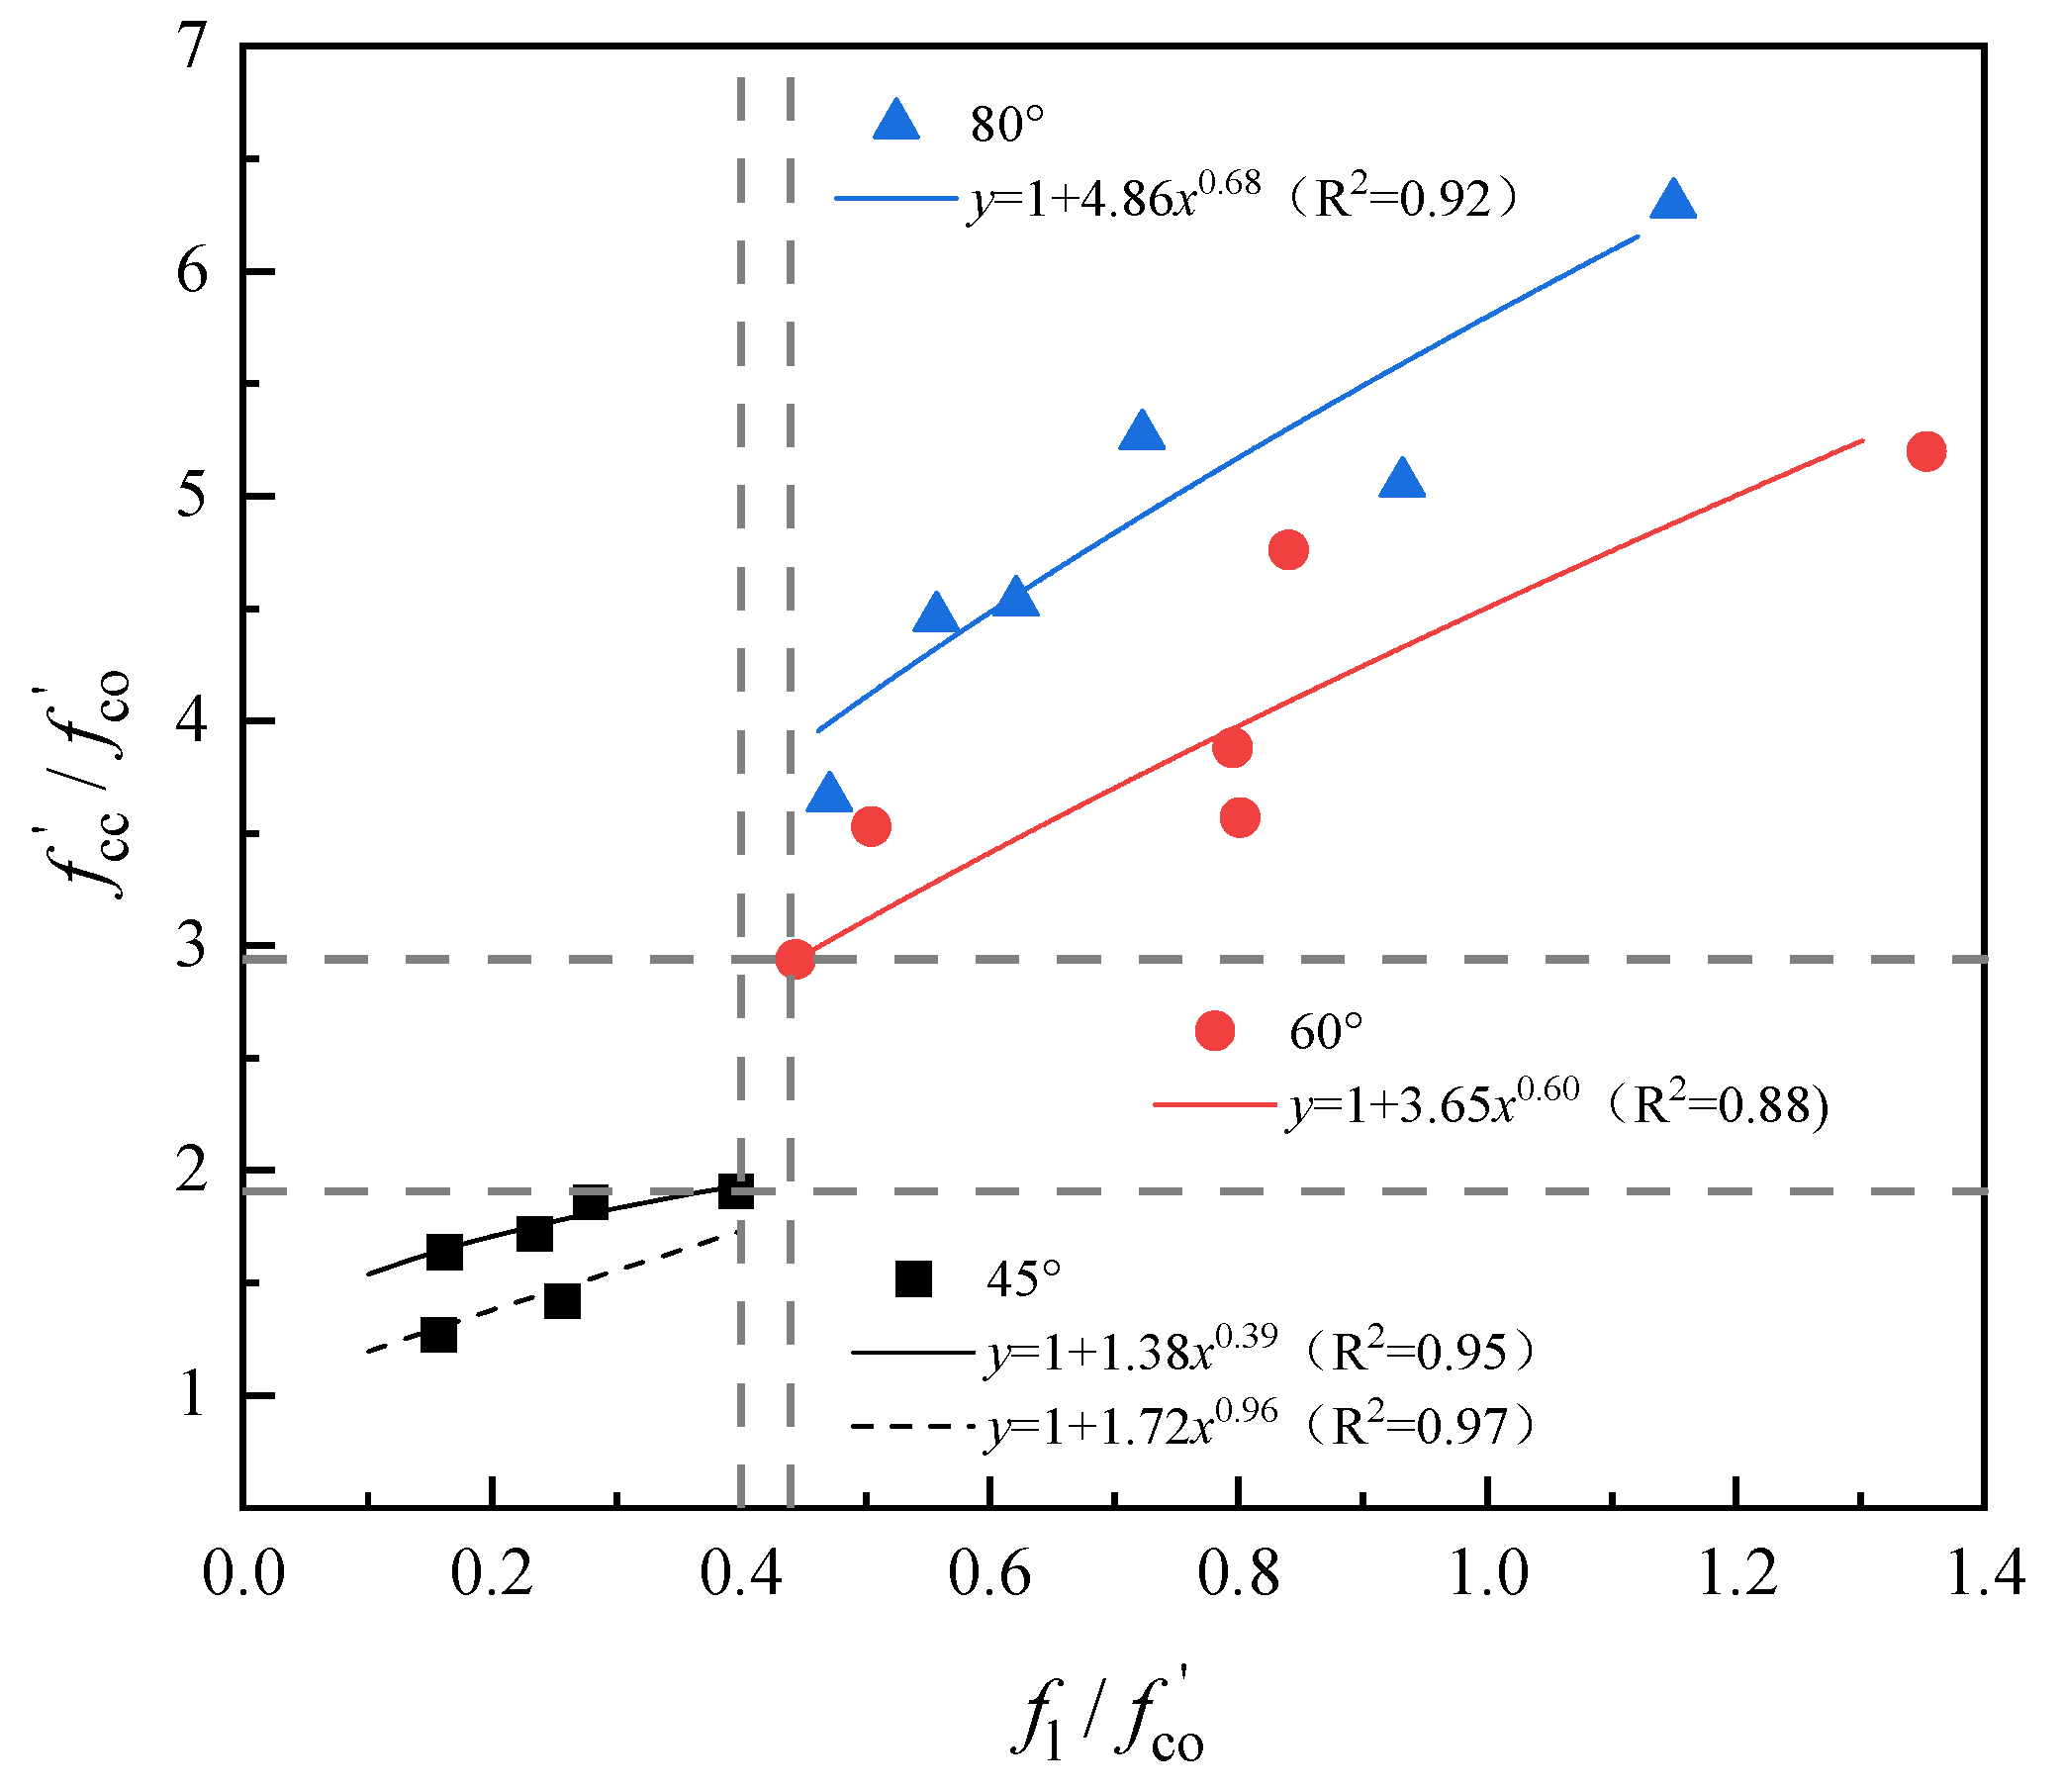
Regression analysis was performed on the experimental data from 54 specimens in this study, categorized by fiber orientation. The results are presented in
Figure 23, where the coefficient of determination (
) is calculated as follows:
where
denotes the predicted value;
represents the measured value; and
is the mean of all measured values.
The predictive formula for the confined compressive strength (
) of GFRP tube-confined specimens with varying fiber angles is derived as follows:
Equations (22)–(24) represent statistically averaged results derived from specimens with identical fiber angles (dominant influencing factor), considering two kinds of layer counts (6, 10), slenderness ratios (2, 4), and distinct loading protocols. These formulas can guide rapid preliminary design when parameters fall within the sufficiently representative ranges.
Furthermore, by embedding the proposed constitutive model for GFRP-confined concrete into the OpenSees (v3.1.0) material library via custom development, the numerical simulation of quasi-static testing on bridge piers can be implemented.
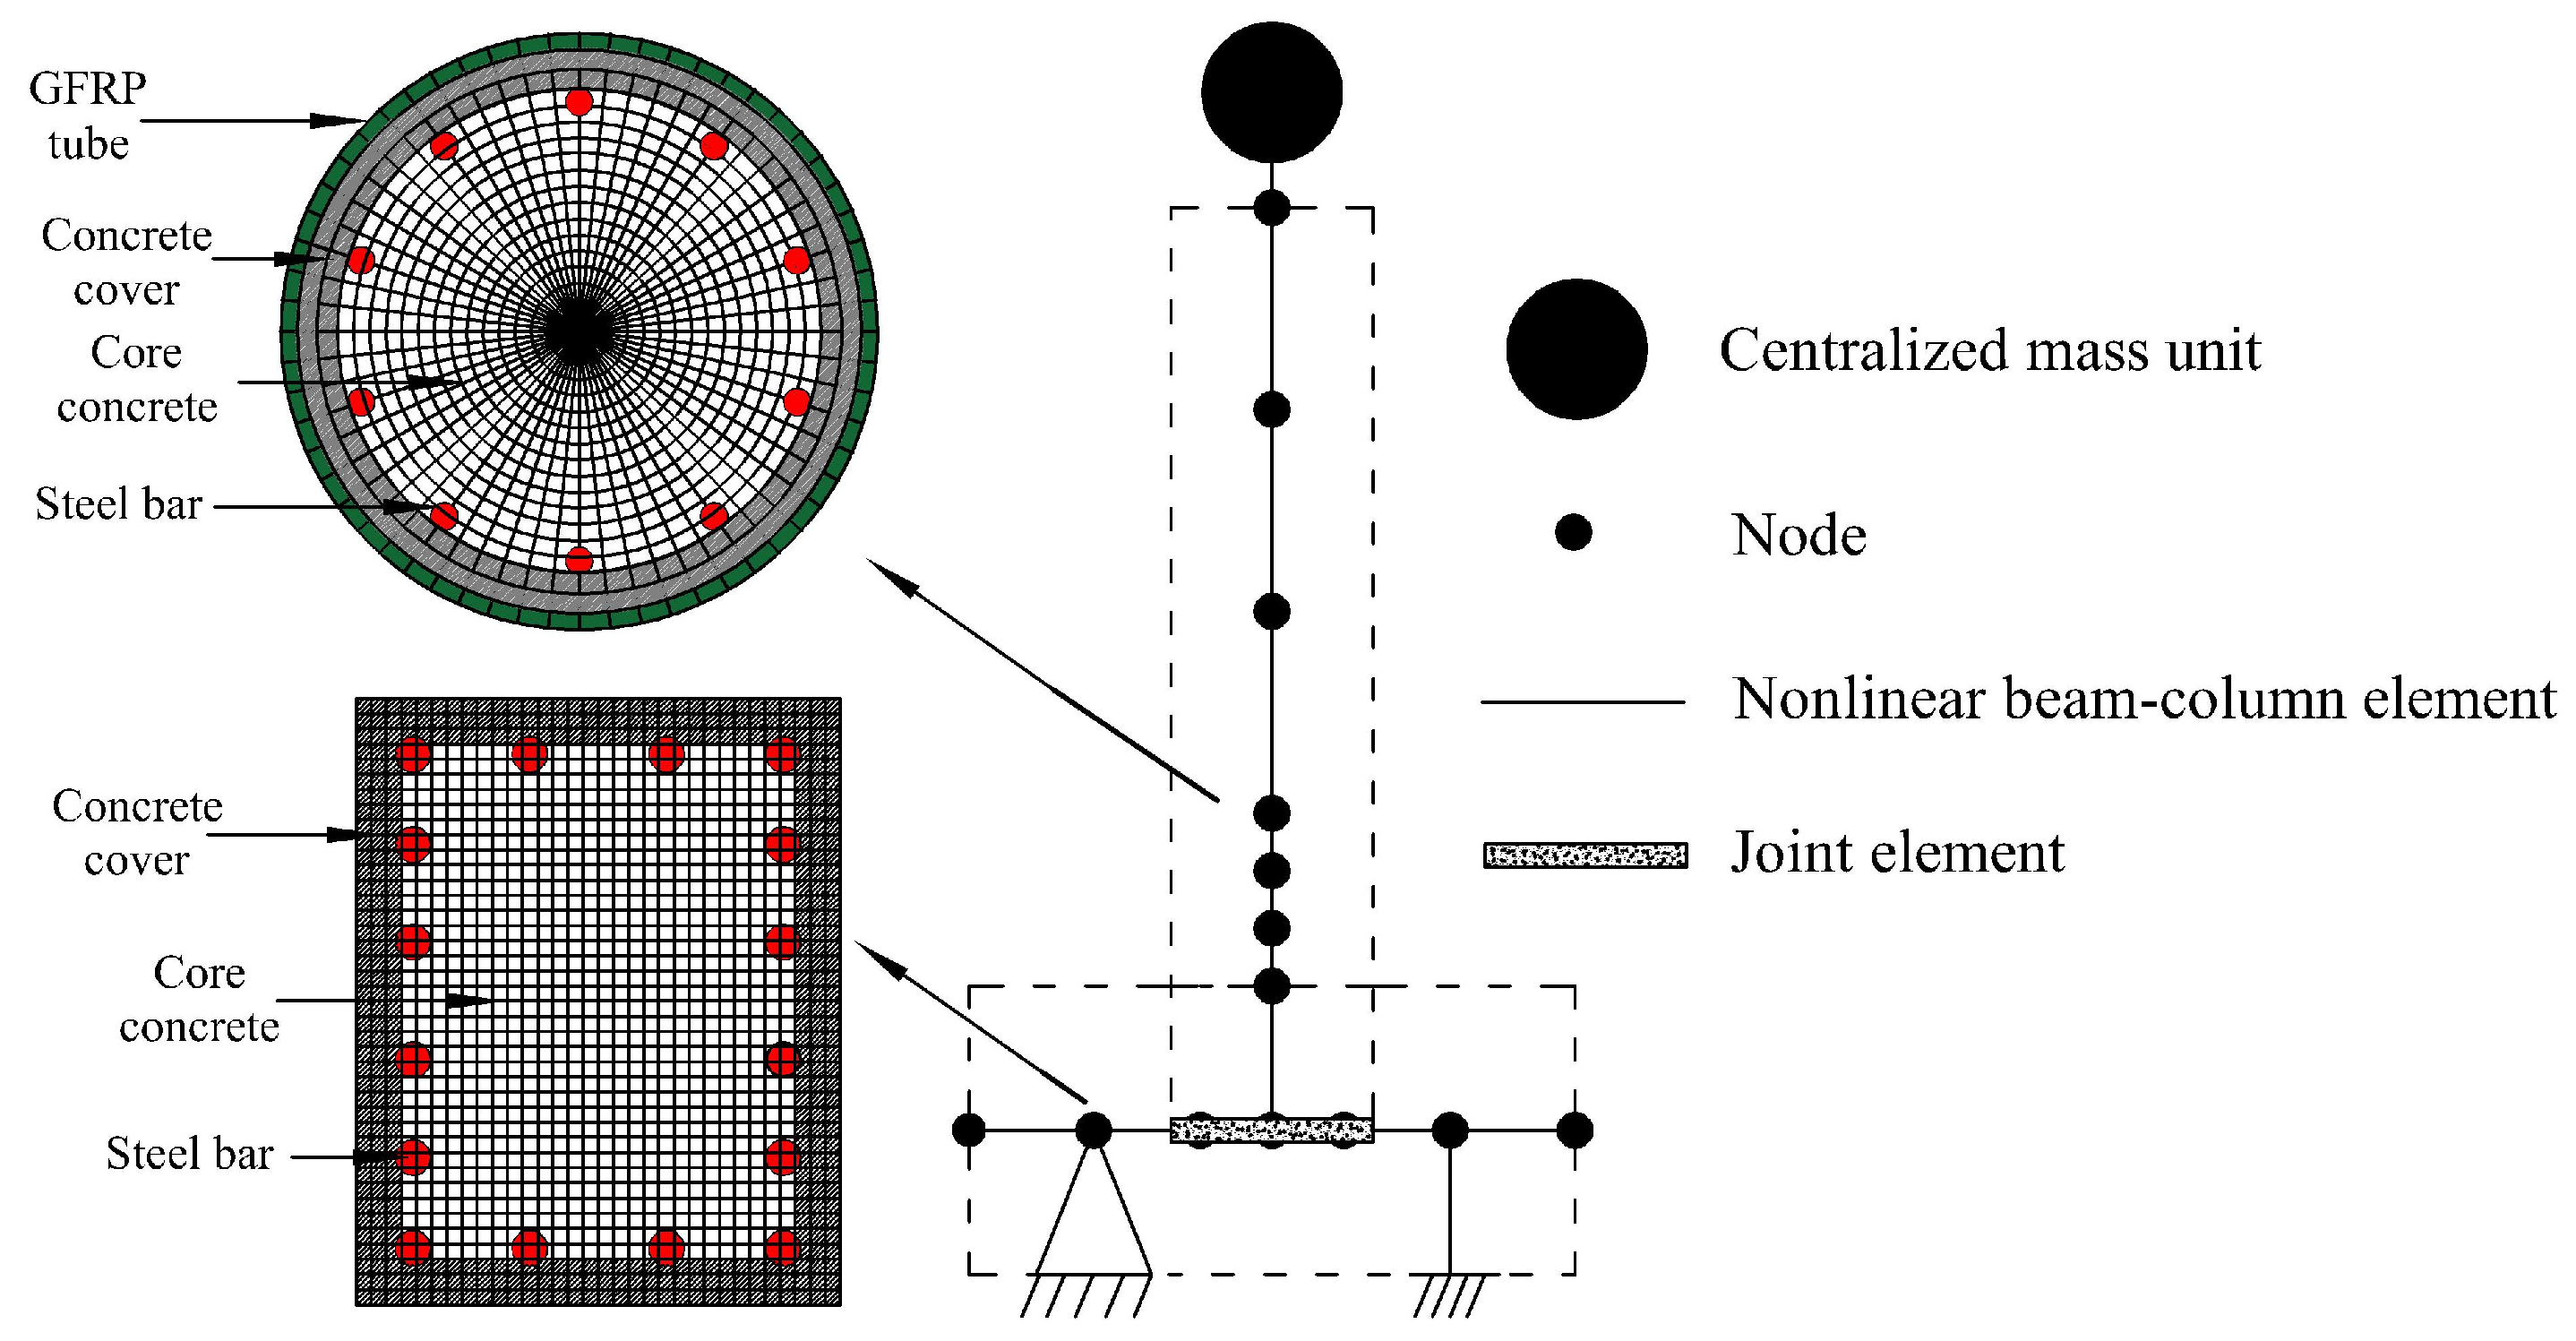
The specimen was modeled in OpenSees using nonlinear beam-column elements. Based on the actual geometric dimensions, the element was discretized with 15 integration points, locally refined near the joint interface. The pier cross-section was divided into 1000 fiber elements (50 circumferential × 20 radial). The column-footing joint was simulated with high-strength grout material matching the joint height, concentrating deformation at the interface. A fixed-end constraint was applied at the base, while rotational restraints were imposed at the top. The sustained dead load at the pier top was modeled as a centralized mass element. Displacement-controlled loading was adopted throughout the test. The specimen model schematics are illustrated in
Figure 24.
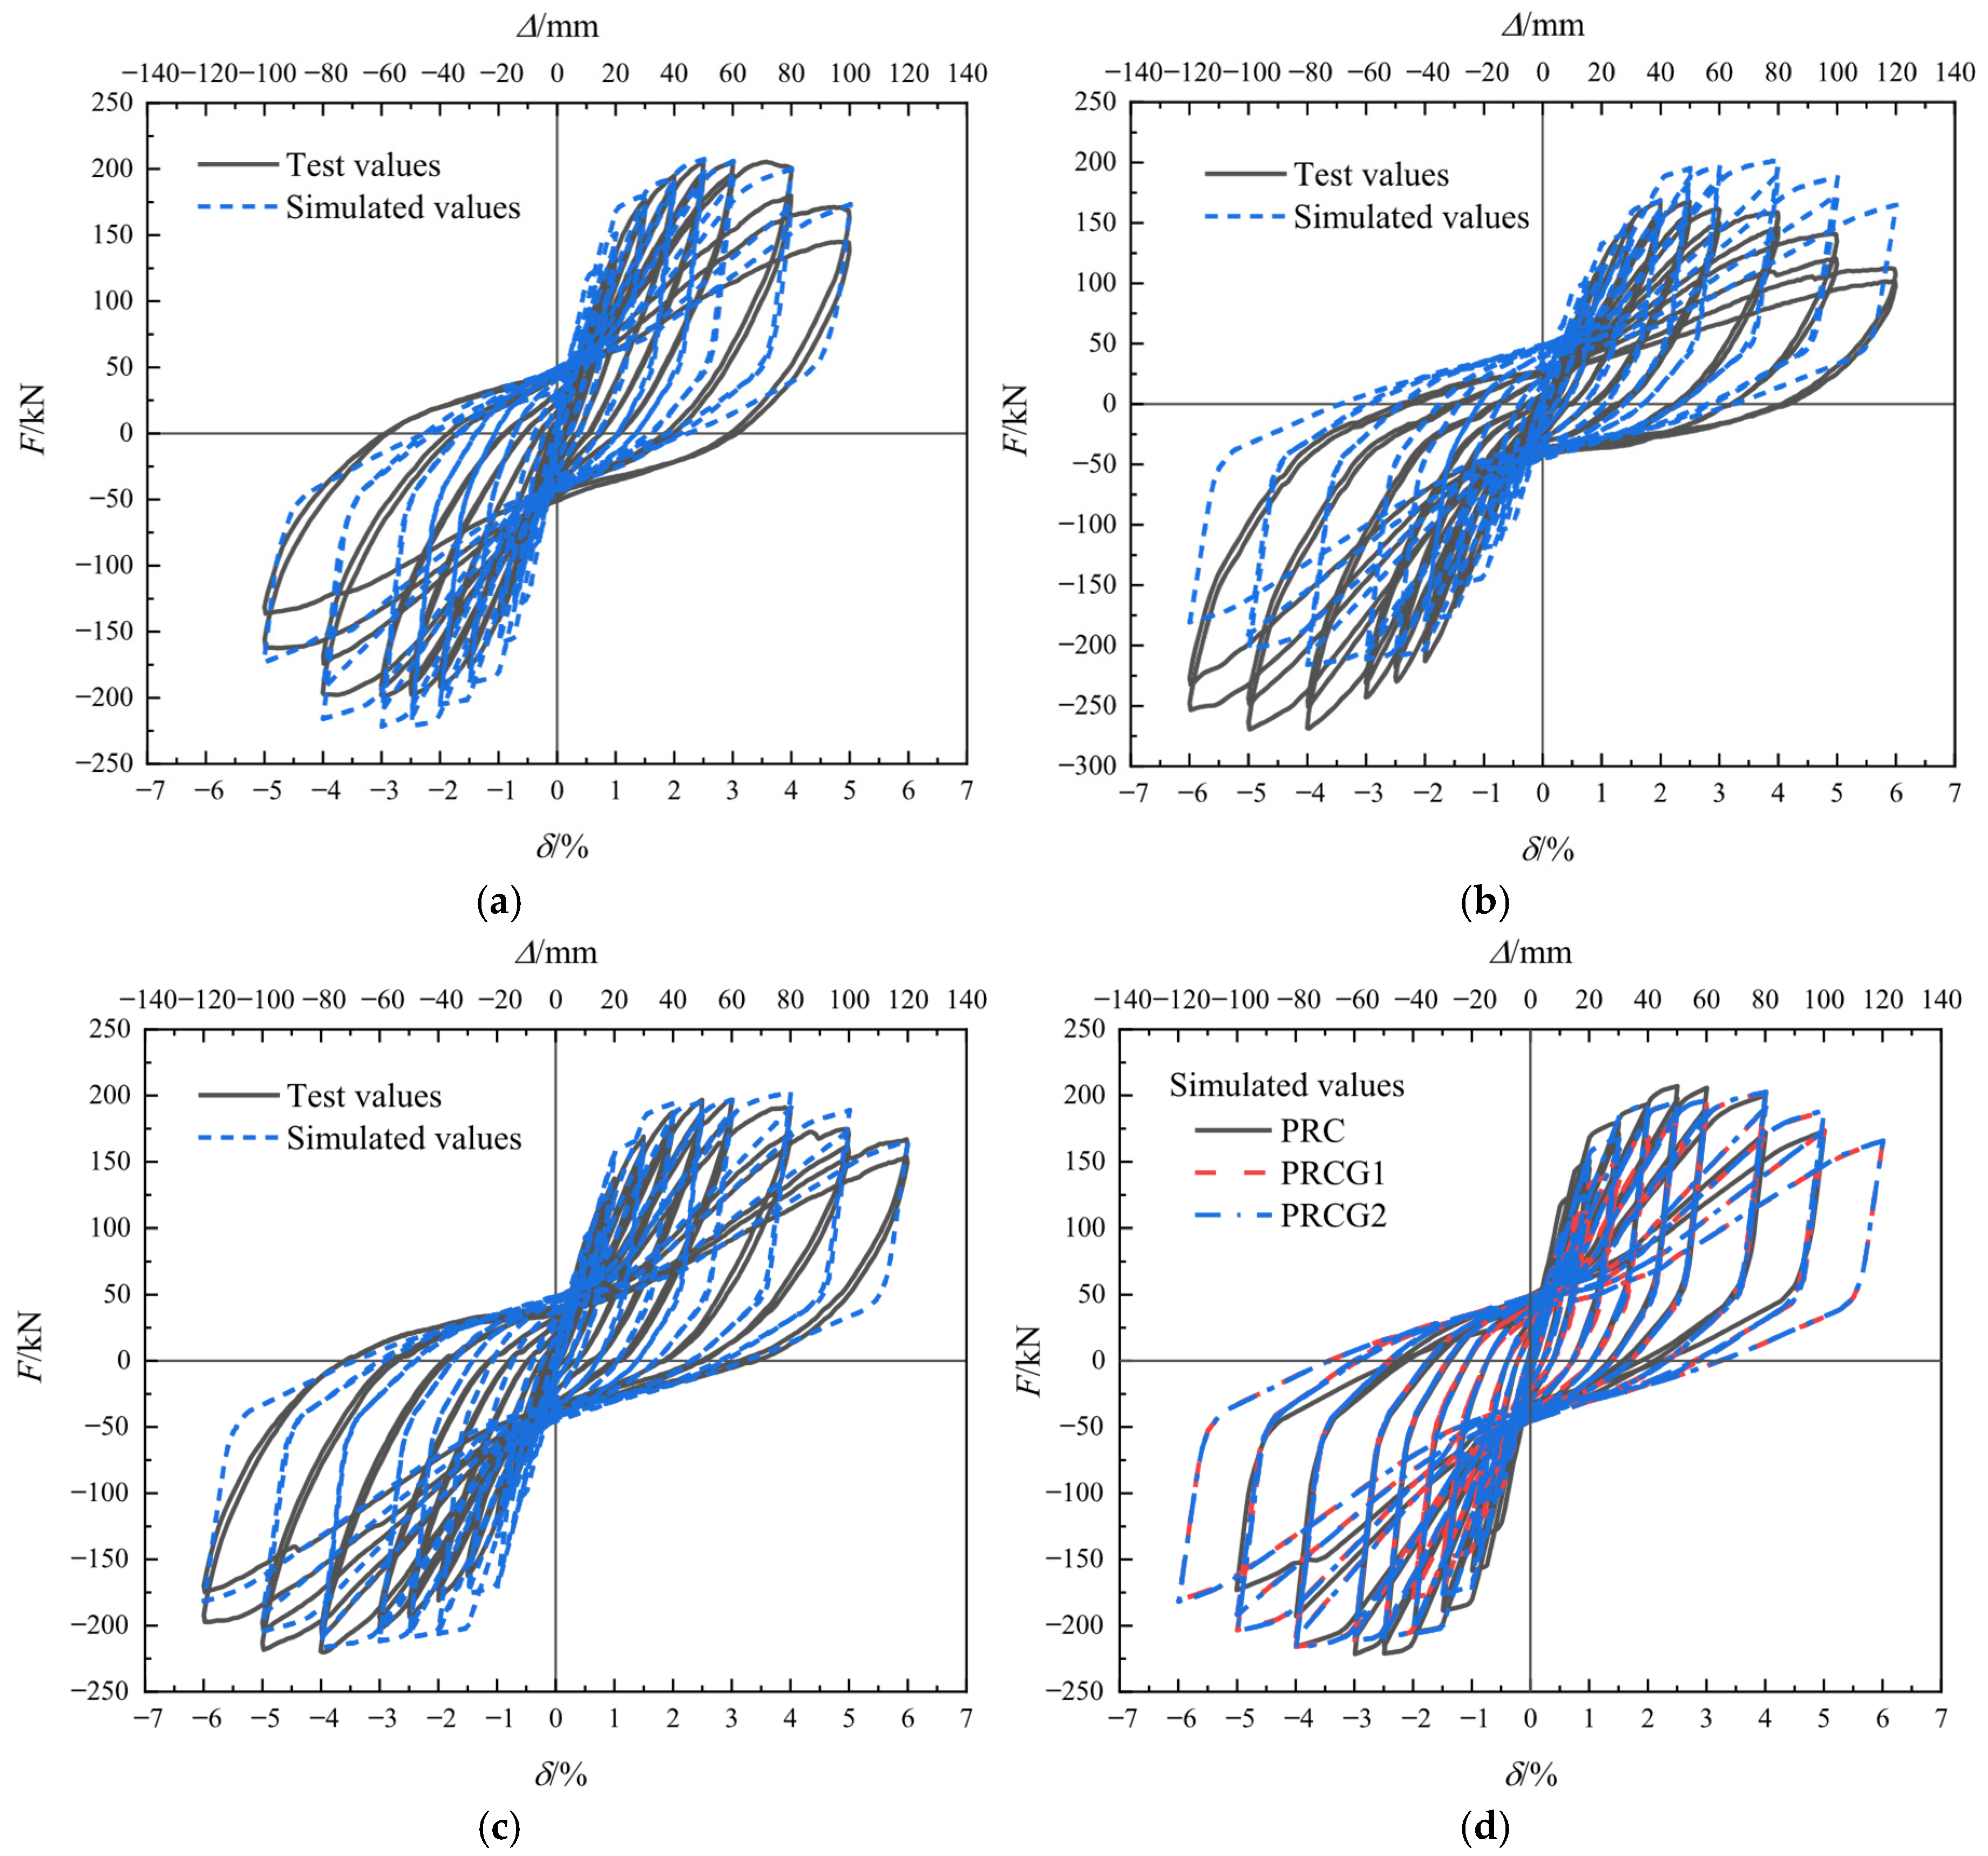
Given severe damage progression in later loading stages, numerical simulations were terminated at a 5% drift ratio for the PRC specimen and 6% drift ratio for PRCG1/PRCG2 to ensure convergence. As illustrated in
Figure 25, the simulated hysteretic responses demonstrate close alignment with the experimental results, accurately replicating the strength degradation and stiffness deterioration caused by sequential steel fracture and concrete crushing under low-cycle cyclic loading. Crucially, PRCG1 and PRCG2 exhibit near-identical hysteretic behavior when axial force eccentricity is neglected, confirming that the 6-ply GFRP tube thickness delivers adequate confinement for the prefabricated bridge piers examined in this study.
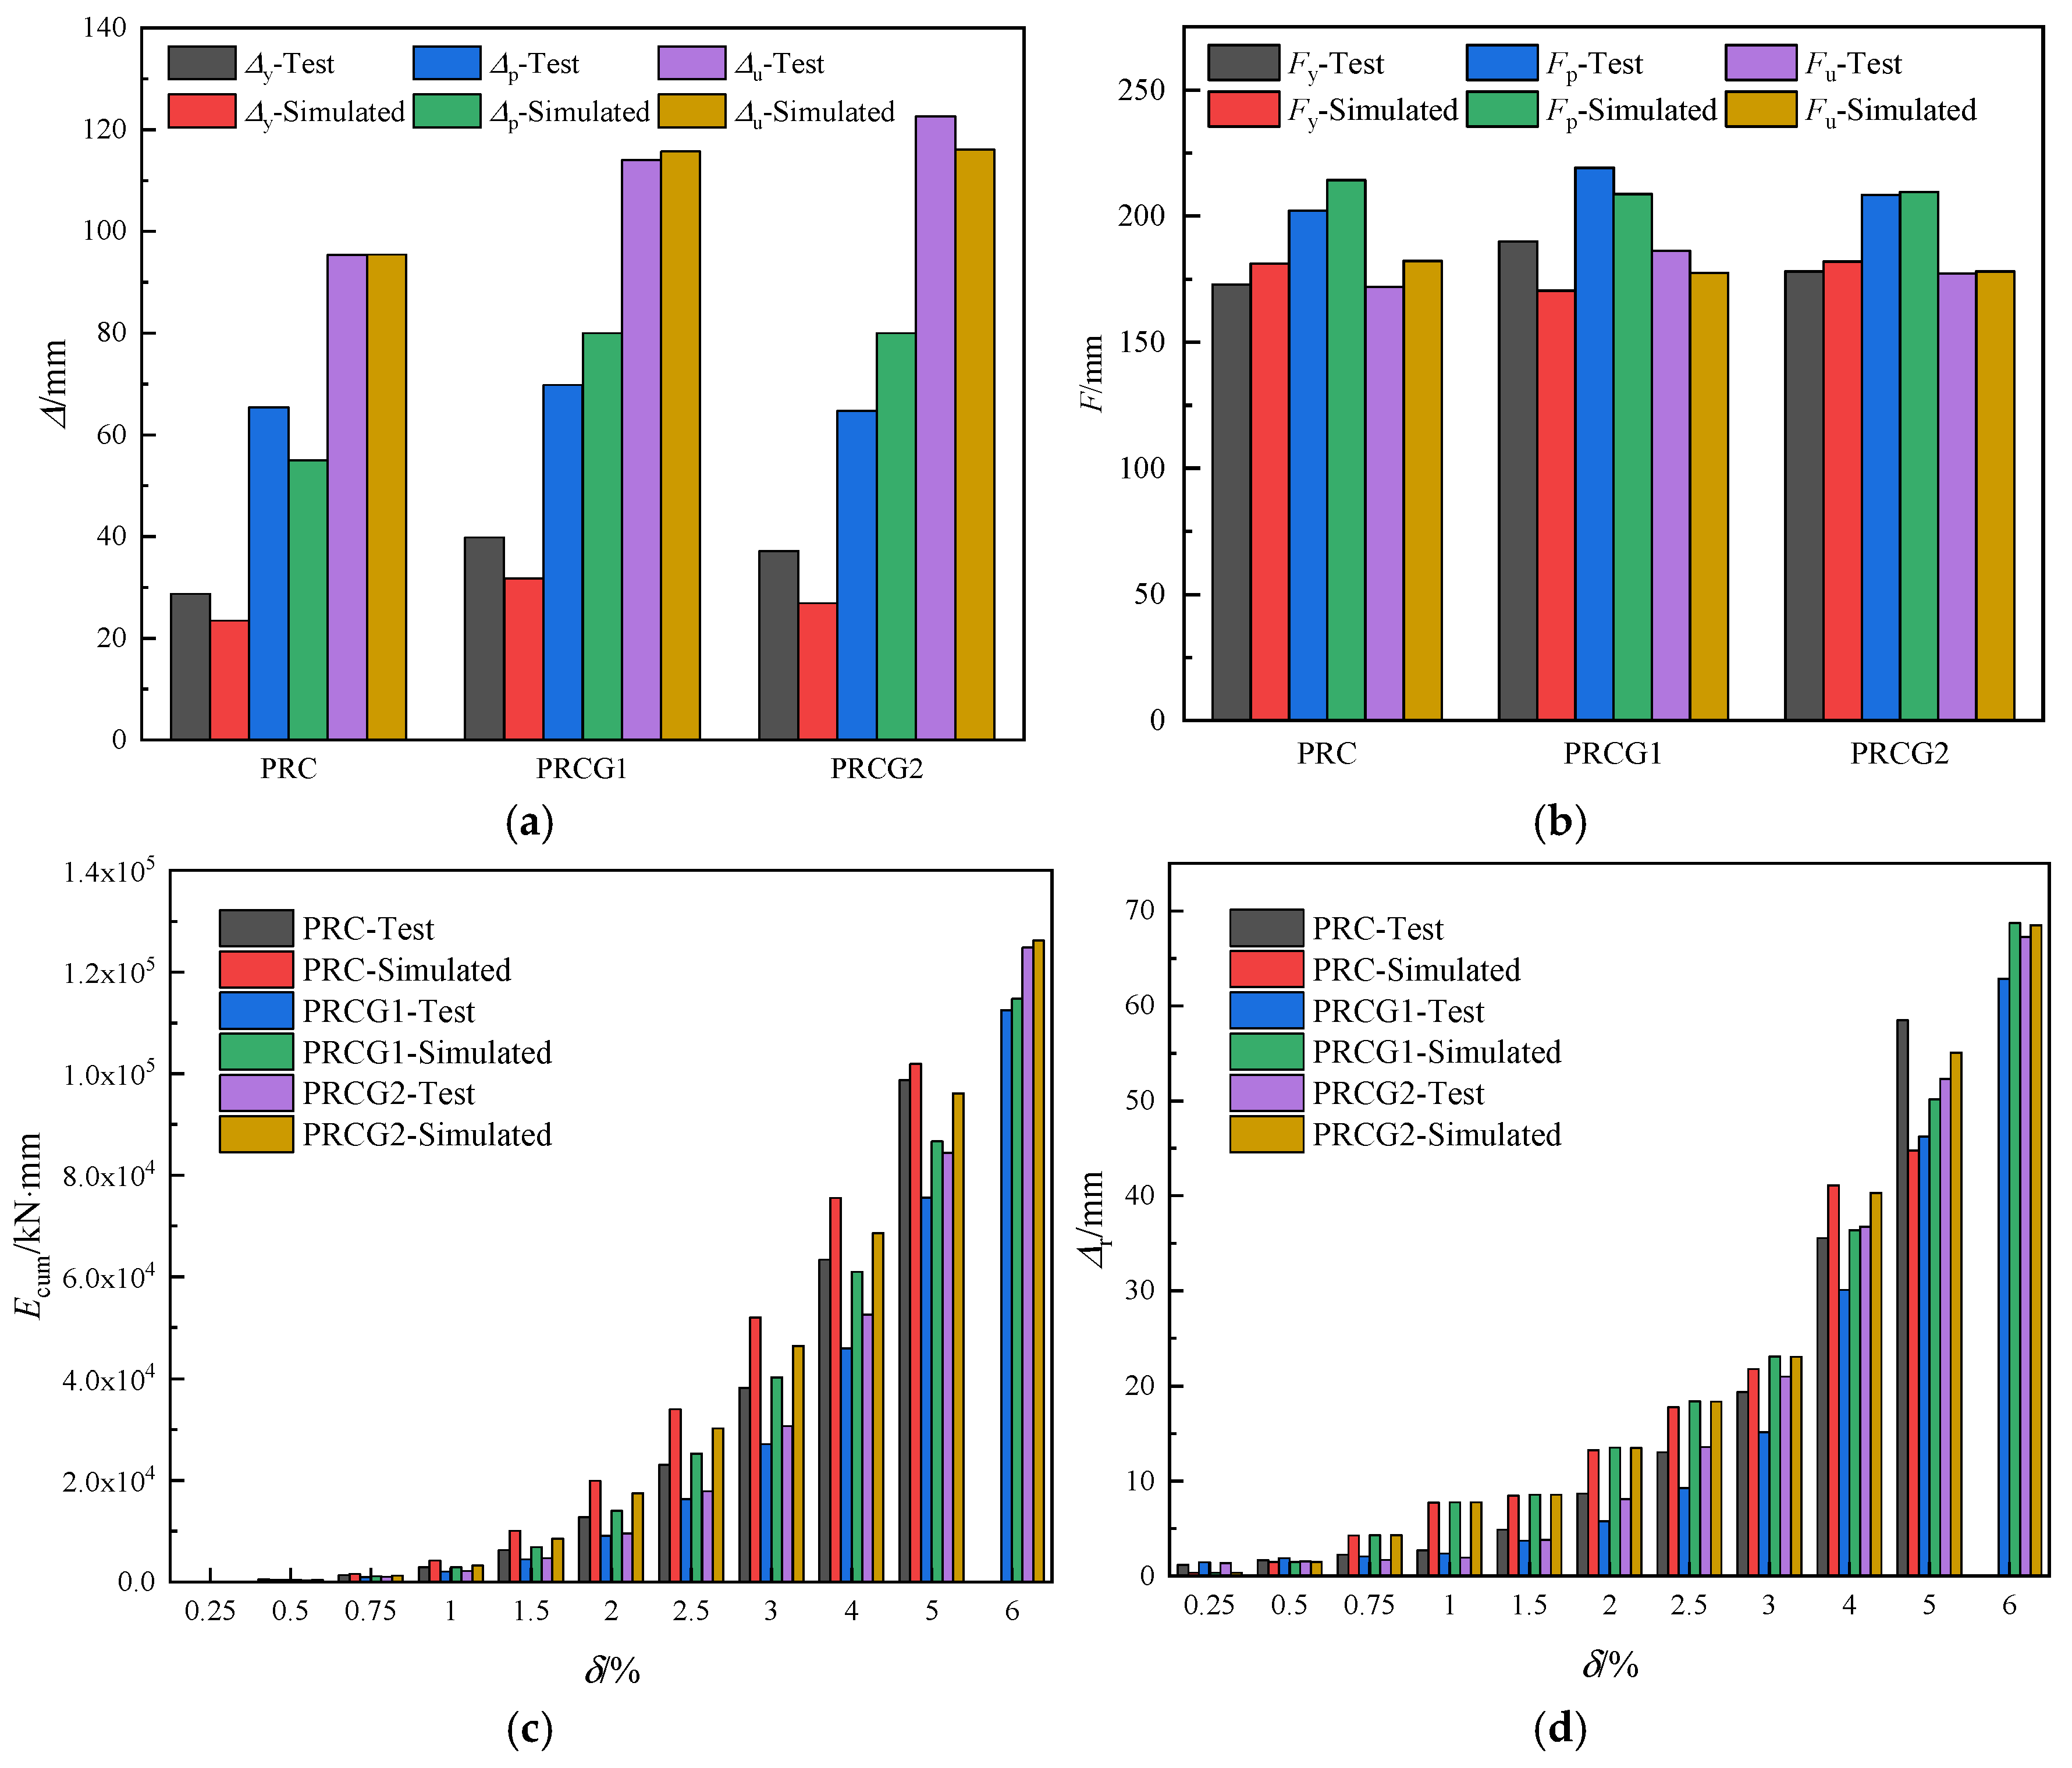
Figure 26 demonstrates that the simulated ultimate displacements (
), averaged across positive/negative loading directions, exhibit the closest agreement with experimental values, with absolute deviations ranging from −6.6 to 1.7 mm (−5.7% to 1.5% relative error). The peak displacements (
) show larger discrepancies, with simulation-experiment differences of −10.4 to 15.3 mm (−18.9% to 19.1%). In contrast, the simulated yield displacements
) are consistently lower than the experimental results (mean of three calculation methods), with absolute deviations of −10.2 to −5.3 mm (−22.5% to −38.0%). For the PRC, PRCG1, and PRCG2 specimens, the differences in yield force (
) between simulation and experiment are 8.2 kN (+4.6%), −19.5 kN (−11.4%), and 3.9 kN (+2.1%), respectively. Similarly, the discrepancies in the peak/ultimate load capacities (
/
) are 12.1 kN/10.3 kN (+5.6%), −10.4 kN/−8.8 kN (−5.0%), and 1.1 kN/0.9 kN (+0.5%).
Comparisons of the simulated versus experimental hysteretic energy dissipation () (based on the first cycle at each loading level) indicate that the numerical model accurately estimates the total . However, it overestimates the energy dissipation in intermediate loading cycles while underestimating the energy increment near failure. For specimens PRC, PRCG1, and PRCG2, the simulation-to-test discrepancy evolves as follows: from −4.9% (initial) to +37.5% (peak), then declines to +3.1%; from +5.8% to +35.3%, then declines to +1.9%; and from +13.3% to +45.3%, then declines to +1.1%, respectively. The residual displacements () in PRC simulations are overestimated by 2.1–5.6 mm (3.9–13.7% relative to the peak displacement per hysteresis loop, ) prior to failure. For PRCG1 and PRCG2, values are consistently overestimated by 2.2–9.1 mm (3.9–19.4%) and 1.3–5.8 mm (1.0–15.9%), respectively.

