Abstract
High strength and high ductility concrete (HSHDC) exhibit exceptional compressive strength (up to 90 MPa) and remarkable tensile ductility (ultimate tensile strain reaching 6%), making them highly resilient under impact loading. To elucidate the influence of strain rate and wet–dry cycling of salt spray on the dynamic compressive response of HSHDC, a series of tests was conducted using a 75 mm split Hopkinson pressure bar (SHPB) system on specimens exposed to cyclic corrosion for periods ranging from 0 to 180 days. The alternating seasonal corrosion environment was reproduced by using a programmable walk-in environmental chamber. Subsequently, both uniaxial compression and SHPB tests were employed to evaluate the post-corrosion dynamic compressive properties of HSHDC. Experimental findings reveal that corrosive exposure significantly alters both the static and dynamic compressive mechanical behavior and constitutive characteristics of HSHDC, warranting careful consideration in long-term structural integrity assessments. As corrosion duration increases, the quasi-static and dynamic compressive strengths of HSHDC exhibit an initial enhancement followed by a gradual decline, with stress reaching its peak at 120 days of corrosion under all strain rates. All specimens demonstrated pronounced strain-rate sensitivity, with the dynamic increase factor (DIF) being minimally influenced by the extent of corrosion under dynamic strain rates (112.6–272.0 s−1). Furthermore, the peak energy-consumption capacity of HSHDC was modulated by both the duration of corrosion and the applied strain rate.
1. Introduction
The durability of concrete structures is a critical determinant of the long-term serviceability of major coastal infrastructure, including bridges, harbors, and tunnels. Chloride-induced corrosion of steel reinforcement is widely recognized as the predominant mechanism responsible for the deterioration of structural performance in reinforced concrete [1,2,3]. In tidal and splash zones, governed by gravitational and meteorological forces, repeated low-frequency impacts and wet–dry cycles accelerate degradation in RC structures, including reinforcement corrosion, surface erosion, and longitudinal cracking [4,5,6]. Moreover, seawater contains high concentrations of chloride salts (e.g., NaCl, MgCl2), and Cl− ions can bind with cement hydration products to form Friedel’s salt (3CaO·Al2O3·CaCl2·10H2O), thereby compromising the integrity of the concrete matrix and reducing the service life of these concrete structures [7,8,9,10,11]. Meanwhile, these structures also face the threat of accidental ship impacts, transient, high-energy loadings resulting from navigational errors, adverse weather, or mechanical failure, that can cause catastrophic structural damage or collapse [12,13]. Dai et al. [6] conducted impact-hammer tests on reinforced concrete beams with varying corrosion levels. The results demonstrated that as the corrosion rate increased from 0% to 17.8%, the deflection of the corroded specimens increased by 50%, and significant spalling of the concrete cover occurred after impact. Tamai et al. [14] investigated the impact resistance of reinforced concrete beams subjected to accelerated corrosion under electrical current. Their findings indicated that at a corrosion level of 5.3%, the impact resistance was reduced to 59% of that of the uncorroded specimens. When the corrosion level reached 12.9%, the relative impact resistance further decreased to 15%. With the expansion of global maritime logistics, marine concrete structures are increasingly exposed to coupled degradation mechanisms involving both chloride-induced corrosion and high-rate impact loading. Enhancing the intrinsic resistance of concrete to chloride ion ingress remains one of the most practical and cost-effective strategies for mitigating reinforcement corrosion [15].
Engineered cementitious composites (ECCs), characterized by low water-to-binder ratios and dense microstructures, exhibit exceptional ductility and distributed microcrack formation [16]. These features significantly improve both the durability and impact resistance of ECC compared to conventional concrete [17,18,19]. As a result, many studies have examined ECC’s performance under marine exposure. For instance, Wang et al. [20] investigated the effect of different levels of seawater salinity on the static mechanical properties of ECC, and the results showed that seawater could reduce the porosity of the specimens, and the porosity of specimens in seawater was reduced by 5.82% compared to specimens exposed to air. Miyazato et al. [21] investigated chloride penetration in pre-cracked ECC and mortar specimens under cyclic chloride exposure (3.1% NaCl solution), finding penetration depths of 0 mm and 20 mm for ECC versus 83.2 mm and 100 mm for mortar. Similarly, Sahmaran et al. [22] demonstrated that ECC displayed enhanced chloride resistance under both immersion and salt-ponding conditions. Lee et al. [23] measured the porosity of UHPC, and the results showed that the UHPC matrix is very dense, with a porosity of 9.32%. Song et al. [24] studied the dynamic compressive performance of corroded UHPC with initial defects, and the results indicated that after 30 days of accelerated corrosion, the dynamic compressive strength of UHPC decreased by 6.9%. Beyond durability, ECC also exhibits excellent mechanical performance under impact loading. Kai et al. [25] employed a split Hopkinson pressure bar (SHPB) to test ECC at strain rates of 100–200 s−1, reporting that compressive strength, energy absorption, and ultimate strain all increased with strain rate. Chen et al. [26] further evaluated ECC with varying slag content under dynamic loading (85–185 s−1), and found that dynamic compressive strength increased significantly, while peak strain slightly declined. However, due to the low strength of ECC and issues such as low elastic modulus, it is generally only used for structural repair and reinforcement [18,27]. For example, ECC is commonly used for strengthening the tensile side of beams [28] because of its good tensile ductility and its ability to reduce spalling on the tensile side, thereby better coordinating with the reinforcement. Therefore, it is necessary to find a material that possesses both high ductility and high strength, aiming to combine high ductility with high load-bearing capacity.
Compared to ECC, high strength and high ductility concrete (HSHDC) combines low porosity, superior ductility, enhanced durability, and notably, high compressive strength [29]. HSHDC is a strain-hardening, multiple-cracking cementitious composite specifically engineered to simultaneously achieve high compressive strength and exceptional tensile ductility. HSHDC achieves strengths of 90 MPa and 8 MPa under compression testing and direct tensile testing, respectively, and an ultimate tensile strain can reach 3% [30,31]. Furthermore, HSHDC demonstrates outstanding mechanical performance under quasi-static, intermediate strain-rate, and impact-loading conditions [29,32,33,34]. This high strength enables HSHDC to perform exceptionally well under impact loading. Meanwhile, HSHDC exhibits superior resistance to chloride penetration [31,35]. Sahmaran et al. [36] measured the porosity of ECC using MIP, and the results showed that the porosity of fiber-reinforced ECC was 27.2%. Luo et al. [37] also measured the porosity of HSHDC, finding that the porosity of HSHDC at room temperature was only 9.17%, significantly lower than that of ECC. The lower porosity gives HSHDC higher mechanical performance and durability, making it potentially applicable in marine environments.
Current research mainly focuses on the corrosion of ECC, with fewer studies on high-strength ECC. At the same time, the corrosion environment is usually saltwater immersion, which does not match actual working conditions. Using salt spray wet–dry cycles can better simulate the corrosion of materials under real conditions. However, current research has predominantly focused on conventional ECC, leaving the durability performance of HSHDC underexplored. Furthermore, the durability–impact coupling observed in ECC cannot be directly extrapolated to HSHDC due to their differing material characteristics. Therefore, a systematic investigation into the effect of long-term chloride-induced corrosion on the impact resistance of HSHDC is essential for evaluating its potential in marine infrastructure applications.
To bridge this research gap, a comprehensive investigation was conducted to evaluate the quasi-static and dynamic compressive behavior of HSHDC subjected to varying durations of corrosion exposure. The salt spray wet–dry cycling system is used for corrosion specimens to better simulate real conditions. The experimental program involved uniaxial compression tests conducted at quasi-static strain rates (10−5–10−3 s−1) using an electro-hydraulic servo universal testing machine, and at dynamic strain rates (112.6–272.0 s−1) using a split Hopkinson pressure bar (SHPB). The effects of corrosion duration and strain rate on the mechanical performance of HSHDC including strength, ductility, and energy absorption were systematically analyzed. The findings offer foundational experimental insights for the structural application of HSHDC in corrosive marine environments, and are expected to provide useful data and guidance for the future design and application of HSHDC in offshore structures, aiming to enhance their dynamic load-resistance performance.
2. Experimental Programs
2.1. Raw Materials and Specimen Preparation
The mass ratio of the HSHDC matrix constituents was maintained at 1:0.186:0.311:0.014 for cementitious materials, water, fine aggregate, and superplasticizer, respectively. The cementitious phase comprised ordinary Portland cement, silica fume, and Class I fly ash. The cement employed was P·II 52.5 ordinary Portland cement (Conch brand) produced by China United Cement Group Co., Ltd., Beijing, China, with its fundamental properties summarized in Table 1. The silica fume utilized was ELKEN 940U, containing more than 40% SiO2 by weight. The fly ash incorporated was of Class I grade. The fine aggregate consisted of silica sand with a particle size ranging from 100 to 200 mesh. The superplasticizer was a polycarboxylate-based high-range water-reducing agent (4930F) produced by BASF, Germany. Tap water from Hangzhou was used for mixing. The polyethylene (PE) fiber length used in this article is 12 mm, produced by Beijing Quantum Sky New Materials Technology Co., Ltd., Beijing, China. For performance considerations, the fiber volume fraction is determined to be 2%. The material properties of PE fiber were shown in Table 2.

Table 1.
Basic properties of cement.

Table 2.
Properties of PE fibers.
The HSHDC mixing procedure is illustrated schematically in Figure 1. Initially, the cementitious materials and superplasticizer were introduced into the mixer and dry-blended for 2 min. Subsequently, fine silica sand was incorporated and mixed for 2 min to promote uniform distribution. Water was then gradually added and mixed for approximately 2 min until the slurry reached a flowable consistency. Polyethylene (PE) fibers were added incrementally in batches, followed by high-speed mixing for an additional 2 min to ensure homogeneous dispersion without visible fiber agglomeration. The fresh mixture was cast into molds in two successive layers, with each layer vibrated for approximately 10 s to eliminate air voids. After casting, the specimens were covered with plastic sheets and cured at ambient temperature for 24 h before demolding. Subsequently, all specimens underwent standard curing conditions (25 °C, 95% relative humidity) until the 28th day, after which mechanical testing was conducted. Five specimens were tested for each group under static and quasi-static loads. In the SHPB experiment, five specimens were measured in each group.

Figure 1.
Mixing procedure.
The tensile properties of HSHDC in this study have been discussed in a previous article [34]; under static conditions, the tensile strength can reach 9.1 MPa, and the tensile strain can reach 6.6%.
2.2. Aggressive Environments
As shown in Figure 2a, the cured specimens were subjected to artificial accelerated corrosion in a walk-in environmental chamber designed to replicate the splash zone conditions of a representative coastal city. According to the research of a related study [38], the concentration of the salt solution was set to 5% to better simulate an accelerated corrosion environment. Since the concentration of the saline solution varied during the experiment, the average concentration from multiple measurements, 5.76%, was used. The chamber parameters were programmed to mimic a full-year seasonal cycle, incorporating four distinct temperature–humidity regimes within each 12-day corrosion cycle. Lu et al. [38] statistically analyzed climate data from a specific bay and designed an accelerated corrosion method in the laboratory based on actual data. Accordingly, each corrosion cycle lasted 12 days, with detailed temperature and humidity changes shown in Figure 2b. HSHDC specimens were exposed to salt spray-induced wet–dry cycling for 0, 60, 120, and 180 days. The 0-day group served as the ambient-condition control group.

Figure 2.
Cyclic drying and wetting for salt-spraying test: (a) specimens under corrosion environment; (b) cyclic drying and wetting system.
2.3. Compressive Test
Static and quasi-static loading was performed using a 1000 kN Instron servo-hydraulic testing system at loading rates of 0.2, 2, and 20 mm/min, corresponding to nominal strain rates of 2.4 × 10⁻⁵ s−1, 2.4 × 10⁻⁴ s−1, and 2.4 × 10⁻³ s−1. Uniaxial compression tests were conducted on cylindrical specimens with a diameter of 70 mm and a height of 140 mm. The configuration of the uniaxial tensile test is illustrated in Figure 3. Electrical resistance strain gauges were attached to the specimens to measure their elastic modulus and Poisson’s ratio. A linear variable differential transformer (LVDT, model MA-5) was used to monitor displacement between the upper and lower platens of the testing apparatus. Axial deformation was measured using a clip-on extensometer with a 70 mm gauge length and a 5 mm deformation capacity. Compressive force was directly recorded by the testing apparatus, while tensile load and deformation were continuously captured in real time using an IMC data acquisition system during loading.

Figure 3.
Uniaxial compression test facility: (a) test setup; (b) schematic diagram of the test.
During strain measurement in uniaxial compression tests, relying solely on the displacement recorded by the LVDT between the loading platens may introduce errors due to system compliance and end-restraint effects. Conversely, exclusive reliance on the extensometer to directly measure specimen deformation may lead to inaccuracies once visible cracking occurs, as slippage and detachment from the specimen surface can take place. Therefore, a correction method proposed by Mansur [39] was adopted in this study to adjust the compressive stress–strain curves accordingly, as shown in Equation (1).
where σ is the stress of the specimen (MPa), ELV is the elastic modulus obtained from LVDT measurements (MPa), ECO is the elastic modulus obtained from the extensometer (MPa), εLV is the strain measured by the LVDT, and εc is the corrected axial compressive strain of the specimen.
Dynamic compression tests were performed using a split Hopkinson pressure bar (SHPB) apparatus. The SHPB system comprised a gas gun, striker (bullet), incident bar, transmission bar, absorption bar, damper, strain amplifier, and data acquisition system. The configuration of the SHPB apparatus is shown in Figure 4. As shown in Figure 4, the strain gauge on the incident bar was placed in the middle of the incident bar, which is 2000 mm away from the specimen, and the strain gauge on the transmission bar is 1000 mm away from the specimen. A pulse shaper was used to overcome the inherent drawbacks of strong wave oscillation in SHPB tests [40]. This consisted of brass sheets with a diameter of 25 mm and a thickness of 1 mm.

Figure 4.
Schematic diagram of the SHPB (unit: mm).
The working principle of the SHPB apparatus involves pressurizing a gas chamber to a predetermined level. Upon triggering, the compressed gas propels a striker bullet toward the incident bar. This impact generates a compressive stress wave in the incident bar, which is subsequently transmitted to the specimen, inducing dynamic compression. Different strain rates were achieved by controlling the impact pressure. In this study, impact pressures of 0.55 MPa, 0.70 MPa, and 0.85 MPa were applied. The stress, strain, and strain rate of the specimens were calculated using the two-wave method, as described in Ref. [41]. The wave signals indicating equilibrium were shown in Figure 5.
where Ab is the cross-sectional area of the incident and transmission bars; As is the cross-sectional area of the specimen; Eb is the elastic modulus of the incident and transmission bars; Cb is the stress wave velocity in the bars; and Ls is the length of the specimen.
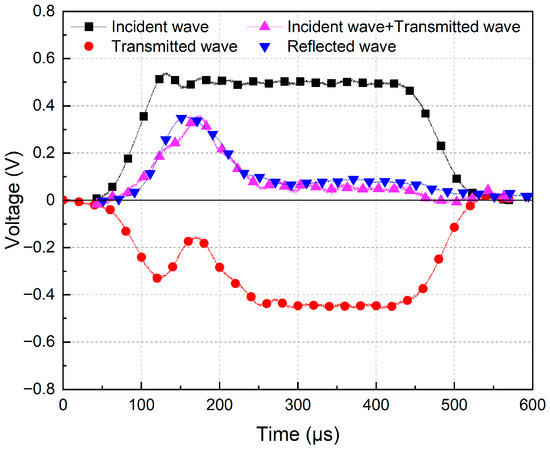
Figure 5.
Wave signals indicating equilibrium.
2.4. Microscopic Test
X-ray diffraction (XRD) patterns were recorded with a PANalytical X’Pert PRO powder diffractometer using Cu Kα radiation (λl = 0.1541 nm). The patterns were collected with a 2θ range from 10° to 80° at a step size of 0.026°. The testing method for fiber pull-out refers to previous studies [42].
3. Results and Discussions
3.1. Results from the Static and Quasi-Static Experiments
3.1.1. X-Ray Diffraction Tests
The X-ray diffraction (XRD) patterns for Friedel’s salt formed after 120 days and 180 days of corrosion exposure are shown in Figure 6; the intensity of the diffraction peaks for Friedel’s salt appears to increase over time, suggesting that the amount of Friedel’s salt formed continues to grow, especially from 120 days to 180 days. The formation of Friedel’s salt exerts pressure on the matrix, promoting the formation of microcracks and adversely affecting the material’s strength, which is consistent with the discussed mechanisms of strength reduction and microcrack evolution caused by corrosion.
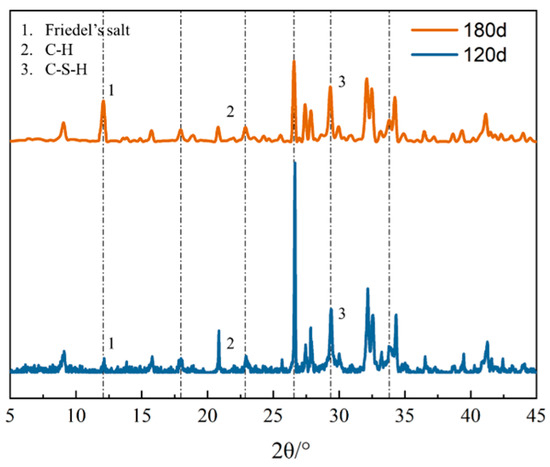
Figure 6.
XRD patterns of HSHDC under different corrosion days.
3.1.2. Stress–Strain Curve
The compressive stress–strain responses of HSHDC under various corrosion durations are presented in Figure 7. According to the stress–strain relationship, each curve can be characterized by three distinct stages, regardless of corrosion exposure time. (1) Linear stage: stress increases linearly with strain. Cracks inside the specimen have not yet developed, and the material is in the elastic stage. (2) Failure stage: the specimen’s stress reaches its peak value, and microcracks inside the specimen rapidly expand and merge, causing local damage and the bearing capacity to reach its limit. This is characterized by the appearance of visible macroscopic cracks and a rapid decrease in stress, with stress quickly dropping to about 30% of the peak stress during this stage. (3) Residual stage: stress decreases slowly during this stage, reflected by a reduction in the slope of the stress–strain curve. As strain continues to decrease, the curve tends to stabilize, reaching about 20% of the peak strength.
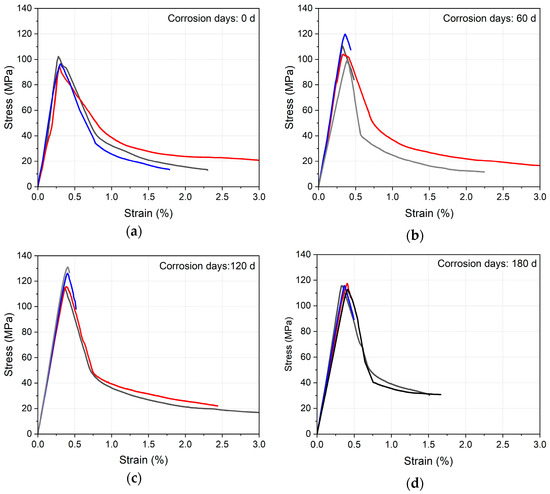
Figure 7.
Static compressive stress–strain curve: (a) 0-day corrosion; (b) 60-day corrosion; (c) 120-day corrosion; (d) 180-day corrosion. (Different colored lines represent parallel specimens).
The results of the compression test of HSHDC under various corrosion durations are shown in Figure 8. Within the strain-rate range of 2.4 × 10⁻⁴ s−1 to 2.4 × 10⁻³ s−1, the influence of strain rate on compressive behavior is relatively minor. All curves exhibit a near-ideal linear response prior to reaching 90% of the peak stress. Beyond this point, strain hardening occurs, accompanied by the initiation of microcracks. The presence of PE fibers enables crack bridging, allowing the material to sustain further stress development despite crack propagation. After reaching peak stress, the compressive stress rapidly declines and then turns into a gradual descending trend, attributed to the coalescence of multiple microcracks into a dominant macrocrack. Due to the insufficient stiffness of the testing apparatus, the rapid release of stored elastic energy at high loading rates can trigger instantaneous specimen failure. Consequently, fewer complete stress–strain profiles were recorded at higher strain rates. With increasing corrosion duration, the post-peak slopes of the curves became progressively steeper, indicating a pronounced increase in brittleness in corroded specimens compared to their uncorroded counterparts.
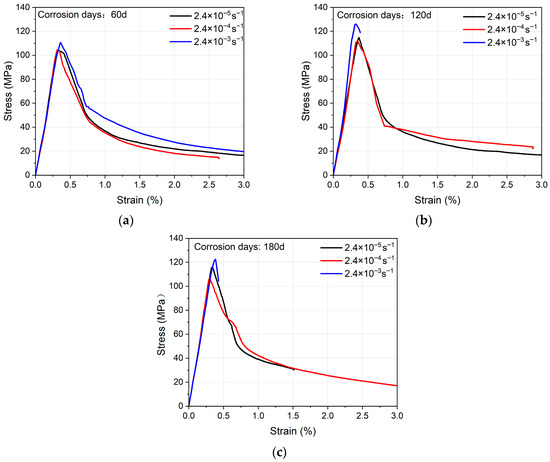
Figure 8.
Typical quasi-dynamic stress–strain curve: (a) 60-day corrosion; (b) 120-day corrosion; (c) 180-day corrosion.
3.1.3. Compressive Strength, Strain and Energy Consumption
Figure 9 shows the relationship between the different durations of salt spray wet–dry cycles and the strength, strain, and energy consumption. When the corrosion age was increased from 0 to 180 days, the strength showed an increasing and then decreasing trend. Compared to the uncorroded specimens, the strength increased by 19.7% at 120 days of corrosion. As a comparison, the change in strength at 60 days to 180 days was small, and there was a slight decrease in strength at 180 days. Meanwhile, the peak compressive strain increased with the age of corrosion, with a 21.3% increase in strain at 180 days.
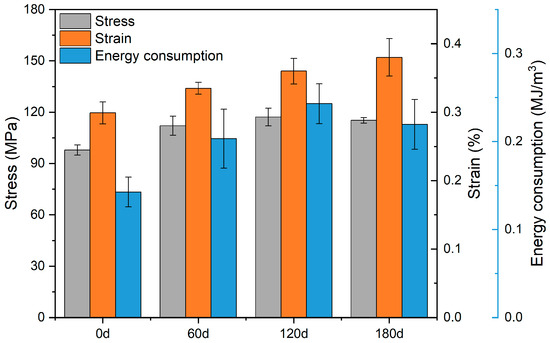
Figure 9.
Comparison of compressive strength, strain, and energy absorption under different corrosion durations.
The envelope area of the compressive stress–strain curve, from the starting point to the ultimate compressive strain, is defined as the energy consumption for each group of HSHDC specimens. A comparison of energy consumption across all groups is presented in Figure 9. The trend in energy consumption with age was generally consistent with strength, with a 69% increase in energy consumption at 120 days compared to 0 days and a 10% decrease at 180 days compared to 120 days.
The results of quasi-static are shown in Figure 10. As shown in Figure 10a, the compressive strength of HSHDC increased consistently with rising strain rate across all corrosion durations, demonstrating a pronounced strain-rate sensitivity. The strength evolution under quasi-dynamic and dynamic loading conditions followed the same trend as that observed under static loading. At a fixed strain rate, compressive strength increased between 60 and 120 days of corrosion, followed by a decrease beyond 120 days. This behavior may be attributed to accelerated hydration reactions and pore filling caused by corrosion product deposition during the initial 0–120 days of exposure. Beyond 120 days, the intrinsically low porosity of HSHDC resulted in crystallization pressure from excess corrosion products, inducing internal expansion, cracking, and subsequent mechanical degradation. As shown in Figure 10b, Within the strain-rate range of 2.4 × 10⁻⁵ s−1 to 2.4 × 10⁻³ s−1, the average peak compressive strain of HSHDC varied between 0.28% and 0.38%. Strain rate and corrosion days have a relatively small effect on strain. A mild increasing trend in peak strain was observed with rising strain rate, indicating limited but observable strain-rate sensitivity.
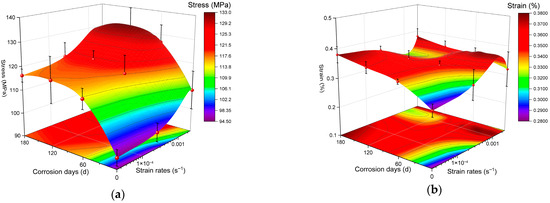
Figure 10.
Quasi-static compressive results: (a) fitting result of stress; (b) fitting result of strain.
3.1.4. Elastic Properties
In this study, the elastic modulus of the specimens was calculated in accordance with the ASTM C469 [43], which can be expressed by Equation (5).
where σ1 and σ2 denote the stress corresponding to ε1 and the stress of the 40% ultimate compressive strength, respectively; where ε1 = 5 × 10⁻⁵; ε2 denotes the axial strain corresponding to σ2. Figure 11a shows the relationship between the salt spray wet–dry cycles and the elastic modulus under different strain rates. As shown in Figure 11a, the elastic modulus does not exhibit a corresponding pattern with changes in corrosion age. At a strain rate of 2.5 × 10⁻⁵, when the corrosion age increases from 60 days to 180 days, the elastic modulus only increases by 2%. With the increase in corrosion age, the variation range of the elastic modulus with strain-rate decreases. This may be because the production of corrosion products fills the pores of the HSHDC matrix, making the matrix denser. As shown in Figure 11b, the Poisson’s ratio of HSHDC under different strain rates and corrosion ages is concentrated between 0.22 and 0.25, showing no obvious regularity.

Figure 11.
Elastic modulus and Poisson’s ratio of HSHDC: (a) elastic modulus; (b) Poisson’s ratio.
3.1.5. Single Fiber Pull-Out Test
The results of single fiber pull-out after different corrosion days are shown in Figure 12. The results indicate that corrosion has a significant impact on fiber pull-out behavior. According to the UHTCC micromechanical model, for cementitious materials to exhibit strain hardening and multiple cracking phenomena, energy criteria should be satisfied [42,44], which is shown in Figure 13. The criteria are defined by Equation (6).
where Jb’ is the residual energy corresponding to the maximum fiber bridging stress; and Jtip is the matrix crack tip toughness.
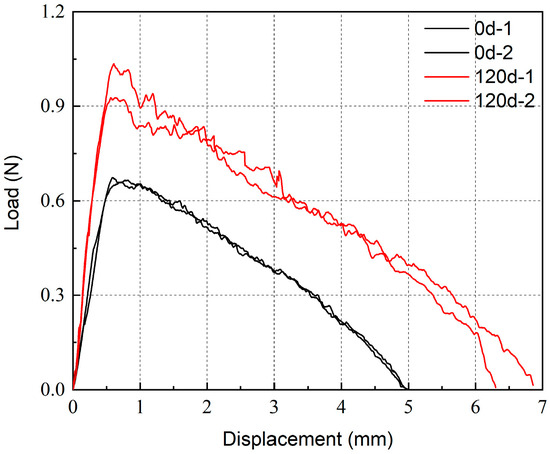
Figure 12.
The force–displacement curves of a single fiber at different corrosion days.
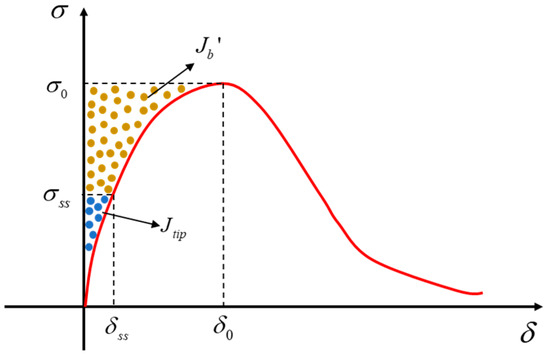
Figure 13.
Typical fiber bridging stress (σ) and the crack-opening (δ) curve.
As the number of corrosion days increases, the slope of the ascending segment of the pull-out curve increases, which means a reduction in Jb’/Jtip [42], leading to an increase in brittleness.
3.2. Results from the Dynamic Experiments
3.2.1. Stress–Strain Curve
The dynamic compressive stress–strain responses of HSHDC under varying corrosion durations are presented in Figure 14. In contrast to the quasi-static tests, complete compressive stress–strain curves were successfully captured for all specimens under dynamic loading, with strain rates ranging from 112.1 s−1 to 270.1 s−1. Both peak stress and peak strain were elevated under dynamic loading, and the strain-rate sensitivity was significantly enhanced. The stress–strain curves at all strain rates exhibited similar characteristics, consisting of a linear region, a failure phase, and a residual stage.
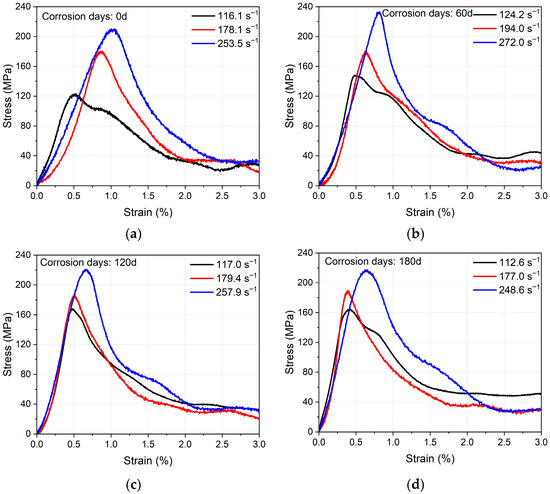
Figure 14.
Typical dynamic stress–strain curve: (a) 0-day corrosion; (b) 60-day corrosion; (c) 120-day corrosion; (d) 180-day corrosion.
At moderate strain rates (117.0 s−1 to 124.2 s−1), the stress–strain curves appeared more rounded, and their post-peak branches were smoother compared to those at higher strain rates. As the strain rate increased to 177.0 s−1–272.0 s−1, both the ascending and descending branches became markedly steeper, and the overall curve morphology began to resemble that observed under quasi-static uniaxial compression. As the corrosion duration increased from 60 to 180 days, the initial linear segments of the curves exhibited progressively steeper slopes. This trend was consistent with observations from the quasi-dynamic tests. The summary of SHPB test was shown in Table 3.

Table 3.
Summary of SHPB test.
3.2.2. Dynamic Strength and Stress
Figure 15 compares the compressive strength and ultimate strain of HSHDC specimens subjected to different corrosion durations. As shown in Figure 15a, in terms of strength, a 4.6% increase was observed from 60 to 120 days, followed by a 2% decrease from 120 to 180 days. With increasing corrosion duration, both compressive strength and strain exhibited a rise–fall trend, primarily attributed to secondary hydration reactions within the matrix.

Figure 15.
Dynamic compressive results: (a) dynamic stress; (b) dynamic strain.
In terms of strain, peak compressive strain decreased progressively with corrosion duration; this trend is more pronounced at high strain rates (177.0 s−1–272.0 s−1). As shown in Figure 15b, as the strain rate increased from 112.1 s−1 to 270.1 s−1, the ultimate compressive strain of 180d rose from 0.49% to 0.76%, representing a 55% increase and indicating strong strain-rate sensitivity. In contrast, wet–dry cyclic corrosion exhibited minimal influence on peak compressive strain.
3.2.3. Energy Consumption
The compressive energy consumption behavior of HSHDC is illustrated in Figure 16. Due to the limited availability of complete curves under quasi-dynamic conditions, energy consumption was estimated by integrating the area under the stress–strain curve from zero to peak stress. For dynamic loading, energy consumption was determined by integrating the stress–strain response over a strain range of 0 to 3%.
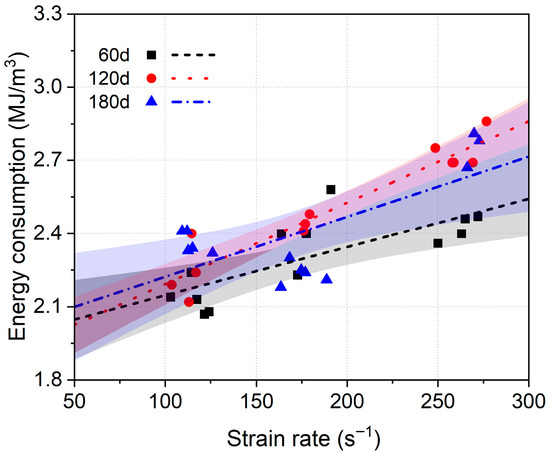
Figure 16.
Dynamic compressive energy consumption.
As shown in Figure 16, the strain energy density of HSHDC is mainly concentrated between 1.97 MJ/m3 and 2.6 MJ/m3, and shows a clear positive correlation with strain rate. Under dynamic loading conditions (strain rate from 112.1 s−1 to 270.1 s−1), the average energy consumption of 180d increased from 2.26 MJ/m3 to 2.58 MJ/m3, representing a 14% enhancement exhibiting clear strain-rate sensitivity. The effects of corrosion increase with the rise in strain rate; at a strain rate of 112.1 s−1, the energy dissipation at 60 days is 10.7% less than at 180 days, while at a strain rate of 270.1 s−1, this value is 12.3%. The influence of corrosion duration on compressive energy consumption was relatively insignificant across both quasi-static and dynamic regimes.
3.3. HSHDC Quasi-Dynamic and Dynamic Compression DIF Under Corrosion
The dynamic increase factor (DIF) is defined as the ratio of a material’s dynamic (or quasi-dynamic) response to its quasi-static counterpart, and serves as a key indicator of strain-rate sensitivity. Numerous studies [45] have demonstrated that the DIF evolution in concrete follows a bilinear relationship with the logarithm of strain rate. Prior to the transition strain rate, the DIF increases gradually and approximately linearly with increasing strain rate. Beyond the transition point, a pronounced increase in DIF is observed with further increments in strain rate.
Figure 17 presents the experimentally obtained DIF values for HSHDC in terms of compressive strength, peak strain, and energy consumption, all of which exhibit a bilinear logarithmic dependence on strain rate. Based on these observed trends, corresponding DIF models were developed for HSHDC. The DIF models for compressive strength, peak compressive strain, and energy consumption are presented in Equations (6) through (8), respectively. Figure 17a compares the existing DIF models [25,46] of HSHDC under dynamic compressive loads. The DIF of strain and energy absorption was shown in Figure 17b,c. Due to limited data, no fitting was performed for strain and energy dissipation DIF. In future research, DIF of HSHDC with a wider range of fiber content can be tested to propose a more general DIF prediction model.

Figure 17.
Dynamic DIF: (a) compressive stress DIF [25,46]; (b) compressive strain DIF; (c) Energy absorption DIF.
4. Conclusions
To investigate the dynamic compressive behavior of high-strength and high-ductility concrete (HSHDC) under corrosive conditions, uniaxial compression tests and split Hopkinson pressure bar (SHPB) test were performed across quasi-dynamic (10−5–10−3 s−1) and dynamic (112.6–272.0 s−1) strain-rate regimes, respectively. The influences of corrosion duration and strain rate on compressive strength, deformation behavior, and energy absorption capacity were analyzed, with particular emphasis on multiple cracking phenomena observed under high strain rates. The principal findings are summarized as follows:
- The quasi-static and dynamic compressive strengths of HSHDC increased and then decreased with corrosion time, with a peak at 120 days. The strength at 120 days was 1.2 times higher than the uncorroded specimens at a strain rate of 2.4 × 10⁻³. However, the effect of corrosion on peak strain and energy consumption was minimal, indicating that HSHDC maintains its energy absorption capacity even with increased corrosion.
- Peak compressive strains ranged from 0.28% to 0.38% in the quasi-dynamic range, with a slight decrease as strain rate increased. When the strain rate exceeded 102 s−1, tensile strains increased to 0.4–0.8%, showing strong sensitivity to strain rate, especially under high dynamic loading.
- All HSHDC specimens exposed to wet–dry cyclic corrosion showed strain-rate sensitivity under dynamic loading. The DIF values under dynamic strain rates (112.6–272.0 s−1) were less sensitive to corrosion time, indicating HSHDC’s resilience under dynamic loading. We also propose predictive models for DIF under different corrosion durations, which can help assess HSHDC’s long-term performance in corrosive environments.
It should be noted that the above conclusions are based on the current experimental results. To better understand the long-term performance of HSHDC under these conditions, further studies with longer exposure times are needed. In addition, although this paper explores the coupled effects of chloride salt wet–dry cycles and strain rates under laboratory conditions, field conditions are more complex. Structures in marine environments are also affected by factors such as sulfate erosion and wave scouring. Future studies considering more coupled factors or conducting experiments in actual marine environments will help provide a more comprehensive assessment of the potential of HSHDC in offshore structural applications.
Author Contributions
Conceptualization, J.Y. and S.H.; methodology, J.Y.; software, S.H.; validation, J.Y., J.L. and Q.C.; formal analysis, Q.C.; investigation, X.Y.; resources, X.Y.; data curation, X.Z.; writing—original draft preparation, J.Y.; writing—review and editing, J.L.; visualization, J.Y.; supervision, J.L.; project administration, J.L.; funding acquisition, X.Z. and J.L. All authors have read and agreed to the published version of the manuscript.
Funding
This research was funded by Key R&D Program of Zhejiang Province (No. 2024C04038), National Natural Science Foundation of China (No. 52378273) and 2025 Special Research Program for Academic Institutions of Zhejiang Province (No. 330000250130304029001).
Data Availability Statement
The original contributions presented in this study are included in the article. Further inquiries can be directed to the corresponding author.
Conflicts of Interest
Author Jie Yang was employed by the company Zhejiang Fang Yuan New Materials Co., Ltd. The remaining authors declare that the research was conducted in the absence of any commercial or financial relationships that could be construed as a potential conflict of interest.
References
- Hartt, W.H. Service Life Projection for Chloride-Exposed Concrete Reinforced with Black and Corrosion-Resistant Bars. Corrosion 2012, 68, 754–761. [Google Scholar] [CrossRef]
- Xia, M.Y.; Guo, R.; Lin, Q.S.; Yu, Z.X. Prediction model for the bond behaviour of low-corrosion reinforced concrete considering corrosion time variability. Constr. Build. Mater. 2024, 444, 137891. [Google Scholar] [CrossRef]
- Angst, U.M. Steel corrosion in concrete-Achilles’ heel for sustainable concrete? Cem. Concr. Res. 2023, 172, 107239. [Google Scholar] [CrossRef]
- Gao, D.; Liu, F.F.; Lin, M.X.; Zhao, T.X.; Zhang, J.G.; He, G.L. The impact performance of concrete-filled double-skin steel tubes under seawater corrosion: A review. Appl. Ocean Res. 2024, 153, 104248. [Google Scholar] [CrossRef]
- Dong, W.Y.; Fang, C.Q.; Yang, S. Influence of lateral impact on reinforced concrete piers under drying-wetting cycle and chloride ion corrosion environment. Bridge Struct. 2021, 17, 51–64. [Google Scholar] [CrossRef]
- Dai, M.J.; Yang, O.; Xiao, Y.; Li, F.C. Influence of longitudinal bar corrosion on impact behavior of RC beams. Mater. Struct. 2016, 49, 3579–3589. [Google Scholar] [CrossRef]
- Talero, R.; Trusilewicz, L.; Delgado, A.; Pedrajas, C.; Lannegrand, R.; Rahhal, V.; Mejía, R.; Delvasto, S.; Ramírez, F.A. Comparative and semi-quantitative XRD analysis of Friedel’s salt originating from pozzolan and Portland cement. Constr. Build. Mater. 2011, 25, 2370–2380. [Google Scholar] [CrossRef]
- Thomas, M.D.A.; Hooton, R.D.; Scott, A.; Zibara, H. The effect of supplementary cementitious materials on chloride binding in hardened cement paste. Cem. Concr. Res. 2012, 42, 1–7. [Google Scholar] [CrossRef]
- Li, H.; Farzadnia, N.; Shi, C. The role of seawater in interaction of slag and silica fume with cement in low water-to-binder ratio pastes at the early age of hydration. Constr. Build. Mater. 2018, 185, 508–518. [Google Scholar] [CrossRef]
- Xu, S.S.; Li, W.; Wang, X.Z.; Zhang, H.Z.; Liu, J.; Jiang, H.; Wang, X.B.; Ma, H.K.; Shi, J.; Yu, Z.Y.; et al. The Mechanical Properties and Durability of the PE-BFRP Hybrid-Fiber-Engineered Cementitious Composite (ECC). Buildings 2025, 15, 1860. [Google Scholar] [CrossRef]
- Yin, S.P.; Jing, L.; Yin, M.T.; Wang, B. Mechanical properties of textile reinforced concrete under chloride wet-dry and freeze-thaw cycle environments. Cem. Concr. Compos. 2019, 96, 118–127. [Google Scholar] [CrossRef]
- Zhang, W.Z.; Pan, J.; Sanchez, J.C.; Li, X.B.; Xu, M.C. Review on the protective technologies of bridge against vessel collision. Thin-Walled Struct. 2024, 201, 112013. [Google Scholar] [CrossRef]
- Fu, T.; Zhu, Z.; Li, Y.; Sun, Y.; Meng, L. Study on the Time-dependent Reliability of Corroded Reinforced Concrete Bridge Structures due to Ship Impact. Adv. Civ. Eng. 2022, 2022, 8190297. [Google Scholar] [CrossRef]
- Tamai, H.; Sonoda, Y.; Bolander, J.E. Impact resistance of RC beams with reinforcement corrosion: Experimental observations. Constr. Build. Mater. 2020, 263, 120638. [Google Scholar] [CrossRef]
- Shumuye, E.D.; Li, W.; Liu, J.; Wang, Z.; Yu, J.; Wu, H. Self-healing recovery and micro-structural properties of slag/fly-ash based engineered cementitious composites under chloride environment and tidal exposure. Cem. Concr. Compos. 2022, 134, 104789. [Google Scholar] [CrossRef]
- Li, H.D.; Qiu, X.Y.; Qiu, Y.F.; Liu, H.Y.; Pan, Y.F. The investigation on mechanical properties of ultra-high toughness cementitious composite using orthogonal experiment. J. Reinf. Plast. Compos. 2025, 44, 204–216. [Google Scholar] [CrossRef]
- Zhang, Z.; Zhang, Q. Self-healing ability of Engineered Cementitious Composites (ECC) under different exposure environments. Constr. Build. Mater. 2017, 156, 142–151. [Google Scholar] [CrossRef]
- Wu, J.H. Impact Performance of RC Beams Reinforced by Engineered Cementitious Composite. Buildings 2023, 13, 1688. [Google Scholar] [CrossRef]
- Zhong, R.; Zhang, F.L.; Poh, L.H.; Wang, S.S.; Le, H.T.N.; Zhang, M.H. Assessing the effectiveness of UHPFRC, FRHSC and ECC against high velocity projectile impact. Cem. Concr. Compos. 2021, 120, 104013. [Google Scholar] [CrossRef]
- Wang, W.R.; Xu, S.L.; Li, Q.H.; Dong, S.L. Long-term performance of fiber reinforced cementitious composites with high ductility under seawater attack with different salinities. Constr. Build. Mater. 2022, 317, 126164. [Google Scholar] [CrossRef]
- Miyazato, S.; Hiraishi, Y. Transport properties and steel corrosion in ductile fibre reinforced cement composites. In Proceedings of the Eleventh International Conference on Fracture (ICF11), Turin, Italy, 20–25 March 2005. [Google Scholar]
- Sahmaran, M.; Li, M.; Li, V.C. Transport properties of engineered cementitious composites under chloride exposure. Aci Mater. J. 2007, 104, 604–611. [Google Scholar]
- Lee, N.K.; Koh, K.T.; Kim, M.O.; Ryu, G.S. Uncovering the role of micro silica in hydration of ultra-high performance concrete (UHPC). Cem. Concr. Res. 2018, 104, 68–79. [Google Scholar] [CrossRef]
- Song, Z.; Li, S.; Cheng, L.; Yu, Q. Investigation of the dynamic mechanical response of corroded ultra-high performance fiber reinforced concrete (UHPFRC) with initial defects. Cem. Concr. Compos. 2024, 154, 105780. [Google Scholar] [CrossRef]
- Kai, M.F.; Xiao, Y.; Shuai, X.L.; Ye, G. Compressive Behavior of Engineered Cementitious Composites under High Strain-Rate Loading. J. Mater. Civ. Eng. 2016, 29, 04016254. [Google Scholar] [CrossRef]
- Chen, Z.; Yang, Y.; Yao, Y. Quasi-static and dynamic compressive mechanical properties of engineered cementitious composite incorporating ground granulated blast furnace slag. Mater. Des. 2013, 44, 500–508. [Google Scholar] [CrossRef]
- Ghalehnoei, M.S.; Javanmardi, A.; Izadifar, M.; Ukrainczyk, N.; Koenders, E. Finite Element Analysis of Shear Reinforcing of Reinforced Concrete Beams with Carbon Fiber Reinforced Polymer Grid-Strengthened Engineering Cementitious Composite. Buildings 2023, 13, 1034. [Google Scholar] [CrossRef]
- Zhang, J.F.; Zhang, X.W.; Wu, J.L.; Wu, F.W. Residual load-carrying performance of ECC-RC composite beam after drop hammer impact. Constr. Build. Mater. 2024, 440, 137368. [Google Scholar] [CrossRef]
- Ali, S.H.; Abid, S.R.; Al-Lami, K.; Calabrese, A.S.; Yosri, A.M.; Al-Ghasham, T.S. Experimental and Statistical Analysis of Repeated Impact Records of Hybrid Fiber-Reinforced High-Performance Concrete. Buildings 2023, 13, 678. [Google Scholar] [CrossRef]
- Su, J.-Y.; Chen, G.; Pan, H.-S.; Lin, J.-X.; Zhang, J.; Zhuo, K.-X.; Chen, Z.-B.; Guo, Y.-C. Rubber modified high strength-high ductility concrete: Effect of rubber replacement ratio and fiber length. Constr. Build. Mater. 2023, 404, 133243. [Google Scholar] [CrossRef]
- Yang, J.S.; Deng, M.K.; Wang, Y.T.; Zhang, Y.X. Uniaxial tensile test of high-strength high-ductility concrete (HSHDC): Mechanical response and toughness evaluation. J. Build. Eng. 2024, 89, 109332. [Google Scholar] [CrossRef]
- Ranade, R.; Li, V.C.; Heard, W.F.; Williams, B.A. Impact resistance of high strength-high ductility concrete. Cem. Concr. Res. 2017, 98, 24–35. [Google Scholar] [CrossRef]
- Kim, M.J.; Choi, H.J.; Shin, W.; Oh, T.; Yoo, D.Y. Development of impact resistant high-strength strain-hardening cementitious composites (HS-SHCC) superior to reactive powder concrete (RPC) under flexure. J. Build. Eng. 2021, 44, 102652. [Google Scholar] [CrossRef]
- Liu, J.T.; Wang, W.S.; Dai, X.S.; Yu, X.Y.; Kong, D.Y.; Zhao, X.; Zhou, F. Influence of polyethylene fiber parameters on the mechanical properties of high-strength high-ductility concrete: An experimental study and constitutive model. J. Build. Eng. 2024, 88, 109128. [Google Scholar] [CrossRef]
- Ranade, R.; Li, V.C.; Stults, M.D.; Rushing, T.S.; Roth, J.; Heard, W.F. Micromechanics of High-Strength, High-Ductility Concrete. ACI Mater. J. 2013, 110, 375–384. [Google Scholar]
- Şahmaran, M.; Özbay, E.; Yücel, H.E.; Lachemi, M.; Li, V.C. Effect of Fly Ash and PVA Fiber on Microstructural Damage and Residual Properties of Engineered Cementitious Composites Exposed to High Temperatures. J. Mater. Civ. Eng. 2011, 23, 1735–1745. [Google Scholar] [CrossRef]
- Luo, J.; Cai, Z.; Yu, K.; Zhu, W.; Lu, Z. Temperature impact on the micro-structures and mechanical properties of high-strength engineered cementitious composites. Constr. Build. Mater. 2019, 226, 686–698. [Google Scholar] [CrossRef]
- Lu, Z.-Y.; Jin, W.-L.; Wang, H.-L.; Jin, L.-Y.; Yan, Y.-Y. Similar design on accelerated test of artificial climate simulation. J. Zhejiang Univ. (China) 2009, 43, 1071–1076. [Google Scholar] [CrossRef]
- Lee, H.P.; Awang, A.Z.; Omar, W.; Tiong, P.L.Y. Derivation of Complete Stress-Strain Curve for SSTT-Confined High-Strength Concrete in Compression. J. Test. Eval. 2018, 46, 168–177. [Google Scholar] [CrossRef]
- Ye, H.; He, Q.; Pan, J.; Zhu, B. Dynamic compressive properties and constitutive model of waste crumb rubber (CR) modified ultra-high performance engineered cementitious composites (UHP-ECC). J. Build. Eng. 2024, 98, 111453. [Google Scholar] [CrossRef]
- Kolsky, H. An Investigation of the Mechanical Properties of Materials at very High Rates of Loading. Proc. Phys. Soc. Sect. B 1949, 62, 676–700. [Google Scholar] [CrossRef]
- Liu, J.; Zheng, L.; Jin, X.; Zhao, X.; Kong, D.; Fu, L.; Wang, B. Water saturation effect on the dynamic tensile behavior of high ductility concrete. Compos. Part B Eng. 2025, 296, 112219. [Google Scholar] [CrossRef]
- ASTM C469/C469M-14; Standard test method for static modulus of elasticity and Poisson’s ratio of concrete in compression. ASTM International: West Conshohocken, PA, USA, 2014.
- Ding, Y.; Yu, K.Q.; Li, M. A review on high-strength engineered cementitious composites (HS-ECC): Design, mechanical property and structural application. Structures 2022, 35, 903–921. [Google Scholar] [CrossRef]
- Fan, H.T.; Yu, H.F.; Ma, H.Y. Dynamic increase factor(DIF) of concrete with SHPB tests: Review and systematic analysis. J. Build. Eng. 2023, 79, 107666. [Google Scholar] [CrossRef]
- Wang, S.Y.; Lin, C.L.; Tai, C.W.; Lu, Y.Y. Experimental study on dynamic compressive properties of early strength seawater and sea-sand ECC. J. Build. Eng. 2025, 108, 112817. [Google Scholar] [CrossRef]
Disclaimer/Publisher’s Note: The statements, opinions and data contained in all publications are solely those of the individual author(s) and contributor(s) and not of MDPI and/or the editor(s). MDPI and/or the editor(s) disclaim responsibility for any injury to people or property resulting from any ideas, methods, instructions or products referred to in the content. |
© 2025 by the authors. Licensee MDPI, Basel, Switzerland. This article is an open access article distributed under the terms and conditions of the Creative Commons Attribution (CC BY) license (https://creativecommons.org/licenses/by/4.0/).