4.2. Prerequisite: Transportation Performance
Prerequisite LT: Transportation performance requires a one-week survey of building occupant traffic flows once a year. This measure is the project’s average CO
2 emissions per trip per occupant, which is then translated into a transportation score and ultimately LEED points. This LEED-EB performance presents CO
2 emission values for each transport mode: from 0.26, 0.33, 0.39, 0.44, 0.68, and 0.93 CO
2 pounds/mile for motorcycle, heavy rail, carpool, alternative fuel vehicles, bus, and car, respectively [
8]. Depending on the distance traveled and the mode of transport, CO
2 emissions per occupant are estimated. Then, taking into account the number of occupants of the building, the average CO
2 emissions for the project are calculated. The final transport score is obtained using the transport efficiency function. This score is ultimately converted into LEED-EB points. Thus, a more sustainable mode of transport and a shorter traffic flow result in more LEED points.
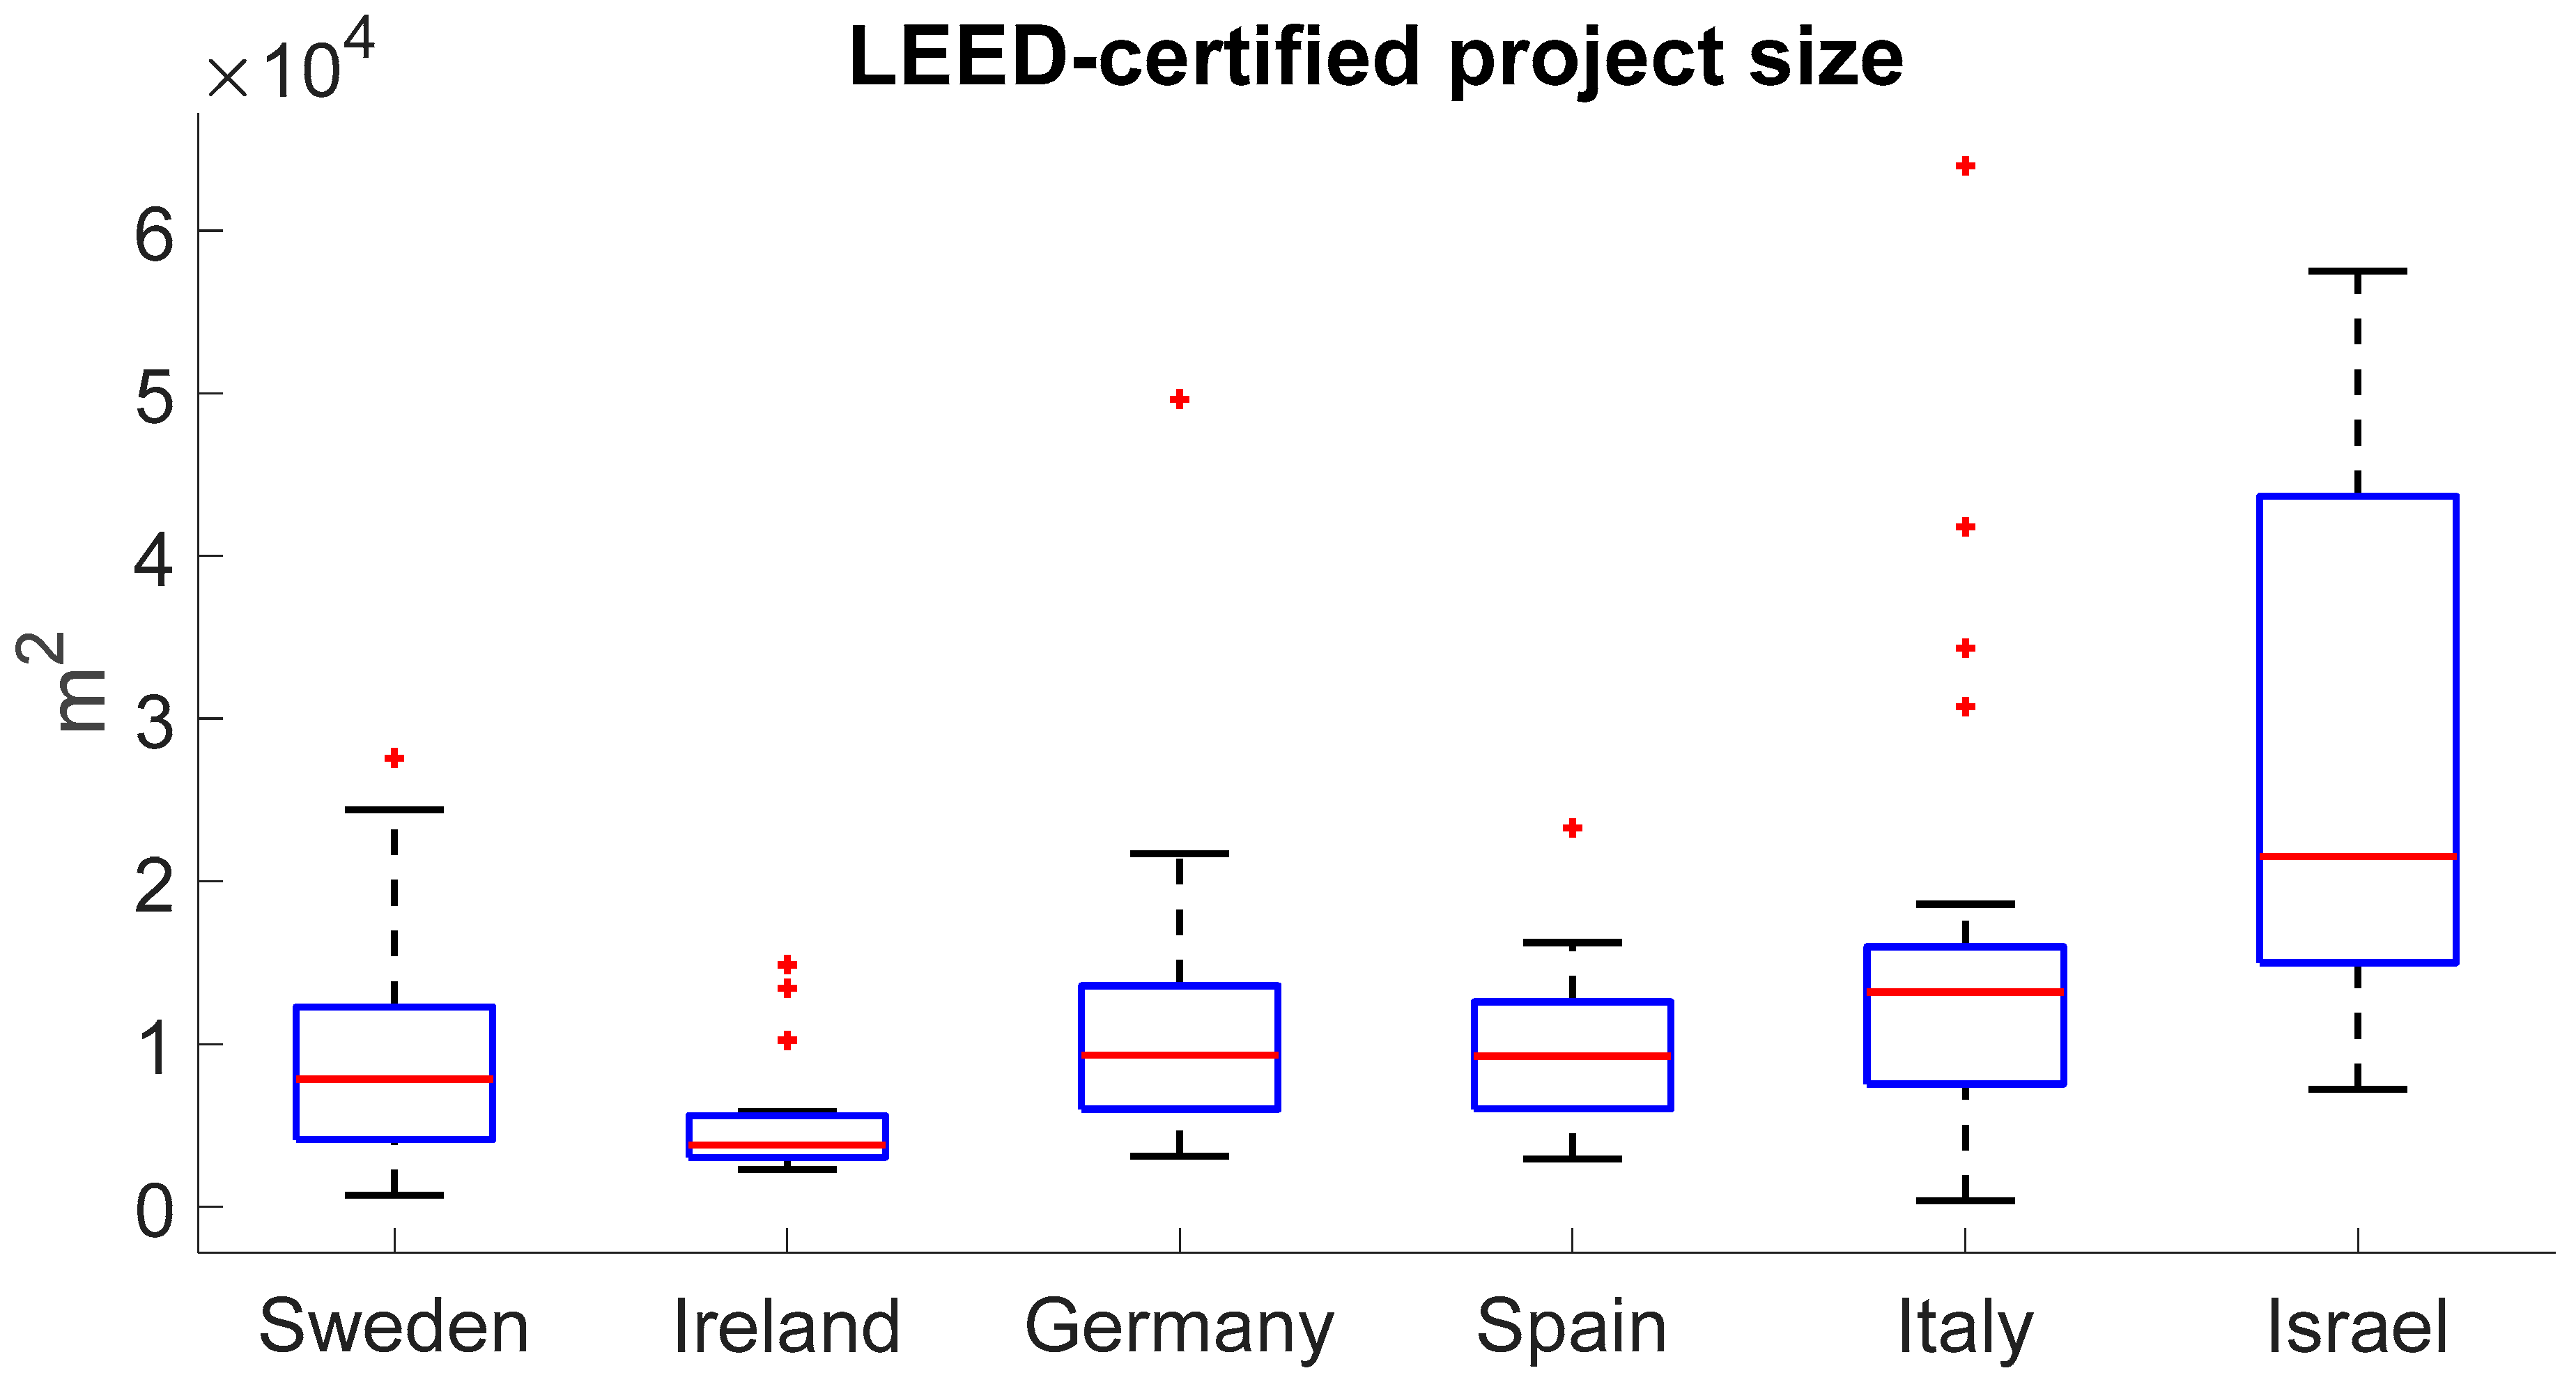
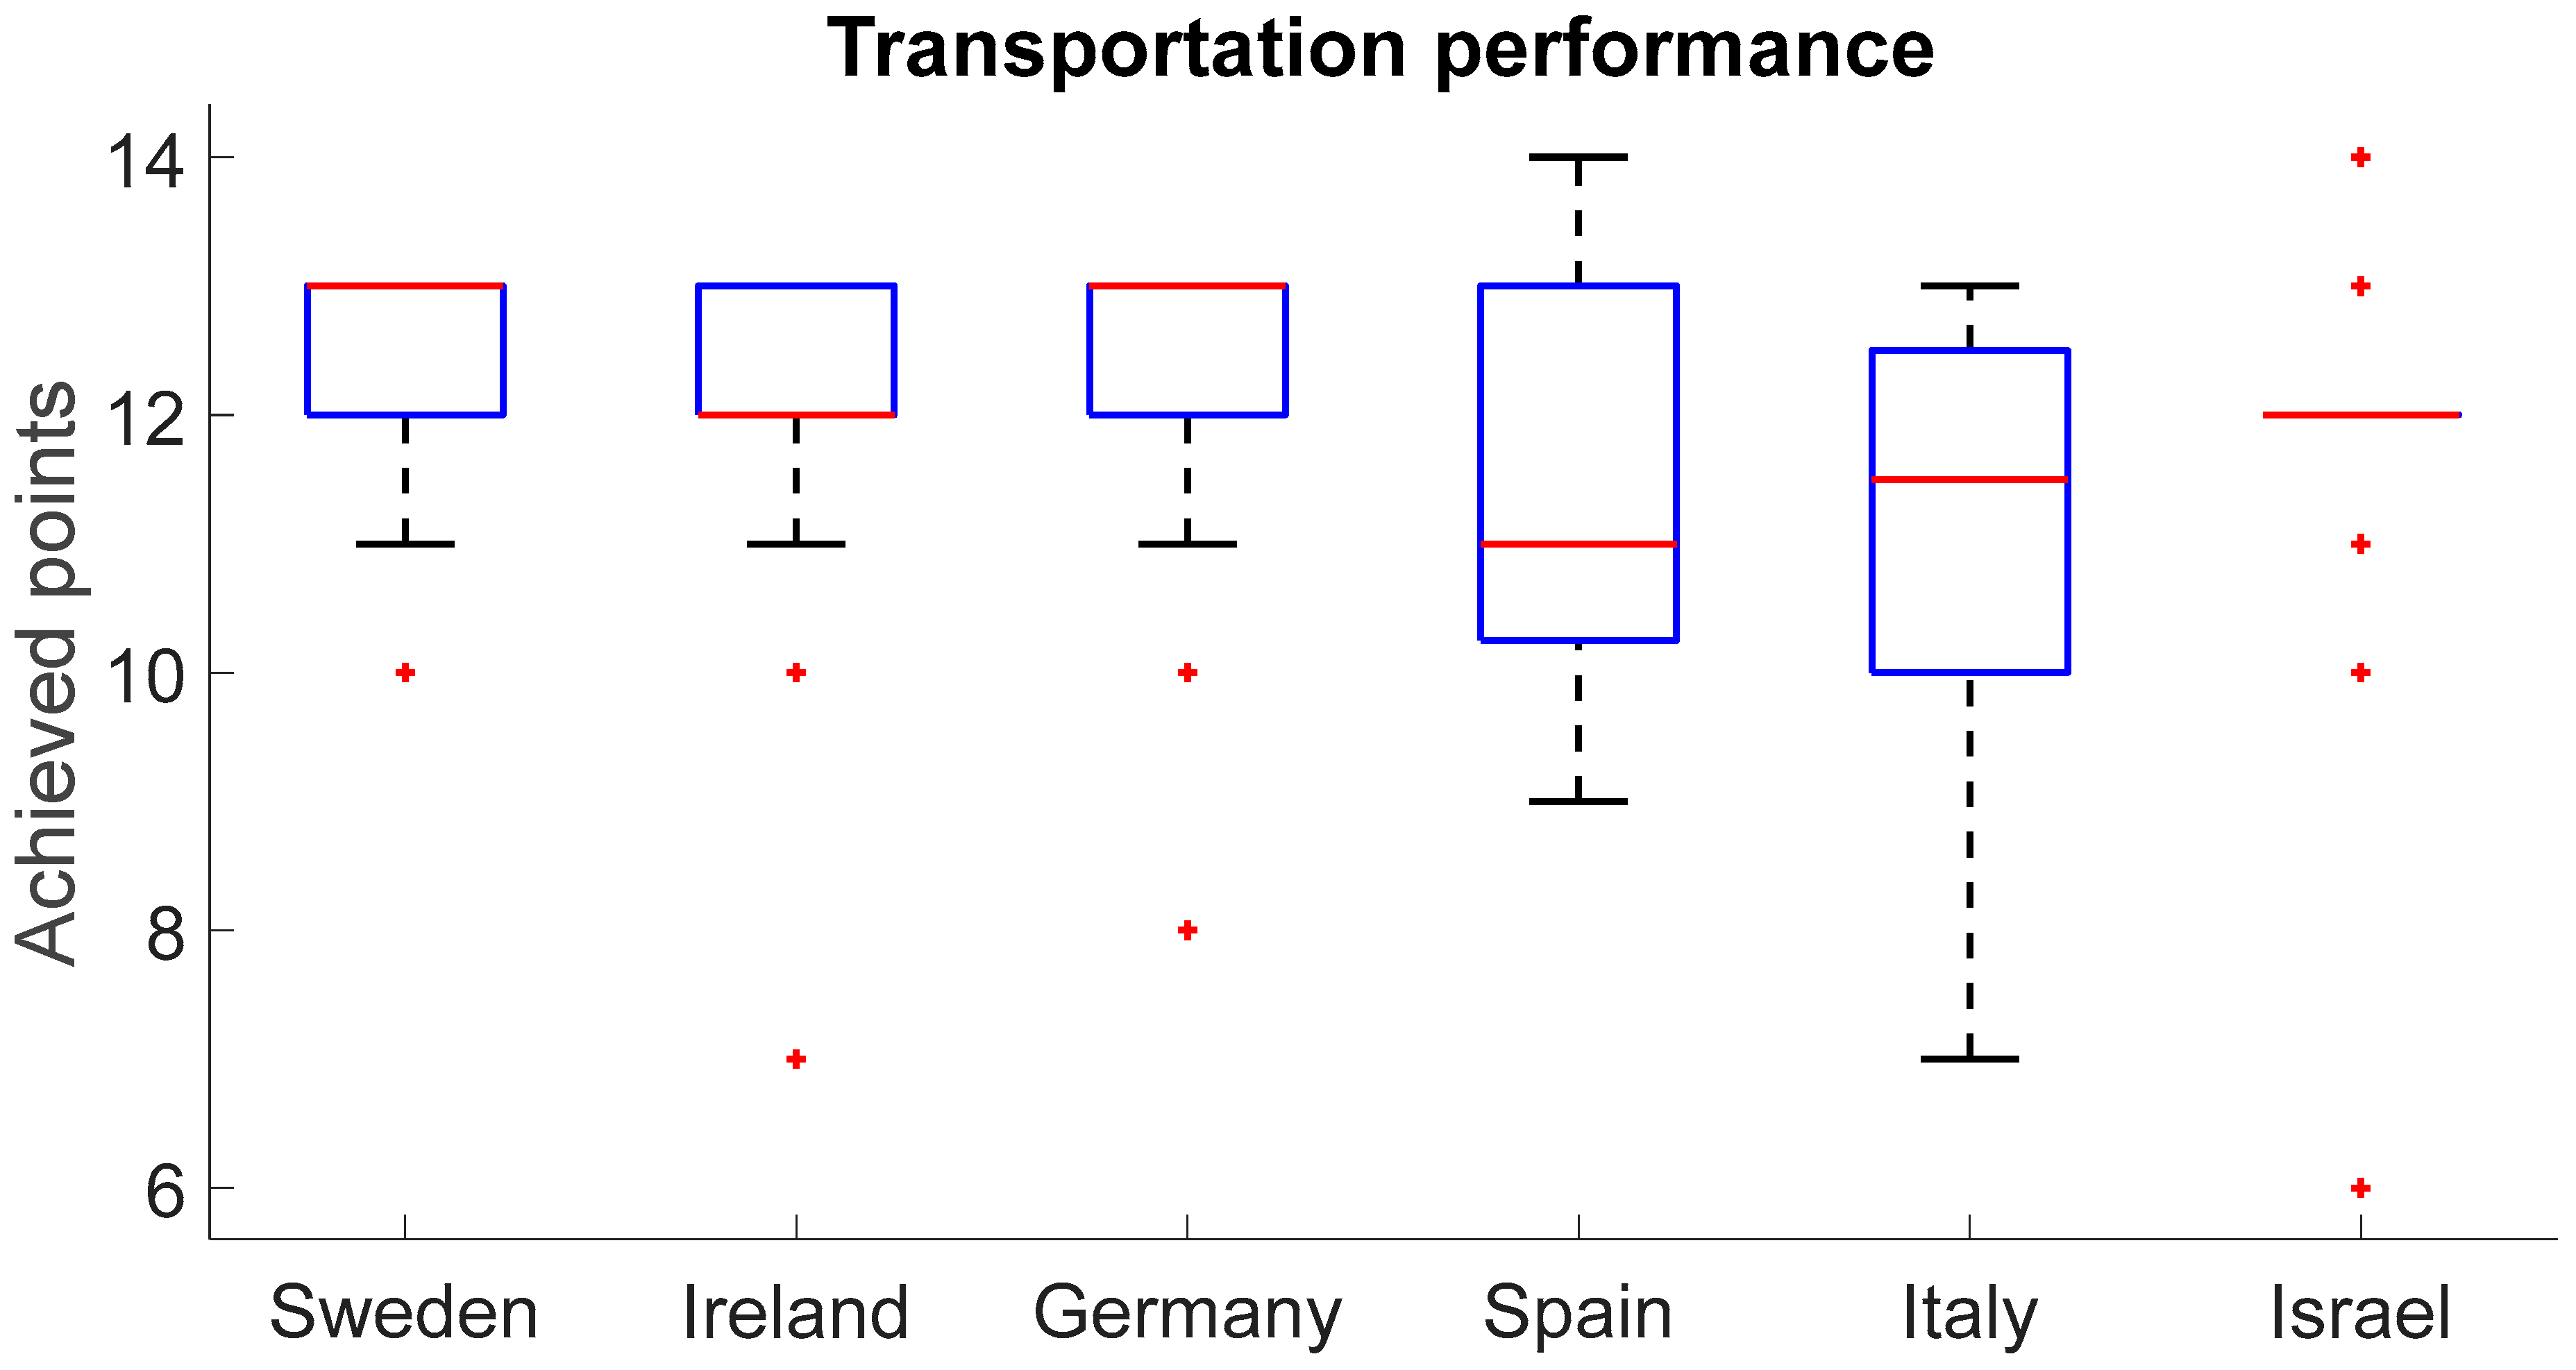
Figure 3 shows that Sweden and Germany have the highest median score (13 points), followed by Ireland and Israel (12 points), and then Italy (11.5 points) and Spain (11 points). However, only Israel has similar scores for the median and 25–75th percentiles. It can be assumed that this focus on equally high transport performance for almost all Israeli projects is probably due to the large size of the LEED-EB v4.1 project relative to other countries, as shown in
Figure 2. This is because large buildings are usually located in densely populated areas with well-developed public transport infrastructure.
In this respect,
Table 9 shows that, for this prerequisite, Sweden and Germany outperformed Italy (the difference appears to be positive;
p = 0.002 and 0.018, respectively). The difference between the remaining 13 pairwise comparisons appears to be negative (
p ≥ 0.070).
The highest number of projects were certified in large cities such as in Spain: Barcelona (10 projects) and Madrid (10 projects), Italy: Milano (19 projects); Germany: Berlin (12 projects) and Hamburg (6 projects); Sweden: Gothenburg (10 projects) and Stockholm (8 projects); Ireland: Dublin (15 projects); and Israel: Tel Aviv (8 projects). A complete list of cities where projects have been certified to LEED-EB is provided in
Table A1 in
Appendix A. All these cities have well-developed public transportation systems [
44]. Therefore, as mentioned earlier, the median LEED scores were near the maximum (11.0–13.0) in all these countries.
The results of previous studies support the findings of this prerequisite. According to Dolge [
44], among 28 European countries, the share of public transport, as well as the share of alternative fuel vehicles such as electric vehicles, in total passenger transport is much higher in Sweden, Ireland, and Germany than in Spain and Italy. Mandev and Sprei [
45] measured the share of electrified kilometers of plug-in hybrid electric vehicles in total passenger turnover in 10 European countries and found that it was higher in Sweden, Germany, and Spain than in Italy.
4.3. Prerequisite WE: Water Performance
Prerequisite WE: Water performance requires a monthly measurement of total potable water consumption for one full year. Based on these data, it is necessary to calculate the water consumption in the project per resident and per unit area. The daily water consumption per occupant and the daily water consumption per unit of floor area of the building are calculated. Then, using these consumptions in combination with a function developed by LEED-EB based on water consumption data for high-performance buildings, a water score is determined. Ultimately, the water score is converted into LEED-EB points [
8].
Figure 4 shows the results of the water performance analysis for six countries, presented as a boxplot. The median was highest in Germany (12 points), followed by Sweden and Ireland (11 points), Spain and Israel (10 points), and Italy (9 points). The narrowest range (25–75th percentile) was observed in Ireland, while the other five countries had a fairly wide range.
In this respect,
Table 10 shows that, for this prerequisite, Ireland and Germany outperformed Italy and Israel (the difference appears to be positive,
p = 0.015 and 0.032 and
p = 0.003 and 0.009, for Ireland and Germany, respectively). Germany also outperformed Spain (the difference appears to be positive,
p = 0.028). The judgment is suspended regarding the difference between Sweden and Germany and between Sweden and Italy (
p = 0.051 and 0.062, respectively). The difference between the remaining eight pairwise comparisons appears to be negative (
p ≥ 0.146).
As noted earlier, for all of these countries, the median LEED-EB water performance was not that close to the maximum of 15 points: 11.0 or 12.0 for Sweden, Ireland, and Germany, and 9.0 or 10.0 for Spain, Italy, and Israel. In Sweden, half of the drinking water comes from surface water and the other half from natural groundwater. However, according to interviews with local municipalities in Sweden, citizens are not aware of or interested in saving drinking water [
46]. In Ireland, given the droughts, the need for water conservation measures is a major issue requiring public awareness [
47]. In Germany, although rainwater and greywater treatment can improve water availability in urban areas, water conservation remains an important issue [
48]. Thus, higher median LEED-EB water performance in Sweden, Ireland, and Germany would be more desirable.
Spain, Italy, and Israel are Mediterranean countries. The region is characterized by moderate climate change, accelerated population growth, and increasing natural water scarcity. Therefore, despite the advanced water purification technologies such as desalination used in the region, especially in Israel, water conservation still remains a very important factor [
49]. However, according to the results, the median LEED-EB water performance in these countries was only 9.0 or 10.0 out of a possible 15.
Thus, LEED consultants and policymakers in Spain, Italy, and Israel should be aware of the low water savings in their LEED-certified buildings and be motivated to encourage communities to conserve drinking water.
4.4. Prerequisite EA: Energy Performance
Prerequisite EA: Energy performance requires monthly measurement of the total energy consumption of the project for one full year. The measured energy consumption is then converted into equivalent project greenhouse gas (GHG) emissions and source energy consumption per occupant and per unit area. After that, GHG emissions are converted into a GHG emissions score, and source energy consumption is converted into a source energy score. This conversion uses US Environmental Protection Agency regional grid factors for projects in the US and national grid factors from the International Energy Agency’s CO
2 Emissions Report for other countries. Ultimately, the sum of the 50% GHG emission score and 50% energy source score determines the LEED-EB energy performance [
8].
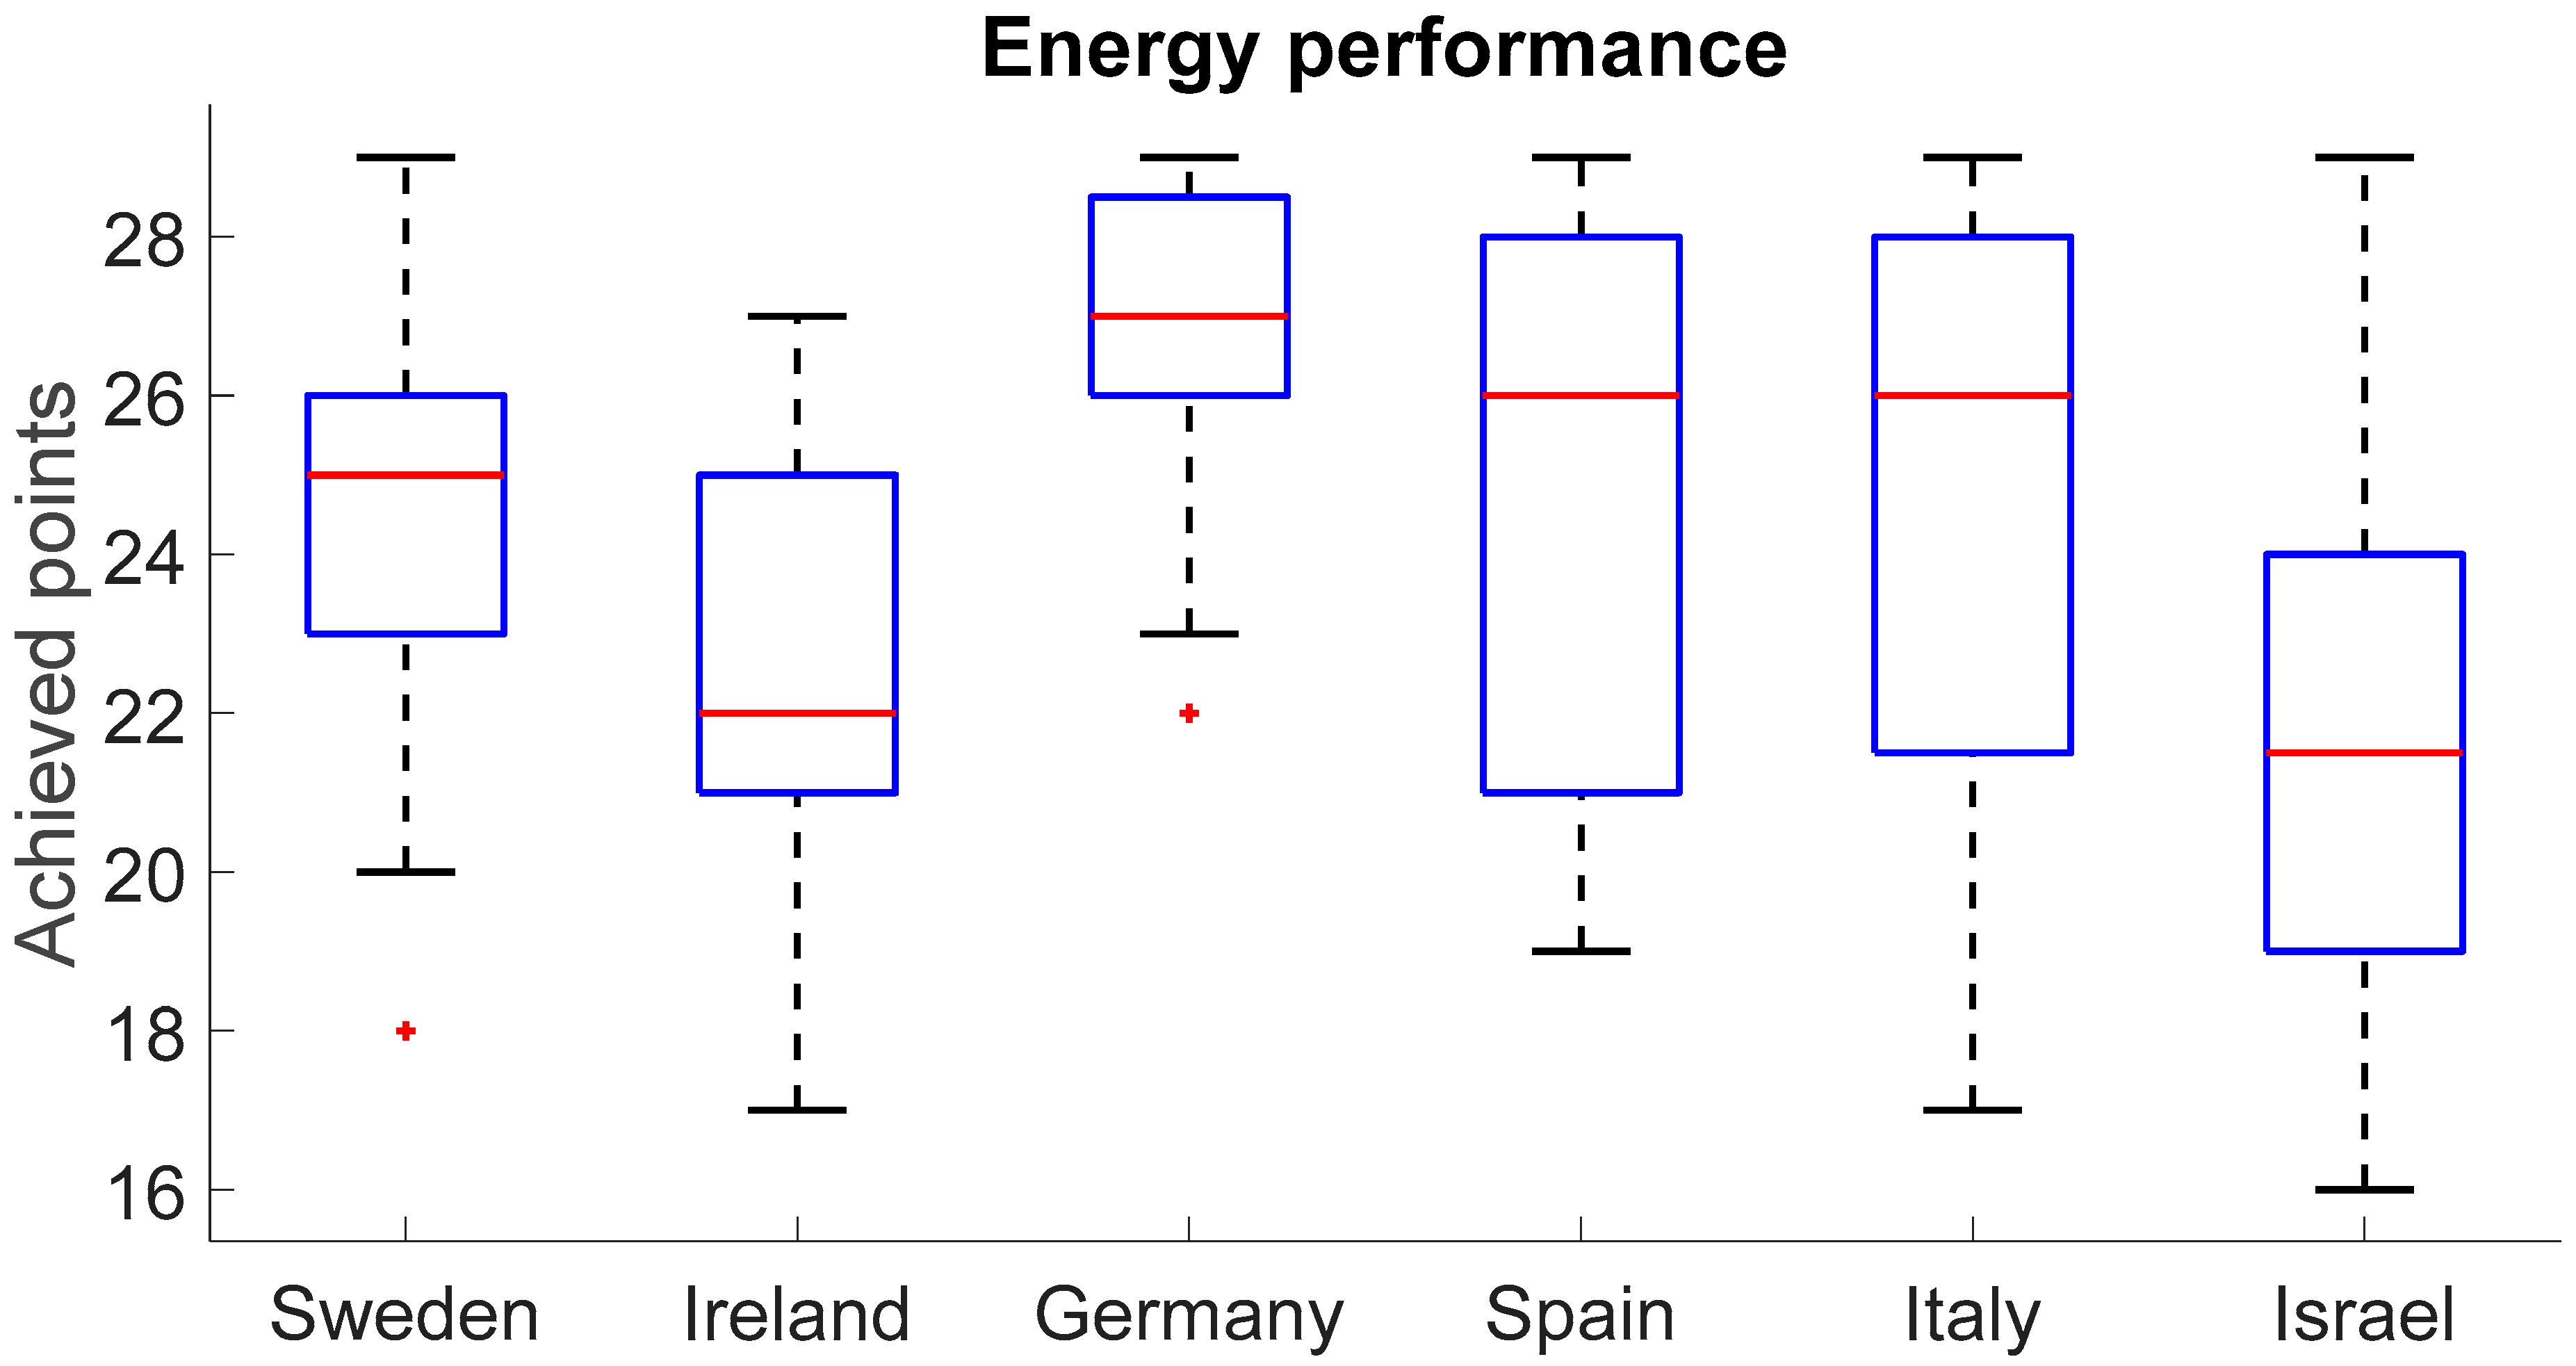
Figure 5 shows the results of the energy performance analysis of six countries. The median was highest in Germany (27 points), followed by Spain and Italy (26 points), Sweden (25 points), Ireland (22 points), and Israel (21.5 points). A fairly wide range (25–75th percentile) was observed across all six countries.
Table 11 shows that, for this prerequisite, Germany outperformed Sweden, Ireland, and Israel, and Sweden outperformed Israel (the difference appears to be positive,
p < 0.001 for all cases). Spain and Italy outperformed Israel (the difference appears to be positive,
p = 0.008 and 0.009). The judgment is suspended regarding the difference between Germany and Italy (
p = 0.068). The difference between the remaining eight pairwise comparisons appears to be negative (
p ≥ 0.078).
As explained, LEED-EB energy performance is calculated based on the sum of 50% GHG emissions points and 50% energy points. GHG emissions vary for different fuel sources used to produce energy. Fossil fuel sources are major contributors to GHG emissions, with coal accounting for the largest share of emissions, followed by oil and natural gas, while solar, wind, hydropower, and nuclear power are low emitters of GHG emissions. Thus, the cleaner the fuel source used in a particular country, and the less energy used to heat, cool, and light a building, the higher median LEED-EB energy performance that can be achieved.
In this regard, Sweden uses about 45% of solar, wind, and hydro energy from its total energy sources, followed by Spain (23%), Ireland and Germany (20%), Italy (15%), and Israel (7%). Sweden uses the least amount of fossil fuels (coal, oil, and gas) out of all energy sources (26%), followed by Spain (66%), Germany (75%), Ireland (78%), Italy (81%), and Israel (93%). Thus, the lowest median LEED-EB energy performance in Israel can be explained by the highest percentage of fossil fuels as energy sources and the lowest percentage of renewable energy sources compared to Sweden, Ireland, Germany, Spain, and Italy.
The median LEED-EB energy performance in these European countries is also a result of the high energy saving standards/regulations applied in the European Union (EU). In particular, the European Green Deal aims to reduce greenhouse gas emissions in the EU by 55% by 2030 [
50], the REPowerEU plan aims to increase renewable energy to 45% [
51], and the Energy Performance of Buildings Directive (EPBD) aims to achieve a climate-neutral Europe by 2050 [
52].
High energy efficiency standards/regulations may require building upgrades, including improved insulation, window replacement, green roof installations, and replacement of efficient heating and cooling equipment. These measures require additional investment. Therefore, financial incentives such as tax reductions, rebates, and subsidies can be useful tools to improve building energy efficiency [
53]. Such incentives have worked well in developed countries, helping to promote energy-efficient building practices, including LEED certification.
For example, in Germany, building owners who intend to renovate a building can receive a tax deduction of 20% of the total cost of the renovation measures taken [
53]. In Spain, which has a lot of sunny days, solar energy is an excellent way to reduce greenhouse gas emissions associated with energy costs for cooling buildings. Therefore, some municipalities allow property tax rates to be reduced by up to 50% when solar energy systems are mounted on buildings [
53].
Thus, with LEED certification in Ireland and Israel in sight, LEED consultants need to consider how to improve building insulation to achieve greater energy savings. In addition, policymakers in these countries should continue working towards reducing fossil fuel use in favor of more renewable sources in the future.
4.5. Prerequisite MRs: Waste Performance
Prerequisite MR: Waste performance requires measuring the total weight of waste such as glass, plastic, and paper that is generated by building occupants and the total weight of waste diverted from landfills and incinerators for one full year. The measured waste is then converted to a project equivalent of the total weight of waste generated and the total weight of waste diverted per day and per occupant. Using these waste weights, the daily non-diverted waste per occupant is estimated. Both measurements, the average daily waste generated by the project and the waste not diverted per occupant, determine the waste performance score. The score is calculated by entering the total amount of waste generated and recycled into the LEED-EB online tool. For each waste score, LEED-EB waste performance is provided as presented in [
8]. In this way, the corresponding LEED-EB points are awarded based on the waste performance score [
8]. The lower the total weight of waste generated and the lower the amount of waste that is not recycled, the higher the LEED score.
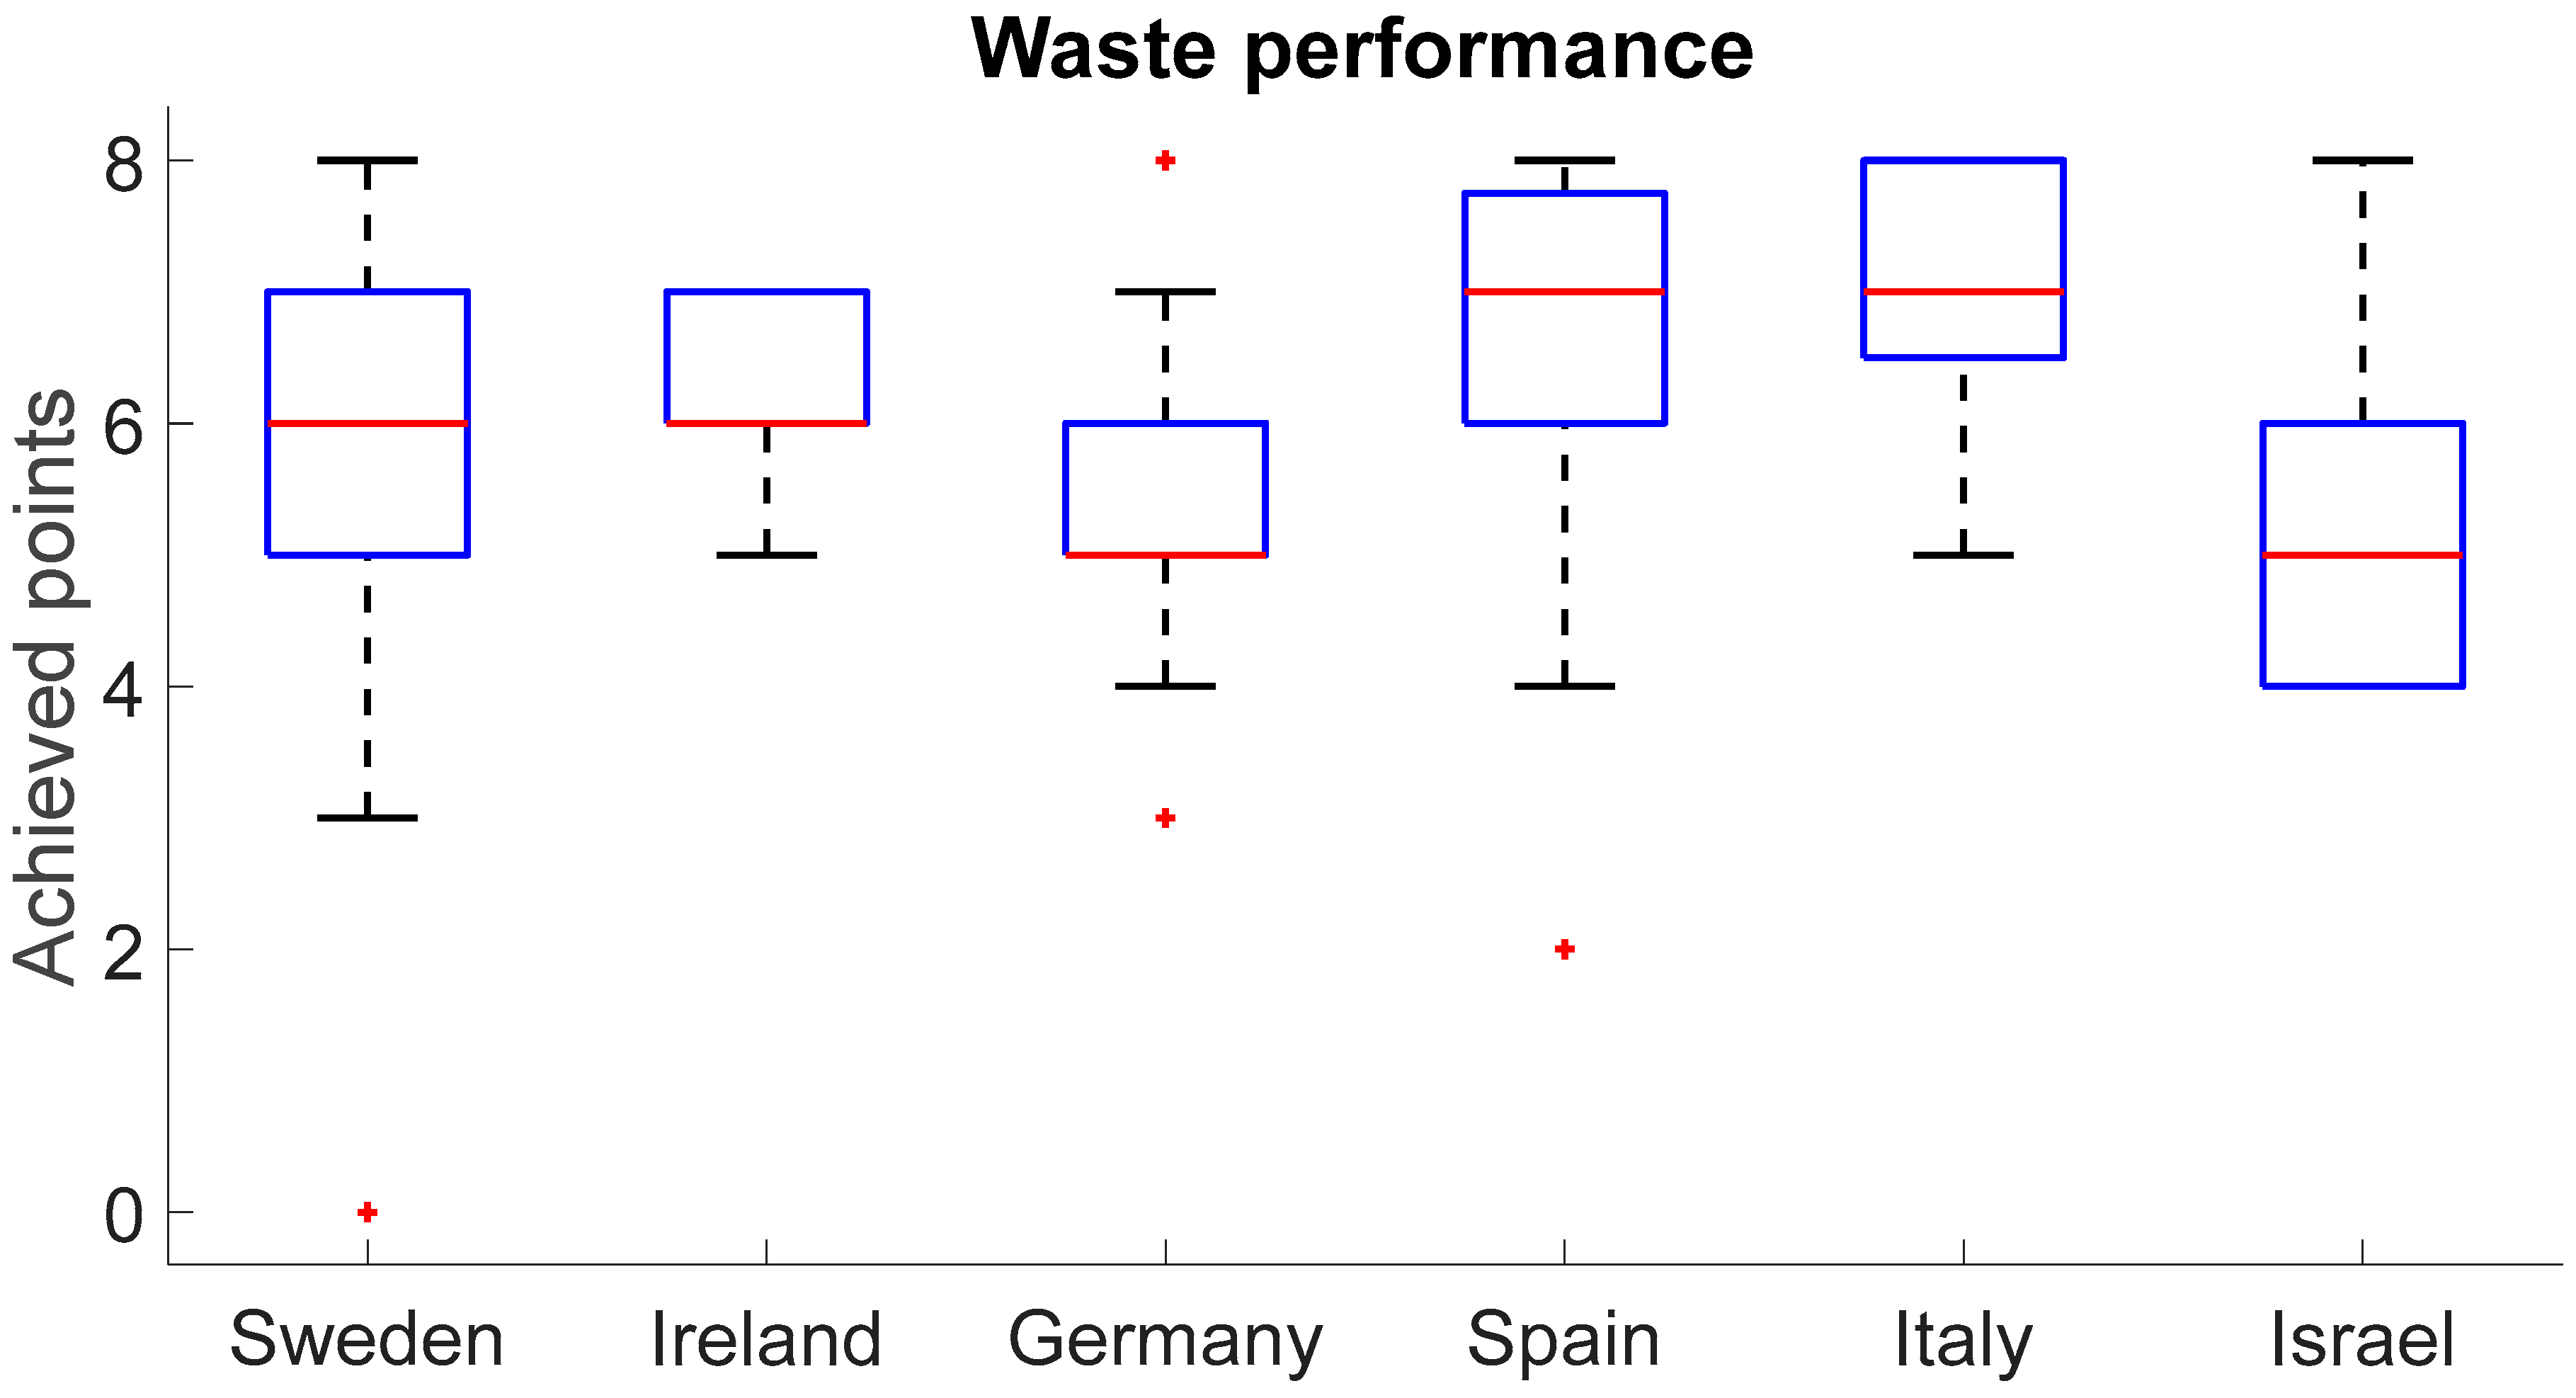
Figure 6 shows the results of the waste performance analysis of six countries. The median was highest in Spain and Italy (7 points), followed by Sweden and Ireland (6 points), and Germany and Israel (5 points). A relatively narrow range (25–75th percentiles) was observed across all six countries.
Table 12 shows that, for this prerequisite, Italy outperformed Sweden, Ireland, Germany, and Israel (the difference appears to be positive,
p ≤ 0.043). Spain outperformed Sweden, Germany, and Israel (the difference appears to be positive,
p ≤ 0.033). The difference between the remaining five pairwise comparisons appears to be negative (
p ≥ 0.103).
The EU is a global leader in waste recycling and management through landfill restrictions and innovative waste collection and recycling [
54]. In this regard, five of the six countries examined in this study, Sweden, Ireland, Germany, Spain, and Italy, have also been identified by other researchers as outstanding in waste management. For example, with regard to plastic waste, in the EU up to 2022, out of 23,299 articles published on this topic in 146 countries, Italy published 2068 articles (9%), followed by Germany with 2053 (9%) and Spain with 1641 (7%) [
55]. Furthermore, focusing on municipal waste recycling rates in the EU, Laureti et al. [
56] reported Sweden and Germany as leading countries with high recycling rates and Ireland, Spain, and Italy as countries with average recycling rates. Thus, although European countries are considered leaders in waste recycling, further efforts to increase the recyclability of municipal waste must be made in future LEED certification, especially in Germany and Israel.
4.6. Prerequisite EQ: Indoor Environmental Quality Performance
Prerequisite EQ: Indoor environmental quality performance requires that an occupant satisfaction survey and indoor air quality assessment in terms of carbon dioxide (CO
2) and total volatile organic compound (TVOC) levels must be conducted at least annually. The occupant satisfaction survey results need to be converted into an occupant satisfaction score, while the indoor air quality assessment results need to be converted into a CO
2 score and TVOC score. Occupant satisfaction survey results are converted to an occupant score using the average occupant satisfaction level multiplied by 10. CO
2 and TVOC scores are determined using the CO
2 and TVOC score functions provided in the USGBC calculator. The human experience score is then assessed by calculating the sum of 50% of the occupant satisfaction score, 25% of the CO
2 score, and 25% of the TVOC score. Ultimately, LEED-EB points are awarded for the human experience score [
8]. Higher occupant satisfaction and higher CO
2 and TVOC scores lead to higher LEED-EB scores.
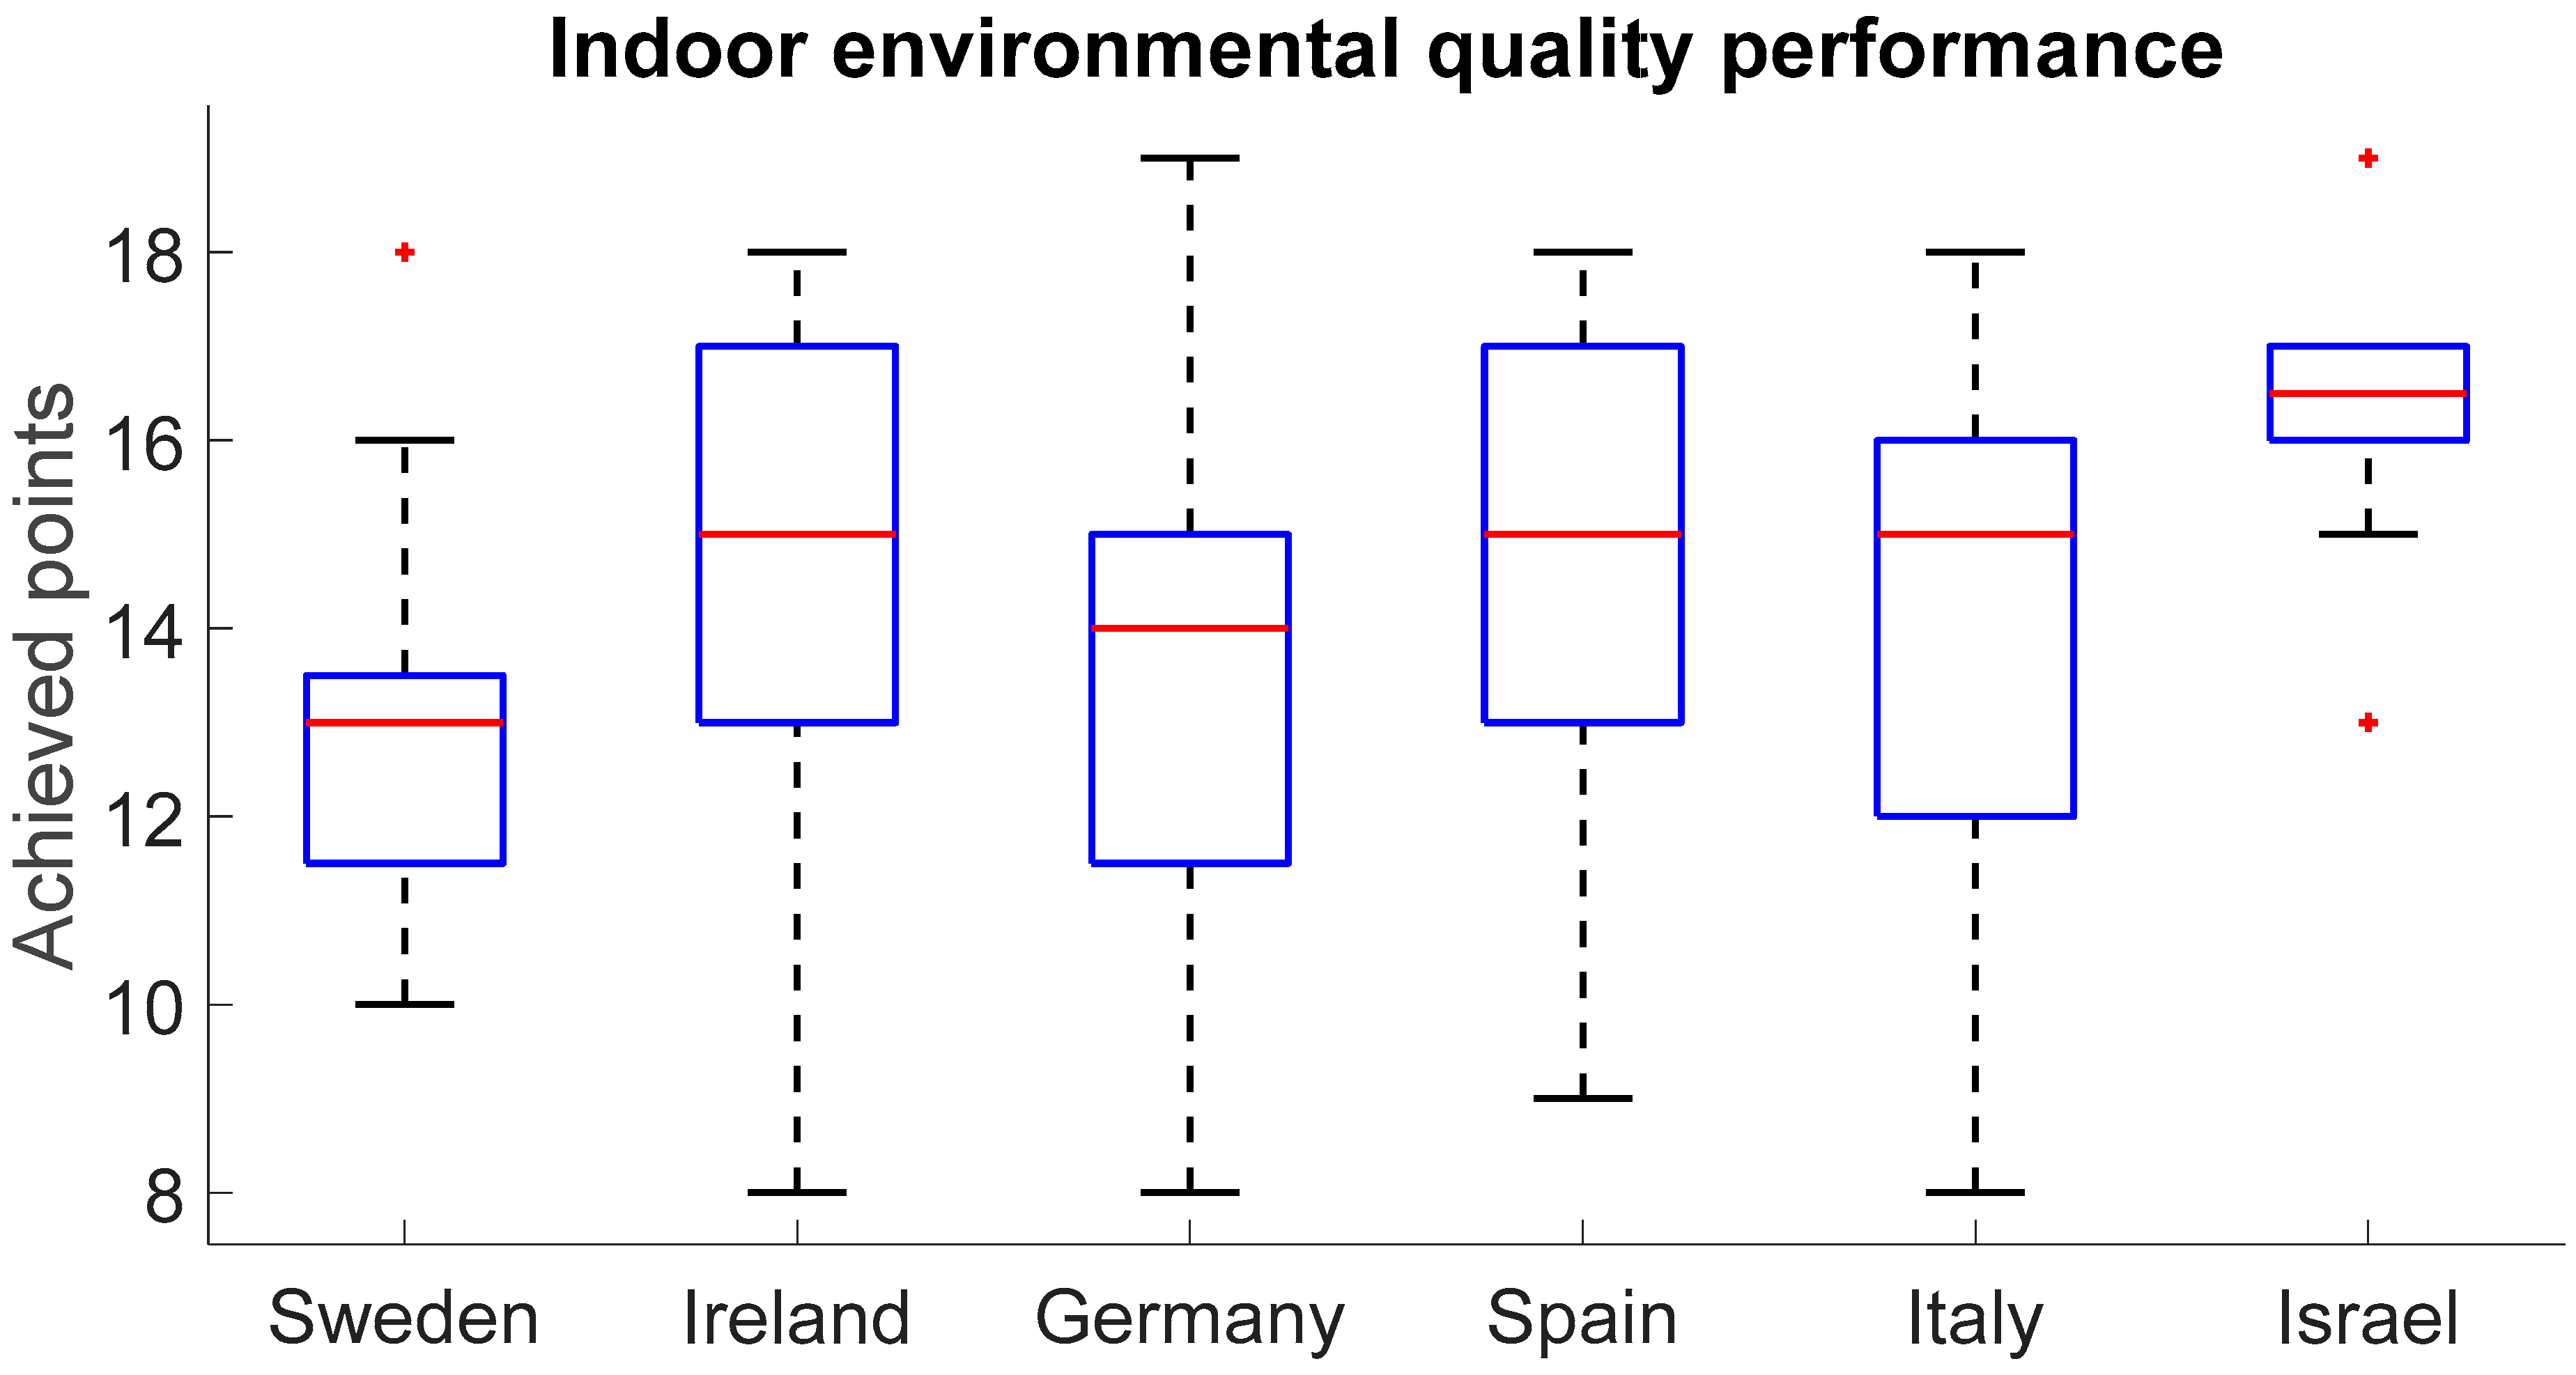
Figure 7 shows the results of the indoor environmental quality performance analysis of six countries. The median was highest in Israel (16.5 points), followed by Ireland, Spain, and Italy (15 points), Germany (14 points), and Sweden (13 points). Israel also had the narrowest range (25–75th percentile), while the other countries had quite wide ranges.
Table 13 shows that, for this prerequisite, Israel outperformed Sweden, Germany, and Italy (the difference appears to be positive,
p ≤ 0.006). Ireland, Spain, and Italy outperformed Sweden (the difference appears to be positive,
p ≤ 0.002). The judgment is suspended regarding the difference between Israel and Ireland (
p = 0.051), between Israel and Spain (
p = 0.062), and between Germany and Spain (
p = 0.046). The difference between the remaining six pairwise comparisons appears to be negative (
p ≥ 0.078).
Currently, more than 75% of existing buildings in the EU are old, built before the current thermal air conditioning regulations came into force. These buildings therefore have inadequately insulated building envelopes and uncontrolled ventilation rates, as well as highly volatile organic compounds (VOCs) emitted by building materials. This in turn leads to poor indoor air quality [
57]. In this regard, the European Agenda identifies the retrofit of the housing stock as a key objective to minimize energy consumption in light of achieving climate neutrality in cities by 2050 [
58]. Furthermore, the European Commission has published EU minimum concentration of interest (EU-LCI) values for 152 organic compounds commonly emitted by building materials [
59]. Thus, four of the six countries assessed—Ireland, Italy, Spain, and Israel—achieved a relatively high median LEED-EB indoor environmental quality performance of 15.0–16.5 (
Table 13).
To address this issue in future LEED-certified buildings certified in Sweden and Germany, LEED consultants need to consider low-VOC building materials and use ventilation rates that reduce CO2 emissions inside buildings.
4.7. Overall LEED-EB Score
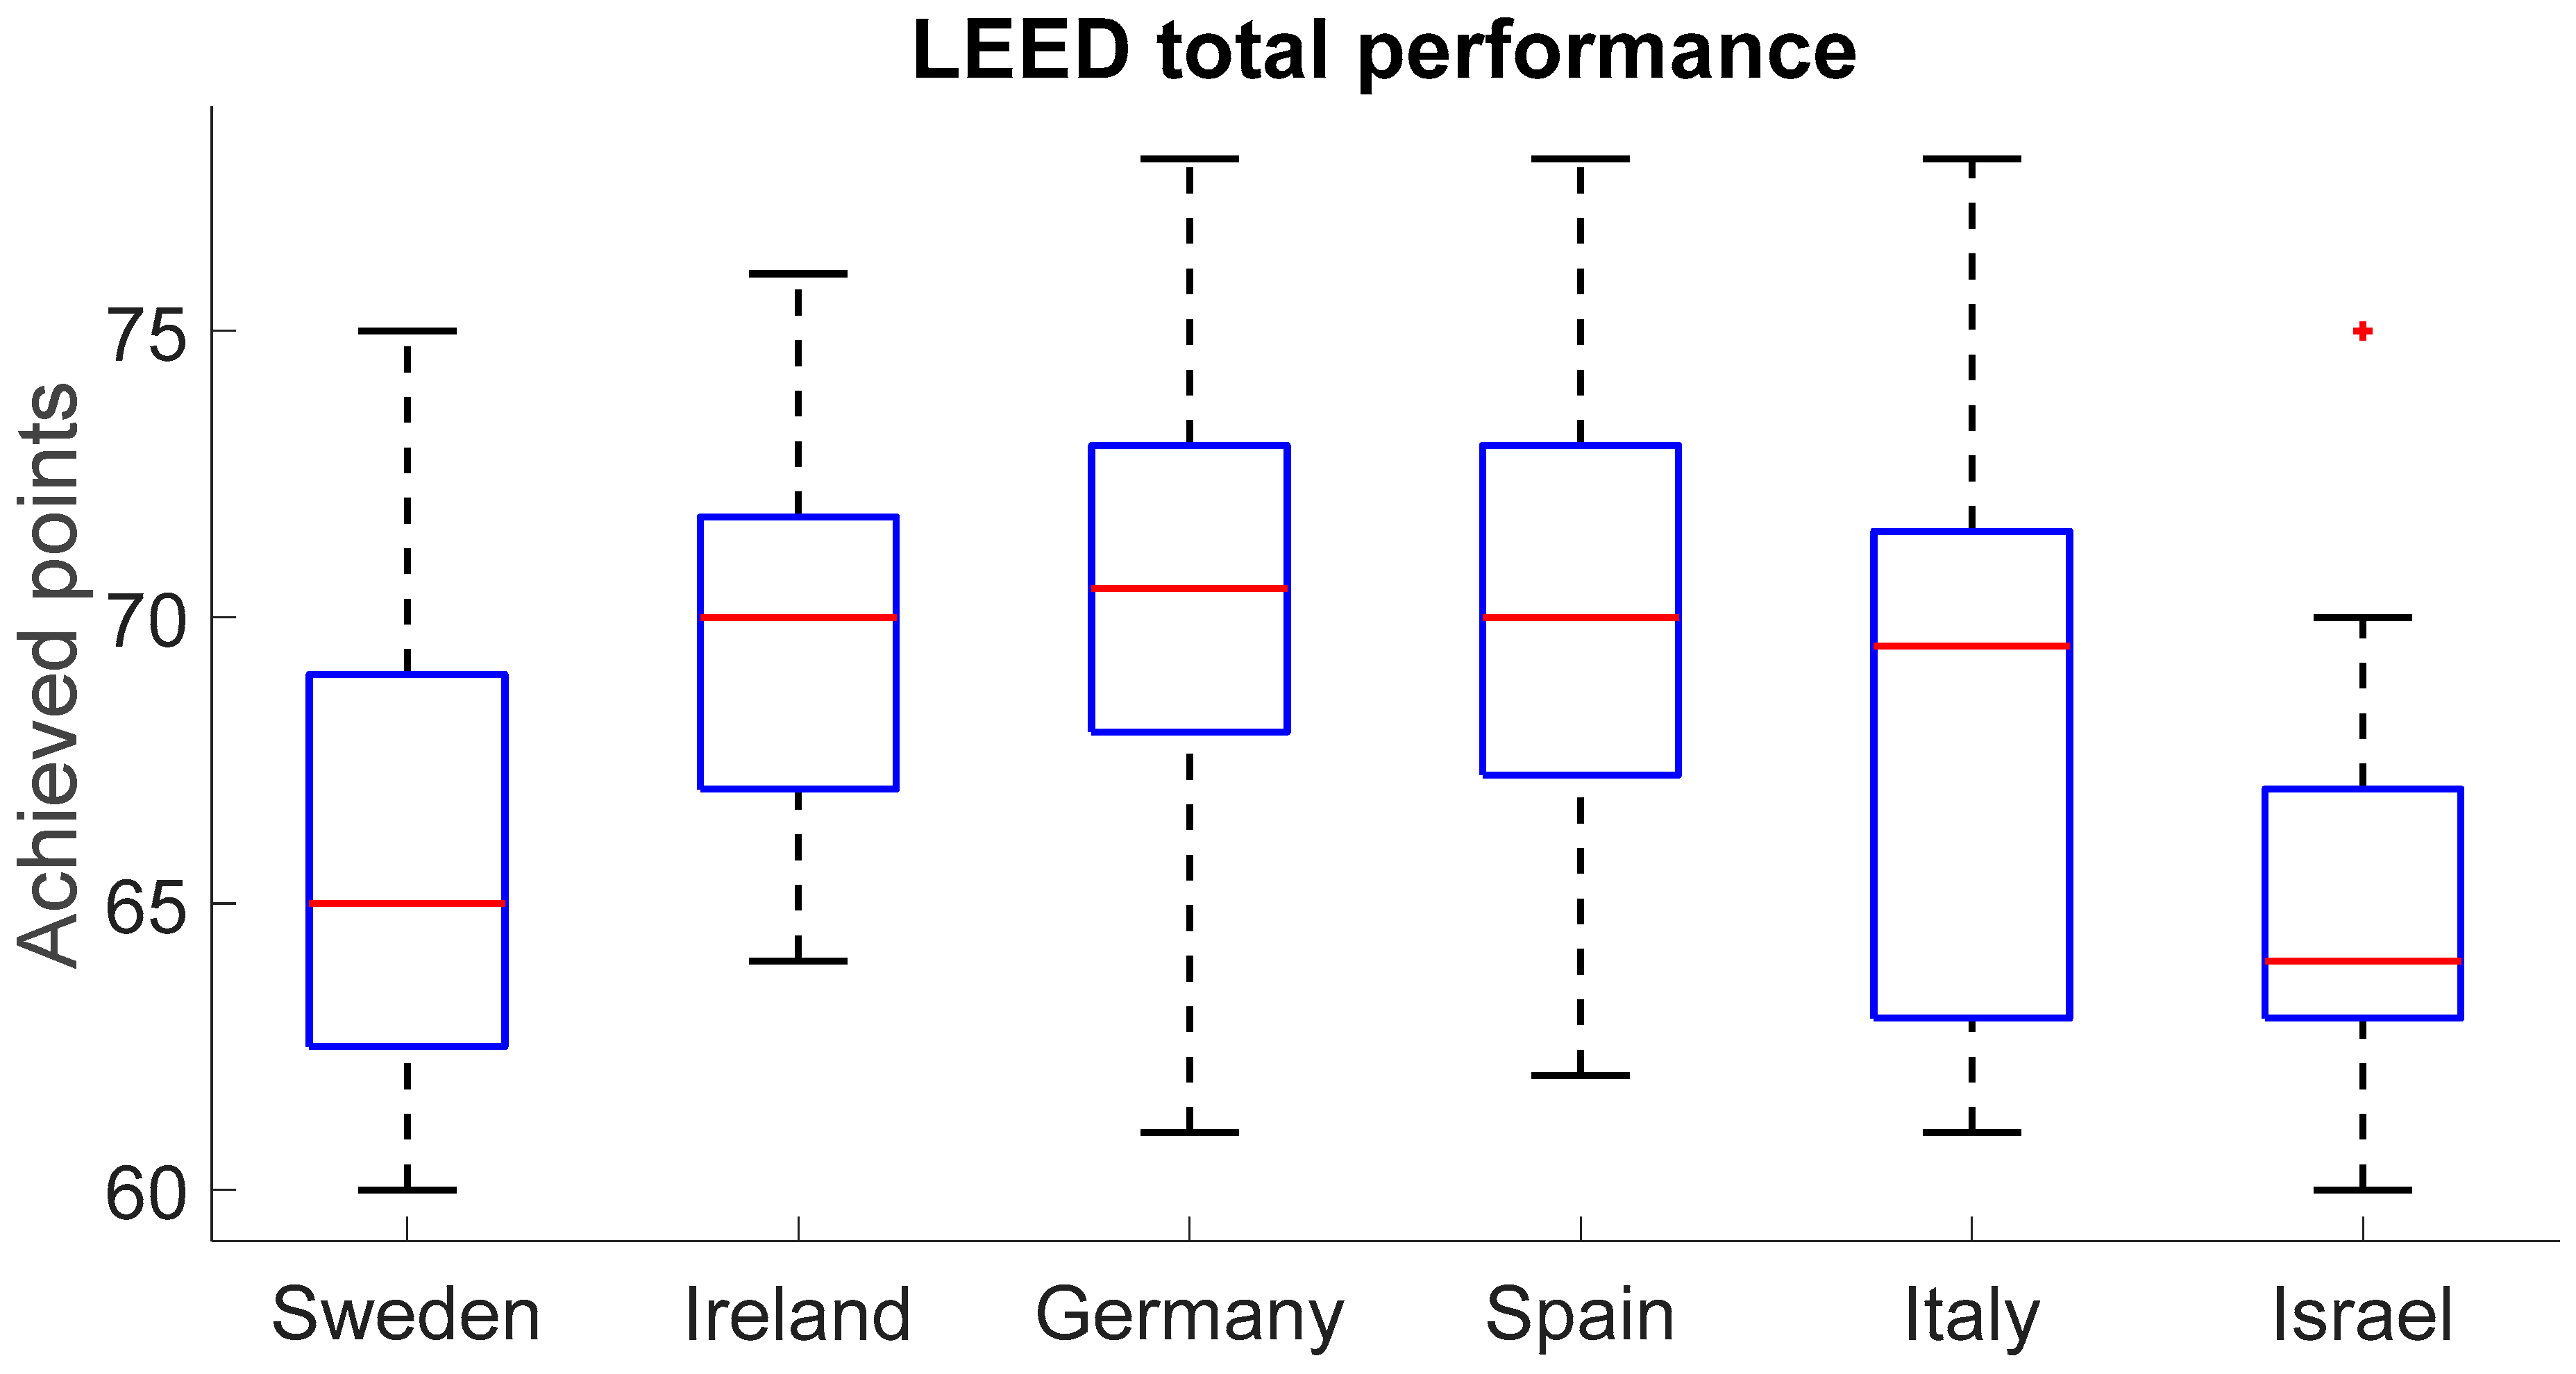
Figure 8 shows the results of the total performance analysis LEED for six countries. The median was highest in Germany (70.5 points), followed by Ireland and Spain (70 points), Italy (69.5 points), Sweden (65 points), and Israel (64 points). Across all countries, the range (25–75th percentile) was quite wide.
Table 14 shows that, for total performance of LEED, Ireland, Germany, and Spain outperformed Sweden and Israel (the difference appears to be positive,
p < 0.001). The judgment is suspended regarding the difference between Italy and Sweden (
p = 0.056) and between Italy and Israel (
p = 0.054). The difference between the remaining seven pairwise comparisons appears to be negative (
p ≥ 0.190).
It is worth mentioning that projects certified under previous versions of LEED-EB v3 and LEED-EB v4 measured only water and energy savings, and the overall LEED achievements were close to a low gold certification of 62–65 [
32]. Over the years, such low achievements have been criticized as “point hunting” that neglects the true sustainability of the building [
13]. In this study, four of the six countries assessed, Italy, Spain, Germany, and Ireland, achieved total LEED points from LEED-EB gold-certified office projects that were well above the low gold certification (60 points). It can be assumed that this is due to the new approach taken in LEED-EB to measure the performance of all the main indicators: transportation (LT), water (WE), energy (EA), waste (MRs), and indoor environmental quality (EQ). It can therefore be assumed that the current performance of all five streams (LT, WE, EA, MR, and EQ) reflects the real situation in the field of building sustainability.

