Abstract
Visual attractiveness perception—an individual’s capacity to recognise and evaluate the visual appeal of urban scene safety—has direct implications for well-being, economic vitality, and social cohesion. However, most empirical studies rely on single-source metrics or algorithm-centric pipelines that under-represent human perception. Addressing this gap, we introduce a fully reproducible, multimodal framework that measures and models this domain-specific facet of human intelligence by coupling Generative Pre-trained Transformer 4o (GPT-4o) with 1000 Street View images. The pipeline first elicits pairwise aesthetic judgements from GPT-4o, converts them into a latent attractiveness scale via Thurstone’s law of comparative judgement, and then validates the scale against 1.17 M crowdsourced ratings from MIT’s Place Pulse 2.0 benchmark (Spearman ρ = 0.76, p < 0.001). Compared with a Siamese CNN baseline (ρ = 0.60), GPT-4o yields both higher criterion validity and an 88% reduction in inference time, underscoring its superior capacity to approximate human evaluative reasoning. In this study, we introduce a standardised and reproducible streetscape evaluation pipeline using GPT-4o. We then combine the resulting attractiveness scores with network-based accessibility modelling to generate a “aesthetic–accessibility map” of urban central districts in Chongqing, China. Cluster analysis reveals four statistically distinct street types—Iconic Core, Liveable Rings, Transit-Rich but Bland, and Peripheral Low-Appeal—providing actionable insights for landscape design, urban governance, and tourism planning.
1. Introduction
Visual attractiveness exerts a profound influence on residents’ psychological and emotional well-being. Urban dwellers are exposed to a variety of environmental factors—such as social deprivation, air pollution, street network configurations, and land-use density—that interact to affect mental health outcomes. Landscape physiognomy—referring to the visual characteristics and qualities of urban environments, which contribute to their aesthetic appeal and psychological impact on inhabitants, including green vegetation, clean streets, and thoughtfully designed architecture—offer not only visual enjoyment but also tangible psychological benefits. Research also suggests that combinations of green and blue spaces in urban parks are especially restorative, contributing to residents’ subjective well-being and mental recovery [1]. Research by Sjerp de Vries has shown that neighbourhoods abundant in greenery help mitigate residents’ stress levels and foster interpersonal interactions, thereby enhancing social cohesion within communities [2]. Such public spaces encourage residents to engage in outdoor social activities, suggesting that attractive urban landscapes not only improve subjective well-being but also strengthen communal bonds and mutual support [3].
Urban streets are integral to the attractiveness of cities. They are the primary spaces where both residents and visitors interact with the urban environment, and they serve as indicators of the overall aesthetic quality of a city. Streetscapes significantly influence people’s perceptions of urban attractiveness and are key to urban identity, making them a compelling focus of this research. Visual attractiveness plays a crucial role in fostering economic development. A visually appealing urban environment, including well-designed streetscapes, public spaces, and green areas, enhances the overall quality of life for residents and visitors. Such environments have been shown to attract both tourists and investors. Tourists are drawn to cities with scenic streetscapes and iconic landmarks, contributing greatly to the hospitality industry, including hotels, restaurants, and cultural attractions. This, in turn, creates employment opportunities and generates income for local businesses. Furthermore, aesthetically attractive urban areas are also appealing to investors who seek locations for businesses, commercial ventures, and real estate development [4]. Attractive cities have the potential to increase property values, attract new businesses, and retain talent, all of which contribute to local economic growth. A visually compelling urban environment not only enhances the city’s image but also strengthens its economic competitiveness on a global scale. As demonstrated by Kai, Lingnan architecture—imbued with historical and cultural significance—not only offers aesthetic appeal but also promotes economic vitality through cultural expression [5]. Similar findings have been observed in small-town environments, where architectural and visual attractiveness directly influences tourism and cultural perception [6]. Visual attractiveness contributes to city branding and residents’ mental health; high-quality green spaces and iconic architectural designs enhance urban health outcomes and support sustainable urban planning. A scientifically grounded approach to enhancing urban aesthetics can significantly improve residents’ happiness while making cities more appealing overall.
Nevertheless, traditional assessment methods refer to manual and subjective approaches used to evaluate visual attractiveness, which often rely on human judgement and field surveys. These methods typically involve on-site assessments, where evaluators physically visit urban spaces, spending time in the environment to observe various features. Evaluators are asked to make subjective judgments about the aesthetic quality of spaces by considering a range of factors, such as the overall harmony of architectural elements, the presence and quality of green spaces, the condition of the pavement, and the spatial layout. In many cases, evaluators also rely on their personal experiences, preferences, or cultural background to guide their judgments, which introduces variability into the evaluation process. While useful, these methods are time-consuming, costly, and prone to inconsistency [7], as evaluations can vary between different raters. For example, visual assessments of urban environments might involve rating street-level aesthetics based on features such as architectural style, greenery, and spatial layout. In contrast, our proposed method automates this process using machine learning models, which can analyse large-scale datasets and provide standardised, reproducible results, thus overcoming the limitations of traditional human-based evaluation. Recent studies have demonstrated the potential of combining street-view imagery with deep learning models to quantify urban perceptions by analysing greenery, pavement quality, and built environment features—providing scalable and objective tools for street-level visual assessments [8]. With advancements in street-view imagery (SVI) and deep learning, it has become feasible to automate large-scale assessments of dynamic urban environments [9]. The existing literature on SVI and environmental quality primarily focuses on identifying key visual features associated with travel behaviour, improving the accuracy of street quality indices, and mapping the spatial distribution of various environmental attributes—such as visual complexity or street-level amenities—within urban settings. However, training deep learning models for aesthetic assessment often requires extensive manual labelling to ensure validity. The MIT Place Pulse 2.0 project [10,11], developed by the Massachusetts Institute of Technology, represents a global initiative to collect and analyse street-view images from diverse urban settings to quantify urban perceptions, safety, and vibrancy. While the project enables rapid aggregation of public perceptions and facilitates the creation of a global visual attractiveness dataset, it still suffers from high labour costs and inconsistent evaluative criteria. In the context of big data and artificial intelligence, automated evaluation methods—characterised by efficiency, scalability, objectivity, and the ability to handle complex datasets—have become essential. Developing a fully automated and geographically transferable method for assessing urban landscape attractiveness is therefore both timely and imperative.
Visual attractiveness has become a focal point in urban studies due to its profound impact on well-being, economic development, and social cohesion. Recent research has explored the use of multimodal large language models (MLLMs), particularly in assessing urban safety perceptions through the integration of street-view imagery, which enhances the efficiency and scalability of urban assessments [12]. Studies such as those on DeepU-Net, a model used for road extraction from high-resolution remote sensing images, demonstrate how deep learning can aid urban planning by improving infrastructure and aesthetic evaluations [13]. Furthermore, research on urban green space vulnerability, such as PSR-based AHP and MLP models used in Kolkata, underscores the importance of greenery in maintaining both ecological health and urban well-being [14]. The economic impact of visual attractiveness is also evident in studies examining tourist willingness to pay more in national parks, showing how aesthetic value drives tourism and local investment. Lastly, location–allocation modelling in health planning, particularly in evaluating spatial accessibility for hospitals, aligns with urban planning efforts to ensure equitable access to resources [15]. These studies collectively contribute to a growing understanding of how aesthetic evaluations, environmental sustainability, and accessibility shape urban dynamics, providing a foundation for the automated framework proposed in this paper.
In recent years, image processing and remote sensing have become integral tools in urban studies, particularly in the analysis and evaluation of urban environments. Through the use of remote sensing imagery, such as satellite or street-view images, it is possible to assess various urban features like land-use, green spaces, and infrastructure. Techniques in image processing, including the application of models like ECA-MobileNetV3 (Large)+SegNet for classification tasks, have significantly advanced the precision of extracting and analysing features from remotely sensed images. For example, in agriculture, ECA-MobileNetV3 (Large)+SegNet has been used for binary classification of crops such as sugarcane, demonstrating the effectiveness of these models in environmental assessments. Similarly, the study of image emotion classification—through frameworks have enriched the analysis of urban imagery by associating emotional and perceptual responses with visual elements. These models facilitate the understanding of how people emotionally respond to urban streetscapes. Additionally, object pose estimation techniques help in accurately analysing urban scenes with complex elements. Finally, studies present a novel approach to classifying complex urban scenes, offering a high degree of accuracy in recognising various environmental features [16]. These advancements in image processing and remote sensing play a pivotal role in enhancing urban studies, particularly in the development of automated frameworks for assessing visual attractiveness.
In recent years, multimodal large language models (MLLMs) have demonstrated remarkable reasoning and analytical capabilities [17]. Models such as GPT-4 have shown state-of-the-art performance across a range of tasks involving natural language processing, image analysis, and multimodal reasoning, excelling in complex applications such as image captioning and visual question answering [18,19,20]. Drawing inspiration from the methodology employed by MIT Place Pulse 2.0, this study proposes an automated approach to evaluating urban landscape attractiveness using MLLMs and street-view imagery. Specifically, we utilise the GPT-4o model in combination with the Place Pulse 2.0 dataset to perform aesthetic comparisons on 1000 urban street-view images, replacing traditional human-based evaluation processes. Each image is randomly paired with 20 others, and the model is tasked with determining “Which image is more attractive?” The comparison yields three possible outcomes: “more attractive,” “indistinguishable,” and “less attractive.” This pairwise comparison framework enables the construction of a relative aesthetic ranking for the 1000 images. Additionally, a crowdsourced human evaluation of the same image set was conducted via an online platform, providing a benchmark for comparison with both MIT Place Pulse 2.0 and GPT-4o outputs.
This study makes three primary contributions:
- (1)
- It introduces an automated framework for assessing urban landscape attractiveness based on GPT-4o, a multimodal large language model. By leveraging GPT-4o’s capabilities in image comprehension and linguistic reasoning, the method replaces labour-intensive aesthetic evaluations with an efficient, standardised process [21]. The open-ended question “Which image is more attractive?” is transformed into a structured decision task, yielding clear categorical outcomes (“more attractive,” “indistinguishable,” and “less attractive”). This structured, replicable workflow significantly improves evaluation efficiency while maintaining high levels of consistency and interpretability, illustrating the practical potential of MLLMs for subjective, cognitively demanding tasks.
- (2)
- Based on the pairwise comparison methodology of MIT Place Pulse 2.0, we constructed a dataset of 1020 real-world street-view images for visual attractiveness assessment. Each image was compared to 50 others, resulting in a model-generated relative ranking of aesthetic appeal. Simultaneously, we collected human preference data for the same image set via a crowdsourcing platform. The resulting dataset enables rigorous cross-modal comparison and serves as a standardised reference for future research in urban visual analysis and aesthetic model development. Figure 1 illustrates the research workflow—from model-based and human aesthetic judgments to a comprehensive attractiveness evaluation of the Yuzhong District in Chongqing, China, which highlightings the method’s scalability and potential for broad application.
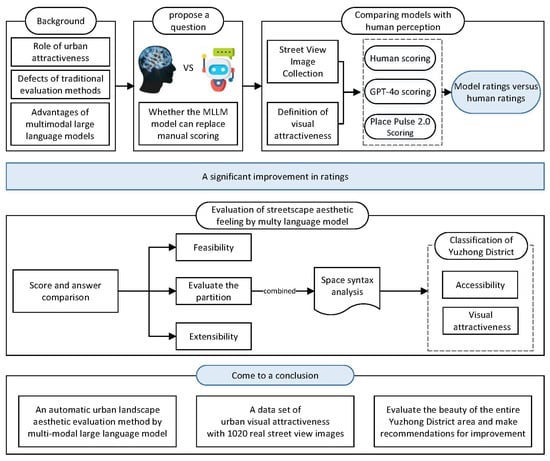 Figure 1. Research framework.
 - (3)
- The MLLM-driven framework proposed in this study offers a novel quantitative decision-support tool for urban design. By analysing the relationship between visual elements in street-view imagery and corresponding attractiveness judgments, the model identifies key visual features—such as greenery, building façades, and street openness—that significantly influence perceptions of visual attractiveness. This approach not only enhances understanding of public aesthetic preferences but also provides data-driven insights for policymakers and urban planners seeking to optimise cityscapes. For instance, when designing new urban districts or renovating ageing streetscapes, this framework can serve as an assistive system to evaluate the potential perceptual impact of proposed interventions, thereby facilitating the creation of more human-centred urban environments.
2. Related Work
2.1. Definition of Visual Attractiveness
Visual attractiveness is not an isolated attribute; rather, it emerges from the interplay of spatial characteristics, architectural scales, and visual perceptions (see Table 1). One of the fundamental components is spatial adjacency. When building façades are oriented toward the street and physically connected to the street edge, they form a continuous urban interface that enhances spatial coherence and intimacy, thereby increasing the perceived attractiveness of the environment (Project for Public Spaces). The ratio of street width to building height (D/H ratio) also plays a critical role in shaping enclosure and psychological comfort. A D/H ratio of 1 is often regarded as the ideal spatial condition, fostering a human-scaled experience and enhancing street-level affinity [22].

Table 1.
Definitions of streetscape aesthetics and their corresponding interpretations.
Architectural form contributes significantly to visual coherence. A clearly defined and orderly building silhouette reinforces visual unity. The integration of auxiliary structures into the primary building contour can markedly improve the cleanliness and aesthetic quality of streetscapes [23]. Additionally, concave spaces—recessed areas within streets or plazas—tend to provide a sense of enclosure and security, offering users a more comfortable spatial experience [24,25]. Depressed spaces, such as sunken plazas, introduce vertical variation into the streetscape and offer quieter zones for rest and social interaction away from vehicular noise and traffic [26].
Public art, particularly in the form of street sculptures, is another vital contributor to visual attractiveness [27]. These elements infuse public spaces with cultural depth and artistic resonance, transforming them into shared assets of civic identity and collective memory [28].
Natural elements are also central to urban aesthetics. Street greenery has been empirically shown to reduce stress and promote psychological restoration. Beyond ecological benefits, vegetation enhances the visual pleasantness of urban spaces [29]. Urban colour schemes, through the contrast and harmony of warm and cool tones, exert a direct influence on emotional perception—warm tones often evoke vitality and warmth, while cool tones induce calmness and serenity [30].
In addition to visual attributes, spatial scale plays a crucial role in shaping street-level experience. Appropriately dimensioned pedestrian walkways—typically around 3 m wide—are considered both legible and comfortable for users. Finally, safety is a prerequisite for the realisation of visual attractiveness. Numerous studies have highlighted that factors such as traffic density, construction noise, and perceived sky openness influence not only feelings of safety but also overall aesthetic evaluations of urban environments [31].
2.2. Applications of Multimodal Large Language Models in Urban Perception
In recent years, artificial intelligence—particularly MLLMs—has demonstrated significant potential in the evaluation of visual attractiveness. These models, capable of processing both visual and textual data, offer scalable and efficient tools that simulate human perception and aesthetic judgement of urban spaces. Cognitive evidence shows that visual complexity can raise viewers’ interest and liking [32], while pair-wise comparison tasks reliably capture subtle perceptual differences [33]. Advances in deep learning have led to remarkable progress in image content recognition, and several studies have leveraged the Place Pulse dataset to explore perceived urban visual quality with convolutional neural networks (CNNs) [34,35,36]. Liu et al.’s LLaVA combines visual encoders with language models, foreshadowing MLLM-based approaches [37], yet CNN pipelines remain labour-intensive and sometimes diverge from subjective surveys [38]. MLLMs such as GPT-4V now integrate image cues with sophisticated language reasoning, promising to reduce manual effort and improve generalisability [39,40]. Studies of generative-AI creativity underline both new opportunities [41] and risks of over-reliance [42]; therefore, holistic frameworks must keep human perceptual principles in focus. Recent work on intuitive physics further emphasises grounding abstract models in realistic, embodied perception [43]. Building on these insights, we adopt an MLLM-based pairwise comparison scheme that integrates aesthetic theory with large-scale street-view imagery, aiming to deliver more accurate, cognitively plausible, and operationally efficient assessments of visual attractiveness.
3. Materials and Methods
3.1. Research Area
To evaluate urban aesthetics, we employed panoramic street-view imagery in combination with a MLLM. The dataset was sourced from Baidu Street View and comprises high-resolution panoramic images captured in Chongqing’s Yuzhong District between 2017 and 2022. A total of 8000 high-quality images were collected for analysis.
Yuzhong District, located at the heart of Chongqing in China serves as the city’s administrative and commercial core (see Figure 2). Covering approximately 23.24 square kilometres and home to over 650,000 residents, the district enjoys a geographically strategic position—bounded by the Yangtze River to the east and the Jialing River to the west. Yuzhong integrates rich natural landscapes with a deep cultural heritage and is home to iconic landmarks such as Jiefangbei and Chaotianmen. The harmony between its scenic environment and historical character has made it a central hub for tourism and cultural engagement in Chongqing, China.
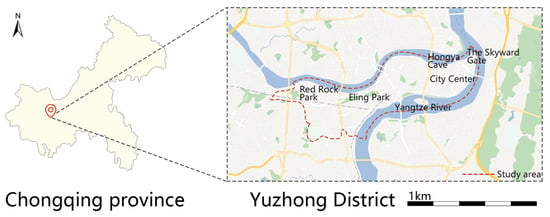
Figure 2.
Study area map.
Moreover, the district boasts highly developed transportation infrastructure, with multiple subway lines and major roads traversing its territory. The area also hosts several universities and research institutes, making it a nucleus for technological innovation and modern development. This confluence of geographic, cultural, and infrastructural elements provides a unique context for understanding the district’s visual attractiveness not only from a visual perspective but also through the lens of multidimensional urban experience for both residents and visitors.
Within this framework, we conduct a comprehensive assessment of urban aesthetics in Yuzhong District by integrating high-quality panoramic street-view imagery with cutting-edge multimodal large language models. This approach offers novel insights and methodologies for urban planning, environmental design, and aesthetic evaluation.
3.2. Human Annotation
For the urban aesthetic evaluation of street-view images, we selected a representative subset of 1020 images from the original dataset, numbered sequentially from 1 to 1020. To reduce the workload associated with human-model comparison, a randomised algorithm was employed to extract 100 images as the primary evaluation set.
Aesthetic assessments were based on four key dimensions:
- (1)
- Compositional structure and visual balance of the image;
- (2)
- Colour harmony and saturation;
- (3)
- Spatial layering and architectural detail richness;
- (4)
- Overall visual appeal and aesthetic value.
Each image was paired with 50 randomly selected images for pairwise comparison, where evaluators were asked to judge “Which image is more attractive?” The results of each comparison were recorded in one of three forms:
- –
- If the target image (e.g., image #1) was deemed more attractive, it received a score of +1.
- –
- If the two images were indistinguishable in aesthetic appeal, the score was 0.
- –
- If the target image was less attractive, the score was –1.
The scoring formula is as follows:
After completing 50 pairwise comparisons, each image receives a cumulative relative score that reflects its overall aesthetic standing within the dataset. Let denote the raw relative attractiveness score of image which ranges from −50 to +50.
The cumulative scoring formula is defined as
This cumulative score serves as a relative ranking indicator of visual attractiveness, enabling structured comparison and subsequent analysis across the image set.
Subsequently, the raw score is linearly normalised to a standardised aesthetic score on a 0–100 scale to facilitate interpretability and comparison. The mapping is defined as follows:
Here, ∈(0,100), where represents the final aesthetic score of image Ii, offering a more comparable and intuitive quantitative measure of visual attractiveness.
This scoring system establishes a robust data foundation for subsequent analyses, including spatial distribution mapping of visual attractiveness, model training, and the evaluation of consistency between human and machine assessments.
3.3. Model-Based Scoring
To evaluate the aesthetic quality of the images, we employed a combined approach using the MIT Place Pulse 2.0 dataset and the GPT-4 model. Place Pulse 2.0 provides a crowd-sourced benchmark of image-based urban perception, while GPT-4 enhances this framework by leveraging visual recognition and affective analysis to deliver refined aesthetic judgments. Each image is scored based on its visual features and perceived appeal to the public, ensuring a comprehensive and reliable evaluation process. This hybrid methodology enables the construction of a multidimensional dataset that reflects visual attractiveness and supports downstream analyses.
In the aesthetic evaluation process, GPT-4 was used to perform image comparisons and generate relative attractiveness rankings. Specifically, each image was paired multiple times with other images, and GPT-4 was tasked with evaluating each pair according to three possible outcomes: “more attractive,” “indistinguishable,” or “less attractive.” For each comparison, GPT-4′s reasoning criteria were recorded to ensure transparency and consistency.
The scoring rule for GPT-based evaluations is defined as follows:
- –
- If image is judged more attractive than image , the score is +1;
- –
- If the images are indistinguishable, the score is 0;
- –
- If image is judged less attractive, the score is –1.
Let the scoring function be defined as
The cumulative GPT-based score for each image , is then calculated as
where 50 is the number of comparison pairs for image . This scoring method yields a relative attractiveness ranking for the entire image set, serving as a machine-generated counterpart to human evaluations and enabling rigorous human–AI comparison in aesthetic judgement.
Through repeated pairwise comparisons, each image accumulates a total score that determines its relative ranking in terms of aesthetic appeal. This raw score is then linearly normalised to a 0–100 scale to ensure interpretability and comparability across the dataset.
Furthermore, the annotation process was enhanced by incorporating GPT-4o’s recorded evaluation rationale, allowing for cross-validation between algorithmic outputs and model-based judgement criteria. This integration ensures the systematicity and reliability of the aesthetic assessment, bridging data-driven computation with interpretable standards.
The overall workflow is illustrated in Figure 3.
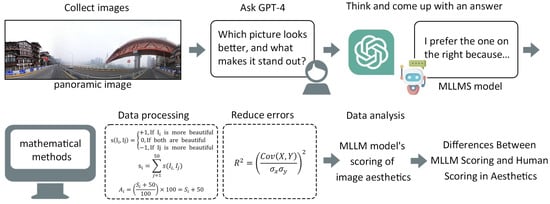
Figure 3.
GPT-4o scoring and data processing workflow.
4. Results
4.1. Image Classification
Drawing upon the theoretical framework from Yoshinobu Ashihara’s The Aesthetic Townscape, we conducted a comprehensive evaluation of visual urban aesthetics through metrics such as colour psychology, D/H ratio, and building silhouette continuity. Based on the standardised aesthetic scores, images were categorised into three intervals:
- Low score (0–3),
- Medium score (3–7),
- High score (7–10) (see Figure 4).
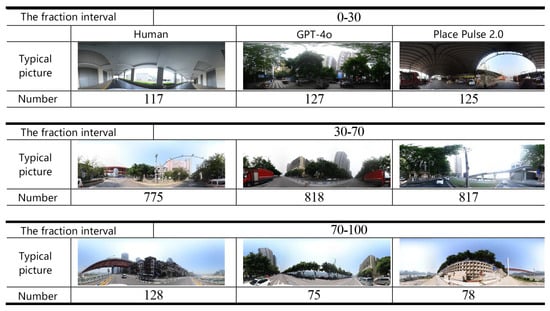 Figure 4. Representative images scoring 0–3, 3–7, and 7–10 from human, GPT-4o, and Place Pulse 2.0 evaluations.
Each image was assessed across multiple dimensions:
- –
- The harmony of colour and architectural proportions;
- –
- The continuity and layering of building silhouettes;
- –
- The spatial comfort influenced by the D/H ratio.
The classification results revealed distinct patterns:
- Low-scoring images (0–3) predominantly featured visually cluttered scenes with disjointed building outlines and a lack of spatial coherence.
- Medium-scoring images (3–7) represented streetscapes that were generally coordinated but lacked strong visual appeal or architectural refinement.
- High-scoring images (7–10) showcased streetscapes with soothing colour palettes, harmonious proportions, and rich spatial layering—serving as exemplars of visual attractiveness.
The distribution and representative examples of each category clearly illustrate the aesthetic variability among urban scenes, offering a structured basis for understanding quality differences in streetscape design.
4.2. Score Comparison
After converting relative pairwise comparison results into a 0–100 aesthetic score scale, we performed further normalisation to ensure score consistency across methods (human, GPT-4o, and Place Pulse 2.0), minimise the influence of outliers, and enable cross-group comparability. Specifically, we applied Z-score normalisation to the final aesthetic scores.
The transformation formula is as follows:
- is the original aesthetic score of image (ranging from 0 to 100);
- μ is the mean of all image scores;
- σ is the standard deviation of the scores;
- is the standardised score for image .
To assess the internal consistency of human evaluation, we incorporated a repeat comparison test for selected image pairs. Specifically, the same image pairs were evaluated three times by human raters. If the results exhibited high variance—for instance, scoring as +1, 0, and –1 across the three trials—such comparisons were deemed inconclusive and excluded from cumulative scoring. This filtering step was introduced to enhance the stability and reliability of the final human-derived scores.
Figure 5 presents a side-by-side comparison of final scores across the three methods: human evaluation, GPT-4o, and Place Pulse 2.0.
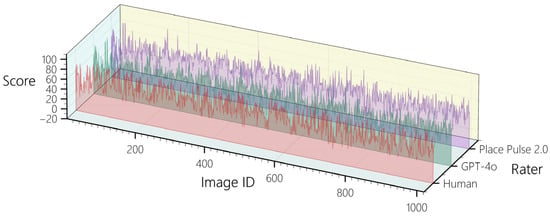
Figure 5.
Comparison of human, GPT-4o, and Place Pulse 2.0 scores.
To quantitatively evaluate the alignment between machine-generated and human scores, we used the coefficient of determination (R2) as a measure of linear correlation. We performed linear regression analyses between
- GPT-4o scores and human scores;
- Place Pulse 2.0 scores and human scores.
The resulting R2 values indicate the degree of consistency between each model’s evaluation and human aesthetic judgement, serving as a benchmark for evaluating the reliability and human-likeness of machine perception in visual attractiveness assessments.
Here, denotes the covariance between model scores and human scores, while and represent the standard deviations of the respective variables.
The coefficient of determination R2 quantifies the proportion of variance in human scores that can be explained by the model scores, with a range of (0,1). A higher R2 indicates stronger consistency and alignment between machine-generated and human aesthetic evaluations.
After excluding samples with uncertain comparison outcomes, we computed the final R2 values for both GPT-4o and Place Pulse 2.0. These coefficients reflect each model’s ability to account for variation in human aesthetic judgement.
As shown in Figure 6, the linear regression fits reveal the following:
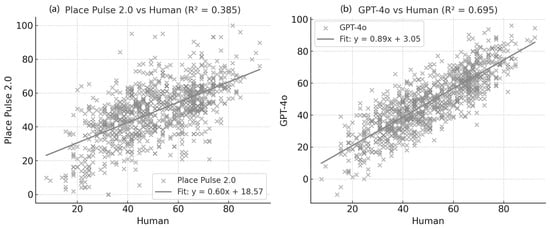
Figure 6.
Scatterplots of GPT-4o and Place Pulse 2.0 scores vs. human scores. (a) Discrepancy between Place Pulse 2.0 scores and human ratings; (b) discrepancy between GPT-4o scores and human ratings.
- GPT-4o vs. human scores: R2 = 0.695.
- Place Pulse 2.0 vs. human scores: R2 = 0.385.
These results demonstrate that GPT-4o exhibits significantly higher alignment with human perception compared to Place Pulse 2.0, underscoring its superior capacity to model subjective aesthetic judgement in urban environments.
The Q-value heatmap is generated by combining aesthetic judgments with network-based accessibility modelling. First, pairwise aesthetic judgments are elicited from GPT-4o, and these judgments are then converted into a latent attractiveness scale using Thurstone’s law of comparative judgement. This scale quantifies the relative attractiveness of different urban streetscapes. Next, the resulting attractiveness scores are integrated with network-based accessibility metrics, which assess how easily different areas are accessible by considering factors like transportation networks, proximity to key locations, and pedestrian pathways. The Q-value is calculated by merging the attractiveness and accessibility scores, likely through a weighted sum or other fusion techniques that combine these two factors into a single value. Finally, the calculated Q-values are visualised as a heatmap, highlighting areas with high or low visual attractiveness and accessibility. This heatmap provides actionable insights for urban planning, helping to identify areas that are both aesthetically pleasing and easily accessible, thereby supporting data-driven decisions for city development and improvement.
To further examine perceptual discrepancies between GPT-4o and human evaluators, we selected identical images and posed parallel aesthetic inquiries to both. As summarised in Figure 7 (right table), humans tended to emphasise subjective emotion and immersive atmosphere—highlighting elements such as the striking red bridge, the sense of openness from the sky, and the emotional undertone of emptiness in the absence of people. In contrast, GPT-4o focused on structural balance and visual composition, emphasising the harmony between built and natural elements and identifying issues such as foreground ambiguity and lack of human activity that weakened overall expressiveness.
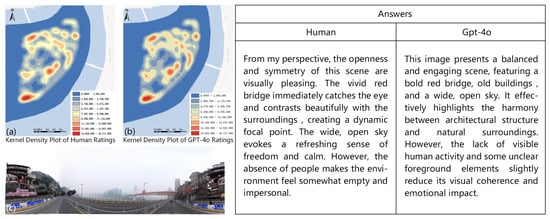
Figure 7.
Kernel density distributions and perceptual comparison between human and GPT-4o evaluations. (a) Kernel density distribution of human aesthetic scores; (b) kernel density distribution of GPT-4o aesthetic score; (c) sample image with paired evaluation by human and GPT-4o. Right table: qualitative comparison of perceptual differences on the same image.
This comparison reveals that human feedback tends to be more emotional, sensory-driven, and experiential, whereas GPT-4o feedback is more rational, structured, and aligned with formal aesthetic criteria. By listing and contrasting divergences, we found that GPT-4o largely mirrors human aesthetic preferences in many key dimensions. High-scoring images (70-100 range) typically share features such as
- Symmetry;
- Open skies;
- Unobstructed greenery;
- Balanced lighting;
- Enclosing yet cohesive building outlines.
However, a notable limitation of GPT-4o lies in its ability to perceive safety-related cues. For instance, images depicting construction zones or dense traffic are often scored significantly lower by humans, while GPT-4o and Place Pulse 2.0 may continue to assign moderate scores based on visual symmetry or colour harmony, overlooking the perceived sense of risk. This suggests that MLLMs require further adaptation to human risk perception when evaluating aesthetics.
On the low-score end, all three evaluators (humans, GPT-4o, and Place Pulse) generally agreed in downgrading visually obscured or pedestrian-inhospitable spaces, such as those beneath overpasses. However, a divergence emerges in the treatment of tree-shaded areas. GPT-4o consistently assigned lower scores to images with dense canopy cover, likely interpreting the shading as a visual obstruction. In contrast, humans appreciated the tree shade for adding comfort, spatial depth, and a sense of natural harmony—core principles in Ashihara’s theory of townscape aesthetics.
This misalignment likely stems from training data biases: MLLMs may have overfitted to clear, open street views and may thus under-recognise the aesthetic value of natural elements like shade and foliage. As a result, models misclassify these features as visual noise rather than aesthetic enhancers.
Implications for Model Improvement:
To bridge this perceptual gap, MLLMs should be fine-tuned with (a) a more diverse training set that includes shaded, vegetated, and natural street scenes; (b) semantic tags that identify positive aesthetic contributions of elements like shadows, trees, and natural textures; and (c) architectural synthesis examples that integrate natural and built forms to foster a holistic understanding of environmental harmony.
By optimising model training along these lines, MLLMs can more accurately reflect human aesthetic intuitions, especially in complex urban–natural hybrid scenes. This enhancement would not only improve evaluative accuracy but also support urban designers with more insightful, human-centred aesthetic analysis, thereby advancing the creation of emotionally resonant and visually coherent urban spaces.
4.3. Spatial Syntax and Visualisation Analysis
Based on the aesthetic scores derived from street-view images, we first conducted a visual mapping to intuitively represent the spatial distribution of visual attractiveness across Yuzhong District. As shown in Figure 8, the visualised results reveal considerable variation in aesthetic quality throughout the area, with clusters of high- and low-attractiveness zones interspersed across the urban fabric.
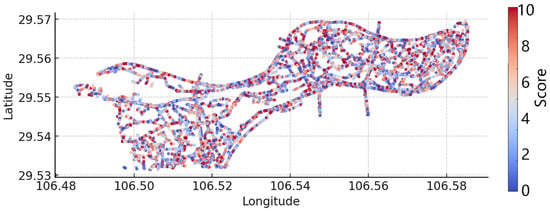
Figure 8.
GPT-4o evaluation of streetscape aesthetic quality in Yuzhong District.
To deepen our understanding and enable typological classification of urban spaces, we conducted a spatial syntax analysis of the entire district. This method allowed us to examine how spatial configuration—such as connectivity, integration, and visibility—relates to perceived visual attractiveness. By overlaying aesthetic score data onto a spatial syntax framework, we were able to detect correlations between spatial intelligibility and visual appeal, providing a more structural understanding of how urban form influences human perception.
This combined approach supports more nuanced interpretations of the relationship between urban morphology and perceived attractiveness, offering a solid basis for data-driven urban design and targeted spatial interventions.
Spatial syntax, developed by Bill Hillier in the 1980s, provides a methodological framework for analysing the relationship between spatial configurations and human behaviour. The theory posits that the structural form of space exerts a significant influence on movement patterns, accessibility, and urban perception. In this study, spatial syntax is applied to quantitatively evaluate the accessibility and structural characteristics of urban environments within Yuzhong District.
As shown in Figure 9a–c, we performed a comprehensive spatial syntax analysis incorporating multiple core indicators:
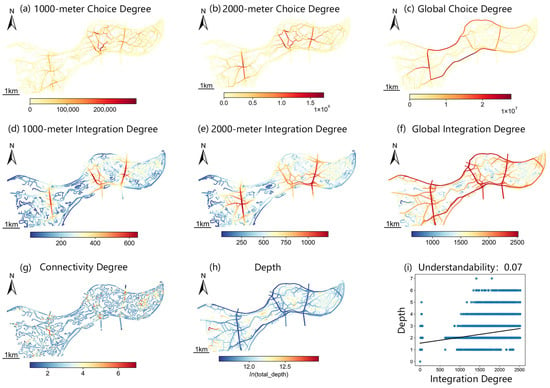
Figure 9.
It presents a comprehensive spatial syntax analysis of Yuzhong District, organised by key spatial metrics across various scales.
Figure 9a–c examines the concept of choice, which captures how frequently a spatial segment appears on the shortest paths between all other pairs of segments, drawing a parallel to betweenness centrality in graph theory. This metric acts as a proxy for potential movement flow and spatial importance. The 1000 m choice emphasises pedestrian-scale connectivity, revealing commonly travelled paths within a 10–15 min walk. At a larger scale, the 2000 m choice highlights the significance of certain subdistricts within the urban network, while the global choice identifies major throughways at the city scale. In Yuzhong District, areas with high choice values are concentrated in the eastern and northern regions, often coinciding with subway lines and major north–south arteries. Conversely, lower choice values tend to be found in older neighbourhoods and hillside parks, which are less accessible due to elevation differences or physical barriers.
Turning to integration (Figure 9d–f), this metric quantifies the ease with which a space can be accessed from all other spaces in the system, with higher integration indicating greater spatial centrality. The 1000 m integration metric reflects local walkability and intra-neighbourhood connectivity, while the 2000 m integration highlights intermediate-scale access across subcentres. On a broader scale, global integration assesses overall centrality in the city’s spatial network. In Yuzhong, highly integrated spaces are found along major arterial roads and subway corridors, particularly in the east and west. Streets with high integration often connect to metro stations, underscoring the critical role of transit in shaping the urban structure of mountainous cities like Chongqing, China.
Next, Figure 9g delves into connectivity, which measures how many spaces are directly connected to a given unit, offering a gauge of local spatial complexity. Notably, areas with high connectivity include subway hubs and the Jiefangbei commercial district, where a dense mix of old and new buildings creates a complex and highly interconnected street grid. Furthermore, Jiefangbei serves as a vital link to major tourist attractions such as Hongyadong and Shibati, further enhancing its connectivity score.
In Figure 9h, depth is analysed, indicating the cumulative number of steps required to reach all other spaces from a given location. Lower depth values suggest higher accessibility. Commercial cores, parks, and high-density residential areas in Yuzhong all demonstrate lower depth values, confirming their role as easily accessible and commonly visited nodes within the district.
Finally, Figure 9i presents intelligibility, which measures the relationship between local connectivity and global integration, offering insights into whether local features help users navigate the broader spatial system. Intelligibility values between 2 and 3 suggest low intelligibility, where wayfinding is challenging and disorientation is common; values from 3 to 5 indicate moderate intelligibility, where navigation is generally intuitive but where errors may occur; and values between 5 and 6 suggest high intelligibility, with a legible and user-friendly environment. In Yuzhong, intelligibility varies significantly across zones. Areas with well-organised street systems, such as commercial corridors and transit-linked zones, exhibit higher intelligibility, while older and more irregular neighbourhoods tend to score lower.
By integrating GPT-4o’s aesthetic evaluation with spatial syntax metrics, this analysis not only reveals the attractiveness of different urban spaces but also explains why they are perceived as such—based on their structural accessibility, legibility, and spatial prominence. This dual approach provides valuable insights for urban design, walkability enhancement, and the development of targeted aesthetic strategies.
4.4. Joint Analysis of Streetscape Aesthetic and Accessibility
By integrating GPT-4o aesthetic evaluation with spatial syntax metrics, we are able to uncover not only how attractive different urban spaces are, but also why—based on their structural accessibility, legibility, and spatial prominence. This dual analysis offers actionable insights for targeted interventions in urban design, walkability enhancement, and aesthetic improvement strategies.
Based on the above analysis, the Yuzhong District was classified into four categories according to visual attractiveness and spatial accessibility. A point density map was generated to illustrate the distribution of each category (as shown in Figure 10), which are discussed as follows:
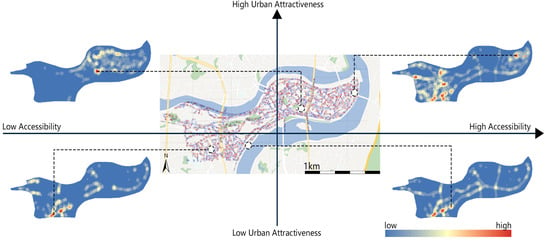
Figure 10.
Quadrant diagram of streetscape aesthetic vs. accessibility.
- High Visual attractiveness and High Accessibility:
This category encompasses the core commercial, cultural, and tourist landmarks of Yuzhong District—areas that combine visually appealing streetscapes with highly developed transportation networks. A prime example is the Jiefangbei area, Chongqing’s most iconic commercial hub. Jiefangbei boasts a rich historical and cultural context, with particularly attractive urban design elements, including pedestrian streets and open plazas. Its high accessibility is ensured by the convergence of multiple metro lines and a well-integrated public transportation system, making it one of the most reachable areas in the district.
- 2.
- High Visual attractiveness but Low Accessibility:
These areas score high in visual attractiveness but are located in zones with complex or limited transportation infrastructure. For instance, Chaotianmen and its surrounding historic neighbourhoods exhibit notable scenic and cultural value but suffer from constrained accessibility due to narrow streets, limited transit options, and the ageing infrastructure characteristic of the old city. Future urban planning initiatives should aim to improve accessibility in these areas by enhancing public transit coverage, expanding pedestrian pathways, and upgrading adjacent road networks.
- 3.
- Low Visual attractiveness but High Accessibility:
These zones are well-connected but lack visual appeal, often due to homogeneous architectural styles or insufficient streetscape design. A representative example is the commercial area surrounding Hongyadong, one of Chongqing’s major tourist destinations. Despite its excellent transit accessibility, parts of the area exhibit overly commercialised and visually monotonous urban forms. Enhancing the aesthetic quality of these streetscapes—through increased greenery, façade improvements, and better pedestrian experience—would help elevate both the visual and experiential dimensions of these high-accessibility areas.
- 4.
- Low Visual attractiveness and Low Accessibility:
This category includes peripheral zones with limited transport connectivity and minimal aesthetic appeal, such as certain ageing residential blocks and industrial sites. These areas are typically located far from the urban core and exhibit poor streetscape quality. Rather than prioritising large-scale development, urban planning efforts should focus on upgrading infrastructure and environmental conditions to enhance overall liveability. Measures may include improved transit access, increased public amenities, and enhanced landscape design, while avoiding over-commercialization to mitigate the risk of environmental degradation and unsustainable urban sprawl.
5. Discussion
5.1. Differentiated Development Strategies for Chongqing Streetscapes
By integrating visual attractiveness scores with spatial accessibility metrics, this study classifies the streetscape areas of Chongqing in China to inform differentiated development strategies. For areas exhibiting both high attractiveness and high accessibility, the recommendation is to prioritise preservation and enhancement of their appeal. Areas with high attractiveness but low accessibility should be targeted for infrastructure improvement to unlock their tourism potential. Conversely, zones with low attractiveness but high accessibility can benefit from visual and environmental enhancements through strategic landscape design. Lastly, regions with both low attractiveness and low accessibility should avoid large-scale development, instead focusing on optimising resource allocation and improving liveability. This systematic framework supports a more rational spatial distribution of urban functions, thereby improving both the city’s tourism appeal and functional coherence.
Leveraging MLLMs in conjunction with street-view imagery enables rapid, scalable, and accurate evaluation of urban environments. This approach offers a scientific and data-driven methodology for uncovering aesthetic potential and optimising tourism resource allocation, thereby informing urban development strategies. For example, the “Constructing High-Quality Livable Cities” study applies street-view deep learning models to evaluate urban street liveability from human-needs perspectives, linking visual quality directly with accessibility and well-being [44]. Similarly, the urban MLLM model has demonstrated a comprehensive understanding of urban environments by fusing remote sensing and street-level data [45]. Another study in Land shows that integrating semantic segmentation outputs from street imagery with sDNA-based accessibility metrics can form a multi-dimensional diagnostic matrix—exactly aligning with our “high/low attractiveness × high/low accessibility” classification scheme [46]. Similarly, the street-view LLM framework—through chain-of-thought reasoning and integration of multimodal data—has achieved higher precision and granularity in geospatial feature extraction [47], expanding the toolkit available for urban planning and infrastructure management.
In this study, we introduce a standardised and reproducible streetscape evaluation pipeline using GPT-4o, significantly reducing reliance on costly human annotation. Compared with crowdsourced human scores, the GPT-4o model achieves greater consistency (R2 = 0.695) and interpretability. By combining the pairwise comparison paradigm of Place Pulse 2.0 with spatial syntax metrics, our method enables automated, city-scale generation of two-dimensional attractiveness–accessibility diagnostics—from individual images to comprehensive urban zones. Its advantages lie in its ability to fuse deep cross-modal features, maintain inferential consistency at scale, and offer traceable explanations for misjudgements in complex settings (e.g., steep terrain, natural obstructions).
The proposed framework exhibits broad applicability across multiple domains: In urban planning and landscape design, it supplies data-driven priorities for site selection and targeted interventions—especially within “low-attractiveness, high-accessibility” zones—thereby sharpening the allocation of landscape-improvement resources. In tourism and commerce, it delivers quantitative assessments of landmark appeal and refines pedestrian and transit routes to boost visitor experience and commercial vitality. In smart governance, incremental street-image updates allow it to flag illegal construction, façade deterioration, and visual pollution in near-real time. In academic research, it establishes an open, multimodal urban-perception benchmark that catalyses interdisciplinary advances spanning urban psychology, computational social science and AI aesthetics. By embedding intuitive visualisations in public platforms, it invites citizen co-creation, closing human–AI–planning feedback loops that nurture aesthetically richer, people-centred urban environments.
5.2. Design Strategies and Limitations of MLLMs in Urban Aesthetic Evaluation
Based on the aesthetic framework developed in this study and the analysis of MLLM scoring deviations, a number of design strategies are proposed to enhance streetscape attractiveness. First, spatial openness and layout quality are critical. Designs should avoid overly narrow or cluttered environments, expand pedestrian zones and green spaces, and reduce physical barriers to enhance visual comfort and flow. Recent studies show that the spatial configuration and continuity of green spaces have a greater influence on visual preference than the amount of greenery alone [48]. Studies show that unobstructed skies and verdant canopies consistently yield higher aesthetic scores [49]. Second, natural elements and greenery should be prioritised. Although MLLMs sometimes misinterpret shade as visual occlusion, humans generally perceive tree cover as aesthetically enriching. Thus, incorporating tree species that offer seasonal variety and shade can elevate the street’s visual quality. Furthermore, drawing on embodied and phenomenological approaches from environmental psychology, aesthetic appreciation is deeply grounded in perceptual experience—our direct sensory encounter with the space shapes affective and cognitive responses. As Bianchi, Actis-Grosso, and Ball [33] point out, elements like coherence, complexity, mystery, and openness are felt through the lived, embodied experience of the environment, engaging our attention and emotional systems immediately. This means that design strategies enhancing gestalt-level perceptual richness—for instance, varying textures, light and shade patterns, and layered green canopies—do not just please the eye; they directly activate embodied perceptual-cognitive processes that underlie aesthetic judgement and environmental restorativeness.
In terms of lighting and colour, balanced illumination and coherent chromatic schemes enhance visual comfort. Excessively harsh or dim lighting should be avoided, while colours should be soft and harmonious. Symmetry and spatial fluidity are also central to aesthetic experience—streetscapes should favour visual balance, symmetrical layouts, and smooth curvature to enhance spatial dynamism. Integrating dynamic and static elements can further boost spatial vibrancy and user engagement. Finally, perceived safety and functional coherence should not be overlooked. Streets should avoid traffic-congested zones, include protected pedestrian pathways, and implement effective traffic management systems to ensure pedestrian safety.
In conclusion, optimising elements such as spatial layout, greenery, lighting, visual design, and safety infrastructure can significantly enhance the aesthetic value of urban streetscapes. MLLMs play a key role in urban aesthetic evaluation due to their ability to fuse cross-modal features, maintain consistent inferences across different scales, and represent complex semantic data hierarchies. These models are capable of extracting low-level visual features like colour, proportion, and contour while also integrating aesthetic principles from text to conduct comprehensive assessments of the theme, mood, and spatial harmony within large datasets [50]. However, despite their impressive capabilities, MLLMs face a number of limitations. Aesthetic judgement is inherently subjective and can vary across cultures and contexts, which makes it challenging for these models to account for all nuances in human perception [49]. Additionally, MLLMs may struggle with recognising finer scene details, potentially missing key aspects that are crucial for accurate urban evaluation. Training bias is another concern, as models may misinterpret regional symbols or historical architectural styles if their training data is not sufficiently diverse, resulting in a misalignment with authentic human perception.
When focusing specifically on GPT-based models, several critical limitations emerge in relation to visual attractiveness assessment. One of the challenges is scale mismatch, as streetscapes involve multi-scale cues that range from small details, like façade elements, to large-scale features such as city skylines, which are difficult to capture accurately with fixed-resolution models. Furthermore, the absence of dynamic and multisensory input limits the model’s ability to replicate the real-life ambiance of urban spaces, which is shaped by factors like pedestrian density, noise, olfactory cues, and changing light conditions throughout the day. Lastly, these models lack a strong socio-functional context, which is crucial in urban aesthetics. Urban aesthetics are deeply intertwined with aspects like safety, accessibility, and cultural vibrancy, yet GPT’s semantic embeddings do not have structured representations of these dimensions, making them less useful for policy-making and urban planning. Addressing these challenges will be crucial for advancing MLLMs and making them more reliable tools for human-centred, aesthetically informed urban development.
6. Conclusions
6.1. Research Contributions and Limitations
The contributions of this research are novel in the context of urban landscape attractiveness assessment. While previous studies have explored various methods for evaluating urban aesthetics—such as using deep learning models like convolutional neural networks (CNNs) or crowdsourced ratings—none have combined the use of a multimodal large language model (MLLM) like GPT-4o for this specific task. The key novelty of our approach lies in leveraging GPT-4o’s advanced capabilities for both image comprehension and linguistic reasoning to conduct automated, scalable, and efficient aesthetic evaluations. In contrast to labour-intensive human evaluations, the framework presented here offers a systematic and reproducible method for assessing visual attractiveness. Additionally, transforming the open-ended question “Which image is more attractive?” into a structured decision task enables the extraction of clearer, more consistent outcomes, which are particularly valuable for large-scale assessments. This method not only accelerates the evaluation process by reducing inference time but also ensures high consistency across evaluations, offering a significant advancement over traditional methods.
This study demonstrates the efficiency and automation advantages of MLLMs in the task of visual attractiveness assessment and introduces an innovative methodology tailored to streetscape evaluation and design. By leveraging MLLMs to automatically analyse the aesthetic features of street-view images—including colour harmony, spatial proportion, and architectural silhouette—we achieved large-scale, rapid assessment of visual attractiveness. This approach significantly improves evaluative efficiency while ensuring consistency in scoring criteria, thereby reducing subjectivity and offering a high-throughput, standardised solution for aesthetic analysis.
Moreover, by coupling these attractiveness assessments with accessibility modelling, we provide actionable insights for urban planning, which represents a novel integration of urban design analysis and machine learning. The methodology is broadly applicable within urban planning and design, offering a quantitative and scientifically grounded framework for evaluating, optimising, and enhancing urban streetscapes. For urban designers and planners, this represents a resource-efficient and operationally feasible tool that supports the creation of more aesthetically compelling urban environments. Ultimately, it provides valuable reference for the aesthetic refinement of future urban streetscapes and the enhancement of visual quality in the built environment.
While our approach utilises a global GPT perspective, it is important to recognise that aesthetic preferences are often shaped by cultural values and regional contexts. In future work, it may be beneficial to refine the model to account for these differences, potentially incorporating cultural filters to ensure a more accurate and context-sensitive evaluation of urban streetscapes.
6.2. Future Research Directions
Future studies may further explore the cultural adaptability of MLLMs, with particular focus on how aesthetic biases manifest across different cultural contexts. Understanding how MLLMs interpret and apply culturally specific aesthetic standards—such as colour preferences or architectural styles—could inform the development of culturally sensitive models. By identifying and calibrating for these cultural variations, MLLMs can achieve more accurate and contextually relevant evaluations, better aligning with the diverse aesthetic expectations of global urban populations.
In addition, the proposed methodology could be extended to a variety of domestic cities across China, enhancing the model’s robustness in responding to diverse urban environments. Significant variations in climate, cultural heritage, and architectural identity exist across Chinese cities. By retraining or fine-tuning MLLMs to accommodate these regional differences, the models could more precisely capture localised expressions of visual attractiveness. For instance, in tropical cities, shaded areas might be perceived as enhancing comfort, whereas in colder climates, open and sunlit streetscapes may be deemed more visually appealing.
This adaptability would allow MLLMs not only to provide localised, culturally resonant aesthetic assessments for planning purposes but also to support the design of urban environments that are more closely aligned with the lived experiences and preferences of local populations—ultimately contributing to the formation of distinctive, engaging, and human-centred urban identities.
Author Contributions
Conceptualization, Q.Z. and J.Z.; methodology, Q.Z., J.Z. and Z.Z.; software, Q.Z., Z.Z. and J.Z.; formal analysis, Q.Z. and J.Z.; data curation, Q.Z. and J.Z.; writing—original draft preparation, Q.Z. and J.Z.; writing—review and editing, Q.Z. and J.Z.; supervision, Z.Z. All authors have read and agreed to the published version of the manuscript.
Funding
This work was supported by the General Project of Humanities and Social Sciences of Universities in Jiangxi Province (Grant No. JC24203).
Data Availability Statement
Data and materials are available from the authors upon request.
Acknowledgments
The authors thank the anonymous reviewers for their valuable comments and suggestions on this article.
Conflicts of Interest
The authors declare that they have no conflicts of interest or personal relationships that could have appeared to influence the work reported in this paper.
References
- Luo, S.; Xie, J.; Furuya, K. Assessing the Preference and Restorative Potential of Urban Park Blue Space. Land 2021, 10, 1233. [Google Scholar] [CrossRef]
- De Vries, S.; Van Dillen, S.M.E.; Groenewegen, P.P.; Spreeuwenberg, P. Streetscape Greenery and Health: Stress, Social Cohesion and Physical Activity as Mediators. Soc. Sci. Med. 2013, 94, 26–33. [Google Scholar] [CrossRef]
- Hou, X.; Chen, P. Analysis of Road Safety Perception and Influencing Factors in a Complex Urban Environment—Taking Chaoyang District, Beijing, as an Example. ISPRS Int. J. Geo-Inf. 2024, 13, 272. [Google Scholar] [CrossRef]
- Wan, R.; Zhang, J.; Huang, Y.; Li, Y.; Hu, B.; Wang, B. Leveraging Diffusion Modeling for Remote Sensing Change Detection in Built-Up Urban Areas. IEEE Access 2024, 12, 7028–7039. [Google Scholar] [CrossRef]
- Yi, K.; Xu, Z. Exploring the Aesthetic Principles of Traditional Lingnan Architecture in Guangzhou Influencing Economic Development and Socio-Economic Perspective—A Notch from Public Well-Being and Modernity. J. Inf. Syst. Eng. 2023, 8, 22838. [Google Scholar] [CrossRef]
- Zawadzka, A.K. Architectural and Urban Attractiveness of Small Towns: A Case Study of Polish Coastal Cittaslow Towns on the Pomeranian Way of St. James. Land 2021, 10, 724. [Google Scholar] [CrossRef]
- Zhang, J.; Fang, J.; Zhang, C.; Zhang, W.; Ren, H.; Xu, L. Geographic Named Entity Matching and Evaluation Recommendation Using Multi-Objective Tasks: A Study Integrating a Large Language Model (LLM) and Retrieval-Augmented Generation (RAG). ISPRS Int. J. Geo-Inf. 2025, 14, 95. [Google Scholar] [CrossRef]
- Tang, F.; Zeng, P.; Wang, L.; Zhang, L.; Xu, W. Urban Perception Evaluation and Street Refinement Governance Supported by Street View Visual Elements Analysis. Remote Sens. 2024, 16, 3661. [Google Scholar] [CrossRef]
- He, H.; Xiong, W.; Zhou, F.; He, Z.; Zhang, T.; Sheng, Z. Topology-Aware Multi-View Street Scene Image Matching for Cross-Daylight Conditions Integrating Geometric Constraints and Semantic Consistency. ISPRS Int. J. Geo-Inf. 2025, 14, 212. [Google Scholar] [CrossRef]
- Salesses, P.; Schechtner, K.; Hidalgo, C.A. The Collaborative Image of The City: Mapping the Inequality of Urban Perception. PLoS ONE 2013, 8, e68400. [Google Scholar] [CrossRef]
- Naik, N.; Philipoom, J.; Raskar, R.; Hidalgo, C. Streetscore—Predicting the Perceived Safety of One Million Streetscapes. In Proceedings of the 2014 IEEE Conference on Computer Vision and Pattern Recognition Workshops, Columbus, OH, USA, 23–28 June 2014; IEEE: New York, NY, USA, 2014; pp. 793–799. [Google Scholar]
- Zheng, S.; Zhang, J.; Zu, R.; Li, Y. Visual Perception Differences and Spatiotemporal Analysis in Commercialized Historic Streets Based on Mobile Eye Tracking: A Case Study in Nanchang Wanshou Palace, China. Buildings 2024, 14, 1899. [Google Scholar] [CrossRef]
- Zhou, G.; Zhi, H.; Gao, E.; Lu, Y.; Chen, J.; Bai, Y.; Zhou, X. DeepU-Net: A Parallel Dual-Branch Model for Deeply Fusing Multiscale Features for Road Extraction From High-Resolution Remote Sensing Images. IEEE J. Sel. Top. Appl. Earth Obs. Remote Sens. 2025, 18, 9448–9463. [Google Scholar] [CrossRef]
- Ali, M.B.; Jamal, S. Modelling the present and future scenario of urban green space vulnerability using PSR based AHP and MLP models in a Metropolitan city Kolkata Municipal Corporation. Geol. Ecol. Landsc. 2024, 8, 1–19. [Google Scholar] [CrossRef]
- Pan, J.; Deng, Y.; Yang, Y.; Zhang, Y. Location-Allocation Modelling for Rational Health Planning: Applying a Two-Step Optimization Approach to Evaluate the Spatial Accessibility Improvement of Newly Added Tertiary Hospitals in a Metropolitan City of China. Soc. Sci. Med. 2023, 338, 116296. [Google Scholar] [CrossRef] [PubMed]
- Zhou, G.; Qian, L.; Gamba, P. A Novel Iterative Self-Organizing Pixel Matrix Entanglement Classifier for Remote Sensing Imagery. IEEE Trans. Geosci. Remote Sens. 2025, 62, 1–21. [Google Scholar] [CrossRef]
- Han, Y.; Liu, J.; Luo, A.; Wang, Y.; Bao, S. Fine-Tuning LLM-Assisted Chinese Disaster Geospatial Intelligence Extraction and Case Studies. ISPRS Int. J. Geo-Inf. 2025, 14, 79. [Google Scholar] [CrossRef]
- Brown, T.B.; Mann, B.; Ryder, N.; Subbiah, M.; Kaplan, J.; Dhariwal, P.; Neelakantan, A.; Shyam, P.; Sastry, G.; Askell, A.; et al. Language Models Are Few-Shot Learners. Adv. Neural Inf. Process. Syst. 2020, 33, 1877–1901. [Google Scholar]
- Zhang, J.; Li, Y.; Fukuda, T.; Wang, B. Urban Safety Perception Assessments via Integrating Multimodal Large Language Models with Street View Images. Cities 2025, 165, 106122. [Google Scholar] [CrossRef]
- Liang, H.; Zhang, J.; Li, Y.; Wang, B.; Huang, J. Automatic Estimation for Visual Quality Changes of Street Space via Street-View Images and Multimodal Large Language Models. IEEE Access 2024, 12, 87713–87727. [Google Scholar] [CrossRef]
- Zhang, J.; Xiang, R.; Kuang, Z.; Wang, B.; Li, Y. ArchGPT: Harnessing Large Language Models for Supporting Renovation and Conservation of Traditional Architectural Heritage. Herit. Sci. 2024, 12, 220. [Google Scholar] [CrossRef]
- Kim, J.; Kim, S. Finding the Optimal D/H Ratio for an Enclosed Urban Square: Testing an Urban Design Principle Using Immersive Virtual Reality Simulation Techniques. Int. J. Environ. Res. Public Health 2019, 16, 865. [Google Scholar] [CrossRef] [PubMed]
- Salahi, S.; Moztarzadeh, H. Providing Design Solutions of Urban Facades Based On the Aesthetics Principles of Colors Case Study: Afifabad Street Shiraz. Space Ontol. Int. J. 2023, 12, 61–76. [Google Scholar] [CrossRef]
- Salingaros, N.A. Design Patterns and Living Architecture; Levellers Press: Amherst, MA, USA, 2017. [Google Scholar]
- Zhang, J.; Hu, J.; Zhang, X.; Li, Y.; Huang, J. Towards a Fairer Green City: Measuring Unfairness in Daily Accessible Greenery in Chengdu’s Central City. J. Asian Archit. Build. Eng. 2023, 23, 1–20. [Google Scholar] [CrossRef]
- Zhang, H.; Ao, M.; Ardabili, N.G.; Xu, Z.; Wang, J. Impact of Urban Sunken Square Design on Summer Outdoor Thermal Comfort Using Machine Learning. Urban Clim. 2024, 58, 102214. [Google Scholar] [CrossRef]
- Zhang, J.; Yu, Z.; Li, Y.; Wang, X. Uncovering Bias in Objective Mapping and Subjective Perception of Urban Building Functionality: A Machine Learning Approach to Urban Spatial Perception. Land 2023, 12, 1322. [Google Scholar] [CrossRef]
- Tan, R.; Wu, Y.; Zhang, S. Walking in Tandem with the City: Exploring the Influence of Public Art on Encouraging Urban Pedestrianism within the 15-Minute Community Living Circle in Shanghai. Sustainability 2024, 16, 3839. [Google Scholar] [CrossRef]
- Wang, R.; Zhao, J.; Meitner, M.J.; Hu, Y.; Xu, X. Characteristics of Urban Green Spaces in Relation to Aesthetic Preference and Stress Recovery. Urban For. Urban Green. 2019, 41, 6–13. [Google Scholar] [CrossRef]
- Jaglarz, A. Perception of Color in Architecture and Urban Space. Buildings 2023, 13, 2000. [Google Scholar] [CrossRef]
- Li, L.; Chung, W. Application of Artificial Intelligence in Visual Communication of Green Urban Rural Integration Landscape Design. Ecol. Chem. Eng. S 2024, 31, 583–597. [Google Scholar] [CrossRef]
- Husselman, T.-A.; Filho, E.; Zugic, L.W.; Threadgold, E.; Ball, L.J. Stimulus Complexity Can Enhance Art Appreciation: Phenomenological and Psychophysiological Evidence for the Pleasure-Interest Model of Aesthetic Liking. J. Intell. 2024, 12, 42. [Google Scholar] [CrossRef] [PubMed]
- Bianchi, I.; Actis-Grosso, R.; Ball, L.J. Grounding Cognition in Perceptual Experience. J. Intell. 2024, 12, 66. [Google Scholar] [CrossRef] [PubMed]
- Zhang, F.; Zhou, B.; Liu, L.; Liu, Y.; Fung, H.H.; Lin, H.; Ratti, C. Measuring Human Perceptions of a Large-Scale Urban Region Using Machine Learning. Landsc. Urban Plan. 2018, 180, 148–160. [Google Scholar] [CrossRef]
- Russakovsky, O.; Deng, J.; Su, H.; Krause, J.; Satheesh, S.; Ma, S.; Huang, Z.; Karpathy, A.; Khosla, A.; Bernstein, M.; et al. ImageNet Large Scale Visual Recognition Challenge. Int. J. Comput. Vis. 2015, 115, 211–252. [Google Scholar] [CrossRef]
- Naik, N.; Kominers, S.D.; Raskar, R.; Glaeser, E.L.; Hidalgo, C.A. Computer Vision Uncovers Predictors of Physical Urban Change. Proc. Natl. Acad. Sci. USA 2017, 114, 7571–7576. [Google Scholar] [CrossRef]
- Liu, H.; Li, C.; Wu, Q.; Lee, Y.J. Visual Instruction Tuning. Adv. Neural Inf. Process. Syst. 2023, 36, 34892–34916. [Google Scholar]
- Kang, Y.; Abraham, J.; Ceccato, V.; Duarte, F.; Gao, S.; Ljungqvist, L.; Zhang, F.; Näsman, P.; Ratti, C. Assessing Differences in Safety Perceptions Using GeoAI and Survey across Neighbourhoods in Stockholm, Sweden. Landsc. Urban Plan. 2023, 236, 104768. [Google Scholar] [CrossRef]
- Ma, H.; Li, J.; Ye, X. Deep Learning Meets Urban Design: Assessing Streetscape Aesthetic and Design Quality through AI and Cluster Analysis. Cities 2025, 162, 105939. [Google Scholar] [CrossRef]
- Verma, D.; Mumm, O.; Carlow, V.M. Assessing Visual Similarity of Neighbourhoods with Street View Images and Deep Learning Techniques. J. Urban Des. 2024, 30, 1–12. [Google Scholar] [CrossRef]
- Vinchon, F.; Gironnay, V.; Lubart, T. GenAI Creativity in Narrative Tasks: Exploring New Forms of Creativity. J. Intell. 2024, 12, 125. [Google Scholar] [CrossRef]
- Sternberg, R.J. Do Not Worry That Generative AI May Compromise Human Creativity or Intelligence in the Future: It Already Has. J. Intell. 2024, 12, 69. [Google Scholar] [CrossRef] [PubMed]
- Vicovaro, M. Grounding Intuitive Physics in Perceptual Experience. J. Intell. 2023, 11, 187. [Google Scholar] [CrossRef] [PubMed]
- Li, M.; Fan, Z. Constructing High-Quality Livable Cities: A Comprehensive Evaluation of Urban Street Livability Using an Approach Based on Human Needs Theory, Street View Images, and Deep Learning. Land 2025, 14, 1095. [Google Scholar] [CrossRef]
- Suel, E.; Bhatt, S.; Brauer, M.; Flaxman, S.; Ezzati, M. Multimodal Deep Learning from Satellite and Street-Level Imagery for Measuring Income, Overcrowding, and Environmental Deprivation in Urban Areas. Remote Sens. Environ. 2021, 257, 112339. [Google Scholar] [CrossRef] [PubMed]
- Wu, T.; Lin, D.; Chen, Y.; Wu, J. Integrating Street View Images, Deep Learning, and sDNA for Evaluating University Campus Outdoor Public Spaces: A Focus on Restorative Benefits and Accessibility. Land 2025, 14, 610. [Google Scholar] [CrossRef]
- Li, X.; Wen, C.; Hu, Y.; Yuan, Z.; Zhu, X.X. Vision-Language Models in Remote Sensing: Current Progress and Future Trends. IEEE Geosci. Remote Sens. Mag. 2024, 12, 32–66. [Google Scholar] [CrossRef]
- Peng, Y.; Li, Z.; Shah, A.M.; Lv, B.; Liu, S.; Liu, Y.; Li, X.; Song, H.; Chen, Q. Decoding the Role of Urban Green Space Morphology in Shaping Visual Perception: A Park-Based Study. Land 2025, 14, 495. [Google Scholar] [CrossRef]
- Jiang, R.; Chen, C.W. Multimodal LLMs Can Reason about Aesthetics in Zero-Shot. arXiv 2025, arXiv:2501.09012. [Google Scholar] [CrossRef]
- Cai, C.; Kuriyama, K.; Gu, Y.; Biljecki, F.; Herthogs, P. Can a Large Language Model Assess Urban Design Quality? Evaluating Walkability Metrics Across Expertise Levels. arXiv 2025, arXiv:2504.21040. [Google Scholar] [CrossRef]
Disclaimer/Publisher’s Note: The statements, opinions and data contained in all publications are solely those of the individual author(s) and contributor(s) and not of MDPI and/or the editor(s). MDPI and/or the editor(s) disclaim responsibility for any injury to people or property resulting from any ideas, methods, instructions or products referred to in the content. |
© 2025 by the authors. Licensee MDPI, Basel, Switzerland. This article is an open access article distributed under the terms and conditions of the Creative Commons Attribution (CC BY) license (https://creativecommons.org/licenses/by/4.0/).