Article

Leadership in Energy and Environmental Design for Existing Buildings Version 4.1 (LEED-EB v4.1) Gold-Certified Office Space Projects in European and Mediterranean Countries: A Pairwise Comparative Analysis

Department of Civil Engineering, Ariel University, Ariel 40700, Israel
Buildings 2025, 15(16), 2972; https://doi.org/10.3390/buildings15162972
Submission received: 12 July 2025 / Revised: 13 August 2025 / Accepted: 20 August 2025 / Published: 21 August 2025
(This article belongs to the Section Building Energy, Physics, Environment, and Systems)

Abstract

There is a gap in the research on LEED-certified projects that has arisen from combining the “old” LEED system and “new” LEED version in green building practice. This study is focused on gold-certified office projects under LEED for Existing Buildings version 4.1 (LEED-EB v4.1). Wilcoxon–Mann–Whitney and Cliff’s δ tests were used to conduct a pairwise comparison of six countries (Sweden, Ireland, Germany, Spain, Italy, and Israel) in terms of five performance indicators (transportation, water, energy, waste, and indoor environmental quality). The results show that Sweden and Germany outperformed Italy (p = 0.002 and 0.018, respectively) in transportation performance. Ireland outperformed Italy and Israel (p = 0.015 and 0.032, respectively), and Germany outperformed Italy and Israel (p = 0.003 and 0.009, respectively) in water performance. Germany outperformed Sweden, Ireland, and Israel (p < 0.001, respectively) and Sweden, Spain, and Italy outperformed Israel (p < 0.001, p = 0.008, and p = 0.009, respectively) in energy performance. Italy outperformed Sweden, Ireland, Germany, and Israel (0.001 < p ≤ 0.013) and Spain outperformed Germany and Israel (p = 0.015 and p < 0.001, respectively) in waste performance. Israel outperformed Sweden, Germany, and Italy (p < 0.001, p < 0.001, and p = 0.006, respectively) and Spain, Ireland, and Italy outperformed Sweden (p < 0.001, p = 0.002, and p = 0.004, respectively) in indoor environmental quality performance. The findings of this study show that each of the six selected countries has an individual LEED-EB v4.1 certification strategy. This study contributes new knowledge that can support LEED professionals in developing LEED certification strategies for each country.

1. Introduction

The Leadership in Energy and Environmental Design (LEED) rating system was launched in 1998 by the U.S. Green Building Council to reduce the environmental impact of the U.S. building sector [1]. LEED has now become the most widely accepted and studied building green rating system worldwide [2,3] and in Europe [4].
It has been suggested [5] that each subsequent LEED version (v)—v1 (2000), v2.2 (2005), v3 (2009), v4 (2013), and v4.1 (2019)—may implement a more flexible LEED certification strategy and, as a result, may reduce environmental harm. In this paper, the literature review primarily focuses on LEED v3 and v4 because the difference between LEED certification strategies in each version was assessed using inferential statistics. Table 1 lists the LEED systems and LEED versions whose LEED-certified projects were used for comparisons between world regions, between countries from different regions, and between countries in the same region.
The abovementioned LEED systems, v3 and v4, encompass the following categories: sustainable sites (SSs), water efficiency (WE), energy and atmosphere (EA), materials and resources (MRs), indoor environmental quality (EQ), regional priority (RP), and innovation in design (ID); by contrast, v4 includes an additional location and transportation (LT) category, which has been separated from SSs [6,7]. This study focuses on the LEED-EB v4.1 system, which includes interval and binary data [8].
The LEED-EB system is completely different from the previous LEED-EB v2.2, v3, and v4 systems: LEED-EB focuses on performance-based prerequisites that are mandatory requirements for LEED certification. This system, in addition to the water and energy savings performance-based prerequisites in WE and EA (which already existed in LEED v2.2, v3, and 4), introduced, for the first time, performance-based prerequisites for LT, MRs, and EQ. Thus, LEED-EB prioritizes five performance-based prerequisites, LT, WE, EA, MRs, and EQ, encouraging measurements based on a project’s performance over a specified period of 1 year (365 consecutive days). This is because certification strategies for LEED-EB-certified projects may differ from those for LEED v3- and v4-certified projects and therefore require special consideration. Table 2 lists five main performance-based prerequisites with maximum points in the LEED-EB system. Table 3 lists ten binary credits with maximum points in the LEED-EB v4.1 system.
There are at least two fundamentally different approaches to examining LEED certification strategies. The first approach involves analyzing individual LEED-certified projects. This approach mainly describes a unique LEED certification strategy, e.g., [9,10] and is beyond the scope of this study. The second approach involves analyzing group trends in LEED-certified projects through comparisons between independent groups. The application of the latter approach is limited by several requirements: LEED-certified projects must belong to independent groups, each with the required sample size to conduct significance tests, to the same LEED system (e.g., EB), to the same LEED version (v) (e.g., v4.1), to the same certification level (e.g., gold), and to the same space type (e.g., office).
In this context, a research gap was identified when analyzing LEED-EB v4.1 gold-certified office projects using significance tests. Therefore, the objective of this study is to examine LEED-EB v4.1 gold-certified projects using significance tests in paired comparisons between six countries (i.e., Sweden, Ireland, Germany, Spain, Italy, and Israel). The novelty of this study is that the six countries studied have different LEED-EB v4.1 certification strategies. The findings of this study provide a reference to help LEED professionals in developing LEED certification strategies.
The importance of applying the LEED-EB v4.1 system in the Mediterranean region was highlighted in a study in 2020. Laera and de Pereda Fernández [11] noted in an editorial that certifying existing buildings to the LEED-EB v4.1 standard is considered one of the most effective strategies for energy savings and emissions reduction in Spain. El Sorady and Rizk [12] reported on the successful application of the LEED-EB system to Islamic buildings in historic Cairo. However, LEED-EB v4.1-certified projects have not yet been evaluated through comparisons between independent groups (e.g., between countries) using inferential statistics. Currently, a small number of LEED-EB v4.1-certified projects are available for analysis in Europe and the Mediterranean. Thus, neither descriptive nor inferential statistics have been presented in studies on LEED-EB v4.1-certified projects. In this context, the use of descriptive statistics may bias the conclusions for each country, whereas the use of inferential statistics, under certain conditions, namely the required sample size and an appropriate significance test, will allow more realistic conclusions to be drawn for each country.

2. Literature Review

2.1. Pairwise Comparison Worldwide

Wu et al. [13] used significance tests to compare different regions such as North America, East Asia, West Asia, and Europe in terms of LEED v2.2- and LEED v3-certified projects at the category level (total sample size = 5327). Wu et al. [14] used significance tests to compare differences between adjacent certification levels across the world: certified and silver, silver and gold, and gold and platinum (total sample size = 3416). In both studies, the statistical difference between independent groups was associated with a low p-value. However, the combination of large sample size and low p-value can sometimes be associated with a small or negligible effect size [15].
Chi et al. [16] used significance tests to compare China (n = 147) and the United States (n = 190) in terms of LEED-NC v3 2009 gold-certified projects. They showed that the difference between China and the US is characterized by a low p-value (statistical significance), while the effect size (substantive significance) is in the transition zone between negligible and small effect size. Pushkar [17] also used significance tests to compare the USA (n = 37) with China (n = 16) in LEED-CI v4 gold-certified projects, showing that the difference between China and the US is characterized by a low p-value and a large effect size. Thus, both comparisons had low p-values and significantly different effect sizes. A comparison of the results of the two abovementioned studies showed that reporting both p-value and effect size index is a necessary procedure, especially for large sample sizes.

2.2. Pairwise Comparison in European and Mediterranean Countries

Pushkar [18] studied the LEED–NC v3 2009 system through a comparison between northern (i.e., Finland and Sweden) and southern (i.e., Türkiye and Spain) European countries in terms of LEED–NC v3 gold-certified projects, showing that there are significant differences both between and within northern and southern European countries. Pushkar [19] studied the LEED–C-and-S v3 and v4 systems through comparisons between Finland (n = 11) and Spain (n = 11) regarding LEED–C-and-S v3 and v4 gold-certified projects and showed that there are significant differences between the two countries. Pushkar [20] studied the LEED–CI v3 and LEED–C-and-S v3 systems through pairwise comparisons between Türkiye, Spain, and Italy regarding LEED–CI v3 and LEED–C-and-S v3 gold-certified projects, respectively, showing that there are significant differences with large effect sizes between these three southern European countries in each of the two LEED systems. However, the lack of disaggregation of LEED data by building space type may limit the value of these studies’ findings.
Two studies compared Spain with Finland using LEED-EB v3- and v4-certified office projects and compared Mediterranean countries using LEED-CI v4-certified office projects at the gold certification level [21,22]. These studies found significant differences with large effect sizes between countries for each combination of LEED systems and LEED versions. In these two studies, when comparing countries, not only did LEED-certified projects have the same LEED system, version, and certification level, the LEED-certified projects also had the same space type in the building and the difference between countries was assessed using the p-value and effect size. This study design significantly increases the reliability of statistical conclusions. Table 4 shows the successive changes in both the methodology for selecting LEED-certified projects (LEED) and the methodology for applying inferential statistics (statistical design).

2.3. Research Gap

In 2016–2023, in the articles [13,14,16,17,18,19,20,21], a comparative analysis was used to estimate the difference in LEED certification strategies in terms of LEED v.2.2, v3, and v4 (the latest versions at the time) with the LEED-NC-, LEED-C-and-S-, LEED-EB-, and LEED-CI-certified projects having the required sample size to conduct the significance test. A comparative analysis showed that each new LEED version and each LEED system had different LEED certification strategies.
In 2024, Pushkar [22] used the comparative analysis to compare three Mediterranean countries, Spain, Türkiye, and Israel, regarding LEED-CI v4 gold-certified office projects. This study is the closest analog to the present study. However, the ongoing evolution of LEED is accompanied by the emergence of certification strategies, the implementation of which depends on the country of application. Consequently, the constant introduction of new combinations of the “old” LEED system and the “new” LEED version is accompanied by the emergence of a research gap in green building science.
Currently, a pairwise comparison between Sweden, Ireland, Germany, Spain, Italy, and Israel regarding LEED-EB v4.1 gold-certified office projects has not yet been conducted. Given the small sample of LEED-EB v4.1 gold-certified projects, using descriptive statistics would not allow one to conclude that differences between countries are not due to chance, whereas using inferential statistics would allow one to make this conclusion.

2.4. Purpose of This Study

The aim of this study is to conduct a pairwise comparison of six countries from different regions of Europe and the Mediterranean regarding LEED-EB v4.1 gold-certified office building projects. Achieving LEED gold certification level can be used to define different LEED certification strategies and contribute to the advancement of green building science. It should be noted that, for each of these countries, LEED-EB is the latest version with the sample sizes required to conduct the significance test for pairwise comparisons.

2.5. Novelty and Contribution

While the previous study [22] (a close analog to this study) used a pairwise comparative analysis of LEED-CI v4 gold-certified office projects, in this study, we perform an analysis of LEED-EB v4.1 gold-certified office projects. LEED-CI and LEED-EB are subsystems of the same overall LEED system, but they have fundamental differences in LEED certification strategy. LEED v4.1 is fundamentally different from LEED v4. The novelty of this study lies in the fact that each of the six selected countries has a different LEED-EB v4.1 certification strategy. This study provides new knowledge for LEED professionals that can be used in selecting LEED certification strategies in each of these countries. This study is the first to compare LEED-EB v4.1 gold-certified projects from six European and Mediterranean countries using inferential statistics.

3. Materials and Methods

3.1. Flowchart of Present Study

The flowchart in Figure 1 represents the design process for the following two sections of this study: data collection and data analysis.
Data collection involves two stages: (1) collecting LEED-EB v4.1-certified office projects in European and Mediterranean countries; and (2) selecting countries where LEED-EB v4.1-certified office projects at one of the certification levels had the required sample size to draw reliable statistical conclusions. Data analysis includes descriptive and inferential statistics for interval and binary data. Descriptive statistics include the boxplot method in graphical format, median and 25–75th percentiles, and percentage of mean score (PAS) in tabular format, while inferential statistics include the Wilcoxon–Mann–Whitney (WMW) exact test and Cliff’s δ effect size for interval data, and Fisher’s 2 × 2 exact test and natural logarithm of odds ratio (lnθ) effect size for binary data. Data collection and data analysis are presented in Section 3.2 and Section 3.3, respectively.

3.2. Data Collection

3.2.1. A Minimum Sample Size

LEED data contain both discrete (interval) data with “tied” data and binary data [23]. In this context, for “tied” data, the sample size (n) should be n1 = n2 ≥ 12 to obtain reliable conclusions [24]. Table 5 lists twenty countries from European and Mediterranean countries where at least one LEED-EB project was certified in both the Green Building Information Gateway (GBIG) and the U.S. Green Building Council (USGBC) databases [25,26].

3.2.2. Normality Assumption

Table 6 shows that the normality assumption was violated for three or four of the five LEED-EB performance indicators in LEED-EB v4.1 gold-certified office projects in six countries. Thus, for the LEED-EB v4.1 performance-based prerequisites (interval data), nonparametric descriptive and inferential statistics were used to compare the six countries. A similar approach was used to analyze LEED-EB v4.1 binary data.

3.3. Data Analysis

Both graphical and tabular formats were used to conduct the analysis. In the graphical format, the boxplot method was used to estimate the median (the central red line) and the 25th and 75th percentiles (the edges of the box); the whiskers extend to the most extreme datapoints the algorithm considers to be not outliers, and the outliers are plotted individually (red points) [27]. In tabular format, in both LEED interval and binary data, the median, 25–75th percentiles and effect size index were used. Additionally, the percentage of average scores (PAS)—the ratio of points obtained to the total points expressed as a percentage—was used to describe LEED binary data [7]. Cliff’s δ effect size [28] and exact Wilcoxon–Mann–Whitney (WMW) [24] tests were used to treat LEED interval data with “tied” data, while the natural logarithm of the odds ratio (lnθ) effect size [29] and Fisher’s exact 2 × 2 test with Lancaster’s mid-p-value [30] were used to treat LEED binary data. For the lnθ test, the Fleiss procedure (adding 0.5 to each observed frequency) was used if one of the proportions in the fourfold table was zero [31]. The formulas used to apply Cliff’s δ and lnθ have been described in detail in a previous study [32]. MATLAB 2024a was used to perform descriptive and inferential statistics [27,32].
The two-tailed p-value was calculated from both WMW and Fisher’s exact 2 × 2 tests. p-value was interpreted as the difference between two groups using three-valued logic: “it appears positive” indicates that there appears to be difference between the two groups, “it appears negative” suggests that there does not appear to be difference between the two groups, and “judgment is suspended” signifies that the conclusion is suspended [33,34]. Table 7 shows the absolute effect size thresholds (negligible, small, medium, and large) for Cliff’s δ and lnθ.
Wolker [37] and Durlak [38] noted that effect size is a general rule of thumb rather than a strict criterion, especially when there is limited knowledge. Translating statistical effect sizes into practical effect sizes in the field of LEED-certified projects is difficult due to limited knowledge in this area and requires further research.

3.4. The Relationship Between p-Value and Effect Size

Fisher [39] suggested that the level of significance α (typically α = 0.05) should be determined on a case-by-case basis, taking into account current knowledge. Beninger et al. [40] and Altman [41] pointed out that the interpretation of the p-value should not be based on the use of two-valued logic. Gotelli and Ellinson [42] recommended reporting the exact p-value to allow readers to interpret statistical inferences for themselves. Kennedy-Shaffer [43] noted that a balanced decision must be made by considering statistical significance (p-value) and substantive significance (effect size) in parallel. Hurlburt and Lombardi [33] argued that conclusions should be drawn based on p-value and effect size results as well as a review of the literature and the author’s experience.

4. Results and Discussion

4.1. LEED-Certified Project Size

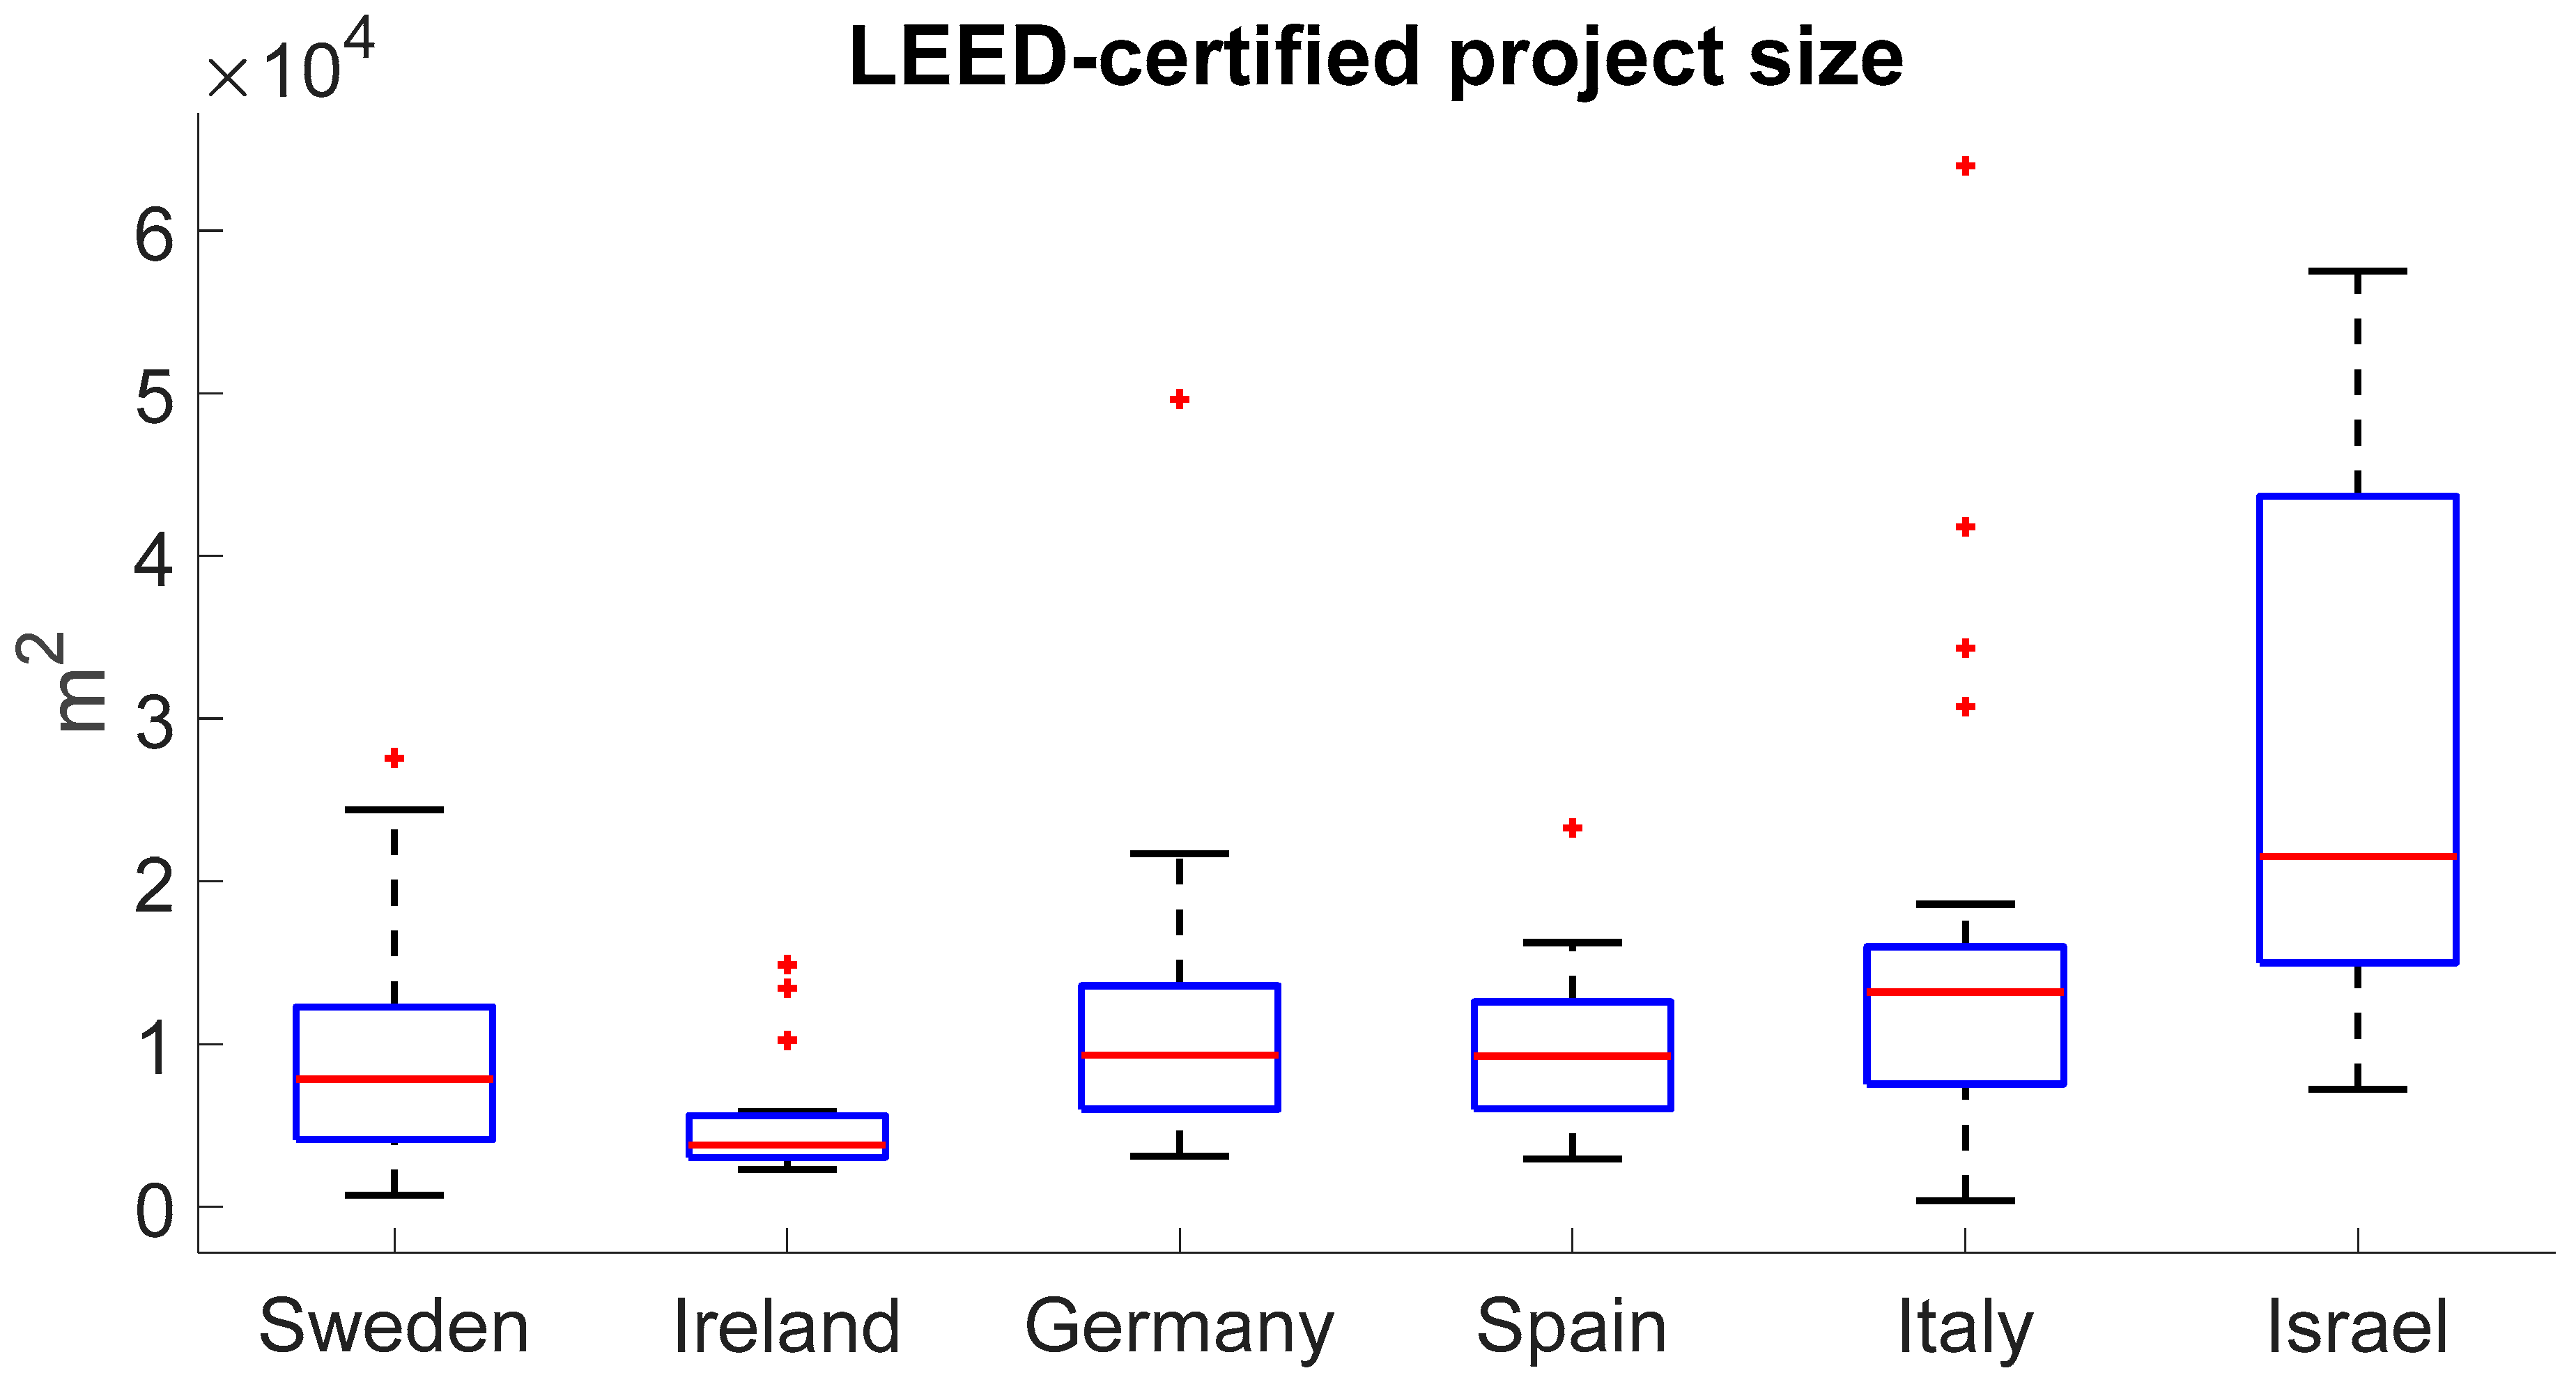
Figure 2 shows that Israel has the largest project size, Ireland the lowest, and Sweden, Germany’s, Spain’s, and Italy’s projects were of intermediate size. Israel outperformed Sweden, Ireland, Germany, Spain, and Italy.
Table 8 shows Israel outperformed all other five studied countries (the difference appears to be positive, p ≤ 0.002). Italy outperformed Ireland and Sweden (the difference appears to be positive, p = 0.006 and p = 0.028, respectively). Spain and Germany outperformed Ireland (the difference appears to be positive, p = 0.003 and p = 0.001, respectively). The judgment is suspended regarding the difference between Sweden and Ireland (p = 0.061). The differences between Italy, Spain and Germany and between Spain, Germany and Sweden appear to be negative (p ≥ 0.087).

4.2. Prerequisite: Transportation Performance

Prerequisite LT: Transportation performance requires a one-week survey of building occupant traffic flows once a year. This measure is the project’s average CO2 emissions per trip per occupant, which is then translated into a transportation score and ultimately LEED points. This LEED-EB performance presents CO2 emission values for each transport mode: from 0.26, 0.33, 0.39, 0.44, 0.68, and 0.93 CO2 pounds/mile for motorcycle, heavy rail, carpool, alternative fuel vehicles, bus, and car, respectively [8]. Depending on the distance traveled and the mode of transport, CO2 emissions per occupant are estimated. Then, taking into account the number of occupants of the building, the average CO2 emissions for the project are calculated. The final transport score is obtained using the transport efficiency function. This score is ultimately converted into LEED-EB points. Thus, a more sustainable mode of transport and a shorter traffic flow result in more LEED points.
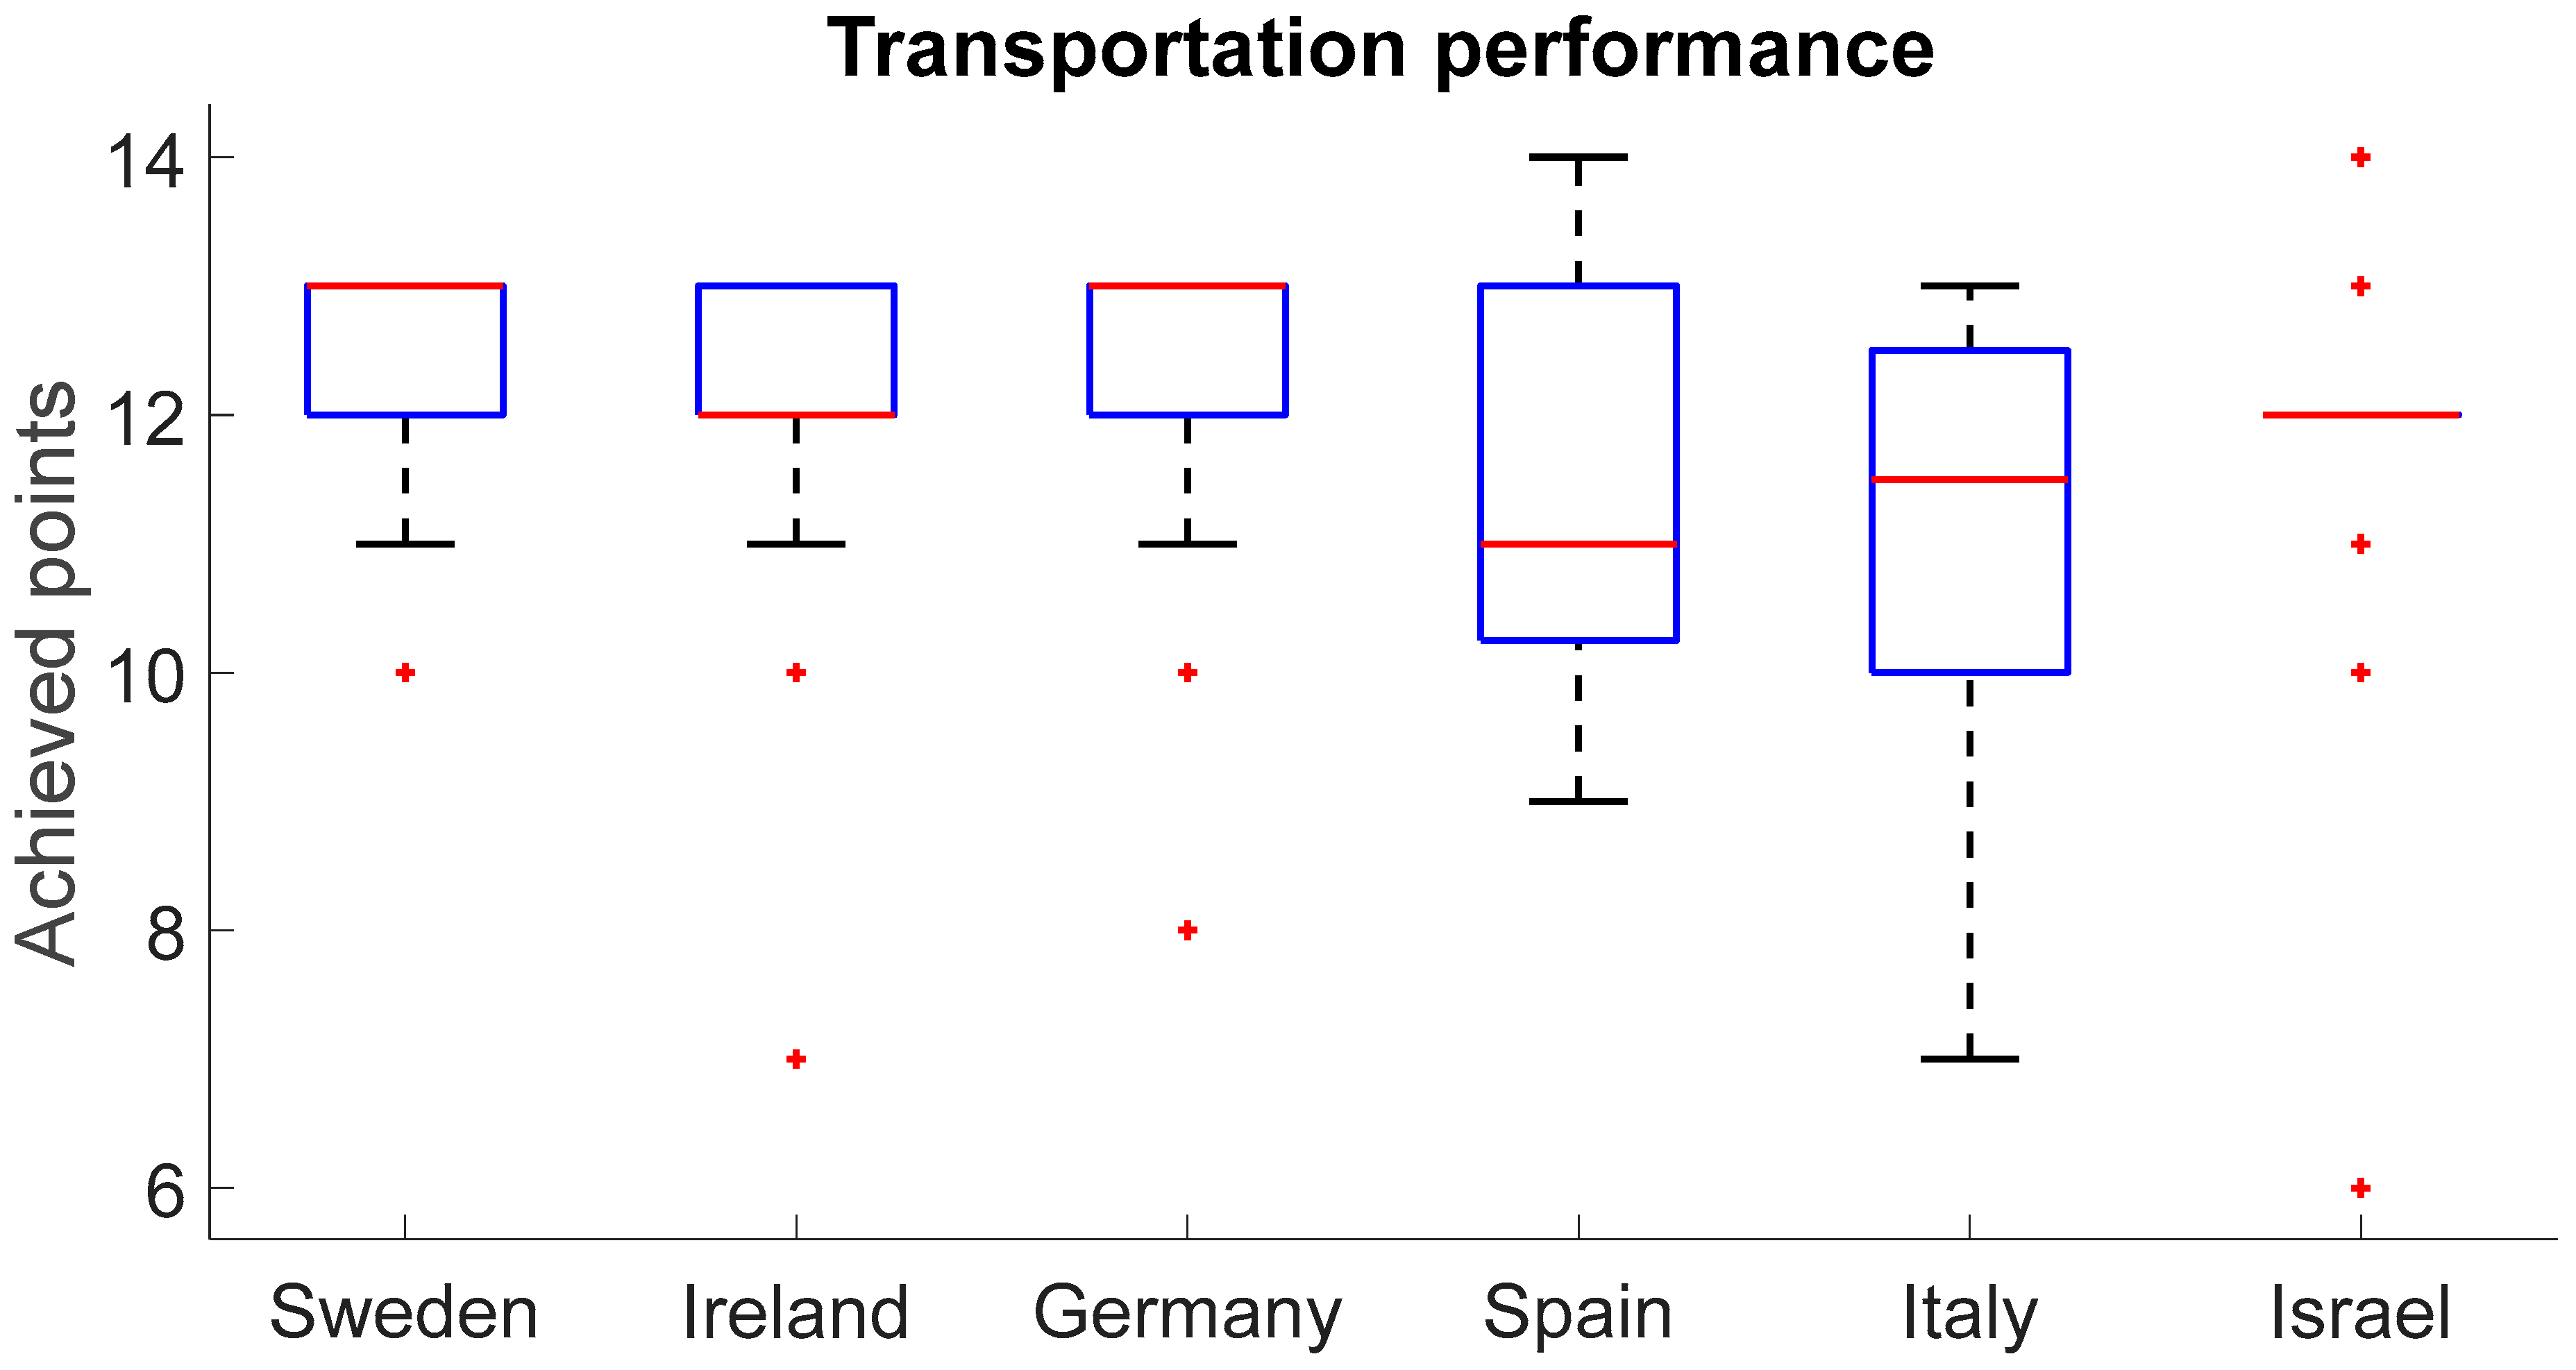
Figure 3 shows that Sweden and Germany have the highest median score (13 points), followed by Ireland and Israel (12 points), and then Italy (11.5 points) and Spain (11 points). However, only Israel has similar scores for the median and 25–75th percentiles. It can be assumed that this focus on equally high transport performance for almost all Israeli projects is probably due to the large size of the LEED-EB v4.1 project relative to other countries, as shown in Figure 2. This is because large buildings are usually located in densely populated areas with well-developed public transport infrastructure.
In this respect, Table 9 shows that, for this prerequisite, Sweden and Germany outperformed Italy (the difference appears to be positive; p = 0.002 and 0.018, respectively). The difference between the remaining 13 pairwise comparisons appears to be negative (p ≥ 0.070).
The highest number of projects were certified in large cities such as in Spain: Barcelona (10 projects) and Madrid (10 projects), Italy: Milano (19 projects); Germany: Berlin (12 projects) and Hamburg (6 projects); Sweden: Gothenburg (10 projects) and Stockholm (8 projects); Ireland: Dublin (15 projects); and Israel: Tel Aviv (8 projects). A complete list of cities where projects have been certified to LEED-EB is provided in Table A1 in Appendix A. All these cities have well-developed public transportation systems [44]. Therefore, as mentioned earlier, the median LEED scores were near the maximum (11.0–13.0) in all these countries.
The results of previous studies support the findings of this prerequisite. According to Dolge [44], among 28 European countries, the share of public transport, as well as the share of alternative fuel vehicles such as electric vehicles, in total passenger transport is much higher in Sweden, Ireland, and Germany than in Spain and Italy. Mandev and Sprei [45] measured the share of electrified kilometers of plug-in hybrid electric vehicles in total passenger turnover in 10 European countries and found that it was higher in Sweden, Germany, and Spain than in Italy.

4.3. Prerequisite WE: Water Performance

Prerequisite WE: Water performance requires a monthly measurement of total potable water consumption for one full year. Based on these data, it is necessary to calculate the water consumption in the project per resident and per unit area. The daily water consumption per occupant and the daily water consumption per unit of floor area of the building are calculated. Then, using these consumptions in combination with a function developed by LEED-EB based on water consumption data for high-performance buildings, a water score is determined. Ultimately, the water score is converted into LEED-EB points [8].
Figure 4 shows the results of the water performance analysis for six countries, presented as a boxplot. The median was highest in Germany (12 points), followed by Sweden and Ireland (11 points), Spain and Israel (10 points), and Italy (9 points). The narrowest range (25–75th percentile) was observed in Ireland, while the other five countries had a fairly wide range.
In this respect, Table 10 shows that, for this prerequisite, Ireland and Germany outperformed Italy and Israel (the difference appears to be positive, p = 0.015 and 0.032 and p = 0.003 and 0.009, for Ireland and Germany, respectively). Germany also outperformed Spain (the difference appears to be positive, p = 0.028). The judgment is suspended regarding the difference between Sweden and Germany and between Sweden and Italy (p = 0.051 and 0.062, respectively). The difference between the remaining eight pairwise comparisons appears to be negative (p ≥ 0.146).
As noted earlier, for all of these countries, the median LEED-EB water performance was not that close to the maximum of 15 points: 11.0 or 12.0 for Sweden, Ireland, and Germany, and 9.0 or 10.0 for Spain, Italy, and Israel. In Sweden, half of the drinking water comes from surface water and the other half from natural groundwater. However, according to interviews with local municipalities in Sweden, citizens are not aware of or interested in saving drinking water [46]. In Ireland, given the droughts, the need for water conservation measures is a major issue requiring public awareness [47]. In Germany, although rainwater and greywater treatment can improve water availability in urban areas, water conservation remains an important issue [48]. Thus, higher median LEED-EB water performance in Sweden, Ireland, and Germany would be more desirable.
Spain, Italy, and Israel are Mediterranean countries. The region is characterized by moderate climate change, accelerated population growth, and increasing natural water scarcity. Therefore, despite the advanced water purification technologies such as desalination used in the region, especially in Israel, water conservation still remains a very important factor [49]. However, according to the results, the median LEED-EB water performance in these countries was only 9.0 or 10.0 out of a possible 15.
Thus, LEED consultants and policymakers in Spain, Italy, and Israel should be aware of the low water savings in their LEED-certified buildings and be motivated to encourage communities to conserve drinking water.

4.4. Prerequisite EA: Energy Performance

Prerequisite EA: Energy performance requires monthly measurement of the total energy consumption of the project for one full year. The measured energy consumption is then converted into equivalent project greenhouse gas (GHG) emissions and source energy consumption per occupant and per unit area. After that, GHG emissions are converted into a GHG emissions score, and source energy consumption is converted into a source energy score. This conversion uses US Environmental Protection Agency regional grid factors for projects in the US and national grid factors from the International Energy Agency’s CO2 Emissions Report for other countries. Ultimately, the sum of the 50% GHG emission score and 50% energy source score determines the LEED-EB energy performance [8].
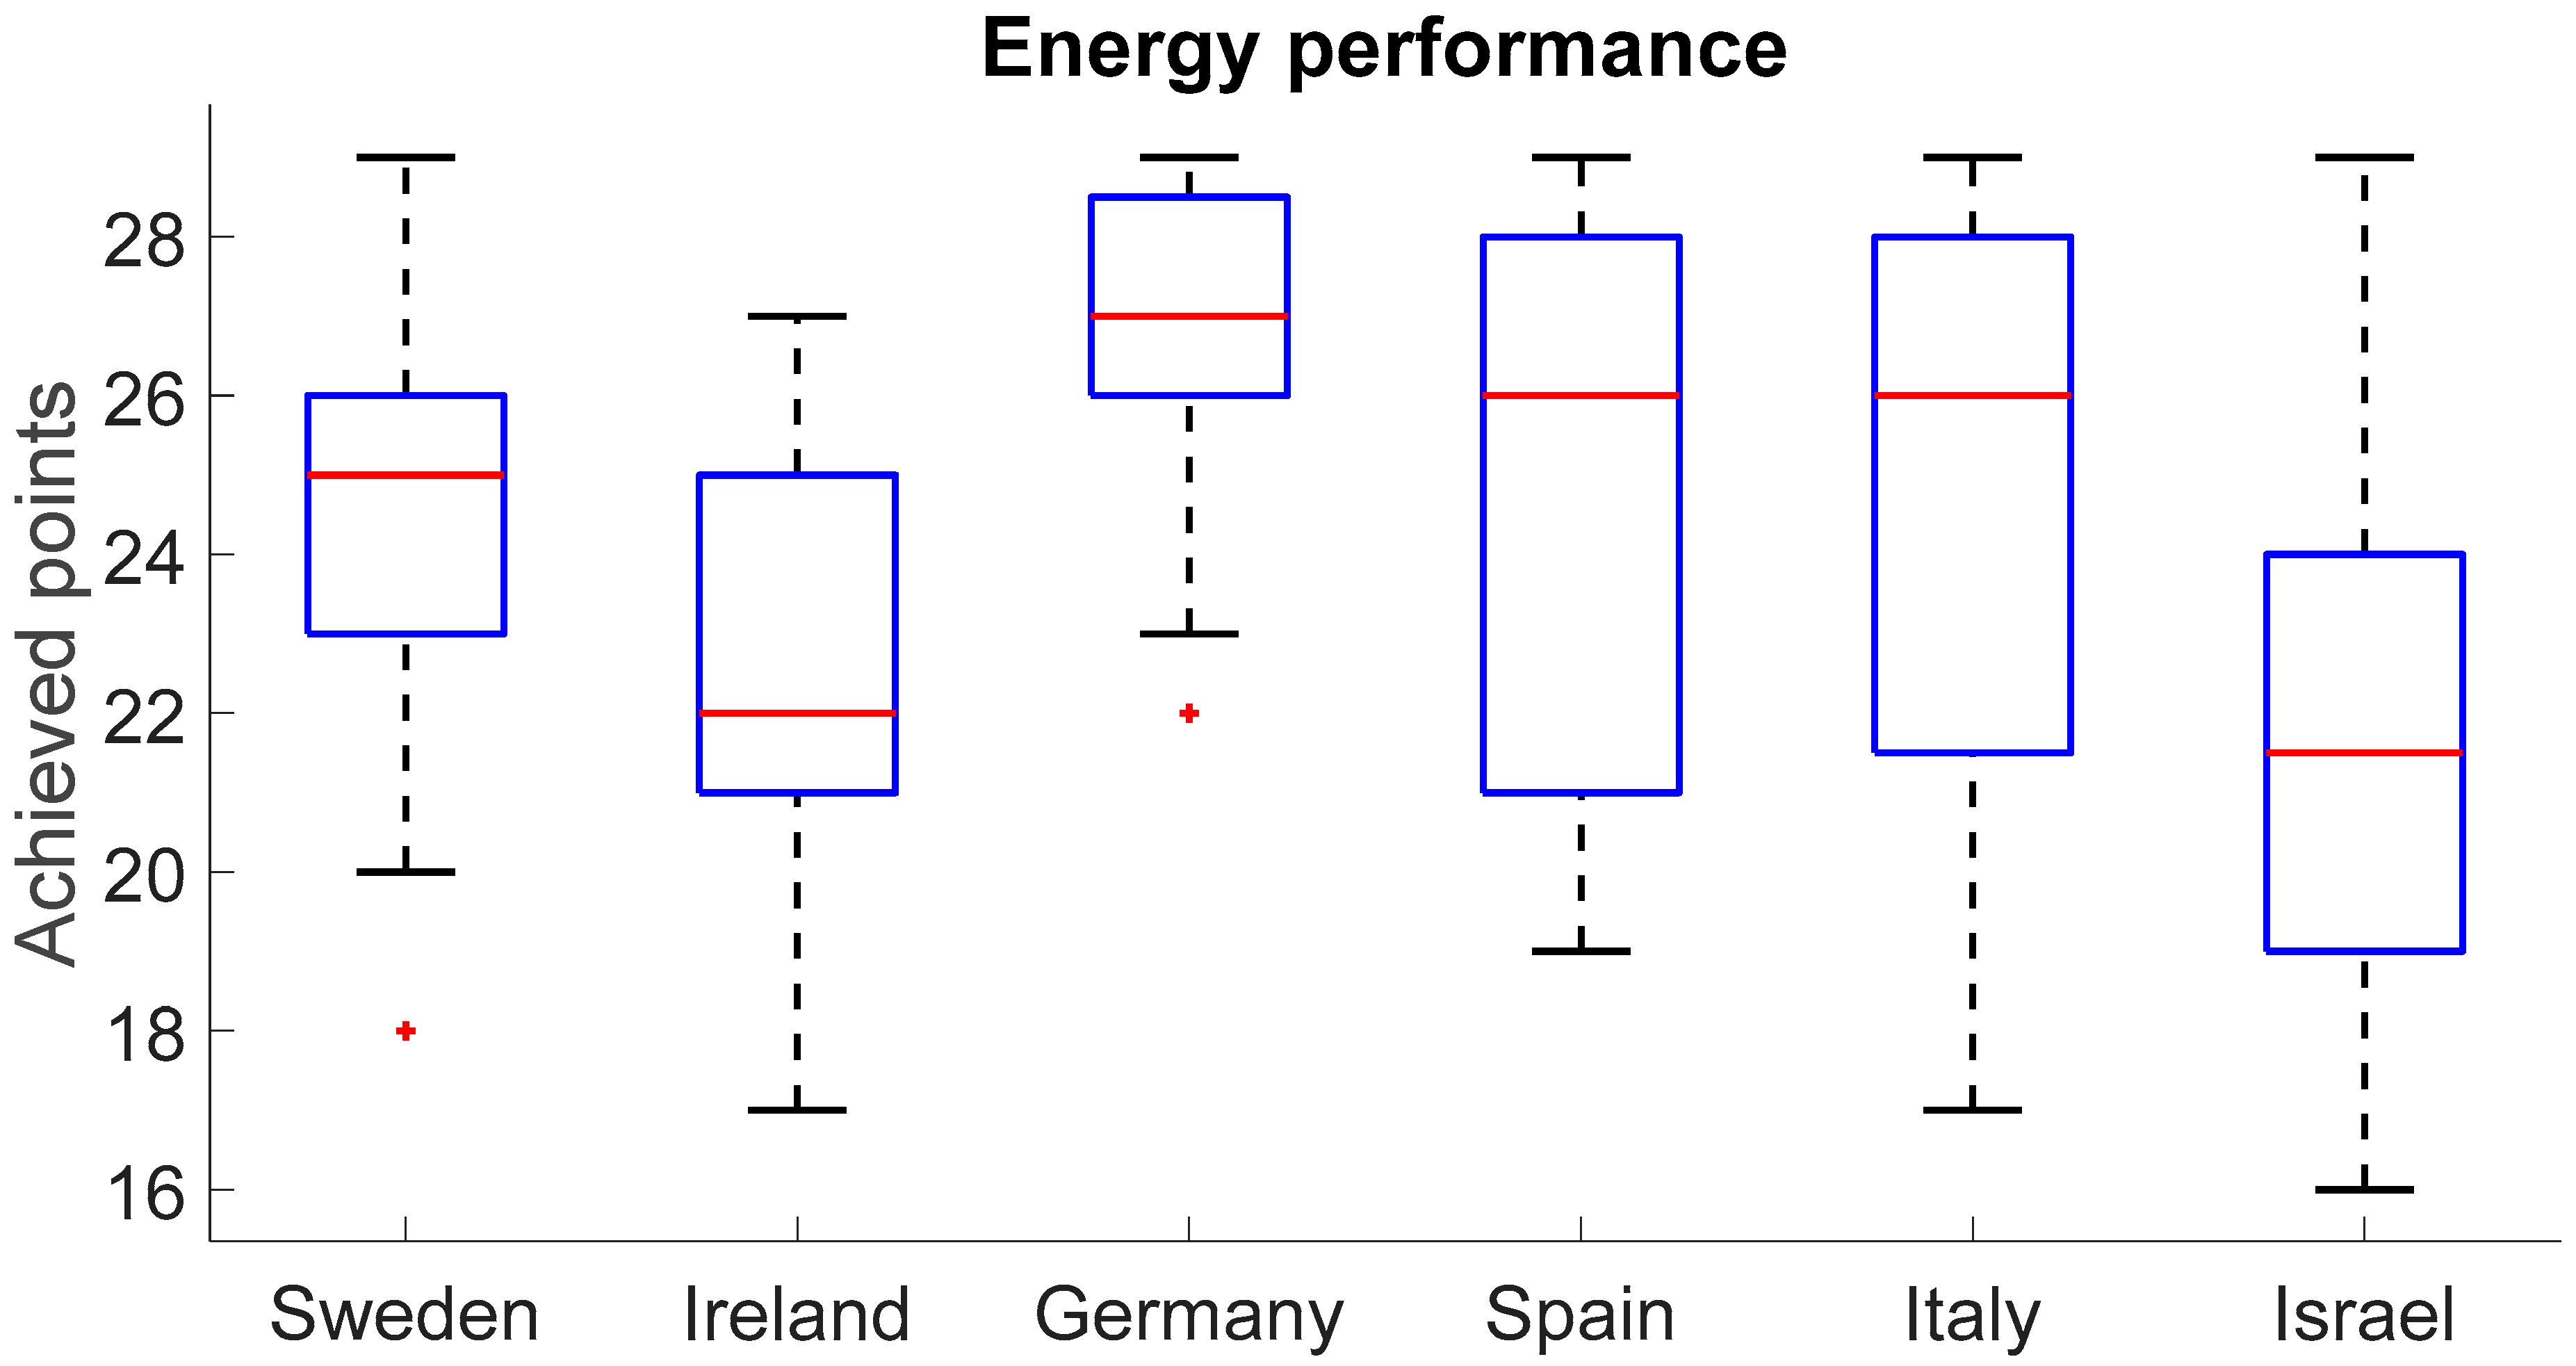
Figure 5 shows the results of the energy performance analysis of six countries. The median was highest in Germany (27 points), followed by Spain and Italy (26 points), Sweden (25 points), Ireland (22 points), and Israel (21.5 points). A fairly wide range (25–75th percentile) was observed across all six countries.
Table 11 shows that, for this prerequisite, Germany outperformed Sweden, Ireland, and Israel, and Sweden outperformed Israel (the difference appears to be positive, p < 0.001 for all cases). Spain and Italy outperformed Israel (the difference appears to be positive, p = 0.008 and 0.009). The judgment is suspended regarding the difference between Germany and Italy (p = 0.068). The difference between the remaining eight pairwise comparisons appears to be negative (p ≥ 0.078).
As explained, LEED-EB energy performance is calculated based on the sum of 50% GHG emissions points and 50% energy points. GHG emissions vary for different fuel sources used to produce energy. Fossil fuel sources are major contributors to GHG emissions, with coal accounting for the largest share of emissions, followed by oil and natural gas, while solar, wind, hydropower, and nuclear power are low emitters of GHG emissions. Thus, the cleaner the fuel source used in a particular country, and the less energy used to heat, cool, and light a building, the higher median LEED-EB energy performance that can be achieved.
In this regard, Sweden uses about 45% of solar, wind, and hydro energy from its total energy sources, followed by Spain (23%), Ireland and Germany (20%), Italy (15%), and Israel (7%). Sweden uses the least amount of fossil fuels (coal, oil, and gas) out of all energy sources (26%), followed by Spain (66%), Germany (75%), Ireland (78%), Italy (81%), and Israel (93%). Thus, the lowest median LEED-EB energy performance in Israel can be explained by the highest percentage of fossil fuels as energy sources and the lowest percentage of renewable energy sources compared to Sweden, Ireland, Germany, Spain, and Italy.
The median LEED-EB energy performance in these European countries is also a result of the high energy saving standards/regulations applied in the European Union (EU). In particular, the European Green Deal aims to reduce greenhouse gas emissions in the EU by 55% by 2030 [50], the REPowerEU plan aims to increase renewable energy to 45% [51], and the Energy Performance of Buildings Directive (EPBD) aims to achieve a climate-neutral Europe by 2050 [52].
High energy efficiency standards/regulations may require building upgrades, including improved insulation, window replacement, green roof installations, and replacement of efficient heating and cooling equipment. These measures require additional investment. Therefore, financial incentives such as tax reductions, rebates, and subsidies can be useful tools to improve building energy efficiency [53]. Such incentives have worked well in developed countries, helping to promote energy-efficient building practices, including LEED certification.
For example, in Germany, building owners who intend to renovate a building can receive a tax deduction of 20% of the total cost of the renovation measures taken [53]. In Spain, which has a lot of sunny days, solar energy is an excellent way to reduce greenhouse gas emissions associated with energy costs for cooling buildings. Therefore, some municipalities allow property tax rates to be reduced by up to 50% when solar energy systems are mounted on buildings [53].
Thus, with LEED certification in Ireland and Israel in sight, LEED consultants need to consider how to improve building insulation to achieve greater energy savings. In addition, policymakers in these countries should continue working towards reducing fossil fuel use in favor of more renewable sources in the future.

4.5. Prerequisite MRs: Waste Performance

Prerequisite MR: Waste performance requires measuring the total weight of waste such as glass, plastic, and paper that is generated by building occupants and the total weight of waste diverted from landfills and incinerators for one full year. The measured waste is then converted to a project equivalent of the total weight of waste generated and the total weight of waste diverted per day and per occupant. Using these waste weights, the daily non-diverted waste per occupant is estimated. Both measurements, the average daily waste generated by the project and the waste not diverted per occupant, determine the waste performance score. The score is calculated by entering the total amount of waste generated and recycled into the LEED-EB online tool. For each waste score, LEED-EB waste performance is provided as presented in [8]. In this way, the corresponding LEED-EB points are awarded based on the waste performance score [8]. The lower the total weight of waste generated and the lower the amount of waste that is not recycled, the higher the LEED score.
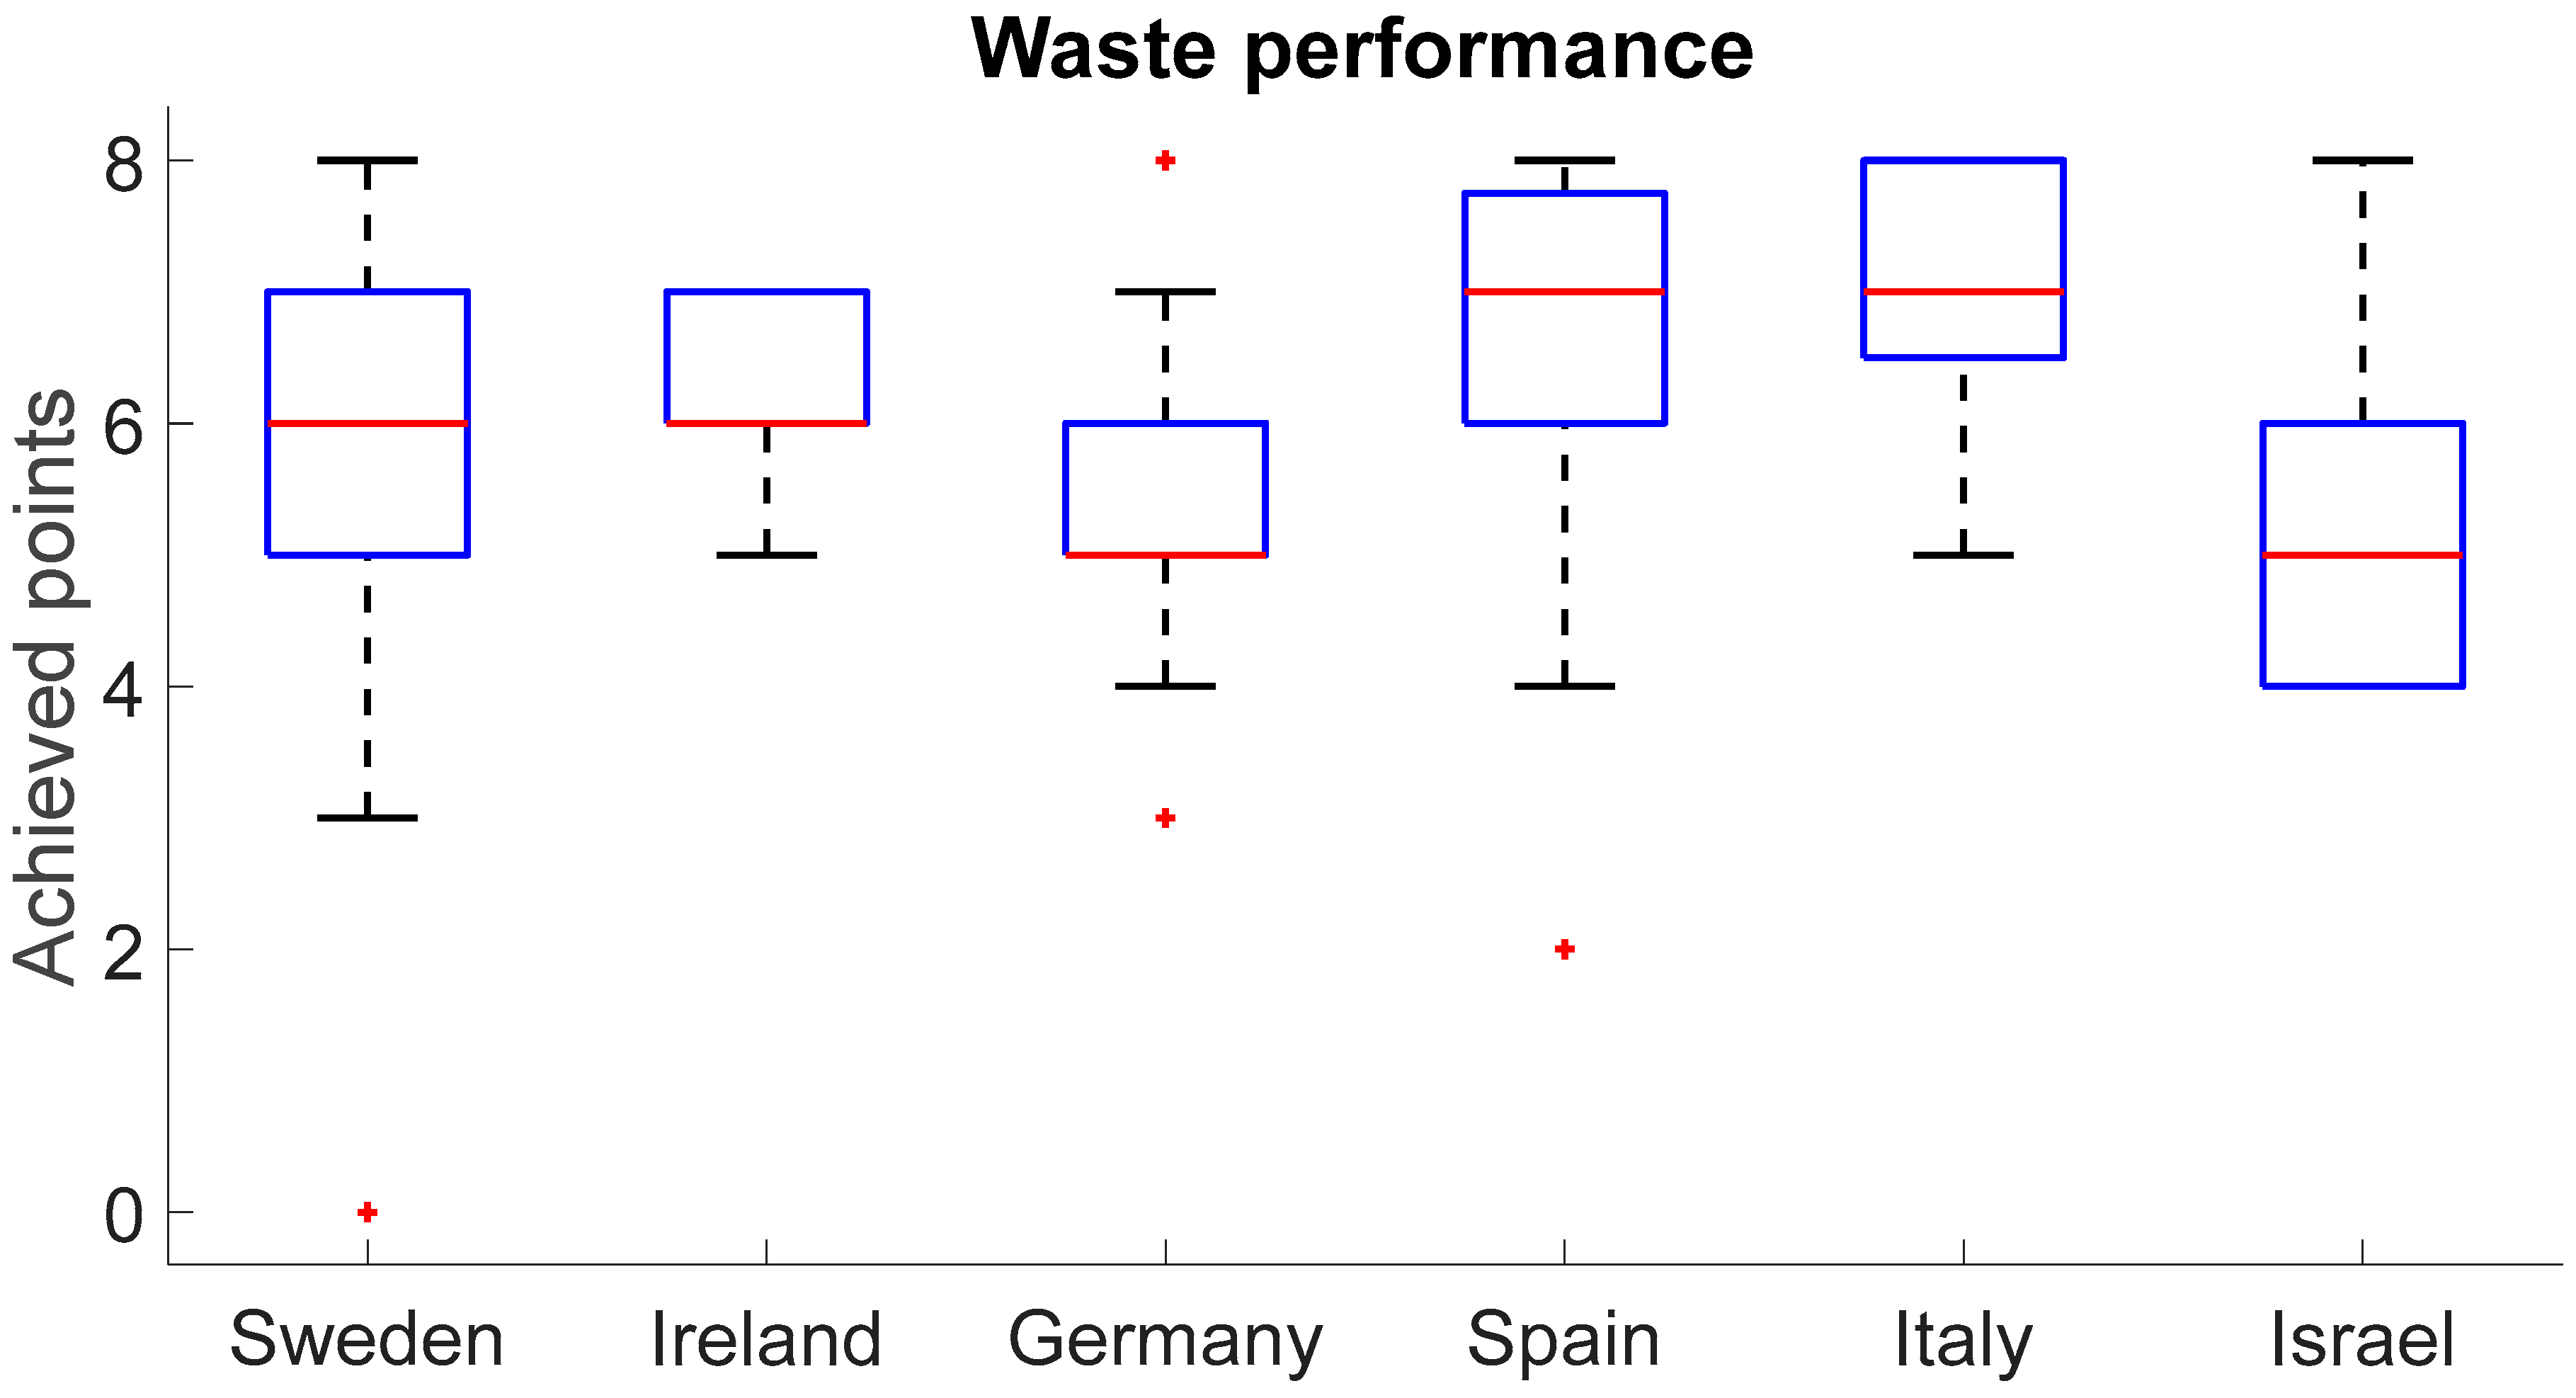
Figure 6 shows the results of the waste performance analysis of six countries. The median was highest in Spain and Italy (7 points), followed by Sweden and Ireland (6 points), and Germany and Israel (5 points). A relatively narrow range (25–75th percentiles) was observed across all six countries.
Table 12 shows that, for this prerequisite, Italy outperformed Sweden, Ireland, Germany, and Israel (the difference appears to be positive, p ≤ 0.043). Spain outperformed Sweden, Germany, and Israel (the difference appears to be positive, p ≤ 0.033). The difference between the remaining five pairwise comparisons appears to be negative (p ≥ 0.103).
The EU is a global leader in waste recycling and management through landfill restrictions and innovative waste collection and recycling [54]. In this regard, five of the six countries examined in this study, Sweden, Ireland, Germany, Spain, and Italy, have also been identified by other researchers as outstanding in waste management. For example, with regard to plastic waste, in the EU up to 2022, out of 23,299 articles published on this topic in 146 countries, Italy published 2068 articles (9%), followed by Germany with 2053 (9%) and Spain with 1641 (7%) [55]. Furthermore, focusing on municipal waste recycling rates in the EU, Laureti et al. [56] reported Sweden and Germany as leading countries with high recycling rates and Ireland, Spain, and Italy as countries with average recycling rates. Thus, although European countries are considered leaders in waste recycling, further efforts to increase the recyclability of municipal waste must be made in future LEED certification, especially in Germany and Israel.

4.6. Prerequisite EQ: Indoor Environmental Quality Performance

Prerequisite EQ: Indoor environmental quality performance requires that an occupant satisfaction survey and indoor air quality assessment in terms of carbon dioxide (CO2) and total volatile organic compound (TVOC) levels must be conducted at least annually. The occupant satisfaction survey results need to be converted into an occupant satisfaction score, while the indoor air quality assessment results need to be converted into a CO2 score and TVOC score. Occupant satisfaction survey results are converted to an occupant score using the average occupant satisfaction level multiplied by 10. CO2 and TVOC scores are determined using the CO2 and TVOC score functions provided in the USGBC calculator. The human experience score is then assessed by calculating the sum of 50% of the occupant satisfaction score, 25% of the CO2 score, and 25% of the TVOC score. Ultimately, LEED-EB points are awarded for the human experience score [8]. Higher occupant satisfaction and higher CO2 and TVOC scores lead to higher LEED-EB scores.
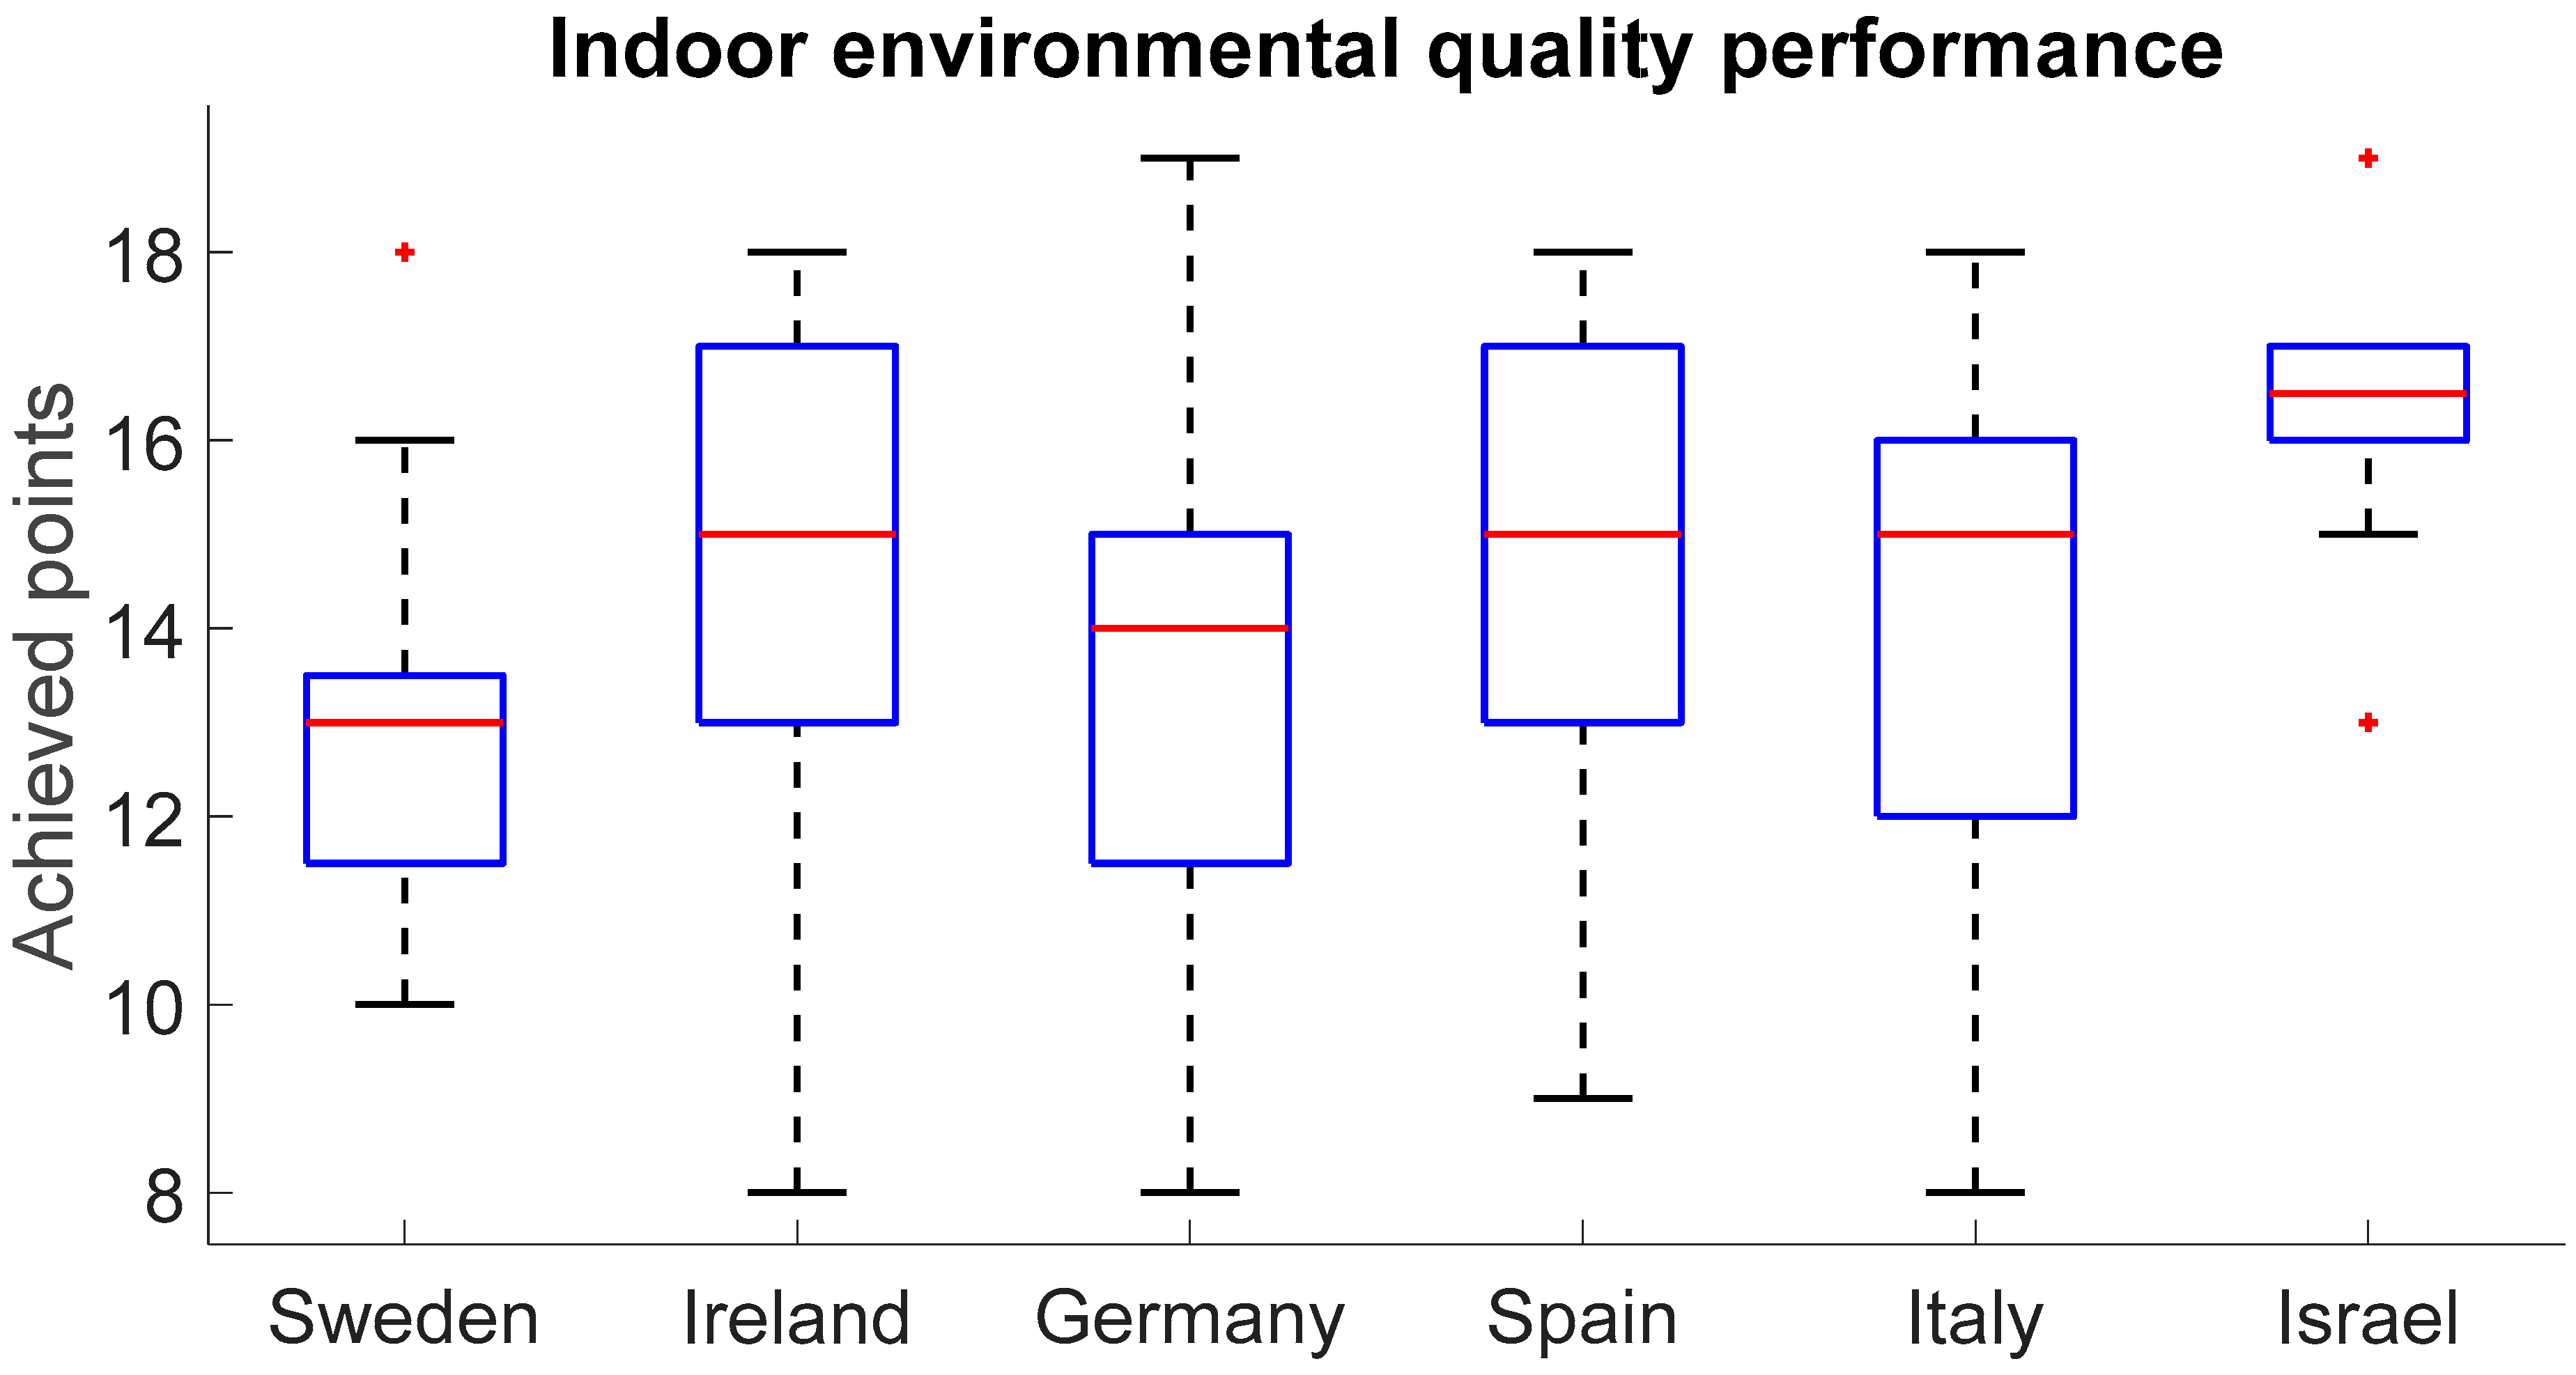
Figure 7 shows the results of the indoor environmental quality performance analysis of six countries. The median was highest in Israel (16.5 points), followed by Ireland, Spain, and Italy (15 points), Germany (14 points), and Sweden (13 points). Israel also had the narrowest range (25–75th percentile), while the other countries had quite wide ranges.
Table 13 shows that, for this prerequisite, Israel outperformed Sweden, Germany, and Italy (the difference appears to be positive, p ≤ 0.006). Ireland, Spain, and Italy outperformed Sweden (the difference appears to be positive, p ≤ 0.002). The judgment is suspended regarding the difference between Israel and Ireland (p = 0.051), between Israel and Spain (p = 0.062), and between Germany and Spain (p = 0.046). The difference between the remaining six pairwise comparisons appears to be negative (p ≥ 0.078).
Currently, more than 75% of existing buildings in the EU are old, built before the current thermal air conditioning regulations came into force. These buildings therefore have inadequately insulated building envelopes and uncontrolled ventilation rates, as well as highly volatile organic compounds (VOCs) emitted by building materials. This in turn leads to poor indoor air quality [57]. In this regard, the European Agenda identifies the retrofit of the housing stock as a key objective to minimize energy consumption in light of achieving climate neutrality in cities by 2050 [58]. Furthermore, the European Commission has published EU minimum concentration of interest (EU-LCI) values for 152 organic compounds commonly emitted by building materials [59]. Thus, four of the six countries assessed—Ireland, Italy, Spain, and Israel—achieved a relatively high median LEED-EB indoor environmental quality performance of 15.0–16.5 (Table 13).
To address this issue in future LEED-certified buildings certified in Sweden and Germany, LEED consultants need to consider low-VOC building materials and use ventilation rates that reduce CO2 emissions inside buildings.

4.7. Overall LEED-EB Score

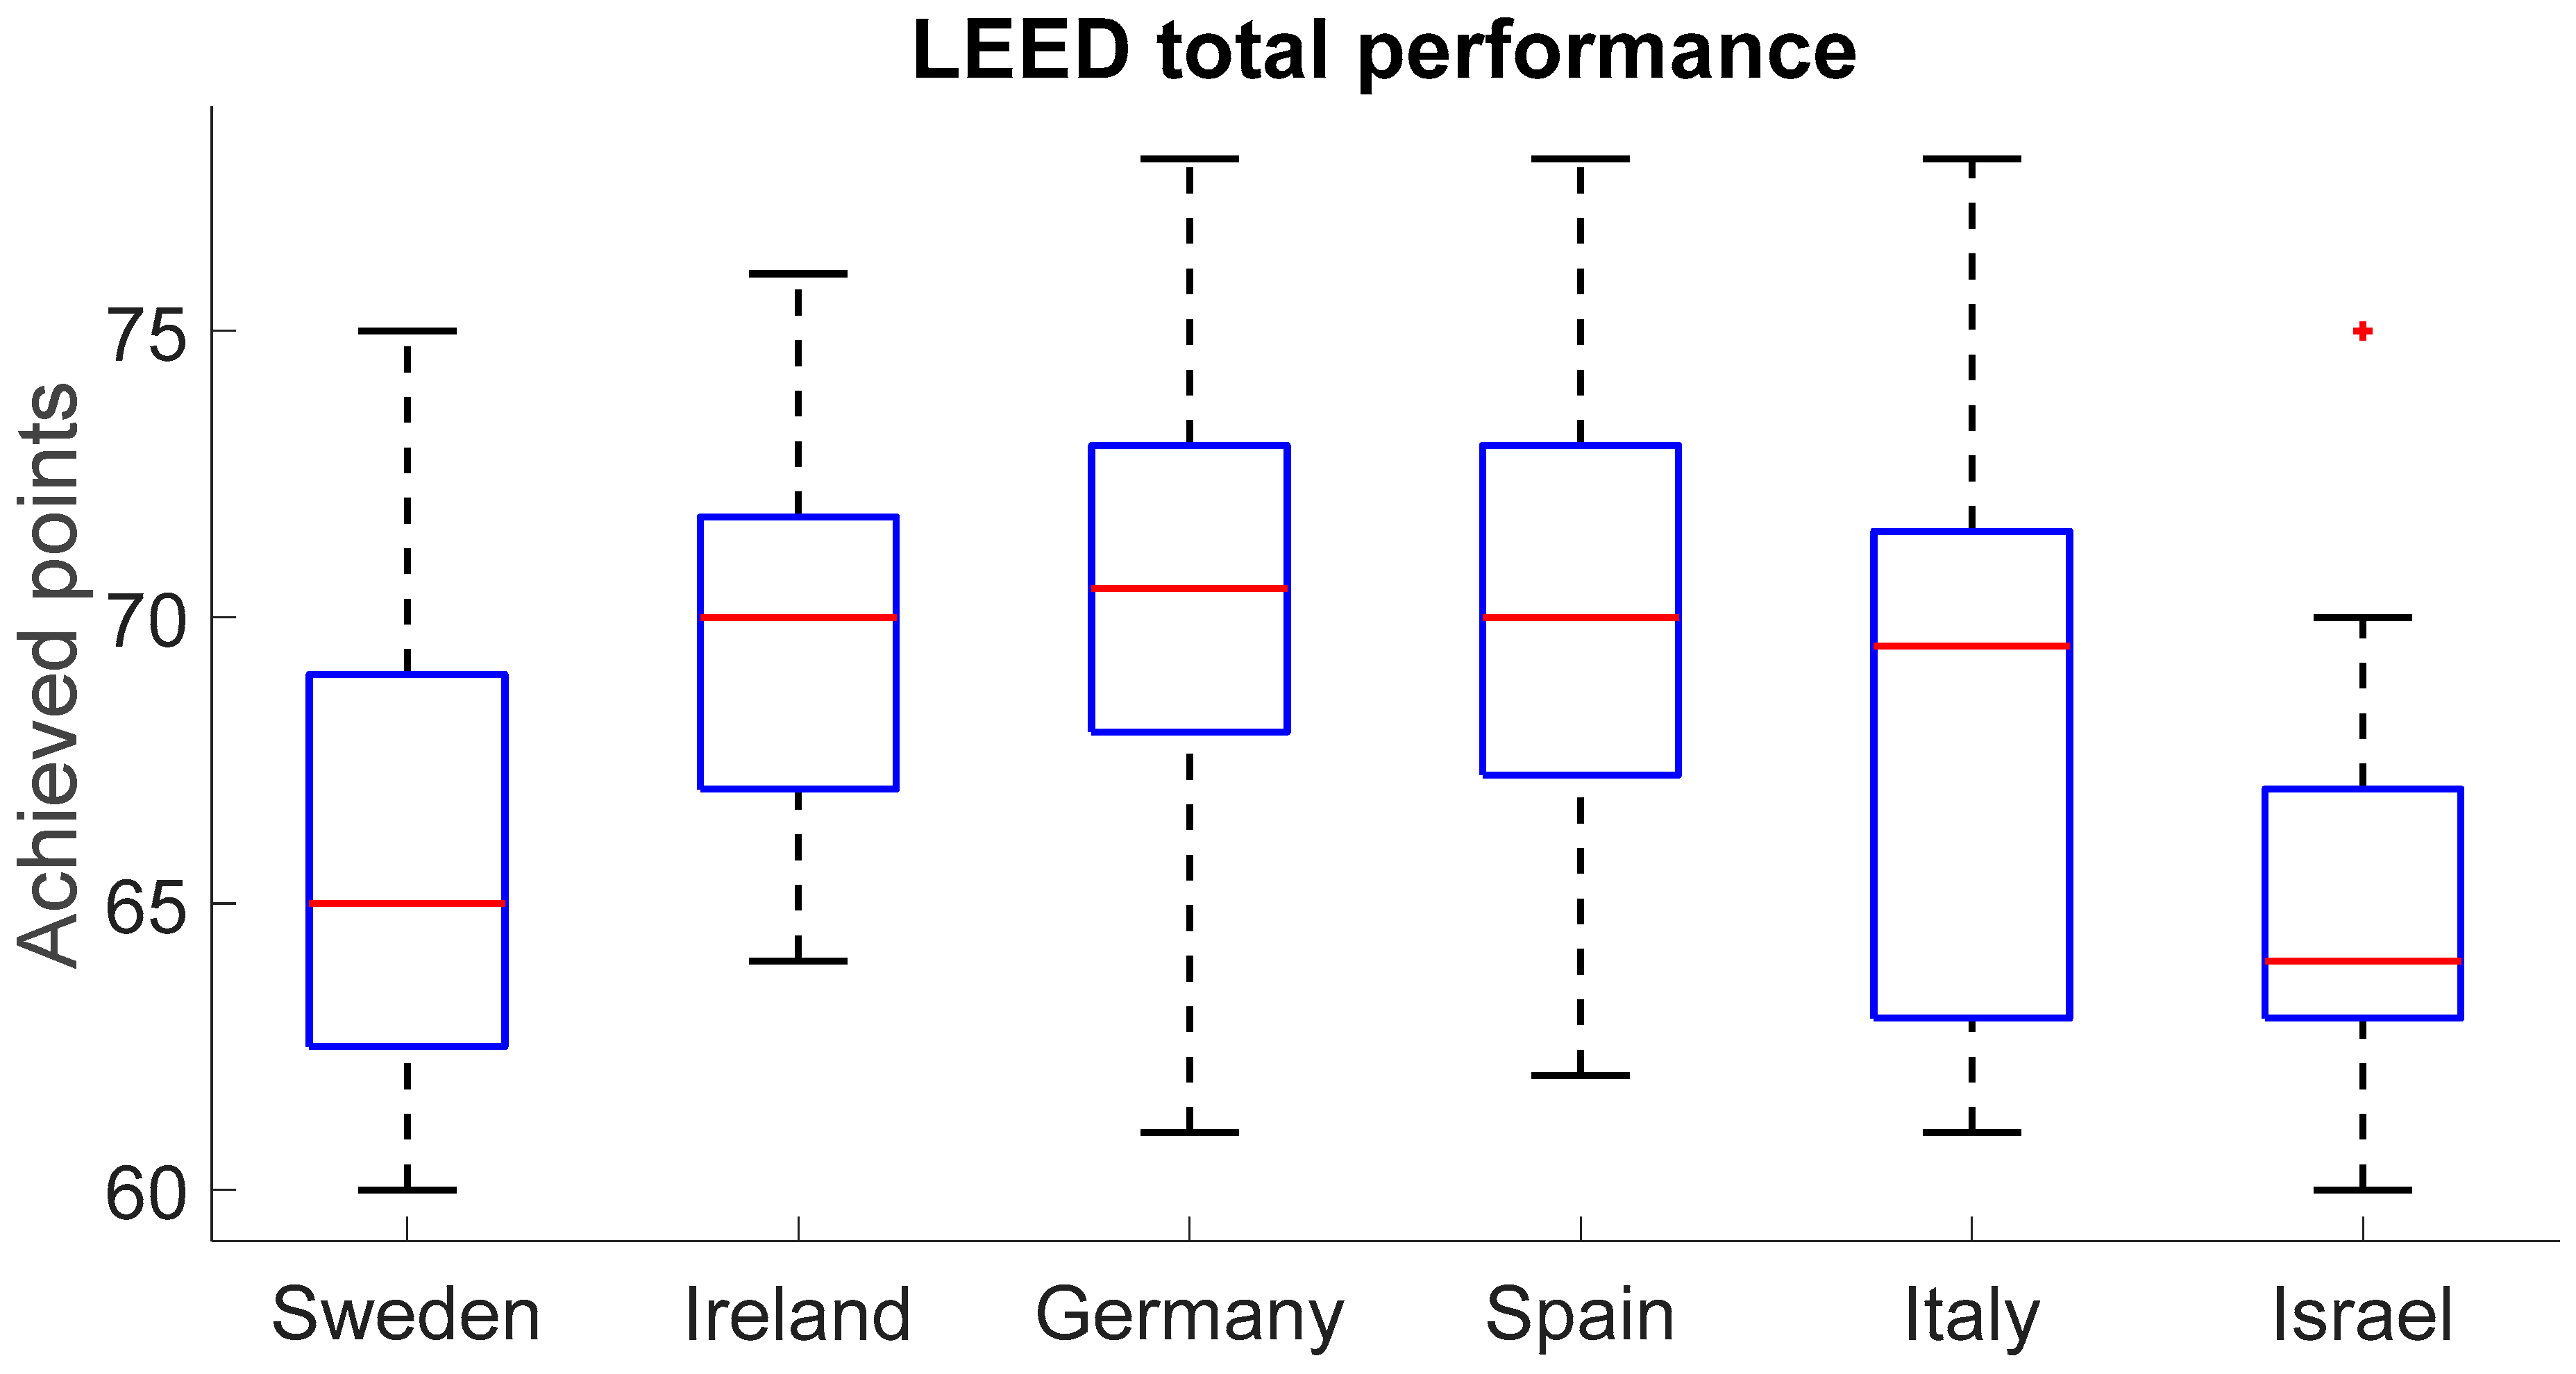
Figure 8 shows the results of the total performance analysis LEED for six countries. The median was highest in Germany (70.5 points), followed by Ireland and Spain (70 points), Italy (69.5 points), Sweden (65 points), and Israel (64 points). Across all countries, the range (25–75th percentile) was quite wide.
Table 14 shows that, for total performance of LEED, Ireland, Germany, and Spain outperformed Sweden and Israel (the difference appears to be positive, p < 0.001). The judgment is suspended regarding the difference between Italy and Sweden (p = 0.056) and between Italy and Israel (p = 0.054). The difference between the remaining seven pairwise comparisons appears to be negative (p ≥ 0.190).
It is worth mentioning that projects certified under previous versions of LEED-EB v3 and LEED-EB v4 measured only water and energy savings, and the overall LEED achievements were close to a low gold certification of 62–65 [32]. Over the years, such low achievements have been criticized as “point hunting” that neglects the true sustainability of the building [13]. In this study, four of the six countries assessed, Italy, Spain, Germany, and Ireland, achieved total LEED points from LEED-EB gold-certified office projects that were well above the low gold certification (60 points). It can be assumed that this is due to the new approach taken in LEED-EB to measure the performance of all the main indicators: transportation (LT), water (WE), energy (EA), waste (MRs), and indoor environmental quality (EQ). It can therefore be assumed that the current performance of all five streams (LT, WE, EA, MR, and EQ) reflects the real situation in the field of building sustainability.
An analysis of each of these ten binary credits showed that they achieved less than 1% of LEED-EB v4.1 gold-certified office projects. The results are shown in Appendix A Table A2, Table A3, Table A4, Table A5, Table A6, Table A7, Table A8, Table A9, Table A10 and Table A11.

5. Conclusions

The objective of this study was to conduct a pairwise comparison of six countries (i.e., Sweden, Ireland, Germany, Spain, Italy, and Israel) regarding LEED-EB v4.1 gold-certified office projects. The main finding of this study is that each of the six selected countries has an individual LEED-EB v4.1 certification strategy.
Specifically, the findings of this study are as follows:
  • For the transportation performance prerequisite, Sweden and Germany showed the highest scores and Italy showed the lowest, with Ireland, Spain, and Israel in between. Despite these differences, the transportation performance in all of these countries was close to the maximum allowable. Thus, LEED consultants have correctly converted the applicability of well-developed public transportation systems in these countries into LEED certification.
  • For the water performance prerequisite, Germany showed the highest score and Italy showed the lowest, with Sweden, Ireland, Spain, and Israel in between. LEED consultants and policymakers in the Mediterranean region, in the context of global warming, need to be aware of the low water savings of LEED-certified buildings.
  • For the energy performance prerequisite, Germany showed the highest score and Ireland and Israel showed the lowest, with Spain, Italy, and Sweden in between. Therefore, LEED consultants need to pay special attention to improving the thermal insulation of buildings to achieve greater energy savings in LEED certification in Ireland and Israel. In addition, the transition from fossil fuels to renewable energy sources needs to be continued.
  • For the waste performance prerequisite, Spain and Italy showed the highest scores and Germany and Israel showed the lowest, with Sweden and Ireland in between. European countries are leaders in recycling. However, LEED consultants need to find additional ways to convince project teams to improve recycling efficiency, especially in Germany and Israel.
  • For the indoor environmental quality performance prerequisite, Israel showed the highest score, and Germany and Sweden showed the lowest, with Ireland, Spain, and Italy in between. Therefore, LEED consultants in Sweden and Germany need to pay more attention to the applicability of low-VOC building materials to reduce CO2 emissions inside buildings.
  • For the overall LEED performance, Germany, Ireland, Spain, and Italy showed the highest scores, and Sweden and Israel showed the lowest. Among the six countries analyzed, Sweden and Israel lag behind in overall sustainability due to insufficient attention to water, energy, and waste management.
The significance of this study is that it provides LEED professionals with new knowledge that can be used when selecting LEED certification strategies for existing office buildings in each of these countries. This study is also of interest in developing new versions of LEED.

6. Restrictions

This study has two restrictions. First, it is necessary to analyze other systems to assess the environmental friendliness of buildings, which will significantly expand the horizons of green building science. Second, based on the knowledge of LEED professionals, an effect size level should be adopted that truly indicates the “substantive significance” in green building development.

7. Future Research

Recently, three studies offered perspectives for future research: one used an expert team to estimate the efficiency of LEED-certified buildings [60], one used structural equation modeling, and another used random forest regression and post-occupant satisfaction scores to estimate the occupant satisfaction in LEED-certified buildings [61,62]. Thus, using the methodologies described in the three studies mentioned above may help in better evaluating LEED-certified projects and in the development of future versions of LEED rating systems.

Funding

This research received no external funding.

Data Availability Statement

Publicly available data sets were analyzed in this study. The data can be found here: https://www.usgbc.org/projects (USGBC Projects Site) (accessed on 19 August 2025) and http://www.gbig.org (GBIG Green Building Data) (accessed on 19 August 2025).

Conflicts of Interest

The author declares no conflict of interest.

Appendix A

Table A1. Distribution of LEED-EB v4.1 gold-certified office projects among cities in six countries: Sweden, Ireland, Germany, Spain, Italy, and Israel.
CountryCities (Numbers)
Sweden (n = 36)Gothenburg (10), Stockholm (8), Uppsala (4), Jonkoping (3), Danderyd (2), Malmo (2), Linkoping (1), Helsingborg (1), Vaxjo (1), Solna (1), Vasteras (1), Boras (1), Vastra Frolunda (1)
Ireland (n = 15)Dublin (15)
Germany (n = 24)Berlin (12), Hamburg (6), Munich (1), Dortmund (1), Kiel (1), Essen (1), Kassel (1), Wolfsburg (1)
Spain (n = 23)Barcelona (10), Madrid (10), Alcobendas (1), Malaga (1), Valencia (1)
Italy (n = 24)Milano (19), Roma (3), Biella (1), Torino (1),
Israel (n = 18)Tel Aviv (8), Holon (4), Petach Tikva (2), Herzliya (2), Raanana (2)
Table A2. SSc1 in six countries.
Credit (Max Points)Sample Size (n), Median, 25–75th Percentiles (PAS)
Sweden (n = 36)Ireland (n = 15)Germany (n = 24)Spain (n = 23)Italy (n = 24)Israel (n = 18)
SSc1 (1)0.0, 0.0–0.0 (0)0.0, 0.0–0.0 (7)0.0, 0.0–0.0 (0)0.0, 0.0–0.0 (0)0.0, 0.0–0.0 (0)0.0, 0.0–0.0 (0)
p-value (lnθ)
SwedenIrelandGermanySpainItalyIsrael
SwedenX0.147 (−2.02)0.500 (−0.40)0.500 (−0.40)0.500 (−0.40)0.500 (−0.68)
Ireland X0.192 (1.62)0.197 (1.58)0.192 (1.62)0.227 (1.34)
Germany X0.500 (−0.04)0.500 (0.00)0.500 (−0.28)
Spain X0.500 (0.04)0.500 (−0.24)
Italy X0.500 (−0.28)
Israel X
Table A3. SSc2 in six countries.
Credit (Max Points)Sample Size (n), Median, 25–75th Percentiles (PAS)
Sweden (n = 36)Ireland (n = 15)Germany (n = 24)Spain (n = 23)Italy (n = 24)Israel (n = 18)
SSc2 (1)0.0, 0.0– 0.0 (0)1.0, 0.0–1.0 (67)0.0, 0.0–0.0 (0)0.0, 0.0–0.0 (17)0.0, 0.0–0.0 (8)0.0, 0.0–0.0 (0)
p-value (lnθ)
SwedenIrelandGermanySpainItalyIsrael
SwedenX<0.001 (−4.94)0.500 (−0.40)0.010 (−2.82)0.078 (−2.09)0.500 (−0.68)
Ireland X<0.001 (4.54)0.003 (2.25)<0.001 (3.09)<0.001 (4.26)
Germany X0.025 (−2.43)0.122 (−1.69)0.500 (−0.28)
Spain X0.302 (0.84)0.074 (2.14)
Italy X0.338 (1.41)
Israel X
Note: Bold font: there appears to be a difference between the two groups; ordinal font: there appears to be no difference between the two groups.
Table A4. SSc3 in six countries.
Credit (Max Points)Sample Size (n), Median, 25–75th Percentiles (PAS)
Sweden (n = 36)Ireland (n = 15)Germany (n = 24)Spain (n = 23)Italy (n = 24)Israel (n = 18)
SSc3 (1)0.0, 0.0–0.0 (0)0.0, 0.0–0.0 (7)0.0, 0.0–0.0 (0)0.0, 0.0–1.0 (39)0.0, 0.0–0.5 (25)0.0, 0.0–0.0 (0)
p-value (lnθ)
SwedenIrelandGermanySpainItalyIsrael
SwedenX0.147 (−2.02)0.500 (−0.40)<0.001 (−3.87)0.001 (−3.24)0.500 (−0.68)
Ireland X0.192 (1.62)0.043 (−2.20)0.150 (−1.54)0.227 (1.34)
Germany X<0.001 (−3.47)0.005 (−2.85)0.500 (−0.28)
Spain X0.286 (0.66)0.001 (3.19)
Italy X0.016 (2.56)
Israel X
Note: Bold font: there appears to be a difference between the two groups; ordinal font: there appears to be no difference between the two groups; italic font: judgment is suspended.
Table A5. SSc4 in six countries.
Credit (Max Points)Sample Size (n), Median, 25–75th Percentiles (PAS)
Sweden (n = 36)Ireland (n = 15)Germany (n = 24)Spain (n = 23)Italy (n = 24)Israel (n = 18)
SSc4 (1)0.0, 0.0–0.0 (0)1.0, 1.0–1.0 (93)0.0, 0.0–0.0 (8)0.0, 0.0–1.0 (30)0.0, 0.0–0.0 (4)0.0, 0.0–0.0 (6)
p-value (lnθ)
SwedenIrelandGermanySpainItalyIsrael
SwedenX<0.001 (−6.56)0.078 (−2.09)<0.001 (−3.50)0.200 (−1.54)0.167 (−1.83)
Ireland X<0.001 (5.04)<0.001 (3.47)<0.001 (5.77)<0.001 (5.47)
Germany X0.047 (−1.57)0.426 (0.74)0.784 (0.44)
Spain X0.022 (2.31)0.036 (2.01)
Italy X0.749 (−0.30)
Israel X
Note: Bold font: there appears to be a difference between the two groups; ordinal font: there appears to be no difference between the two groups; italic font: judgment is suspended.
Table A6. EAc2 in six countries.
Credit (Max Points)Sample Size (n), Median, 25–75th Percentiles (PAS)
Sweden (n = 36)Ireland (n = 15)Germany (n = 24)Spain (n = 23)Italy (n = 24)Israel (n = 18)
EAc2 (1)0.0, 0.0–0.0 (17)0.0, 0.0–0.0 (0)0.0, 0.0–1.0 (33)0.0, 0.0–0.8 (26)0.0, 0.0–0.5 (25)0.0, 0.0–1.0 (33)
p-value (lnθ)
SwedenIrelandGermanySpainItalyIsrael
SwedenX0.108 (1.89)0.171 (−0.92)0.422 (−0.57)0.423 (−0.51)0.131 (−0.92)
Ireland X0.009 (−2.77)0.045 (−2.44)0.044 (−2.39)0.013 (−2.78)
Germany X0.643 (0.35)0.444 (0.41)0.871 (−0.01)
Spain X0.870 (0.06)0.615 (−0.35)
Italy X0.619 (−0.41)
Israel X
Note: Bold font: there appears to be a difference between the two groups; ordinal font: there appears to be no difference between the two groups; italic font: judgment is suspended.
Table A7. EAc3 in six countries.
Credit (Max Points)Sample Size (n), Median, 25–75th Percentiles (PAS)
Sweden (n = 36)Ireland (n = 15)Germany (n = 24)Spain (n = 23)Italy (n = 24)Israel (n = 18)
EAc3 (1)0.0, 0.0–0.0 (0)0.0, 0.0–0.0 (0)0.0, 0.0–0.0 (0)0.0, 0.0–0.0 (0)0.0, 0.0–0.0 (0)0.0, 0.0–0.0 (0)
p-value (lnθ)
SwedenIrelandGermanySpainItalyIsrael
SwedenX0.500 (−0.86)0.500 (−0.40)0.500 (−0.44)0.500 (−0.44)0.500 (−0.68)
Ireland X0.500 (0.46)0.500 (0.42)0.500 (0.46)0.500 (0.18)
Germany X0.500 (−0.04)0.500 (0.00)0.500 (−0.28)
Spain X0.500 (0.04)0.500 (−0.24)
Italy X0.500 (−0.28)
Israel X
Table A8. MRc2 in six countries.
Credit (Max Points)Sample Size (n), Median, 25–75th Percentiles (PAS)
Sweden (n = 36)Ireland (n = 15)Germany (n = 24)Spain (n = 23)Italy (n = 24)Israel (n = 18)
MRc2 (1)0.0, 0.0–0.0 (0)0.0, 0.0–0.0 (7)0.0, 0.0–0.0 (4)0.0, 0.0–0.0 (13)0.0, 0.0–0.0 (8)0.0, 0.0–0.0 (0)
p-value (lnθ)
SwedenIrelandGermanySpainItalyIsrael
SwedenX0.147 (−2.02)0.200 (−1.54)0.027 (−2.52)0.078 (−2.09)0.500 (−0.68)
Ireland X0.757 (0.50)0.820 (−0.74)0.773 (−0.24)0.227 (1.34)
Germany X0.228 (−1.24)0.426 (−0.74)0.714 (0.86)
Spain X0.507 (0.50)0.160 (1.84)
Italy X0.338 (1.41)
Israel X
Note: Bold font: there appears to be a difference between the two groups; ordinal font: there appears to be no difference between the two groups.
Table A9. EQc2 in six countries.
Credit (Max Points)Sample Size (n), Median, 25–75th Percentiles (PAS)
Sweden (n = 36)Ireland (n = 15)Germany (n = 24)Spain (n = 23)Italy (n = 24)Israel (n = 18)
EQc2 (1)0.0, 0.0–0.0 (3)1.0, 0.0–1.0 (67)0.0, 0.0–1.0 (38)0.0, 0.0–1.0 (43)0.0, 0.0–0.0 (8)0.0, 0.0–0.0 (0)
p-value (lnθ)
SwedenIrelandGermanySpainItalyIsrael
SwedenX<0.001 (−4.25)<0.001 (−3.04)<0.001 (−3.29)0.413 (−1.16)0.667 (0.45)
Ireland X0.077 (1.20)0.147 (0.96)<0.001 (3.09)<0.001 (4.26)
Germany X0.663 (−0.25)0.012 (1.89)0.003 (3.12)
Spain X0.005 (2.14)0.002 (3.36)
Italy X0.337 (1.41)
Israel X
Note: Bold font: there appears to be a difference between the two groups; ordinal font: there appears to be no difference between the two groups.
Table A10. EQc3 in six countries.
Credit (Max Points)Sample Size (n), Median, 25–75th Percentiles (PAS)
Sweden (n = 36)Ireland (n = 15)Germany (n = 24)Spain (n = 23)Italy (n = 24)Israel (n = 18)
EQc3 (1)0.0, 0.0–0.0 (0)1.0, 0.0–1.0 (20)0.0, 0.0–0.0 (17)0.0, 0.0–1.0 (35)0.0, 0.0–0.5 (25)0.0, 0.0–0.0 (0)
p-value (lnθ)
SwedenIrelandGermanySpainItalyIsrael
SwedenX0.011 (−3.02)0.011 (−2.77)<0.001 (−3.69)0.001 (−3.24)0.500 (−0.68)
Ireland X0.843 (0.22)0.377 (−0.76)0.8556 (−0.29)0.042 (2.34)
Germany X0.143 (−0.98)0.395 (−0.51)0.075 (2.09)
Spain X0.438 (0.47)0.003 (3.01)
Italy X0.016 (2.56)
Israel X
Note: Bold font: there appears to be a difference between the two groups; ordinal font: there appears to be no difference between the two groups; italic font: judgment is suspended.
Table A11. IN in six countries.
Credit (Max Points)Sample Size (n), Median, 25–75th Percentiles (PAS)
Sweden (n = 36)Ireland (n = 15)Germany (n = 24)Spain (n = 23)Italy (n = 24)Israel (n = 18)
In (1)0.0, 0.0–0.0 (0)0.0, 0.0–0.0 (13)0.0, 0.0–0.0 (0)0.0, 0.0–1.0 (39)0.0, 0.0–0.5 (25)0.0, 0.0–0.0 (22)
p-value (lnθ)
SwedenIrelandGermanySpainItalyIsrael
SwedenX0.041 (−2.60)0.500 (−0.40)<0.001 (−3.87)0.001 (−3.24)0.005 (−3.12)
Ireland X0.070 (2.21)0.109 (−1.43)0.335 (−0.77)0.520 (−0.62)
Germany X<0.001 (−3.470.005 (−2.85)0.014 (−2.72)
Spain X0.286 (0.66)0.250 (0.81)
Italy X0.860 (0.15)
Israel X
Note: Bold font: there appears to be a difference between the two groups; ordinal font: there appears to be no difference between the two groups; italic font: judgment is suspended.

References

  1. Ade, R.; Rehm, M. The unwritten history of green building rating tools: A personal view from some of the ‘founding fathers’. Build. Res. Inf. 2020, 48, 1–17. [Google Scholar] [CrossRef]
  2. Lei, M.; Cui, T. A Scientometric Analysis and Visualization of Global LEED Research. Buildings 2022, 12, 1099. [Google Scholar] [CrossRef]
  3. Madson, K.; Franz, B.; Leicht, R.; Nelson, J. Evaluating the Sustainability of New Construction Projects over Time by Examining the Evolution of the LEED Rating System. Sustainability 2022, 14, 15422. [Google Scholar] [CrossRef]
  4. Gluszak, M.; Malkowska, A.; Marona, B. Green Building Adoption on Office Markets in Europe: An Empirical Investigation into LEED Certification. Energies 2021, 14, 1971. [Google Scholar] [CrossRef]
  5. Li, X.; Feng, W.; Liu, X.; Yang, Y. A comparative analysis of green building rating systems in China and the United States. Sustain. Cities Soc. 2023, 93, 104520. [Google Scholar] [CrossRef]
  6. Pham, D.H.; Kim, B.; Lee, J.; Ahn, A.C.; Ahn, Y. A Comprehensive Analysis: Sustainable Trends and Awarded LEED 2009 Credits in Vietnam. Sustainability 2020, 12, 852. [Google Scholar] [CrossRef]
  7. Pham, D.H.; Kim, B.; Lee, J.; Ahn, Y. An Investigation of the Selection of LEED Version 4 Credits for Sustainable Building Projects. Appl. Sci. 2020, 10, 7081. [Google Scholar] [CrossRef]
  8. LEED-EB v4.1. Operation and Maintenance. 2018. Available online: https://dcqpo543i2ro6.cloudfront.net/sites/default/files/file_downloads/LEED%20v4.1%20O%2BM%20Guide.pdf (accessed on 8 July 2025).
  9. Akçay, C.; Sarı, M. Sustainable Healthcare Infrastructure: Design-Phase Evaluation of LEED Certification and Energy Efficiency at Istanbul University’s Surgical Sciences Building. Buildings 2025, 15, 2385. [Google Scholar] [CrossRef]
  10. Kim, J. Green building strategies for LEED-certified laboratory buildings: Comparison between gold and platinum levels. Int. J. Sustain. Build. Technol. Urban Dev. 2020, 11, 153–173. [Google Scholar]
  11. Laera, R.; de Pereda Fernández, L. Apolonio Morales 29, an intervention model for energy efficiency and building sustainability. Build. Manag. 2020, 4, 4–10. [Google Scholar] [CrossRef]
  12. El Sorady, D.A.; Rizk, S.M. LEED v4.1 operations & maintenance for existing buildings and compliance assessment: Bayt Al-Suhaymi, Historic Cairo. Alex. Eng. J. 2020, 59, 519–531. [Google Scholar] [CrossRef]
  13. Wu, P.; Mao, C.; Wang, J.; Song, Y.Z.; Wang, X.Y. A decade review of the credits obtained by LEED v2.2 certified green building projects. Build. Environ. 2016, 102, 167–178. [Google Scholar] [CrossRef]
  14. Wu, P.; Song, Y.; Shou, W.; Chi, H.; Chong, H.Y.; Sutrisna, M. A comprehensive analysis of the credits obtained by LEED 2009 certified green buildings. Renew. Sustain. Energy Rev. 2017, 68 Pt 1, 370–379. [Google Scholar] [CrossRef]
  15. Sullivan, G.M.; Feinn, R. Using Effect Size—Or Why the P Value Is Not Enough. J. Grad. Med. Educ. 2012, 4, 279–282. [Google Scholar] [CrossRef]
  16. Chi, B.; Lu, W.S.; Ye, M.; Bao, Z.K.; Zhang, X.L. Construction waste minimization in green building: A comparative analysis of LEED-NC 2009 certified projects in the US and China. J. Clean. Prod. 2020, 256, 120749. [Google Scholar] [CrossRef]
  17. Pushkar, S. Evaluating LEED commercial interior (LEED-CI) projects under the LEED transition from v3 to v4: The differences between China and the US. Heliyon 2020, 6, e04701. [Google Scholar] [CrossRef]
  18. Pushkar, S. A Comparative Analysis of Gold Leadership in Energy and Environmental Design for New Construction 2009 Certified Projects in Finland, Sweden, Turkey, and Spain. Appl. Sci. 2018, 8, 1496. [Google Scholar] [CrossRef]
  19. Pushkar, S. Assessing LEED Core and Shell (LEED–C-AND-S), v3 and v4 of gold office-type projects: The difference between Finland and Spain. J. Green Build. 2022, 17, 109–123. [Google Scholar] [CrossRef]
  20. Pushkar, S. The Effect of Regional Priority Points on the Performance of LEED 2009 Certified Buildings in Turkey, Spain, and Italy. Sustainability 2018, 10, 3364. [Google Scholar] [CrossRef]
  21. Pushkar, S. LEED-EB Gold Projects for Office Spaces in Large Buildings Transitioning from Version 3 (v3) to 4 (v4): Similarities and Differences between Finland and Spain. Appl. Sci. 2020, 10, 8737. [Google Scholar] [CrossRef]
  22. Pushkar, S. Leadership in Energy and Environmental Design Commercial Interior Version 4 (LEED-CI v4) Gold-Certified Office Space Projects: A Pairwise Comparative Analysis between Three Mediterranean Countries. Buildings 2024, 14, 815. [Google Scholar] [CrossRef]
  23. Pushkar, S. Leadership in Energy and Environmental Design for LEED Version 4 (LEED-EB v4) Gold Certification Strategies for Existing Buildings in the United States: A Case Study. Buildings 2025, 15, 1080. [Google Scholar] [CrossRef]
  24. Bergmann, R.; Ludbrook, J.; Spooren, W.P.J.M. Different outcomes of the Wilcoxon-Mann-Whitney test from different statistics packages. Am. Stat. 2000, 54, 72–77. [Google Scholar]
  25. GBIG Green Building Data. Available online: http://www.gbig.org (accessed on 8 July 2025).
  26. USGBC Projects Site. Available online: https://www.usgbc.org/projects (accessed on 8 July 2025).
  27. MATLAB and Statistics Toolbox Release 2024a, The Math Works, Inc.: Natick, MA, USA, 2014.
  28. Cliff, N. Dominance statistics: Ordinal analyses to answer ordinal questions. Psychol. Bull. 1993, 114, 494–509. [Google Scholar] [CrossRef]
  29. Bland, J.M.; Altman, D.G. The odds ratio. BMJ 2000, 320, 1468. [Google Scholar] [CrossRef]
  30. Routledge, R.D. Resolving the conflict over Fisher’s exact test. Can. J. Stat. 1992, 20, 201–209. [Google Scholar] [CrossRef]
  31. Fleiss, J.L. Statistical Methods for Rates and Proportions, 2nd ed.; Wiley: New York, NY, USA, 1981. [Google Scholar]
  32. Pushkar, S. Impact of “Optimize Energy Performance” Credit Achievement on the Compensation Strategy of Leadership in Energy and Environmental Design for Existing Buildings Gold-Certified Office Space Projects in Madrid and Barcelona, Spain. Buildings 2023, 13, 2656. [Google Scholar] [CrossRef]
  33. Hurlbert, S.H.; Lombardi, C.M. Final collapse of the Neyman-Pearson decision theoretic framework and rise of the neoFisherian. Ann. Zool. Fenn. 2009, 46, 311–349. [Google Scholar] [CrossRef]
  34. Hurlbert, S.H.; Lombardi, C.M. Lopsided reasoning on lopsided tests and multiple comparisons. Aust. N. Z. J. Stat. 2012, 54, 23–42. [Google Scholar] [CrossRef]
  35. Romano, J.; Corragio, J.; Skowronek, J. Appropriate statistics for ordinal level data: Should we really be using t-test and Cohen’s d for evaluating group differences on the NSSE and other surveys? In Proceedings of the Annual Meeting of the Florida Association of Institutional Research, Cocoa Beach, FL, USA, 1–3 February 2006; Florida Association for Institutional Research: Cocoa Beach, FL, USA, 2006; pp. 1–33. [Google Scholar]
  36. Chen, H.; Cohen, P.; Chen, S. How Big is a Big Odds Ratio? How big is a big odds ratio? Interpreting the magnitudes of odds ratios in epidemiological studies. Commun. Stat. Simulat. Comput. 2010, 39, 860–864. [Google Scholar] [CrossRef]
  37. Volker, M.A. Reporting effect size estimates in school psychology research. Psychol. Sch. 2006, 43, 653–672. [Google Scholar] [CrossRef]
  38. Durlak, J.A. How to select, calculate, and interpret effect sizes. J. Pediatr. Psychol. 2009, 34, 917–928. [Google Scholar] [CrossRef] [PubMed]
  39. Fisher, R.A. Statistical Methods and Scientific Inference; Oliver & Boyd: Edinburgh, UK, 1956. [Google Scholar]
  40. Beninger, P.G.; Boldina, I.; Katsanevakis, S. Strengthening statistical usage in marine ecology. J. Exp. Mar. Biol. Ecol. 2012, 426–427, 97–108. [Google Scholar] [CrossRef]
  41. Altman, D.G. Practical Statistics for Medical Research; Chapman and Hall: London, UK, 1991. [Google Scholar]
  42. Gotelli, N.J.; Ellinson, A.M. A Primer of Ecological Statistics, 2nd ed.; Sinauer Associates: Sunderland, MA, USA, 2004; ISBN 9781605350646. [Google Scholar]
  43. Kennedy-Shaffer, L. Before p < 0.05 to beyond p < 0.05: Using history to contextualize p-values and significance testing. Am. Stat. 2019, 73, 82–90. [Google Scholar]
  44. Dolge, K.; Barisa, A.; Kirsanovs, V.; Blumberga, D. The status quo of the EU transport sector: Cross-country indicator-based comparison and policy evaluation. Appl. Energy 2023, 334, 120700. [Google Scholar] [CrossRef]
  45. Mandev, A.; Sprei, F. Country-level differences in the electrified kilometers of plug-in hybrid electric vehicles across Europe. Environ. Res. Infrastruct. Sustain. 2024, 4, 041003. [Google Scholar] [CrossRef]
  46. Bendz, A.; Boholm, Å. Indispensable, yet Invisible: Drinking Water Management as a Local Political Issue in Swedish Municipalities. Local Gov. Stud. 2020, 46, 800–819. [Google Scholar] [CrossRef]
  47. Antwi, S.H.; Rolston, A.; Linnane, S.; Getty, D. Communicating Water Availability to Improve Awareness and Implementation of Water Conservation: A Study of the 2018 and 2020 Drought Events in the Republic of Ireland. Sci. Total Environ. 2022, 807, 150865. [Google Scholar] [CrossRef]
  48. Kasipiyawong, J.; Gayh, U.; Ghomi, M.R. The potential of rainwater harvesting and greywater recycling as an alternative domestic water resource in Bahnstadt-Heidelberg, Germany. J. Water Sanit. Hyg. Dev. 2024, 14, 486–496. [Google Scholar] [CrossRef]
  49. Palatnik, R.R.; Raviv, O.; Sirota, J.; Shechter, M. Water Scarcity and Food Security in the Mediterranean Region: The Role of Alternative Water Sources and Controlled-Environment Agriculture. Water Resour. Econ. 2025, 49, 100256. [Google Scholar] [CrossRef]
  50. Forni, L.; Fortuna, F.; Giarda, E.; Giovanardi, F.; Panarello, D. The ‘Green buildings’ directive: A quantification of its costs and benefits in two Italian regions. J. Hous. Econ. 2025, 68, 102057. [Google Scholar] [CrossRef]
  51. Schramm, L.; Terranova, C. From NGEU to REPowerEU: Policy steering and budgetary innovation in the EU. J. Eur. Integr. 2024, 46, 943–961. [Google Scholar] [CrossRef]
  52. Keliauskaite, U.; McWilliams, B.; Sgaravatti, G.; Tagliapietra, S. Financing European Union’s buildings’ decarbonisation strategy. Energy Policy 2025, 198, 114437. [Google Scholar] [CrossRef]
  53. Turhan, B.; Turhan, C. Financial and Tax Incentives in Energy-Efficient Buildings: A Comparative View of Türkiye and the World. ZeroBuild J. 2025, 3, 22–40. [Google Scholar]
  54. Nguyen, T.; Van Nguyen, T.; Zhou, L.; Duong, Q.H.; Ieromonachou, P. Assessing the impact of EU policies on recycling supply chain: A system dynamics perspective on advancing packaging recycling capacity. Ann. Oper. Res. 2025, 1–53. [Google Scholar] [CrossRef]
  55. Soares, S.; Serralha, F.; Paz, M.C.; Carriço, N.; Galatanu, S.-V. Unveiling the data: An analysis of plastic waste with emphasis on the countries of the E3UDRES2 alliance. Heliyon 2024, 10, e28375. [Google Scholar] [CrossRef]
  56. Laureti, L.; Costantiello, A.; Anobile, F.; Leogrande, A.; Magazzino, C. Waste Management and Innovation: Insights from Europe. Recycling 2024, 9, 82. [Google Scholar] [CrossRef]
  57. Blázquez, T.; Suárez, R.; Ferrari, S.; Sendra, J.J. Improving Winter Thermal Comfort in Mediterranean Buildings Upgrading the Envelope: An Adaptive Assessment Based on a Real Survey. Energy Build. 2023, 278, 112615. [Google Scholar] [CrossRef]
  58. Pollex, J.; Lenschow, A. When talk meets actions—Return to Commission leadership in EU environmental policy-making with the European Green Deal. J. Eur. Public Policy 2024, 32, 2197–2222. [Google Scholar] [CrossRef]
  59. Scutaru, A.M.; Witterseh, T. Risk Mitigation for Indoor Air Quality using the Example of Construction Products–Efforts Towards a Harmonization of the Health-Related Evaluation in the EU. Int. J. Hyg. Environ. Health 2020, 229, 113588. [Google Scholar] [CrossRef]
  60. Ismaeil, E.M.H. Sustainability-Based Value Engineering Management as an Integrated Approach to Construction Projects. Buildings 2024, 14, 903. [Google Scholar] [CrossRef]
  61. Goodarzi, M.; Naseri, S.; Tafazzoli, M. Beyond the Green Label: How LEED Certification Levels Shape Guest Satisfaction in USA Hotels. Buildings 2025, 15, 2108. [Google Scholar] [CrossRef]
  62. Goodarzi, M.; Berghorn, G.H. Pathways to Project Effectiveness in Sustainable Communities: Insights from a Residential Satisfaction Evaluation Model. J. Archit. Eng. 2025, 31, 04025014. [Google Scholar] [CrossRef]
Figure 1. The flowchart of the data collection and analysis workflow.
Buildings 15 02972 g001
Figure 2. The boxplot results in LEED-EB-gold-certified project sizes in six countries. The symbol “+” indicates an outlier.
Buildings 15 02972 g002
Figure 3. The boxplot results for transportation performance in six countries. The symbol “+” indicates an outlier.
Buildings 15 02972 g003
Figure 4. The boxplot results for water performance in six countries. The symbol “+” indicates an outlier.
Buildings 15 02972 g004
Figure 5. The boxplot results for energy performance in six countries. The symbol “+” indicates an outlier.
Buildings 15 02972 g005
Figure 6. The boxplot results for waste performance in six countries. The symbol “+” indicates an outlier.
Buildings 15 02972 g006
Figure 7. The boxplot results for indoor environmental quality performance in six countries. The symbol “+” indicates an outlier.
Buildings 15 02972 g007
Figure 8. The boxplot results for LEED total performance in six countries. The symbol “+” indicates an outlier.
Buildings 15 02972 g008
Table 1. Leadership in Energy and Environmental Design (LEED) systems, versions 3 and 4.
AcronymFull Form
LEED-CI v3LEED Commercial Interior versions 3 and 4
LEED-CI v4
LEED-C-and-S v3LEED Core and Shell Development versions 3 and 4
LEED-C-and-S v4
LEED-EB v3LEED for Existing Buildings versions 3 and 4
LEED-EB v4
Table 2. LEED-EB v4.1 rating system: performance-based prerequisites with maximum points (interval scale).
CategoryPrerequisiteMaximum Points
Location and transportation (LT)LT, transportation performance14
Water efficiency (WE)WE, water performance15
Energy and atmosphere (EA)EA, energy performance33
Materials and resources (MRs)MRs, waste performance8
Indoor environmental quality (EQ)EQ, indoor environmental quality performance20
Total 90
Note: The sum of these prerequisites can reach 90 points out of a possible 100.
Table 3. LEED-EB v4.1 rating systems: credits with maximum points (binary scale).
CategoryCreditMaximum Points
Sustainable sites (SS)SSc1, rainwater management1
SSc2, heat island reduction1
SSc3, light pollution reduction1
SSc4, site management1
Energy and atmosphere (EA)EAc1, enhanced refrigerant management1
EAc2, grid harmonization1
Materials and resources (MRs)MRc1, purchasing1
Indoor environmental quality (EQ)EQc1, green cleaning1
EQc2, integrated pest management1
Innovation (IN)INc1, innovation1
Total 10
Note: The amount of these binary credits can reach 10 points out of 100 possible.
Table 4. A summary of the combination of LEED and statistical design is provided in the literature review section.
LEEDStatistical Design
System and VersionCertification LevelSpace Typep-ValueEffect SizeReference
LEED-NC v2.2CombinedCombinedYesNo[13]
LEED-NC v3 2009SelectedCombinedYesNo[14]
LEED-NC v3 2009SelectedCombinedYesYes[16]
LEED-CI v4SelectedCombinedYesYes[17]
LEED–NC v3 2009SelectedCombinedYesYes[18]
LEED–C-and–S v3/v4SelectedCombinedYesYes[19]
LEED–CI v3 and LEED–C-and-S v3SelectedCombinedYesYes[20]
LEED-EB v3/v4SelectedSelectedYesYes[21]
LEED-CI v4SelectedSelectedYesYes[22]
“Combined” for a certification level means that all certification levels (i.e., certified, silver, gold and platinum) are combined into one group, while “Selected” means that the certification levels have been selected into different groups according to the certification level. “Combined” for a space type means that all space types (e.g., offices, healthcare, residential, etc.) are combined into one group, whereas “Selected” means that space types have been selected for different groups (e.g., offices only). “Yes” or “No” for statistical design indicates whether the p-value and effect size were estimated.
Table 5. The distribution of the number of LEED-EB v4.1-certified office projects in several European and Mediterranean countries (in alphabetical order) across the four LEED certification levels (3 May 2025).
CountryCertifiedSilverGoldPlatinum
Egypt0010
Finland0060
France0010
Germany00242
Greece0030
Hungary0010
Ireland00150
Israel00180
Italy00240
Latvia0010
Poland0031
Portugal0020
Romania00107
Serbia00110
Slovakia0040
Spain002310
Sweden06360
Türkiye0074
Ukraine0001
United Kingdom0010
Note: Bold font style indicates the number of LEED v4.1-certified projects that were accepted for evaluation using inferential statistics.
Table 6. Results of the Shapiro–Wilk normality test for LEED-EB v4.1 gold-certified office projects in six countries.
CountryPrerequisitep-Value
SwedenTransportation performance<0.001
Water performance0.002
Energy performance0.220
Waste performance<0.001
Indoor environmental quality performance0.025
IrelandTransportation performance<0.001
Water performance0.019
Energy performance0.485
Waste performance0.001
Indoor environmental quality performance0.088
GermanyTransportation performance<0.001
Water performance0.044
Energy performance0.015
Waste performance0.204
Indoor environmental quality performance0.048
SpainTransportation performance0.007
Water performance0.132
Energy performance0.012
Waste performance0.010
Indoor environmental quality performance0.098
ItalyTransportation performance0.023
Water Performance0.299
Energy Performance0.026
Waste Performance0.001
Indoor Environmental Quality Performance0.069
IsraelTransportation performance<0.001
Water performance0.191
Energy performance0.830
Waste performance0.017
Indoor environmental quality performance0.005
Note: Bold font: there appears to be a difference between the two groups; ordinal font: there appears to be no difference between the two groups; italic font: judgment is suspended.
Table 7. Cliff’s δ and lnθ effect sizes in absolute value.
NegligibleSmallMediumLargeReference
|δ| < 0.1470.147 ≤ |δ| < 0.330.33 ≤ |δ| < 0.474|δ| ≥ 0.474[35]
|lnθ| < 0.510.51 ≤ |lnθ| < 1.241.24 ≤ |lnθ| < 1.90|lnθ| ≥ 1.90[36]
Table 8. LEED-EB v4.1 gold-certified office project size in six countries.
LEED DataSample Size (n), Median, 25–75th Percentiles
Sweden (n = 36)Ireland (n = 15)Germany (n = 24)Spain (n = 23)Italy (n = 24)Israel (n = 18)
Project size (m2)7833, 4141–12,2803787, 3049–55939316, 6007–13,5819265, 6030–12,59713,192, 7539–15,98821,535, 14,996–43,674
p-value (Cliff’s δ)
SwedenIrelandGermanySpainItalyIsrael
SwedenX0.061 (0.34)0.214 (−0.19)0.311 (−0.16)0.028 (−0.34)<0.001 (−0.79)
Ireland X0.001 (−0.61)0.003 (−0.57)0.006 (−0.52)<0.001 (−0.94)
Germany X0.666 (0.08)0.230 (−0.20)<0.001 (−0.73)
Spain X0.087 (−0.29)<0.001 (−0.82)
Italy X0.002 (−0.56)
Israel X
Note: Bold font: there appears to be a difference between the two groups; ordinal font: there appears to be no difference between the two groups; italic font: judgment is suspended.
Table 9. Prerequisite LT: transportation performance of LEED-EB v4.1 gold-certified office projects in six countries.
Prerequisite (Max Points)Sample Size (n), Median, 25–75th Percentiles
Sweden (n = 36)Ireland (n = 15)Germany (n = 24)Spain (n = 23)Italy (n = 24)Israel (n = 18)
LT: Transportation Performance (14)13.0, 12.0–13.012.0, 12.0–13.013.0, 12.0–13.011.0, 10.2–13.011.5, 10.0–12.512.0, 12.0–12.0
p-value (Cliff’s δ)
SwedenIrelandGermanySpainItalyIsrael
SwedenX0.362 (0.15)0.856 (0.03)0.076 (0.26)0.002 (0.44)0.070 (0.28)
Ireland X0.499 (−0.12)0.536 (0.12)0.128 (0.28)0.517 (0.13)
Germany X0.201 (0.21)0.018 (0.38)0.177 (0.24)
Spain X0.440 (0.13)0.704 (−0.07)
Italy X0.240 (−0.21)
Israel X
Note: Bold font: there appears to be a difference between the two groups; ordinal font: there appears to be no difference between the two groups.
Table 10. Prerequisite WE: Water performance of LEED-EB v4.1 gold-certified office projects in six countries.
Prerequisite (Max Points)Sample Size (n), Median, 25–75th Percentiles
Sweden (n = 36)Ireland (n = 15)Germany (n = 24)Spain (n = 23)Italy (n = 24)Israel (n = 18)
WE: Water Performance (15)11.0, 9.0–12.011.0, 11.0–12.012.0, 10.0–13.010.0, 7.2–12.09.0, 8.0–11.010.0, 8.0–11.0
p-value (Cliff’s δ)
SwedenIrelandGermanySpainItalyIsrael
SwedenX0.518 (−0.11)0.051 (−0.30)0.421 (0.12)0.062 (0.28)0.146 (0.24)
Ireland X0.313 (−0.19)0.181 (0.26)0.015 (0.45)0.032 (0.43)
Germany X0.028 (0.37)0.003 (0.48)0.009 (0.46)
Spain X0.561 (0.10)0.849 (0.04)
Italy X0.670 (−0.08)
Israel X
Note: Bold font: there appears to be a difference between the two groups; ordinal font: there appears to be no difference between the two groups; italic font: judgment is suspended.
Table 11. Prerequisite EA: Energy performance of LEED-EB v4.1 gold-certified office projects in six countries.
Prerequisite (Max Points)Sample Size (n), Median, 25–75th Percentiles
Sweden (n = 36)Ireland (n = 15)Germany (n = 24)Spain (n = 23)Italy (n = 24)Israel (n = 18)
EA: Energy Performance (33)25.0, 23.0–26.022.0, 21.0–25.027.0, 26.0–28.526.0, 21.0–28.026.0, 21.5–28.021.5, 19.0–24.0
p-value (Cliff’s δ)
SwedenIrelandGermanySpainItalyIsrael
SwedenX0.081 (0.31)<0.001 (−0.55)0.411 (−0.13)0.396 (−0.13)<0.001 (0.54)
Ireland X<0.001 (−0.74)0.083 (−0.34)0.078 (−0.34)0.203 (0.26)
Germany X0.098 (0.28)0.068 (0.30)<0.001 (0.78)
Spain X0.919 (0.02)0.008 (0.48)
Italy X0.009 (0.47)
Israel X
Note: Bold font: there appears to be a difference between the two groups; ordinal font: there appears to be no difference between the two groups; italic font: judgment is suspended.
Table 12. Prerequisite MRs: Waste performance of LEED-EB v4.1 gold-certified office projects in six countries.
Prerequisite (Max Points)Sample Size (n), Median, 25–75th Percentiles
Sweden (n = 36)Ireland (n = 15)Germany (n = 24)Spain (n = 23)Italy (n = 24)Israel (n = 18)
MRs: Waste Performance (8)6.0, 5.0–7.06.0, 6.0–7.05.0, 5.0–6.07.0, 6.0–7.87.0, 6.5–8.05.0, 4.0–6.0
p-value (Cliff’s δ)
SwedenIrelandGermanySpainItalyIsrael
SwedenX0.043 (−0.35)0.432 (0.12)0.033 (−0.32)<0.001 (−0.63)0.103 (0.27)
Ireland X0.008 (0.49)0.667 (−0.08)0.013 (−0.45)<0.001 (0.65)
Germany X0.015 (−0.41)<0.001 (−0.70)0.397 (0.15)
Spain X0.104 (−0.27)0.004 (0.51)
Italy X<0.001 (0.78)
Israel X
Note: Bold font: there appears to be a difference between the two groups; ordinal font: there appears to be no difference between the two groups.
Table 13. Prerequisite EQ: Indoor environmental quality performance of LEED-EB v4.1 gold-certified office projects in six countries.
Prerequisite (Max Points)Sample Size (n), Median, 25–75th Percentiles
Sweden (n = 36)Ireland (n = 15)Germany (n = 24)Spain (n = 23)Italy (n = 24)Israel (n = 18)
EQ: Indoor Environmental Quality Performance (20)13.0, 11.5–13.515.0, 13.0–17.014.0, 11.5–15.015.0, 13.0–17.015.0, 12.0–16.016.5, 16.0–17.0
p-value (Cliff’s δ)
SwedenIrelandGermanySpainItalyIsrael
SwedenX0.002 (−0.53)0.192 (−0.20)<0.001 (−0.57)0.004 (−0.43)<0.001 (−0.89)
Ireland X0.170 (0.26)0.748 (−0.06)0.680 (0.08)0.051 (−0.39)
Germany X0.046 (−0.34)0.173 (−0.23)<0.001 (−0.65)
Spain X0.414 (0.14)0.062 (−0.34)
Italy X0.006 (−0.48)
Israel X
Note: Bold font: there appears to be a difference between the two groups; ordinal font: there appears to be no difference between the two groups; italic font: judgment is suspended.
Table 14. LEED total from LEED-EB v4.1 gold-certified office projects in six countries.
Prerequisite (Max Points)Sample Size (n), Median, 25–75th Percentiles
Sweden (n = 36)Ireland (n = 15)Germany (n = 24)Spain (n = 23)Italy (n = 24)Israel (n = 18)
LEED total (100)65.0, 62.5–69.070.0, 67.0–71.870.5, 68.0–73.070.0, 67.2–73.069.5, 63.0–71.564.0, 63.0–67.0
p-value (Cliff’s δ)
SwedenIrelandGermanySpainItalyIsrael
SwedenX0.001 (−0.56)<0.001 (−0.53)<0.001 (−0.57)0.056 (−0.29)0.543 (0.10)
Ireland X0.601 (−0.10)0.599 (−0.10)0.377 (0.17)<0.001 (0.65)
Germany X1.000 (0.00)0.223 (0.21)<0.001 (0.59)
Spain X0.190 (0.22)<0.001 (0.64)
Italy X0.054 (0.35)
Israel X
Note: Bold font: there appears to be a difference between the two groups; ordinal font: there appears to be no difference between the two groups; italic font: judgment is suspended.
Disclaimer/Publisher’s Note: The statements, opinions and data contained in all publications are solely those of the individual author(s) and contributor(s) and not of MDPI and/or the editor(s). MDPI and/or the editor(s) disclaim responsibility for any injury to people or property resulting from any ideas, methods, instructions or products referred to in the content.