Article

Temperature–Load Stress Analysis of Ultra-Long Pool Structures Based on Distributed Fiber Optic Sensing and Finite Element Analysis

1
China Coal Xi’an Design Engineering Co., Ltd., Xi’an 710054, China
2
School of Civil Engineering, Chang’an University, Xi’an 710064, China
*
Authors to whom correspondence should be addressed.
Buildings 2025, 15(16), 2961; https://doi.org/10.3390/buildings15162961
Submission received: 14 July 2025 / Revised: 10 August 2025 / Accepted: 14 August 2025 / Published: 20 August 2025

Abstract

Ultra-long pool structures used in mine water treatment projects are typical large-volume concrete structures that are highly susceptible to cracking due to the combined effects of cement hydration heat, seasonal temperature variations, and internal water pressure. Such cracking can compromise the durability and long-term service performance of the structure. In this study, distributed fiber optic sensing and finite element analysis were conducted to observe the response of ultra-long pool structures under thermal–load effects. System comparison shows that the average error between the monitored peak thermal strain values and the corresponding simulated values is within 9%. Parametric analysis using the validated simulation model indicates that the hydration protocol with temperatures of 15 °C (casting), 55 °C (peak), and 15 °C (stable), a temperature drop of −20 °C, and loading conditions in sub-pools 3+6 and sub-pools 1+3+5 are the most unfavorable scenarios for inducing tensile stress. When a temperature drop of −20 °C is combined with loading conditions in sub-pools 3+6 or sub-pools 1+3+5, the tensile stress in the pool structure increases by 30% compared to the stress induced by loading alone. This indicates that during the service life of the pool structure, extreme temperature variations combined with mechanical loading may result in localized cracking. This study provides a comprehensive understanding of ultra-long pool behavior during construction and service phases, supporting effective maintenance and long-term durability.

1. Introduction

Mine water treatment plays a critical role in ensuring environmental safety and sustainable mining operations [1,2,3,4]. To accommodate large volumes of mine wastewater, treatment facilities often adopt ultra-long reinforced concrete pool structures. These pools, characterized by their large volumes and continuous lengths, are especially vulnerable to cracking due to complex environmental and operational conditions [2,5,6]. Cracking not only compromises the structural integrity and durability of the pool but also severely affects its water retention capacity and long-term service performance [7].
One of the primary challenges in such large-scale concrete structures is the combined influence of thermal and service period inner water loading [8,9]. The heat generated from cement hydration during the early-age curing process and seasonal temperature fluctuations induces thermal gradients and shrinkage strains [10]. Additionally, internal water pressure exerted during service further exacerbates the risk of tensile stress concentration, especially in restrained regions such as sidewall frame columns and intersections of longitudinal and transverse walls [11]. If not properly addressed, these factors may lead to early-age or service-stage cracking, ultimately shortening the structure’s lifespan [12].
To address the issue of cracking in concrete structures, recent studies have primarily focused on the incorporation of composite admixtures or fibers to enhance crack resistance [13,14,15]. These approaches have shown promising results in reducing early-age cracking and improving long-term durability in conventional large-volume concrete structures. However, the majority of these researches have centered on traditional-scale structures, with very limited investigations targeting ultra-long reinforced concrete pools. This research gap is especially significant for ultra-long pools exposed to harsh environments and internal hydraulic pressure, where unique challenges remain insufficiently addressed.
On the other hand, current research predominantly focuses on laboratory-based studies and has not comprehensively monitored the thermal and load stresses experienced by ultra-long pool structures during actual service conditions. In terms of monitoring methodologies, existing studies on large-scale concrete structures largely rely on point-based monitoring techniques [16]. There is a significant gap in comprehensive monitoring for ultra-long pools exceeding 100 m in length, where a holistic understanding of stress distributions and crack behaviors is crucial but currently lacking.
In this study, distributed optical fiber sensing technology was utilized to ensure precise in situ monitoring of temperature and stress variations. The monitored data is then used to validate a finite element simulation model, ensuring that the model accurately reflects real-world conditions. Building on this validated finite element model, a comprehensive parametric analysis is conducted to explore a diverse range of temperature-load scenarios and their effects on crack initiation and propagation. Through this extensive analysis, the critical conditions are found and an optimized proposal is obtained to improve the crack resistance of the concrete.
The outline of this study are as follows: Section 2 outlines the research methodologies, detailing the distributed optical fiber sensing scheme, numerical simulation scenarios, and laboratory experiments. Section 3 validates the numerical simulation model using the in sit monitoring data. Section 4 and Section 5 present parametric analyses exploring the impacts of various factors on structural stresses, identifying critical weak conditions. Finally, the study synthesizes the research outcomes in Section 6.

2. Methodology

As illustrated in Figure 1, this study encompasses three pivotal steps, each elaborated in the subsequent sections.
Initially, distributed optical fiber sensing technology is employed for in situ monitoring of temperature and stresses, laying a crucial foundation for accurate data collection. Subsequently, the collected data are utilized to validate a finite element simulation model, ensuring its alignment with actual field conditions. Finally, a comprehensive parametric analysis is conducted using the validated model to investigate various temperature–load scenarios and their impacts on crack initiation and propagation, thereby providing valuable insights into the system’s potential vulnerabilities and behaviors under different conditions.

2.1. Overview of Ultra-Long Pool Structure

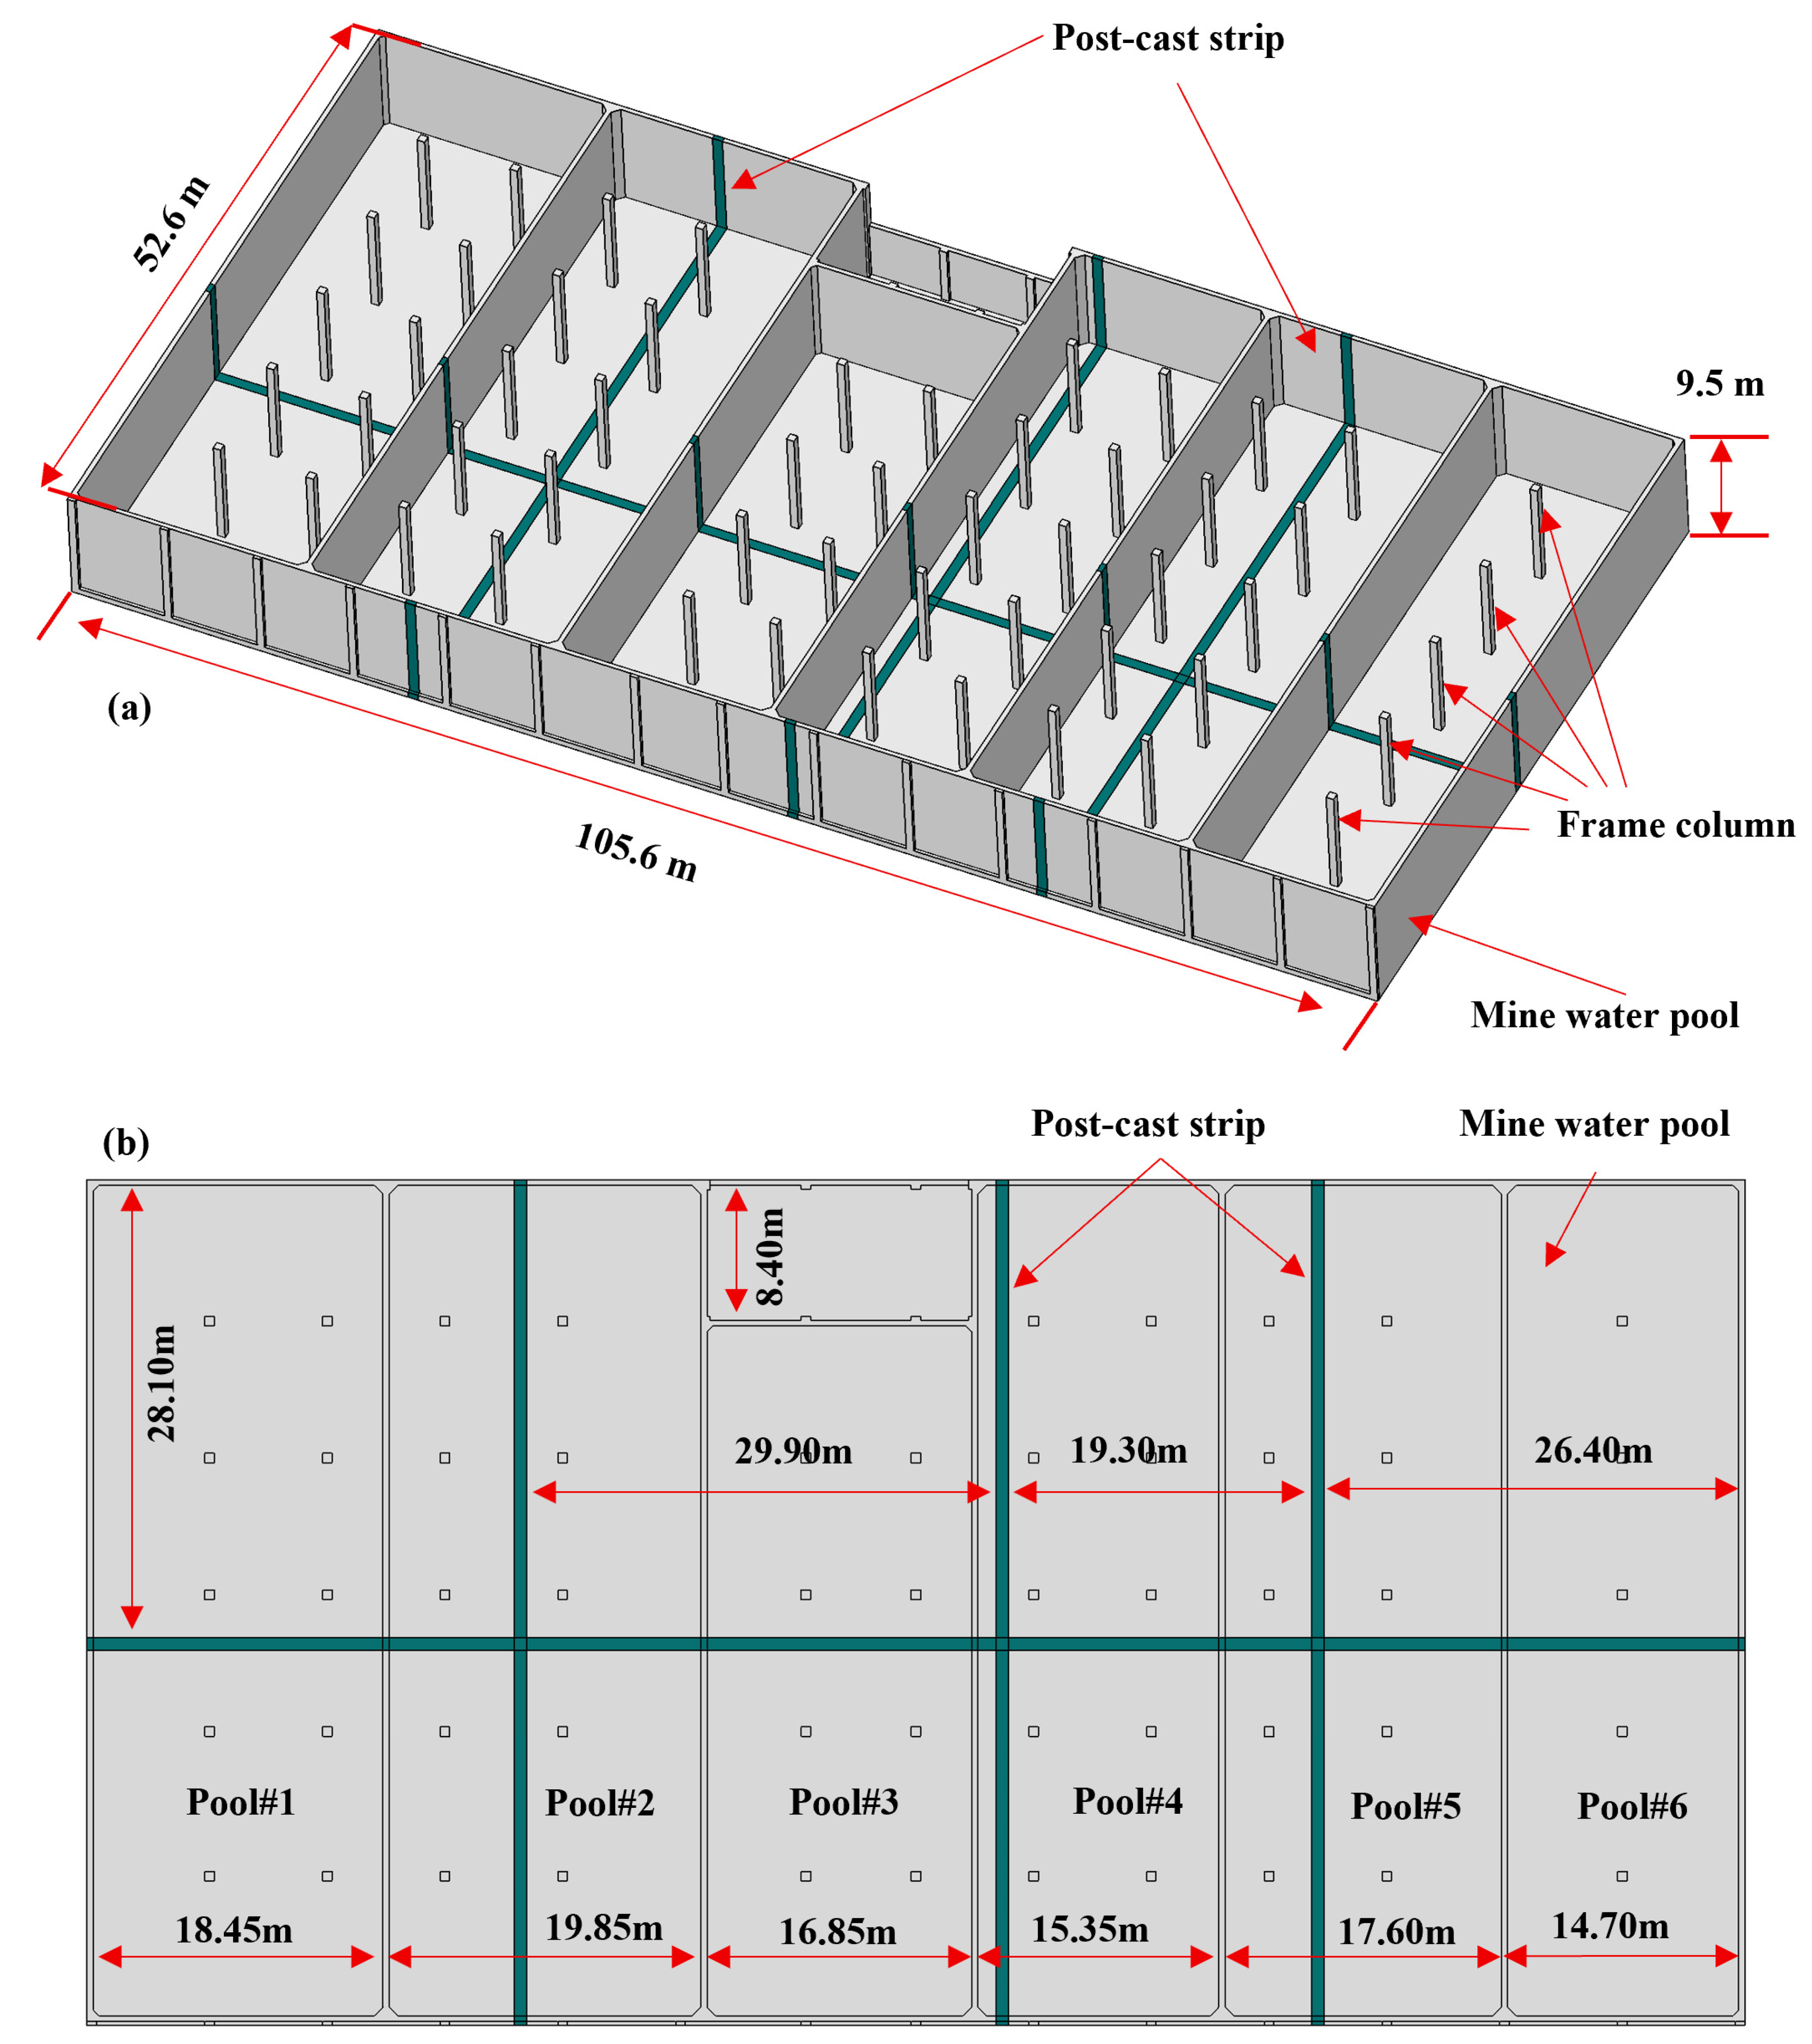
Figure 2 shows the overview of the studied ultra-long pool. It is constructed using a cast-in-place reinforced concrete method and is classified as a typical ultra-long, large-volume concrete structure. The pool has a length of 105.6 m, a width of 52.6 m, and a height ranging from 7.3 to 9.5 m.
The base slab is 500 mm thick. To facilitate different stages of the wastewater treatment process, the pool is internally divided into six hydraulically connected sub-pool units. The water pool is constructed with C40 concrete and reinforced with HRB400 high-strength deformed bars. Unlike typical large-scale concrete basins, it features no expansion or contraction joints. To mitigate early-age thermal stress from hydration, several longitudinal post-cast strips were incorporated during construction.

2.2. Distributed Fiber Optic Sensing

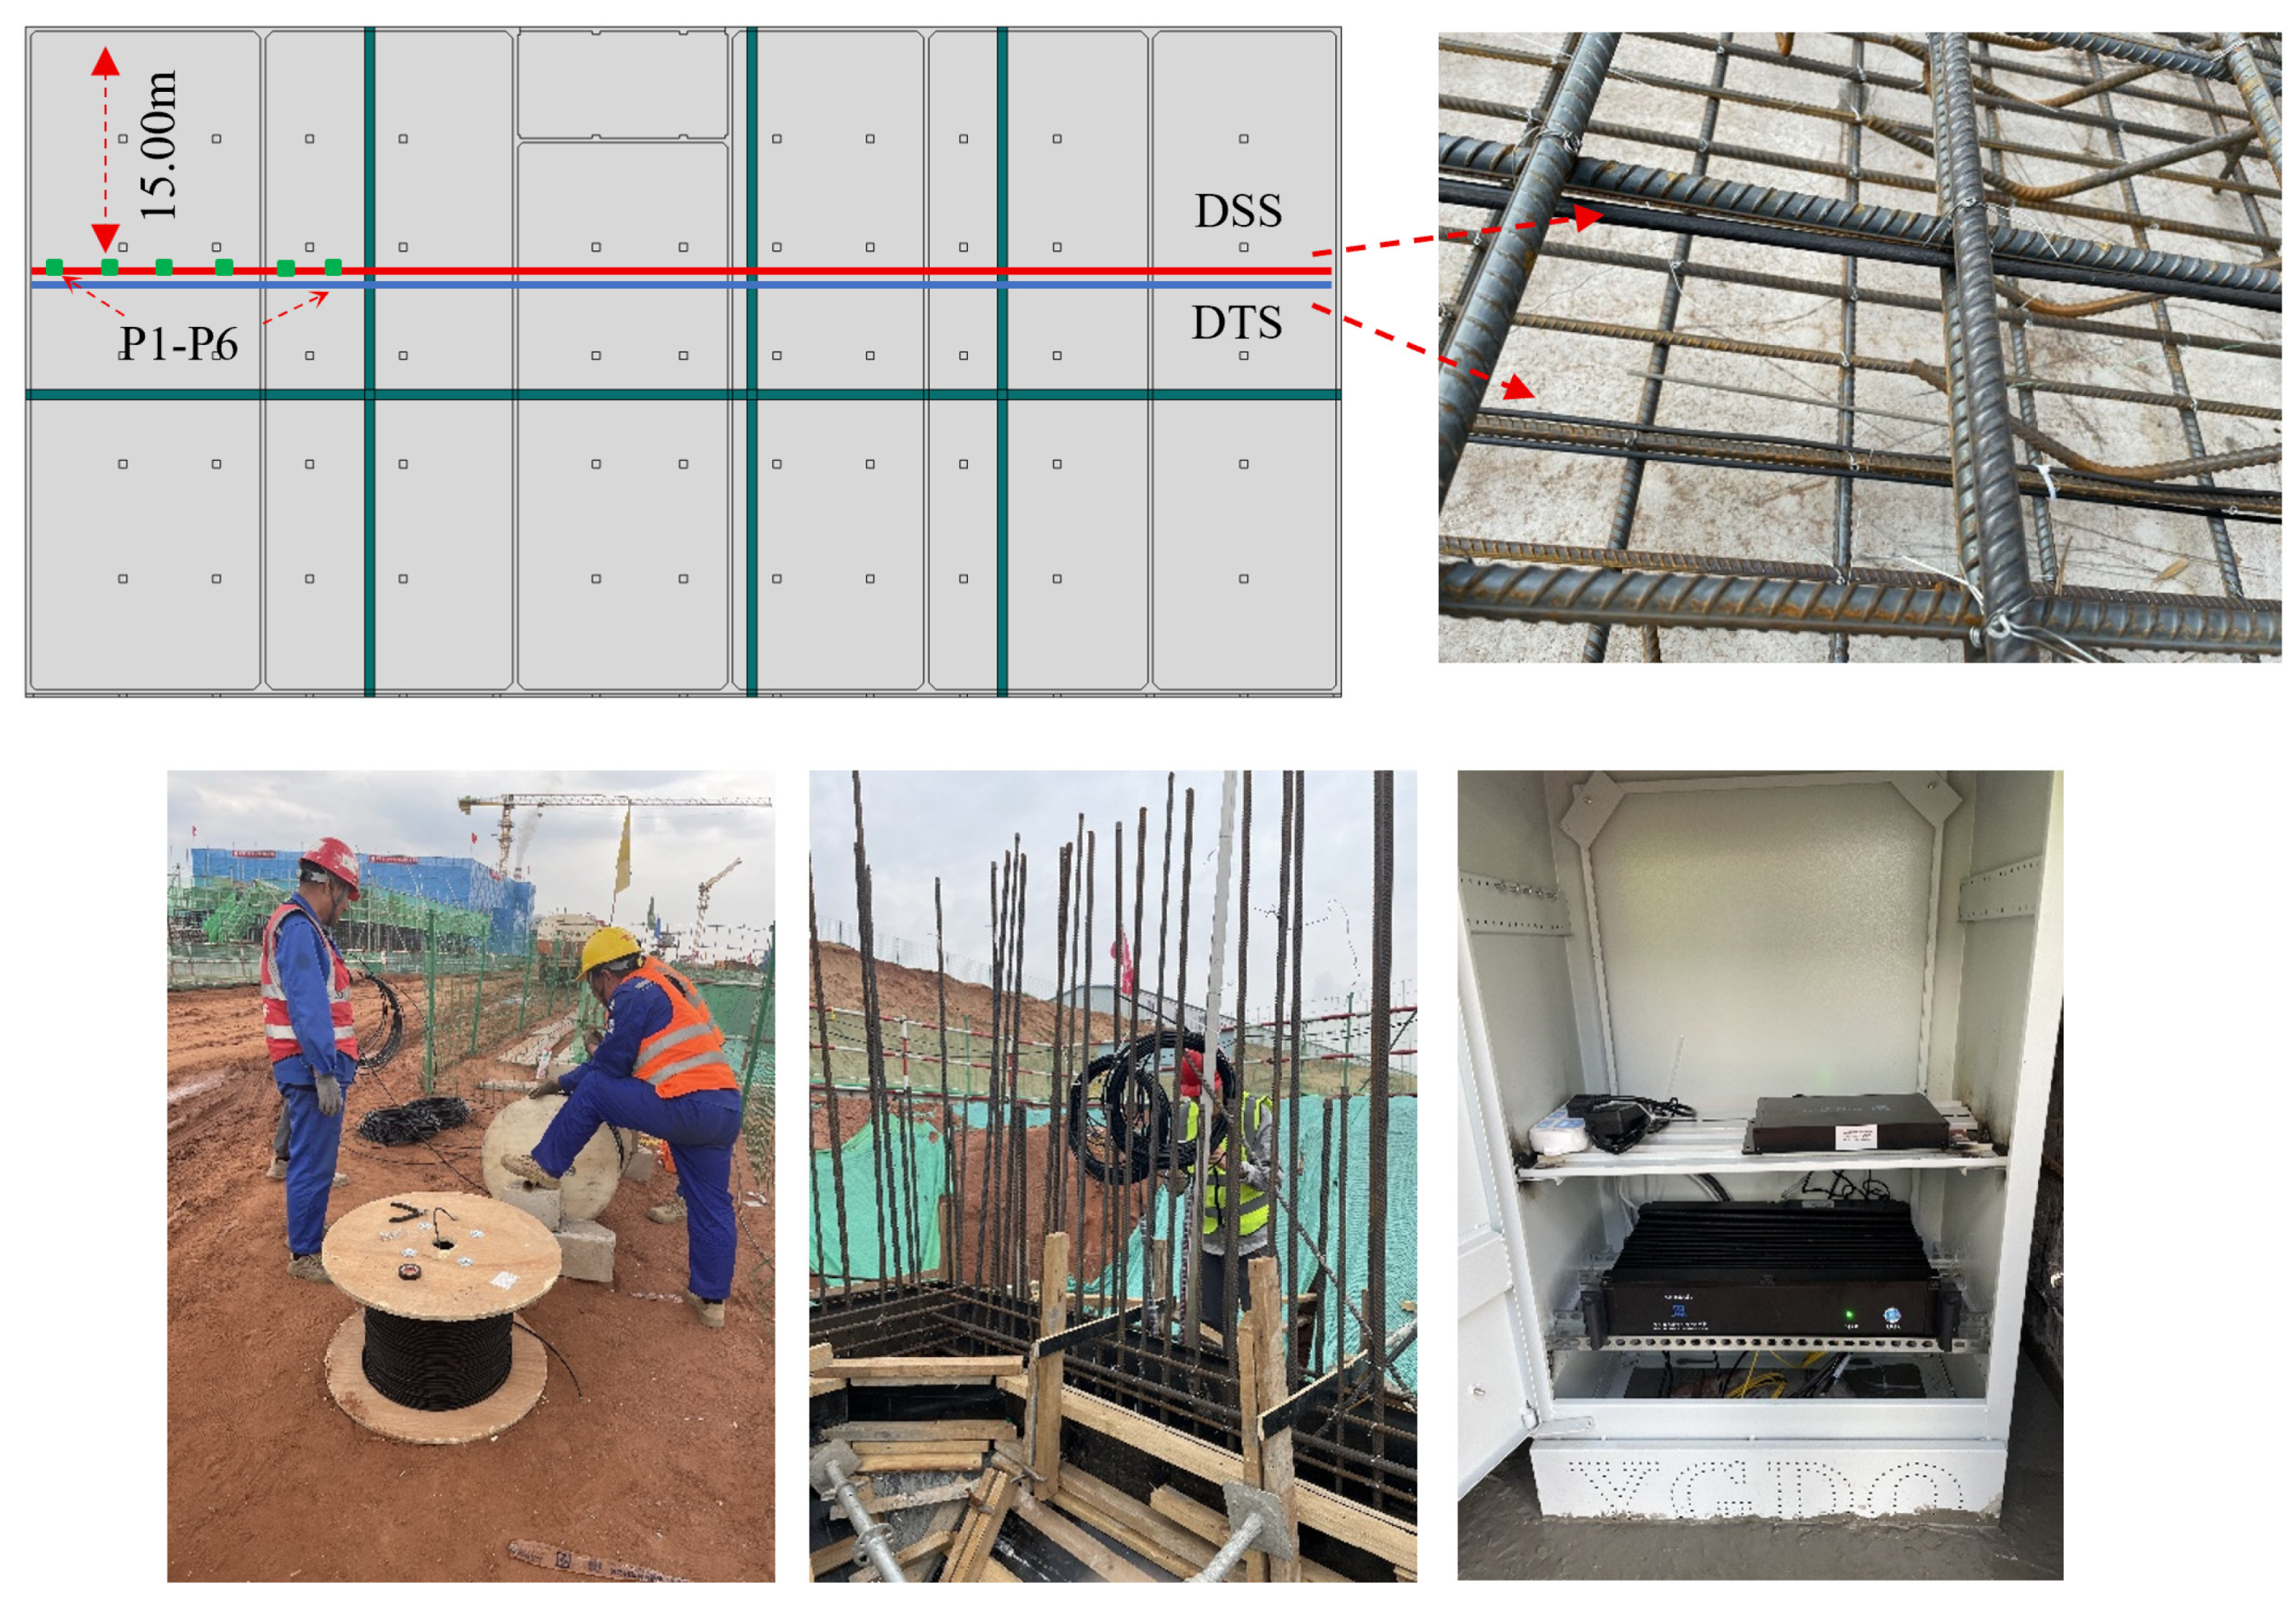
In this study, distributed fiber optical sensing (DFOS) was selected due to its unique advantages in achieving large-scale, high-density, and long-term monitoring. Given the ultra-long dimensions of the pool structure, it would be difficult for traditional sensors to efficiently capture the full-field temperature and strain distributions. The optical fiber system enables distributed measurements along the entire structure, providing the spatial resolution necessary for identifying thermal gradients and deformation patterns over time. Optical fibers were embedded 30 mm from the top and bottom surfaces—within the protective layer—to ensure accurate near-surface measurements while maintaining durability during casting and operation. The installed distributed optical fiber cables are shown in Figure 3. Specifically, distributed temperature sensing (DTS) and distributed strain sensing (DSS) systems were deployed along the entire length of the baseboard. Subsequently, these optical sensors were interconnected to establish a centralized monitoring hub. Along the cable, sensor points are uniformly spaced at intervals of 1 m to balance spatial resolution with system feasibility and data manageability across the entire structure.
Principally, the applied DTS and DSS belong to ultra-weak fiber Bragg grating (UW-FBG) [16]. UW-FBG combines the dense spatial resolution of DFOS with the high accuracy and wavelength-encoded reliability of traditional FBG sensors, making it ideal for large-scale, precise monitoring. Considering both the variation of strain and temperature, the wavelength shift of the DSS sensor is written as [17]
λ b = K ε Δ ε + K t Δ T
where λ b is the wavelength shift; K ε and K t are the strain and thermal coefficients of the UW-FBG sensor, respectively; Δ ε and Δ T are the stress and temperature shifts, respectively; K ε Δ ε is the strain-induced wavelength variation of the sensor; K t Δ T is the temperature-induced wavelength variation of the sensor.
For DTS, a layer of stainless-steel tube is adopted around the sensors. Therefore, the wavelength shift of the DTS sensor is only affected by temperature change and can be written as
λ b ˙ = K t Δ T
By subtracting Equation (2) from Equation (1), the wavelength drift caused by pure strain can be obtained. In practical monitoring, the λ b and λ b ˙ are measured, which means the stress caused by load and temperature can be calculated. The strain and temperature coefficients used for data interpretation were pre-calibrated and provided by the sensor manufacturer (Suzhou NanZee Sensing Technology Co., Ltd., Suzhou, China). In this study, the strain coefficient K ε was 1/845 pm/με, and the temperature coefficient K t was 1/100 pm/°C.

2.3. Material Properties

2.3.1. Material Experiments

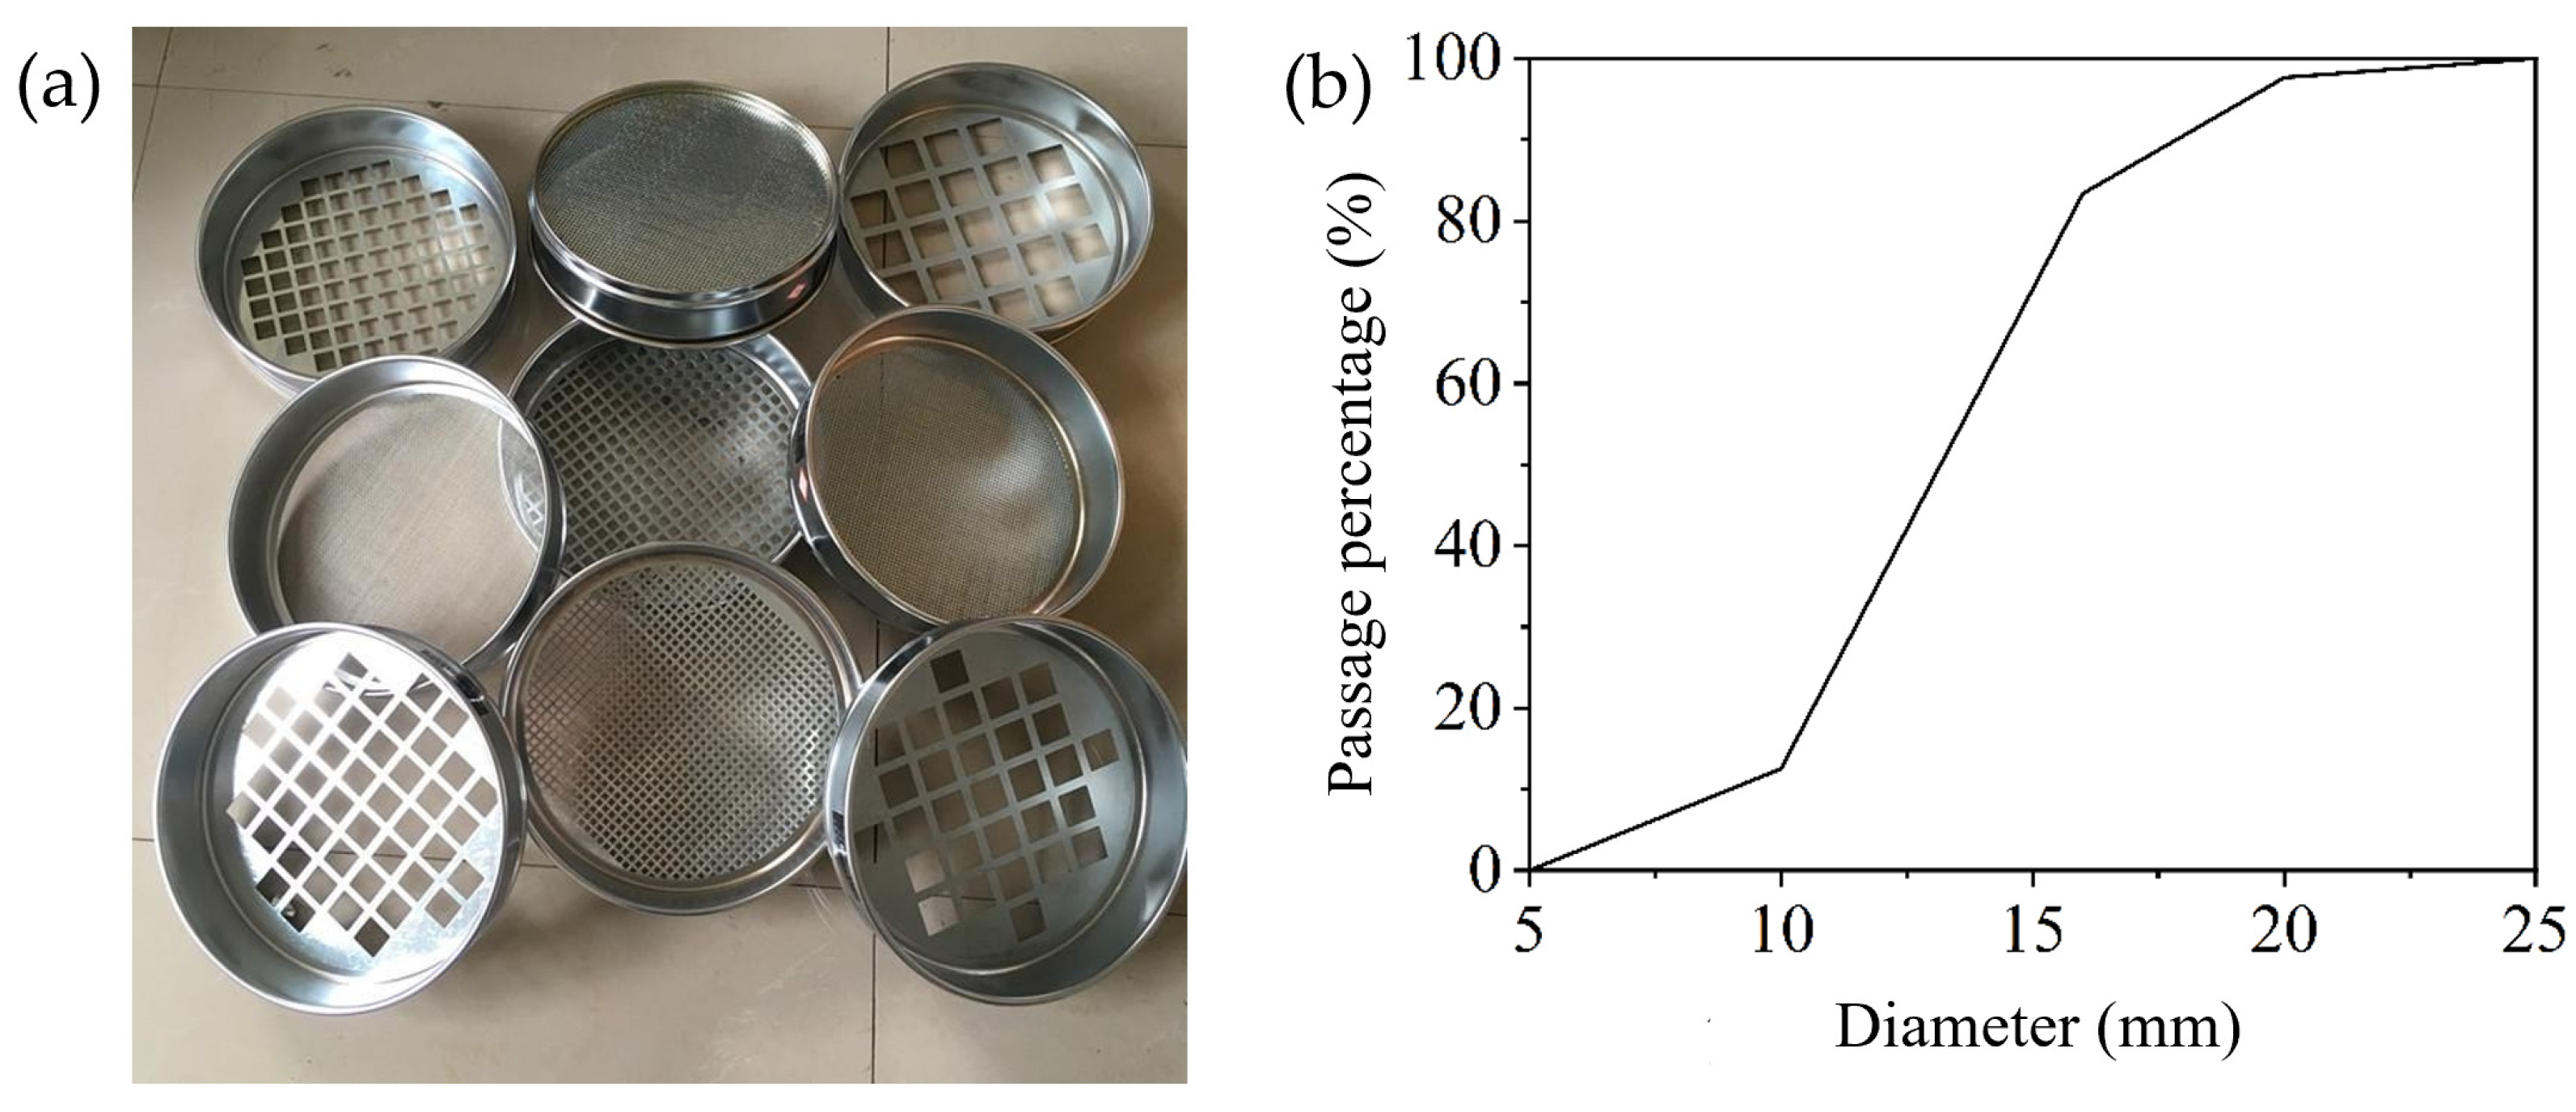
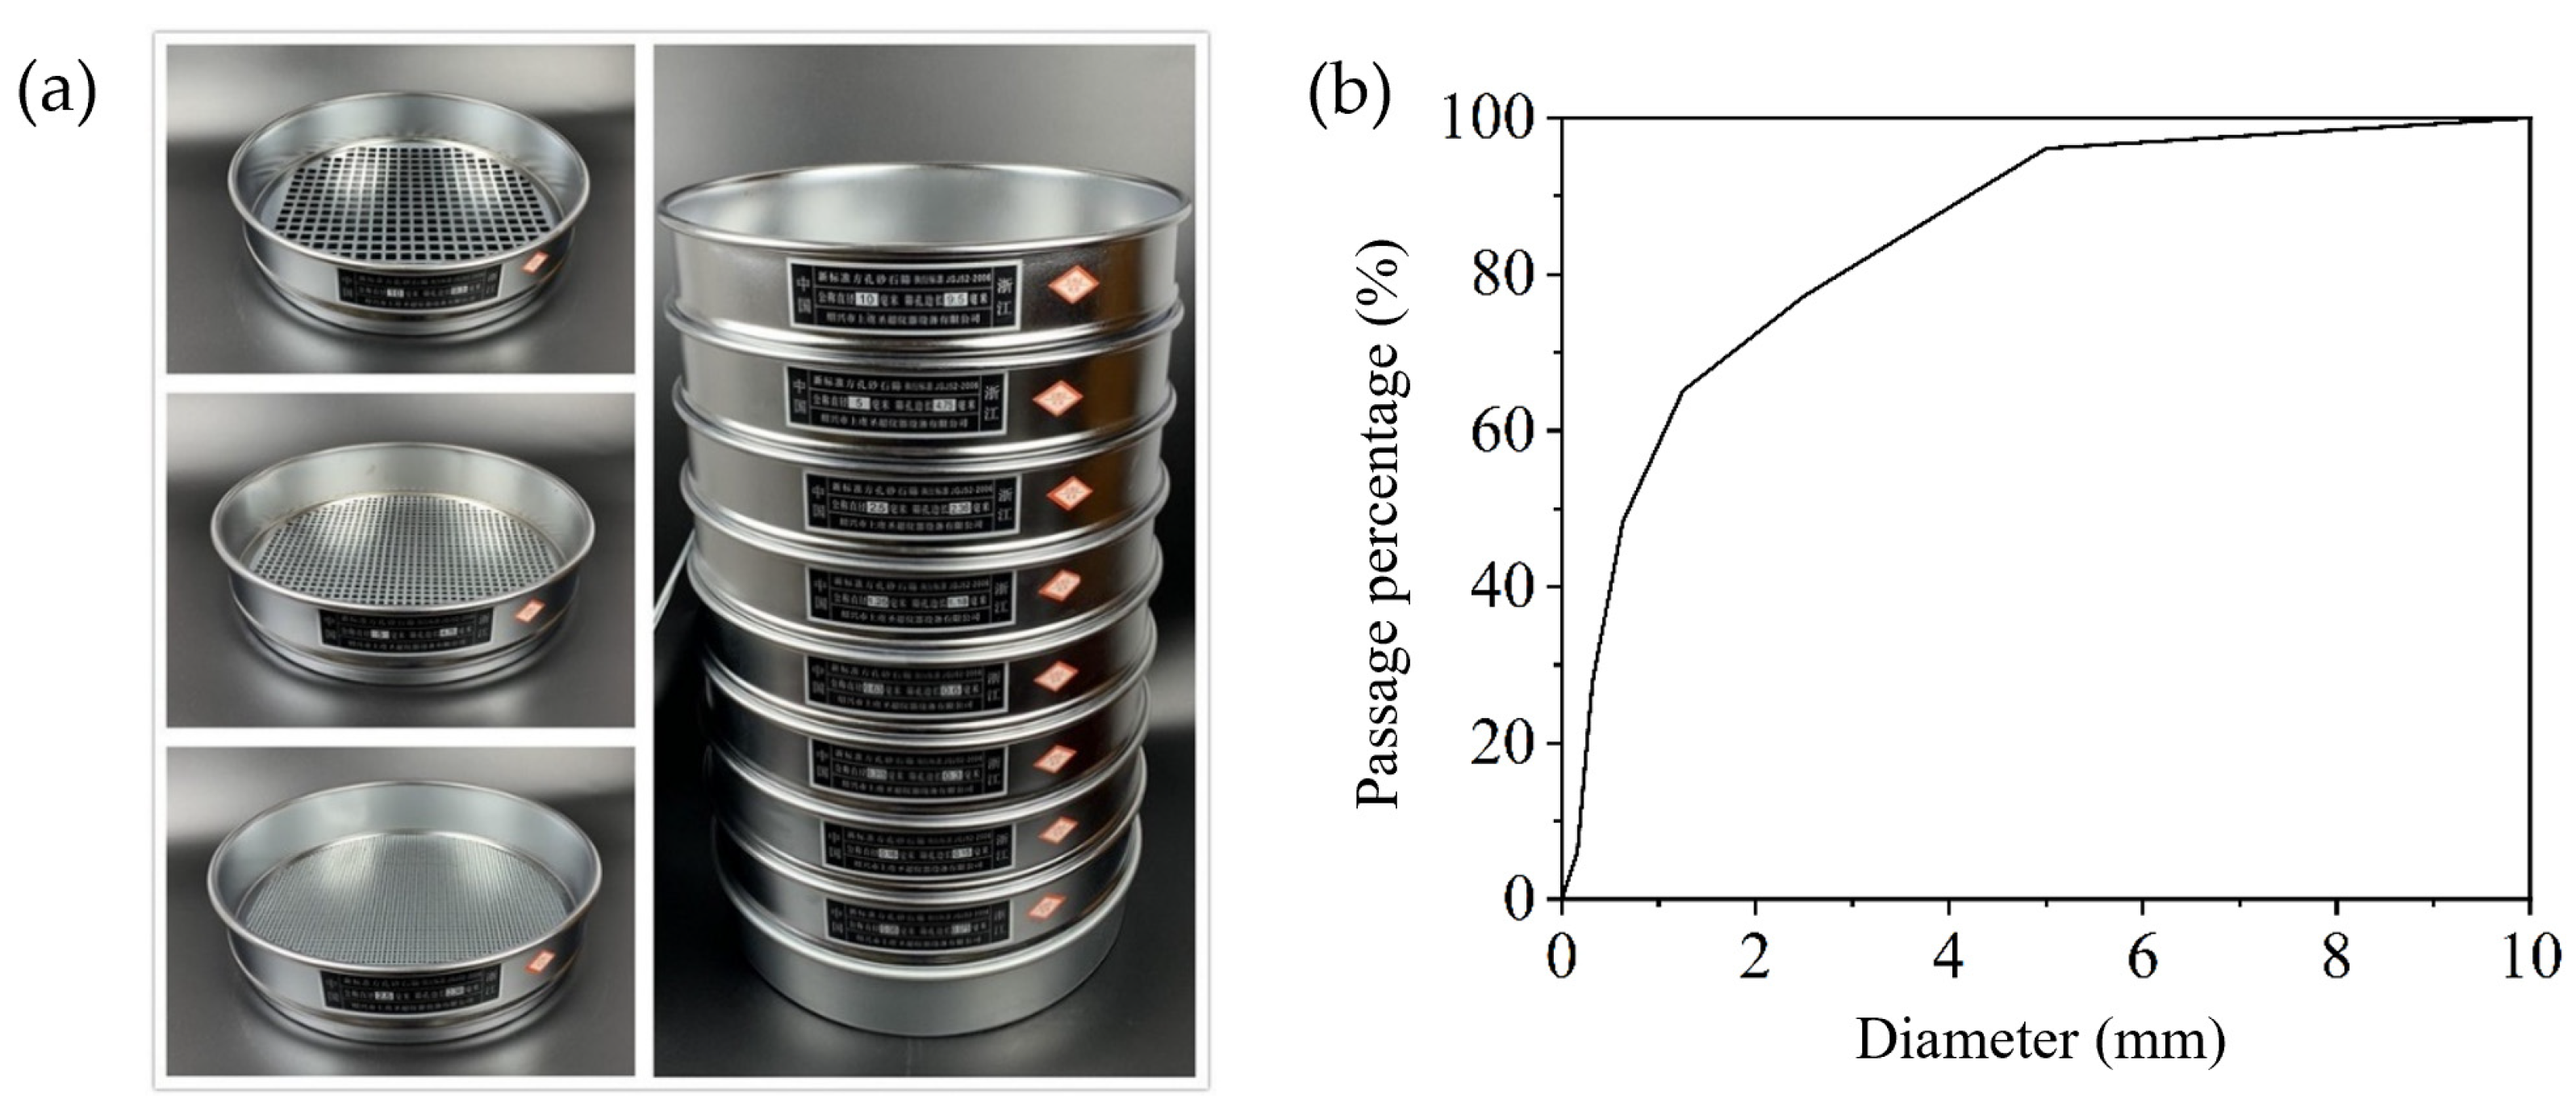
To ensure the reliability and representativeness of the concrete used in this study, all raw materials were directly sourced from the construction site, including PC 42.5 composite Portland cement, according to Chinese standard GB 175-2023 [18], grade I and class F fly ash, polycarboxylate superplasticizer, natural river sand with particle sizes within 4.75 mm, and gravel with 5 mm–25 mm continuous grading. The chemical compositions of the cement and fly ash are listed in Table 1.
According to Chinese Code JGJ 52-2006 [19], the particle size distribution of both the sand and gravel was evaluated using standard sieving analysis to confirm compliance with mix design requirements, as shown in Figure 4 and Figure 5. In addition, the apparent density, bulk density, and compacted bulk density of the aggregates were each measured twice to improve test repeatability and accuracy, as listed in Table 2 and Table 3. The fine aggregate used in this study had a fineness modulus of 2.7, indicating a medium sand classification according to standard grading systems.
Based on the material tests, a concrete mixture was designed, as detailed in Table 4. This mixture was formulated to replicate the actual material behavior as closely as possible within the simulation and testing framework, thereby ensuring an accurate representation of practical conditions. Then, 100 × 100 × 100 mm cubic samples were cast for compressive and splitting tests. All concrete specimens were cured in a standard curing room at 20 ± 2 °C and relative humidity ≥ 95%, in accordance with Chinese Standard GB/T 50081-2019 [20]. After 28 days of curing, the concrete mixture was tested, and the test values were calculated by applying a coefficient of 0.95, revealing compressive strengths of 45.0 ± 2.0 MPa. In addition, the splitting test strength f s t was converted to the uniaxial tensile strength f t by f t = 1.23 f s t 0.5446 [21], with results of 2.53 ± 0.36 MPa.

2.3.2. Concrete Constitutive Laws

In the numerical simulation, concrete damage plasticity model (CDP) was used for concrete modeling, because CDP has the capacity to offer the most realistic portrayal of the actual properties of concrete [22].
Specifically, the constitutive curves shown in Figure 6 were utilized in accordance with the curve proposed by Chinese code GB 50010-2010 [23]. Notably, the stress–strain curves of concrete under tension and compression are represented in the same coordinate system, but with different ratios. Positive values represent compression, whereas negative values indicate tension.
The compressive constitutive law of concrete is represented by [23]
σ c = f c α a ε c ε c ,   p + 3 2 α a ε c ε c ,   p 2 + α a 2 ε c ε c ,   p 3   if   ε c ε c ,   p f c ε c / ε c , p α d ε c / ε c ,   p 1 2 + ε c / ε c ,   p   if   ε c > ε c ,   p
ε p = 700 + 172 f c × 10 6
where fc and ε(c, p) represent the compressive strength and corresponding strain of the concrete, respectively; αa and αd represent parameters; σc and εc represent the compressive stress and strain of the concrete, respectively. According to Chinese design code [23], αa, αd, and ε(c, p) were valued at 1.71, 2.74, and 0.00192, respectively.
Accordingly, concrete’s tensile constitutive law is represented by [23]
σ t = f t ε t ε t ,   p         if     ε t ε t ,   p f t ε t / ε t ,   p α d ε t / ε t ,   p 1 2 + ε t / ε t ,   p     if     ε t > ε t ,   p
where ft and ε(t, p) represent the tensile strength and corresponding strain; σt and εt represent the tensile stress and strain of concrete, respectively.
The dilation angle ψ, flow potential eccentricity ε, biaxial compressive strength to the uniaxial compressive strength ratio σbo/σco, yielding surface shape coefficient k, and viscosity parameter μ are the plasticity parameters defined according to [24]. Table 5 summarizes the values for these parameters. Additionally, the tested f c and f t were applied in Equations (3)–(5). Essentially, these curves were semi-empirically constructed, relying on the measured strengths, and established constitutive models.

2.3.3. Steel Reinforcement Constitutive Laws

The tensile and compressive behavior of steel bars are represented by the elastic–plastic strain hardening material model [23], as follows:
σ s = ε s E s         if   0 ε s < ε y 0.02 E s ε s ε y + f y   if   ε y ε s ε u
where σs and εs denote the stress and strain of the steel bars, respectively; fy and εy represent the yield stress and corresponding strain; Es represents the elastic modulus; and εu represents the ultimate strain.

2.4. Numerical Modeling

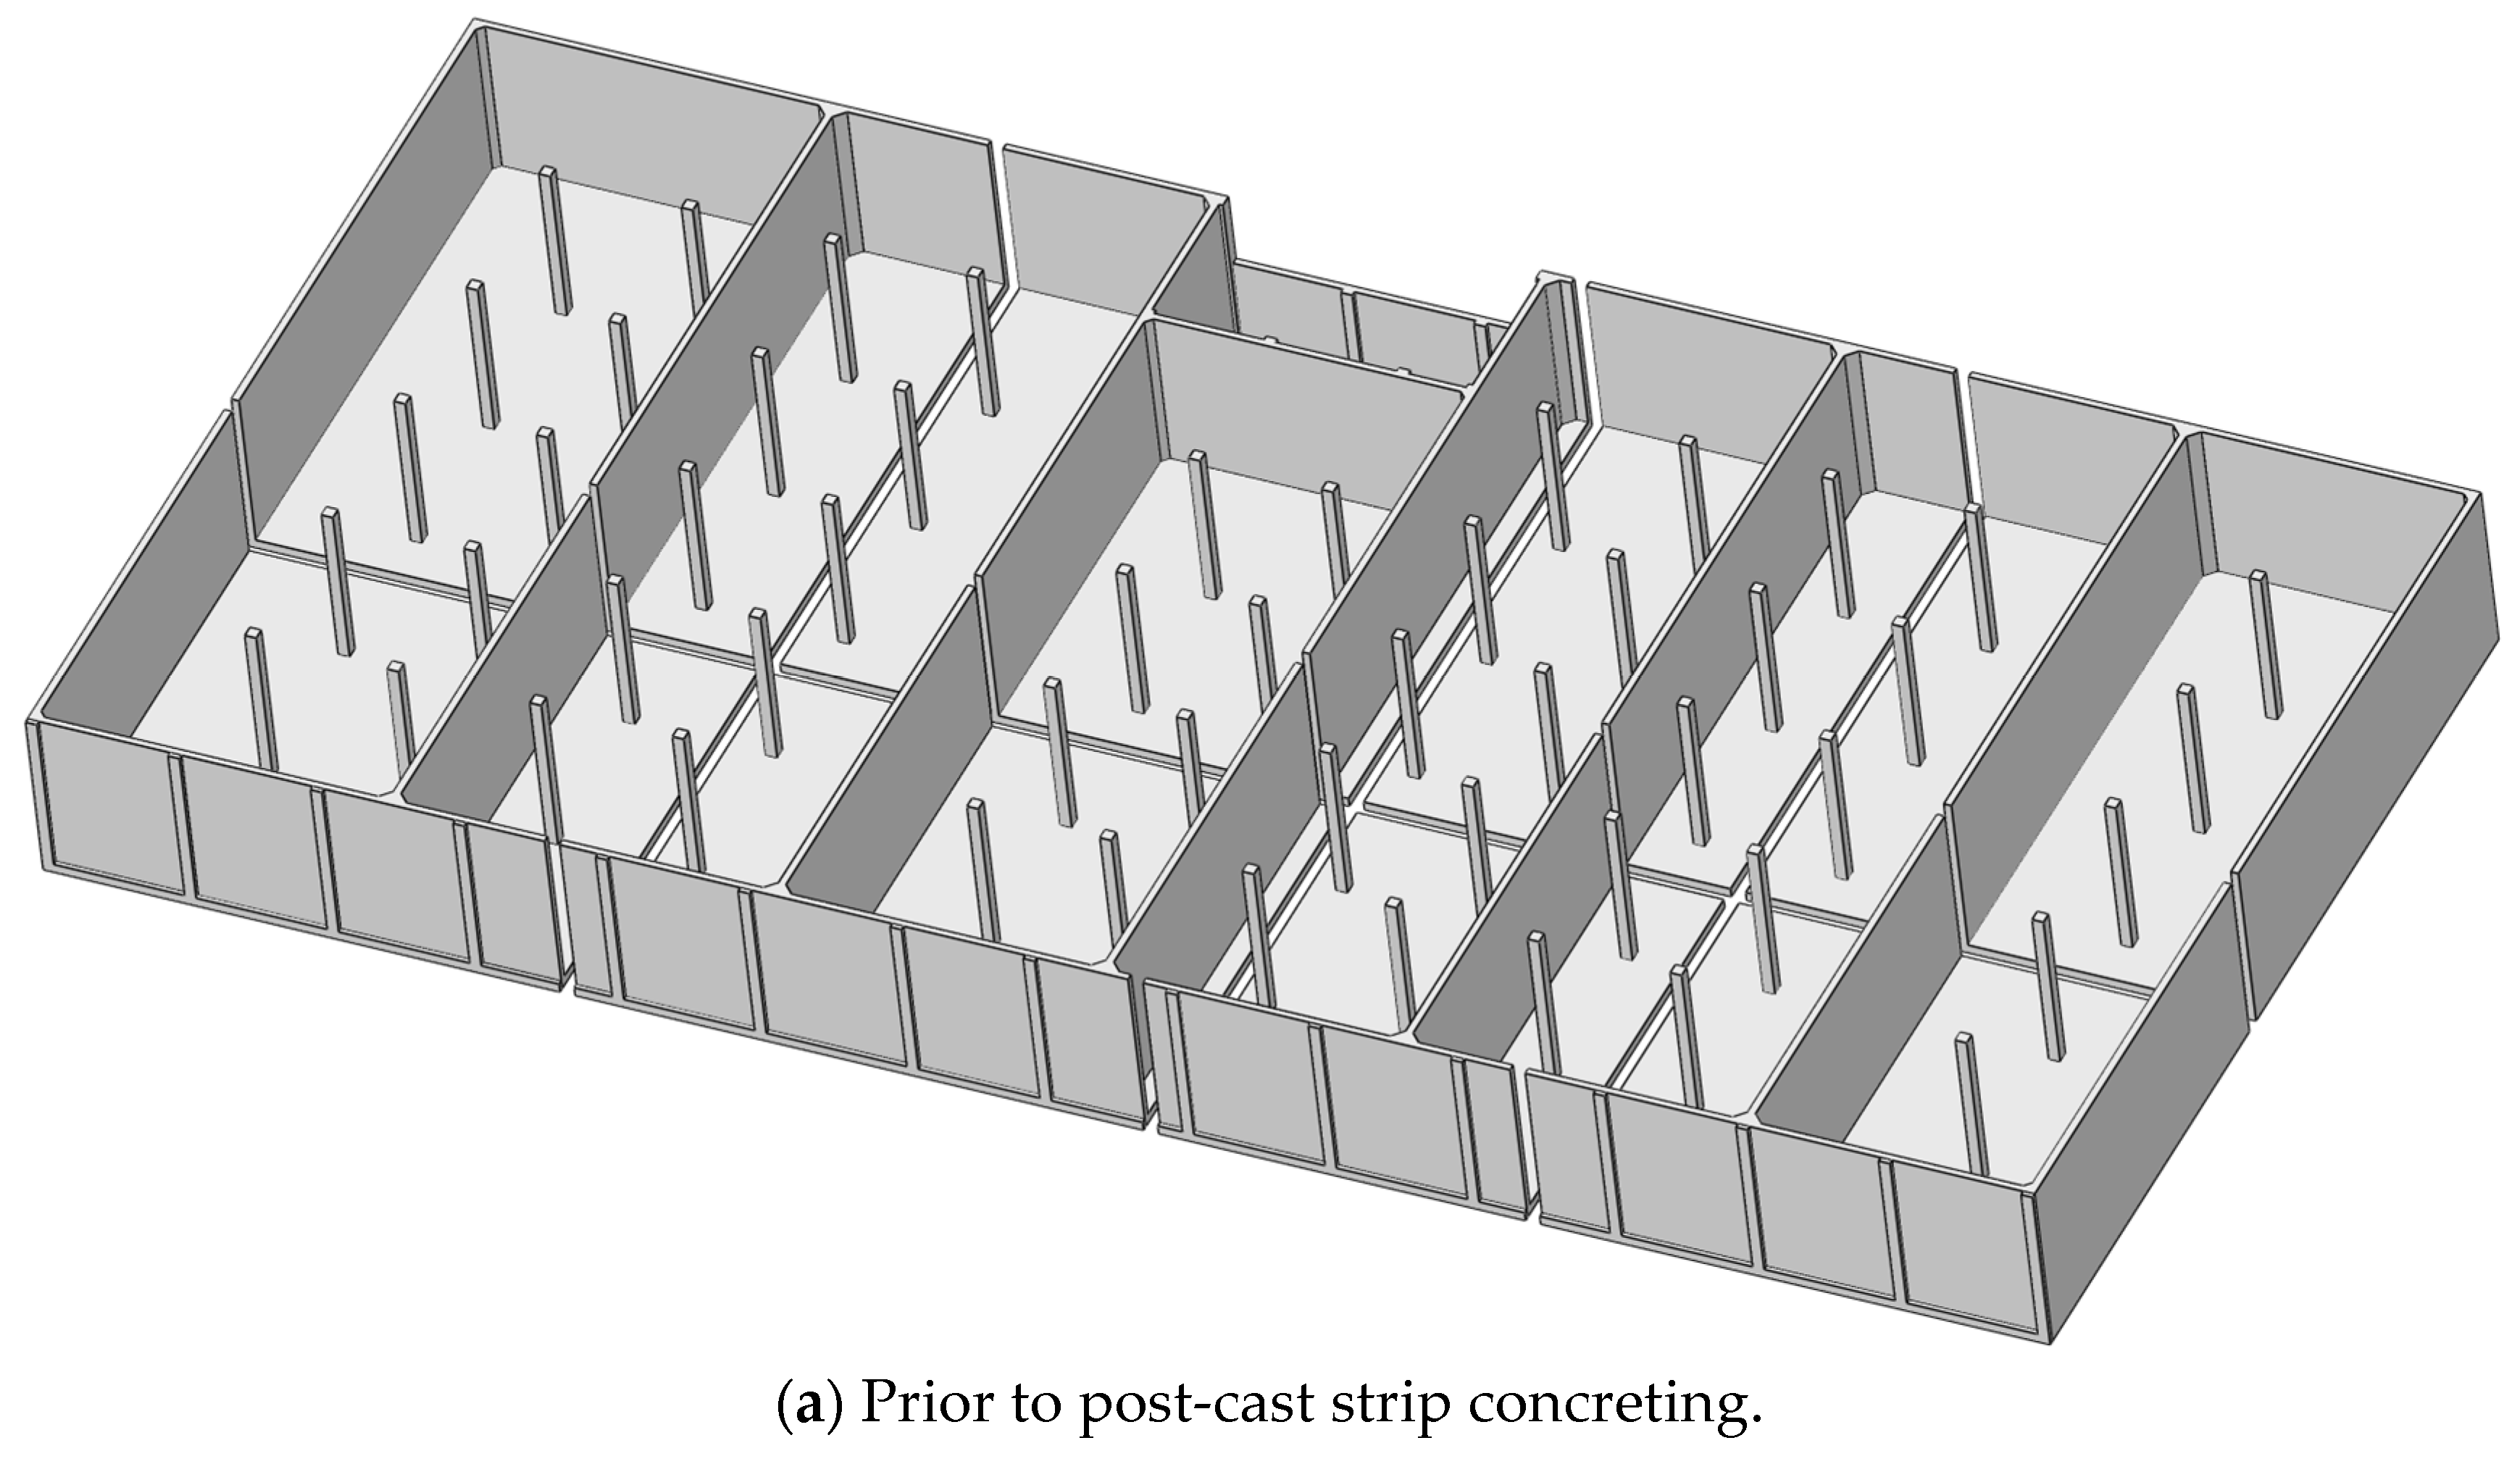
During actual construction, the reinforcement was first fully tied in place, followed by the casting of concrete in sequence, excluding the post-cast strip sections. Once the hydration heat process was complete (about 7 days), the post-cast strips were then poured. To reflect the actual construction sequence, the numerical simulation also accounted for the effect of the post-cast strips. Figure 7a depicts the structural configuration prior to casting the post-cast strips. Figure 7b shows the completed structure after the strips were cast. And Figure 7c illustrates the reinforcement mesh layout of the ultra-long water pool. It is worth noting that although the internal frame columns within the ultra-long pool have a relatively limited influence on the thermal and load responses of the overall structure, they were still included in the modeling for structural completeness and accuracy.
Through ABAQUS (version 6.14) software [22], a fine three-dimensional model was developed to investigate the influence of the temperature and the water load on the structure resistance. In this three-dimensional model, concrete was modeled using a solid brick element (C3D8R). A two-node linear three-dimensional truss element (T3D2) was used to represent the rebars, which were embedded in concrete.

2.5. Considered Conditions

Following validation of the FEM model using on-site temperature and strain data from the distributed temperature sensing (DTS) and distributed strain sensing (DSS) systems, systematic analysis was conducted to simulate the typical thermal and loading conditions encountered by the ultra-long water pool during and after construction, as summarized in Table 6. The parameters analyzed in the numerical simulation were selected based on a detailed investigation of the actual construction and environmental conditions on-site, as well as the functional requirements of this ultra-long pool. Moreover, considerations were made regarding long-term service behavior under seasonal temperature variations and realistic loading scenarios. These conditions are divided into three main categories: early-age hydration temperature, seasonal thermal effects, and various static water loading combinations. Each condition was selected based on realistic construction scenarios and service environments to ensure the accuracy and applicability of the numerical simulation.
Specifically, initial concrete placing temperatures of 15 °C, 20 °C, and 25 °C, along with corresponding peak temperatures of 45 °C, 50 °C, and 55 °C, were used to simulate the heat of hydration process. Seasonal temperature variations of ±10 °C, ±15 °C, and ±20 °C after concreting were applied to simulate environmental temperature changes throughout the year, aiming to assess the structural response to thermal expansion and contraction. It should be noted that the seasonal temperature rises and drops refer to temperature differences, which were derived from long-term on-site environmental monitoring conducted during the early design phase of the project. Single-, double-, and triple-pool full water conditions were simulated to evaluate the structural response under hydrostatic pressure, corresponding to the staged water-filling scenarios during testing and service phases.

3. Hydration Temperature Effects

3.1. Verification of the FEM Model

To assess the early-age mechanical behavior of the ultra-long pool structure under thermal effects, DTS and DSS technologies are used to observe the temperature and strain during the hydration. Figure 8 shows the monitoring webpage. Using the installed DTS and DSS, the hydration temperature and the corresponding strain are observed.
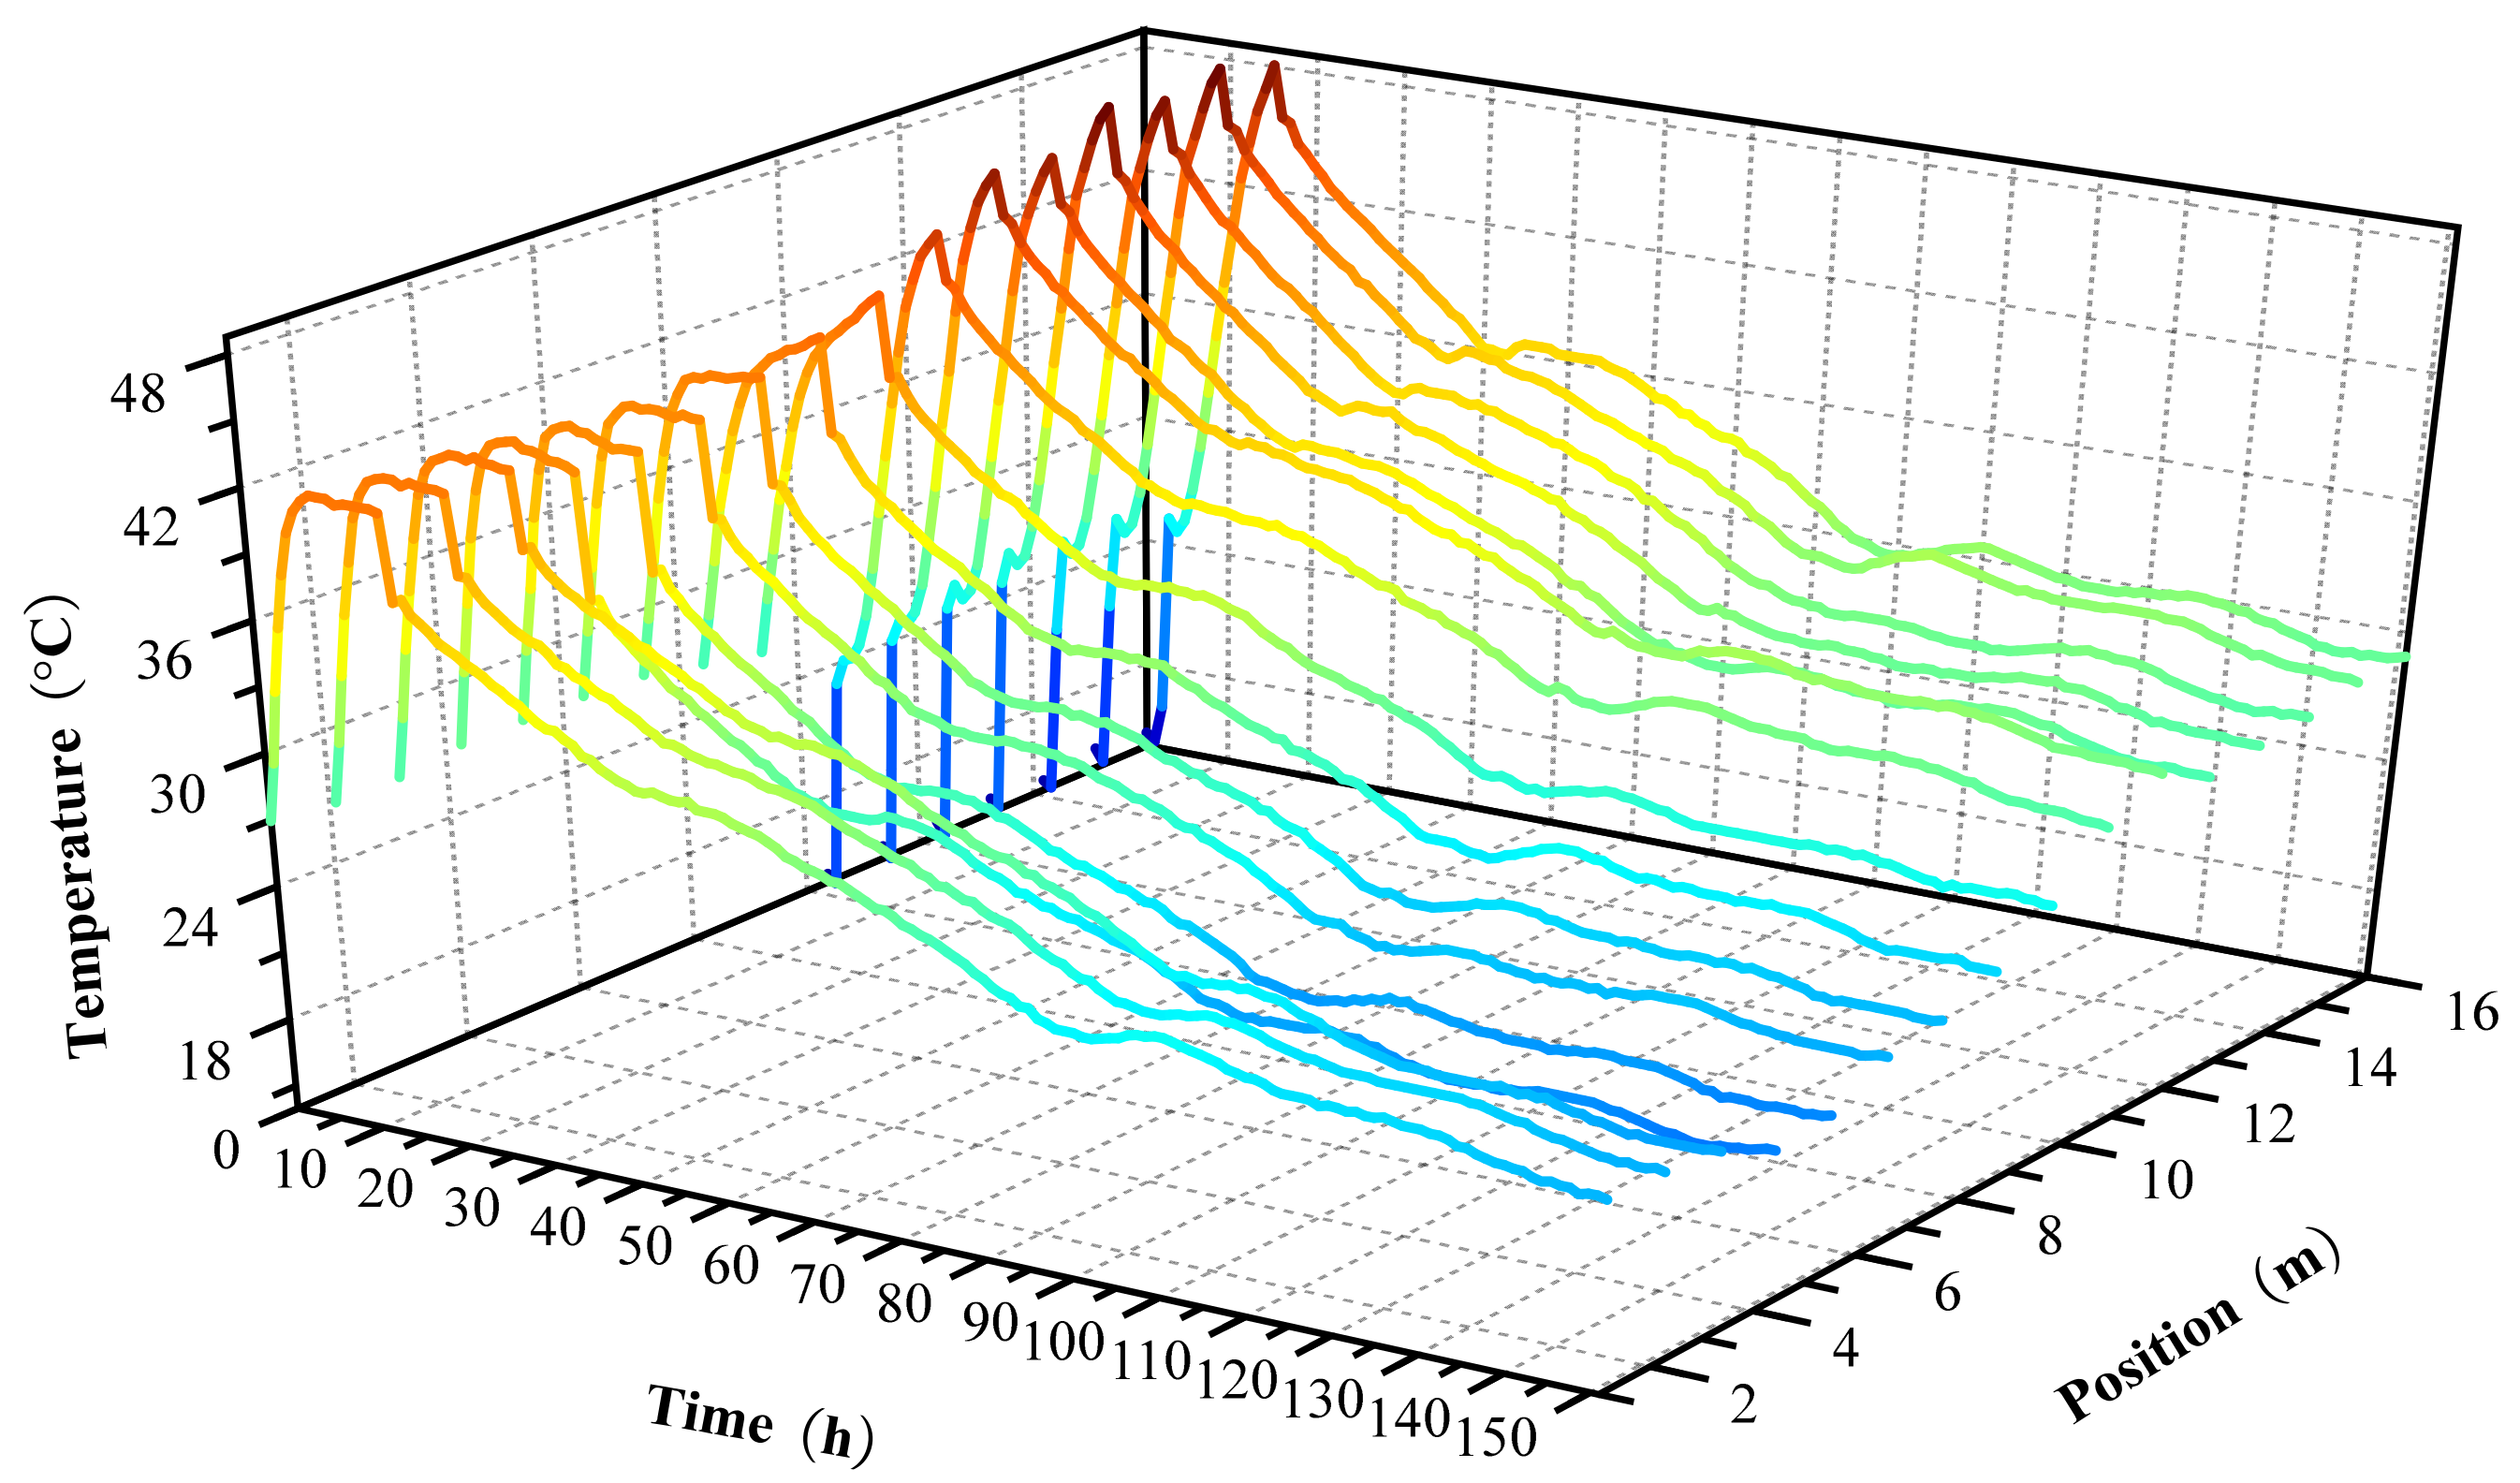
Figure 9 depicts the hydration heat monitoring graph at various points after concrete pouring. As observed from the graph, the hydration heat reached its peak approximately 20 h post-pouring. However, the peak values varied across different locations, ranging between 42 °C and 48 °C. This discrepancy is primarily attributed to the varying ambient temperatures during the pouring process at each location. Additionally, after about 150 h, the hydration heat tended to stabilize.
Taking the six points in Figure 3 as examples, the measured temperatures were input into the finite element model for analysis. These locations were chosen primarily based on the actual construction sequence. Given the total length of the pool structure (105.6 m), the base slab was divided into n multiple segments by the post-cast strip shown in Figure 2. The regions where P1–P6 are located correspond to the first casting zones, which were instrumented early and thus provided the most complete and continuous monitoring data throughout the hydration and early-age periods. The numerical analysis results obtained were compared with the experimental test results, as shown in Figure 10.
From Figure 10, several observations can be made: (1) Overall, the monitored strain curves exhibit a consistent tendency with the simulated strain curves, initially increasing with temperature rise and subsequently decreasing as the temperature falls. (2) In terms of peak occurrence time, the monitored and simulated times are nearly coincident, validating the effectiveness of the established model. (3) Regarding peak values, the simulated values are slightly lower than the monitored values, likely due to the initial stress imparted to the optical fiber during installation. However, the discrepancy between the simulated and monitored peak values is within 9%. (4) For different monitoring points, the thermal strain at the edge locations is slightly higher than that at the central positions. This can be attributed to the greater thermal expansion constraints at the edges, leading to increased thermal stress and strain compared to the more freely expanding central region. In summary, through the aforementioned comparisons, it can be concluded that the established finite element model accurately reflects the actual conditions with a high degree of precision.
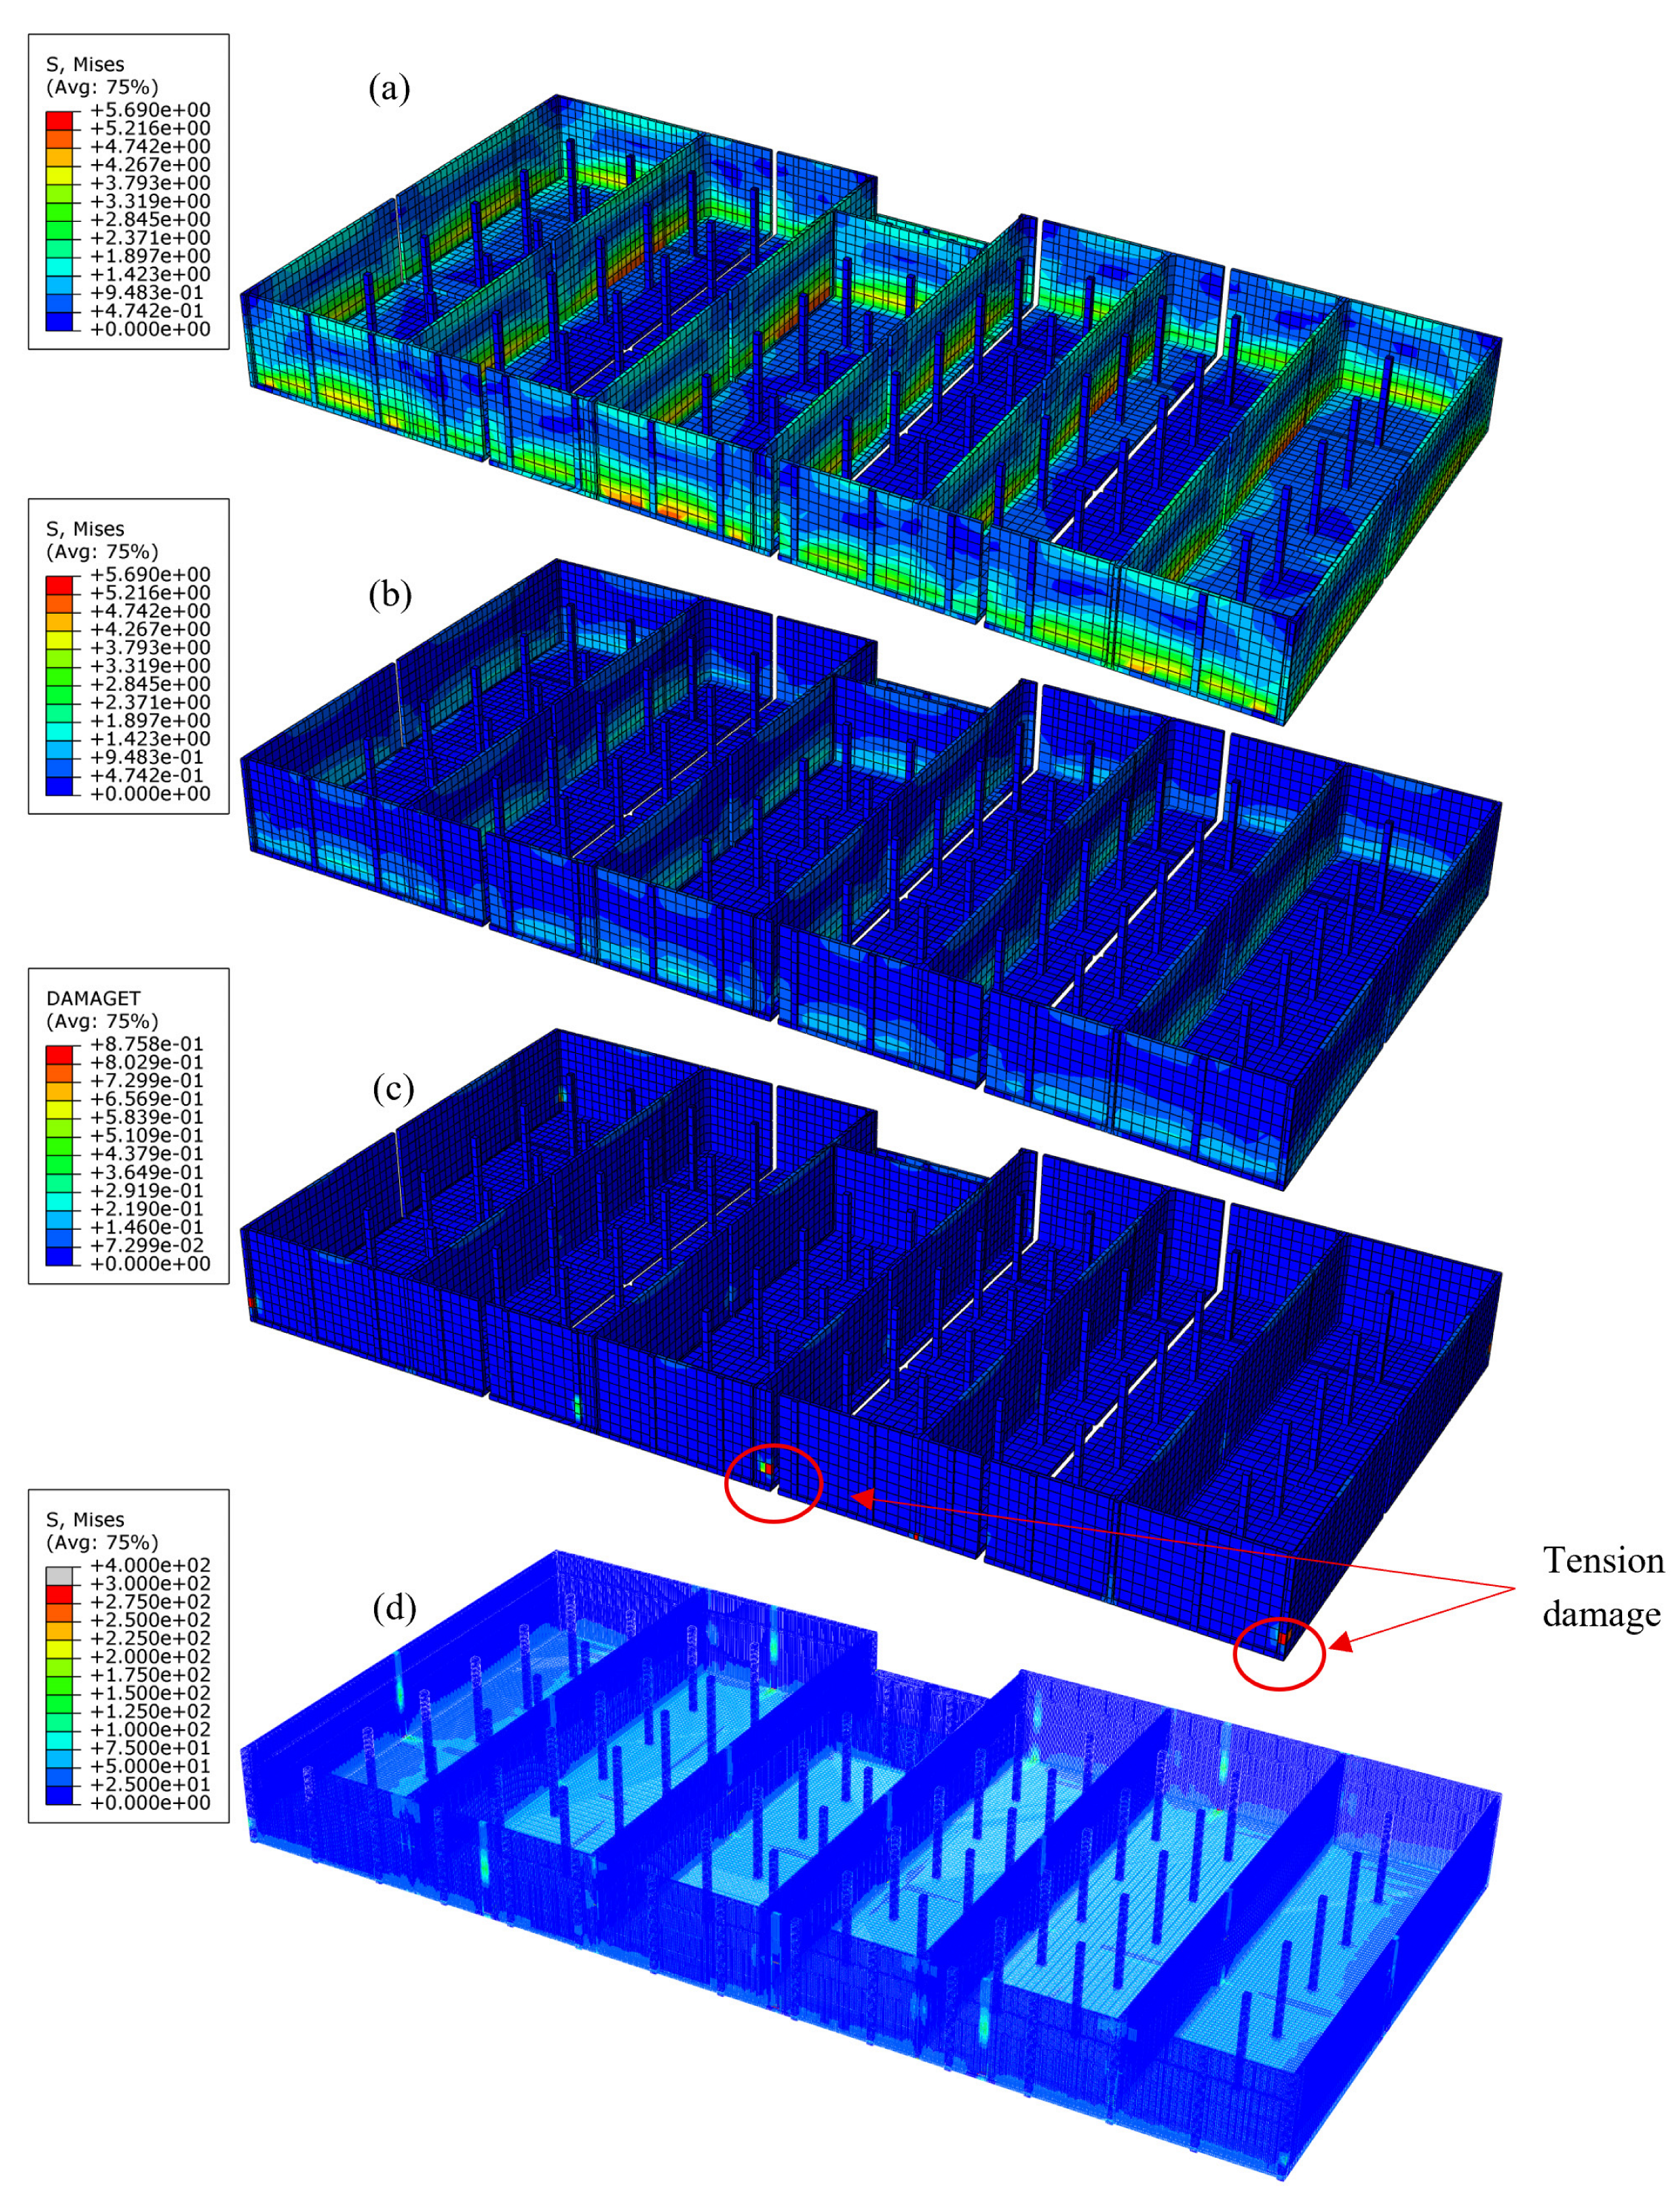
Based on the measured data shown in Figure 9, the temperature progress curves for various cases are generated, as shown in Figure 11. Notice that the baseline (measured) results were obtained from the distributed fiber optic sensors as described in Section 2.2. The various temperature progress curves correspond to different types of cement. This allowed us to evaluate how varying heat generation profiles might affect the structural thermal response of the pool during early hydration. Each case is identified by a three-part label in the form X–Y–Z, where X is the initial casting temperature (°C), Y is the peak hydration temperature (°C), and Z is the ambient temperature (°C). The corresponding von Mises stress responses and tensile damage assessments under these conditions are summarized in Table 7. In this study, the damage variable d was used as the main criterion to assess the cracking level of concrete. When the damage factor d falls within the range of 0.75 to 0.9, it was classified as minor damage.

3.2. Effect of Initial Casting Temperature

The initial temperature at which concrete is cast has a pronounced impact on the development of thermal stress during the hydration process. A lower casting temperature typically results in a higher thermal gradient between the inner core and the surface of the concrete element, especially when hydration heat rises rapidly after placement. This leads to more significant restraint and higher internal tensile stress. In Table 7, when the initial casting temperature is 15 °C and the peak hydration temperature reaches 55 °C, the peak Mises stress reaches 5.68 MPa, indicating a considerable risk of thermal cracking. Conversely, when the casting temperature increases to 25 °C under the same peak temperature condition, the corresponding peak stress drops to 4.26 MPa. This demonstrates that increasing the initial casting temperature can effectively moderate thermal gradients and mitigate the early-age tensile stress buildup in this ultra-long pool structure.

3.3. Effect of Peak Hydration Temperature

The peak temperature generated during hydration is directly related to the rate of cementitious reaction and plays a key role in stress evolution. Higher peak temperatures result in greater thermal expansion of the concrete core, and when constrained by surrounding materials, this can generate substantial internal tensile stresses. As shown in Table 7, at a constant initial casting temperature of 15 °C, increasing the peak hydration temperature from 45 °C to 55 °C resulted in a progressive increase in Mises stress from 4.26 MPa to 5.68 MPa. This upward tendency underscores the importance of controlling the peak hydration temperature through appropriate mix design, use of supplementary cementitious materials, or thermal management techniques.

3.4. Effect of Ambient Temperature

After reaching the peak of the hydration reaction, the concrete gradually cools to the ambient temperature. The extent of this cooling phase, represented by the ambient temperature, is critical for determining the residual stress level. Greater temperature drops from peak to stabilization lead to higher thermal contraction, and if restraint is present, residual tensile stresses will accumulate. As summarized in Table 7, residual Mises stresses remain high in cases with low ambient temperatures. For example, in the 25-55-15 scenario, the stress finally reaches 3.88 MPa. In contrast, when the stabilized temperature is higher (e.g., 25 °C), the residual stress is significantly reduced. This demonstrates the need to manage post-hydration cooling, such as through thermal insulation, to minimize long-term tensile stress buildup.

3.5. Tensile Damage Assessment and Cracking Risk

Among all test cases in Table 7, the cases of 15-55-15 and 20-60-20 showed tensile damage, classified as “minor damage.” This case combined a low casting temperature, a high peak hydration temperature, and a low stabilized temperature. Such an unfavorable combination led to the highest peak stress and significant residual tensile stress, as shown in Figure 12c. The emergence of tensile damage under this condition confirms the reliability of the simulation in identifying cracking risks. All other configurations remained below the cracking threshold, reinforcing the conclusion that the magnitude of both thermal increases and subsequent cooling must be jointly controlled to ensure structural safety.

3.6. Stress Distribution Along the Longitudinal Pool Wall

Given the ultra-long geometry of the pool (over 100 m), understanding the distribution of thermal effects along its full length is essential. To capture this behavior, longitudinal Mises stress data along the pool wall were extracted for the typical simulation cases in Table 7, as shown in Figure 13. Additionally, the case of 15-55-15 is shown in Figure 14. Notice that these two figures show Mises stress corresponding to the peak hydration temperature of Figure 11.
It can be observed in Figure 13 that the entire pool structure is primarily subjected to compressive forces. This global compressive state arises mainly due to the thermal expansion of the concrete during the early stages of hydration. As the internal temperature increases significantly due to the exothermic hydration reaction, the concrete tends to expand. However, because of the high degree of restraint provided by the surrounding structural elements and the absence of expansion joints, this expansion is restricted, leading to the development of internal compressive stress. Additionally, the boundary conditions and continuity of the pool walls further confine the expansion, promoting a uniform compressive field across large regions of the structure.
In Figure 14, the red dashed lines indicate the locations of the columns or transverse walls. The stress profiles shown in Figure 14 reveal that even under seemingly uniform thermal loading, nonlinear stress distributions develop along the length of the wall due to differential restraint conditions, localized stiffness changes, and boundary effects. Under high-risk conditions (e.g., the 15-55-15 case), the stress distribution shows pronounced peaks near structural discontinuities, particularly at the intersections of longitudinal and transverse walls and at wall–column junctions. In contrast, under conditions involving higher casting temperatures or more moderate cooling gradients, the stress profile is notably smoother, with more gradual transitions and significantly lower overall stress amplitudes.
This spatial analysis provides valuable insight into stress localization mechanisms and highlights the importance of full-length monitoring in long concrete structures. This further supports the need for targeted reinforcement detailing and sensor deployment strategies along the pool perimeter, especially in early-age and cold-weather concreting scenarios.

3.7. Recommendations for Crack Control

Based on the above findings, several recommendations are proposed to enhance the early-age crack resistance of ultra-long concrete pool structures. Casting temperatures below 15 °C should be avoided when possible. The mix design should incorporate low-heat cementitious materials to suppress peak hydration temperatures. Furthermore, construction scheduling should consider environmental conditions to avoid rapid cooling after peak temperatures, particularly in winter or low-humidity climates. In addition to these measures, the use of post-cast strips has proven to be an effective method for mitigating thermal stress concentration.
In the actual project, it was difficult to artificially control the concrete casting temperature through preheating or insulation. Therefore, practical measures were adopted, including the use of low-heat cement concrete to reduce hydration heat and the implementation of post-cast (construction) joints to relieve thermal stress. These approaches provide a cost-effective balance between construction feasibility and crack mitigation.

4. Influence of Ambient Temperature Variations

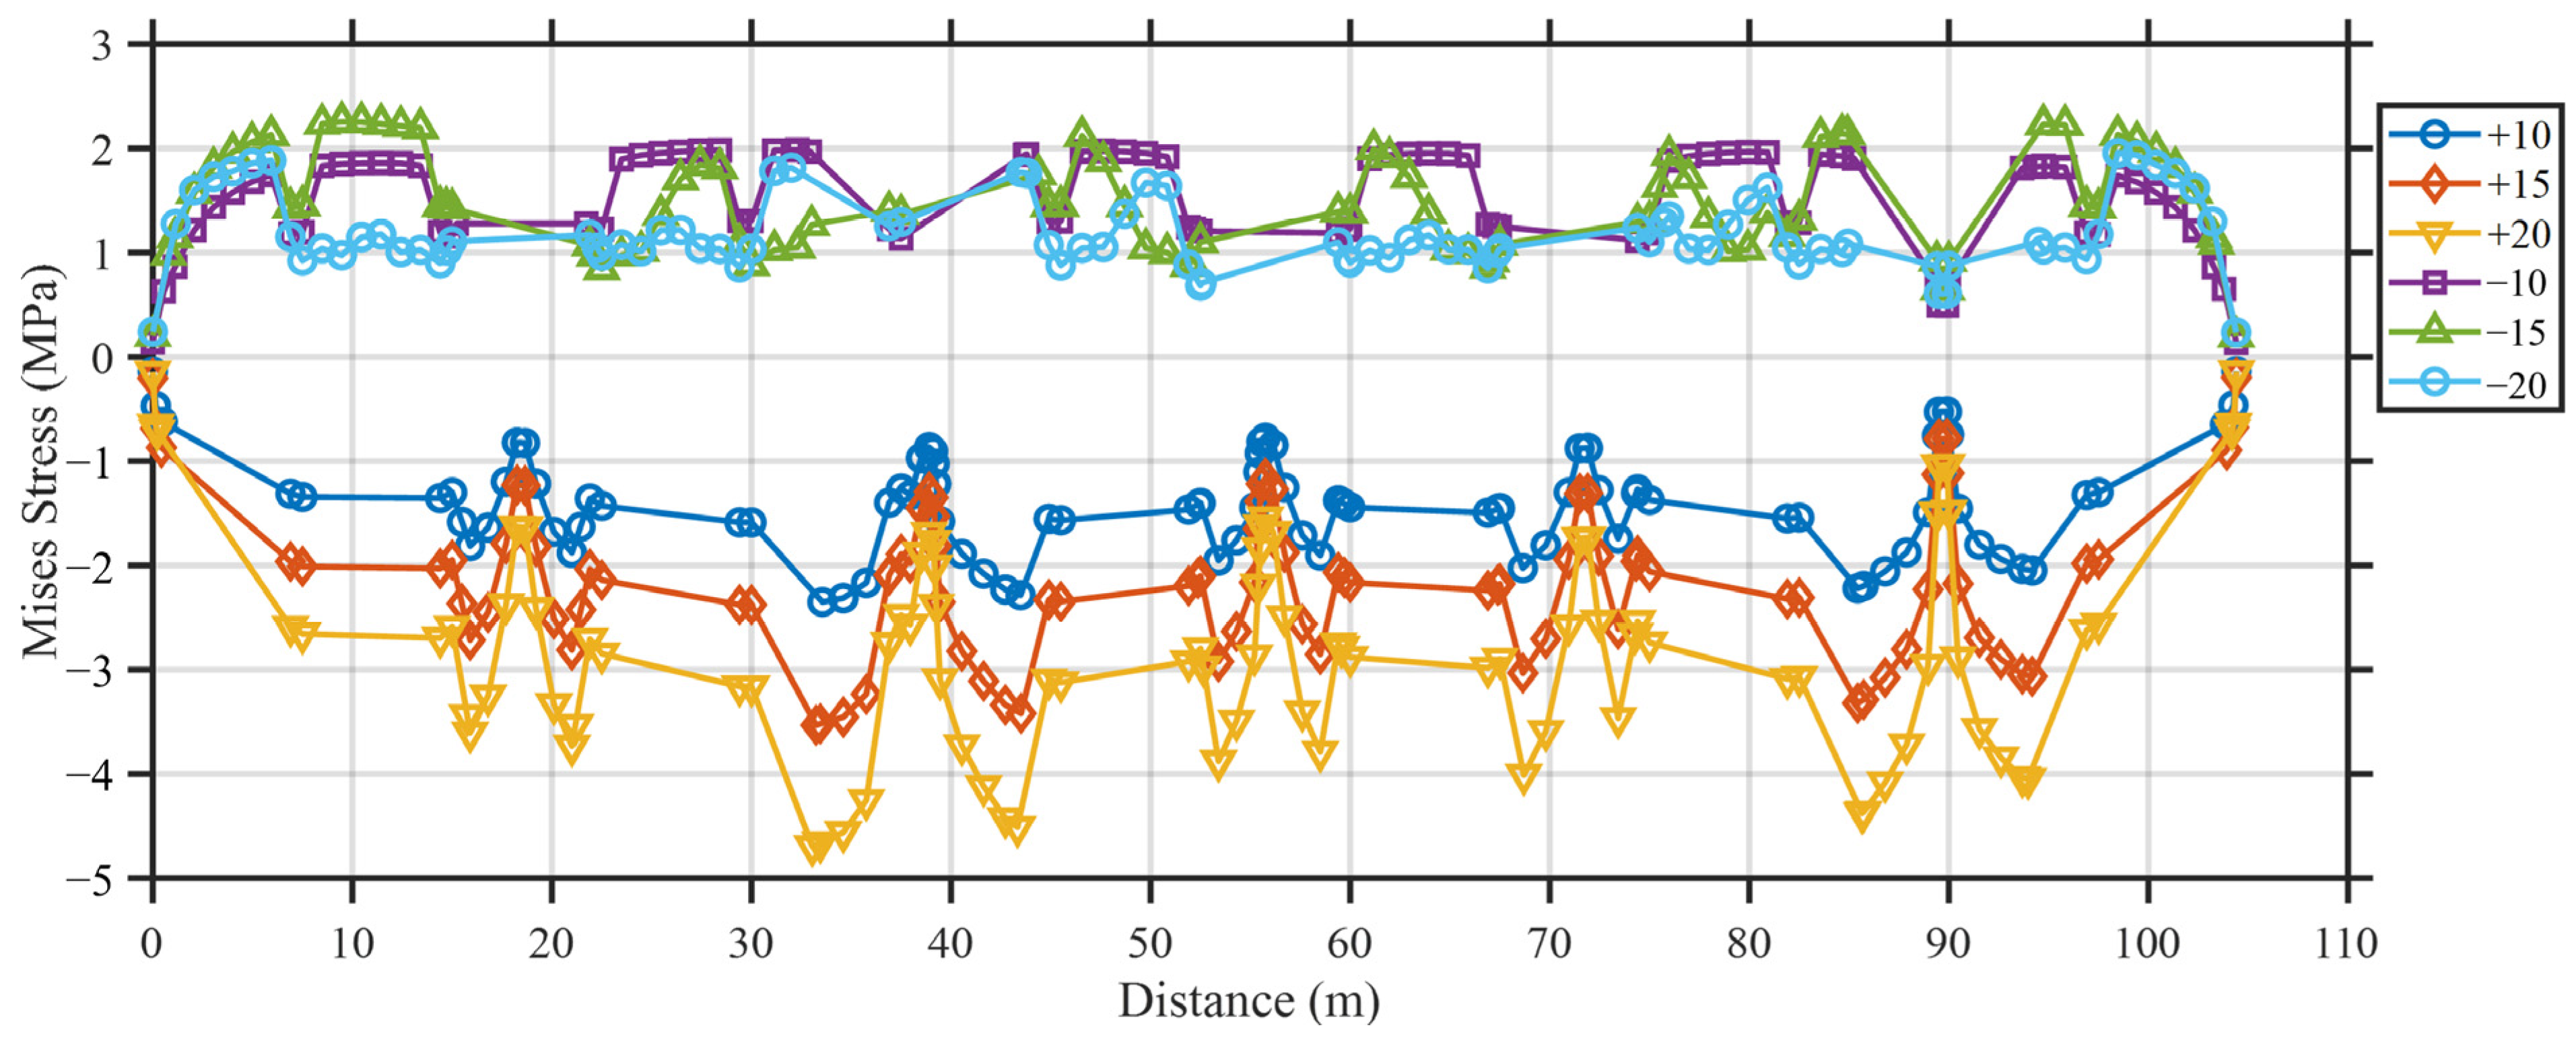
This section investigates the influence of seasonal ambient temperature fluctuations on the pool structure by applying uniform temperature changes of +10 °C, +15 °C, and +20 °C, (representing summer heating), as well as −10 °C, −15 °C, and −20 °C (representing winter cooling) across the entire structure. The stress along the longitudinal reference line (see Figure 14) under the temperature increases and decreases is shown in Figure 15. Despite the differences between heating and cooling scenarios, a common finding observed across all cases is the non-uniform stress distribution along the longitudinal direction of the pool wall. In particular, noticeable stress fluctuations consistently appear near structural discontinuities, such as the intersections between transverse walls and columns. These regions act as localized restraint points, amplifying thermal stress concentrations regardless of the direction of temperature change.
Table 8 presents the statistical data from Figure 15, including the mean, maximum, and minimum stresses, as well as the standard deviation.

4.1. Stress Response Under Heating Scenarios

For heating scenarios (+10 °C to +20 °C), the structure consistently exhibits compressive stress, increasing in magnitude with higher temperature. Specifically, the mean stress rises in compressive intensity from −1.39 MPa at +10 °C to −2.72 MPa at +20 °C. The standard deviation also increases from 0.49 to 1.06 MPa, indicating that higher temperature rises lead to greater stress heterogeneity, likely due to differential stiffness and varying restraint conditions across the length of the structure. The most severe compressive response (−4.69 MPa) occurs under the +20 °C case, suggesting a potential risk for localized overstress under extreme heat exposure.

4.2. Stress Response Under Cooling Scenarios

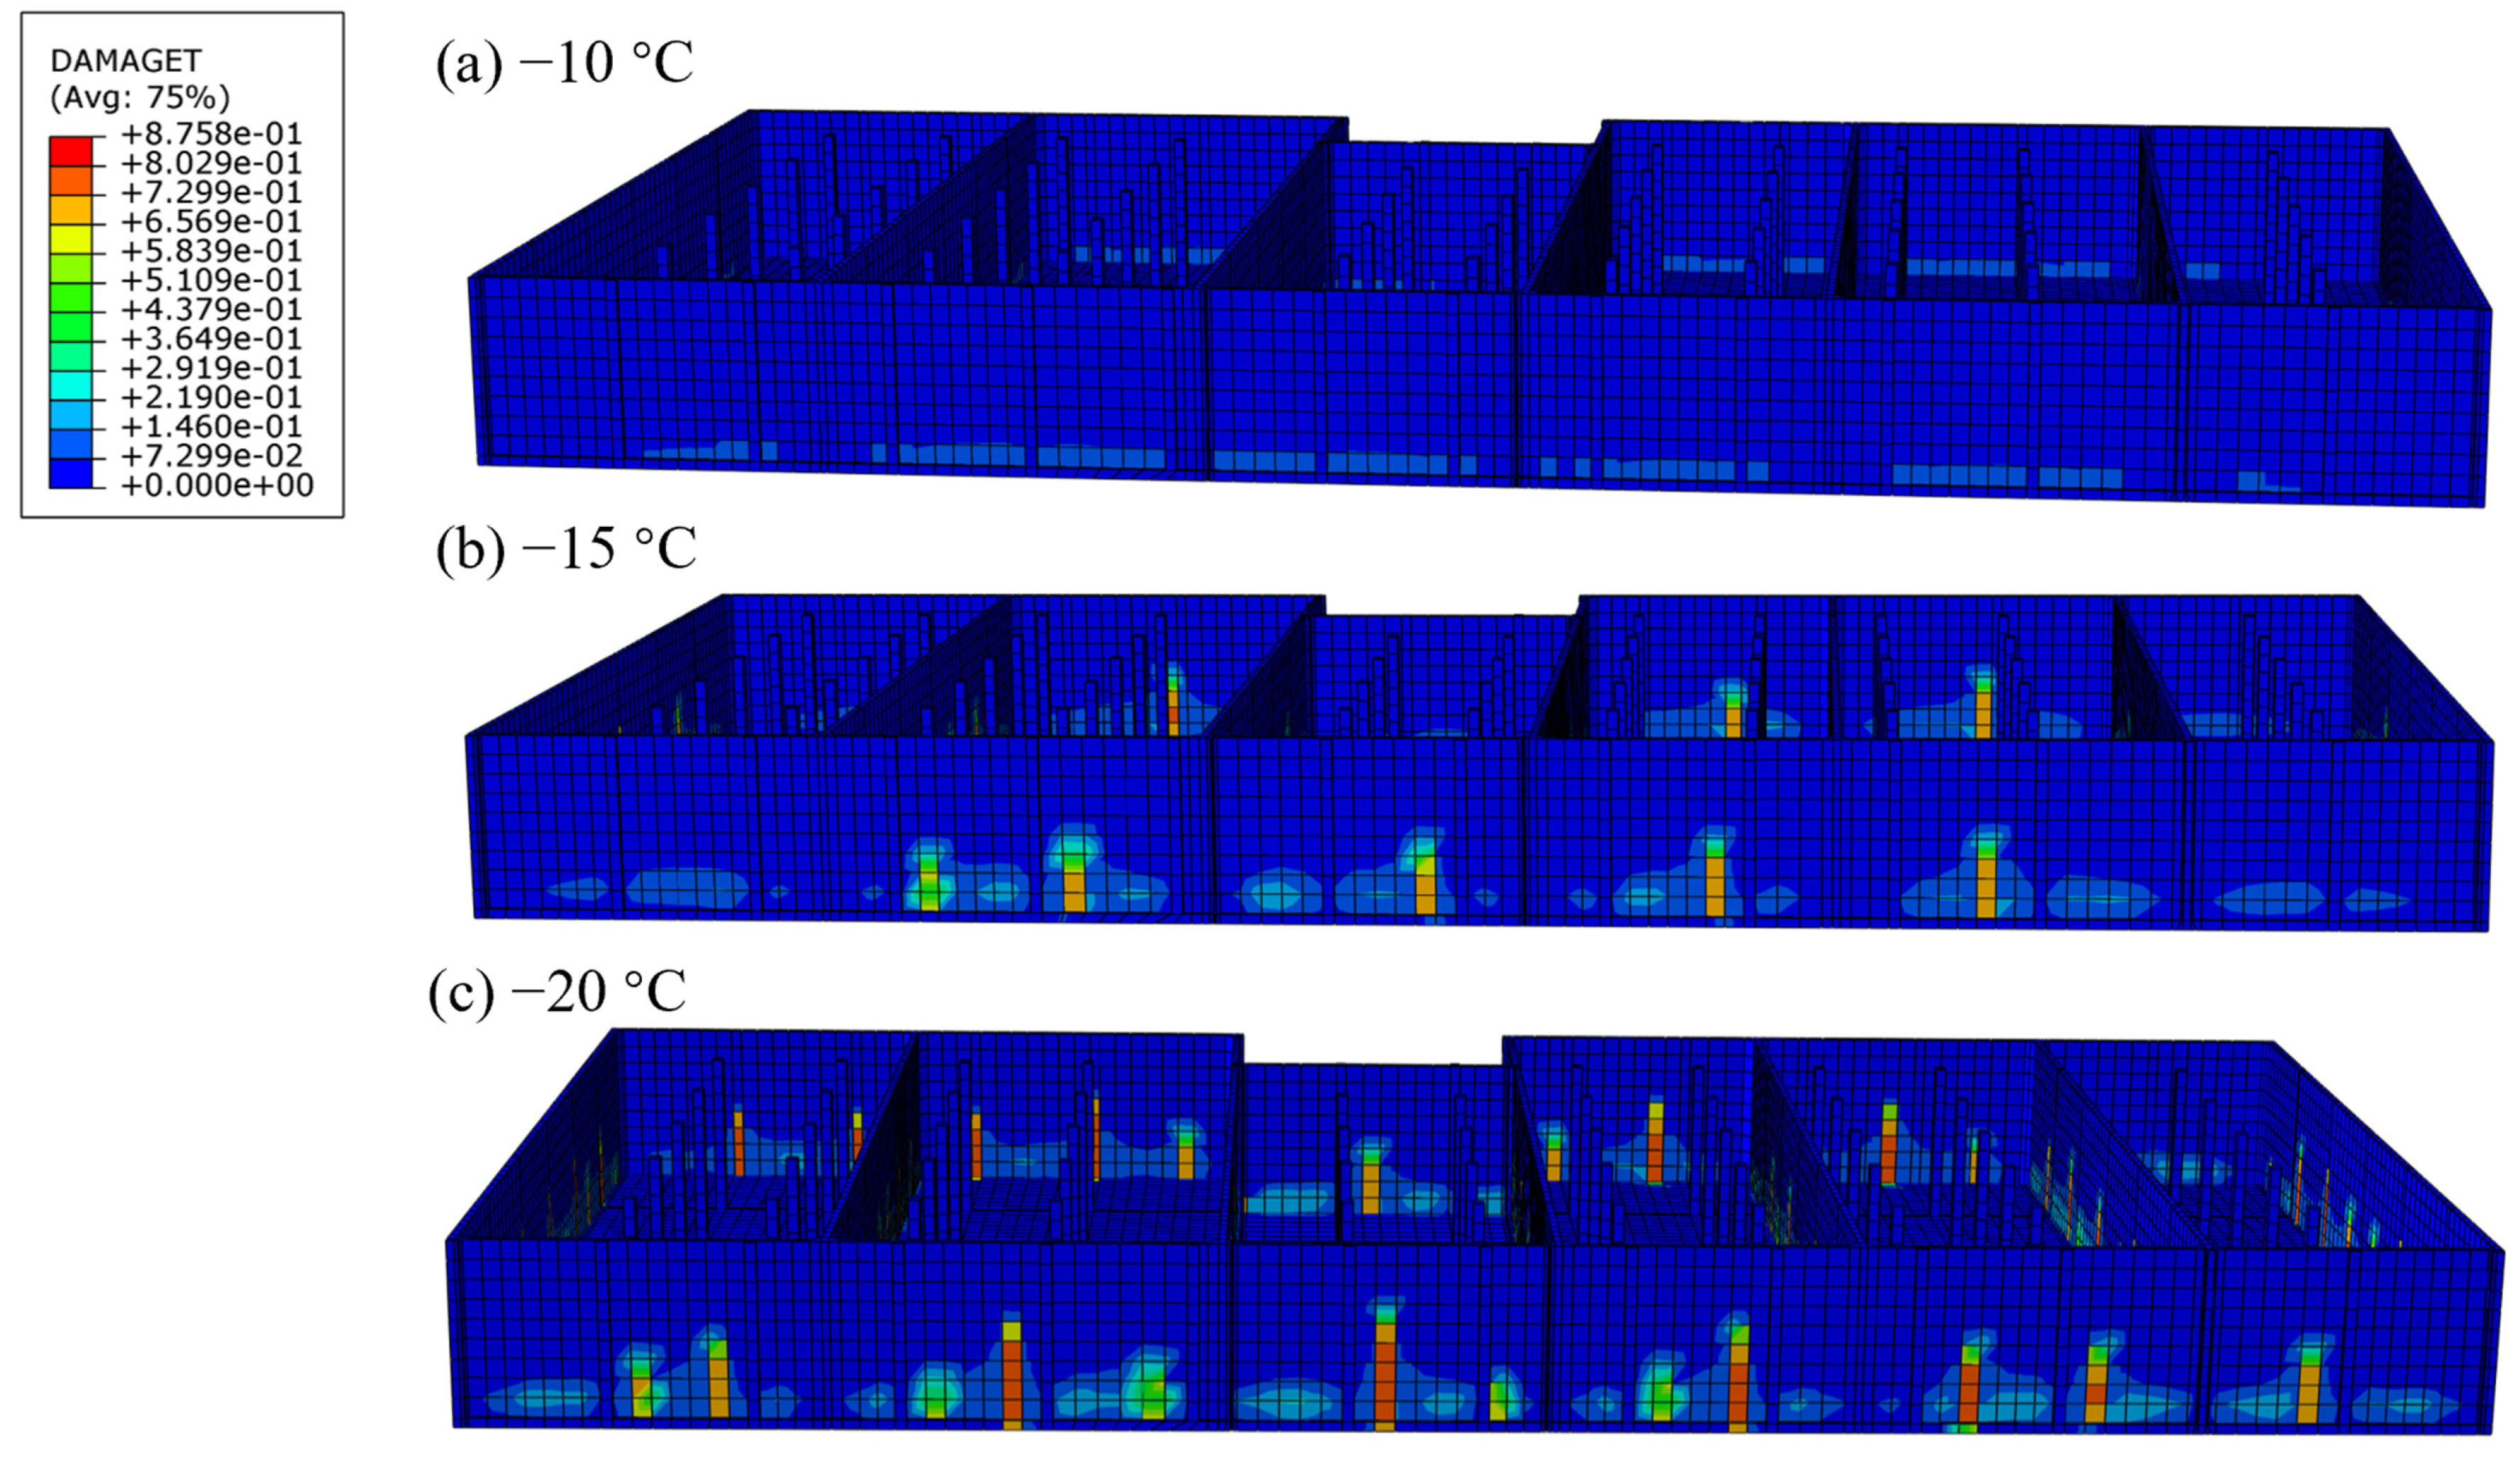
The structure undergoes tensile stress due to thermal contraction. The mean tensile stress remains relatively consistent across the three cases, ranging from +1.18 MPa (−20 °C) to +1.54 MPa (−10 °C). Interestingly, the maximum tensile stress remains high (near +2.0 MPa), but the standard deviation slightly decreases with larger cooling magnitudes—from 0.50 at −15 °C to 0.35 at −20 °C. This suggests that although the tensile demand increases, larger cooling drops lead to a more uniform stress distribution across the pool wall, likely because the restrained system contracts more synchronously. It is worth noting that the comparatively lower values at −20 °C and −15 °C are due to the onset of concrete cracking at these temperatures (Figure 16), which locally relieves stress and thereby reduces the apparent tensile stress concentrations in certain regions.

4.3. Heating Scenarios Versus Cooling Scenarios

When comparing heating versus cooling responses, a clear asymmetry is evident. Heating generates greater absolute stress magnitudes and significantly higher variability, while cooling tends to produce less intense but more uniformly distributed tensile stress. For example, the mean stress at +20 °C is −2.72 MPa (compressive), compared to +1.18 MPa (tensile) at −20 °C. This difference may stem from the nonlinear thermal expansion behavior of concrete. Additionally, compressive stress concentrations under heating may not immediately cause cracking but can contribute to delayed damage mechanisms, such as restrained creep or internal microcracking.
Overall, the results indicate that, despite their smaller magnitude, cooling-induced tensile stress pose a greater risk of early-age cracking. Under cooling conditions of −15 °C and −20 °C, although the average tensile stress remain moderate (approximately +1.50 to +1.18 MPa), they are accompanied by localized stress concentrations that may exceed the early-age tensile strength of concrete.

4.4. Concrete Damage Observation

Figure 16 provides clear visual confirmation of early-age tensile damage, with localized cracking observed under cooling conditions of 15 °C and 20 °C.
In these scenarios, the calculated tensile stresses exceeded the concrete’s early-age tensile strength threshold, leading to crack initiation. Specifically, tensile stresses at the damaged locations reached or surpassed 2.0–2.5 MPa, which approximates or exceeds the early-age tensile strength of C40 concrete. This observation aligns with the previous finding that, although the average tensile stress remains relatively stable, the occurrence of cracking at −15 °C and −20 °C results in local stress relief and consequently lower measured tensile stresses in those areas. These results highlight that thermal contraction induced by rapid environmental cooling poses a significant cracking risk in ultra-long pool walls.

5. Water Loading

In addition to thermal effects, the structural performance is significantly influenced by hydrostatic loading. This section presents a comprehensive evaluation of load-induced effects based on various water loading conditions, as outlined in Table 6. The following aspects are examined:

5.1. Structural Response Under Single Sub-Pool Loading

Table 9 presents a comparison of the maximum principal stress, maximum displacement, and tensile damage status for six ultra-long pool structure cases under single sub-pool loading conditions. The maximum principal stress values range from 2.42 MPa to 2.54 MPa across all pool cases, indicating relatively consistent stress magnitudes. Pool 1 exhibits the highest maximum principal stress of 2.54 MPa, while pool 4 shows the lowest value at 2.42 MPa. This marginal variation suggests that although the pools experience different loading conditions, the resulting peak stress remains within a narrow band.
In terms of maximum displacement, pool 6 demonstrates the largest displacement at 59.91 mm, followed closely by pool 5 (55.65 mm) and pool 1 (55.51 mm). The lowest displacement is observed in pool 3, with a value of 51.59 mm. These results reflect slight variability in global deformation responses, which may be attributed to differences in structural stiffness, or joint configurations among the pools. Notably, all six pools are marked as having “minor damage” under the tensile damage assessment, indicating that tensile stress levels in each case exceeded the material’s tensile capacity, leading to crack initiation or propagation.
Figure 17 illustrates the distribution of maximum principal stress along the longitudinal direction of the pool bottom slab for six pool loading configurations. Overall, a consistent pattern is observed across all cases: the principal stress is unevenly distributed, with distinct stress peaks occurring at the locations of transverse walls, which correspond to the structural boundaries of each pool.
These stress peaks at the transverse walls indicate localized stress concentration resulting from geometric discontinuities and stiffness variations introduced by the wall constraints. In contrast, the mid-span regions of each sub-pool bottom exhibit relatively uniform and lower stress levels, forming a typical boundary-dominated stress distribution profile.

5.2. Structural Response Under Dual Sub-Pool Loading

Table 10 summarizes the maximum principal stress, maximum displacement, and corresponding tensile damage observations across various pool combinations under dual sub-pool loading conditions. The maximum principal stress values range from 2.45 MPa to 2.88 MPa, with the highest value observed in the pool 3+6 case (2.88 MPa). These results indicate a generally uniform stress distribution pattern, suggesting that slight geometric differences among the pool layouts have limited influence on the peak stress levels.
Regarding deformation, the maximum displacement values vary from 51.88 mm to 55.78 mm, reflecting a relatively consistent deformation response of the base slab. The largest displacement (55.78 mm) occurs in the pool 1+5 configuration, yet the variation across all cases remains within a narrow range (approximately 4 mm), which confirms that the structural stiffness is largely unaffected by different sub-pool loading pairing scenarios.
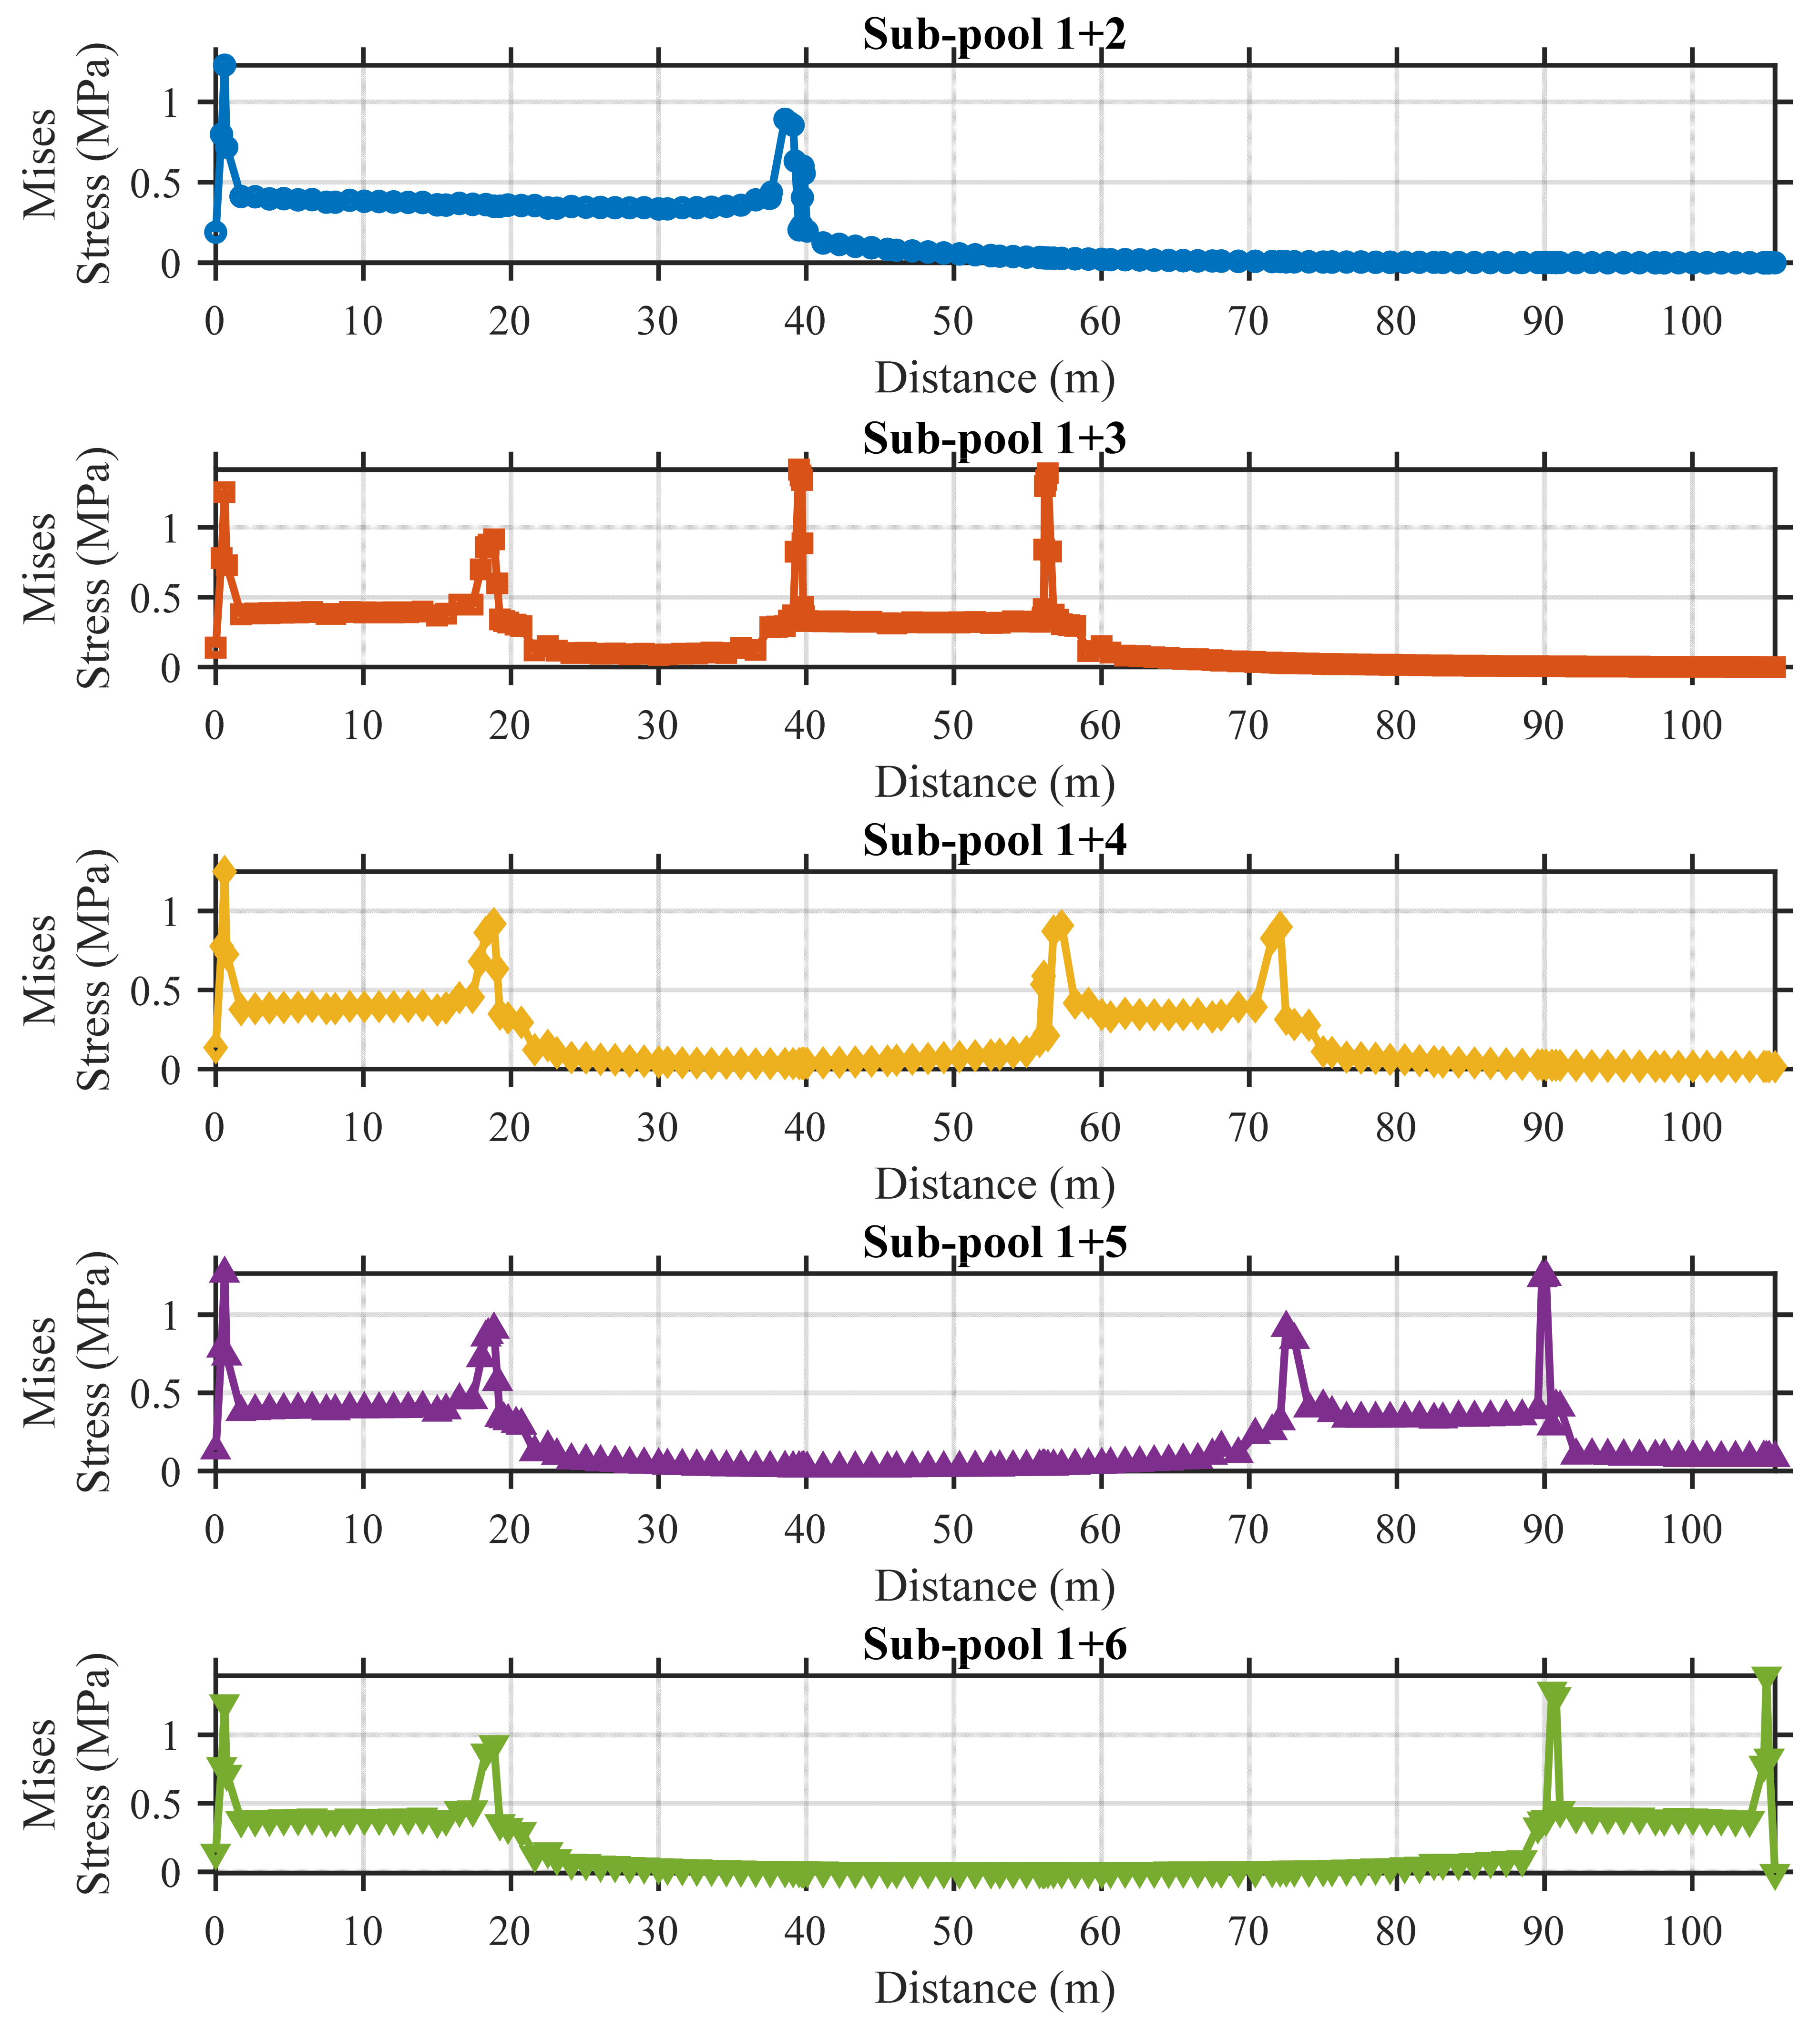
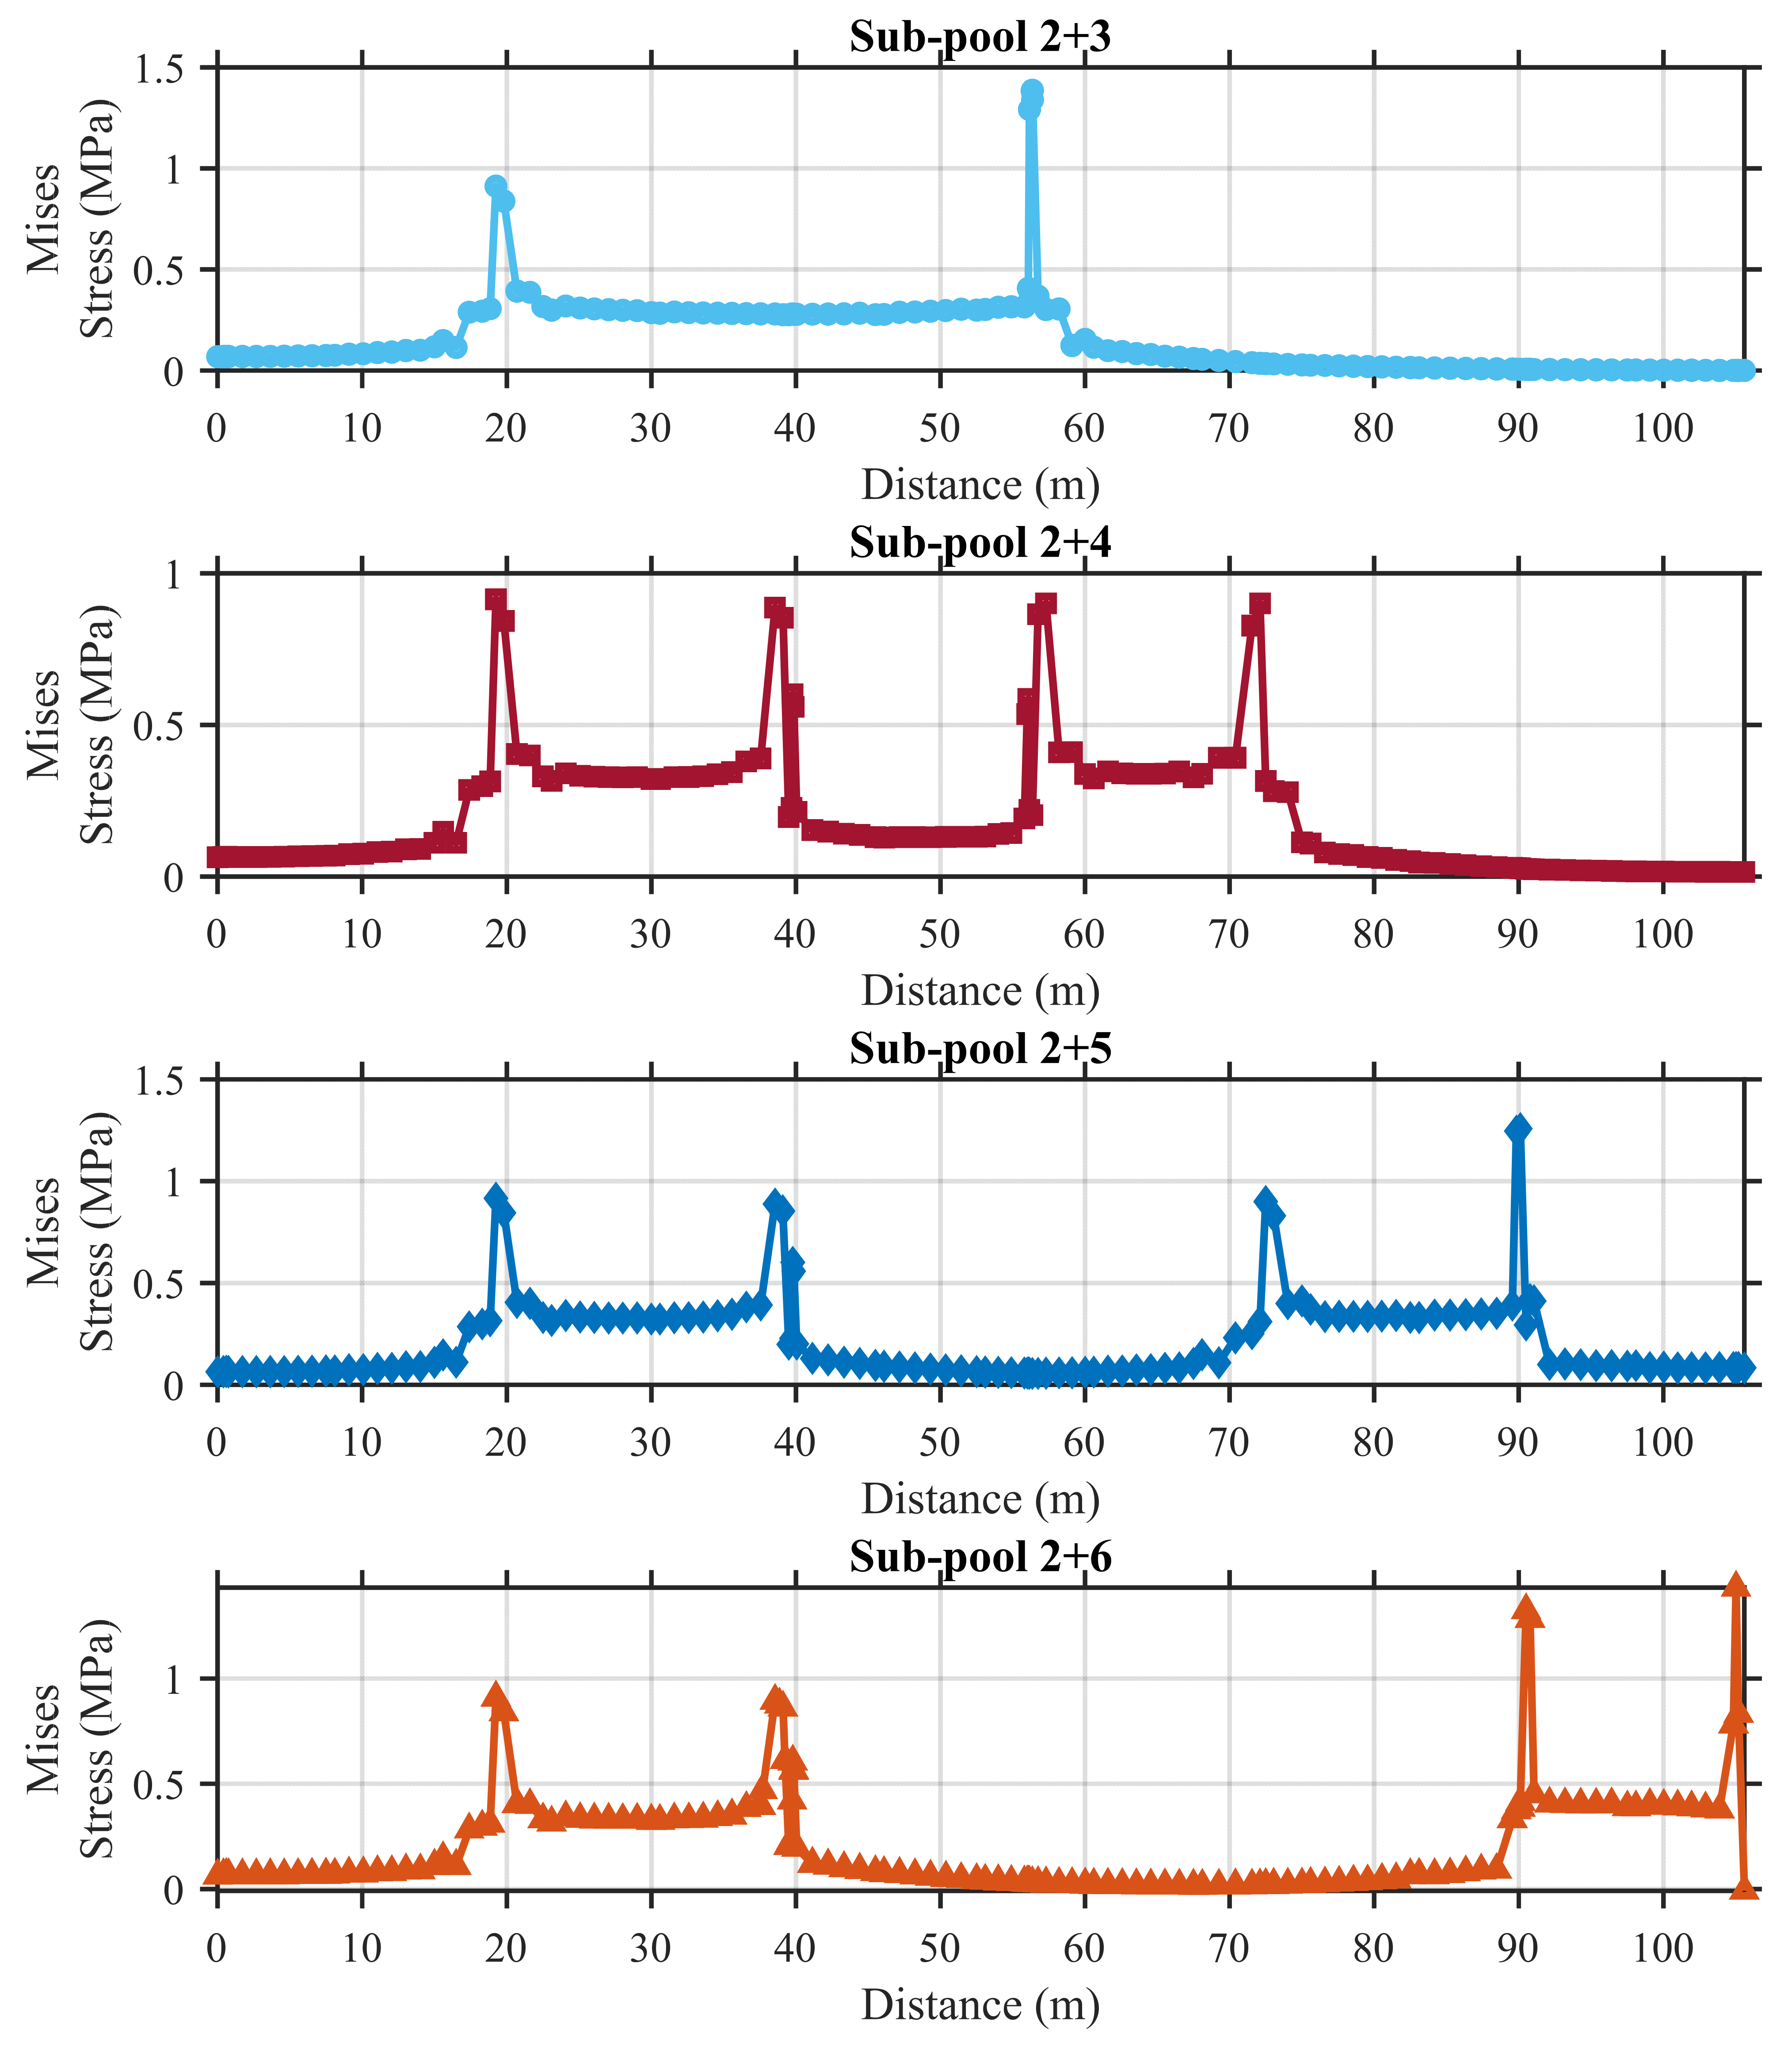
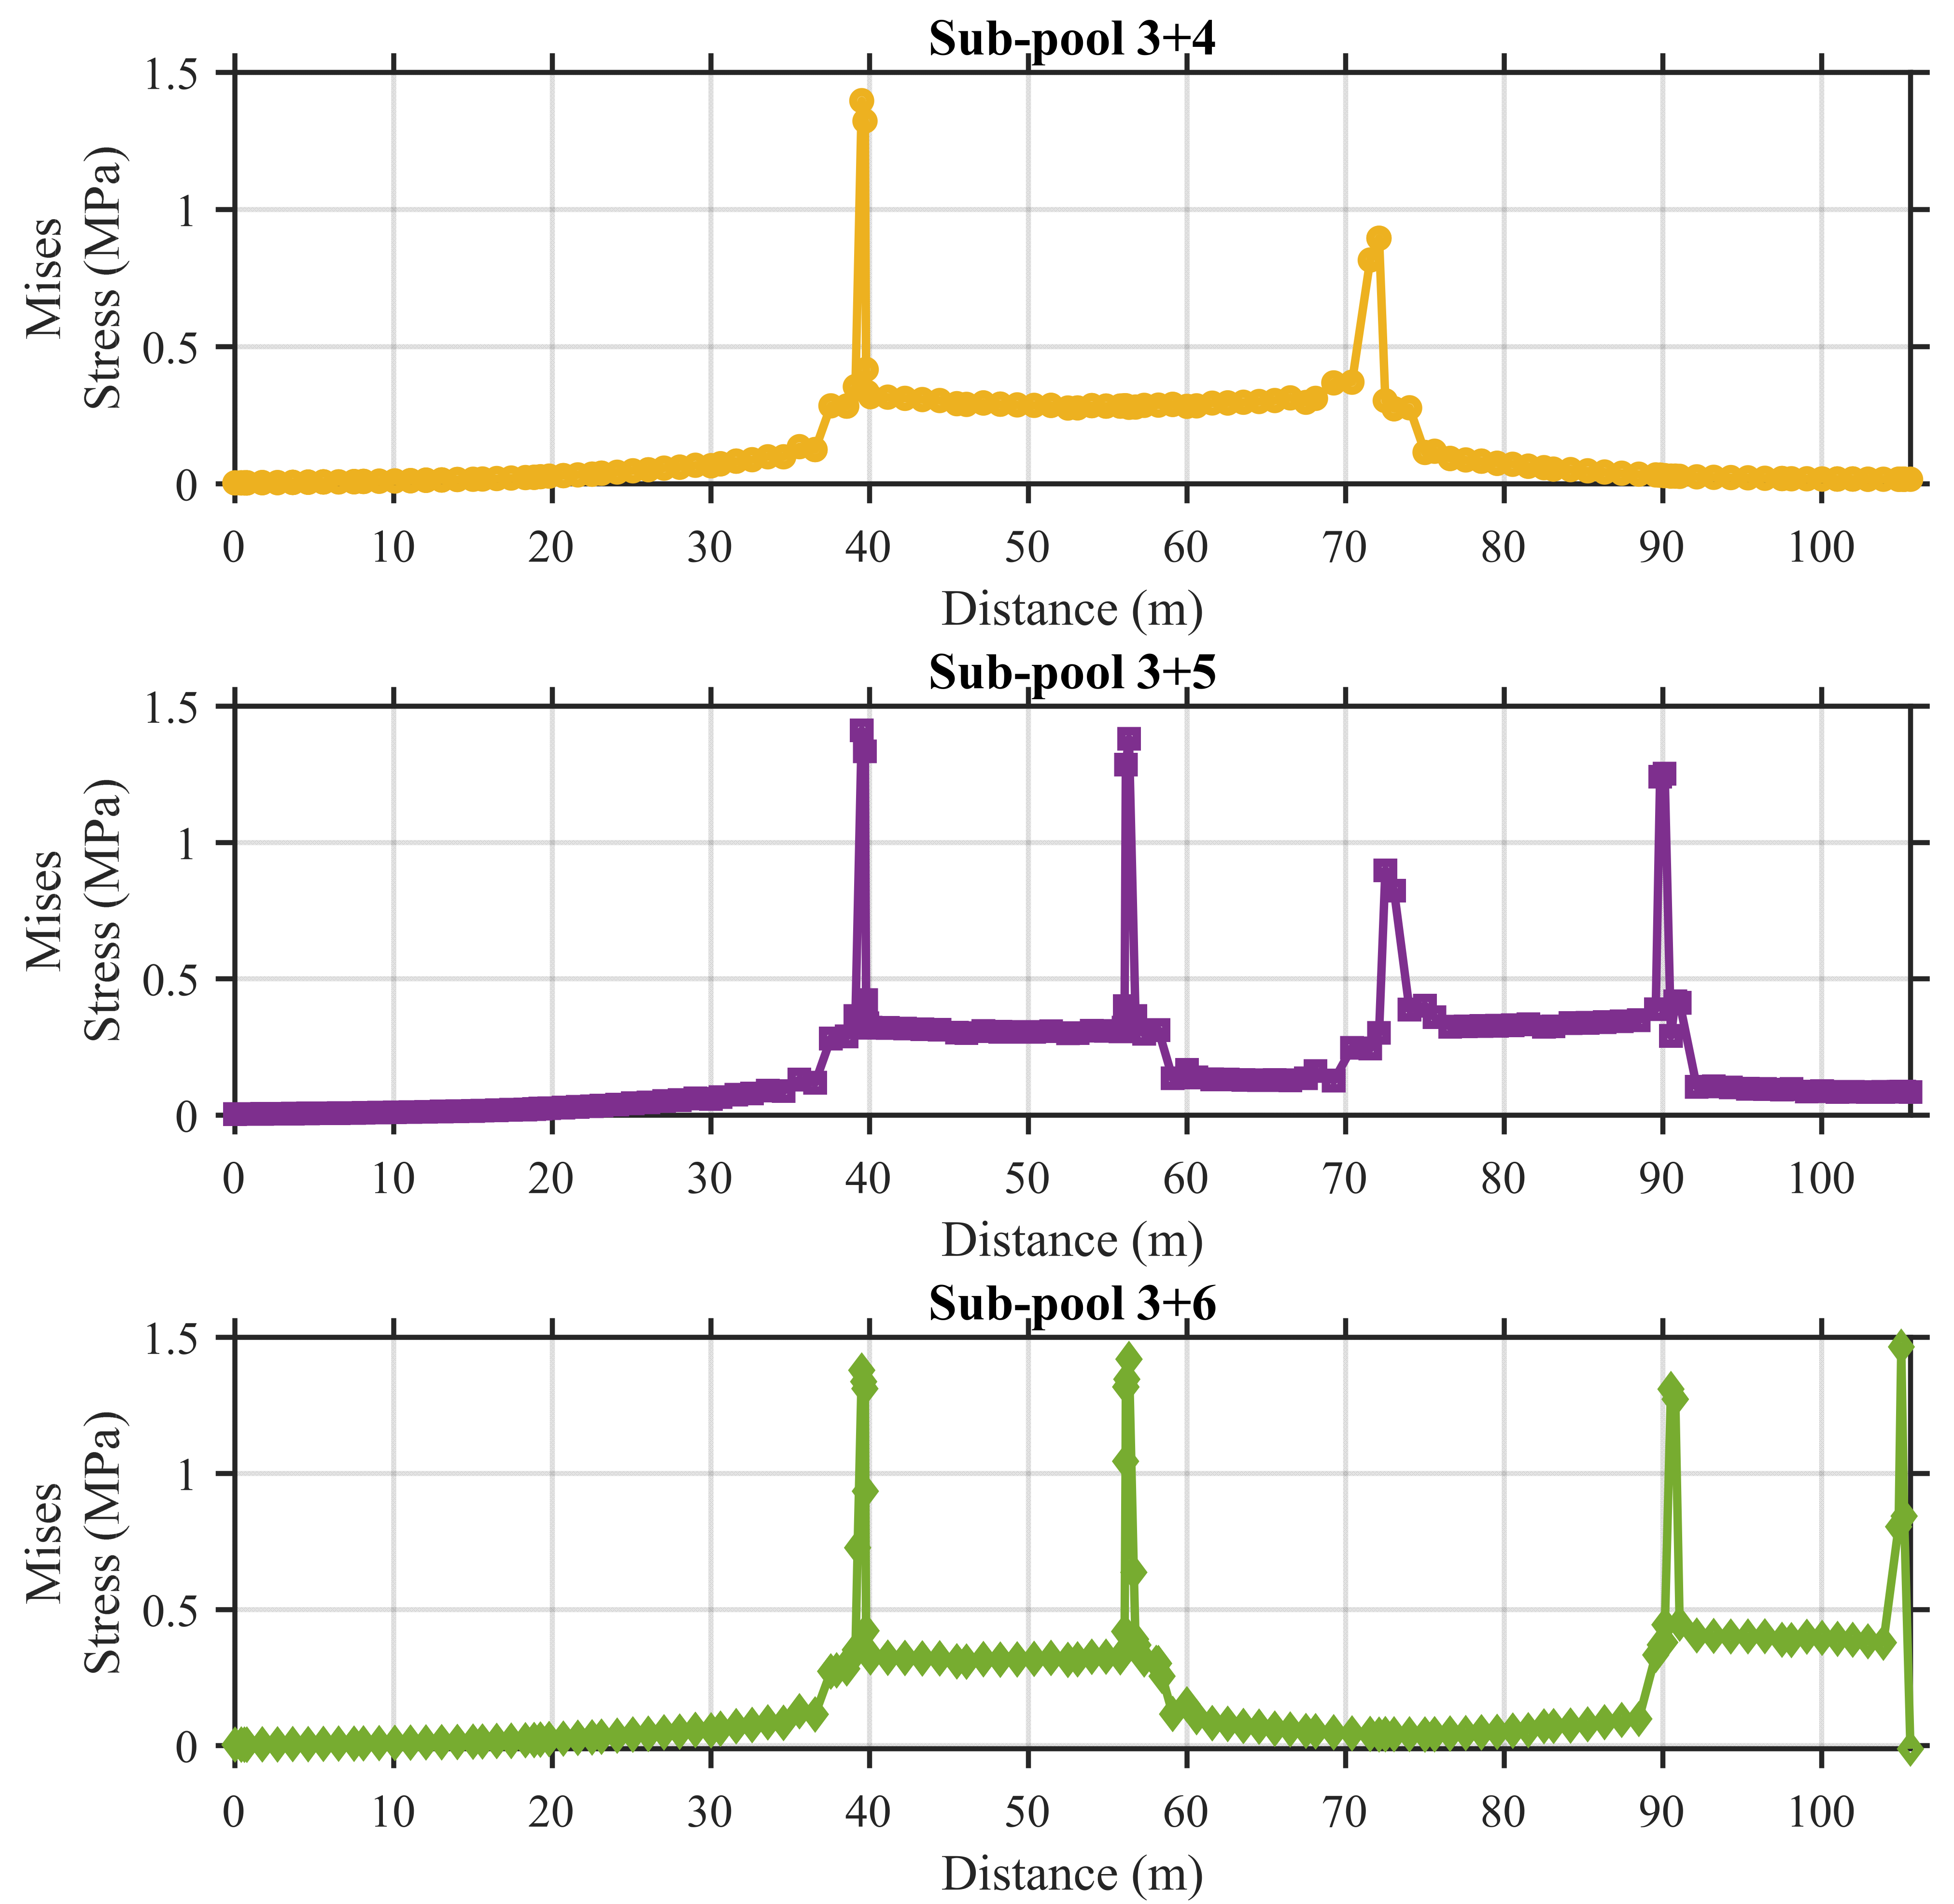
Figure 18, Figure 19, Figure 20 and Figure 21 illustrate the stress distribution along the longitudinal direction of the pool base slab under various sub-pool loading combination scenarios. It can clearly be observed that the stress in the base slab increases significantly beneath the loaded pools, forming distinct stress plateaus in the plots. The width of each stress plateau approximately corresponds to the width of the loaded sub-pool, indicating a direct relationship between the load application area and stress concentration.
Notably, pronounced stress fluctuations are observed on both sides of the plateaus, which can be attributed to the influence of the side walls and the abrupt change in boundary conditions. When two adjacent sub-pools are simultaneously loaded, such as in the pool 1+2 configuration, the width of the stress plateau expands accordingly, roughly equal to the combined width of the two pools.
In configurations where one sub-pool separates the loaded sub-pools, such as sub-pool 2+4—the intermediate pool (sub-pool 3 in this case) still experiences elevated stress levels, which exceed those observed in more distant pools such as sub-pools 1 and 5. This indicates a certain degree of stress transmission across the structure, even without direct loading. However, when the loaded sub-pools are separated by two or more sub-pools, the influence on the intermediate sub-pool becomes minimal, and the stress returns closer to the baseline levels observed in unloaded regions.
These observations also reflect that, although the ultra-long pool is structurally divided into six sub-pools, the stress response of each sub-pool remains relatively independent due to the constraints provided by the base slab and the upper frame structure. The boundary and stiffness conditions effectively compartmentalize structural behavior, minimizing interaction between distant sub-pools under localized loading conditions.
Additionally, it should be noted that all single and dual loading conditions are classified as “minor damage.” This is because, for ultra-long pools, single and dual sub-pool loading are equivalent to applying concentrated loads over a small region of a continuous beam, which tends to induce localized stress concentrations.

5.3. Structural Response Under Triple Sub-Pool Loading

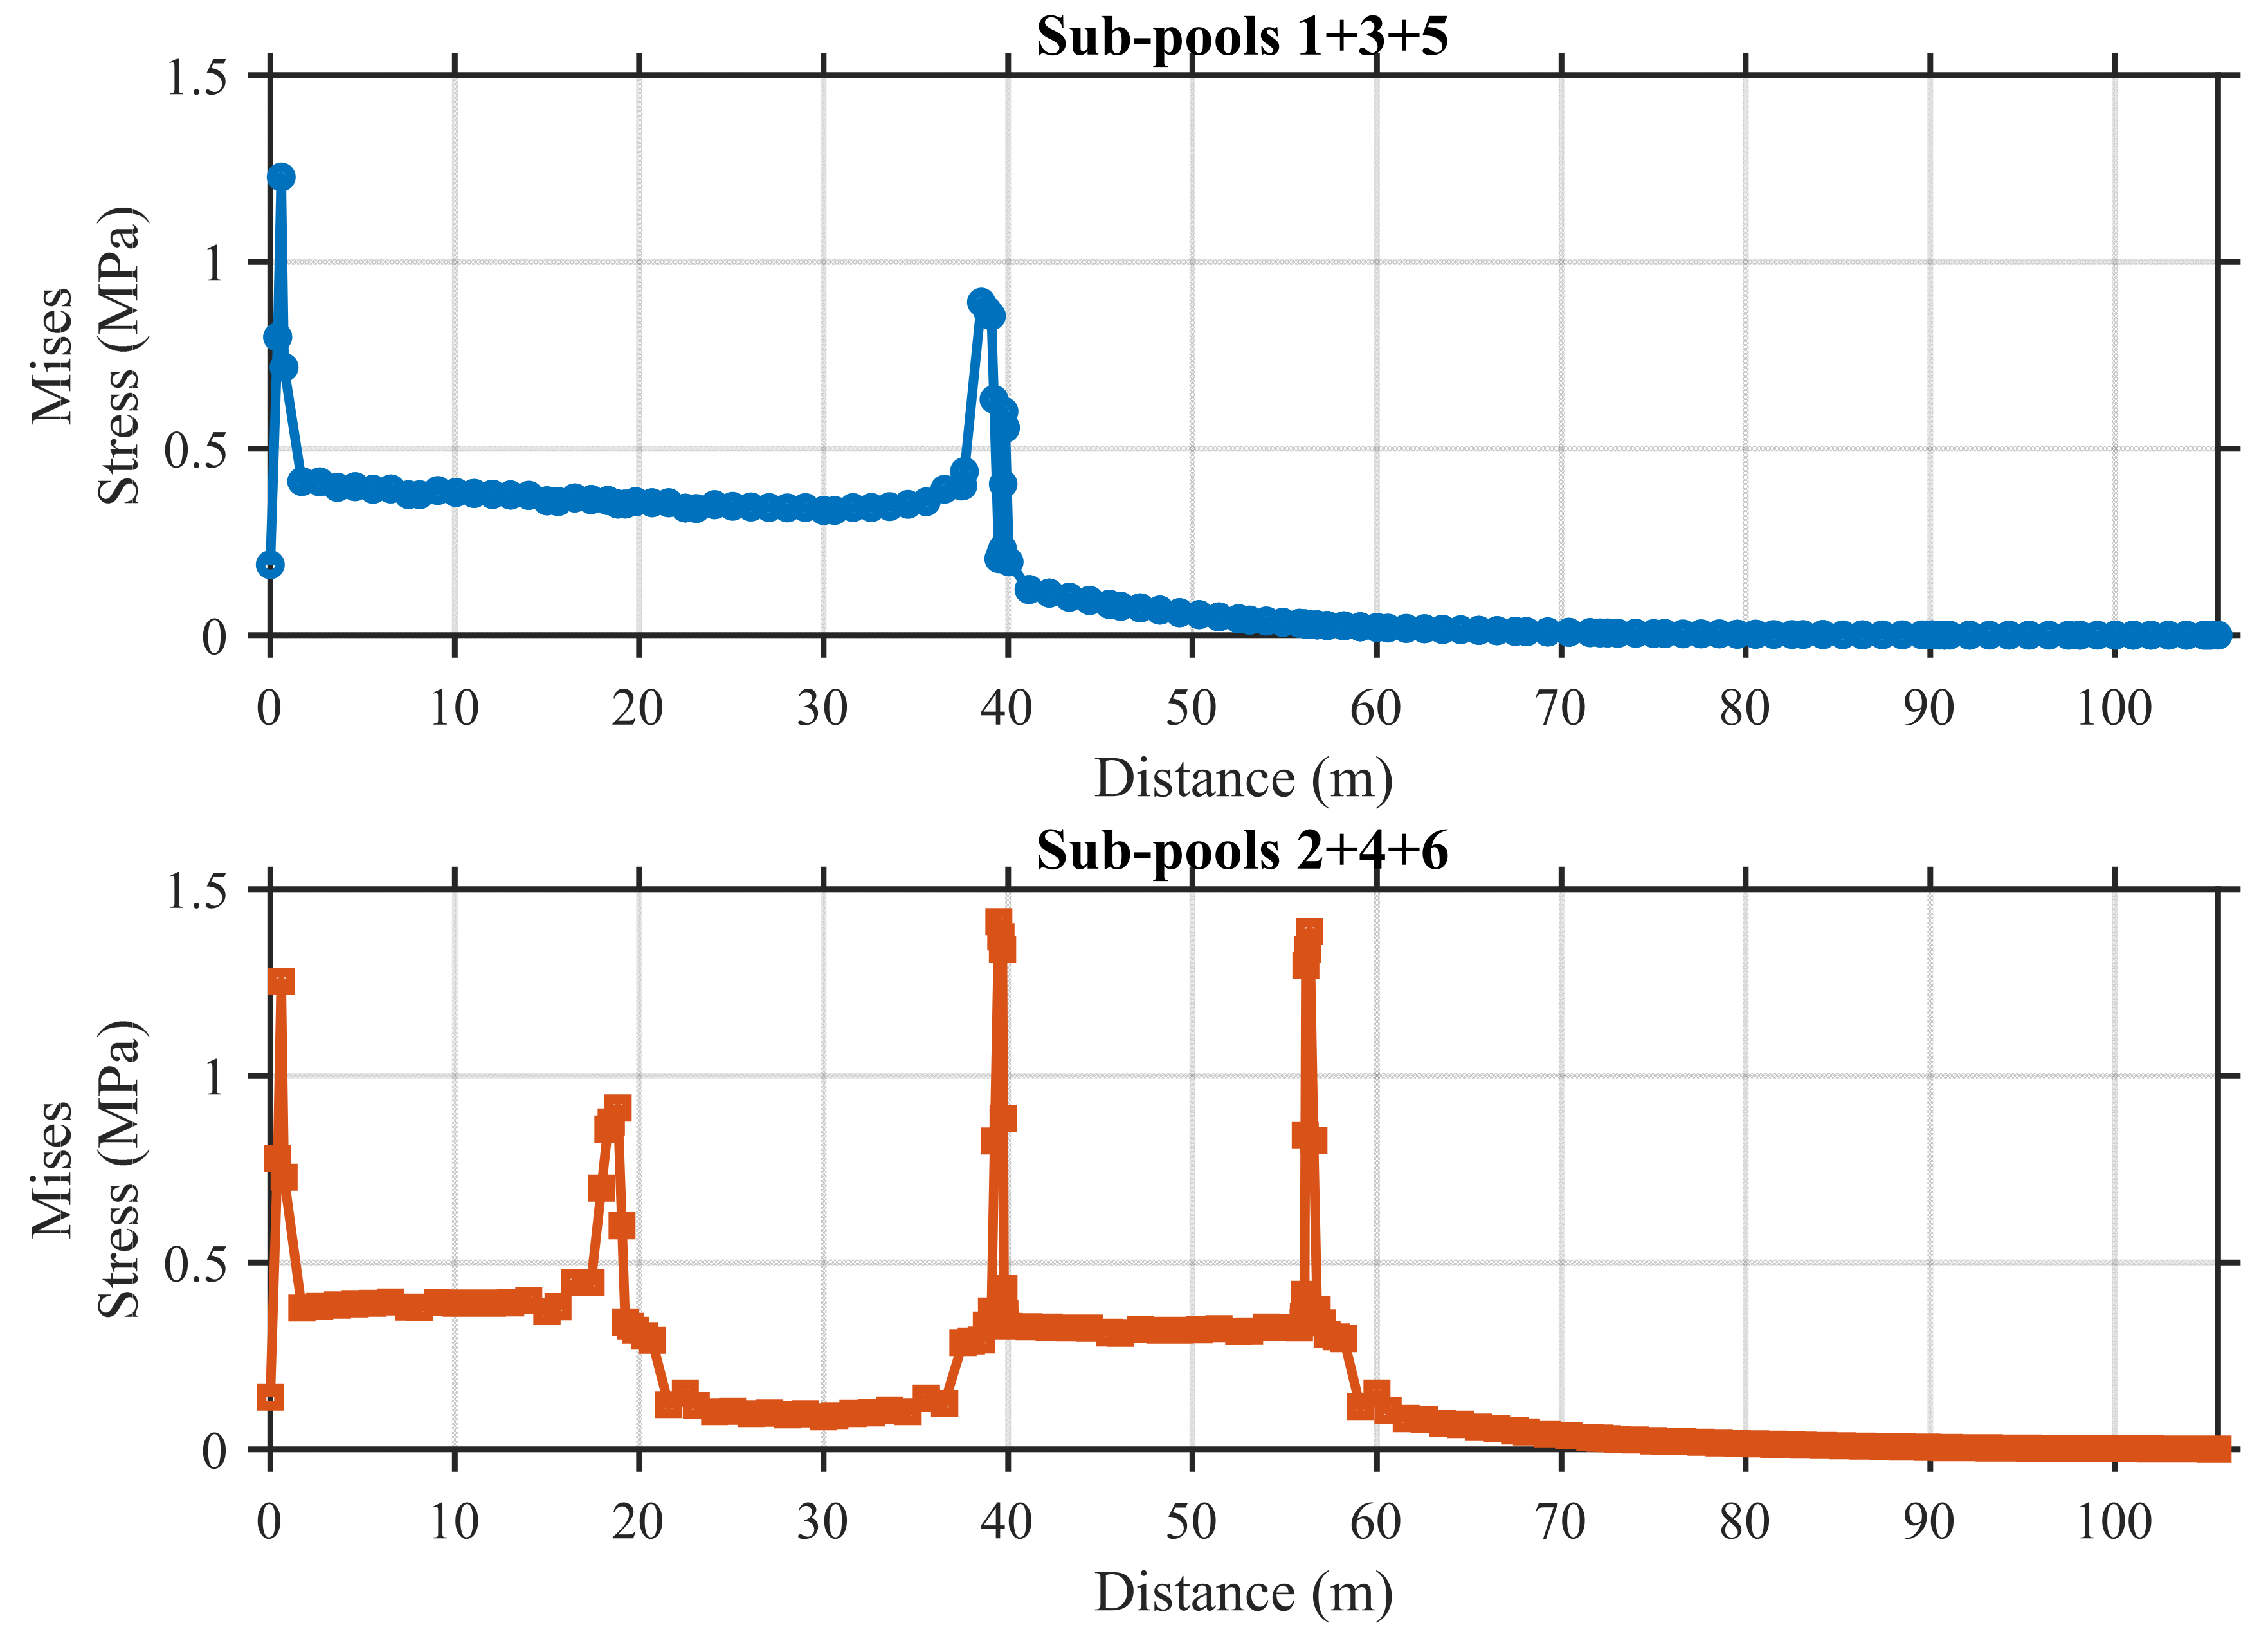
Table 11 presents the results for two alternating sub-pool loading cases (1+3+5 and 2+4+6), highlighting maximum principal stress, maximum displacement, and associated tensile damage. The maximum principal stress values are relatively close, with 2.40 MPa for sub-pool 1+3+5 and 2.54 MPa for sub-pool 2+4+6. Similarly, the maximum displacement values are 54.29 mm and 53.28 mm, respectively. These results indicate that both loading configurations induce comparable stress and deformation responses in the structure.
The minor differences observed may be attributed to slight asymmetries in geometry or boundary conditions, but the overall structural behavior remains consistent. In both cases, minor tensile damage is observed, suggesting that the stress levels have surpassed the tensile strength threshold.
These findings further support the conclusion that the base slab and upper frame structure effectively constrain the deformation, resulting in a robust and relatively uniform response, even under discontinuous or alternating loading patterns. Moreover, the similar performance of the two configurations reflects the symmetrical and modular nature of the ultra-long pool design, which enhances its structural reliability under varied operational scenarios.
Figure 22 illustrates the stress distribution along the longitudinal direction of the pool base slab when triple pools are simultaneously loaded. Similar to the previous cases, distinct stress plateaus are observed beneath the loaded pools. These plateaus represent regions of elevated stress corresponding to the locations of applied loads, consistent with the trend noted in earlier two-pool loading scenarios. The repeated appearance of such stress steps further confirms the localized nature of stress concentration and the structural response characteristics under sectional loading.

5.4. Sensitive Analysis

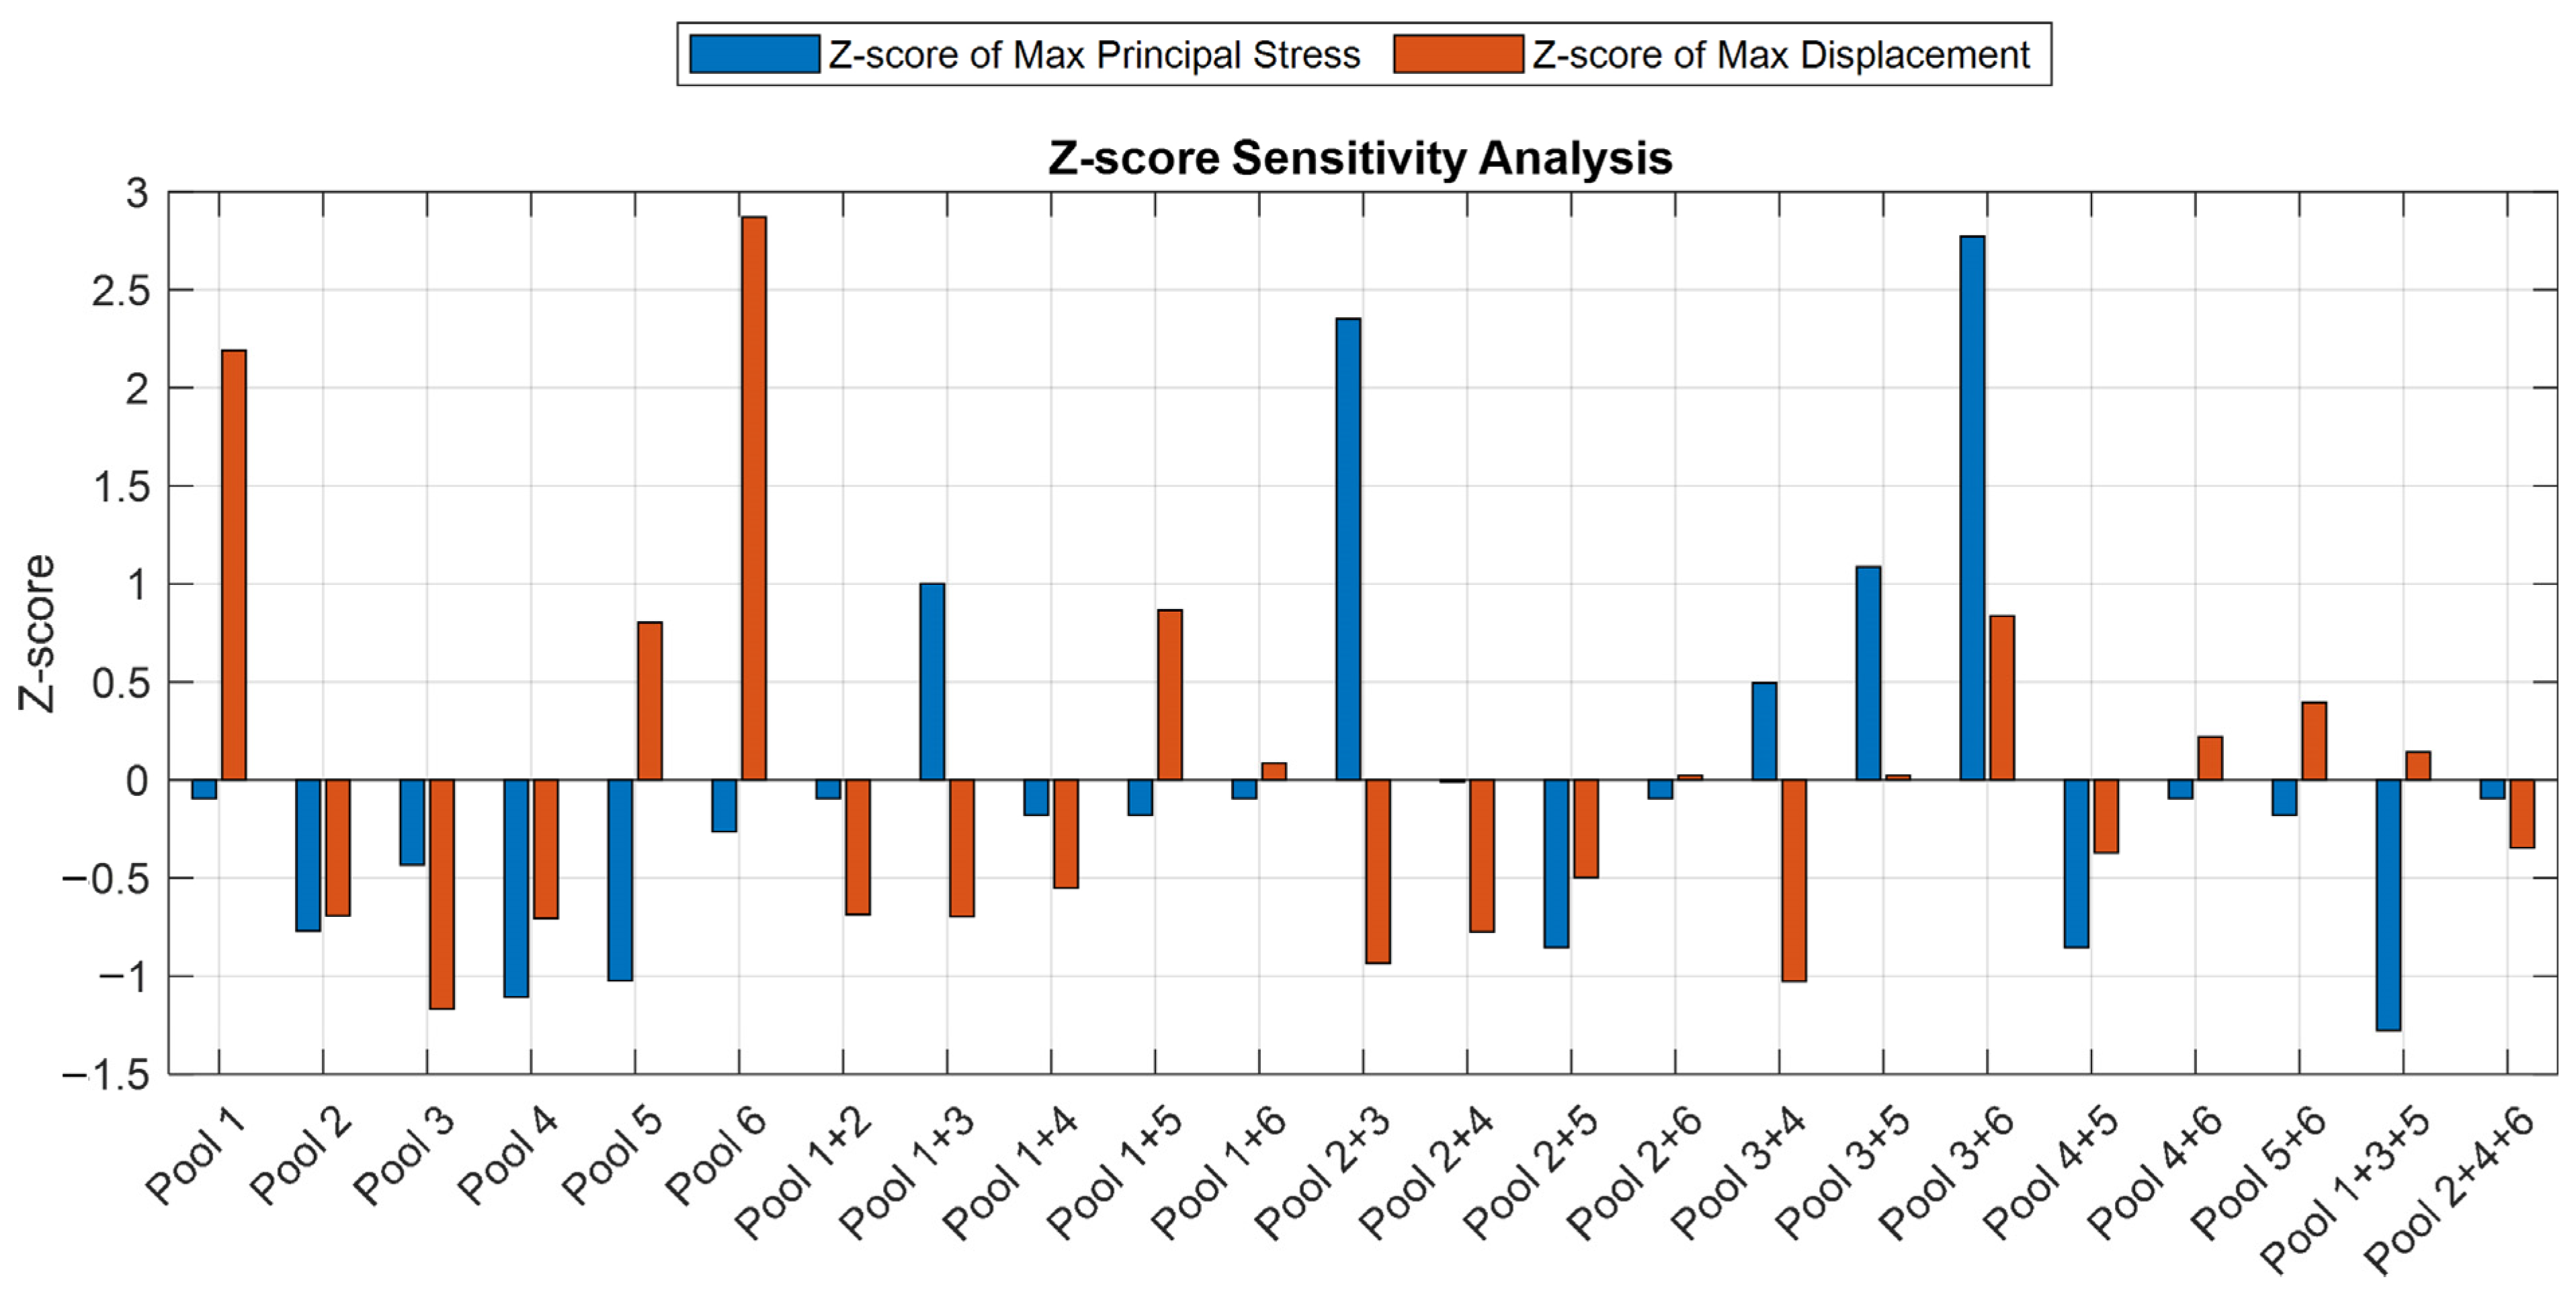
Figure 23 presents the Z-score standardized values of max principal stress and max displacement for each load combination. Notably, the cases of sub-pool 6 loading, sub-pool 3+6 loading, and sub-pool 1+3+5 loading exhibit the highest Z-scores for both stress and displacement, indicating significantly higher-than-average structural responses under this condition. This suggests that the loading scenario corresponding to these cases induces a relatively severe state in the structure. The divergence of Z-scores across combinations highlights their varying levels of impact and can be used to prioritize scenarios in further design or safety evaluations.
Figure 24 illustrates the interaction between the Z-score of max principal stress and max displacement via a scatter plot. The data points display a moderate positive correlation, implying that combinations causing higher stresses generally also result in larger displacements. This indicates a consistent structural behavior pattern, where stress and deformation are jointly elevated under severe loading conditions. The cases of sub-pool 6 loading, sub-pool 3+6 loading, and sub-pool 1+3+5 loading are clearly separated from the cluster, confirming their outlier nature in both stress and displacement.

5.5. Coupling Effects Under Load and Temperature

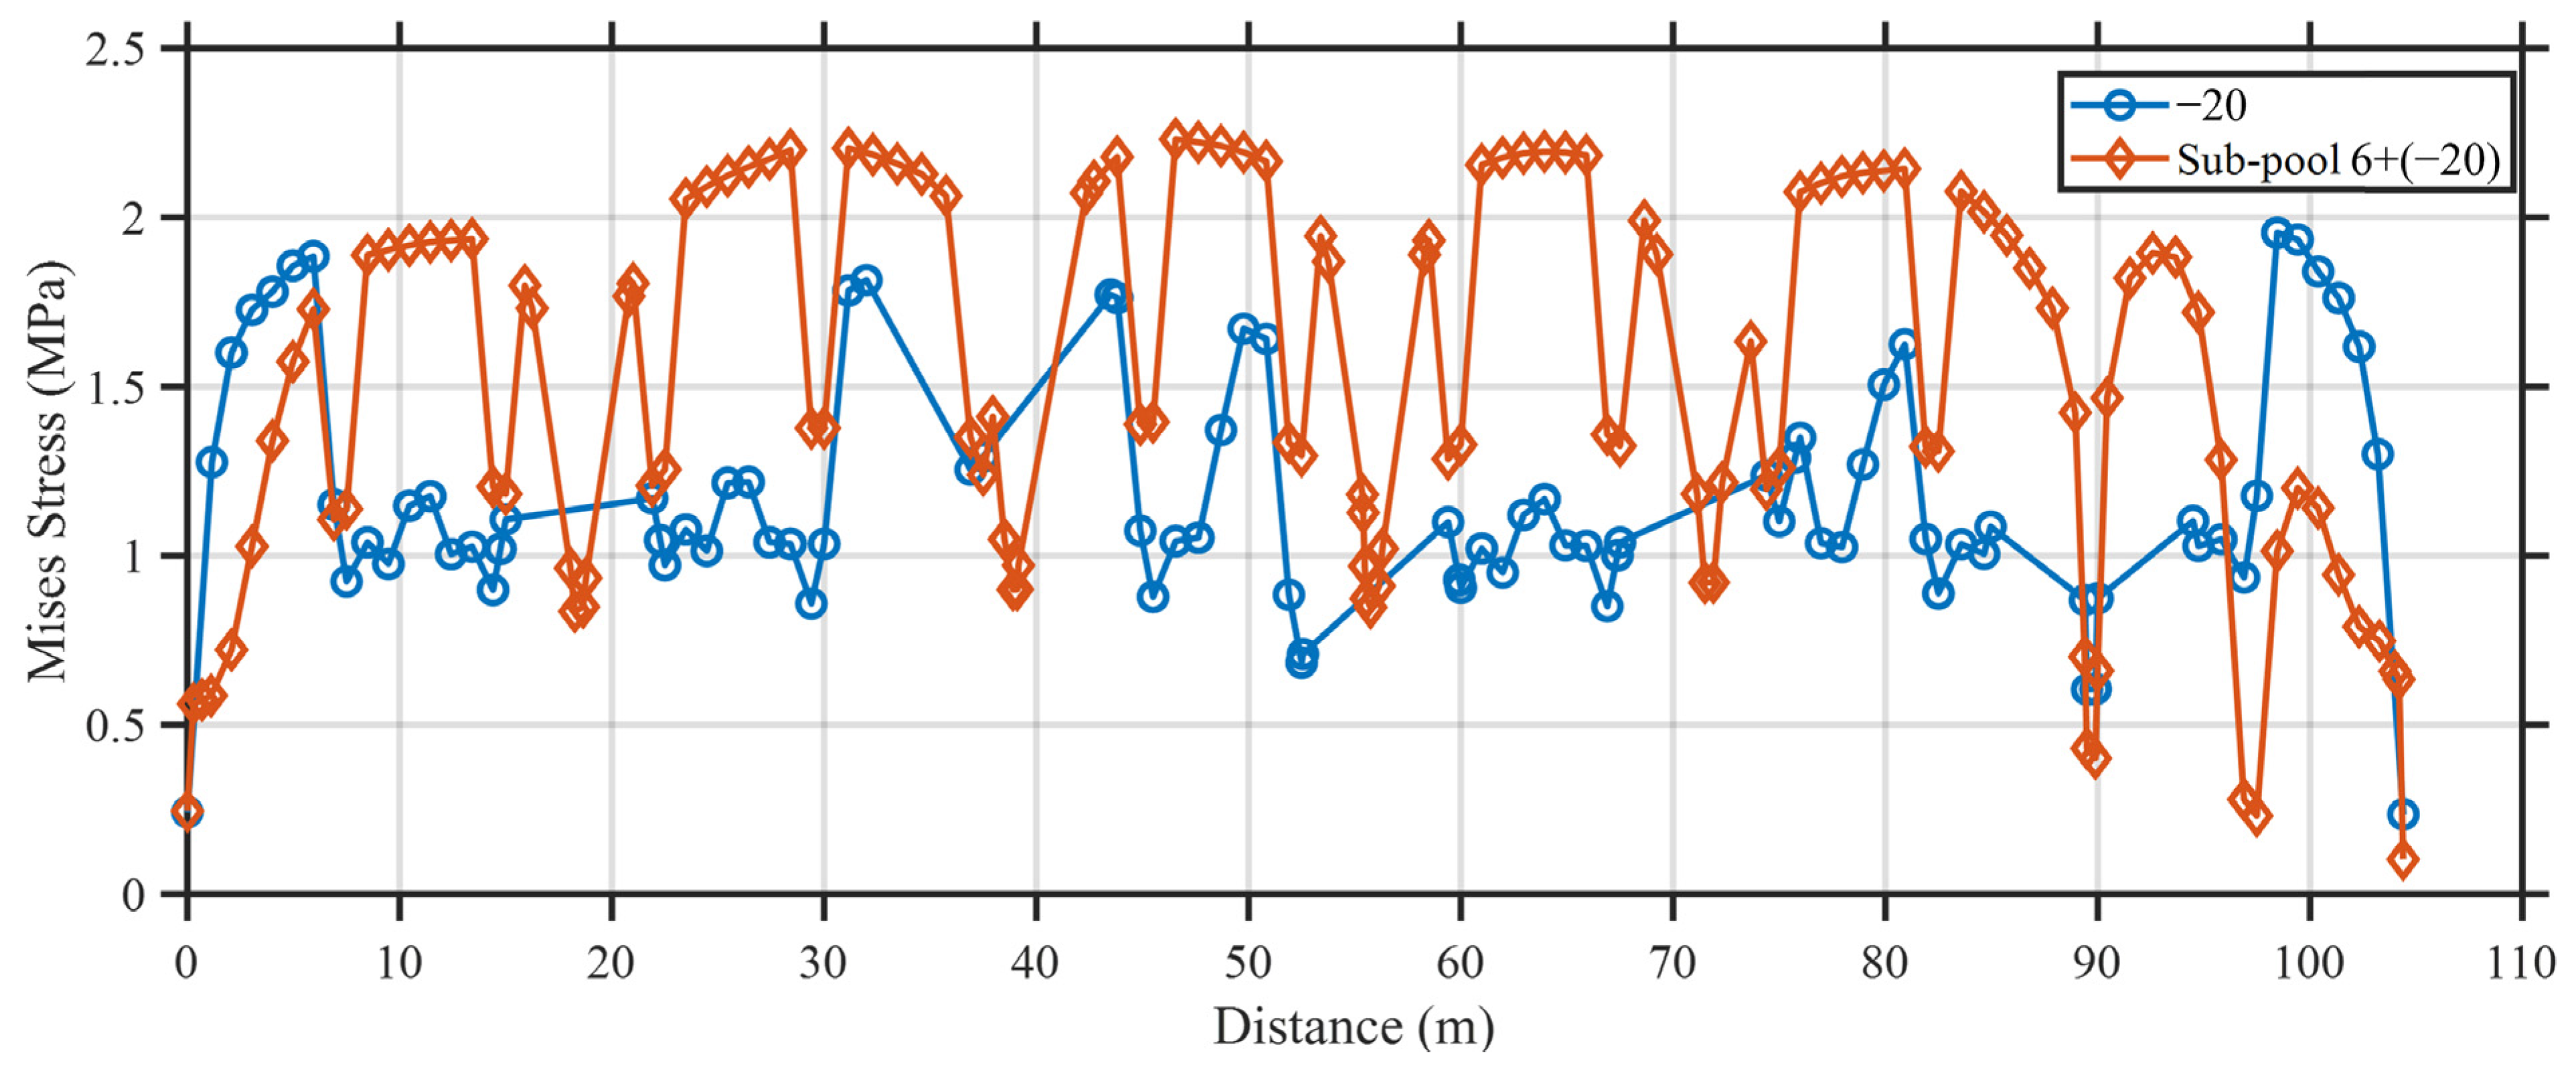
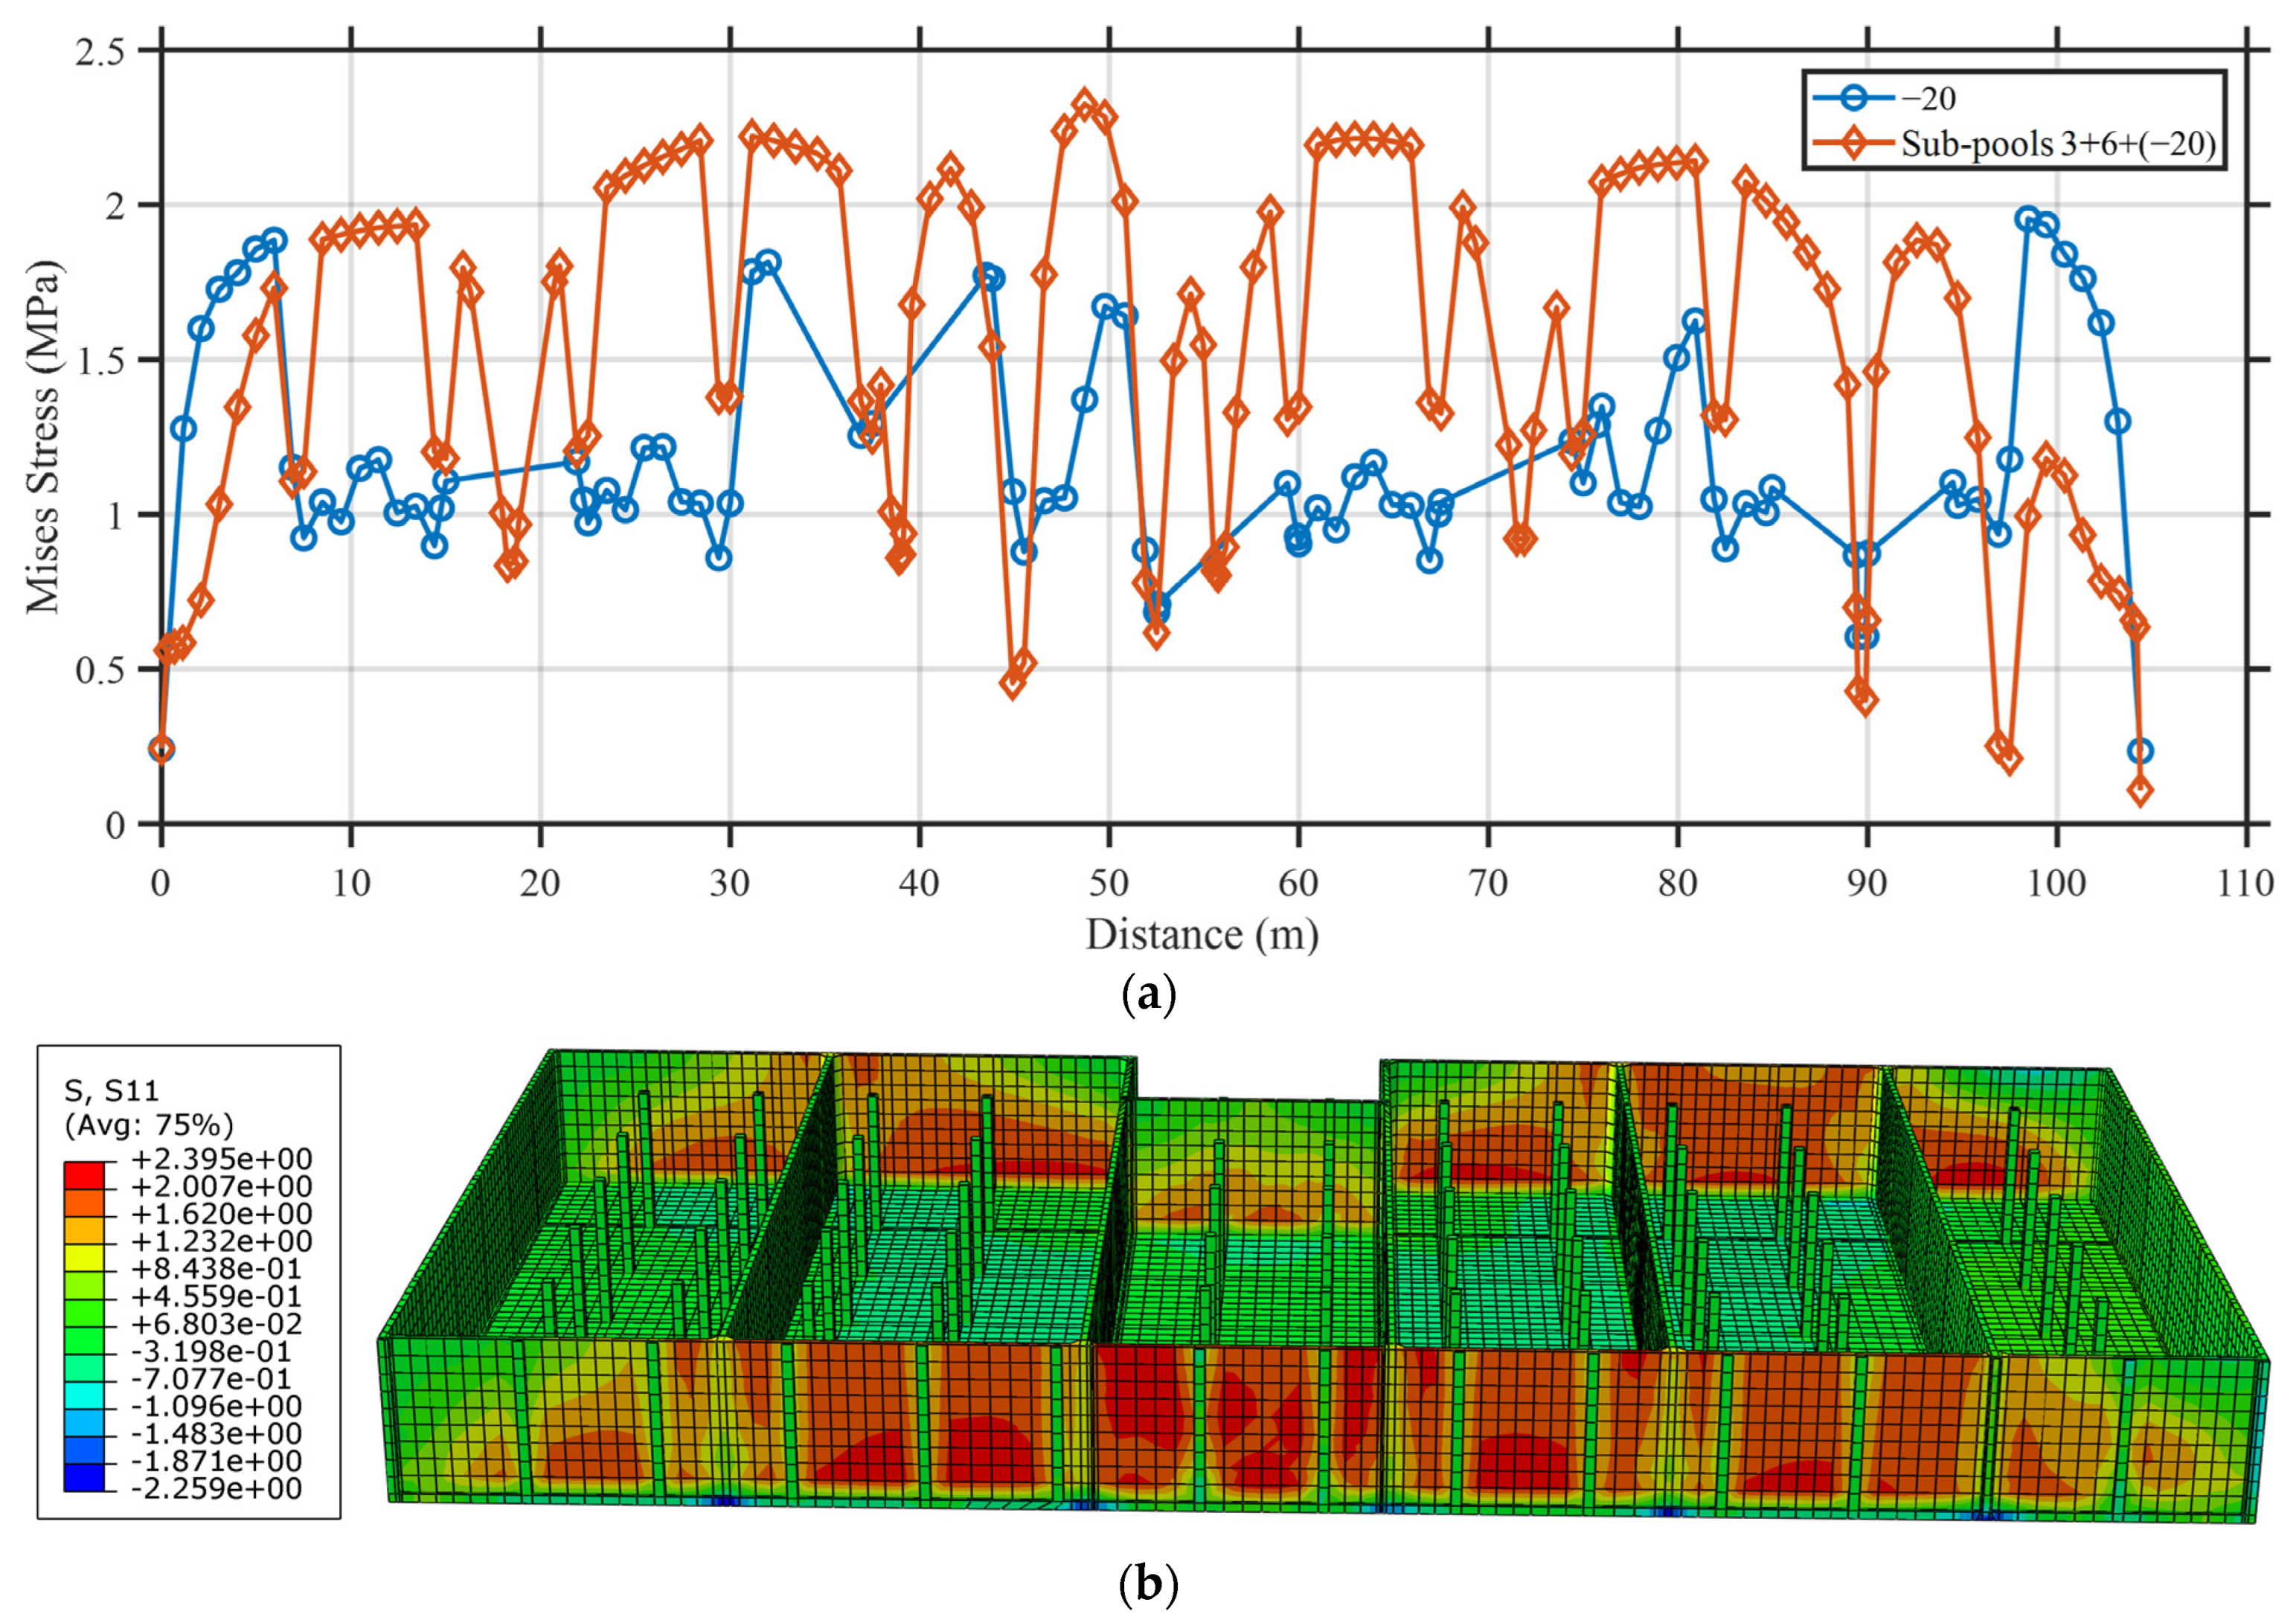
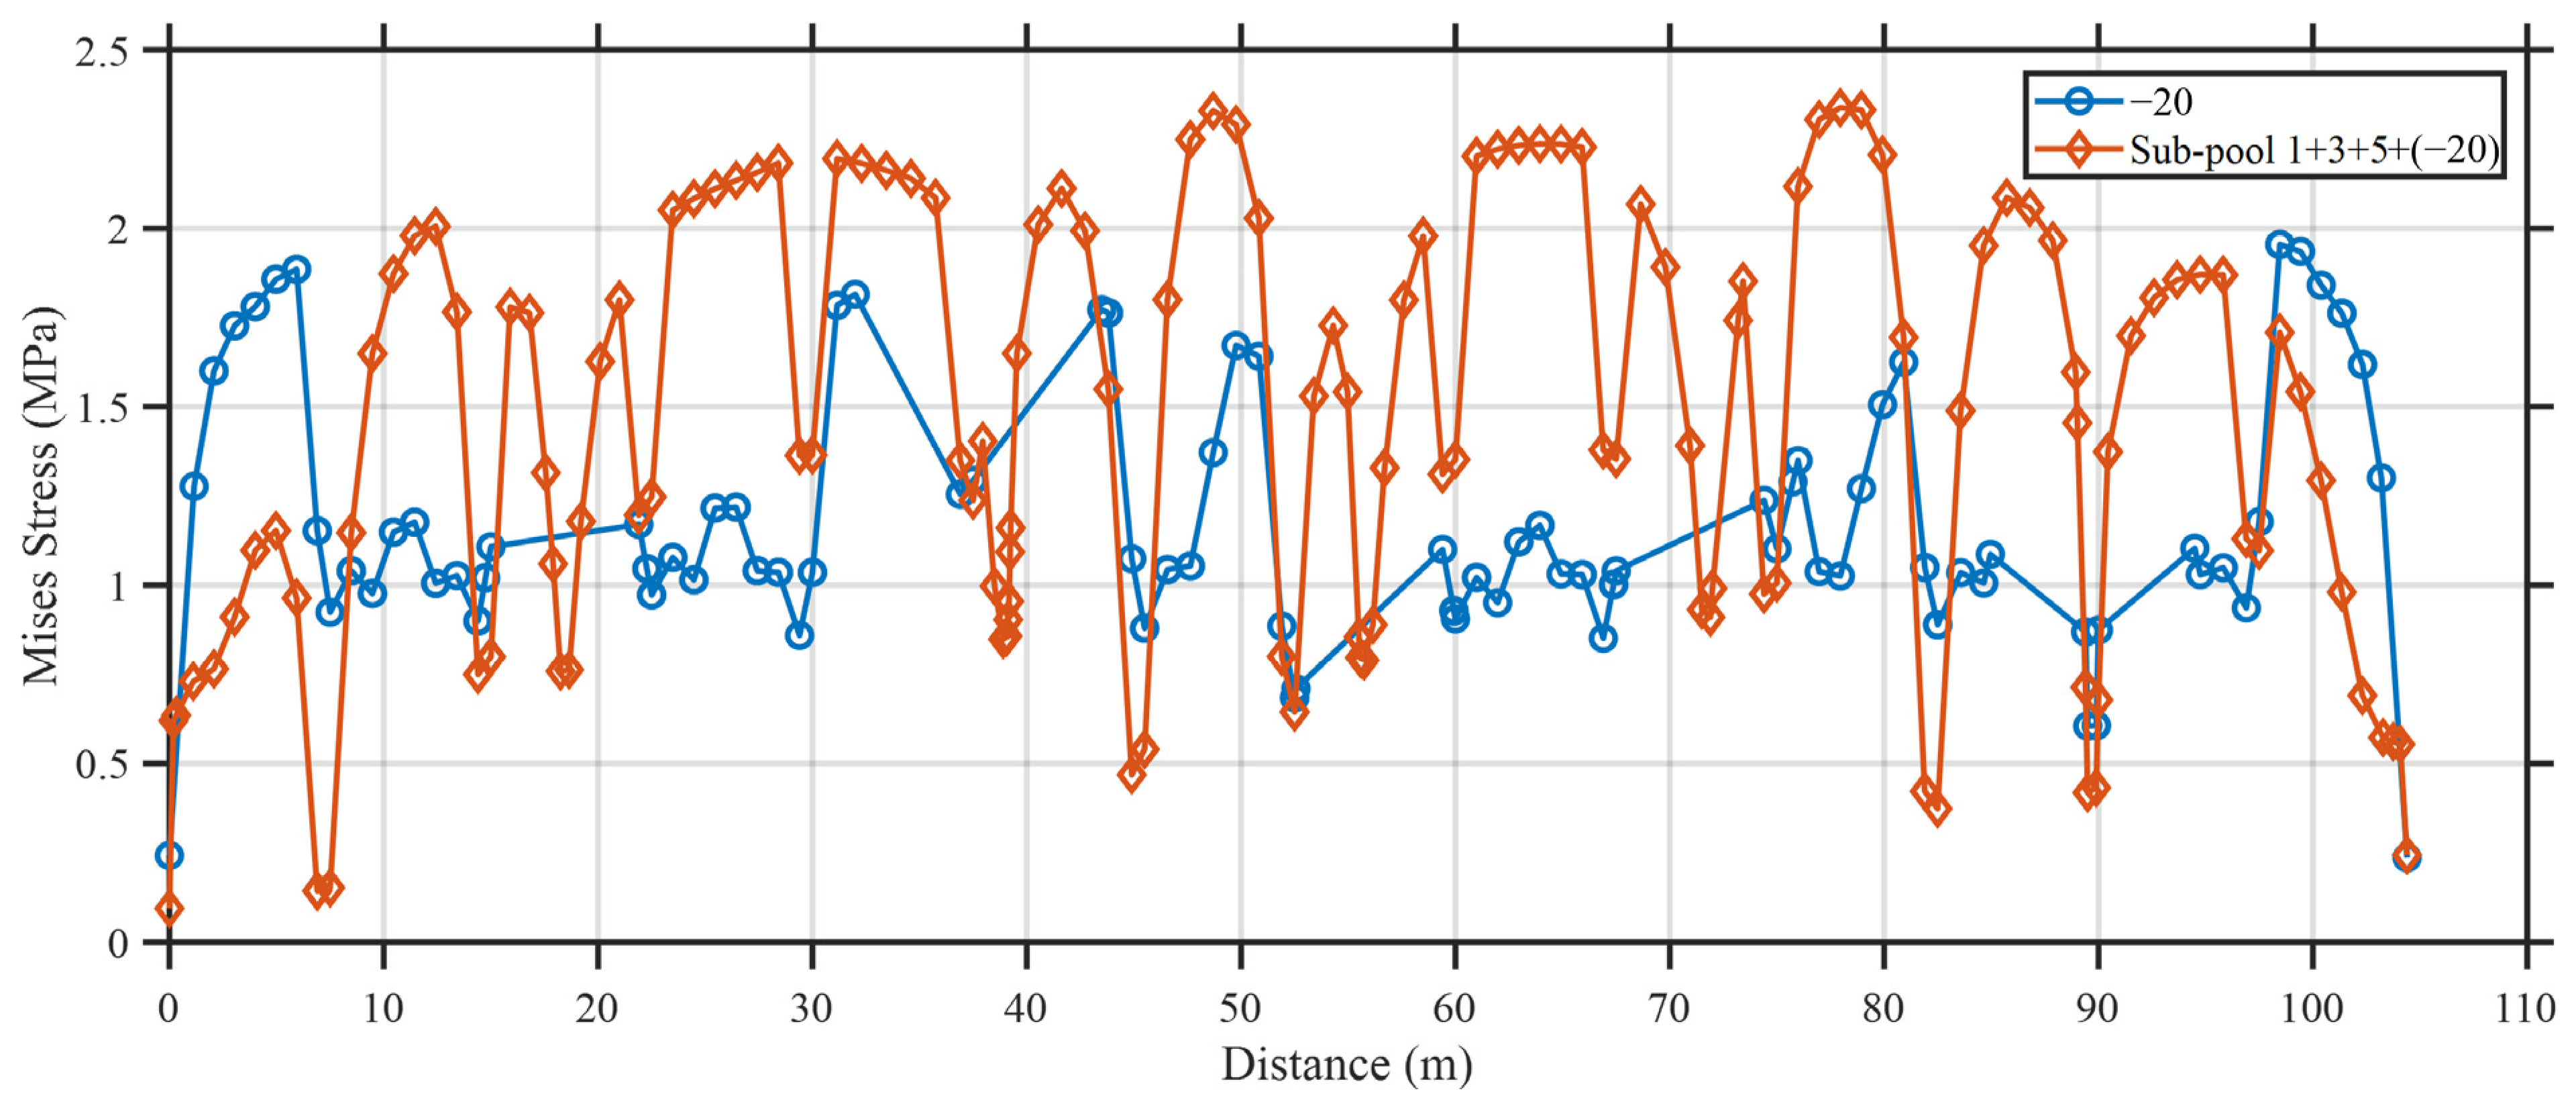
Based on the analysis in Section 4, the cases of sub-pool 6 loading, sub-pool 3+6 loading, and sub-pool 1+3+5 loading were identified as the most critical loading cases. To further investigate the combined effects of seasonal temperature variation and operational loading, a coupled thermal–structural analysis was conducted by applying a uniform temperature drop of 20 °C, in conjunction with three representative loading conditions: sub-pool 6 loading, sub-pool 3+6 loading, and sub-pool 1+3+5 loading. Therefore, these scenarios were selected for in-depth coupled analysis to evaluate the structural response under combined thermal and mechanical effects. The analyzed results are shown in Figure 25, Figure 26 and Figure 27.
The results show that the superposition of thermal contraction and water loading significantly amplifies the tensile stress levels in the base slab and side walls. While the stress distribution patterns remain similar to those observed in load-only conditions, the overall magnitude of principal tensile stress increases noticeably, particularly near structural discontinuities, such as slab–wall junctions and pool corners, where temperature-induced restraints are more pronounced.
Among the three cases, the 1+3+5 loading configuration exhibits the most extensive tensile stress region due to the alternating loading arrangement and cumulative thermal restraint across the central pools. In contrast, the sub-pool 6 case produces more concentrated peak stresses near the structural boundaries.
These findings highlight that thermal effects significantly exacerbate stress concentrations in long-span water-retaining structures. Therefore, incorporating temperature–load coupling in the design and assessment process is essential to ensure long-term performance, particularly under adverse seasonal conditions and discontinuous operational loading.

6. Conclusions

In this study, a combination of distributed fiber optic sensing (DFOS) and finite element analysis (FEA) was employed to evaluate the response of an ultra-long pool structure under thermal and loading conditions during both construction and service phases. Based on the analysis, the following conclusions can be drawn:
(1)
A finite element model was developed and validated using DFOS monitoring data. The comparison showed an average error within 9% between the simulated and measured peak thermal strain values, confirming the model’s reliability in reproducing the structural response under thermal and mechanical effects.
(2)
Based on the validated model, parametric studies revealed that a temperature drop of −20 °C combined with staged loading in sub-pool 3+6 and sub-pool 1+3+5 leads to the most severe tensile stress conditions, increasing stress levels by up to 30%. These findings indicate that localized cracking is most likely to occur under extreme thermal gradients and asymmetric loading scenarios.
(3)
Simulation results revealed that tensile stress distribution is highly sensitive to both the temperature history during curing and the subsequent loading scheme. Stress concentrations tend to develop near construction joints and wall intersections, which are vulnerable regions for crack initiation under service conditions.
These findings provide valuable insights for optimizing construction protocols, improving loading strategies, and guiding long-term durability design. While the current study focuses on key variables with significant influence on thermal behavior, a broader FEM-based parametric analysis or onsite observation (such as humidity, pore-water pressure, acoustic emissions) would add value. Additionally, the spatial interval of the applied DFOS may have limited the ability to capture very fine-scale gradients, especially near geometric discontinuities, such as construction joints or re-entrant corners. Future work will focus on exploring additional design and environmental variables for enhanced generalizability, incorporating time-dependent effects, such as long-term environmental influences like freeze–thaw cycles and chemical attacks, to further enhance the predictive capability of the proposed framework.

Author Contributions

Methodology, D.Z.; Validation, X.H.; Formal analysis, P.M.; Investigation, D.Z.; Resources, J.L.; Data curation, Y.L. and J.L.; Writing—original draft, Y.L.; Writing—review & editing, P.M. and W.W. All authors have read and agreed to the published version of the manuscript.

Funding

This study was funded by the National Natural Science Foundation of China with Grant No. 52308232, the China Postdoctoral Science Foundation with Grant No. 2023M740365, and the Research Project on Key Technologies for Crack Control in Ultra-Long Concrete Pool Structures (XMSHT*KC-KY-CCSC-00-25-005).

Data Availability Statement

The original contributions presented in the study are included in the article, further inquiries can be directed to the corresponding author.

Conflicts of Interest

Authors Yongxing Li, Xinyang Han, Dajian Zhang and Jianrong Li were employed by the company China Coal Xi’an Design Engineering Co., Ltd. The remaining authors declare that the research was conducted in the absence of any commercial or financial relationships that could be construed as a potential conflict of interest.

References

  1. Chattopadhyay, S.; Chattopadhyay, D. Coal and other mining operations: Role of sustainability. In Fossil Energy; Springer: New York, NY, USA, 2020; pp. 333–356. [Google Scholar]
  2. Yuan, S.; Sui, W.; Han, G.; Duan, W. An optimized combination of mine water control, treatment, utilization, and reinjection for environmentally sustainable mining: A case study. Mine Water Environ. 2022, 41, 828–839. [Google Scholar] [CrossRef]
  3. Xu, Z.; Sun, Y. Mine water safety and environment: Chinese experience. Water 2024, 16, 2833. [Google Scholar] [CrossRef]
  4. de Lima, J.P.M.; Amaral, M.C.S.; de Lima, S.C.R.B. Sustainable water management in the mining industry: Paving the way for the future. J. Water Process Eng. 2025, 71, 107239. [Google Scholar] [CrossRef]
  5. Wang, D.B.; Song, X.B.; Nie, H.Y. Cracking analysis of massive concrete with large-diameter pipes during construction. Constr. Build. Mater. 2022, 338, 127636. [Google Scholar] [CrossRef]
  6. Fairbairn, E.M.; Azenha, M. Thermal cracking of massive concrete structures. In State of Art Report of the RILEM TC; Springer: Cham, Switzerland, 2019. [Google Scholar]
  7. Li, K.; Li, L. Crack-altered durability properties and performance of structural concretes. Cem. Concr. Res. 2019, 124, 105811. [Google Scholar] [CrossRef]
  8. Zhou, G.D.; Yi, T.H. Thermal load in large-scale bridges: A state-of-the-art review. Int. J. Distrib. Sens. Netw. 2013, 9, 217983. [Google Scholar] [CrossRef]
  9. Schrefler, B.A.; Majorana, C.E.; Khoury, G.A.; Gawin, D. Thermo-hydro-mechanical modelling of high performance concrete at high temperatures. Eng. Comput. 2002, 19, 787–819. [Google Scholar] [CrossRef]
  10. de Borst, R.; Peeters, P.P. Analysis of concrete structures under thermal loading. Comput. Methods Appl. Mech. Eng. 1989, 77, 293–310. [Google Scholar] [CrossRef]
  11. Hooshmand, A.; Kianoush, R.; Siad, H.; Lachemi, M.; Moslemi, M. Investigation of leakage and self-healing of direct tension cracks under sustained loading and high-water pressure. Constr. Build. Mater. 2021, 267, 120879. [Google Scholar] [CrossRef]
  12. Jahandari, S.; Tao, Z.; Alim, M.A.; Li, W. Integral waterproof concrete: A comprehensive review. J. Build. Eng. 2023, 78, 107718. [Google Scholar] [CrossRef]
  13. Stoiber, N.; Kromoser, B. Topology optimization in concrete construction: A systematic review on numerical and experimental investigations. Struct. Multidiscip. Optim. 2021, 64, 1725–1749. [Google Scholar] [CrossRef]
  14. Ji, J.; Li, Z.; Ma, T.; Wang, H.; Li, J.; Wang, J. Evaluation on the Crack Resistance of Cement-Stabilized Macadam Mixture with Crack-Resistant Interlocking Gap Gradation and Rubber Powder. J. Mater. Civ. Eng. 2024, 36, 04024269. [Google Scholar] [CrossRef]
  15. Fang, L.; Fu, D.; Yuan, Q.; Xu, S.; Zhang, D.; Cai, H.; Zeng, X.; Wang, Y.; Zhou, J. Combined effects of low-heat cement, expansive agent and shrinkage-reducing admixture on drying shrinkage and cracking of concrete. Case Stud. Constr. Mater. 2025, 22, e04344. [Google Scholar] [CrossRef]
  16. Liu, K.; Wang, X.; Luo, Z. Pre-tension-free distributed UW-FBG detection method for two-dimensional bearing capacity of super-long bored piles. J. Mod. Opt. 2025, 72, 382–390. [Google Scholar] [CrossRef]
  17. Xu, K.; Wang, F.; Wang, Y.; Dai, P.; Wang, J.; Liu, Y.; Fan, Y.; Sun, Z.; Wang, Y.; Zhao, W.; et al. Large-capacity interrogation for ultra-weak fiber Bragg grating array with a DFB Laser Array Chip. J. Light. Technol. 2025, 43, 8467–8473. [Google Scholar] [CrossRef]
  18. GB 175-2023; Common Portland Cement. China Architecture and Building Press: Beijing, China, 2023.
  19. JGJ 52-2006; Standard for Technical Requirements and Test Method of Sand and Crushed Stone (or Gravel) for Ordinary Concrete. China Architecture and Building Press: Beijing, China, 2006.
  20. GB/T 50081-2019; Standard for Test Methods of Concrete Physical and Mechanical Properties. China Architecture and Building Press: Beijing, China, 2019.
  21. Wu, Z.; Zhang, J.; Yu, H.; Wu, Q.; Da, B. Computer-aided investigation of the tensile behavior of concrete: Relationship between direct and splitting tensile strength. In Structures; Elsevier: Amsterdam, The Netherlands, 2023; Volume 55, pp. 453–467. [Google Scholar]
  22. Simulia. ABAQUS User’s Manual, Version 6.14; Dassault Systèmes Simulia Corp.: Providence, RI, USA, 2014.
  23. GB50010-2010; Code for Design of Concrete Structures. China Architecture and Building Press: Beijing, China, 2010.
  24. Xing, G.; Al-Dhabyani, M.A.; Al-Shakhada, N.A.; Li, X. Experimental and numerical investigations on the behavior and failure mechanism of RC beams strengthened with near-surface mounted high-strength aluminum alloy bars. J. Struct. Eng. 2021, 147, 04021208. [Google Scholar] [CrossRef]
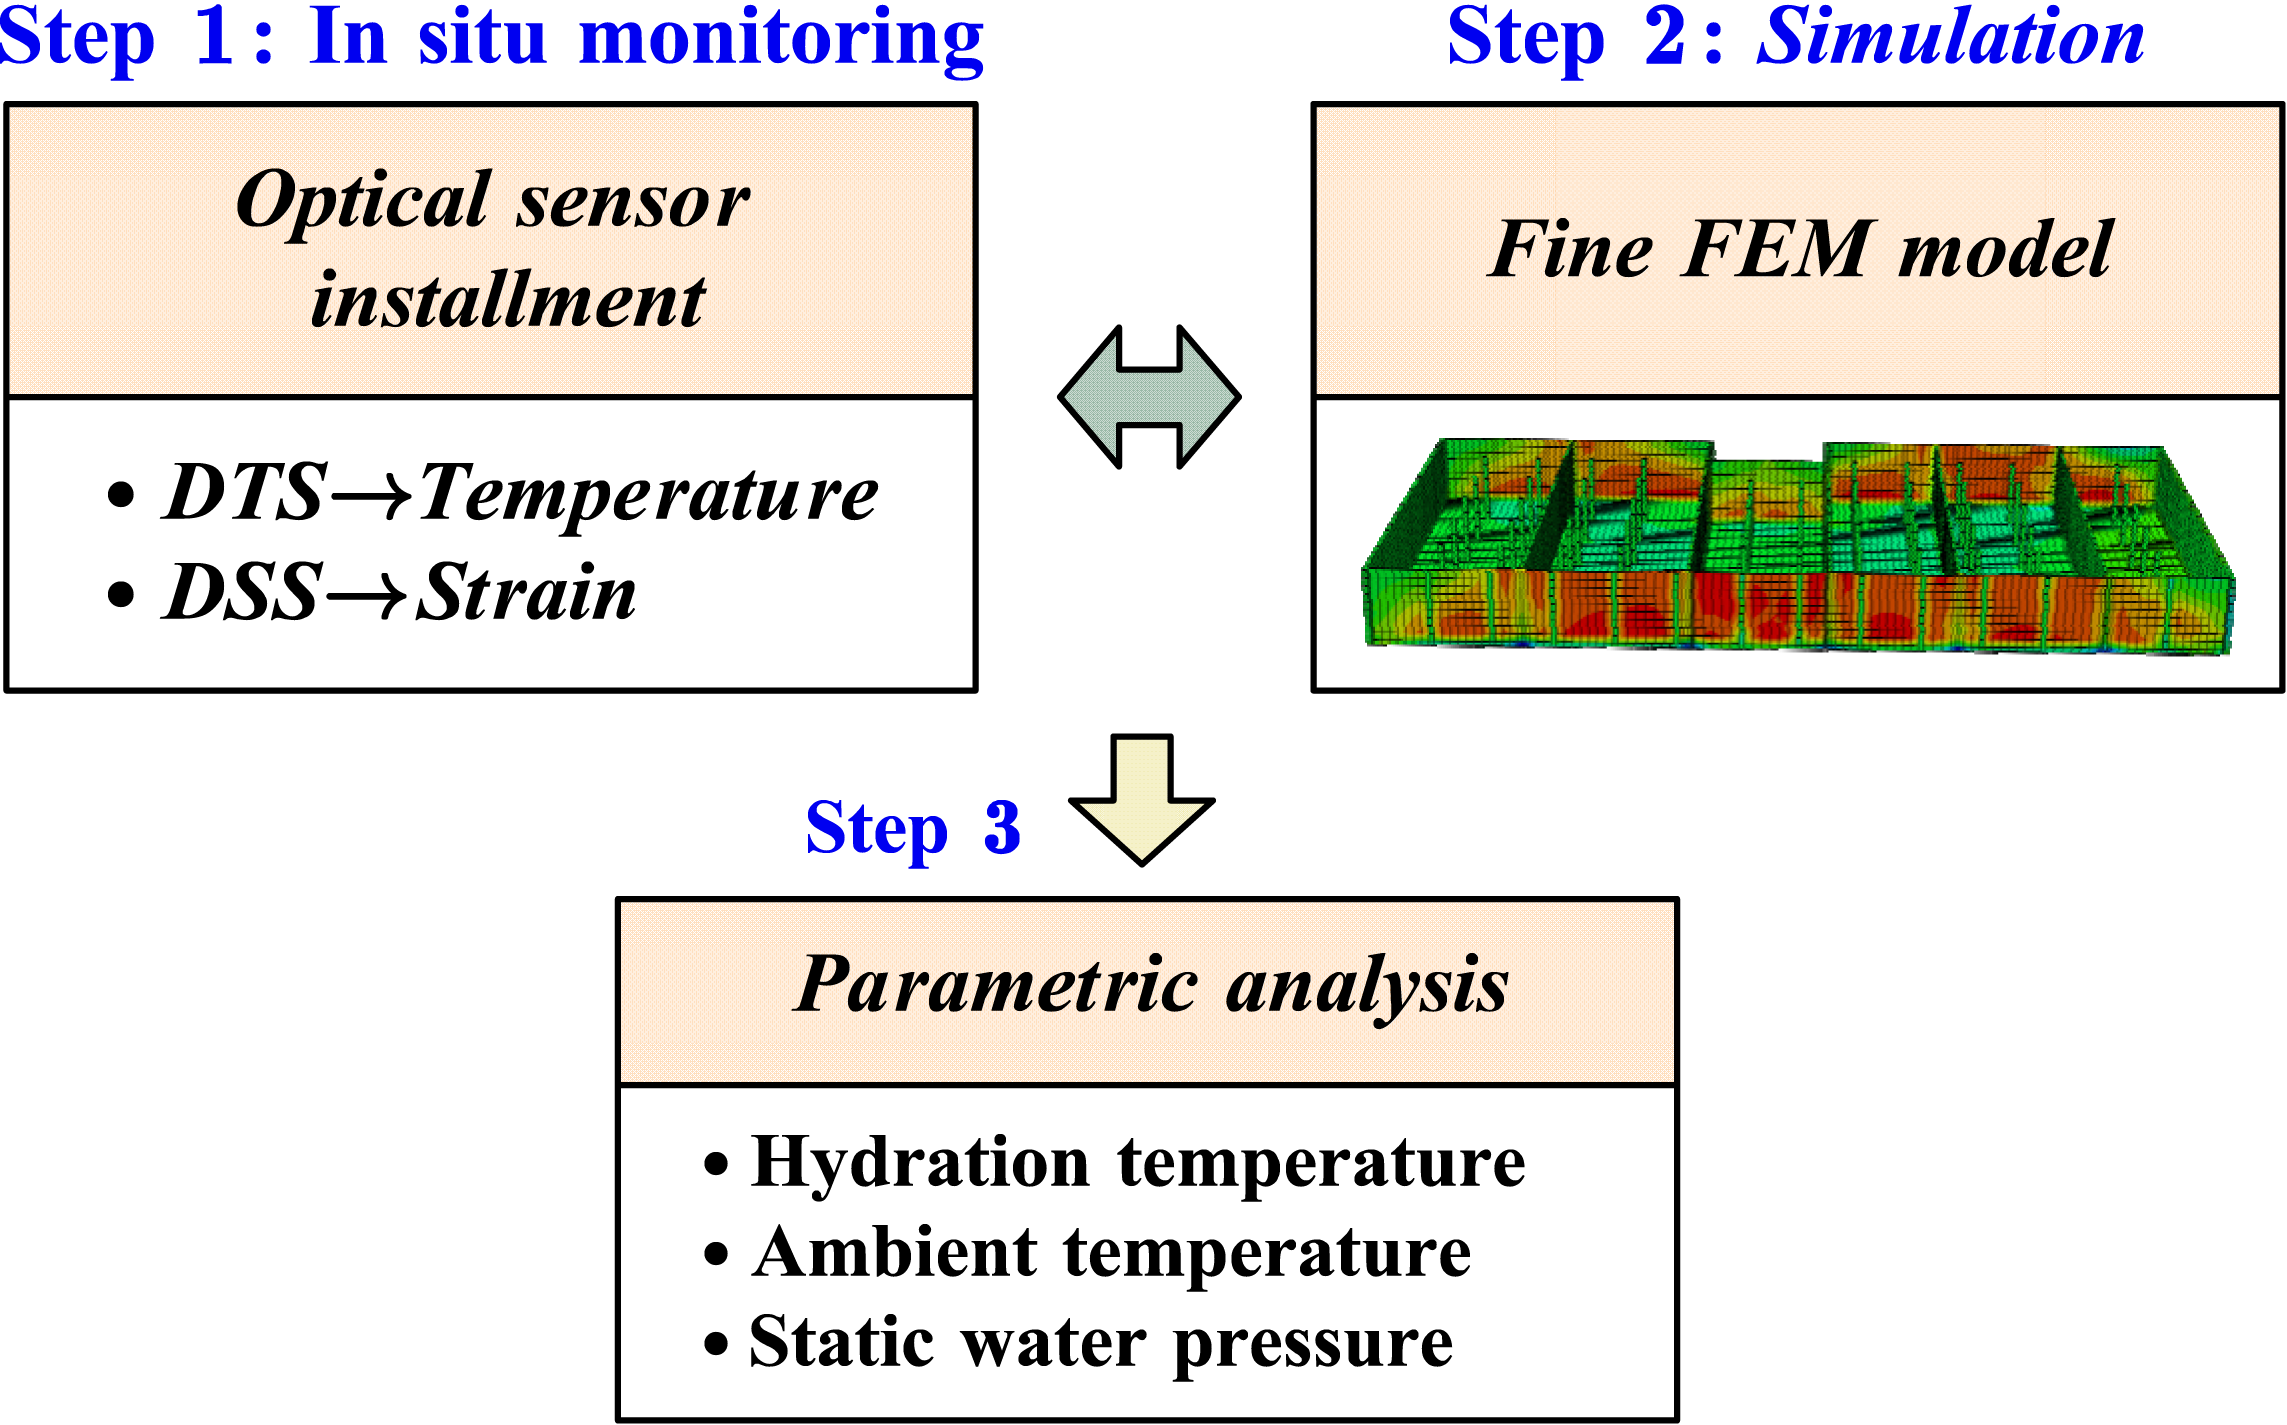
Figure 1. Flowchart of this study.
Buildings 15 02961 g001
Figure 2. Overview of the mine water treatment pool: (a) 3D stereogram; (b) Top view planar diagram.
Buildings 15 02961 g002
Figure 3. Installation of distributed optical fiber and monitoring center.
Buildings 15 02961 g003
Figure 4. Particle size distribution of gravel: (a) Standard sieving; (b) Particle size distribution.
Buildings 15 02961 g004
Figure 5. Particle size distribution of sand. (a) Standard sieving; (b) Particle size distribution curve.
Buildings 15 02961 g005
Figure 6. Uniaxial stress–strain curve of concrete [23].
Buildings 15 02961 g006
Figure 7. Established three-dimensional model of ultra-long water pool.
Buildings 15 02961 g007aBuildings 15 02961 g007b
Figure 8. Monitoring webpage.
Buildings 15 02961 g008
Figure 9. Measured temperature.
Buildings 15 02961 g009
Figure 10. Comparison between the measured and simulated strain values.
Buildings 15 02961 g010
Figure 11. Temperature progress curve.
Buildings 15 02961 g011
Figure 12. Results of case 15-55-15: (a) Mises stress corresponding to the peak hydration temperature; (b) Mises stress after stabilization; (c) Tension damage; (d) Rebar Mises stress corresponding to the peak hydration temperature.
Buildings 15 02961 g012
Figure 13. Mises stress distribution along the longitudinal pool wall.
Buildings 15 02961 g013
Figure 14. Mises stress along the longitudinal reference line.
Buildings 15 02961 g014
Figure 15. Stress along the longitudinal reference line.
Buildings 15 02961 g015
Figure 16. Tensile damage under cooling scenarios.
Buildings 15 02961 g016
Figure 17. Stress along the longitudinal direction under single sub-pool loading.
Buildings 15 02961 g017
Figure 18. Stress along base slab (sub-pool 1 combinations).
Buildings 15 02961 g018
Figure 19. Stress along base slab (sub-pool 2 combinations).
Buildings 15 02961 g019
Figure 20. Stress along base slab (sub-pool 3 combinations).
Buildings 15 02961 g020
Figure 21. Stress along base slab (sub-pool 4 and 5 combinations).
Buildings 15 02961 g021
Figure 22. Stress along base slab corresponding to conditions shown in Table 11.
Buildings 15 02961 g022
Figure 23. Z-score sensitivity analysis.
Buildings 15 02961 g023
Figure 24. Interaction analysis.
Buildings 15 02961 g024
Figure 25. Stress under −20 °C versus sub-pool 6 and −20 °C coupling.
Buildings 15 02961 g025
Figure 26. Structure response under sub-pool 3+6+ (−20 °C) and −20 °C. (a) Stress along the longitudinal the same reference line of Figure 14. (b) Stress map under sub-pool 3+6+ (−20 °C). (c) Stress map under −20 °C.
Buildings 15 02961 g026aBuildings 15 02961 g026b
Figure 27. Stress under −20 °C versus pool 1+3+5 and −20 °C coupling.
Buildings 15 02961 g027
Table 1. Chemical compositions of cement and fly ash (wt%).
SiO2Al2O3CaOFe2O3MgONa2OK2OSO3TiO2
Cement19.495.5465.013.222.750.311.072.320.29
Fly ash48.2240.873.832.650.530.300.590.861.63
Table 2. Test results of gravel density.
Averaged Value (kg/m3)
Apparent density2580
Bulk density1530
Compacted bulk density1660
Table 3. Test results of sand density.
Averaged Value (kg/m3)
Apparent density2660
Bulk density1590
Compacted bulk density1820
Table 4. Mix design (kg/m3).
CementFly AshSandGravelWaterSp f c  (MPa) f t  (MPa)
Specimen29511072410531589.6845.0 ± 2.02.53 ± 0.36
Table 5. Plasticity parameters of CDP model.
ParameterDilation Angle, ψPlastic Potential Eccentricity, εStress Ratio
σbo/σco
Yielding Surface
Shape Factor, k
Viscosity Parameter, μ
Value300.11.160.66670.0001
Table 6. Working conditions considered.
No.DescriptionValue(s)Type/Notes
1Hydration heat Casting temperature: 15/20/25 °C
Peak temperature: 45/50/55 °C
Thermal
2Seasonal temperature increases +10/+15/+20 °CThermal
3Seasonal temperature decreases −10/−15/−20 °CThermal
4Static water loadingOnly one sub-pool filled (6 cases)Loading
Two sub-pools filled (15 cases)
1-2/1-3/1-4/1-5/1-6/2-3/2-4/2-5/2-6
3-4/3-5/3-6/4-5/4-6/5-6
-Sub-pools 1, 3, and 5 filled
-Sub-pools 2, 4, and 6 filled
Table 7. Parametric analysis results.
Peak Mises Stress (MPa)Stabilized Mises StressTensile Damage
15-45-154.262.94None
15-50-154.973.00None
15-55-155.682.80Minor Damage
20-45-153.552.95None
20-50-154.263.43None
20-55-154.983.50None
20-60-205.683.09Minor Damage
25-45-152.841.42None
25-50-153.553.38None
25-55-154.263.88None
25-60-254.983.01None
30-60-254.263.43None
Table 8. Statistical analysis results from Figure 15.
CasesMean Stress (MPa)Max Stress (MPa)Min Stress (MPa)Std.
+10 °C−1.392542−0.137349−2.3510900.491334
+15 °C−2.067914−0.196965−3.5319700.742718
+20 °C−2.722492−0.139204−4.6941901.057008
−10 °C1.5377841.9842400.1384760.442215
−15 °C1.4980552.2547500.1964430.500747
−20 °C1.1812251.9544800.2352920.354571
Table 9. Structural response under single sub-pool loading.
Max Principal Stress (MPa)Max Displacement (mm)Tensile Damage
Sub-pool 12.5458.51Minor damage
Sub-pool 22.4652.57Minor damage
Sub-pool 32.5051.59Minor damage
Sub-pool 42.4252.54Minor damage
Sub-pool 52.4355.65Minor damage
Sub-pool 62.5259.91Minor damage
Table 10. Structural response under dual sub-pool loading.
Max Principal Stress (MPa)Max Displacement (mm)Tensile Damage
Sub-pool 1+22.5452.58Minor damage
Sub-pool 1+32.6752.56Minor damage
Sub-pool 1+42.5352.86Minor damage
Sub-pool 1+52.5355.78Minor damage
Sub-pool 1+62.5454.17Minor damage
Sub-pool 2+32.8352.07Minor damage
Sub-pool 2+42.5552.40Minor damage
Sub-pool 2+52.4552.97Minor damage
Sub-pool 2+62.5454.04Minor damage
Sub-pool 3+42.6151.88Minor damage
Sub-pool 3+52.6854.04Minor damage
Sub-pool 3+62.8855.72Minor damage
Sub-pool 4+52.4553.23Minor damage
Sub-pool 4+62.5454.45Minor damage
Sub-pool 5+62.5354.81Minor damage
Table 11. Structural response under triple pool loading.
Max Stress (MPa)Max Displacement (mm)Tensile Damage
Sub-pool 1+3+52.4054.29Minor damage
Sub-pool 2+4+62.5453.28Minor damage
Disclaimer/Publisher’s Note: The statements, opinions and data contained in all publications are solely those of the individual author(s) and contributor(s) and not of MDPI and/or the editor(s). MDPI and/or the editor(s) disclaim responsibility for any injury to people or property resulting from any ideas, methods, instructions or products referred to in the content.