Article

Bond–Slip Properties and Acoustic Emission Characterization Between Steel Rebar and Manufactured Sand Concrete

by
Lei Han
,
Hua Yang
,
Qifan Wu
and
Yubo Jiao
*
Key Laboratory of Urban Security and Disaster Engineering of Ministry of Education, State Key Laboratory of Bridge Engineering Safety and Resilience, Beijing University of Technology, Beijing 100124, China
*
Author to whom correspondence should be addressed.
Buildings 2025, 15(16), 2959; https://doi.org/10.3390/buildings15162959
Submission received: 21 July 2025 / Revised: 15 August 2025 / Accepted: 19 August 2025 / Published: 20 August 2025
(This article belongs to the Section Building Materials, and Repair & Renovation)

Abstract

Natural sand (NS) is facing the problem of resource scarcity, while manufactured sand (MS) has become a favorable alternative resource due to its wide range of sources, superior performance, as well as economic and environmental protection. This study adopted MS to replace NS to prepare manufactured sand concrete (MSC). The water–cement ratio, replacement rate of MS, and stone powder content were systematically investigated for the damage evolution of rebar during bond–slip with MSC. Seven groups of specimens were tested using the center pull-out test to analyze the effects of different factors on the bond–slip characteristics (bond stress–slip curve, bond fracture energy, peak stress, and peak slip). Acoustic emission (AE) monitoring was also adopted to synchronously characterize the slip damage process of reinforced MSC. The results indicate that the water–cement ratio and replacement ratio of MS present significant influences on the bond strength of reinforced MSC, in which the smaller the water–cement ratio is, the stronger the bond strength of reinforced concrete. Further, the larger the replacement rate of MS is, the stronger the bond strength of reinforced concrete. The higher the stone powder content, the higher the bond strength, but the effect is small compared to the two variables mentioned above. In terms of AE, count and energy remain at low values in the first and middle stages, followed by larger values, proving that cracks were beginning to develop within the specimen, and then a very large signal and then splitting occurred. The information entropy is relatively stable in the first and middle stages of the test, then fluctuates with the generation of cracks, and finally fluctuates violently and then the specimen splits. The AE parameters are more active with an increasing water–cement ratio, while they are smoother with increases in the replacement rate of MS and stone powder content.

1. Introduction

Ordinary concrete is a commonly used building material made of cement, water, coarse aggregate, fine aggregate, and admixtures in proportions, characterized by low cost, easy construction, and adjustable strength. Natural sand (NS) is rock particles with a particle size of less than 4.75 mm, which is widely used as fine aggregate for construction materials. The rapid development of global infrastructure and increased awareness of environmental protection have led to the depletion of natural sand resources [1,2,3], and over-exploitation has led to environmental damage. Therefore, finding sustainable alternative materials has become an urgent need. Manufactured sand (MS) refers to rock particles with a grain size of less than 4.75 mm and is produced by mechanical crushing and screening of raw materials such as rocks, pebbles, tailings, or industrial waste residues after soil removal treatment; it is characterized by irregular particles and a rough surface. Natural sand consists of naturally rounded particles with excellent workability, but its availability is limited and quality exhibits significant variability. Also, MS contains moderate amount of stone powder, which can enhance the performance of concrete [4,5]. Manufactured sand concrete (MSC) has become a research hotspot and gradually become a mainstream material due to the advantages of sufficient raw materials and green environmental protection [6]. Zhang et al. [7] studied the mechanical properties of MS. Relevant scholars evaluated the micromechanical and durability characteristics of MS [8]. However, this paper investigates the bond behavior of manufactured sand in reinforced concrete specimens.
Kavya, and Rao [9] studied the effect of manufactured sand on concrete with different ratios. It was shown that the particle morphology, grading, and stone powder content of MS significantly affects the concrete properties [10,11]. High-performance MSC can be prepared by optimizing the characteristics of MS, adjusting the proportion, and using admixtures. Shen et al. [12] studied the clean production of MS and the case of stone powder recycling. The researchers studied the effect of stone powder on the microstructure of MSC and its permeability [13]. In addition, the effect of stone powder content on the carbonation properties of MSC was also investigated to improve its durability [14]. Researchers used machine learning to optimize the design of concrete and MS ratios [15]. Meng et al. [16] investigated concrete based on MS with different percentages of NS substitution. A database of compressive strength and splitting tensile strength of MSC under multi-factors has been established [17]. Zhen et al. [18] investigated the mechanical properties of glass fiber-reinforced MSC and proposed an intrinsic model. MS has also been used for the preparation of ultra-high-performance concrete (UHPC), with the advantages of low cost and low environmental impact and for the production of reinforced concrete beams in order to study their shear fatigue behavior [19,20]. The use of MS to replace NS as a fine aggregate for the preparation of concrete not only protects environmental resources, but also effectively improves the performance of concrete, and the study of the effect of stone powder content on the performance of concrete can promote the development of MSC.
Most concrete structures need to be bonded to the rebar to achieve more efficient performance. The bond, which refers to the interaction and force transfer between rebar and concrete, directly affects the performance of concrete structures, as has been demonstrated in studies. Wang et al. [21] investigated the bond performance of high strength manufactured sand concrete (HMC) with steel rebar. Through central pull-out tests and finite element analysis, the researchers explored the bond–slip behavior of recycled sand concrete with steel bars and established an intrinsic model and a formula for calculating the critical anchorage length [22]. Jiang et al. [23] investigated the effects of fiber type, surface treatment, diameter, and anchorage length on the bond performance of Basalt Fiber-Reinforced Polymer (BFRP) rods in ultra-high-performance seawater sea-sand concrete (UHP-SSC) by pulling out the specimen. The effect of rib geometry on the bond performance between ribbed BFRP bars and seawater sea-sand concrete has been investigated [24]. Xu et al. [25] investigated the bond–slip performance and damage mechanism of pre-embedded rebars in a steel–polyvinyl–alcohol (S-PVA) hybrid fiber high-performance concrete at elevated temperatures. It was shown that a quartz sand-modified enamel (QSME) coating significantly improved the bond performance of normal rebar but reduced the bond strength of deformed rebar [26]. Amr El-Nemr et al. [27] investigated the effect of fiber type, surface configuration, rebar diameter, and concrete strength on the bond properties of fiber-reinforced polymer (FRP) bars to concrete through pull-out specimen tests. Researchers also investigated the bond strength of glass FRP (GFRP) bars to sea-sand concrete (SSC), as affected by the embedment length, polyethylene fiber volume fraction, and concrete strength through pull-out tests [28]. The bond behavior of highly ductile fiber-reinforced concrete (HDC) with deformed steel bars under repeated and post-repeated monotonic loading has been investigated [29]. Through the testing of 98 specimens, researchers found that corrosion and high temperatures significantly reduced the bond strength and concrete compressive strength [30]. Hua et al. [31] explored the bond performance of bimetallic steel bar (BSB) with seawater sea-sand concrete (SWSSC). In addition, studies have been conducted to investigate the bond properties of reinforcement and concrete in reinforced concrete structures at medium and high temperatures through experimental and theoretical analyses [32]. Researchers investigated the bond behavior of reinforced concrete structures under different cooling methods based on pull-out tests [33]. Huang et al. [34] predicted the high temperature bond strength of corroded reinforced concrete. Nowadays, in the research on the bonding properties of concrete and steel rebar, there are limited studies on MSC. This study investigates the effects of multiple variables on the interfacial bond behavior between manufactured sand concrete and steel rebar. As a simple concrete material with the advantages of being easy to obtain, easy to construct, and having a low cost, it is crucial to clarify its bonding properties with steel rebar, which is of great importance to promote the development of MSC.
Acoustic emission (AE) is widely used for damage monitoring of reinforced concrete (RC) structures to assess concrete damage, crack extension, and bond performance in real time by capturing elastic wave signals. It can identify microcracks, localize cracks, and assess the structural health status. Li et al. [35] proposed a correction method for AE-based concrete damage assessment. A related study validated the application of AE in locating and characterizing chloride corrosion damage using micro-CT [36]. Antoine Boniface et al. [37] investigated the application of AE in concrete damage detection and localization. It was shown that the crack width affects the localization accuracy of the ultrasonic source, but the error decreases significantly as the crack heals [38]. Li et al. [39] experimentally explored the AE behavior of concrete of different strengths under uniaxial compression. However, there is a lack of research on the systematic characterization of the bonding properties of concrete to steel reinforcement using AE techniques. The use of AE techniques to analyze the fracture process occurring in MSC will promote the application of AE in bond performance assessment.
This paper analyzed the bonding properties of MSC to steel rebar by means of center pull-out tests on plain reinforced concrete, combined with an AE device. In this study, the water–cement ratio (0.41, 0.44, 0.47), replacement rate of MS (0%, 50%, 100%), and stone powder content (0%, 5%, 10%) were considered, and twenty-one specimens for seven groups were fabricated. The bond stress–slip curves, bond fracture energy, peak bond stress, and peak slip of reinforcement and MSC under three factors were systematically analyzed by the center pull-out test. Based on the AE parameters (counts, information entropy, and energy), the bond fracture damage process of steel bars with MSC under three factors was characterized according to corresponding variations.

2. Test Program

2.1. Materials

2.1.1. MSC

MSC is a composite material consisting of cement, MS, NS, stone powder (SP), gravel, water, and water reducing agents. The chemical composition of cement is shown in Table 1. The grading curves of MS and NS are shown in Figure 1. Stone powder is a kind of fine particle by-product produced in the production process of MS, which is mainly composed of tiny particles with a particle size less than 0.075 mm after rock crushing. The morphology of the MSC raw material is shown in Figure 2.

2.1.2. Steel Rebar

In the pull-out tests, all the HRB400 steel rebar with a diameter of 20 mm was used. The properties of steel rebar are shown in Table 2.
Table 2. Properties of HRB400 steel rebar.
Performance IndicatorsNumerical or Descriptive
Rebar gradeHRB400
StandardGB/T 1499.2-2018 [40]
Yielding strength≥400 MPa
Tensile strength≥540 MPa
Elongation rate≥16%
Bending propertiesBend 180° without cracks
WeldabilityGood welding properties

2.2. Specimen Setting

2.2.1. Specimen Details

There were seven groups in the experiment. Each group has three cubic specimens (150 mm), and the average value is taken to represent the final result. The steel rebar is embedded in a fully embedded manner, i.e., bond length of 150 mm. A schematic diagram of the pull-out specimens is shown in Figure 3.

2.2.2. Proportion of Mixes

The water–cement ratio (0.41, 0.44, 0.47), replacement rate of MS (0%, 50%, 100%), and the stone powder content (0%, 5%, 10%) were considered. Corresponding proportions were illustrated in Table 3.

2.2.3. Specimen Preparation

The mixing and preparation of MSC was carried out in accordance with the standard GB/T 50080-2016 [41]. Before mixing, the mixer was pretreated using mortar with the same water–cement ratio. Subsequently, weighed coarse aggregate, fine aggregate, cement, and water were added in sequence and mixed for 5 min. After mixing, the mixture was poured into the mold. The demolded specimens were placed in a curing room at a temperature of 20 degrees Celsius and 95% relative humidity and cured for 28 days according to standard curing conditions. Cubic specimens with dimensions of 150 × 150 × 150 mm were used for the center pull-out test.

2.3. Test Methods

2.3.1. Center Pull-Out Test

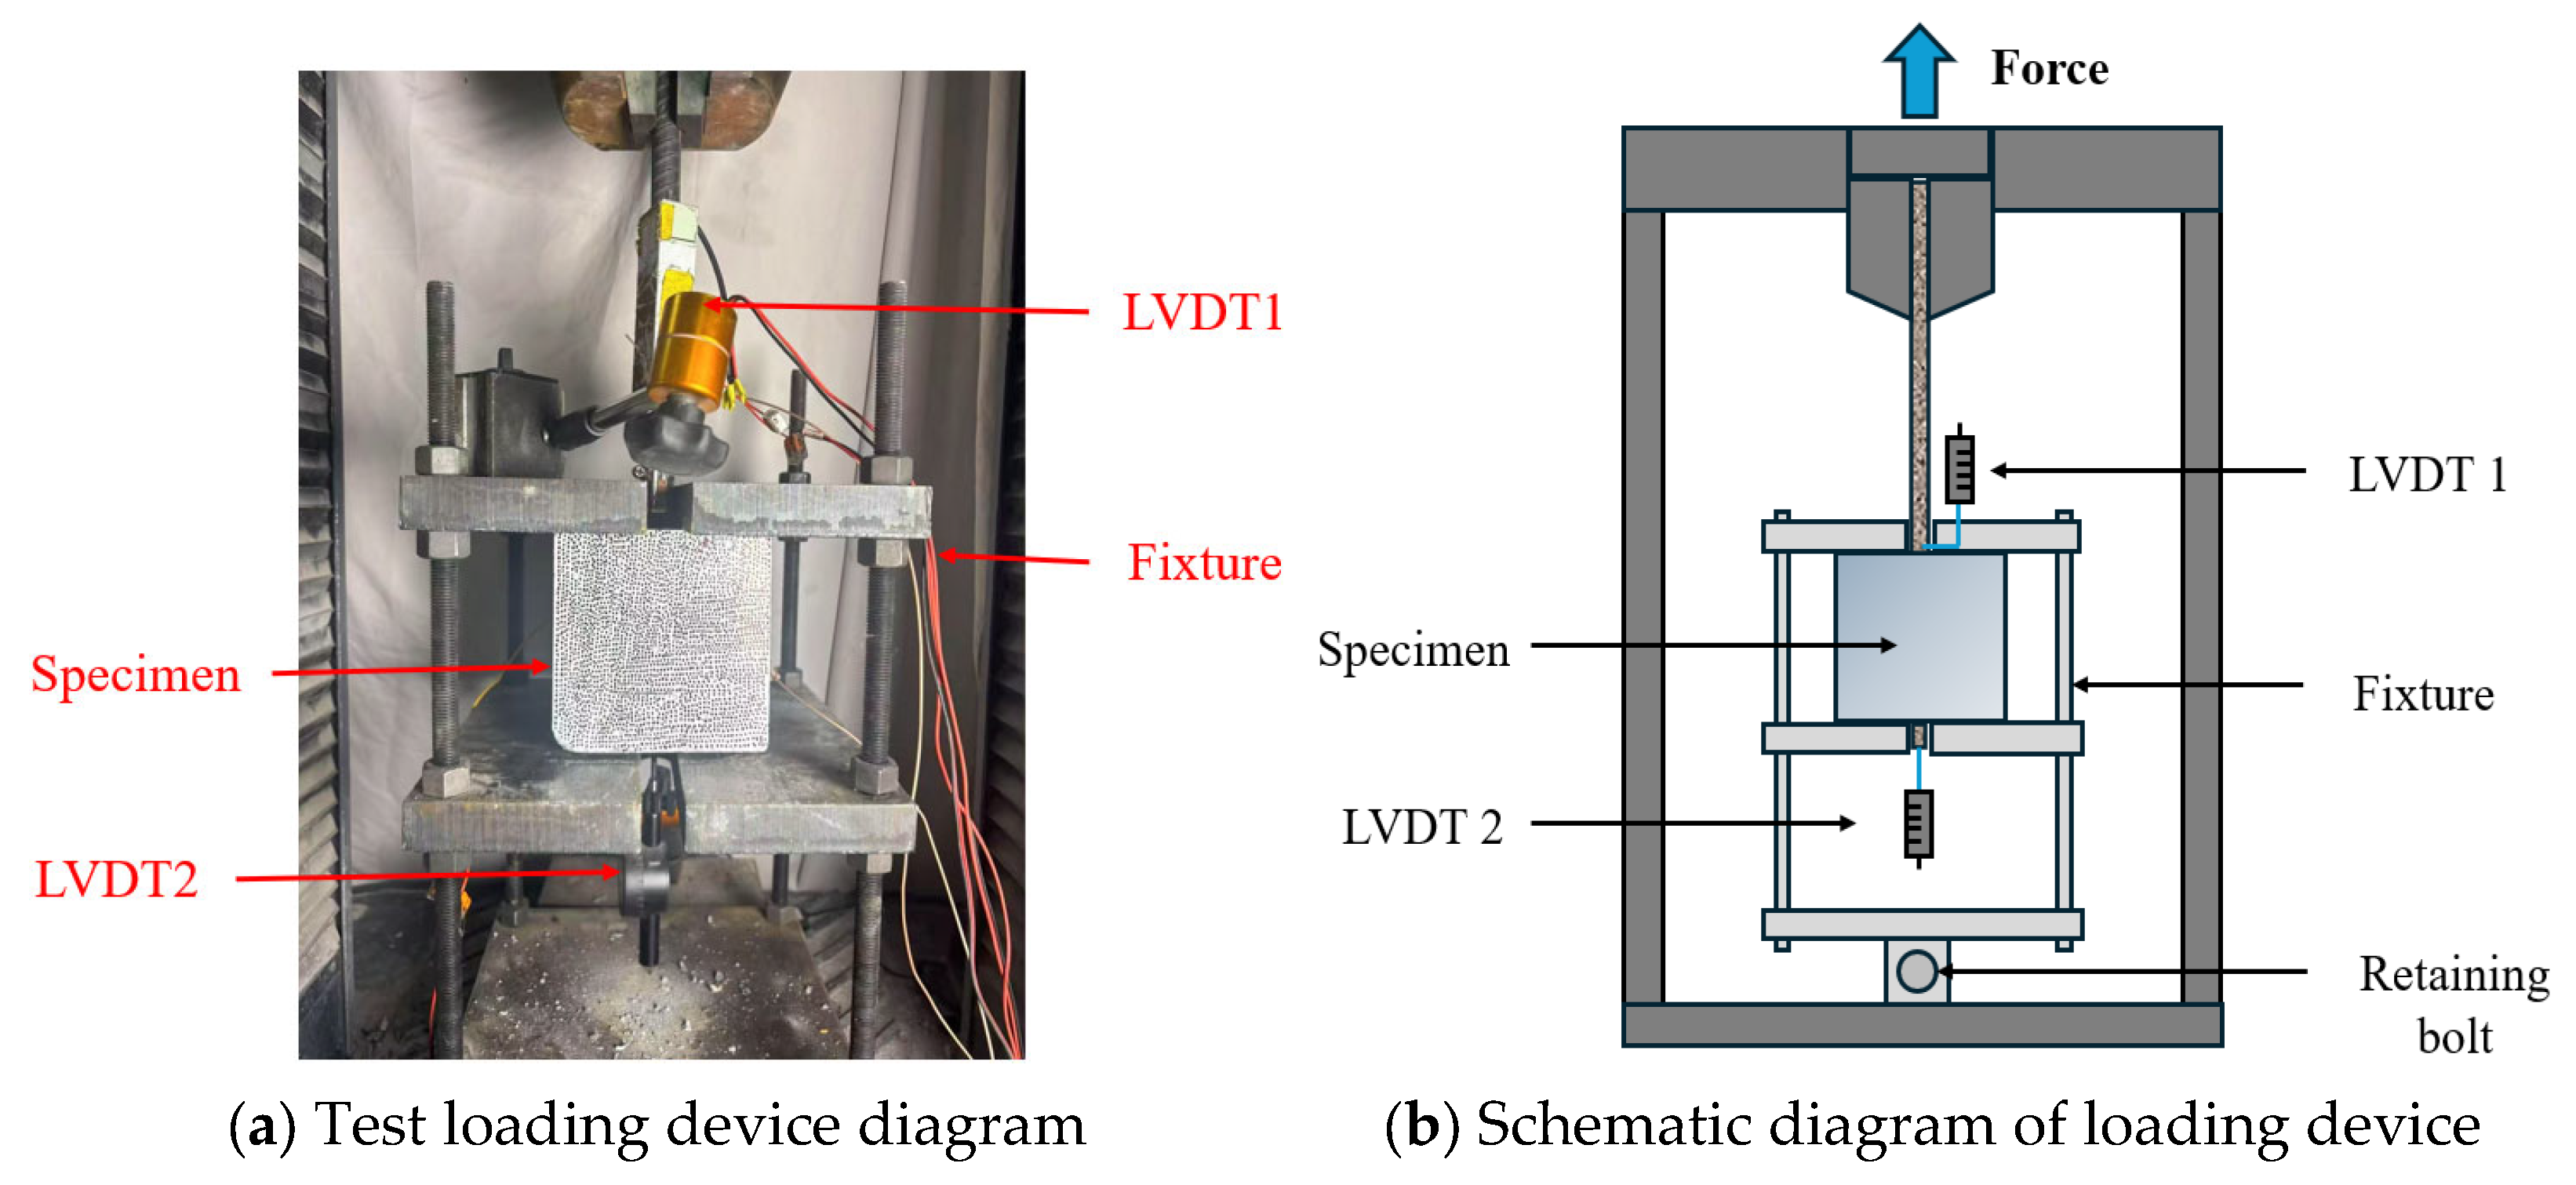
The device used for the center pull-out test was a 1000 kN universal testing machine. Since reinforced concrete specimens cannot be placed directly on the universal testing machine for pull-out, a specific fixture was made. For this test, a displacement transducer was set up at the loading end (LVDT1) and the free end (LVDT2) of the specimen to measure the displacement “ δ L ” at the loading end and “ δ F ” at the free end. The diagram of the test loading device is shown in Figure 4.
The center pull-out test process is as follows: (1) The bearing surface is flat. Due to the experimental conditions, there is unevenness on the bearing surface of the specimen after casting. In order to ensure the accuracy of the test results, this test uses an angle grinder to polish the protruding part of the specimen surface, so that it reaches a flat state. (2) The specimen is pre-loaded to make the specimen and the fixture close together. (3) After pre-loading is completed, formal loading can begin. According to the performance of the test machine and reference to the research results of other scholars, this test adopts the displacement control mode to set the loading speed, and the loading rate selected for this test is 0.5 mm/min.
The bond stress is the average bond stress over the range of bond lengths, i.e., the pull-out load divided by the bond area between reinforcement and concrete is calculated according to Equation (1).
τ = F π d b l b ,
where F is the pull-out load collected by the testing machine (kN); db is the diameter of the bar (mm); and lb is the bond length (mm).
The slip of the reinforcement is the relative displacement of the steel rebar with respect to the concrete and is calculated by Equation (2).
S = δ F δ L ,
where δ L is the displacement gauge reading at the loaded (upper) end of the steel rebar; δ F is the displacement gauge reading at the free (lower) end of the steel rebar.
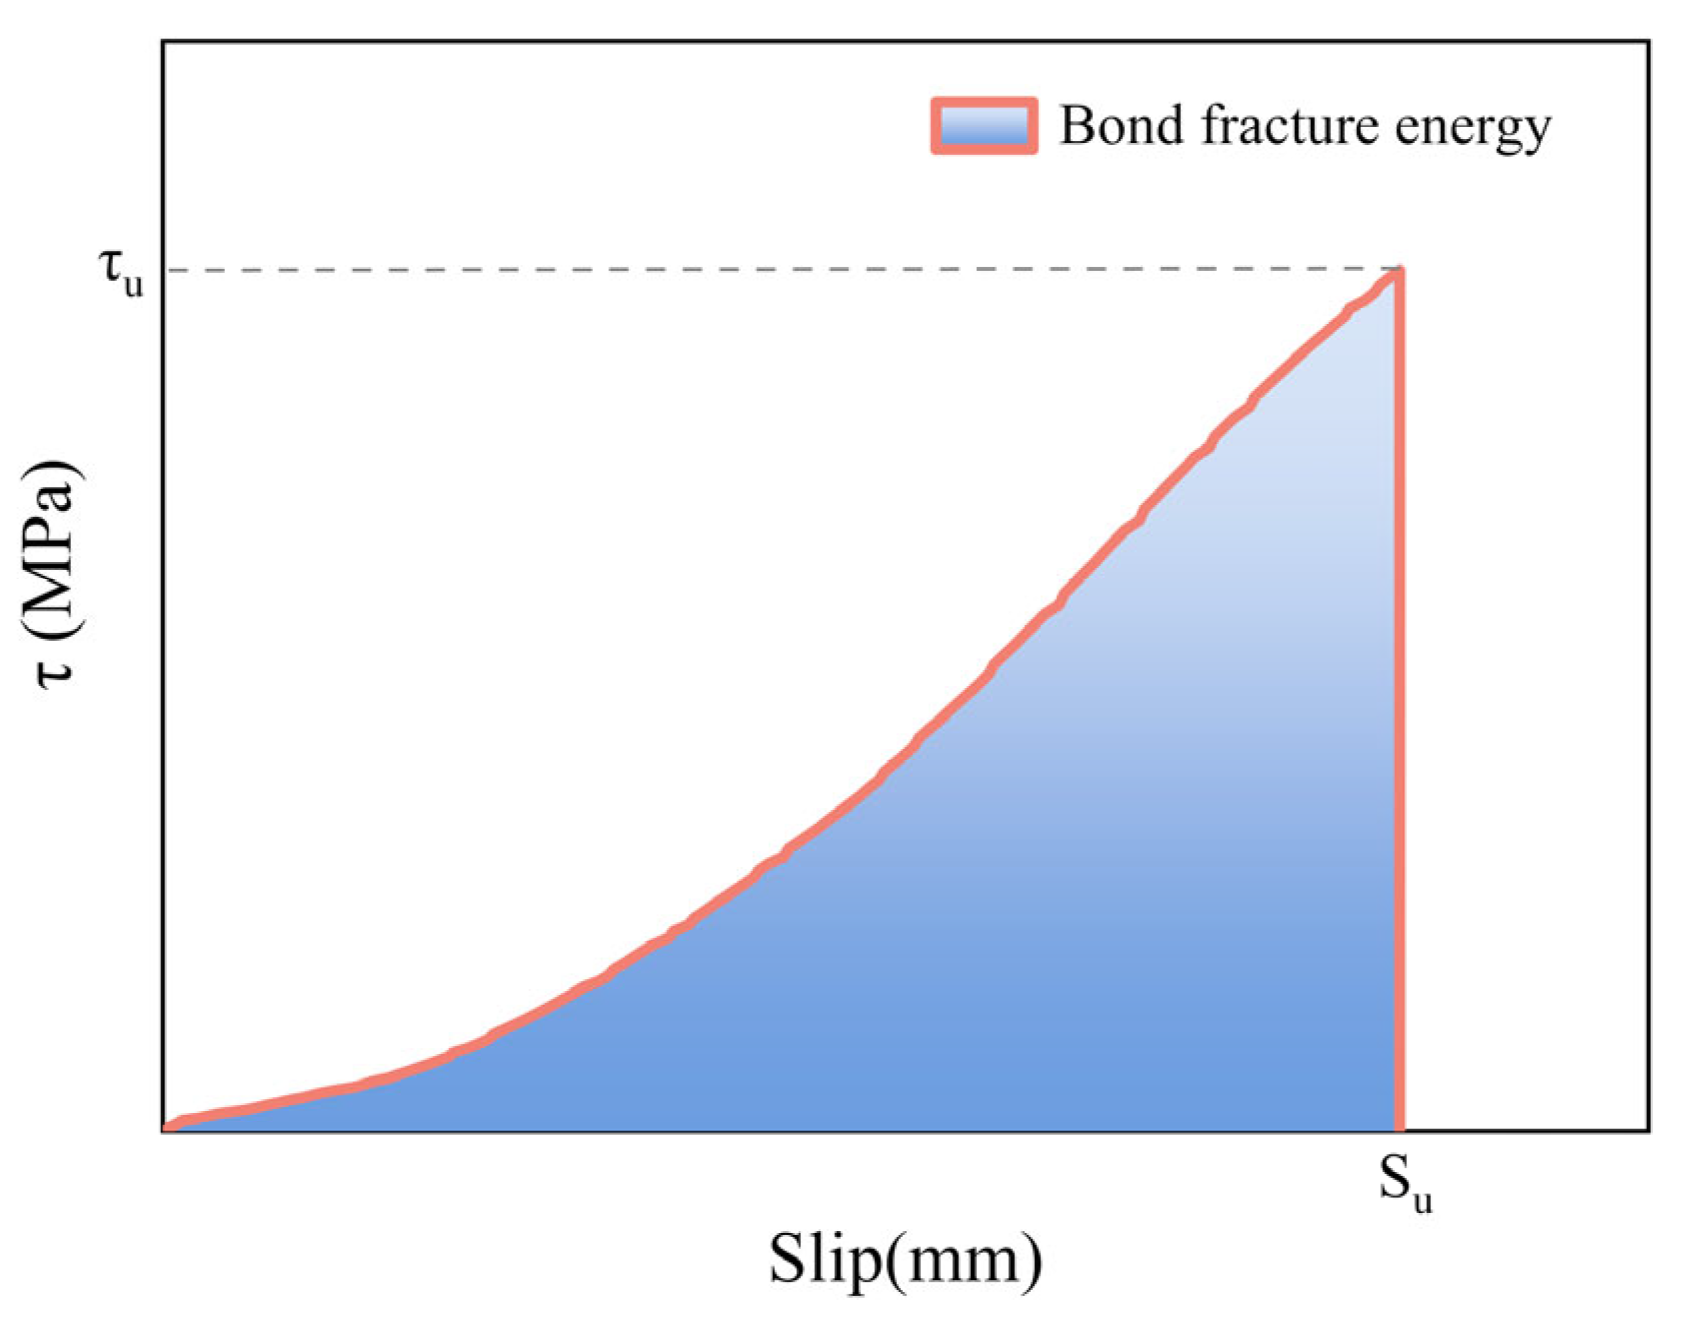
The physical significance of the area of the bond stress–slip curve is the bond fracture energy, as shown in Figure 5. The bond breaking energy represents the energy consumed from the beginning of slip to complete debonding of the reinforcement and concrete per unit bond area. In the test, usually only discrete data points (τ-S) can be obtained; at this time, it is necessary to calculate the area of the curve through the numerical integration method. The method used in this paper is the trapezoidal method, and the principle is to approximate the curve segments between neighboring data points as a straight line, and the trapezoidal area is used to approximate the integral value by adding up the trapezoidal area. The specific method is as follows:
For n + 1 data points (S0, τ0), (S1, τ1), ..., (Sn, τn), the area is calculated by Equation (3).
A = i = 1 n ( τ i 1 + τ i ) 2 ( S i S i 1 )
Figure 5. Schematic area diagram of bond–slip curves.
Buildings 15 02959 g005

2.3.2. AE Test

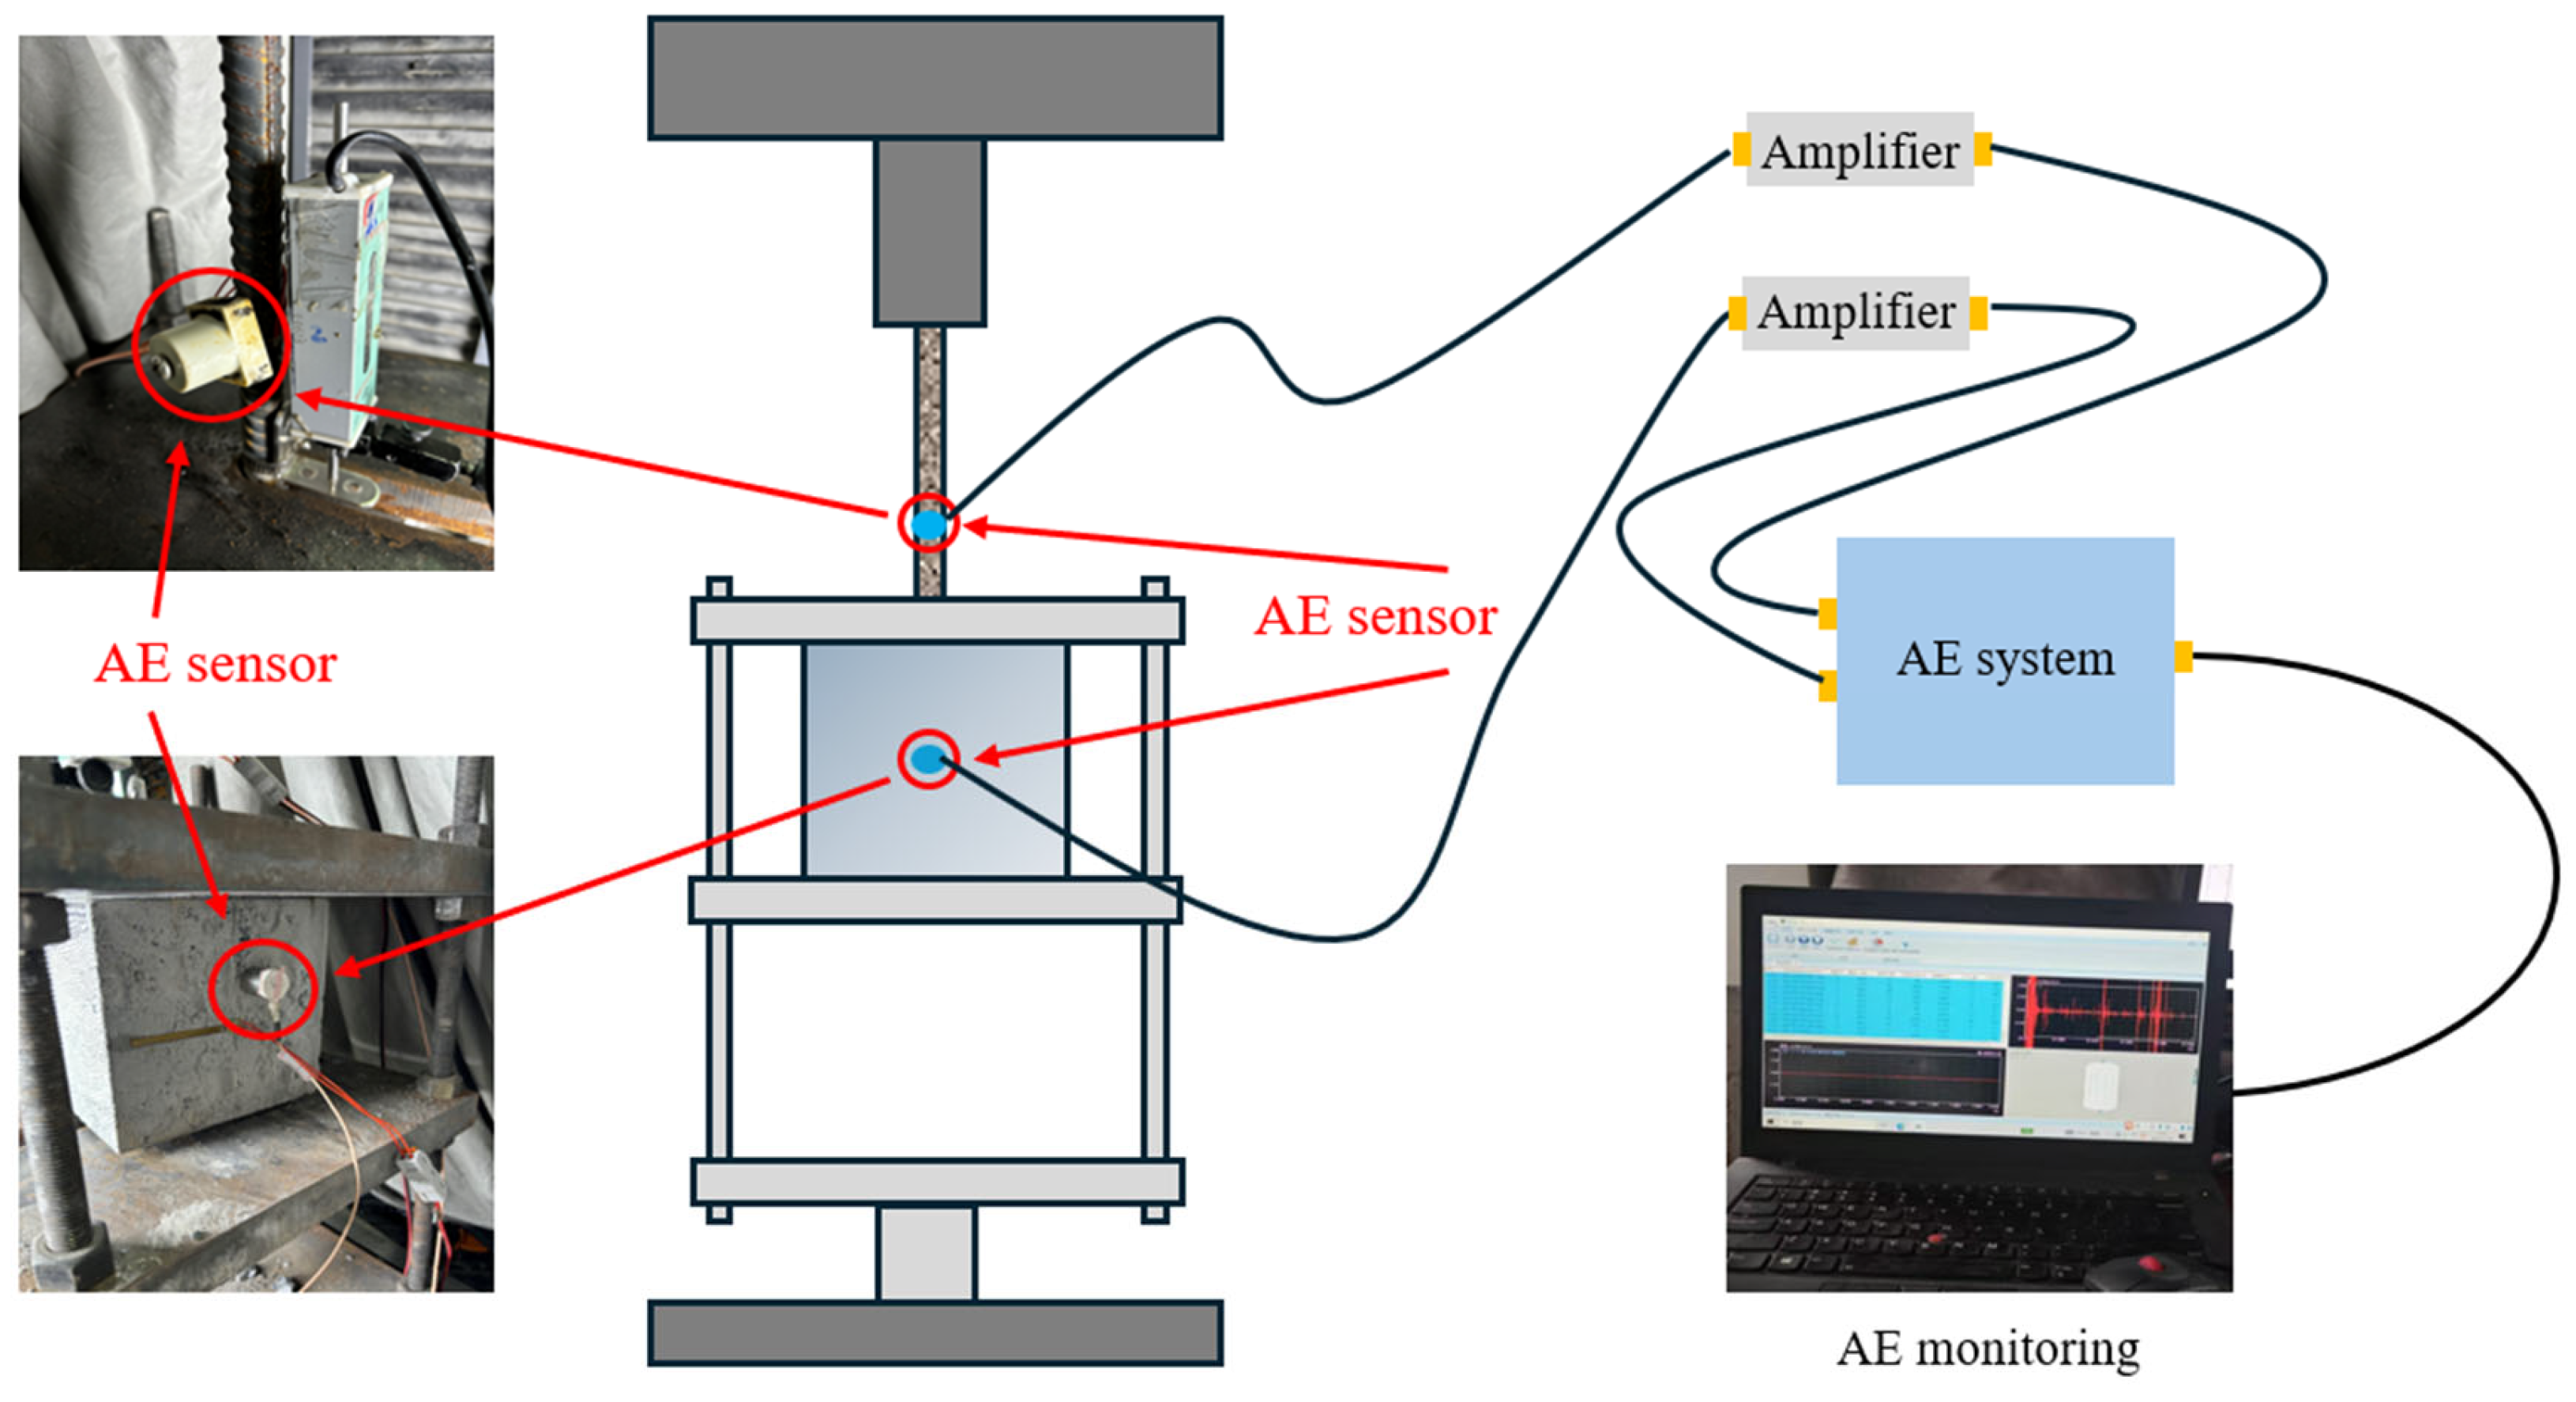
AE is a non-destructive testing technique that monitors damage and crack extension within a material in real time by capturing the elastic wave signals released when the material is stressed. AE signal acquisition was carried out in the center pull-out test. The AE acquisition device is shown in Figure 6. The sensors were placed on the surface of the concrete and steel rebar, respectively, and connected to the acquisition device through an amplifier. However, during the acoustic emission signal acquisition process of the test, the acoustic emission amplifier will capture part of the noise, and the subsequent processing of the acoustic emission data needs to remove the noise, i.e., filtering needs to occur. The threshold for the acquisition system is 45 dB.
The count is the number of oscillations of an acoustic emission signal waveform above a preset threshold, reflecting the frequency of the event.
Information entropy is a statistical tool used to quantify signal complexity and uncertainty, which is often used to analyze the AE signal characteristics of the material damage process. Information entropy is calculated by using Equation (4).
H ( X ) = i = 1 n p ( x i ) log p ( x i ) ,
where p ( x i ) is the probability of an event xi occurring in a signal (e.g., the probability of a distribution of magnitude, energy, or frequency).
Energy is the total energy carried by the signal pulse during an acoustic emission event and is used to quantify the intensity of the acoustic emission activity or the magnitude of the energy release.

3. Results and Analysis

3.1. Destruction Mode

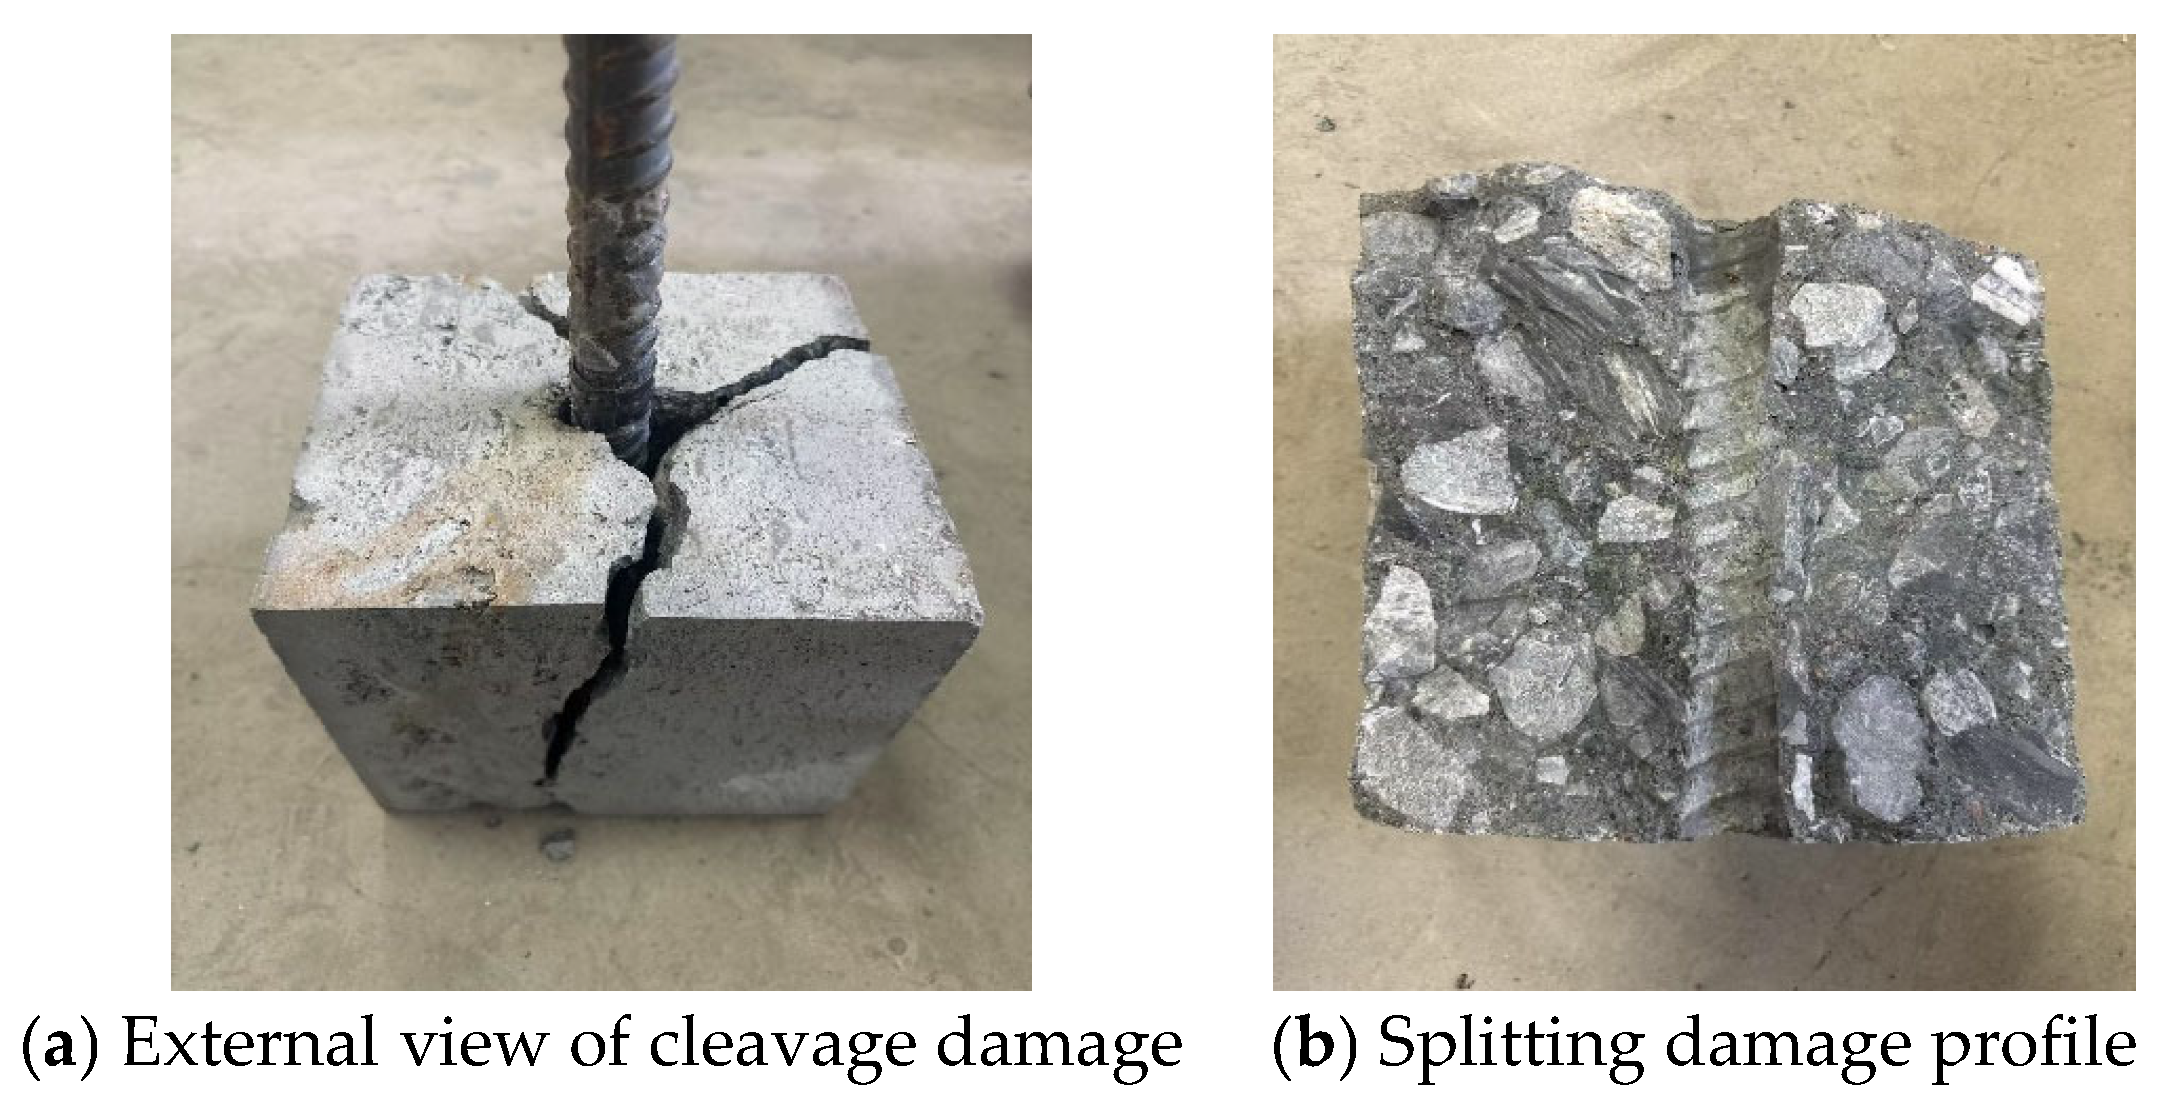
In the pull-out experiments in this paper, there is only one damage mode for the steel bar and MSC, which is splitting damage. The specimen splitting damage is shown in Figure 7. Existing studies have conducted basic mechanical analyses of concrete splitting failure [42], while this paper focuses on the specific effects of three variables.

3.2. Bond Strength Analysis of Rebar with MSCs

3.2.1. Bond Stress–Slip Curve Analysis

The bond stress–slip curve of the reinforcement and MSC is mainly divided into two stages, as shown in Figure 8a. The first stage is the rising section; the curve in this section rises approximately linearly with a steep slope, reflecting the rapid increase in bond stress with slip. The bond stress reaches the peak bond stress τu, and the bar slip is S1, which is a combination of the chemical bond and mechanical occlusion force between the steel bar and concrete. The second stage is the descending section, which has a sudden drop in curve stress and a slight increase in slip to reach the peak slip Su, which is characterized by brittle fracture, with almost zero residual stress, and the splitting crack runs through the specimen at this stage, with an instantaneous loss of bonding capacity. Figure 8b shows the bond stress–slip curves of each group of specimens in this test and Figure 8c shows the bond stress–slip curve in the ideal case. It can be seen that with the increase in bond stress, the slip also increases, that is, the rising section of the bond stress–slip curve. Finally, when the bond stress increases to the peak bond stress, the bond stress plummets to 0, and at this time, the slip of the reinforcement increases slightly to reach the peak slip. The bond–slip curves derived from the results of this test basically coincide with the Eligehausen bond–slip curves [43]. The difference is that in this test, after the bond stress in the reinforced concrete specimen reaches the maximum value, the specimen undergoes splitting damage, and its bond stress rapidly decreases to 0.

3.2.2. Peak Bond Stress and Peak Slip Analysis

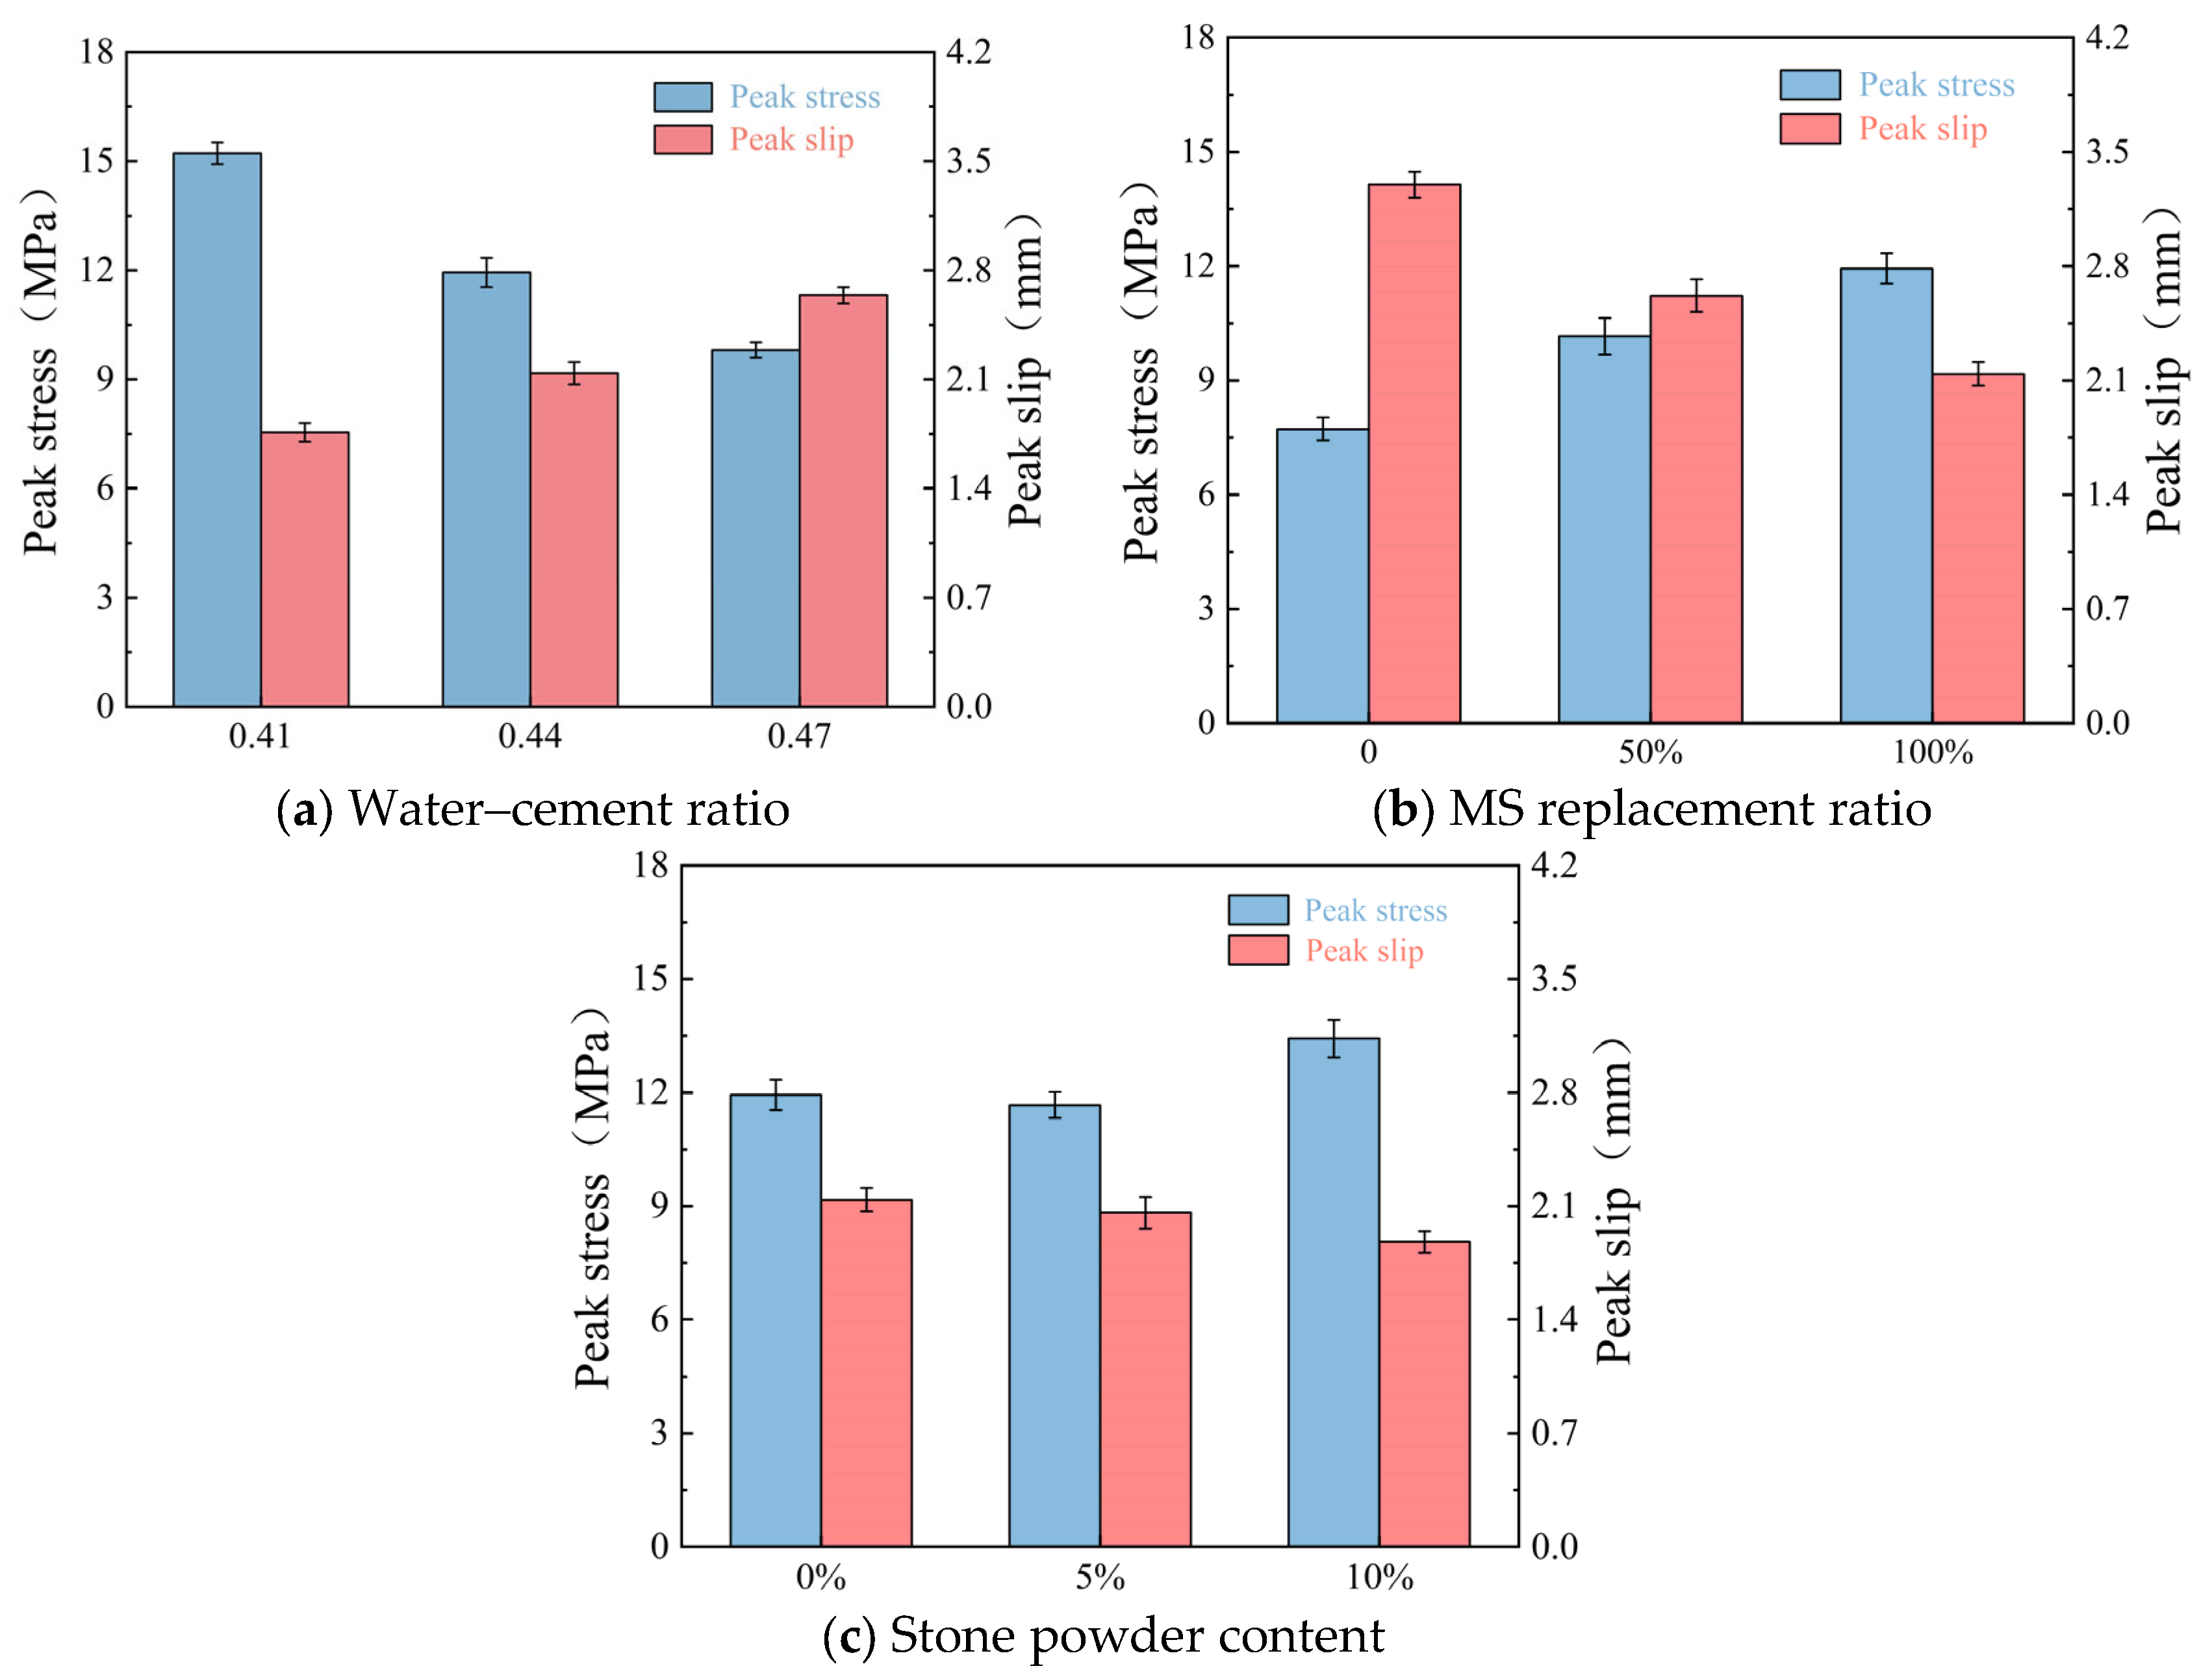
Figure 9 illustrates the effects of the water–cement ratio, MS replacement ratio, and stone powder content on peak bond stresses and peak slip for each group of specimens. For the peak bond stress, when the water–cement ratio decreases from 0.41 to 0.44 and then from 0.44 to 0.47, the peak bond stress of the reinforced concrete decreases from 15.22 MPa to 11.94 MPa to 9.71 MPa, with decreases of 21.55% and 18.68%. And when the replacement rate of the MS increases from 0% to 50% and then to 100%, the peak bond stress increased from 7.72 MPa to 9.86 MPa to 11.94 MPa, with an increase of 27.72% and 21.10%. When the stone powder content increased from 0% to 5% and then to 10%, the peak bond stress of reinforced concrete increased from 11.93 MPa to 12.19 MPa to 13.43 MPa, with an increase of 2.18% and 10.17%.
For the peak slip of steel rebar, when the water–cement ratio decreases from 0.41 to 0.44 and then from 0.44 to 0.47, the peak slip of steel rebar increases from 1.76 mm to 2.14 mm to 2.56 mm, with an increase of 21.59% and 19.63%. The replacement rate of MS increases from 0% to 50% and then to 100%, and the peak slip of steel rebar decreases from 2.77 mm to 2.54 mm and then to 2.14 mm, with decreases of 8.30% and 15.75%. When the stone powder content was increased from 0% to 5% and then to 10%, the peak slip of steel rebar decreased from 2.14 mm to 2.08 mm and then to 1.91 mm, with decreases of 2.81% and 7.28%.
Therefore, it can be concluded that as the water–cement ratio decreases from 0.47 to 0.41, the peak bond stress between the steel rebar and the MSC increases, and the peak slip of the steel rebar decreases. Further, the bond strength of the steel rebar and the MSC increases. As the replacement rate of MS increases from 0% to 100%, the peak bond stress between the steel rebar and the MSC increases, the peak slip of the rebar decreases, and the bond strength of the steel rebar and the MSC increases. The bond strength of reinforcement and MSC increases. With the increase in stone powder content from 0% to 10%, the peak bond stress of the steel rebar to MSC increases, the peak slip of the steel rebar decreases, and the bond strength of the steel rebar to MSC increases. However, in terms of the increase in the three variables, the water–cement ratio and the replacement rate of MS had a greater effect on the steel rebar–MSC bond strength, and the stone powder content had a smaller effect on the steel rebar–MSC bond strength.

3.2.3. Bond Fracture Energy Analysis

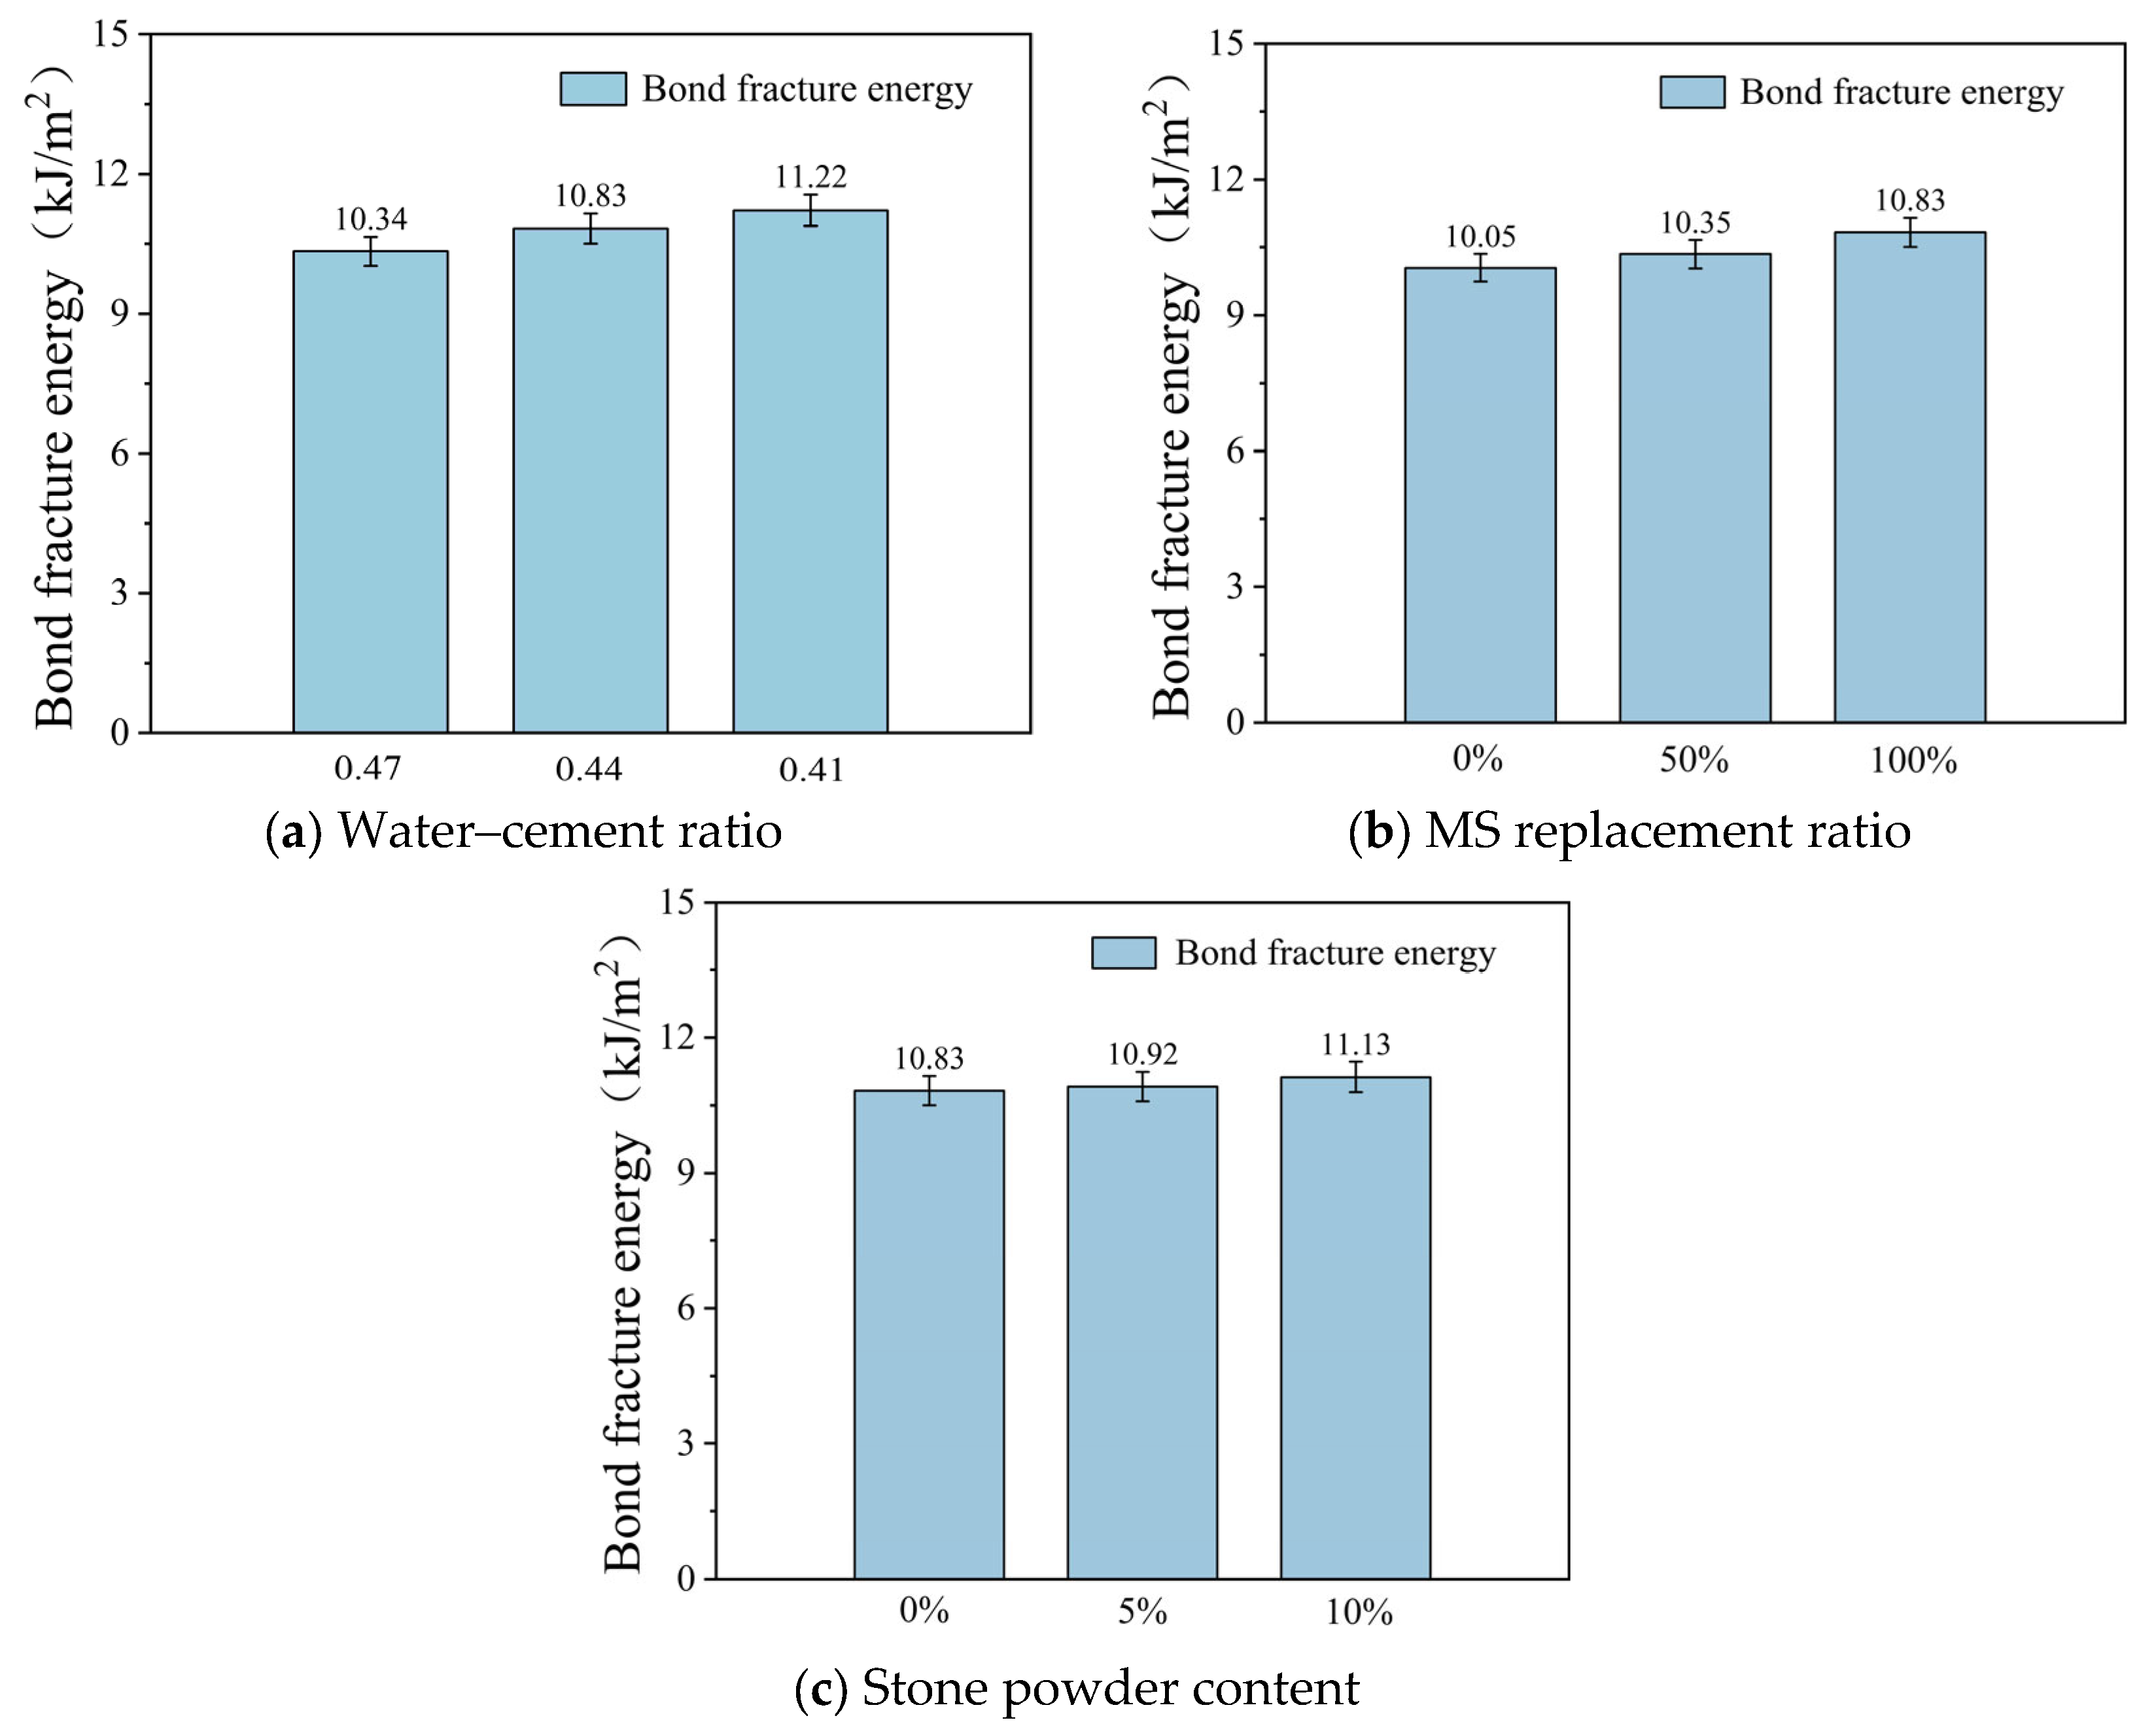
The variations in bond fracture energy between rebar and MSC are demonstrated in Figure 10. Among them, when the water–cement ratio was reduced from 0.47 to 0.44, the bond fracture energy increased from 10.34 kJ/m2 to 10.83 kJ/m2, with an increase of 9.67%. When the water–cement ratio continued to be reduced from 0.44 to 0.41, the bond fracture energy increased from 10.83 kJ/m2 to 11.22 kJ/m2, with an increase of 3.61%. The two increases in the water–cement ratio both resulted in a significant increase in the bond fracture energy, and the bond fracture energy between reinforced concrete was the largest and the bond performance was the strongest when the water–cement ratio was 0.41. This trend aligns with studies on cementitious composites [44], where lower w/c ratios enhance density and interfacial bonding, thereby improving fracture energy.
In addition, when the replacement rate of MS was increased from 0% to 50%, the bond fracture energy increased from 10.05 kJ/m2 to 10.35 kJ/m2, with an increase of 2.99%. When the replacement rate of MS continued to be increased from 50% to 100%, the bond fracture energy increased from 10.35 kJ/m2 to 10.83 kJ/m2, with an increase of 4.64%. The two times of increase in the replacement rate of MS all resulted in a significant increase in bond fracture energy. Both increases in the replacement rate of MS have resulted in a significant increase in the bond fracture energy, and the bond fracture energy between reinforced concrete is the largest and the bond performance is the strongest when the replacement rate of MS is 100%. This trend matches research by Zhang & Islam [45], who found that a higher MS content refines the interfacial transition zone (ITZ) through pozzolanic activity and filler effects. However, the nonlinear improvement suggests that MS agglomeration may partially offset its benefits at higher replacement levels, as noted in studies on steel-fiber-reinforced lightweight materials.
Finally, when the stone powder content was increased from 0% to 5%, the bond fracture energy increased from 10.83 kJ/m2 to 10.92 kJ/m2, with an increase of 0.83%. When the stone powder content was increased from 5% to 10%, the bond fracture energy increased from 10.92 kJ/m2 to 11.13 kJ/m2, with an increase of 1.92%. However, the increase in fracture energy is significantly lower than the increase in stress due to stress concentration and brittle fracture (strain drop) caused by the filler particles. The two increases in stone powder content all make the bond fracture energy increase, but the increase is small; the stone powder content is 10% when the bond fracture energy between the reinforced concrete is the largest, and the bond performance is also the strongest.
Zhou et al. [13] suggested that appropriate stone powder can reduce the heat of hydration, increase the hydration products, improve the filling effect, and reduce the permeability, which can be used as a reference principle for the present results. Based on the above analysis, it can be concluded that the water–cement ratio and the replacement rate of MS have a greater influence on the bonding performance between steel rebar and MSC, while the stone powder content has a smaller influence on the bonding performance between steel rebar and MSC.

3.3. MSC Damage Analysis Based on Acoustic Emission Parameters

Zhou et al. used AE monitoring in a four-point bending test of concrete beams [46]; another study used AE monitoring in a uniaxial compression test of concrete cylinders [47]. In this paper, we used acoustic emission monitoring in a center pull-out test of reinforced concrete to analyze the development of concrete cracks during the bond failure process between the reinforcing bars and the concrete.

3.3.1. Acoustic Emission Counting and Information Entropy Analysis

(1)
MSC with different water–cement ratios
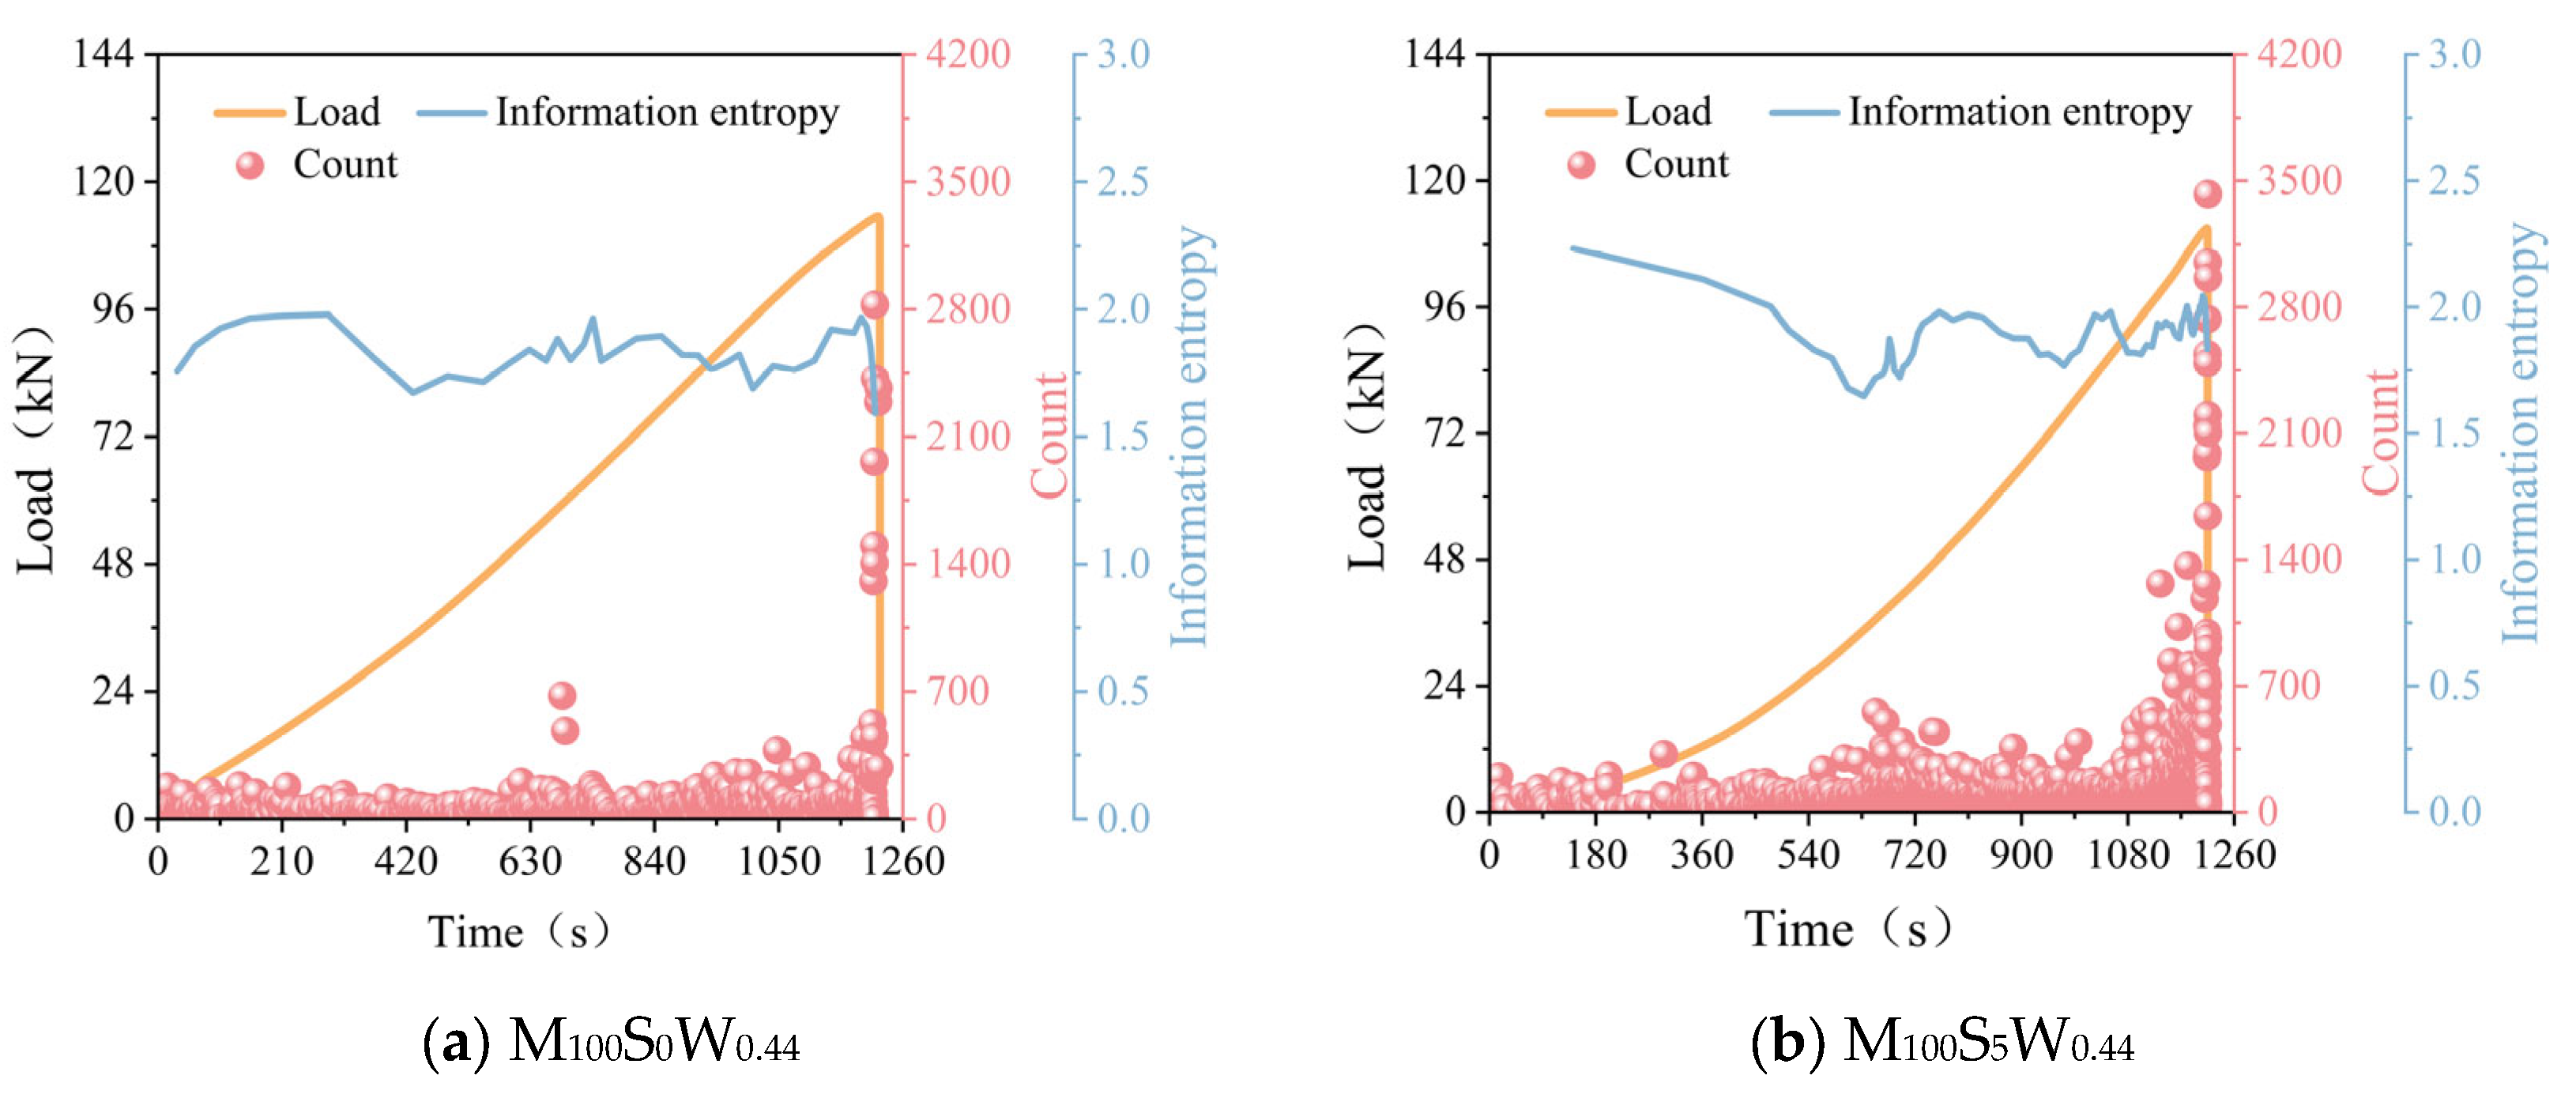
Figure 11 exhibits the count and information entropy of MSC specimens with different water–cement ratios. The count of M100S0W0.41 was kept at a low level during the period of 0–1250 s, and there was no obvious crack inside the MSC. The count increased during the period of 1250–1750 s, and cracks started to appear inside the MSC at this time. Finally, the count was extremely high during the period of 1750–1850 s, reaching the highest value, and then the MSC underwent splitting and damage. The count of M100S0W0.44 was kept at a low level during the period of 0–740 s, and there was no obvious crack inside the MSC. During the period of 740–1130 s, the count was increased, and the crack inside the MSC started to appear. Finally, during the period of 1130–1230 s, the count was very high and reached the highest value, and the MSC underwent splitting damage at this time. The count of M100S0W0.47 was kept at a low level during the period of 0–650 s, and no obvious cracks appeared in the MSC. The count increased during the period of 650–1000 s, and cracks began to appear in the MSC. And finally, the count was very high during the period of 1000–1100 s, reaching the highest value, and then the MSC underwent splitting damage.
The information entropy of M100S0W0.41 was relatively smooth, without obvious fluctuation during 0–1250 s. And within 1250–1750 s, there was a violent fluctuation, at which time a crack was produced inside the MSC. Finally, within 1750–1850 s, violent fluctuation occurred again, at which time the MSC underwent splitting damage. The information entropy of M100S0W0.44 was relatively stable, without obvious fluctuations during 0–740 s. And then there were violent fluctuations during 740–1130 s, at which time cracks were produced inside the MSC. Finally, violent fluctuations occurred again during 1130–1230 s, at which time the MSC was damaged by cleavage. The information entropy of M100S0W0.47 was relatively stable without obvious fluctuation during 0–650 s. And within 650–1000 s, violent fluctuation appeared, and at this time, cracks were generated within MSC. Finally, within 1000–1100 s, violent fluctuation appeared again, and at this time, splitting damage occurred in MSC.
Quantitative analysis based on the experimental data shows that the acoustic emission parameters of MSC specimens with different water–cement ratios exhibit regular threshold characteristics. In the initial stabilization stage, the AE counting thresholds increased with the increase in water–cement ratio, which were lower than 50, 80, and 100 counts/s for W0.41, W0.44, and W0.47 specimens, respectively, and the corresponding information entropy values were stabilized in the ranges of 1.5 ± 0.1, 1.6 ± 0.15, and 1.7 ± 0.2, respectively. After entering the crack development stage, the counting growth rates showed significant differences, with W0.41, W0.44, and W0.47 specimens reaching 0.3, 1.33, and 2 counts/s2, respectively, while the information entropy fluctuation amplitude ΔH was more than 0.5, 0.7, and 1.0, respectively. The counting peaks for each specimen in the damage stage exceeded 800, 1000, and 1200 counts/s in turn. Based on this, it is recommended to establish a three-level warning mechanism: Primary warning (counts > 100 counts/s and ΔH > 0.3) corresponds to crack initiation. Intermediate warning (counts > 300 counts/s and ΔH > 0.8) signifies crack expansion. And emergency warning (counts > 800 counts/s and H > 2.0) predicts approaching damage.
(2)
MSC with different replacement rates of MS
The count and information entropy of MSC specimens with different MS replacement rates are illustrated in Figure 12. The count of M0S0W0.44 remains at a low level during 0–450 s, and there was no obvious crack inside the MSC. The count increased during 450–690 s, and cracks started to appear inside the MSC at this time. And finally, a very high count occurred and reached the highest value during 690–790 s, and then the MSC underwent splitting damage. The count of M50S0W0.44 was kept at a low level during 0–500 s, and no obvious cracks appeared in the MSC. The count increased during 500–890 s, and cracks began to appear in the MSC. Finally, the count appeared at a very high level during 890–990s and reached the highest value, and then the MSC underwent splitting damage. The count of M100S0W0.44 was kept at a low level during 0–750 s, and there was no obvious crack inside the MSC. The count increased during 750–1120 s, and cracks started to appear inside the MSC. Finally, the count was extremely high during 1120–1220 s, reaching the highest value, and splitting damage occurred in the MSC.
The information entropy of M0S0W0.44 was relatively smooth, without obvious fluctuation during 0–450 s. And there was a violent fluctuation during 450–690 s, at which time a crack was generated inside the MSC. Finally, there was a violent fluctuation again during 690–790 s, at which time the MSC was damaged by splitting. The information entropy of M50S0W0.44 was relatively smooth without obvious fluctuation during 0–500 s. And there was a sharp fluctuation during 500–890 s, when cracks were generated inside the MSC. Finally, there was a sharp fluctuation during 890–990 s, when the MSC was split and damaged. The information entropy of M100S0W0.44 with a 100% MS replacement rate was relatively smooth, without obvious fluctuation during 0–750 s. And within 750–1120 s, there was a violent fluctuation, at which time a crack was generated inside the MSC. Finally, within 1120–1220 s, there was a violent fluctuation again, at which time the MSC underwent cleavage damage.
Quantitative analysis based on the experimental data showed that MSC specimens with different MS replacement rates exhibited significant AE parameter threshold characteristics during the damage process. For the baseline specimens without adding MS (M0S0W0.44), the AE counts in the initial stabilization phase (0–450 s) were maintained below 50 counts/s, and the information entropy values were stabilized in the range of 1.5 ± 0.1; when the MS replacement rate was increased to 50% (M50S0W0.44) and 100% (M100S0W0.44), the stabilization phases were extended, respectively. During the crack development stage, the counting growth rate of the three groups of specimens shows significant differences: the baseline specimens reach a growth rate of 1.0 counts/s2 during 450–690 s, the 50% replacement rate of specimens reach a growth rate of 1.0 counts/s2 during 500–890 s, and the 50% replacement rate of specimens reach a growth rate of 1.0 counts/s2 during 500–890 s. The growth rate of the baseline specimens reaches a growth rate of 1.0 counts/s2 during 500–890 s. The growth rate of the baseline specimens reaches 1.0 counts/s2 during 500–890 s, and the growth rate of the 50% replacement rate specimens reaches 1.0 counts/s2 during 500–890 s, while the 100% replacement rate specimens were only 0.6 counts/s2 during 750–1120s, suggesting that the doping of MS significantly suppressed the crack extension rate. The parameter mutation thresholds in the damage stage also increased with the MS replacement rate: the baseline specimens showed a peak count of >800 counts/s and an entropy mutation of >2.0 at 690–790 s, while the 100% replacement rate of specimens reached a more drastic mutation of >1200 counts/s and >2.5 only at 1120–1220 s. Based on this, a three-level warning mechanism can be established: Primary warning (counts > 80 counts/s and ΔH > 0.4) corresponds to crack initiation. Intermediate warning (counts > 400 counts/s and ΔH > 1.2) signifies stable extension. And emergency warning (counts > 1000 counts/s and ΔH > 2.3) predicts critical damage. Notably, for every 10% increase in MS replacement rate, the crack initiation time was delayed by 25 s on average, and the damage critical counting threshold was increased by 8%, which provides a quantitative basis for modulating the damage evolution through material modification.
(3)
MSC with different stone powder contents
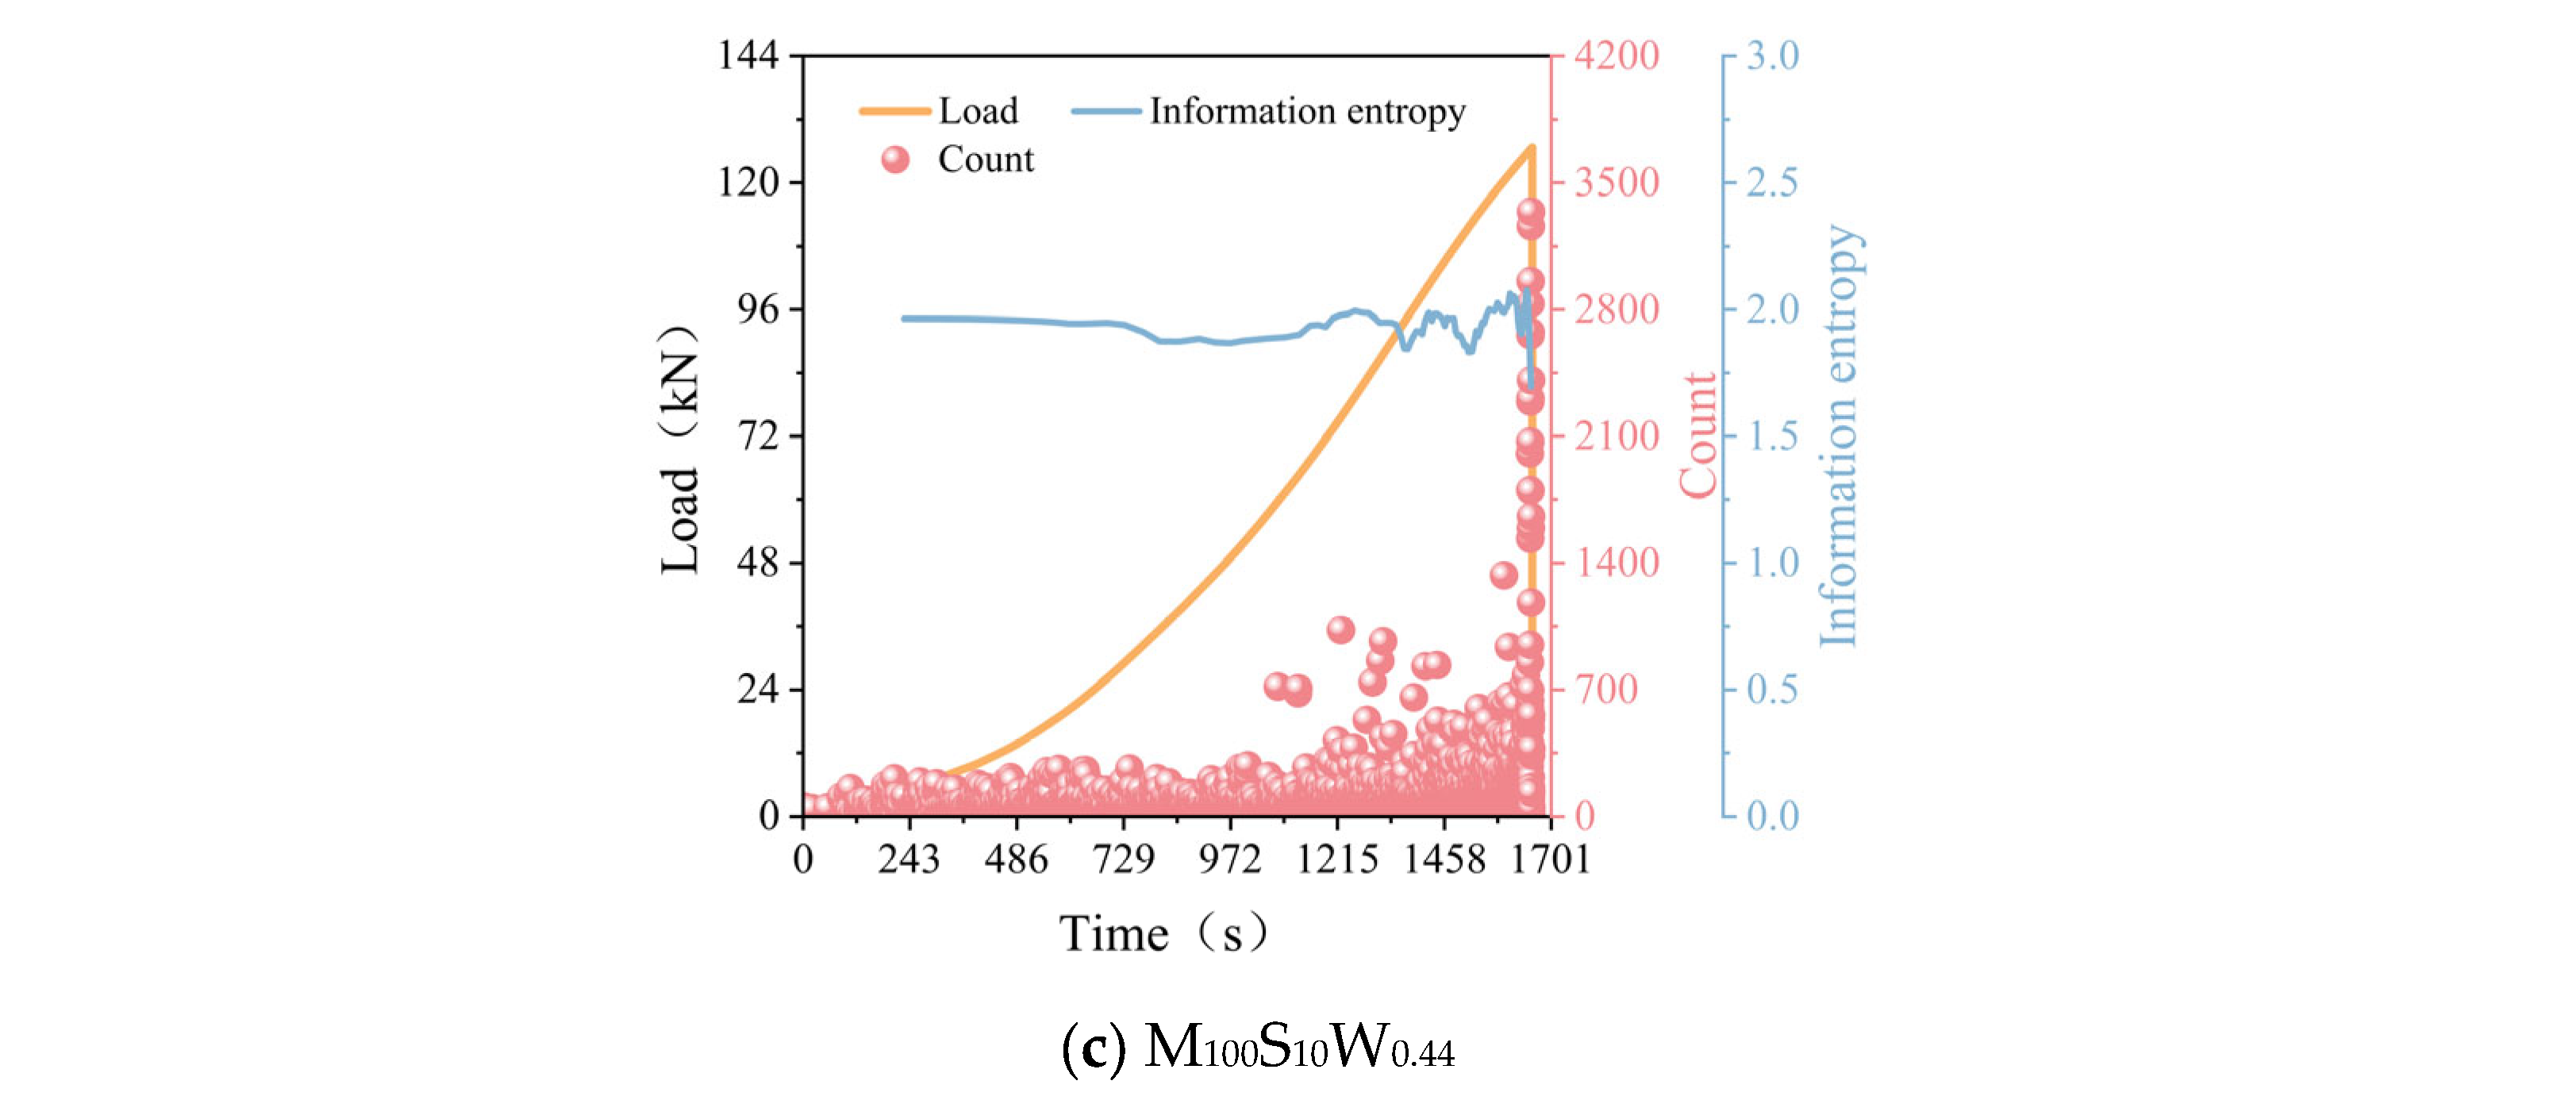
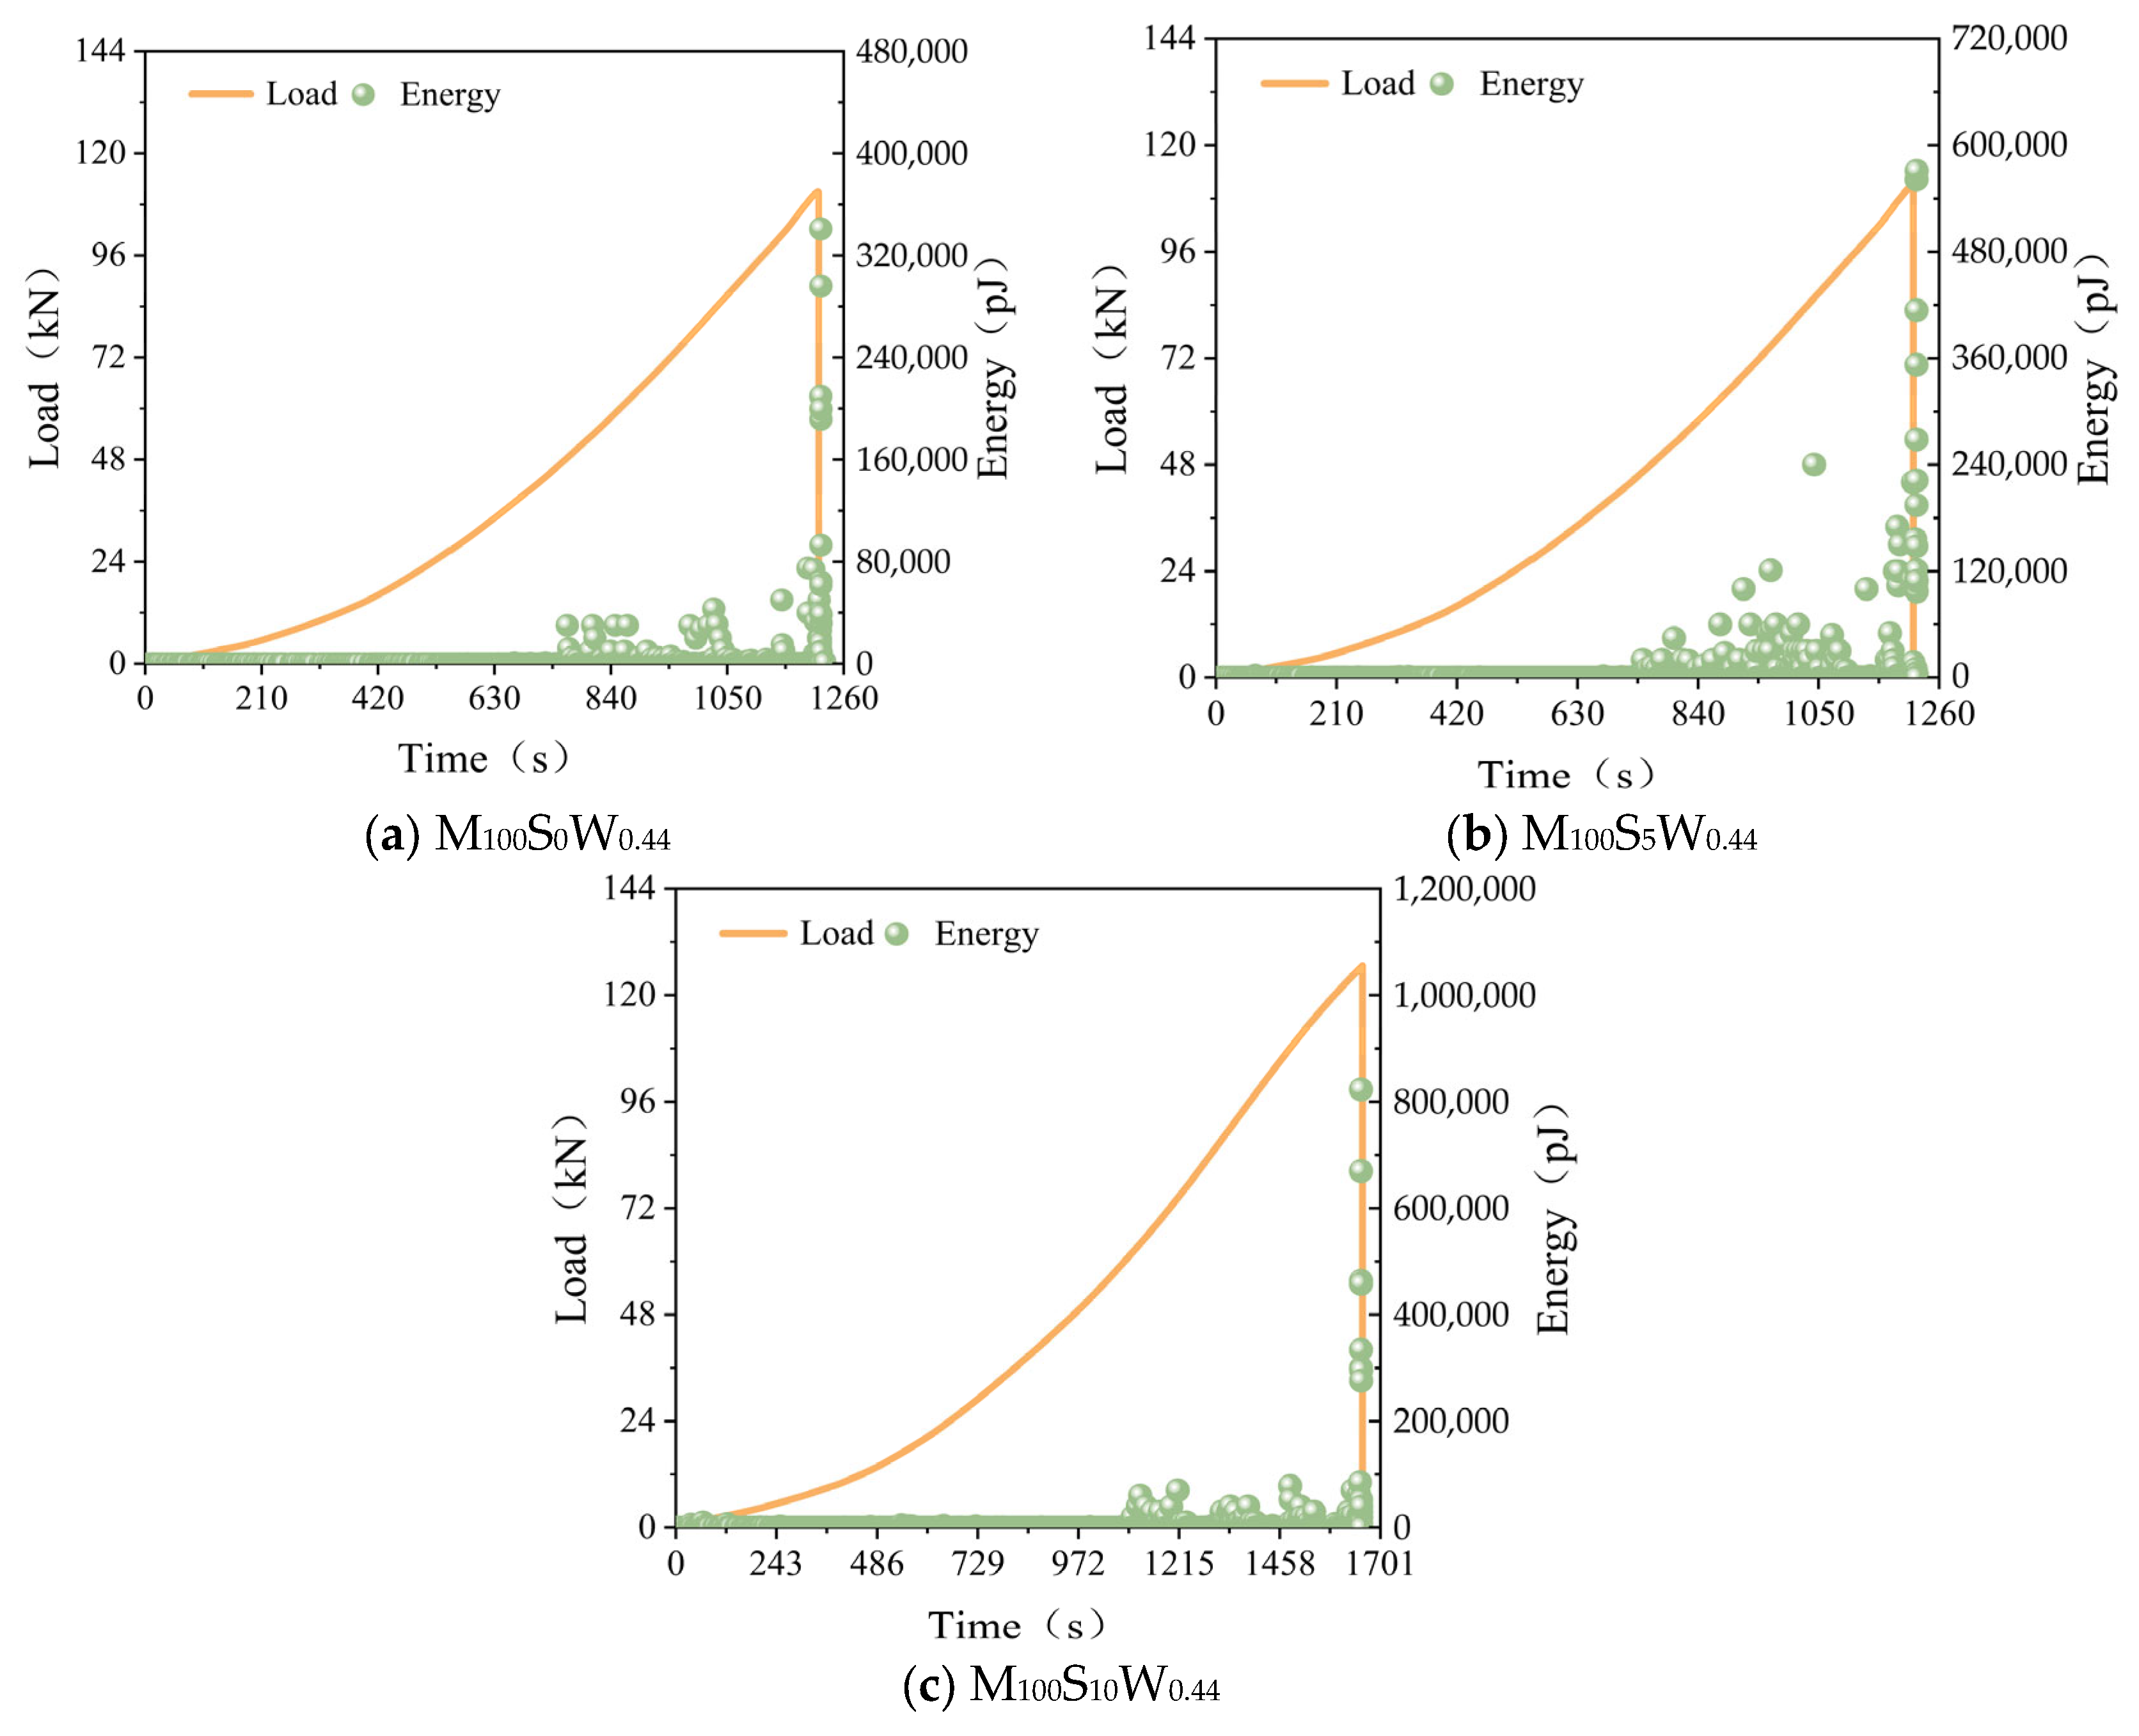
Figure 13 displays the count and information entropy of MSC specimens with different stone powder contents. The count of M100S0W0.44 remained low during 0–750 s, and no obvious cracks appeared inside the MSC. The count increased during 750–1120 s, and cracks began to appear inside the MSC. Finally, the count appeared at a very high level and reached the highest value during 1120–1220 s, and then the MSC was damaged by cleavage. The count of M100S5W0.44 with a 5% stone powder content was kept at a low level during 0–720 s, and no obvious cracks appeared inside the MSC. The count increased during 720–1110 s, and cracks began to appear inside the MSC. Finally, the count was extremely high during 1110–1210 s, reaching the highest value, and then the MSC underwent cleavage damage. The count of M100S10W0.44 was kept at a low level during 0–1100 s, and no obvious cracks appeared inside the MSC. The count increased during 1100–1550 s, and cracks began to appear inside the MSC. Finally, the count appeared at a very high level during 1550–1650 s, reaching the highest value, and then the MSC underwent splitting damage.
The information entropy of M100S0W0.44 was relatively smooth without obvious fluctuation during 0–750 s. And there was a violent fluctuation within 750–1120 s, at which time a crack was generated inside the MSC. Finally, there was a violent fluctuation within 1120–1220 s again, at which time the MSC underwent splitting damage. The information entropy of M100S5W0.44 was relatively stable without obvious fluctuation during 0–720 s. And then there were violent fluctuations during 720–1120 s, at which time cracks were produced inside the MSC. Finally, violent fluctuations occurred again during 1120–1220 s, at which time cleavage damage occurred in the MSC. The information entropy of M100S10W0.44 was relatively smooth, without obvious fluctuation during 0–1100 s. And within 1100–1550 s, violent fluctuation appeared, at which time cracks were generated inside the MSC. Finally, within 1550–1650 s, violent fluctuation appeared again, at which time splitting damage occurred in the MSC.
Quantitative analysis based on the experimental data showed that the stone powder content had a significant effect on the AE parameter thresholds of the MSC specimens. For the benchmark specimens without stone powder (M100S0W0.44), the AE counts in the initial stabilization phase (0–750 s) were maintained below 60 counts/s, and the value of information entropy was stabilized in the range of 1.6 ± 0.1; when the stone powder content was increased to 5% (M100S5W0.44) and 10% (M100S10W0.44), the stabilization phases were, respectively, adjusted to 720 s and a significantly longer 1100 s, and the initial counting thresholds showed a decreasing and then increasing trend of 55 counts/s and 70 counts/s, respectively, corresponding to entropy values of 1.55 ± 0.1 and 1.7 ± 0.15, respectively. In the crack extension stage, the three groups of specimens showed different damage characteristics: the counting growth rate of the baseline specimens during the period of 750–1120 s was 0.85 counts/s2, 0.9 counts/s2 for the 5% stone powder content of specimens during 720–1110 s, and decreased to 0.5 counts/s2 for the 10% stone powder content of specimens during 1100–1550 s, showing that a moderate amount of stone powder (5%) slightly accelerates the initial crack expansion, but a high content (10%) instead significantly inhibits the expansion rate. The critical thresholds of the damage phase increase with increasing stone powder content: the benchmark specimens show a peak count of >900 counts/s and an entropy mutation of >2.1 at 1120–1220 s, while the 10% stone powder content of specimens reaches a more drastic mutation of >1300 counts/s and >2.8 at 1550–1650 s. Based on this, an early warning system for stone powder modified concrete can be established: Primary warning (counts > 100 counts/s and ΔH > 0.5) corresponds to microcrack initiation. Intermediate warning (counts > 500 counts/s and ΔH > 1.5) signifies through-crack formation. Emergency warning (counts > 1000 counts/s and H > 2.5) signals structural failure.

3.3.2. Acoustic Emission Energy Analysis

(1)
MSC with different water–cement ratios
Figure 14 shows the energy produced by MSC specimens with different water–cement ratios during the test. The energy of M100S0W0.41 did not have a large value during the period of 0–1250 s, which was kept at a lower value. And a large amount of energy was generated during the period of 1250–1750 s, at which time a crack was generated inside the MSC. Finally, a large amount of energy was generated during the period of 1750–1850 s, which appeared as the maximum value, and at which time the MSC underwent splitting and damage. The energy of M100S0W0.44 did not have a large value during the period of 0–740 s, which was kept at a lower value. And a large amount of energy was produced during the period of 740–1130 s, at which time cracks were produced inside the MSC. Finally, a large amount of energy was produced during the period of 1130–1230 s, at which time cleavage damage occurred in the MSC. The energy of M100S0W0.47 did not have a large value during the period of 0–650 s and was kept at a lower value. And a large amount of energy was produced during the period of 650–1000 s, at which time a crack was produced inside the MSC. Finally, a large amount of energy was produced during the period of 1000–1100 s, at which time the MSC underwent splitting damage. Totally, the maximum energy produced by the MSC specimens with a 0.41 water–cement ratio was larger than that of the MSC specimens with a 0.44 water–cement ratio, and larger than that of the MSC specimens with a 0.47 water–cement ratio.
By quantitatively analyzing the AE energy–time relationship of MSC specimens with different water–cement ratios, the three-stage characteristics of material damage evolution can be clearly observed. In the initial stabilization stage, the energy release of W0.41, W0.44, and W0.47 specimens is maintained below 100 pJ for 1250 s, 740 s, and 650 s, respectively, where the stabilization stage is shortened by about 46% for each increase of 0.03 in the water–cement ratio. After entering the crack extension stage, the energy release rates showed significant differences: the energy of W0.41 specimens increased from 100 pJ to 800 pJ (growth rate of 0.7 pJ/s) during 1250–1750 s, while the growth rate of W0.47 specimens decreased to 0.5 pJ/s during 650–1000 s, indicating that the damage of the materials with a high water–ash ratio developed more slowly. The peak energy of the damage stage decreases with an increasing water–cement ratio, and the W0.41 specimen reaches a peak value of 1200 pJ at 1750–1850 s, which is 50% higher than that of 800 pJ for the W0.47 specimen. The experimental data show that increasing the water–cement ratio from 0.41 to 0.47 leads to a decrease in the crack initiation energy threshold from 200 pJ to 150 pJ, but a decrease in the critical damage threshold from 1000 pJ to 800 pJ is observed. Based on the characteristics of the energy release, it is recommended to set up a three-level early warning mechanism: The primary warning (energy > 200 pJ) corresponds to the crack initiation. The intermediate warning (energy > 10,000 pJ) signifies the stable expansion. The emergency warning (energy > 100,000 pJ) predicts the crack initiation. And the emergency warning signals the crack expansion. These quantitative results provide a clear energy parameter benchmark for concrete structural health monitoring.
(2)
MSC with different replacement rates of MS
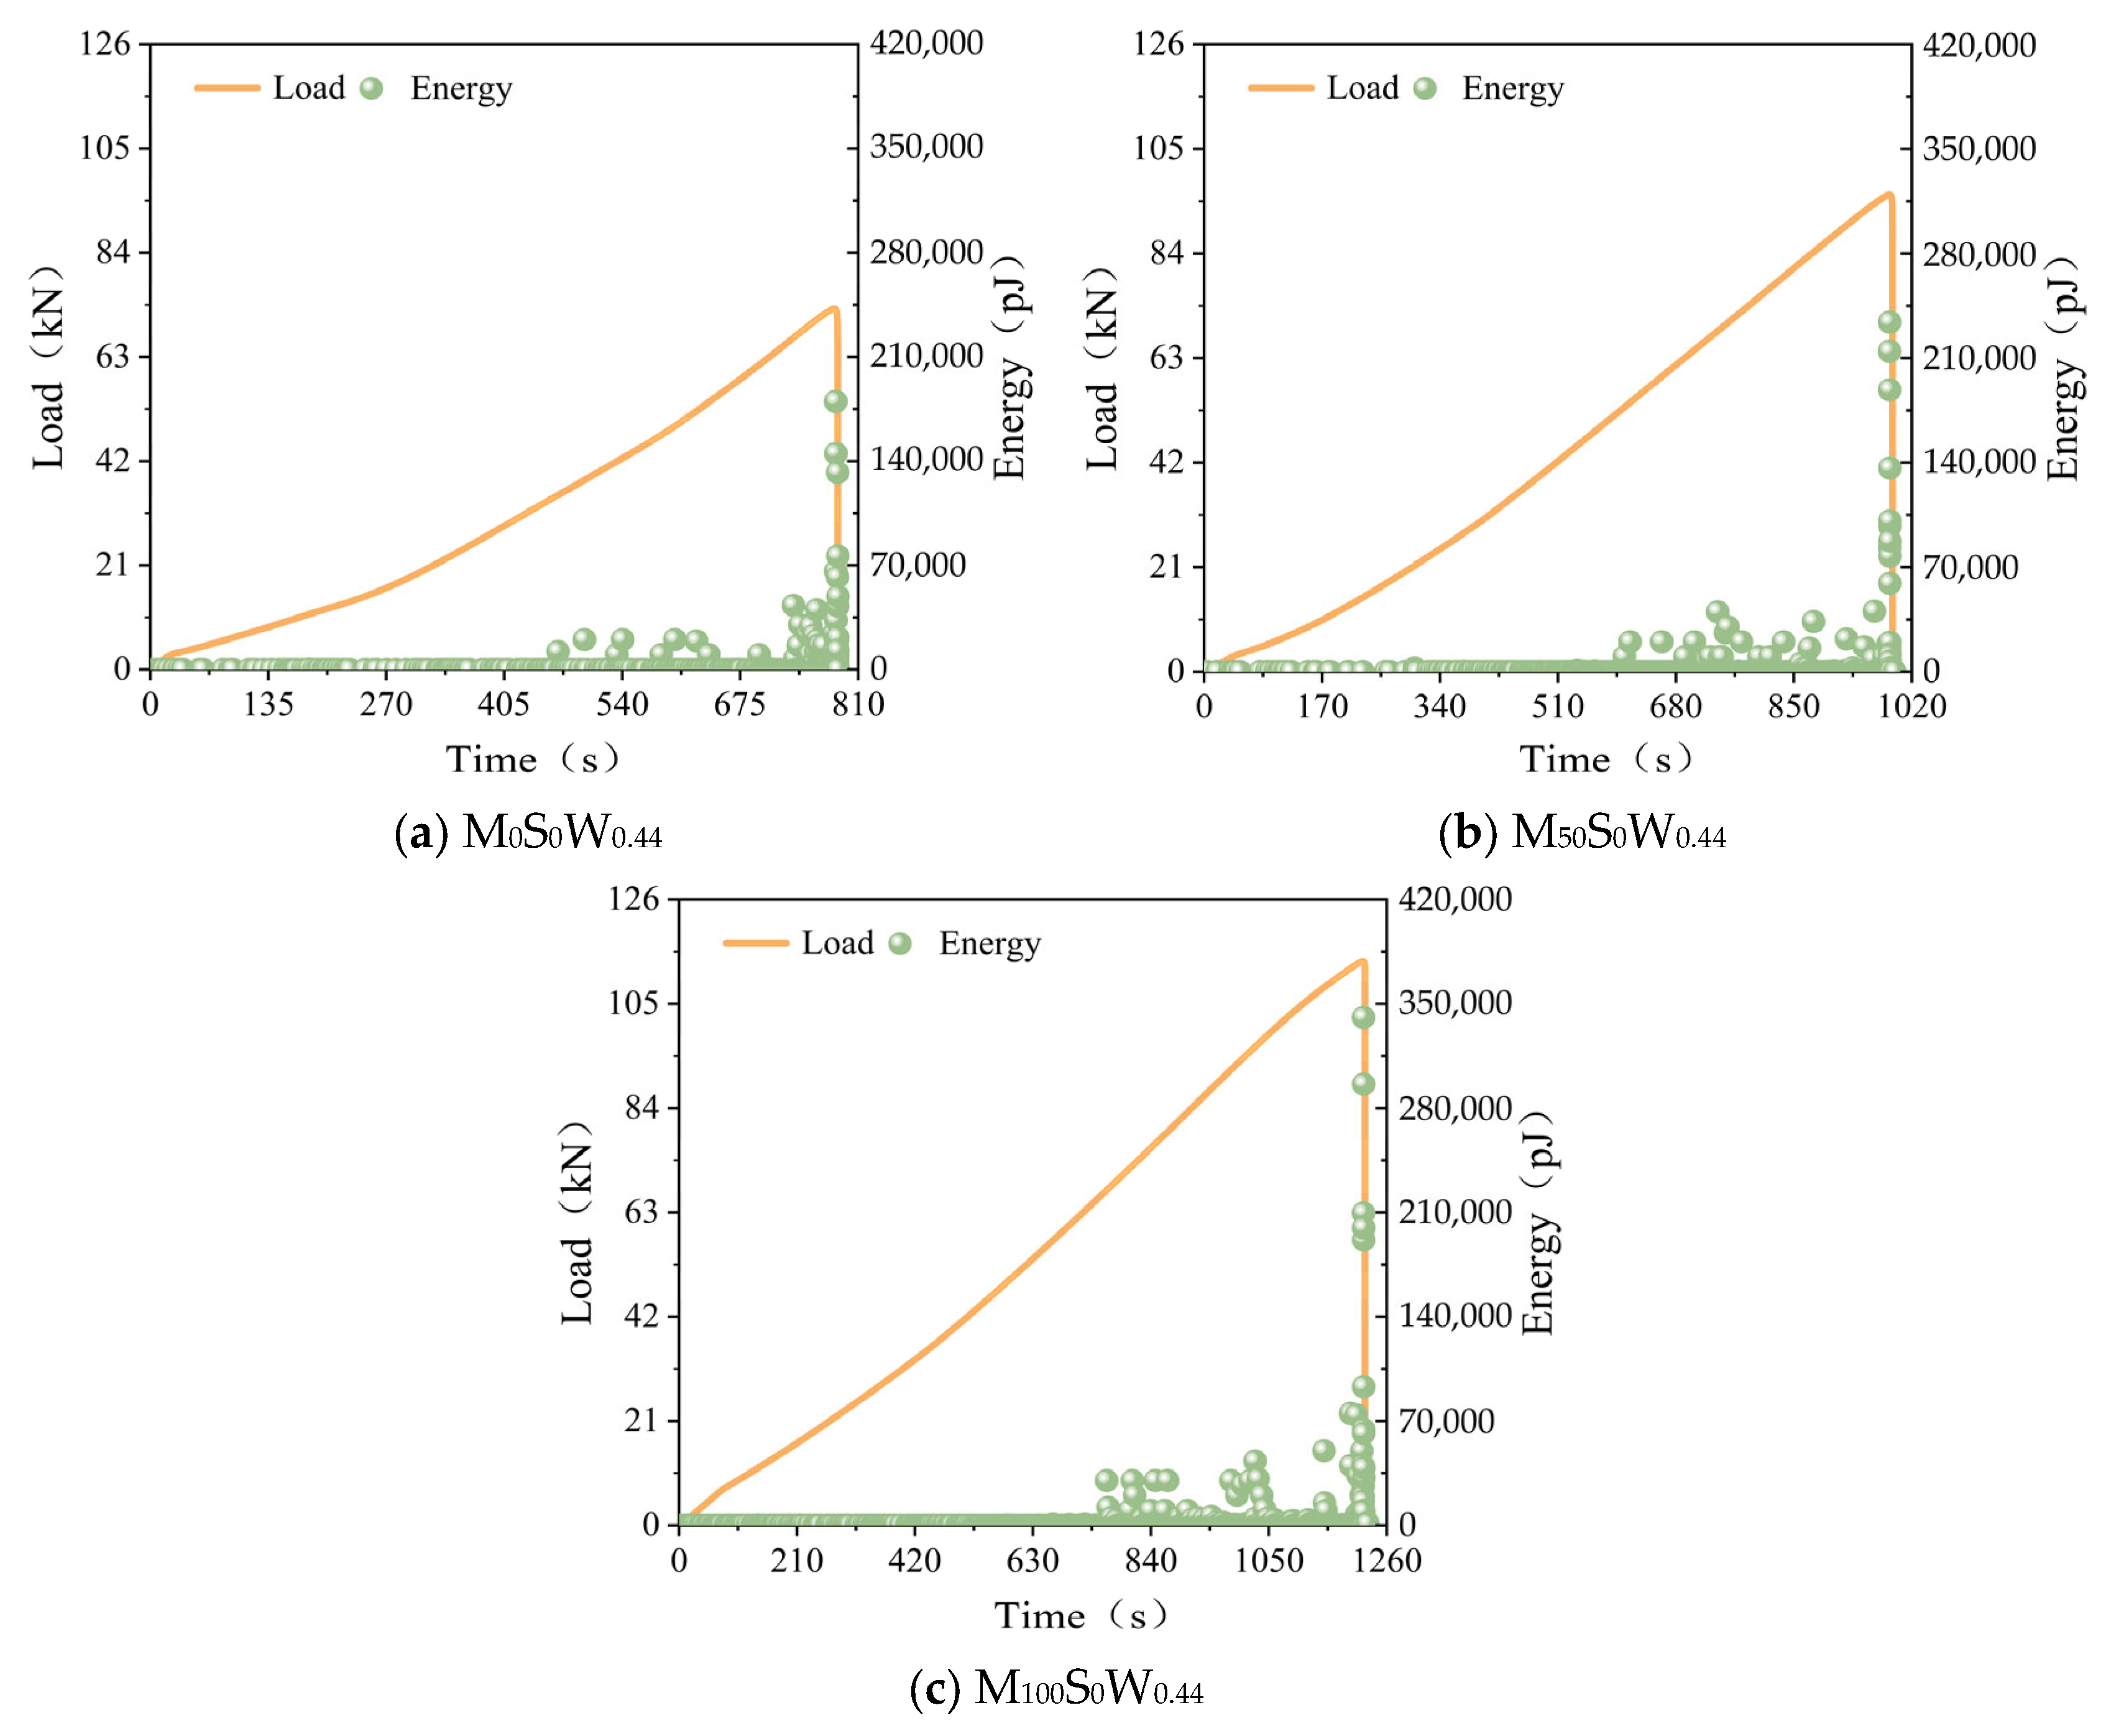
Figure 15 illustrates the energy generated during the test for MSC specimens with different replacement rates of MS. The energy of M0S0W0.44 did not have a large value during the period of 0–450 s and was kept at a lower value. And a large amount of energy was generated in 450–690 s, when cracks were generated inside the MSC. Finally, a large amount of energy was generated, and a maximum value appeared during the period of 690–790 s, when splitting damage occurred in the MSC. The energy of M50S0W0.44 did not have a large value during 0–500 s, which was kept at a lower value. And a large amount of energy was generated during 500–890 s, when cracks were generated inside the MSC. Finally, a large amount of energy was generated in 890–990 s, which appeared as the maximum value, and then the MSC underwent cleavage damage. The energy of M100S0W0.44 did not have a large value during the period of 0–750 s, which was kept at a lower value. And a large amount of energy was generated during 750–1120 s, at which time cracks were generated inside the MSC. Finally, a large amount of energy was generated, and the maximum value appeared during 1120–1220 s, at which time splitting damage occurred in the MSC. Taken together, the maximum energy produced by the MSC specimens with a 100% MS replacement rate was larger than that of the MSC specimens with a 50% MS replacement rate, and larger than that of the MSC specimens with a 0% MS replacement rate.
By quantitatively analyzing the AE energy–time relationship of MSC specimens with different MS replacement rates, the regularity characteristics of material damage evolution can be clearly observed. In the initial stabilization stage, the energy release of the 0% MS specimen (M0S0W0.44) was maintained below 120,000 pJ for 450 s, which was extended to 500 s for the 50% replacement rate specimen, and further extended to 750 s for the 100% substitution rate specimen, indicating that the MS doping significantly retarded the damage initiation time. After entering the crack extension stage, the energy release characteristics of the three groups of specimens showed a gradient difference: the energy increased from 120,000 pJ to 350,000 pJ (growth rate of ≈958 pJ/s) during 450–690 s for the 0% MS specimens, and the growth rate decreased to 676 pJ/s during 750–1120 s for the 100% MS specimens, but the peak energy of the final damage increased with the increase in MS. However, the peak energy at final damage increases with the increase in the MS replacement rate, reaching 350,000 pJ, 380,000 pJ, and 420,000 pJ for 0%, 50%, and 100% MS specimens, respectively, which shows that the increase in MS doping both slows down the damage progression and enhances the energy absorption capacity of the material at final damage. Based on the energy evolution characteristics, a three-level warning mechanism can be established: Primary warning (energy > 500 pJ) corresponds to crack initiation in MS-modified specimens, which is delayed by 250 s compared with that of the baseline specimens. Intermediate warning (energy > 10,000 pJ) is achieved when the remaining life of 100% MS specimens is about 370 s (1120–750 s), which is extended by 240 s compared with that of the 0% MS specimens. And emergency warning (energy > 100,000 pJ) is achieved when the remaining life of 100% MS specimens is about 370 s (1120–750 s). These quantitative results demonstrate that for every 10% increase in the MS replacement rate, the critical damage energy threshold of the specimens is increased by about 7%, providing a clear basis for material modification in the design of highly durable concrete.
(3)
MSC with different stone powder contents
Figure 16 shows the energy generated during the test for MSC specimens with different stone powder contents. The energy of M100S0W0.44 did not have a large value during 0–750 s and was kept at a lower value. And a large amount of energy was generated in 750–1120 s, when cracks were generated inside the MSC. Finally, a large amount of energy was generated during 1120–1220 s, with a maximum value, when the MSC was split and damaged. The energy of M100S5W0.44 did not have a large value during the period of 0–720 s and was kept at a lower value. And a large amount of energy was generated during 720–1120 s, when cracks were generated inside the MSC. Finally, a large amount of energy was generated, and a maximum value appeared during the period of 1120–1220 s, at which time cleavage damage occurred in the MSC. The energy of M100S10W0.44 did not have a large value during the period of 0–1100 s, which was kept at a lower value. And a large amount of energy was generated in 1100–1550 s, when cracks were generated inside the MSC. Finally, during 1550–1650 s, a large amount of energy was generated, and a maximum value appeared, when splitting damage occurred in the MSC. All in all, the maximum energy produced by the MSC specimens with a 10% stone powder content was greater than that of the MSC specimens with a 5% stone powder content and greater than that of the MSC specimens with a 0% stone powder content.
By quantitatively analyzing the AE energy–time relationship of MSC specimens with different stone powder contents, the three-stage characteristic law of material damage evolution can be clearly observed. In the initial stabilization stage, the energy release of the specimen with a 0% stone powder content (M100S0W0.44) was maintained below 160,000 pJ for 750 s, shortened to 720 s for the 5% stone powder specimens, and significantly prolonged to 1100 s for the 10% stone powder specimens, which suggests that the appropriate amount of stone powder incorporation (10%) can effectively delay the damage initiation time. The graphical data show that in the interval of 0–700 s of the time axis, the energy curve remains smooth, which is in perfect agreement with the characteristics of the stabilization stage described in the text. The crack extension stage showed significant differences: the energy of the specimens with a 0% stone powder content increased from 160,000 pJ to 480,000 pJ (growth rate ≈ 914 pJ/s) during 750–1120 s, while the growth rate of the 10% stone powder specimens decreased to 711 pJ/s during 1100–1550 s. However, the peak energy at the time of damage increased significantly with the increase in stone powder content. This is shown by the fact that the peak energies of damage for the specimens with a 0%, 5%, and 10% stone powder content were 480,000 pJ, 520,000 pJ, and 600,000 pJ, respectively, with the 10% stone powder content specimens showing a 25% enhancement in energy absorption capacity compared to the baseline specimen. Combined with the graphical data, it can be seen that the mutation points of the energy curves highly correspond to the damage stages: the 10% stone powder content specimens show a steep energy increase at 1550 s (≈1458 s marking point in the graph), which corresponds to the final damage moment. Notably, the graph shows an energy fluctuation (jump from 200,000 pJ to 400,000 pJ) near 972 s, which may indicate a critical point of crack penetration. Based on the energy evolution characteristics, three levels of warning thresholds can be established: Primary warning (energy > 500 pJ) with a remaining lifetime of about 450 s for specimens with a 10% stone powder content. Intermediate warning (energy > 20,000 pJ) with a warning window of 350–400 s. And emergency warning (energy > 100,000 pJ), which is specific to specimens with a 10% stone powder content, and which has a pre-destructive warning. Its pre-destruction warning time reaches 100 s. Quantitative analysis showed that the critical damage energy threshold of the specimens increased by about 10% for every 5% increase in stone powder content, which provides clear data support for the improvement of concrete toughness by mineral admixtures.

4. Conclusions

In this study, the effects of the water–cement ratio, replacement rate of MS, and stone powder content on the bonding performance and fracture damage evolution law of reinforcing steel and MSC are systematically revealed through the central pull-out test and AE dynamic monitoring technology, and the following main conclusions are drawn:
(1)
When the water–cement ratio decreased from 0.47 to 0.41, the peak bond stress and bond fracture energy increased by 56.8% and 8.5%, respectively, while the peak slip decreased by 30.5%, indicating a significant enhancement in the bond strength of the reinforced concrete specimens.
(2)
As the manufactured sand replacement ratio increased from 0% to 100%, the peak bond stress and bond fracture energy rose by 54.7% and 7.8%, respectively, while the peak slip decreased by 22.7%, demonstrating a significant improvement in the bond strength of the reinforced concrete specimens.
(3)
The improvement effect of stone powder incorporation on bond properties was small. When the content of stone powder was increased from 0% to 10%, the peak bond stress was elevated by 12.6%, and the bond fracture energy was slightly increased by 2.8%. Further, the amount of steel rebar slip was reduced by 9.5%, which was weaker than the first two factors, but still reflected a positive regulatory effect.
(4)
The damage process was characterized using AE parameters (counts, information entropy, energy). At the beginning of the test, counts and energy were kept at the lowest level and information entropy did not fluctuate significantly. As the test progressed, the specimen produced small cracks, the counts and energy became larger, and the information entropy fluctuated. Finally, the count and energy increased dramatically to reach the maximum value, the information entropy fluctuated dramatically, and the specimen was damaged by splitting.
(5)
The damage process was quantified using AE parameters (counts, information entropy, energy). Thresholds for each parameter to reach the three damage stages (no damage at the beginning of the test, appearance and expansion of microcracks, brittle damage) were analyzed. A three-stage warning theory was proposed.
(6)
As the water–cement ratio decreases (0.47–0.41), the replacement ratio of mechanism sand increases (0–100%), and the content of stone dust increases (0–10%), the acoustic emission parameters become more and more active, and the threshold increases accordingly.
(7)
Based on the experimental results of this paper, it is concluded that in the actual MSC project, it is recommended to use a water–cement ratio greater than 0.44, replace all NS with MS, and keep the content of stone powder in the range of 5–10% as a way to enhance the strength of the material.

Author Contributions

Conceptualization, L.H. and Y.J.; Methodology, L.H. and H.Y.; Validation, L.H.; Investigation, H.Y. and Q.W.; Resources, Y.J.; Data curation, L.H.; Writing – original draft, L.H.; Writing – review & editing, H.Y., Q.W. and Y.J.; Visualization, L.H.; Supervision, Y.J.; Funding acquisition, Y.J. All authors have read and agreed to the published version of the manuscript.

Funding

The authors would like to acknowledge the financial support from the National Natural Science Foundation of China (No. 52178266).

Data Availability Statement

The original contributions presented in the study are included in the article, further inquiries can be directed to the corresponding author.

Conflicts of Interest

The authors declare that they have no known competing financial interests or personal relationships that could have appeared to influence the work reported in this paper.

References

  1. Alwaeli, M.; Gołaszewski, J.; Niesler, M.; Pizoń, J.; Gołaszewska, M. Recycle option for metallurgical sludge waste as a partial replacement for natural sand in mortars containing CSA cement to save the environment and natural resources. J. Hazard. Mater. 2020, 398, 123101. [Google Scholar] [CrossRef]
  2. Kurad, R.; Silvestre, J.D.; de Brito, J.; Ahmed, H. Effect of incorporation of high volume of recycled concrete aggregates and fly ash on the strength and global warming potential of concrete. J. Clean. Prod. 2017, 166, 485–502. [Google Scholar] [CrossRef]
  3. Kirthika, S.K.; Singh, S.K.; Chourasia, A. Alternative fine aggregates in production of sustainable concrete—A review. J. Clean. Prod. 2020, 268, 122089. [Google Scholar]
  4. Jiang, Z. Green High-Performance Concrete with Manufactured Sand; Springer: Berlin/Heidelberg, Germany, 2023. [Google Scholar]
  5. Cheng, Y.-H.; Yang, S.-H.; Zhang, J.-Y.; Sun, X.H. Test research on hydration process of cement-iron tailings powder composite cementitious materials. Powder Technol. 2022, 399, 117215. [Google Scholar] [CrossRef]
  6. Zhu, X.; Zhang, Y.; Liu, Z.; Qiao, H.; Ye, F.; Lei, Z. Research on carbon emission reduction of manufactured sand concrete based on compressive strength. Constr. Build. Mater. 2023, 403, 133101. [Google Scholar] [CrossRef]
  7. Zhang, L.; Song, Y.; Shi, T.; Zhao, Z.; Zhang, X.; Liu, Y.; Li, Q.; Wang, P.; Zhang, F.; Qian, X.; et al. A correlation study between the properties of manufactured sand and tunnel muck. Case Stud. Constr. Mater. 2024, 21, e03684. [Google Scholar] [CrossRef]
  8. Chandrasekhar, C.; Ransinchung, G.D. Assessment of interface characteristics and durability aspects of manufactured sand (M-sand) in engineered cementitious composites. J. Build. Eng. 2024, 91, 109705. [Google Scholar] [CrossRef]
  9. Kavya, A.; Rao, A.V. Experimental investigation on mechanical properties of concrete with M-sand. Mater. Today Proc. 2020, 33, 663–667. [Google Scholar] [CrossRef]
  10. Zhang, J.; Li, D.; Wang, Y. Toward intelligent construction: Prediction of mechanical properties of manufactured-sand concrete using tree-based models. J. Clean. Prod. 2020, 258, 120665. [Google Scholar] [CrossRef]
  11. Ding, X.; Li, C.; Xu, Y.; Li, F.; Zhao, S. Experimental study on long-term compressive strength of concrete with manufactured sand. Constr. Build. Mater. 2016, 108, 67–73. [Google Scholar] [CrossRef]
  12. Shen, W.; Wu, J.; Du, X.; Li, Z.; Wu, D.; Sun, J.; Wang, Z.; Huo, X.; Zhao, D. Cleaner production of high-quality manufactured sand and ecological utilization of recycled stone powder in concrete. J. Clean. Prod. 2022, 375, 134146. [Google Scholar] [CrossRef]
  13. Zhou, A.; Miao, G.; Zhang, Y.; Qian, R.; Zhang, Y.; Shi, J.; Yang, Y. Effects of stone powder on microstructure of manufactured-sand concrete and its gas permeability. J. Build. Eng. 2024, 91, 109539. [Google Scholar] [CrossRef]
  14. Yang, X.; Pan, M.; Zheng, S.; Liang, J.; Tan, M.; Rong, H. Influence of stone powder content on carbonation performance of manufactured sand concrete (MSC). J. Build. Eng. 2023, 76, 107341. [Google Scholar] [CrossRef]
  15. Ren, Q.; Ding, L.; Dai, X.; Li, C.; Li, C.; Jiang, Z. Optimizing mix design of concrete with manufactured sand for low embodied carbon and desired strength using machine learning. Constr. Build. Mater. 2024, 457, 139407. [Google Scholar] [CrossRef]
  16. Meng, Q.; Jing, X.; Wang, H.; Guo, X.; Song, J.; Du, J. Flexural fatigue properties of concrete based on different replacement percentage of natural sand with manufactured sand. J. Build. Eng. 2024, 87, 108987. [Google Scholar] [CrossRef]
  17. Jin, K.; Li, Y.; Shen, J.; Lin, H.; Fan, M.; Shi, J. Investigation on compressive strength and splitting tensile strength of manufactured sand concrete: Machine learning prediction and experimental verification. J. Build. Eng. 2024, 97, 110852. [Google Scholar] [CrossRef]
  18. Zhen, H.; Xiong, Z.; Song, Y.; Li, L.; Qiu, Y.; Zou, X.; Chen, B.; Chen, D.; Liu, F.; Ji, Y. Early mechanical performance of glass fibre-reinforced manufactured sand concrete. J. Build. Eng. 2024, 83, 108440. [Google Scholar] [CrossRef]
  19. Li, F.; Yao, T.; Luo, J.; Song, Q.; Yang, T.; Zhang, R.; Cao, X.; Li, M. Experimental investigation on the performance of ultra-high performance concrete (UHPC) prepared by manufactured sand: Mechanical strength and micro structure. Constr. Build. Mater. 2024, 452, 139001. [Google Scholar] [CrossRef]
  20. Xia, J.; Chen, K.; Wu, Y.; Xiao, W.; Jin, W.; Zhang, J. Shear fatigue behavior of reinforced concrete beams produced with manufactured sand as alternatives for natural sand. J. Build. Eng. 2022, 62, 105412. [Google Scholar] [CrossRef]
  21. Wang, Z.; Li, H.; Huang, F.; Yang, Z.; Wen, J.; Yi, Z. Bond properties between railway high-strength manufactured sand concrete and steel bars. Constr. Build. Mater. 2024, 416, 135179. [Google Scholar] [CrossRef]
  22. Shi, H.; Li, H.; Wang, Z.; Huang, F.; Yang, Z.; Wen, J.; Dong, H.; Yi, Z. Bond-slip behaviour between recycled sand concrete and steel bars. J. Build. Eng. 2024, 86, 108980. [Google Scholar] [CrossRef]
  23. Jiang, K.; Wang, X.; Ben, Q.; Ding, L.; Chen, Z.; Liew, J.R.; Du, H.; Wu, Z. Bond behavior of BFRP bars in ultra-high performance seawater sea-sand concrete reinforced by non-metallic fibers. Eng. Struct. 2024, 318, 118699. [Google Scholar] [CrossRef]
  24. He, S.; Li, L.; Lin, J.; Chen, X.; Weng, C.; Xiao, H.; Liu, P.; Qiao, S.; Xiong, Z. Bond Performance Between Ribbed BFRP bar and Seawater Sea-Sand Concrete: Influences of rib Geometry. Structures 2024, 65, 106660. [Google Scholar] [CrossRef]
  25. Xu, Q.; Jiang, X.; Lv, H.; Xu, C. Experimental investigation on bond-slip performance and damage evolution mechanism of deformed reinforcing bar embedded in steel polyvinyl-alcohol hybrid fiber high performance concrete after high temperature. Constr. Build. Mater. 2024, 436, 136951. [Google Scholar] [CrossRef]
  26. Kuang, Y.; Tang, F.; Li, G.; Lin, W.; Lin, Z. Bond characteristics of quartz sand modified enamel coated steel bars with concrete. Constr. Build. Mater. 2023, 408, 133699. [Google Scholar] [CrossRef]
  27. El-Nemr, A.; Ahmed, E.A.; Barris, C.; Joyklad, P.; Hussain, Q.; Benmokrane, B. Bond performance of fiber reinforced polymer bars in normal-and high-strength concrete. Constr. Build. Mater. 2023, 393, 131957. [Google Scholar] [CrossRef]
  28. Liao, J.; Zeng, J.J.; Bai, Y.L.; Zhang, L. Bond strength of GFRP bars to high strength and ultra-high strength fiber reinforced seawater sea-sand concrete (SSC). Compos. Struct. 2022, 281, 115013. [Google Scholar] [CrossRef]
  29. Wu, Z.; Deng, M.; Zhang, M.; Zhang, W.; Liu, J. Bond Behavior Between Highly Ductile Fiber-Reinforced Concrete (HDC) and Deformed Rebar Under Repeated and Post-Repeated Monotonic Loading. Structures 2024, 67, 106933. [Google Scholar] [CrossRef]
  30. Liu, C.; Liu, X.; Yan, L.; Zheng, C. Experimental study on bond behavior of corroded reinforced concrete under coupling effect of fatigue load and elevated temperature. Eng. Fail. Anal. 2024, 166, 108862. [Google Scholar] [CrossRef]
  31. Hua, J.; Yang, Z.; Xue, X.; Huang, L.; Wang, N.; Chen, Z. Bond properties of bimetallic steel bar in seawater sea-sand concrete at different ages. Constr. Build. Mater. 2022, 323, 126539. [Google Scholar] [CrossRef]
  32. Liu, S.; Zheng, W.; Tang, W.; Wang, Y. Bond performance in reinforced concrete exposed to moderately-high sustained temperatures. Eng. Struct. 2025, 331, 120007. [Google Scholar] [CrossRef]
  33. Liu, C.; Li, W.; Zhang, S.; Li, J.; Miao, J.; Zhang, R. Bond Behavior of Reinforced Concrete Structures Under Different Cooling Methods Based on Pull-Out Tests. Structures 2025, 72, 108189. [Google Scholar] [CrossRef]
  34. Huang, T.; Wan, C.; Liu, T.; Ou, J.; Ai, Y.; Ren, Z.; Miao, C. Data-Driven Prediction of High-Temperature Bond Strength in Corroded Reinforced Concrete. Structures 2025, 71, 107973. [Google Scholar] [CrossRef]
  35. Li, X.; Miao, T.; Liu, T.; Chen, R.; Yu, A. Acoustic Emission Evaluation and Localization Correction of Concrete Damage Considering Stress Levels. Case Stud. Constr. Mater. 2025, 22, e04281. [Google Scholar] [CrossRef]
  36. Van Steen, C.; Pahlavan, L.; Wevers, M.; Verstrynge, E. Localisation and characterisation of corrosion damage in reinforced concrete by means of acoustic emission and X-ray computed tomography. Constr. Build. Mater. 2019, 197, 21–29. [Google Scholar] [CrossRef]
  37. Boniface, A.; Saliba, J.; Sbartaï, Z.M.; Ranaivomanana, N.; Balayssac, J.-P. Evaluation of the acoustic emission 3D localisation accuracy for the mechanical damage monitoring in concrete. Eng. Fract. Mech. 2020, 223, 106742. [Google Scholar] [CrossRef]
  38. Tsangouri, E.; Karaiskos, G.; Deraemaeker, A.; Van Hemelrijck, D.; Aggelis, D. Assessment of acoustic emission localization accuracy on damaged and healed concrete. Constr. Build. Mater. 2016, 129, 163–171. [Google Scholar] [CrossRef]
  39. Li, P.; Ren, X.; Li, J. Damage assessment of concrete via acoustic emission and mesoscopic damage constitutive model. Eng. Fract. Mech. 2024, 303, 110133. [Google Scholar] [CrossRef]
  40. GB/T 1499.2-2018; Steel for the Reinforcement of Concrete—Part 2: Hot Rolled Ribbed Bars. Ministry of Housing and Urban-Rural Development People’s Republic China (MOHURD): Beijing, China, 2018.
  41. GB/T 50080-2016; Standard for Test Method of Performance on Ordinary Fresh Concrete. Ministry of Housing and Urban-Rural Development People’s Republic China (MOHURD): Beijing, China, 2016.
  42. Chang, Y.; Qin, S.; Huang, M.; Hu, D.; Yang, H.; Li, S. Analytical model of the bond stress-slip relationship for reinforced concrete due to splitting failure. Constr. Build. Mater. 2021, 287, 123025. [Google Scholar] [CrossRef]
  43. Eligehausen, R.; Popov, E.P.; Bertero, V.V. Local Bond Stress-Slip Relationships of Deformed Bars Under Generalized Excitations; NTIS: Springfield, VA, USA, 1983. Available online: https://nehrpsearch.nist.gov/static/files/NSF/PB84192848.pdf (accessed on 18 August 2025).
  44. Wang, X.; Saifullah, H.A.; Nishikawa, H.; Nakarai, K. Effect of water–cement ratio, aggregate type, and curing temperature on the fracture energy of concrete. Constr. Build. Mater. 2020, 259, 119646. [Google Scholar] [CrossRef]
  45. Zhang, M.H.; Islam, J. Use of nano-silica to reduce setting time and increase early strength of concretes with high volumes of fly ash or slag. Constr. Build. Mater. 2012, 29, 573–580. [Google Scholar] [CrossRef]
  46. Zhou, S.; Jiang, Z.; Ou, Q.; Liu, J.; Wang, C. Analysis on flexural toughness of steel fiber reinforced concrete based on acoustic emission and digital image correlation techniques. Constr. Build. Mater. 2025, 492, 143039. [Google Scholar] [CrossRef]
  47. Holsamudrkar, N.; Banerjee, S. B-value based damage source localization and classification using acoustic emission (AE) data for concrete cylinders wrapped with hybrid FRCM composites. Compos. Part C Open Access 2025, 17, 100624. [Google Scholar] [CrossRef]
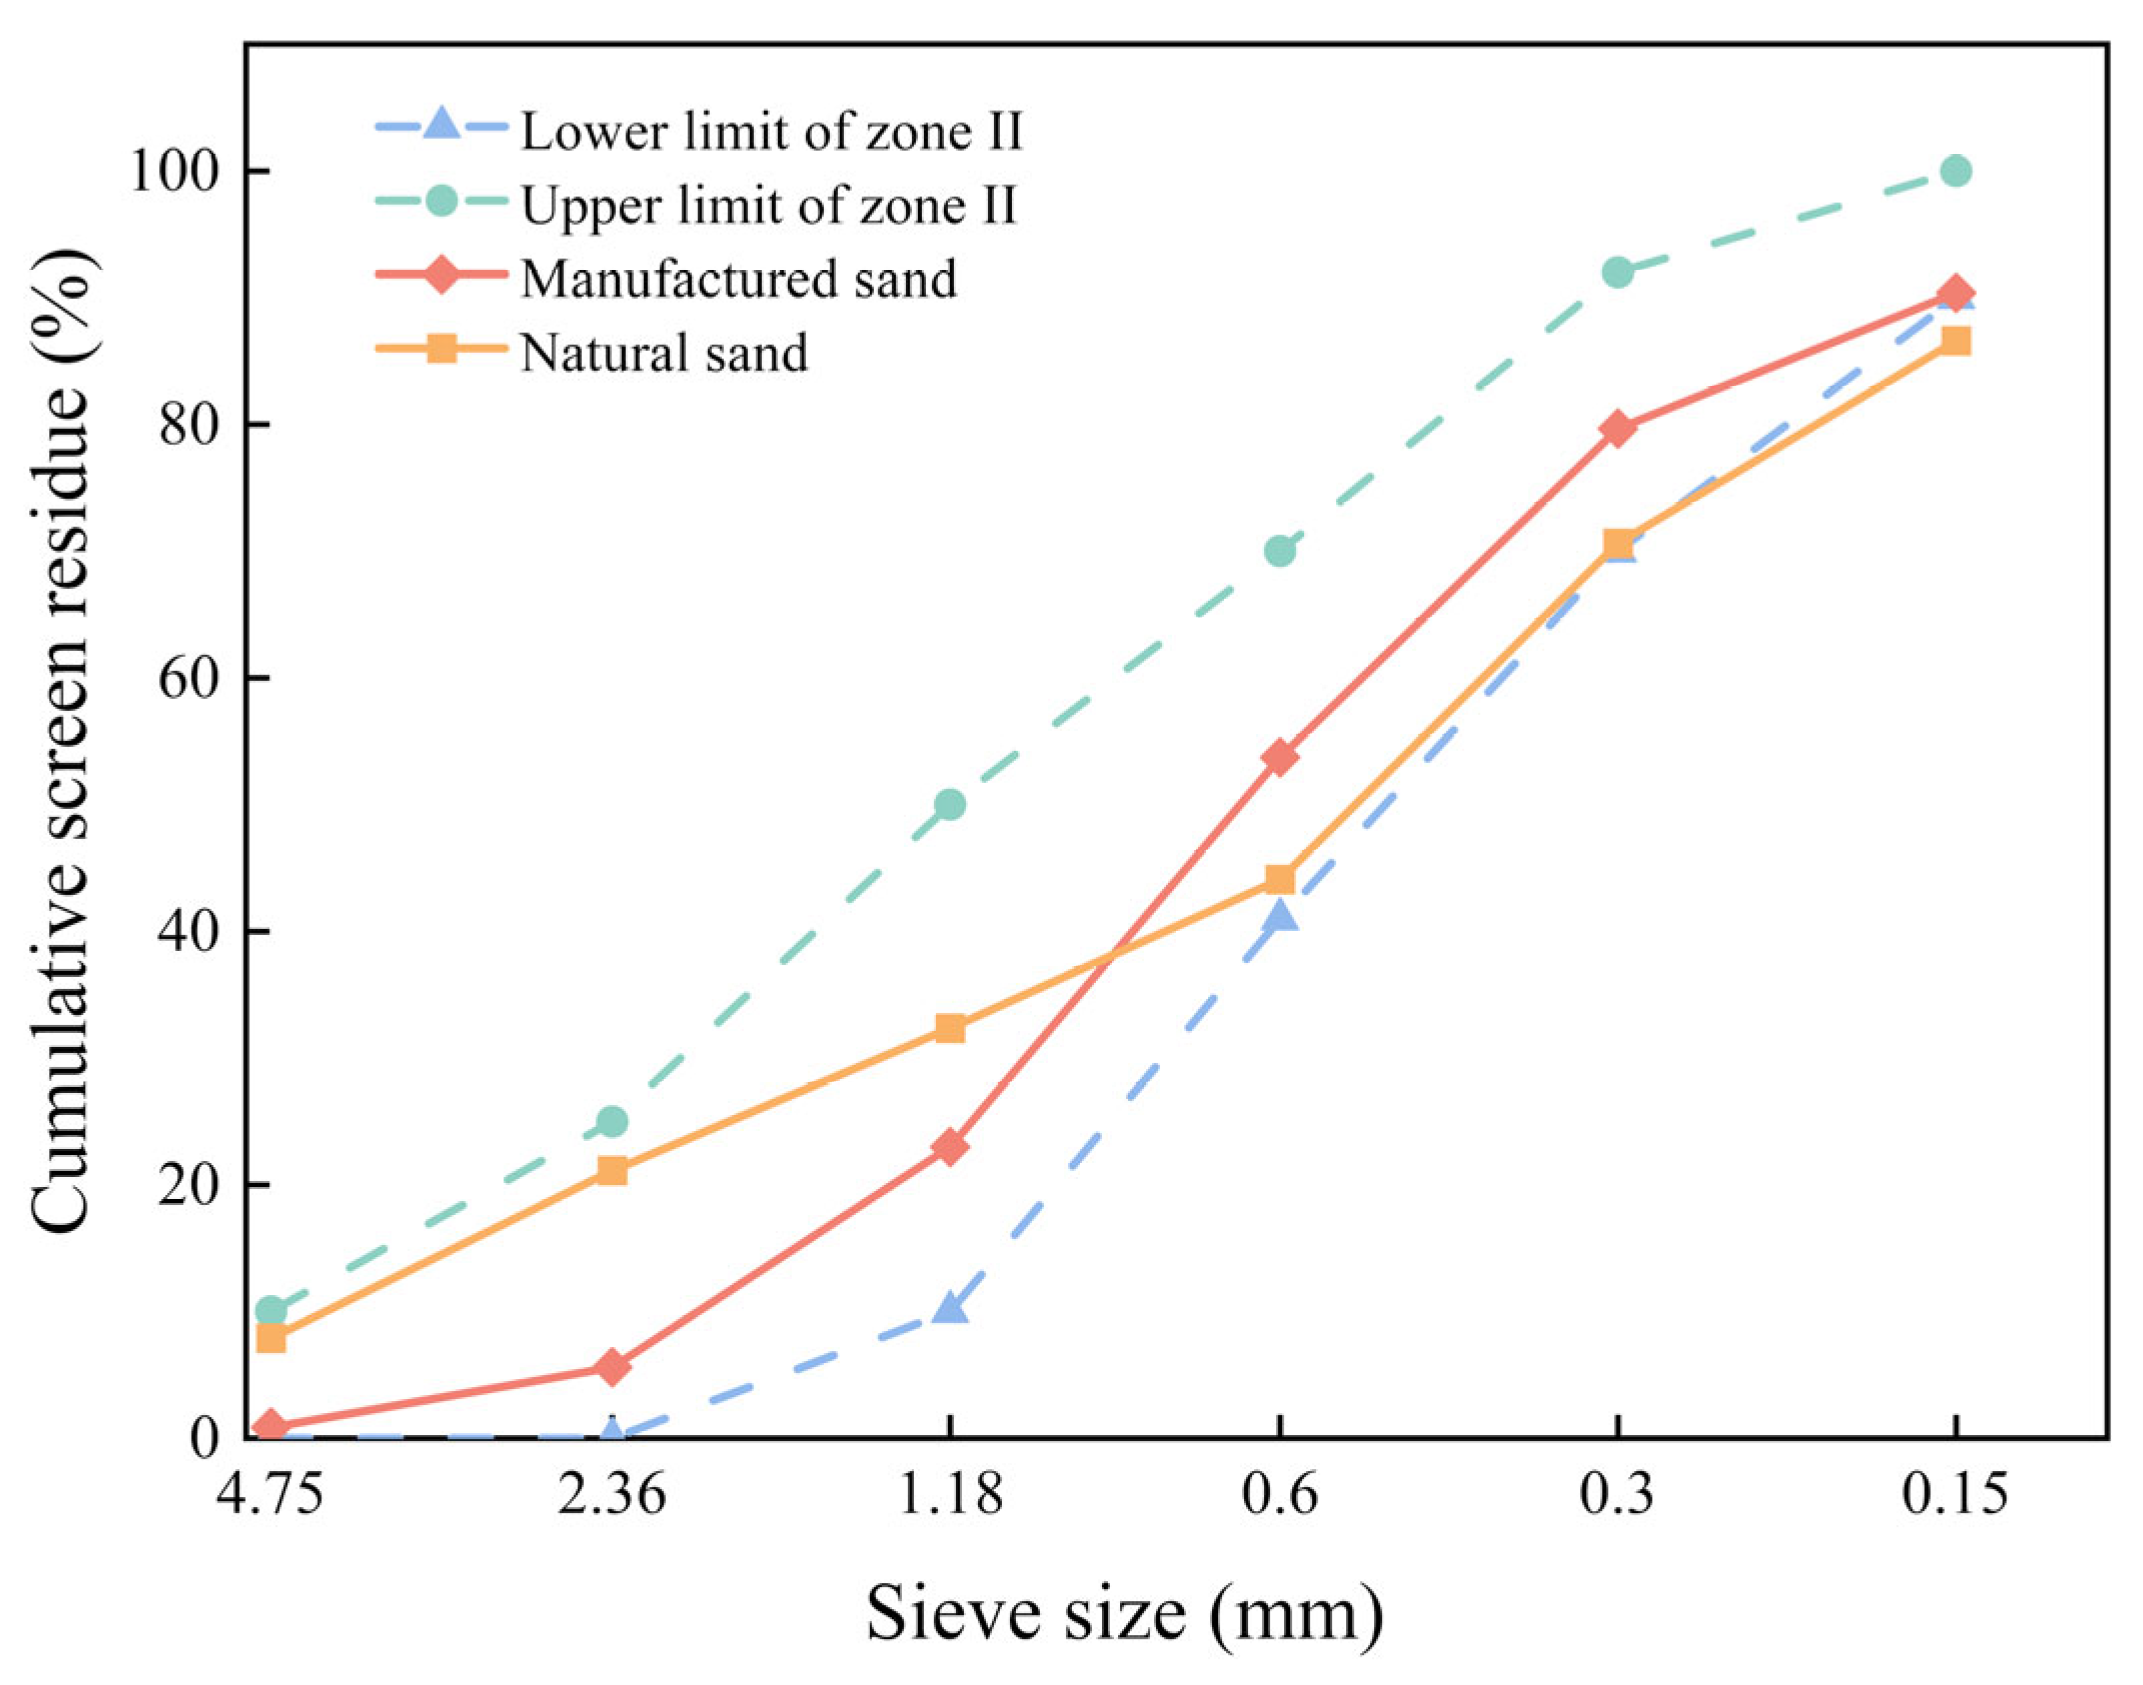
Figure 1. Material particle size distribution curve.
Buildings 15 02959 g001
Figure 2. MSC raw materials.
Buildings 15 02959 g002
Figure 3. Schematic diagram of pull-out specimens between steel rebars and MSCs.
Buildings 15 02959 g003
Figure 4. Diagram of the test set up for center pull-out test of specimens.
Buildings 15 02959 g004
Figure 6. Schematic diagram of the acoustic emission device in the center pull-out test.
Buildings 15 02959 g006
Figure 7. Splitting damage of concrete specimens.
Buildings 15 02959 g007
Figure 8. Test-related bond–slip curves.
Buildings 15 02959 g008
Figure 9. Peak bond stress and peak slip at different factor levels.
Buildings 15 02959 g009
Figure 10. Bond fracture energy of test specimens at different factor levels.
Buildings 15 02959 g010
Figure 11. Variation in count and information entropy at different water–cement ratios.
Buildings 15 02959 g011
Figure 12. Variation in count and information entropy for different replacement rates of MS.
Buildings 15 02959 g012
Figure 13. Variation in count and information entropy at different stone powder contents.
Buildings 15 02959 g013aBuildings 15 02959 g013b
Figure 14. Energy changes at different water–cement ratios.
Buildings 15 02959 g014
Figure 15. Energy changes at different replacement rates of MS.
Buildings 15 02959 g015
Figure 16. Energy changes at different stone powder contents.
Buildings 15 02959 g016
Table 1. Chemical composition of cement.
IngredientSiO2Al2O3CaOFe2O3SO3MgOLoss
Content/%20.475.9059.644.802.083.742.44
Table 3. Mix proportion of MSC (kg/m3).
GroupMSNSCementSPGravelWaterWRA
M0S0W0.440757386011351704
M50S0W0.44378.5378.5386011351704
M100S0W0.447570386011351704
M100S5W0.44720.952038636.04811351704
M100S10W0.44688.182038668.81811351704
M100S0W0.417460413011191704
M100S0W0.477660362011501704
Note: Each group of labels consists of three variables, which represent the replacement rate of mechanized sand, the stone powder content, and the water–cement ratio. For example, the group of “M100S5W0.44” represents that the replacement rate of MS is 100%, the content of stone powder is 5%, and the water–cement ratio is 0.44.
Disclaimer/Publisher’s Note: The statements, opinions and data contained in all publications are solely those of the individual author(s) and contributor(s) and not of MDPI and/or the editor(s). MDPI and/or the editor(s) disclaim responsibility for any injury to people or property resulting from any ideas, methods, instructions or products referred to in the content.