1. Introduction
1.1. Importance of Light Environment for Wellness in Office Facilities
In modern society, human wellness is closely related not only to the improvement of individual quality of life but also to social and economic sustainability. Accordingly, this topic is being addressed as a core focus in the fields of architecture and environmental design [
1,
2]. In particular, the typical office environment, where many individuals spend most of their daily time and substantial productive activities take place, should emphasize human-centric design due to its impact on human health, emotions, and cognitive abilities [
3,
4].
Among the various environmental factors that influence human wellness in an office, the light environment plays a crucial role. The light environment can lead to visual fatigue in the eyes, which are the most actively used physical elements during work. This fatigue can affect the physical and psychological health of employees, as well as their work efficiency. Among these factors, illuminance and correlated color temperature (CCT) are key elements that directly define the indoor light environment, and they are variables that occupants can control. Therefore, they should be prioritized in architectural design and human-centric design considerations, especially when compared to more complex variables of the light environment, such as spectrum and intrinsically photosensitive retinal ganglion cell (ipRGC) sensitivity [
5,
6,
7,
8,
9,
10,
11].
Against this background, there is a growing social interest and demand for indoor light environments that promote human wellness in workspaces. Consequently, research aimed at scientifically elucidating the relationship between the physical characteristics of light environments and various human responses is actively being conducted.
1.2. Development of Previous Light Environment Studies
Prior to initiating this study, it was imperative to conduct a thorough examination of the existing literature pertaining to lighting environments within the discipline of architecture. Numerous studies have demonstrated that the indoor light conditions established within a given space can significantly influence human physical, psychological, and cognitive responses. Consequently, a variety of research methodologies have been suggested to explore these effects.
Previously, many studies have aimed to identify optimal light conditions, such as spectrum and exposure time, to improve human sleep duration, quality, and performance, primarily through actual measurements of spaces and 3D modeling-based simulations [
12,
13,
14,
15,
16]. At the same time, there have been studies that have utilized surveys and post-occupancy evaluations (POEs) to understand the relationship between light environments and human visual satisfaction, emotional stability, and stress responses [
17,
18,
19,
20,
21].
In addition to these methods, recent experimental research has been actively conducted to quantitatively collect and analyze data on the effects of light environments on human physical, psychological, and cognitive responses through the integration of various disciplines. These studies mainly set illuminance and CCT as key variables and measured physiological signals through, for example, recording heart rate variability (HRV) [
16,
22], near-infrared spectroscopy (NIRS) [
23,
24], and electroencephalogram (EEG) [
25,
26], as well as psychological indicators related to emotions and stress, and work performance, based on controlled experimental environments and participants [
22,
23,
25,
27,
28]. Recently, research has also emerged that addresses the effects of the physical properties of light, such as spectral composition and color rendering index (CRI), on visual and non-visual responses, as well as cognitive experiments involving specific participants, such as students and drivers, in virtual reality-based experimental environments [
25,
29,
30,
31].
However, such experimental-based research has common limitations found in this type of design and analysis [
Table 1].
First, many studies have been conducted based on small-scale experimental designs with limited light environment variables (2to 6 variables); these do not adequately reflect the diversity of light environments and user characteristics in actual workspaces, leading to difficulties in practical application [
16,
22,
23,
24,
25,
26,
27,
28,
32,
33,
34].
Second, most studies often rely on simple statistical techniques focused on group mean difference tests, such as the t-test or analysis of variance (ANOVA), making it difficult to understand the interaction effects between light environment variables and to assess their influence or contribution to human responses based on these results [
22,
23,
24,
25,
27,
28,
30,
32,
33,
34].
Third, most studies focus on single responses during physical, psychological response, or cognitive performance, or analyze them independently, making it challenging to comprehensively explain the mechanisms by which light environments simultaneously affect complex human responses. Additionally, analyses of interconnections or correlations between measurement indicators are rarely addressed [
22,
28,
30,
31].
Therefore, research on human-centered light environment design requires not only a comprehensive assessment of various light environment variables but also an integrated interpretation of human responses, sophisticated experimental designs considering individual user-response variations, and multi-layered analyses. This study aims to comprehensively analyze the effects of illuminance and CCT on human physiology, psychology, and work efficiency based on this awareness of the issues.
1.3. Significance and Aims of the Study
This study aimed to comprehensively analyze the effects of adjustable illuminance and CCT, which occupants can intuitively perceive and control indoors, on human physical, psychological, and cognitive responses (work performance) to enhance practicality and applicability in architectural and environmental design. While recent light research has emphasized non-visual response indicators based on biological rhythms, such as ipRGC stimulation, circadian stimulus, and melanopic lux, these indicators have limitations in terms of standardized design application and occupants’ autonomous control. Thus, this study has set illuminance and CCT as light environment variables, considering realism and user experience.
Additionally, based on the methodologies of previous research, this study aimed to differentiate itself by addressing the aforementioned limitations in a number of ways.
First, the experiments comprehensively reflected the range of changes in light environments observed in actual workspaces based on light design criteria established in existing research and sustainable certification systems.
Second, it simultaneously analyzed human physical and psychological responses, and work performance to the light environment, integrating various human responses.
Third, rather than simply testing differences between groups based on light environment variables, it quantitatively measured and compared the relative contributions and effect strengths of each light environment variable on human responses through correlation analysis and multiple regression analysis.
Based on this, the study proposed the following hypotheses to investigate the extent to which physical responses, psychological responses, and work performance are influenced by the light environment conditions formed by illuminance and CCT:
H1. Illuminance and color temperature will affect human physical, psychological, and cognitive responses.
H2. Illuminance and color temperature will have different influences on each response indicator (physical, psychological responses, and work performance), and there will exist an interrelated structure among them.
2. Materials and Methods
2.1. Experiment Design
2.1.1. Procedure
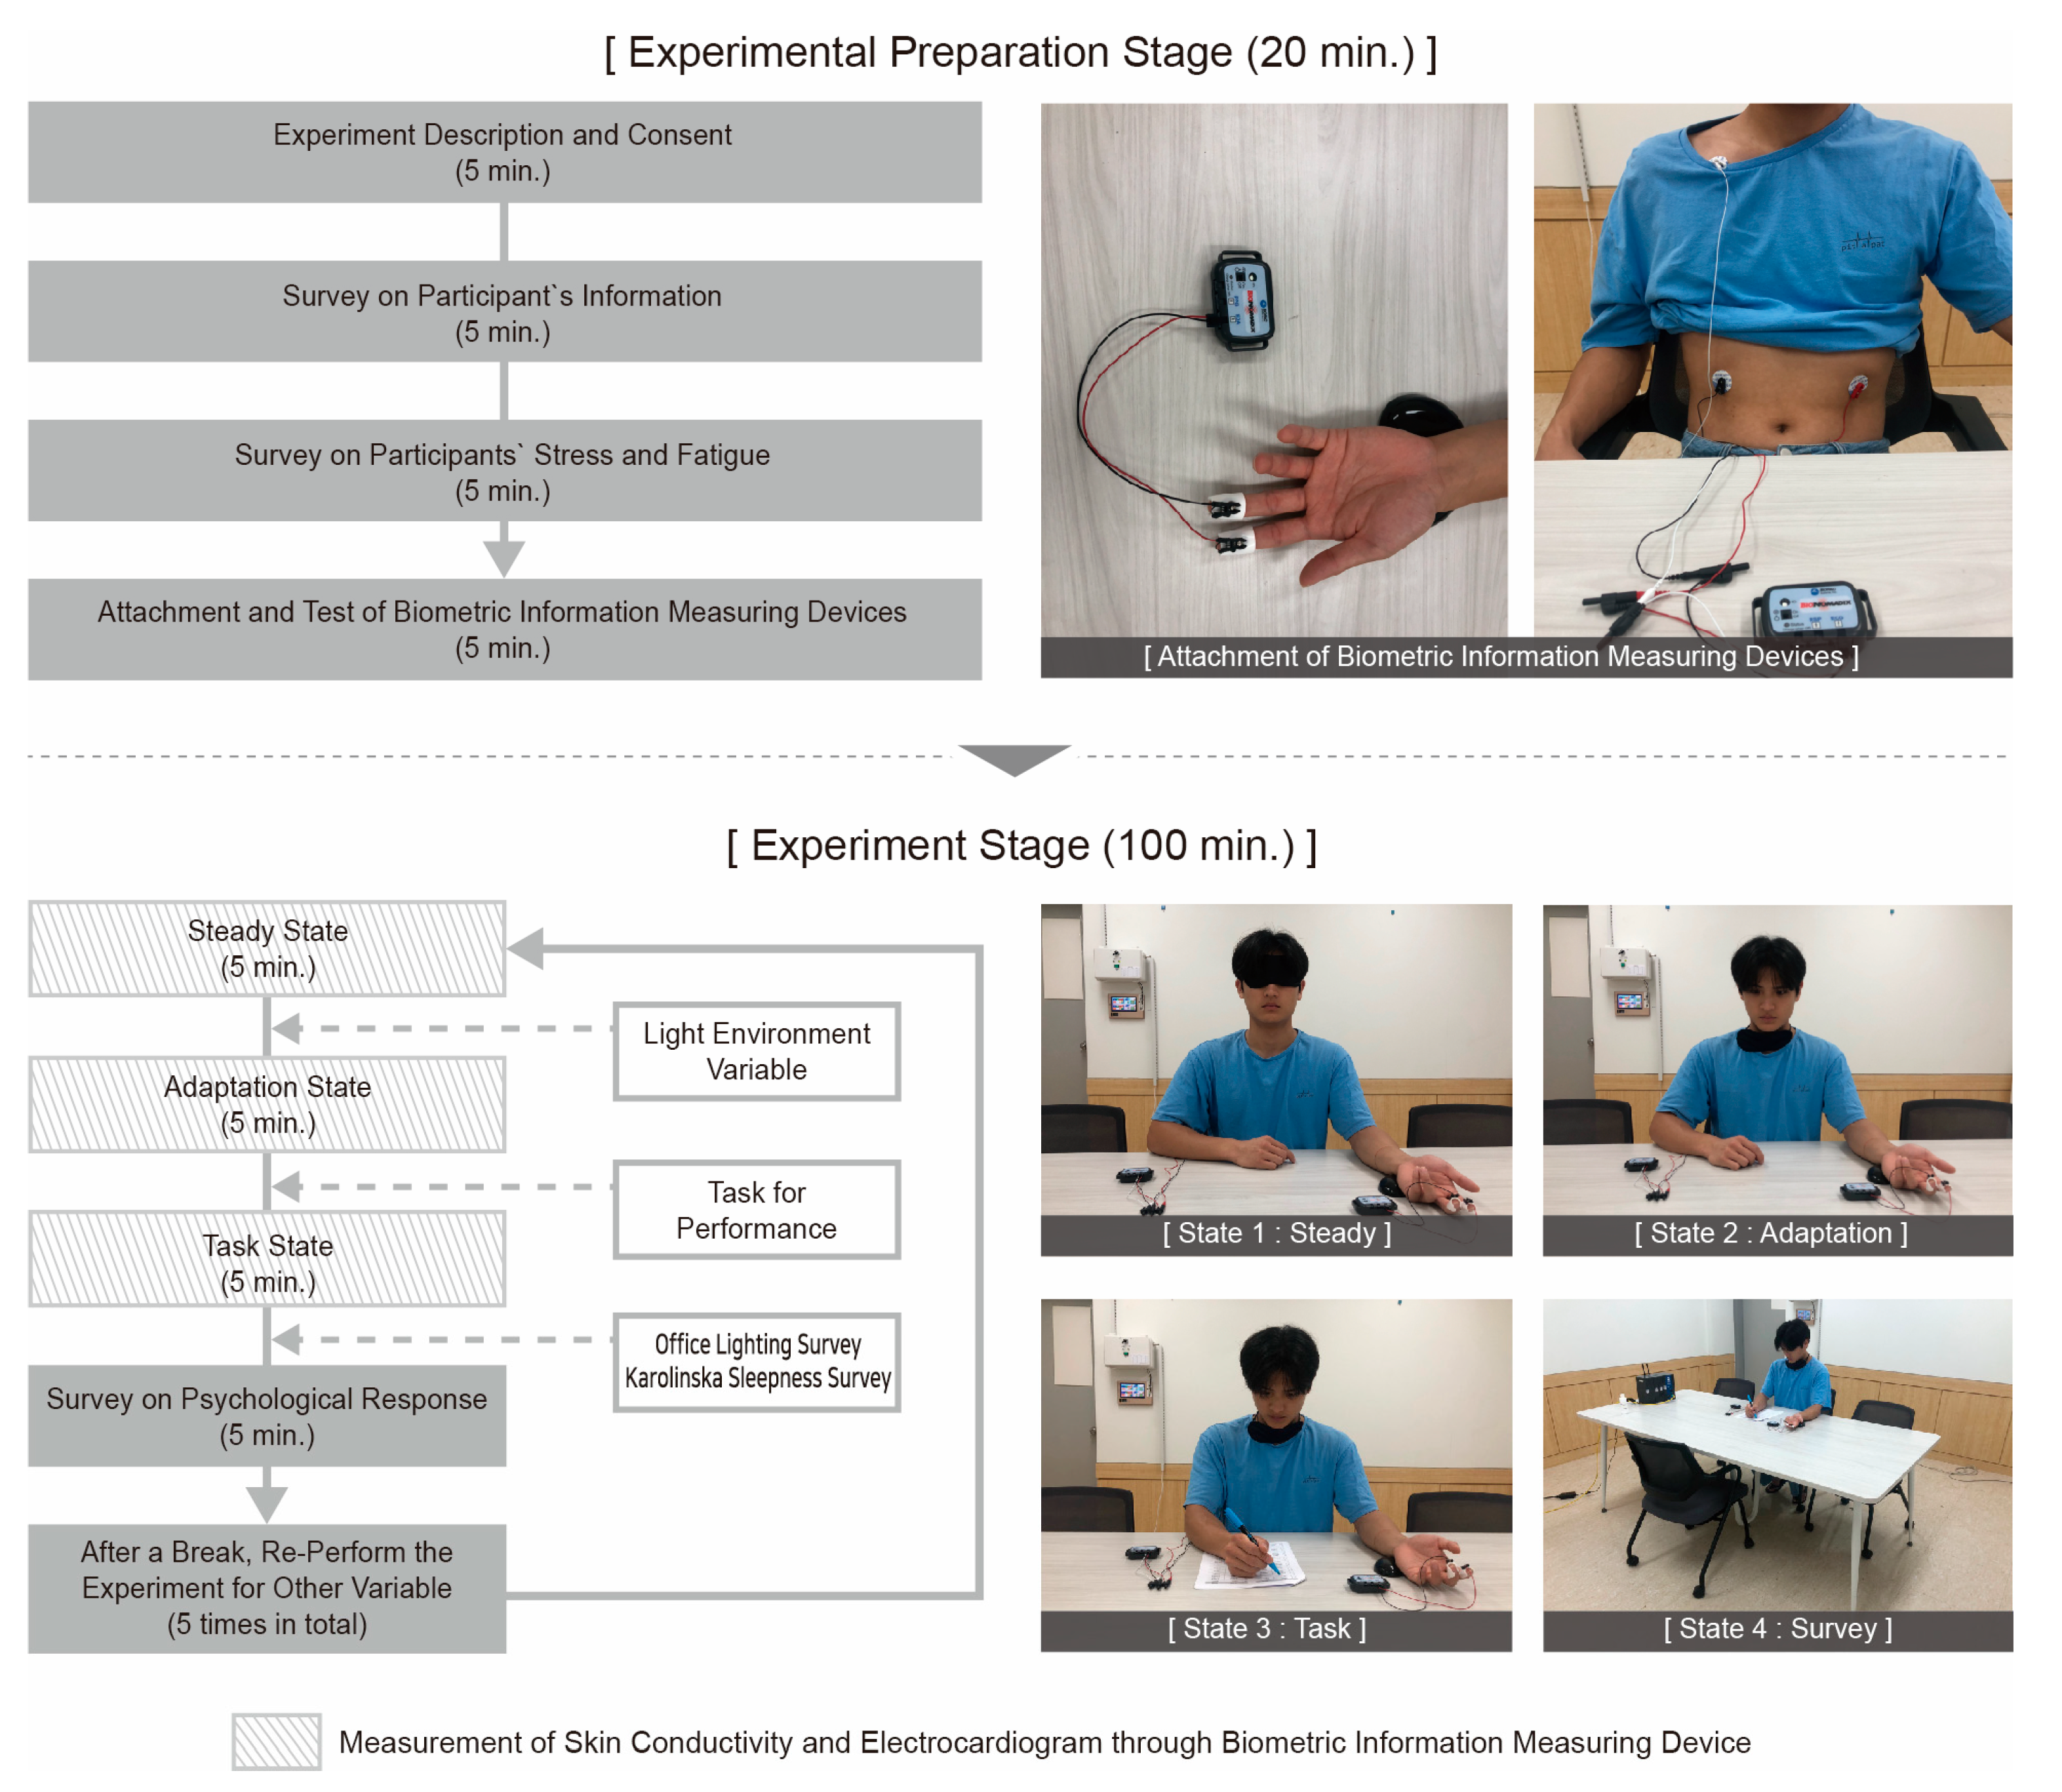
An experiment was conducted to measure the physical and psychological reactions and performance of workspace occupants according to the indoor light environment (illuminance and CCT). The experiment largely consisted of two stages—a preparation stage and an experiment stage—and took approximately 120 min. The specific steps are shown in
Figure 1.
When a participant entered the experimental space, they first heard general information about the experiment, including its purpose and procedures, and then provided their consent to participate by completing a form. In addition to collecting basic information, such as gender, age, work type, and visual issues (wearing glasses or contact lenses, color vision deficiency, and color blindness), the participant then completed a survey on health diseases (arrhythmia and pacemaker use), medication use (antidepressants and sleeping pills), and current stress and fatigue that might affect biometric information. Participants exhibiting any of these issues were excluded from the study.
Biometric information measuring devices (skin conductivity and electrocardiogram) were attached to the participant and checked to determine whether the corresponding biometric information was being collected properly. After proper data collection was confirmed, the experiment stage began. During the experiment, each participant was asked to maintain the same comfortable posture and refrain from intentional movement or deep breathing during the data measurement.
The experiment consisted of three stages: a steady state (5 min), an adaptation state (5 min), and a task state (5 min). The structure and duration of these states were designed based on previous studies on light environment experiments [
16,
22,
29,
31]. Each state served the following purposes.
First, during the “steady state”, participants wore eye patches for 5 min. This phase was designed to minimize the influence of prior light exposure on the participants and to establish baseline measurements of the experimental environment. At this stage, the researcher set one light environment variable in the experimental space. Afterwards, participants removed the eye patches and performed an “adaptation state” to the presented light environment for 5 min. During this state, participants did not perform any specific conscious actions; instead, they simply adapt to the light environment, allowing their physiological responses to stabilize. After the end of the adaptation state, a “task state” occurred in which work performance was measured. Each participant attempted to solve problems provided in writing in 5 min. In this third stage, biometric information was collected. Lastly, the participants completed a survey on their perceived preferences, visual comfort, and fatigue under the presented variables.
Afterwards, there was a short rest, and trials with the participants were conducted using different light environments in the same way. There were a total of five light environment variable trials presented to each participant. Through these steps, we aimed to minimize variability in the participants’ responses to the light environment variables and to obtain more consistent data.
2.1.2. Experimental Space and Settings
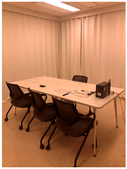
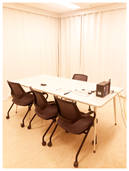
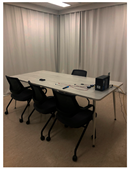
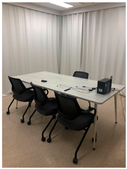
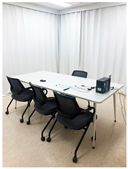
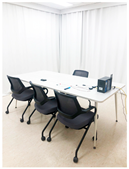
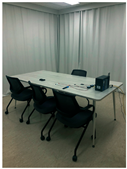
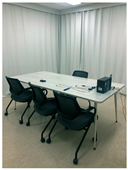
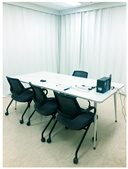
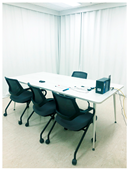
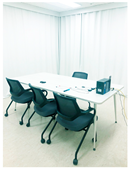
The experiment was conducted in a research laboratory (Room 203, Z1 Building, Hongik University, Seoul, Republic of Korea). This space had the advantage of being easy for the participants to access, and the researchers could also respond immediately to the experimental variables and device control. The experiment was conducted in a space that was the least affected by the external environment among the entire laboratory space (W: 4.50 m, D: 4.25 m, H: 2.56 m). In the experimental space, a blackout curtain was installed to exclude the effects of external daylight and uncontrolled artificial light. Other environmental factors remained the same (
Figure 2).
2.1.3. Light Environments
Light Environment Variables
Illuminance and CCT variables for the experiment were set according to the following criteria: the illuminance was based on the appropriate workplace illuminance (300–500 lx, 750 lx for precision work) suggested by the Korean Agency for Technology and Standards (KS A 3011), the International Commission on Illumination (ISO 8995), and the Illuminating Engineering Society of North America (IESNA Lighting Handbook) [
35,
36,
37]. The minimum illuminance value was designated as 150 lx, one level lower than 300 lx, and the maximum value was designated as 1200 lx, considering the maximum average illuminance of the workspace measurement experiment results of Kim and Lee (2024) [
38]. Accordingly, there were a total of six illuminance levels in the experiment (150, 300, 500, 750, 1000, and 1200 lx). The color temperature was set to three levels: warm white (2700 K), neutral white (4000 K), and cool white (6500 K), according to the color temperature classification standards used in general environments.
The light environment variables of the experiment (illuminance and color temperature) were systematically combined into 18 conditions. In addition, the color rendering index (CRI) was set to Ra90 for all light environment variables.
The experimental variables were configured to comprehensively encompass a range of light environments. They were designed to compare differences in human responses to each light environment variable and to analyze the interrelationships among these responses. Additionally, each light environment variable was tested independently and presented to participants in a randomized order to prevent consecutive transitions. After completing the experiment for one variable, participants were given sufficient rest and a stabilization period to minimize the influence of the previous condition.
Additionally, considering the number of experimental participants (72 people) and the number of trials per participant (five light environment variable trials), we planned to collect the same amount of data for each light environment variable (consisting of a specific luminance and CCT). Therefore, 20 data points (72 × 5 ÷ 18) were collected for each variable in the experiment.
Control and Verification
The light environment variables were controlled using a specific device. First, the device specified the CCT and then adjusted the illuminance through pulse-width modulation (PWM). Before the experiment, an illuminance meter was used to derive the PWM values suitable for the planned light environment variables.
In addition, an illuminance meter (Konika Minolta CL-500A, Tokyo, Japan) was used to verify that the light environment variable was accurately created. Illuminance and CCT were measured at the center of a desk (W: 2.0 m, D: 1.0 m, H: 0.75 m) placed in the experimental space where the study was performed. A total of three measurements were conducted per variable, and the planned light environment variables were verified by averaging the measured values. Through actual measurements, it was confirmed that the illuminance and CCT were created without major errors. The experimental space for each light environment variable is shown in [
Table 2].
2.2. Participants
2.2.1. Qualification for Participation
Participants in the experiment were recruited through an announcement within the university after receiving approval from the Institutional Review Board (IRB) of Hongik University (7002340-202306-HR-011). The experiment was conducted over approximately one month, from 4 July to 11 August 2023.
The criteria for participation included adult men and women who reported being previously exposed to indoor light environments while engaged in work or academic activities. To minimize potential differences in visual cognitive abilities and health status due to age, the age range was limited to individuals in their 20s and 30s. Ultimately, 72 individuals who met these criteria and expressed a willingness to participate were recruited.
On the day before the experiment, participants were instructed to obtain sufficient sleep and to refrain from consuming caffeine or nicotine, exercising, or overeating for at least 8 h prior to the start of the experiment. Compliance with these guidelines was verbally confirmed before the experiment began.
While a selection of previous studies involved an average of 58.93 participants [
16,
22,
23,
24,
25,
26,
27,
28,
29,
30,
31,
32,
33,
34], this study included a total of 72 participants, with the aim of collecting 360 data points. This allowed the current research to explore the effects of changes in indoor light environments on human responses more precisely and to derive highly reliable analytical results based on a relatively larger sample size compared to previous studies.
2.2.2. Basic Information About Participants
The gender ratio of the participants was 75% female (54 people) and 25% male (18 people), indicating higher participation of women. The average age was 25.18 years (SD = 3.48), which obviously fell within the range of the participant criterion. The participants’ primary reported work and study behaviors were PC work (31.5%), paperwork (18.1%), and research (13.4%). These patterns reflect tasks commonly performed in typical office environments. Regarding the use of eyeglasses or contact lenses, half of the participants (56.9%) used them. In addition, all participants reported not having any visual problems or heart-related diseases and not taking any psychotropic drugs.
2.2.3. Stress and Fatigue of Participants
After collecting basic information, the Perceived Stress Scale (PSS) and the Karolinska Sleepiness Scale (KSS) were used to measure the current stress and fatigue levels of the participants (
Table A1 and
Table A2). The reliability and validity of the PSS and KSS have been verified, and they have been used as standard indicators for assessing current stress and fatigue levels [
39,
40,
41,
42,
43]. The basic stress level of the participants averaged 16.96 points, while the fatigue level averaged 4.3 points, as measured by the two indicators. These results suggest that the participants experienced typical levels of stress and fatigue encountered in daily life while participating in the experiment.
2.3. Analysis Indicators
Data on physical responses were measured for 5 min at three stages; stability, adaptation, and task performance, with variables such as skin conductivity and heart rate variability under different light environment variables. The collected physical response data were analyzed for 3 min, excluding the first and last minute, to consider adaptation to environmental changes at each stage. To analyze the differences in work performance based on changes in the light variables, cognitive tasks were presented, and the results were used to assess the participants’ performance abilities. After all stages were completed, a survey was conducted to investigate the psychological responses (preference, visual comfort, and fatigue) related to the presented light environment.
2.3.1. Physical Responses
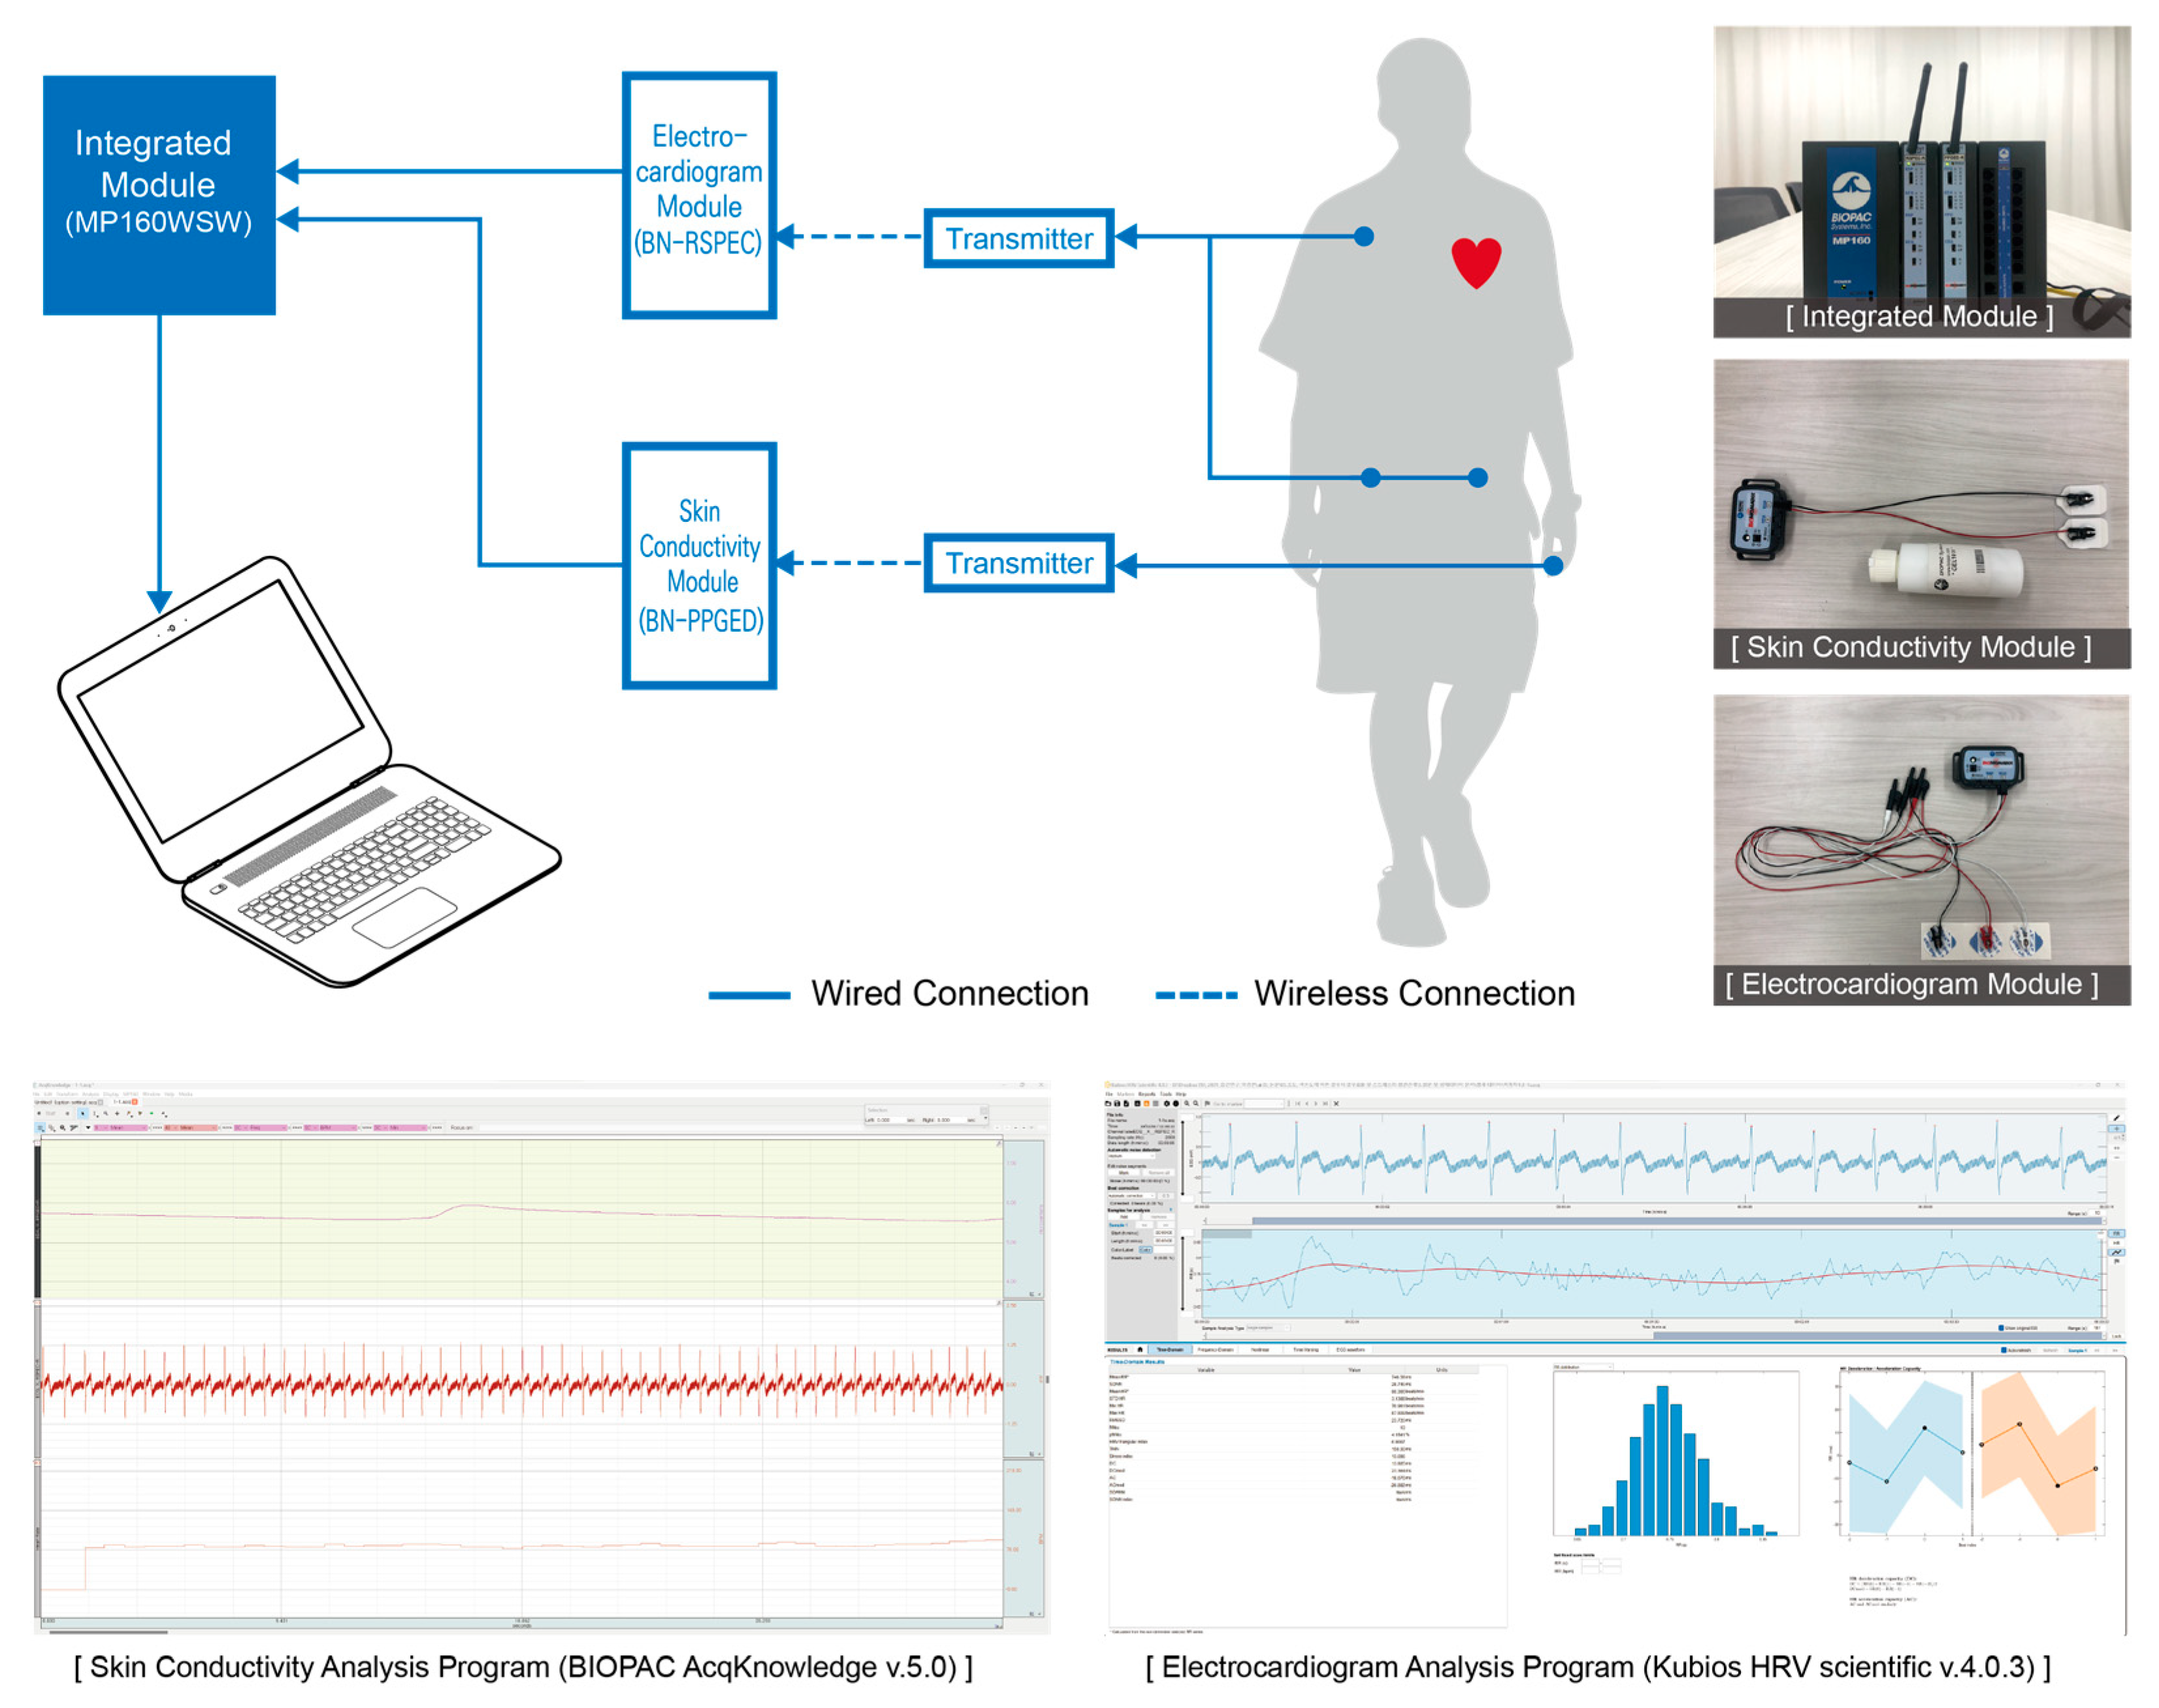
To collect data on physical responses according to light environments, devices from BIOPAC Systems (Goleta, California, USA) were utilized. The equipment consisted of an integrated module (MP160WSW), a skin conductivity module (BN-PPGED), and an electrocardiogram (ECG) module (BN-RSPEC).
The integrated module consolidates the collected biometric information and transmits it to an analysis program on a PC. The skin conductivity and ECG modules are composed of a receiver and a wireless transmitter, with measurements taken through electrodes connected to the transmitter and then relayed to the integrated module via the receiver. The information sent to the PC was analyzed through the program. In the current study, skin conductivity analysis was conducted using BIOPAC Systems’ AcqKnowledge (v.5.0, BIOPAC Systems, Goleta, California, USA), while ECG analysis was performed using Kubios’ HRV scientific (v.4.0.3, Kubios, Kuopio, Finland) (
Figure 3). The specific indicators for analyzing physical responses are described in the following paragraphs.
Skin Conductivity
Skin conductivity measures the electrical activity caused by sweat. The secretion of sweat increases due to human arousal (activation of the sympathetic nervous system) from excitement, tension, or surprise, which is reflected in an increase in skin conductivity. Skin conductivity assesses arousal in response to changes in the light environment by measuring the rate of increase or decrease during the task state, based on values measured during a steady state [
44,
45].
Heart Rate Variability (HRV)
Heart rate is influenced by the human autonomic nervous system (sympathetic nervous system: arousal; parasympathetic nervous system: relaxation). Electrocardiography (ECG) can be divided into the time domain method (TDM), which analyzes the intervals of waveforms over time, and the frequency domain method (FDM), which analyzes waveforms according to their frequency components.
In this experiment, we utilized the standard deviation of the NN interval (SDNN) to indicate sympathetic nervous system activity (the NN interval refers to the time duration between two consecutive normal sinus heartbeats in an ECG recording), the root mean square of the successive differences (RMSSD) to indicate parasympathetic nervous system activity, and the low frequency/high frequency (LF/HF) ratio from the FDM to represent the relative balance between the sympathetic and parasympathetic nervous systems. Based on this indicator, we compared the rate of increase or decrease in the task state relative to the steady state [
46,
47,
48,
49,
50,
51,
52].
2.3.2. Psychological Responses
Preference and Visual Comfort
The survey on preferences and visual comfort utilized the Office Lighting Survey (OLS), which specifically presents evaluation indicators related to light environment preferences and visual comfort [
33]. The OLS consists of a total of 12 items, with preferences assessed in items 1 to 6 and visual comfort evaluated in items 7 to 12 (
Table A3). The survey scores are summed separately for preferences and visual comfort. Based on this, an analysis of changes in psychological responses to the light environment can be conducted.
Fatigue
The fatigue level was assessed using the same KSS that was utilized to collect participants’ basic information before the experiment. By comparing the average self-reported fatigue levels of participants under different light variables, we analyzed which light environment contributed to feelings of fatigue in humans.
2.3.3. Work Performance
To measure work performance based on light variables, the Alphanumeric Verification Task (AVT) was utilized. The AVT (see
Figure 4) involves comparing the characters in a presented text (left) with those in a comparison text (right) to identify the incorrect characters in the comparison text relative to the presented text. The AVT can simulate human cognitive abilities related to office tasks (such as order numbers and accounting) performed in a work environment [
23,
53].
The AVT in this experiment consisted of six characters, a combination of uppercase letters, lowercase letters, numbers, and special symbols, with a maximum of three incorrect characters per problem (font: Arial, size: 14 pt). Because digital devices such as computers have their own light sources, the tasks were presented in printed form. During the experimental planning phase, a pre-test was conducted with the researchers to determine the appropriate number of items (100 items) and time (5 min) based on the difficulty of the problems.
Participants received two printed A4 paper sheets containing 50 items each and were asked to solve as many problems as possible within 5 min. The measurement of work performance according to AVT was analyzed by dividing it into the number of responses and the accuracy rate, calculated as follows:
The number of responses indicates work speed, while the rate of correct answers indicates work accuracy.
3. Analysis and Results
The experiment presented five light environment variables randomly to a total of 72 participants, and the analysis metrics were categorized into physical (skin conductance, SDNN, RMSSD, and LF/HF ratio), psychological (preference, visual comfort, and fatigue) responses, and work performance (speed and accuracy), with 360 data points collected for each metric. However, due to a lack of familiarity with the biometric data collection devices, errors occurred in the data of three participants, resulting in the exclusion of 15 data points. Ultimately, analysis was conducted using 345 valid data points. The valid sample sizes for each variable are shown in
Table 3.
Data analysis was conducted using IBM SPSS Statistics (v.22), and statistical significance was determined based on a 95% confidence level (p < 0.05). The analysis consisted of the four stages described in the following paragraphs.
First, a visual analysis based on descriptive statistics was performed to identify trends in physical and psychological responses and work performance indicators across 18 light environment variables composed of combinations of illuminance and CCT. This analysis focused on comparing the trends of changes according to the variables and the characteristics of each variable.
Second, the correlations between illuminance, CCT, and each analysis indicator were examined to understand the relationships among the experimental indicators based on light environment variables. Spearman’s rank correlation coefficient was used for this analysis; as the analysis indicators did not necessarily follow a normal distribution, their relationships with light environment variables did not have to be linear, and this measure allowed for stable analysis, even with small sample sizes.
Third, because correlation analysis only shows the influence between variables and does not identify causality or relative influence, multiple regression analysis was performed to quantitatively assess the impact of the light environment variables on each response indicator. The analysis set illuminance and CCT as independent variables, and each analysis indicator as dependent variables, aiming to structurally understand how the detailed elements of the light environment affected the analysis indicators.
Fourth, to understand the interrelationships among physical and psychological responses and work performance indicators, an additional correlation analysis among the indicators was conducted. This allowed for the identification of correlations not only among indicators within the same domain but also cross-relationships between heterogeneous domains while attempting an integrated interpretation of the complex structure of human responses.
3.1. Physical Responses
3.1.1. Overview of Indicators and Descriptive Trends
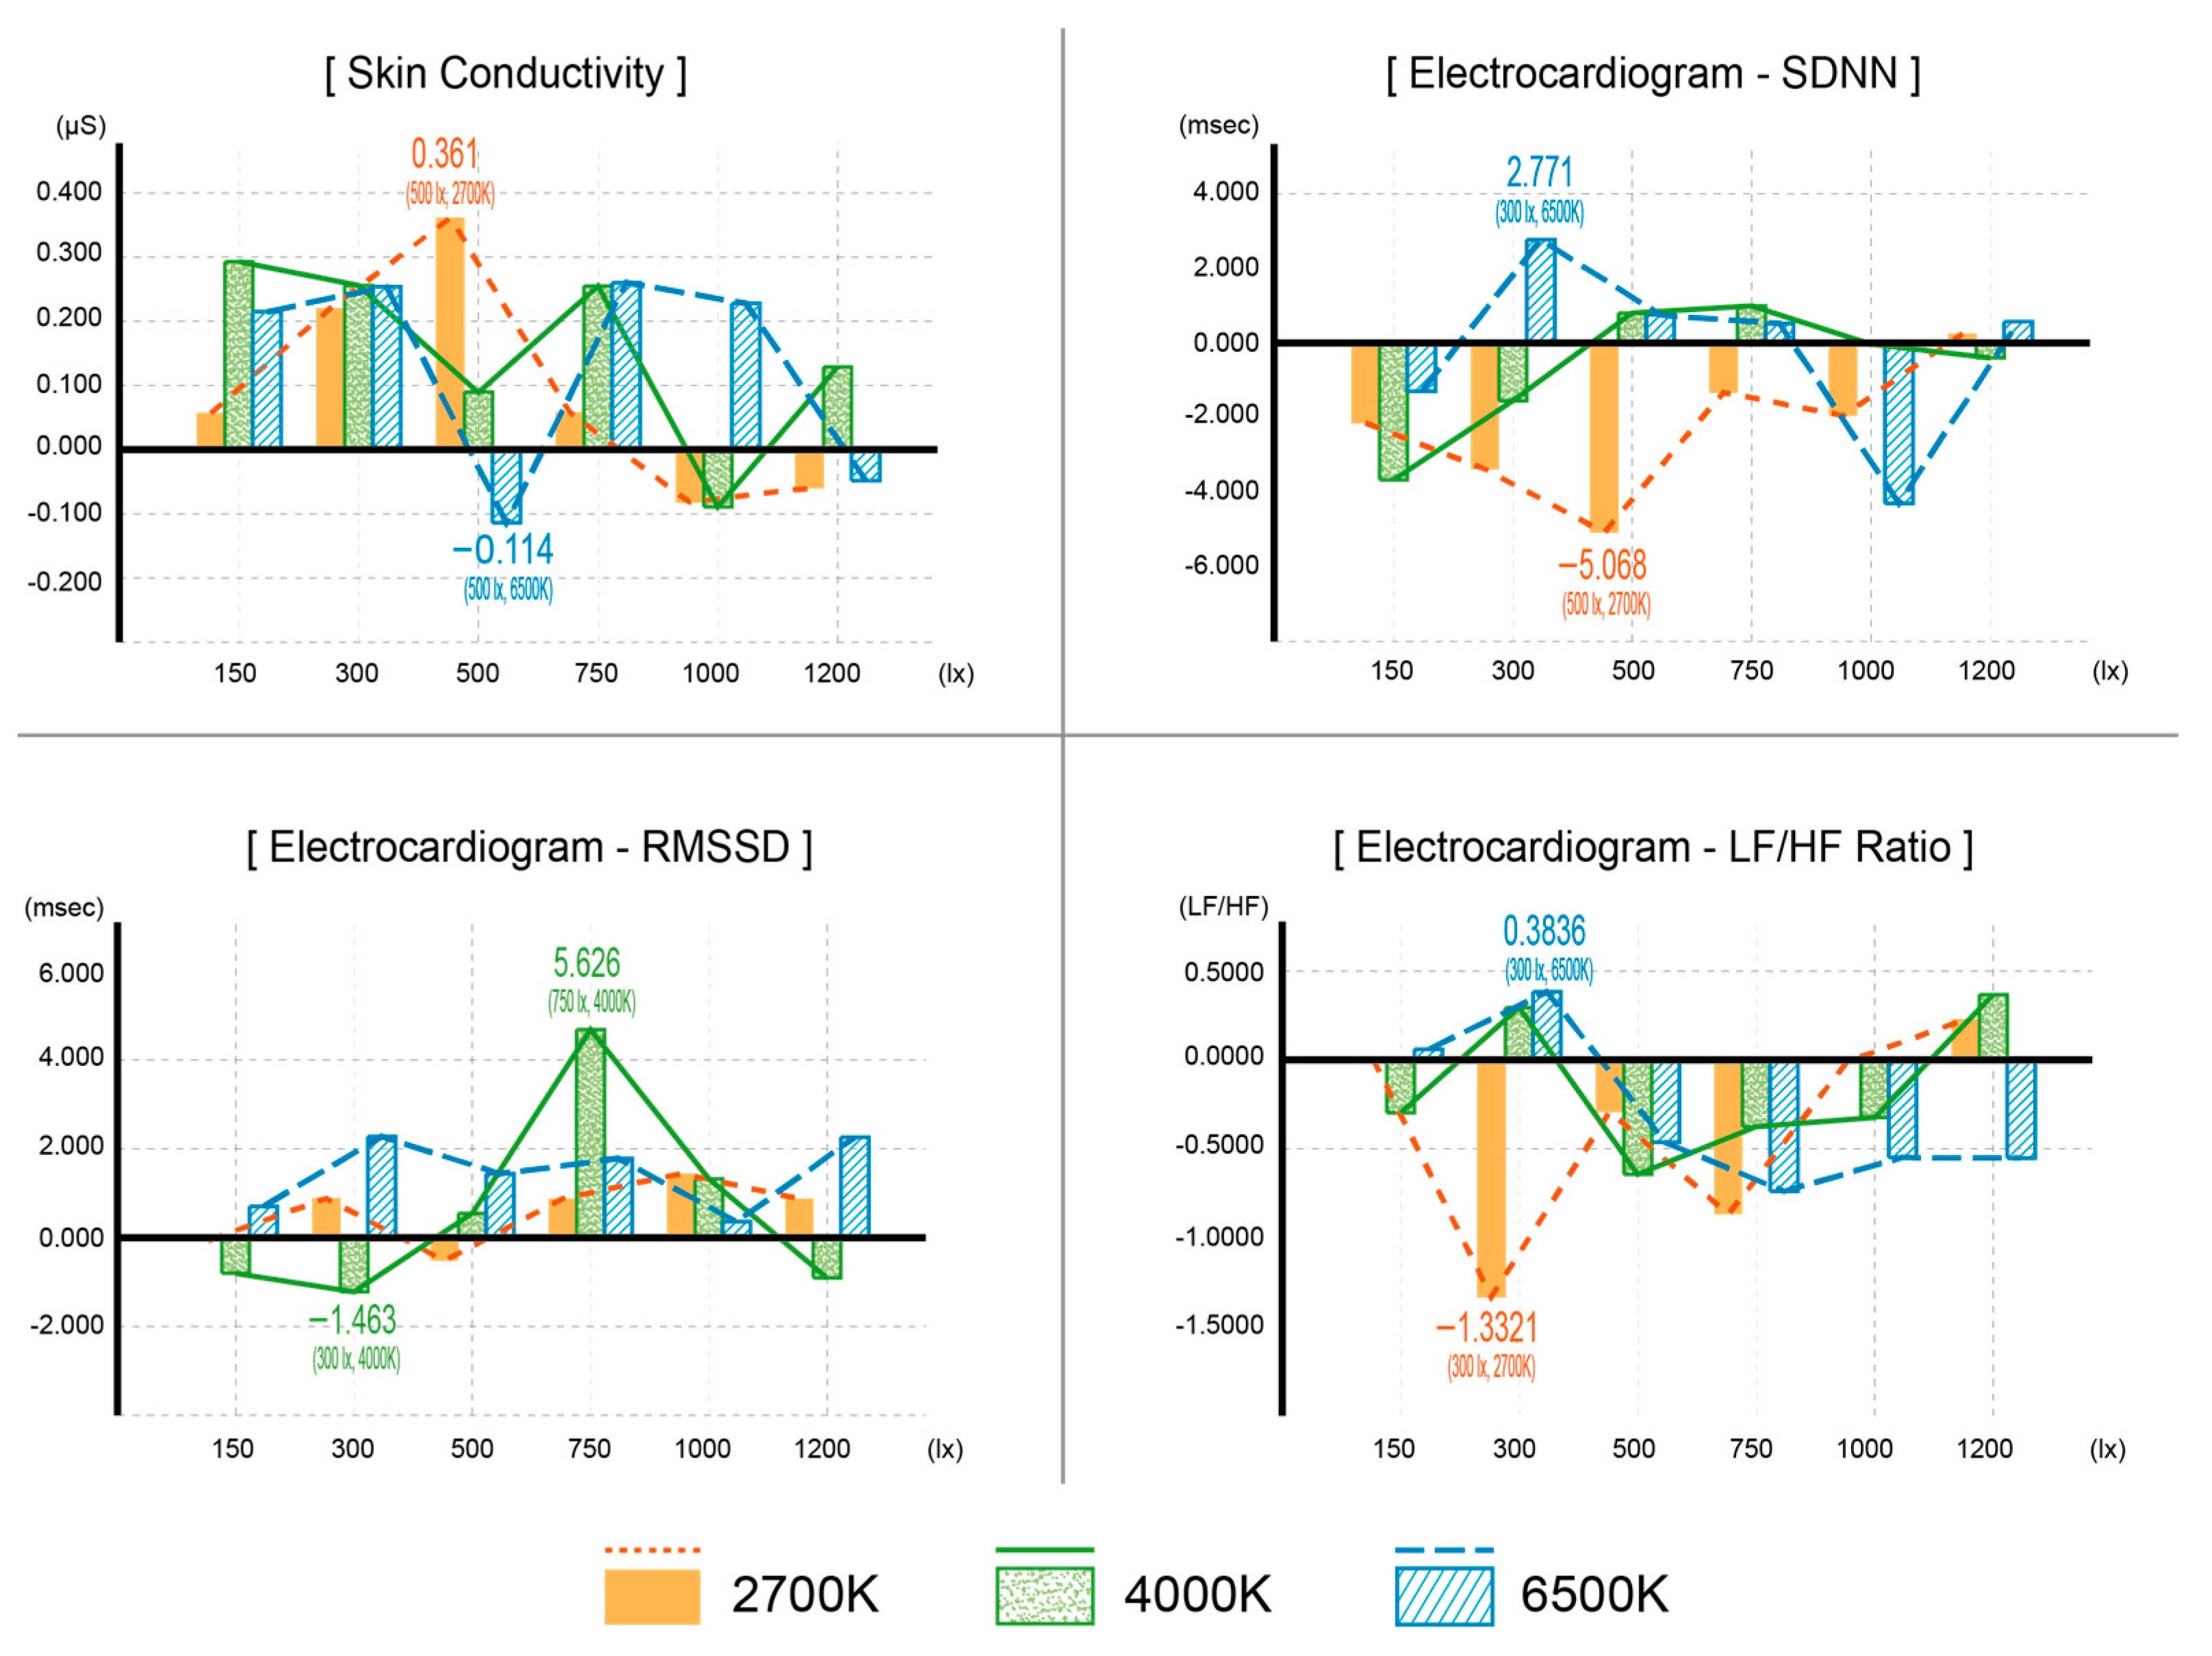
To understand the effects of different light variables on physical response indicators, the analysis was based on the changes observed during the task state compared to the steady state. The visual analysis of these changes is shown in
Figure 5 (
Table A4).
In terms of skin conductivity, the highest level of sympathetic nervous system activation was observed under the 500 lx/2700 K condition, while an increase in CCT to 6500 K at the same illumination level showed the lowest arousal response. This suggests that changes in CCT within the same illumination level can inversely affect arousal levels.
Among the electrocardiogram indicators, SDNN, which is related to sympathetic nervous system activation, showed the largest increase at the 300 lx/6500 K condition, while RMSSD (which indicates parasympathetic nervous system activation) was higher at the 750 lx/4000 K condition and lower at the 300 lx/4000 K condition. The LF/HF ratio indicated a tendency toward sympathetic dominance at the 300 lx/6500 K condition and parasympathetic dominance at the 300 lx/2700 K condition.
These results imply that the response patterns among individual indicators differed and that various physiological stimuli could be induced depending on the combination of illumination and CCT conditions. However, the consistency of the responses was limited, which can be interpreted as reflecting the individual variability that occurs in experiments involving human participants. Therefore, it is difficult to definitively conclude that specific light variables reliably induced physical responses, and it was deemed that it would be necessary to expand the repeated measurements and conduct longer term exposures to light environments for more stable interpretations.
3.1.2. Correlation Analysis with Light Environment Variables
The analysis of the correlations between light environment variables and physiological response indicators showed that there were no statistically significant correlations between illuminance and CCT and the physiological response indicators, as shown in
Table 4 (
p > 0.05). This indicates that changes in the light environment variables during the experiment did not have a consistent effect on physiological responses. Additionally, it can be interpreted that physical responses were influenced by a variety of external factors, such as the participant’s condition, stress, and emotional state.
3.1.3. Multiple Regression Analysis with Light Environment Variables
The results of the regression analysis between light environment variables and physical response indicators showed that, as seen in
Table 5, both illuminance and CCT did not have statistically significant effects on any of the physical indicators (
p > 0.05). This suggests that the intensities of the stimuli were not strong enough to significantly alter physiological responses to the light conditions, or that the exposure time was relatively short. Additionally, because the experimental environment was controlled, there is a possibility that the participants’ stress levels were at a normal range, which may have resulted in less pronounced physiological responses.
3.2. Psychological Responses
3.2.1. Overview of Indicators and Descriptive Trends
To understand the impact of various light environment variables on psychological response indicators, preference and visual comfort were analyzed based on the average sum of scores for the relevant items in the OLS questionnaire, while fatigue was analyzed using the average score from the KSS. The results derived from this analysis are shown in
Figure 6 (
Table A5).
Preference was highest in the 1000 lx/4000 K condition and lowest in the 300 lx/2700 K condition. For visual comfort, the highest rating was observed in the 1200 lx/4000 K condition, while the lowest rating was in the 300 lx/2700 K condition. Additionally, fatigue was lowest in the 1200 lx/4000 K condition and highest in the 150 lx/2700 K condition.
Under the 6500 K color temperature condition, preference and visual comfort points were lower in high-illumination environments above 750 lx compared to the 4000 K condition, while fatigue levels were higher. This suggests that the daylight color temperature (6500 K) may have been perceived by participants as psychologically too cold or excessively bright.
These results indicate that psychological response indicators reacted in a relatively consistent manner to changes in the light environment. In particular, combinations of medium to high brightness and intermediate CCT had a positive psychological effect, while low brightness and low CCT environments or high brightness and high CCT environments acted as factors that increased visual discomfort and fatigue. This suggests that the appropriate combination of illuminance and CCT plays a crucial role in maintaining the psychological satisfaction and condition of occupants.
3.2.2. Correlation Analysis with Light Environment Variables
The analysis of the correlations between light environment variables and psychological response indicators showed that all three psychological response indicators had statistically significant correlations, as shown in
Table 6 (
p < 0.001). Additionally, as the light environment increased, visual comfort and preference also increased (+), while fatigue decreased (−). These results indicate that light environment variables had an immediate and pronounced effect on the subjective psychological state of occupants rather than their physical condition. In particular, it suggests that bright environments and CCT above medium tend to enhance the psychological satisfaction of occupants and reduce fatigue.
3.2.3. Multiple Regression Analysis with Light Environment Variables
To evaluate the influence of each light environment variable on psychological responses, a multiple regression analysis was conducted, and the results are described in this section (
Table 7).
First, preference was significantly affected by illuminance and CCT. In contrast, visual comfort and fatigue showed that illuminance had a significant impact, whereas CCT did not have a notable effect. This suggests that illuminance is a key variable that influences all indicators of psychological responses, whereas CCT can be interpreted as a factor that primarily has a limited influence on comfort and fatigue.
3.3. Work Performance
3.3.1. Overview of Indicators and Descriptive Trends
The analysis of work performance was based on the AVT results performed by the participants. The average response count (work speed) for the given time (5 min) and the accuracy rate (work accuracy) relative to the total response count were calculated for each light variable to analyze trends. The results for response count and accuracy under each light variable are shown in
Figure 7 (
Table A6).
The analysis revealed that the response count was highest under the 750 lx/4000 K condition, while it was lowest under the 750 lx/2700 K condition, where the CCT was lower at the same illuminance. In contrast, the accuracy rate was highest under the 150 lx/4000 K condition and lowest under the 300 lx/4000 K condition.
This suggests that a combination of moderate illuminance and moderate CCT contributes to increased work speed, while accuracy can vary even under moderate illuminance conditions due to slight differences in CCT. However, the overall trend of work performance indicators was not particularly clear based on the light variables, and there was no pattern in which both response number and accuracy rates were high under the same variables. This implies that work efficiency may be less sensitive to changes in light conditions compared to physical and psychological responses, or that factors such as task type and time may have a greater influence.
3.3.2. Correlation Analysis with Light Environment Variables
The analysis of the correlations between light environment variables and the speed and accuracy of tasks showed no statistically significant correlations, as indicated in
Table 8 (
p > 0.05). This suggests that changes in the light environment within the experimental conditions do not have a direct relationship with work speed or accuracy.
These results imply that the light environment variables may not directly affect work ability but rather could act indirectly through physical and psychological factors. It is also possible that the type and duration of the task did not provide sufficient stimulation to induce changes in the indicators of work performance.
3.3.3. Multiple Regression Analysis with Light Environment Variables
The results of a multiple regression analysis evaluating the quantitative impact of illuminance and CCT on work performance (speed and accuracy) showed that neither independent variable had a significant effect on either dependent variable (
Table 9).
In other words, illuminance and CCT did not have statistically significant explanatory power in the regression model regarding the speed and accuracy of AVT performance. This is consistent with the correlation analysis results and suggests that there is a low direct causal relationship between light environment variables and work performance. Additionally, considering that this aligns with the analysis of physical indicators, there may be a possibility of similarity in human response sensitivity between work performance and physical responses.
3.4. Interrelationship Among Human Response Indicators
To understand the interrelationships between physical and psychological responses and work performance, a correlation analysis was conducted across all analytical indicators. As a result, statistically significant correlations were found not only among indicators within the same domain but also between different domains (
Table 10).
First, within the same domain, the following correlations were observed: significant correlations were found between the following physiological response indicators: skin conductivity ↔ SDNN, SDNN ↔ RMSSD, SDNN ↔ LF/HF ratio, and RMSSD ↔ LF/HF ratio. This indicates that the time and frequency domain indicators of the autonomic nervous system were interrelated based on a common physiological mechanism.
In terms of psychological response indicators, significant correlations were confirmed among the following: preference ↔ visual comfort, preference ↔ fatigue, and visual comfort ↔ fatigue. This suggests that psychological satisfaction and fatigue can simultaneously respond to subjective evaluations of the light environment.
Significant results were also observed in the cross-correlation analysis between different domains. Significant correlations were found between the following physical responses and work performance: skin conductivity ↔ work speed, RMSSD ↔ work accuracy, and LF/HF Ratio ↔ work accuracy, indicating that the level of physical arousal may be associated with work performance.
A significant correlation was also found between physical and psychological responses, specifically SDNN ↔ visual comfort, showing that autonomic nervous system responses may be linked to evaluations of psychological stability.
Between psychological responses and work performance, significant correlations were observed in preference ↔ work speed, visual comfort ↔ work speed, and fatigue ↔ work speed. This confirms that a psychologically positive light environment can enhance work speed.
These results suggest that physical, psychological, and cognitive responses do not operate independently but function as an organic response system within the light environment. Notably, it is important that physical response and work performance indicators, which did not show direct effects from illuminance and CCT, exhibited significant relationships with each other. This indicates the possibility that specific responses may operate in conjunction with other responses mediated by psychological evaluations rather than reacting to the environment in isolation. Therefore, it is necessary to systematize the mediating relationships and interaction structures among the responses, focusing on psychological responses rather than conducting independent analyses of each response.
4. Discussion
4.1. Interpretation of Results
This study comprehensively measured physical and psychological responses, as well as work performance, in relation to 18 light environment variables based on combinations of illuminance and CCT, and analyzed the effects and interrelationships of these responses using experimental data. The experiment was conducted based on a controlled experimental design to clearly identify response characteristics under each lighting condition across various light environment variables.
The analysis revealed that psychological response indicators were the most sensitive to changes in the light environment. Preferences were significantly influenced by both illuminance and CCT, while visual comfort and fatigue showed significant responses only to illuminance. This suggests that a bright illuminance with a neutral white color temperature is effective in enhancing users’ psychological satisfaction and reducing fatigue.
However, the physical response indicators showed some trends depending on individual conditions, but overall, there were no direct relationships of those indicators with illuminance and CCT. However, the correlations among the physiological indicators were clear, indicating that the autonomic nervous system responses were based on a consistent physiological mechanism.
Although no direct significance was found between work efficiency and illuminance or CCT, response counts and accuracy rates showed trends under certain conditions (750 lx/4000 K and 150 lx/4000 K). This implies that changes in the light environment may be less influential on work performance than factors such as task difficulty, execution time, or individual differences.
It is noteworthy that the analysis of the intercorrelations among the various response indicators in this study revealed significant connections. Higher preferences and visual comfort were associated with increased work speed, while higher fatigue levels were linked to decreased speed. Additionally, some physiological indicators, such as RMSSD and LF/HF ratio, showed correlations with accuracy. This suggests that psychological responses may act as mediators for physical responses and work performance, indicating that the light environment may operate within a complex response system rather than as a single response.
4.2. Comparison with Previous Studies
The results of this study that indicated that psychological indicators respond sensitively to illuminance and CCT were consistent with previous studies. In particular, the finding that preference and visual comfort were increased at high illuminance and neutral color temperatures is similar to the results of Shamsul et al. (2013) and Zhu et al. (2017) [
32,
33].
In contrast, the physical response indicators and work performance indicators largely lacked consistency in the interpretation of results from existing studies, which can be attributed to factors such as short exposure times, participant diversity, and a lack of control of experimental conditions.
The current research differs from previous studies that compared individual indicators based on light conditions by quantitatively analyzing the interconnections and structural characteristics among various response indicators and interpreting them in an integrated manner. In particular, it confirmed the possibility that psychological responses can mediate physical responses, and work performance provides meaningful implications for future studies on cognitive and emotional responses based on light environments.
4.3. Practical Implications
The results of this study highlight the diversity of responses from occupants in existing indoor light environments based on current standards and designs, particularly emphasizing the importance of psychological characteristics. It offers a number of practical implications.
First, illuminance is the variable that was examined that had the most significant impact on psychological responses, such as preference, visual comfort, and fatigue. An illuminance level of 750 lux or higher had a positive effect on visual comfort and fatigue reduction. This suggests that the illuminance standards presented in existing sustainable certification systems do not directly correlate with users’ subjective experiences or improvements in work performance. Therefore, illuminance standards should move away from static illuminance values and instead recommend a flexible range of illuminance that can be adjusted based on the type of work, the physical and psychological state of the user, and the type of tasks, as well as the application of personalized illuminance control systems.
Second, CCT affected preference but had a limited influence on visual comfort and fatigue. This suggests that the relative impact of illuminance is greater than that of CCT itself. Thus, CCT can be utilized as a secondary element for creating emotional atmospheres and aesthetics in spaces centered around illuminance.
Third, this study confirmed that psychological satisfaction had a direct and indirect impact on work performance, particularly work speed, through an integrated analysis of various response indicators. This implies the need for a human-centered light environment design that incorporates both quantitative and qualitative user-centered responses, contrasting with existing light standards that focus primarily on visual clarity or energy efficiency. There is potential for practical applications in smart offices and personalized light systems.
Finally, the correlation structure identified among the indicators in this study suggests the possibility of transitioning from existing single-response-centered light evaluations to an expanded model through factor analysis of the correlations identified. This could provide a structural basis for AI-based light control systems or algorithms for predicting light responses based on individual biometric information.
5. Conclusions
This study quantitatively analyzed the effects of a light environment composed of adjustable factors, such as illuminance and CCT, on human physical and psychological responses as well as work performance. Additionally, it aimed to identify the interrelationship structure among response indicators to provide a framework for integrated interpretation.
The analysis revealed that psychological response indicators were most sensitive to changes in the light environment variables. In particular, preferences were significantly influenced by both illuminance and CCT, while visual comfort and fatigue were significantly affected by illuminance. In contrast, physical responses and work performance did not show significant direct relationships with the light environment variables; however, the correlation between response indicators suggested the possibility that psychological responses could mediate physical arousal and work performance. These results indicate the need to understand the structure in which various human responses operate organically, centered around psychological responses in light environment design and highlighting the necessity for an integrated approach. Therefore, this study can serve as foundational data for human-centered light design, feedback-based control systems, and the supplementation of quantitative standards, moving beyond the limitations of previous studies that focused on static criterion comparisons or single-response analyses by empirically presenting structural connections among multiple responses.
However, this study has the following limitations.
First, according to the G*Power (v.3.1.9.7) analysis, the minimum sample size required for regression analysis was 107. Although this study collected 345 data points, the sample size for each lighting environment variable ranged from only 18~20, which may limit the statistical power.
Second, the participants constituted a relatively homogeneous group, primarily individuals in their 20s and 30s, with a gender imbalance favoring females. This limitation restricts the study’s capacity to accurately represent the behaviors of users in real office environments, which encompasses a broader range of ages, job roles, and work types.
Third, to clearly analyze the effects of variables (illuminance and CCT), the study employed a controlled environment and paper-based tasks, thereby excluding complex factors present in real office settings, such as daylight, spatial layout, and shading controls. Consequently, generalizing the physical and behavioral complexities of actual office spaces is limited.
Fourth, while the study focused on illuminance and color temperature—variables that occupants can directly adjust in a work environment—it did not consider higher-dimensional variables of the light environment such as spectrum, light distribution, and circadian rhythms.
Therefore, future research should focus on more diverse populations, including variations in gender, age, job roles, and work types. It is also essential to establish a precise experimental framework that incorporates real office-environment factors and higher-dimensional light variables to improve validity. Based on the collected data, classifying and identifying response patterns will be necessary for more sophisticated analysis. This approach is expected to provide a foundation for human-centered light environment design and the development of smart lighting control technologies.
Author Contributions
K.S.L. and K.R.K. conceived and designed the experiments; K.S.L. and K.R.K. performed the experiments; K.R.K. and H.C. analyzed the data; K.R.K., H.C. and K.S.L. wrote the paper. All authors have read and agreed to the published version of the manuscript.
Funding
This work was supported by a National Research Foundation of Korea (NRF) grant funded by the Republic of Korea government, Ministry of Science and ICT (MSIT) (No. NRF-2021R1A2C2011849) and by the Gachon University research fund of 2025 (GCU-202500660001).
Institutional Review Board Statement
The study protocol was approved by the Institutional Review Board of Hongik University (7002340-202306-HR-011 and 13 June 2023).
Informed Consent Statement
Informed consent was obtained from all individuals involved in the study.
Data Availability Statement
The original contributions presented in this study are included in the article. Further inquiries can be directed to the corresponding author.
Conflicts of Interest
The authors declare no conflicts of interest. The funding sponsors had no role in the design of the study; in the collection, analyses, or interpretation of data; in the writing of the manuscript; or in the decision to publish the results.
Appendix A
Table A1.
Perceived Stress Scale (PSS).
Table A1.
Perceived Stress Scale (PSS).
| No. | During the Last Month, How Often You Thought or Felt the Following? | Scale and Points |
|---|
| Never | Almost Never | Sometimes | Fairly
Often | Very
Often |
|---|
| 1 | How often have you been upset because of something that happened unexpectedly? | | | | | |
| 2 | How often have you felt that you were unable to control the important things in your life? | | | | | |
| 3 | How often have you felt nervous and “stressed”? | | | | | |
| 4 | How often have you felt confident about your ability to handle your personal problems? | | | | | |
| 5 | How often have you felt that things were going your way? | | | | | |
| 6 | How often have you found that you could not cope with all the things that you had to do? | | | | | |
| 7 | How often have you been able to control irritations in your life? | | | | | |
| 8 | How often have you felt that you were on top of things? | | | | | |
| 9 | How often have you been angered because of things that were outside of your control? | | | | | |
| 10 | How often have you felt difficulties were piling up so high that you could not overcome them? | | | | | |
Table A2.
Karolinska Sleepiness Scale (KSS).
Table A2.
Karolinska Sleepiness Scale (KSS).
| No. | Here Are Some Descriptors About How Alert or Sleepy You Might Be Feeling Right Now.
Please Read Them Carefully and Then Choose the One Scale Item That Best Corresponds to the Statement Describing How You Feel at the Moment. | Scale |
|---|
| 1 | Extremely alert | 1 |
| 2 | Very alert | 2 |
| 3 | Alert | 3 |
| 4 | Rather alert | 4 |
| 5 | Neither alert nor sleepy | 5 |
| 6 | Some signs of sleepiness | 6 |
| 7 | Sleepy, but no effort to keep awake | 7 |
| 8 | Sleepy, but some effort to keep awake | 8 |
| 9 | Very sleepy, great effort to keep awake, fighting sleep | 9 |
| 10 | Extremely sleepy, can’t keep awake | 10 |
Table A3.
Office Lighting Survey (OLS).
Table A3.
Office Lighting Survey (OLS).
| Category | No. | Question | Scale |
|---|
| No | Somewhat
No | Somewhat
Yes | Yes |
|---|
| Preferences | 1 | I like the lighting in this office. | 0 | 1 | 2 | 3 |
| 2 | In general, the lighting in this office is comfortable. | 0 | 1 | 2 | 3 |
| 3 | This color of light allows me to carry out different tasks. | 0 | 1 | 2 | 3 |
| 4 | My skin looks natural under the light. | 0 | 1 | 2 | 3 |
| 5 | The lighting in this office is too warm. | 3 | 2 | 1 | 0 |
| 6 | The lighting in this office is too cold. | 3 | 2 | 1 | 0 |
Visual
Comfort | 7 | I feel eye strain. | 3 | 2 | 1 | 0 |
| 8 | My eyelids are heavy. | 3 | 2 | 1 | 0 |
| 9 | My eyes feel dry. | 3 | 2 | 1 | 0 |
| 10 | I have burning eyes. | 3 | 2 | 1 | 0 |
| 11 | I have a headache working under this color of light. | 3 | 2 | 1 | 0 |
| 12 | I have difficulties in seeing objects
under this light. | 3 | 2 | 1 | 0 |
Table A4.
Statistical descriptions of the physical response indicators in the light environment variables.
Table A4.
Statistical descriptions of the physical response indicators in the light environment variables.
Physical
Response
Indicator | Illuminance
(lux) | Correlated Color Temperature (K) |
|---|
| 2700 K | 4000 K | 6500 K |
|---|
| N | Mean | SD | N | Mean | SD | N | Mean | SD |
|---|
Skin
conductivity | 150 lx | 20 | 0.057 | ±0.334 | 20 | 0.293 | ±1.129 | 19 | 0.215 | ±0.664 |
| 300 lx | 18 | 0.22 | ±0.815 | 20 | 0.256 | ±0.683 | 20 | 0.254 | ±1.093 |
| 500 lx | 19 | 0.361 | ±0.936 | 18 | 0.09 | ±0.589 | 17 | −0.114 | ±0.581 |
| 750 lx | 20 | 0.058 | ±0.543 | 19 | 0.255 | ±1.067 | 20 | 0.26 | ±0.879 |
| 1000 lx | 19 | −0.082 | ±0.835 | 18 | −0.089 | ±0.337 | 20 | 0.228 | ±0.756 |
| 1200 lx | 18 | −0.06 | ±0.592 | 20 | 0.129 | ±0.697 | 20 | −0.048 | ±0.495 |
| SDNN | 150 lx | 20 | −2.145 | ±15.374 | 20 | −3.668 | ±9.469 | 19 | −1.299 | ±6.041 |
| 300 lx | 18 | −3.382 | ±8.008 | 20 | −1.549 | ±7.671 | 20 | 2.771 | ±6.703 |
| 500 lx | 19 | −5.068 | ±11.009 | 18 | −0.801 | ±9.454 | 17 | −0.75 | ±8.609 |
| 750 lx | 20 | −1.325 | ±6.465 | 19 | 0.993 | ±8.230 | 20 | 0.523 | ±10.494 |
| 1000 lx | 19 | −1.947 | ±9.325 | 18 | −0.034 | ±8.765 | 20 | −4.3 | ±9.254 |
| 1200 lx | 18 | 0.242 | ±9.894 | 20 | −0.4 | ±8.665 | 20 | 0.568 | ±10.600 |
| RMSSD | 150 lx | 20 | −0.073 | ±15.608 | 20 | −0.962 | ±9.962 | 19 | 0.848 | ±5.021 |
| 300 lx | 18 | 1.064 | ±8.003 | 20 | −1.463 | ±6.313 | 20 | 2.737 | ±7.495 |
| 500 lx | 19 | −0.62 | ±9.960 | 18 | 0.661 | ±8.603 | 17 | 1.733 | ±7.057 |
| 750 lx | 20 | 1.058 | ±6.435 | 19 | 5.626 | ±7.196 | 20 | 2.143 | ±7.834 |
| 1000 lx | 19 | 1.731 | ±6.775 | 18 | 1.593 | ±6.360 | 20 | 0.434 | ±9.171 |
| 1200 lx | 18 | 1.054 | ±7.123 | 20 | −1.087 | ±7.805 | 20 | 2.719 | ±11.134 |
| LF/HF ratio | 150 lx | 20 | 0.0079 | ±1.9431 | 20 | −0.2967 | ±2.3015 | 19 | 0.0599 | ±1.8838 |
| 300 lx | 18 | −1.3321 | ±3.4734 | 20 | 0.2952 | ±1.7187 | 20 | 0.3836 | ±2.3848 |
| 500 lx | 19 | −0.2907 | ±2.7812 | 18 | −0.6429 | ±3.4055 | 17 | −0.4622 | ±3.4344 |
| 750 lx | 20 | −0.8664 | ±4.8799 | 19 | −0.3746 | ±3.8487 | 20 | −0.7381 | ±2.0598 |
| 1000 lx | 19 | −0.0105 | ±2.4778 | 18 | −0.3237 | ±2.0158 | 20 | −0.5485 | ±2.0748 |
| 1200 lx | 18 | 0.2278 | ±3.2525 | 20 | 0.3684 | ±1.3320 | 20 | −0.5513 | ±3.2018 |
Table A5.
Statistical descriptions of the psychological response indicators in the light environment variables.
Table A5.
Statistical descriptions of the psychological response indicators in the light environment variables.
Psychological
Response
Indicator | Illuminance
(lux) | Correlated Color Temperature (K) |
|---|
| 2700 K | 4000 K | 6500 K |
|---|
| N | Mean | SD | N | Mean | SD | N | Mean | SD |
|---|
| Preferences | 150 lx | 20 | 9.25 | ±2.245 | 20 | 9.85 | ±2.434 | 19 | 10.53 | ±2.632 |
| 300 lx | 18 | 9 | ±2.301 | 20 | 11.65 | ±2.300 | 20 | 10.95 | ±2.544 |
| 500 lx | 19 | 10.47 | ±2.195 | 18 | 11.39 | ±1.914 | 17 | 12.53 | ±2.322 |
| 750 lx | 20 | 9.75 | ±2.381 | 19 | 11.74 | ±1.790 | 20 | 12.7 | ±2.473 |
| 1000 lx | 19 | 9.05 | ±2.934 | 18 | 13.11 | ±1.937 | 20 | 11.8 | ±1.963 |
| 1200 lx | 18 | 10.67 | ±2.473 | 20 | 12.7 | ±2.080 | 20 | 11.75 | ±2.337 |
Visual
Comfort | 150 lx | 20 | 10.2 | ±3.764 | 20 | 10.75 | ±2.573 | 19 | 12.47 | ±3.835 |
| 300 lx | 18 | 9.67 | ±2.787 | 20 | 13.2 | ±2.353 | 20 | 11.95 | ±2.704 |
| 500 lx | 19 | 13.11 | ±3.462 | 18 | 13.22 | ±2.901 | 17 | 13.65 | ±2.978 |
| 750 lx | 20 | 12 | ±2.695 | 19 | 12.79 | ±2.149 | 20 | 12.8 | ±2.668 |
| 1000 lx | 19 | 11.74 | ±2.306 | 18 | 14.06 | ±2.838 | 20 | 13.15 | ±2.777 |
| 1200 lx | 18 | 12.28 | ±2.516 | 20 | 14.1 | ±2.732 | 20 | 11.25 | ±3.323 |
| KSS | 150 lx | 20 | 5.85 | ±2.254 | 20 | 5.05 | ±2.089 | 19 | 5.26 | ±2.023 |
| 300 lx | 18 | 4.72 | ±1.965 | 20 | 4.6 | ±1.930 | 20 | 4.7 | ±1.780 |
| 500 lx | 19 | 4.53 | ±1.679 | 18 | 4.78 | ±2.315 | 17 | 4.76 | ±2.306 |
| 750 lx | 20 | 4.15 | ±2.033 | 19 | 4.11 | ±1.883 | 20 | 4.05 | ±2.089 |
| 1000 lx | 19 | 4.42 | ±2.063 | 18 | 4 | ±1.940 | 20 | 3.95 | ±2.395 |
| 1200 lx | 18 | 4.06 | ±1.830 | 20 | 3.2 | ±1.281 | 20 | 3.3 | ±1.380 |
Table A6.
Statistical descriptions of the work performance indicators in the light environment variables.
Table A6.
Statistical descriptions of the work performance indicators in the light environment variables.
Work
Performance
Indicator | Illuminance
(lux) | Correlated Color Temperature (K) |
|---|
| 2700 K | 4000 K | 6500 K |
|---|
| N | Mean | SD | N | Mean | SD | N | Mean | SD |
|---|
| Response speed | 150 lx | 20 | 64.15 | ±13.144 | 20 | 66.1 | ±14.980 | 19 | 67.68 | ±13.837 |
| 300 lx | 18 | 66.06 | ±14.988 | 20 | 64.65 | ±13.616 | 20 | 66.15 | ±11.264 |
| 500 lx | 19 | 67.16 | ±14.104 | 18 | 67.89 | ±16.778 | 17 | 67.18 | ±14.651 |
| 750 lx | 20 | 63.95 | ±12.605 | 19 | 71.11 | ±14.479 | 20 | 67.65 | ±10.292 |
| 1000 lx | 19 | 64.68 | ±11.954 | 18 | 70 | ±14.765 | 20 | 64.8 | ±13.213 |
| 1200 lx | 18 | 67.56 | ±13.466 | 20 | 64.9 | ±13.856 | 20 | 66.7 | ±13.750 |
| Correct rate | 150 lx | 20 | 0.9328 | ±0.0476 | 20 | 0.9553 | ±0.0487 | 19 | 0.9285 | ±0.0826 |
| 300 lx | 18 | 0.9368 | ±0.0622 | 20 | 0.8994 | ±0.0742 | 20 | 0.9456 | ±0.0458 |
| 500 lx | 19 | 0.9189 | ±0.0757 | 18 | 0.947 | ±0.0461 | 17 | 0.9118 | ±0.0560 |
| 750 lx | 20 | 0.9378 | ±0.0528 | 19 | 0.9342 | ±0.0379 | 20 | 0.9391 | ±0.0518 |
| 1000 lx | 19 | 0.9258 | ±0.0397 | 18 | 0.9308 | ±0.0434 | 20 | 0.9277 | ±0.0519 |
| 1200 lx | 18 | 0.9124 | ±0.0732 | 20 | 0.9321 | ±0.0530 | 20 | 0.9317 | ±0.0745 |
References
- Halbert, L. High-level Wellness; Beatty: Arlington, VA, USA, 1971. [Google Scholar]
- Woodcraft, S.; Bacon, N.; Caistor-Arendar, L.; Hackett, T. Design for Social Sustainability: A Framework for Creating Thriving New Communities; Social Life. Available online: http://www.social-life.co/media/files/DESIGN_FOR_SOCIAL_SUSTAINABILITY_3.pdf (accessed on 1 March 2023).
- Boubekri, M. Daylighting Design: Planning Strategies and Best Practice Solutions; Birkhäuser: Basel, Switzerland, 2014. [Google Scholar]
- Klepeis, N.; Nelson, W.; Ott, W.; Robinson, J.; Tsang, A.; Switzer, P.; Behar, J.; Hern, S.; Engelmann, W. The national human activity pattern survey (NHAPS): A resource for assessing exposure to environmental pollutants. J. Expo. Anal. Environ. Epidemiol. 2001, 11, 231–252. [Google Scholar] [CrossRef]
- Edwards, L.; Torcellini, P. Literature Review of the Effects of Natural Light on Building Occupants; National Renewable Energy Lab: Golden, CO, USA, 2002. [Google Scholar]
- Beute, F.; de Kort, Y. Salutogenic effects of the environment: Review of health protective effects of nature and daylight. Appl. Psychol. Health Well Being 2014, 6, 67–95. [Google Scholar] [CrossRef] [PubMed]
- Boubekri, M. Daylighting, Architecture and Health: Building Design Strategies; Routledge: Milton Park, UK, 2008. [Google Scholar]
- Ellis, E.V.; Gonzalez, E.W.; Kratzer, D.A.; McEachron, D.L.; Yuetter, G. Auto-Tuning Daylight with LEDs: Sustainable Lighting for Health and Wellbeing; ARCC Conference Repository; University of North Carolina at Charlotte: Charlotte, NC, USA, 2013. [Google Scholar]
- Leslie, R.P. Capturing the daylight dividend in buildings: Why and how? Build. Environ. 2003, 38, 381–385. [Google Scholar] [CrossRef]
- Velds, M. Assessment of Lighting Quality in Office Rooms with Daylighting Systems. Ph.D. Thesis, TU Delft, Delft, The Netherlands, 2000. [Google Scholar]
- World Green Building Council. Health, Wellbeing & Productivity in Offices. Available online: https://worldgbc.org/wp-content/uploads/2022/03/compressed_WorldGBC_Health_Wellbeing__Productivity_Full_Report_Dbl_Med_Res_Feb_2015-1.pdf (accessed on 1 March 2023).
- Lee, J.; Boubekri, M. Impact of daylight exposure on health, well-being and sleep of office workers based on actigraphy, surveys, and computer simulation. J. Green Build. 2020, 15, 19–42. [Google Scholar] [CrossRef]
- Boubekri, M.; Lee, J.; MacNaughton, P.; Schuyler, L.; Tinianov, B.; Satish, U. The impact of optimized daylight and views on the sleep duration and cognitive performance of office workers. Int. J. Environ. Res. Public Health 2020, 17, 3219. [Google Scholar] [CrossRef]
- Figueiro, M.; Hamner, R.; Bierman, A.; Rea, M. Comparisons of three practical field devices used to measure personal light exposure and activity levels. Light. Res. Technol. 2013, 45, 421–434. [Google Scholar] [CrossRef]
- Andersen, M.; Mardaljevic, J.; Lockley, S.W. A framework for predicting the non-visual effects of daylight—Part I: Photobiology-based model. Light. Res. Technol. 2012, 44, 37–53. [Google Scholar] [CrossRef]
- Smolders, K.C.H.J.; de Kort, Y.A.W.; Cluitmans, P.J.M. A higher illuminance induces alertness even during office hours: Findings on subjective measures, task performance and heart rate measures. Physiol. Behav. 2012, 107, 7–16. [Google Scholar] [CrossRef]
- Ferrante, T.; Villani, T. Pre-occupancy evaluation in hospital rooms for efficient use of natural light-improved proposals. Buildings 2022, 12, 2145. [Google Scholar] [CrossRef]
- Xue, P.; Mak, C.M.; Cheung, H.D. The effects of daylighting and human behavior on luminous comfort in residential buildings: A questionnaire survey. Build. Environ. 2014, 81, 51–59. [Google Scholar] [CrossRef]
- Kim, D.; Mansfield, K. Creating positive atmosphere and emotion in an office-like environment: A methodology for the lit environment. Build. Environ. 2021, 194, 107686. [Google Scholar] [CrossRef]
- Kahaki, Z.; Jahangiri, H.; Smith, A.; Kazemi, R. Subjective and objective survey of office lighting: Effects on alertness, comfort, satisfaction, and safety. La Med. Del Lav. 2022, 113, e2022024. [Google Scholar]
- Baird, G.; Thompson, J. Lighting conditions in sustainable buildings: Results of a survey of user’s perceptions. Archit. Sci. Rev. 2012, 55, 102–109. [Google Scholar] [CrossRef]
- Lasauskaite, R.; Richter, M.; Cajochen, C. Lighting color temperature impacts effort related cardiovascular response to an auditory short-term memory task. J. Environ. Psych. 2023, 87, 101976. [Google Scholar] [CrossRef]
- Yu, H.; Akita, T. Effects of illuminance and color temperature of a general lighting system on psychophysiology while performing paper and computer tasks. Build. Environ. 2023, 228, 109796. [Google Scholar] [CrossRef]
- Yuan, Y.; Li, G.; Ren, H.; Chen, W. Effects of light on cognitive function during a Stroop task using functional near-infrared spectroscopy. Phenomics 2021, 1, 54–61. [Google Scholar] [CrossRef]
- Castilla, N.; Higuera-Trujillo, J.L.; Llinares, C. The effect of illuminance on students’ memory: A neuroarchitecture study. Build. Environ. 2023, 228, 109833. [Google Scholar] [CrossRef]
- Zhang, R.; Yang, Y.; Fang, Q.; Liu, Y.; Zhu, X.; Wang, M.; Su, L. Effects of indoors artificial lighting conditions on computer-based learning performance. Int. J. Environ. Res. Public Health 2020, 17, 2537. [Google Scholar] [CrossRef] [PubMed]
- Chen, R.; Tsai, M.; Tsay, Y. Effects of color temperature and illuminance on psychology, physiology, and productivity: An experimental study. Energies 2022, 15, 4477. [Google Scholar] [CrossRef]
- Kim, T.; Lim, S.; Yoon, S.; Yeom, D. Pupil size and gender-driven occupant’s productivity predictive model for diverse indoor lighting conditions in the office environment. Build. Environ. 2022, 226, 109673. [Google Scholar] [CrossRef]
- Castilla, N.; Higuera-Trujillo, J.L.; Llinares, C. Virtual reality-based study assessing the impact of lighting on attention in university classrooms. J. Build. Eng. 2024, 86, 108902. [Google Scholar] [CrossRef]
- Chen, Q.; Pan, Z.; Wu, J.; Xue, C. An investigation into the effects of correlated color temperature and illuminance of urban motor vehicle road lighting on driver alertness. Sensors 2024, 24, 4927. [Google Scholar] [CrossRef]
- Hou, D.; Luo, M.R.; Lin, Y. Quantifying the effects of luminous properties on human visual and non-visual responses in indoor environments: An integrative lighting network. Build. Environ. 2025, 267, 112302. [Google Scholar] [CrossRef]
- Zhu, Y.; Yao, M.; Xiong, X.; Li, X.; Zhou, G.; Ma, N. Effects of illuminance and correlated color temperature on daytime cognitive performance, subjective mood, and alertness in healthy adults. Environ. Behav. 2017, 51, 199–230. [Google Scholar] [CrossRef]
- Shamsul, B.; Sia, C.; Ng, Y.; Karmegan, K. Effects of light’s colour temperature on visual comfort level, task performances, and alertness among students. Am. J. Public Health Res. 2013, 1, 159–165. [Google Scholar] [CrossRef]
- Lan, L.; Hadji, S.; Xia, L.; Lian, Z. The effects of light illuminance and correlated color temperature on mood and creativity. Build. Simul. 2021, 14, 463–475. [Google Scholar] [CrossRef]
- Korean Agency for Technology and Standards. Recommended Levels of Illumination (Report No.: KS A 3011). Available online: https://e-ks.kr/streamdocs/view/sd;streamdocsId=72059197289337820 (accessed on 1 March 2023).
- Report No.: ISO 8995; International Standard. Lighting of Indoor Workplaces. International Commission on Illumination: Vienna, Austria, 2002.
- Illuminating Engineering Society of North America. IESNA Lighting Handbook, 9th ed.; Illuminating Engineering Society: New York, NY, USA, 2000. [Google Scholar]
- Kim, K.; Lee, K. Indoor light environment factors that affect the psychological satisfaction of occupants in office facilities. Buildings 2024, 14, 1248. [Google Scholar] [CrossRef]
- Cohen, S.; Kamarck, T.; Mermelstein, R. A global measure of perceived stress. J. Health Soc. Behav. 1983, 24, 385–396. [Google Scholar] [CrossRef] [PubMed]
- Cohen, S.; Williamson, G. The Social Psychology of Health: Perceived Stress in a Probability Sample of the United States; Sage Publications: Singapore, 1988. [Google Scholar]
- Shahid, A.; Wilkinson, K.; Marcu, S.; Shapiro, C. STOP, THAT and One Hundred Other Sleep Scales; Springer: Berlin/Heidelberg, Germany, 2012. [Google Scholar]
- Wang, Z.; Zhang, H.; Zhang, Q.; Li, S. Interactive effect of circadian rhythm and time on task on driver fatigue level. In Proceedings of the 18th COTA International Conference of Transportation Professionals, Beijing, China, 5–8 July 2018. [Google Scholar]
- Kaida, K.; Takahashi, M.; Akerstedt, T.; Nakata, A.; Otsuka, Y.; Haratani, T.; Fukasawa, K. Validation of the Karolinska Sleepiness Scale against performance and EEG variables. Clin. Neurophysiol. 2006, 117, 1574–1581. [Google Scholar] [CrossRef]
- Cantürk, I.; Karabiber, F.; Çelik, S.; Şahin, M.F.; Yağmur, F.; Kara, S. An experimental evaluation of electrical skin conductivity changes in postmortem interval and its assessment for time of death estimation. Comput. Biol. Med. 2016, 69, 92–96. [Google Scholar] [CrossRef]
- Cho, Y.; Kim, M. Characteristics in HRV, GSR and skin temperature for stress estimate. J. Korea Ind. Inform. Syst. Res. 2015, 20, 11–18. [Google Scholar]
- Balocchi, R.; Cantini, F.; Varanini, M.; Raimondi, G.; Legramante, J.; Macerata, A. Revisiting the potential of time-domain indexes in short-term HRV analysis. Biomed. Tech. 2006, 51, 190–193. [Google Scholar] [CrossRef] [PubMed]
- Berntson, G.; Lozano, D.; Chen, Y. Filter properties of root mean square successive difference (RMSSD) for heart rate. J. Psychophysiol. 2005, 42, 246–252. [Google Scholar] [CrossRef]
- Park, K.; Jeong, H. Assessing methods of heat rate variability. J. Korean Soc. Clin. Neurophysiol. 2014, 16, 49–54. [Google Scholar] [CrossRef]
- Kay, S.; Marple, S. Spectrum analysis—A modern perspective. Proc. IEEE 1981, 69, 1380–1419. [Google Scholar] [CrossRef]
- Sayers, B.M. Analysis of heart rate variability. Ergonomics 1973, 16, 17–32. [Google Scholar] [PubMed]
- Montano, N.; Ruscone, T.; Porta, A.; Lombardi, F.; Pagani, M.; Malliani, A. Power spectrum analysis of heart rate variability to assess the changes in sympathovagal balance during graded orthostatic tilt. Circulation 1994, 90, 1826–1831. [Google Scholar] [CrossRef]
- Kim, W.; Woo, J.; Chae, J. Heart rate variability in psychiatry. J. Korean Neuropsychiatr. Assoc. 2005, 44, 176–184. [Google Scholar]
- Boyce, P.; Eklund, N.; Simpson, S. Individual lighting control: Task performance, mood and illuminance. J. Illum. Eng. Soc. 2000, 29, 131–142. [Google Scholar] [CrossRef]
| Disclaimer/Publisher’s Note: The statements, opinions and data contained in all publications are solely those of the individual author(s) and contributor(s) and not of MDPI and/or the editor(s). MDPI and/or the editor(s) disclaim responsibility for any injury to people or property resulting from any ideas, methods, instructions or products referred to in the content. |
© 2025 by the authors. Licensee MDPI, Basel, Switzerland. This article is an open access article distributed under the terms and conditions of the Creative Commons Attribution (CC BY) license (https://creativecommons.org/licenses/by/4.0/).
