Abstract
Floor slabs are essential load-bearing components in buildings, and their dynamic behavior plays a crucial role in their serviceability limit state. In residential or office buildings, understanding the dynamic behavior of slabs is vital for ensuring the well-being and comfort of occupants. In buildings like medical facilities or laboratories, which contain sensitive equipment, it is equally important to assess dynamic behavior to prevent vibration-induced damage to machinery. Therefore, it is imperative that the dynamic properties of floor slabs are evaluated and considered in the design stage. As there are various viable methods to calculate these properties, this paper will focus on the most widely used methods and compare the effectiveness of their results in representing the real-world dynamic behavior of a voided floor slab via a case study. As the results presented in this paper prove, simplified calculation methods are capable of providing accurate results while being time and resource-saving.
1. Introduction
The construction industry is a major contributor to air pollution, with research showing that the construction and maintenance of buildings account for up to 30% of global greenhouse gas emissions [1]. In the European Union, this figure is even higher, with the construction industry contributing 36% to greenhouse gas emissions, while 40% is attributed to energy consumption [2]. Additionally, the construction industry contributes to dust pollution, noise, waste generation, and excessive water usage [3]. As a result, it is essential for the construction sector to adopt more sustainable practices in both material and energy use.
For example, materials saving can be achieved in the construction of floor slabs, which represent a significant portion of the total weight of the load-bearing framework, sometimes accounting for as much as 90% [4]. One solution that offers significant potential for material savings is the use of plastic void formers or blocks of lightweight materials such as polystyrene in the area around the center of the cross-section of a reinforced concrete slab, where stresses in concrete induced by bending moments are low. This could potentially yield savings as high as 30–35% in the slab’s total mass [5,6]. Furthermore, secondary savings may be achieved in downstream load-bearing elements such as walls, columns, and foundations. These elements, which enable lower self-weight in supported slabs, may be thinner; therefore, their construction consumes fewer materials. This allows for a reduction in the weight of the materials used to build these elements by up to 40% [6].
Other advantages provided by this solution include the reduced seismic mass of voided slabs, as well as their ability to span longer spans without the need for pre- or post-tensioning [6,7].
This type of slab also possesses some drawbacks that have been addressed in various studies. One commonly addressed problem is the shearing and punching strength of voided slabs [8,9,10,11,12,13,14]. As the cross-sectional area of the slab is reduced by voids or non-load-bearing materials, the shear strength is significantly reduced. Therefore, it is common practice not to use voided slabs in areas with high shearing/punching stresses, including areas around the walls or columns. Other commonly analyzed subjects are the flexural behavior of voided slabs, as their structural rigidity is reduced [6,15,16,17,18], and the dynamic behavior of voided slabs, which is directly linked to their reduced rigidity, leading to lower (and less desirable) eigenfrequencies of oscillation [7,19]. To be precise, dynamic behavior is a topic of great interest in slab structures with reduced structural rigidity, as illustrated by scientific papers focusing on the dynamics of composite slab structures [20,21,22,23].
This study aims to first introduce the concept of voided reinforced concrete slabs and provide an overview of various approaches to assess their dynamic behavior. An experimental study is also conducted with the aim of comparing different computational procedures with measurement results, similar to other scientific works [24].
2. Voided Biaxial Slabs—Overview of Technology
History of the Technology
The first known case of using voids in a concrete structure to reduce stress is the dome of the Roman Pantheon. This structure, in its current form, was built in 126 AD during the reign of Emperor Hadrian [25]. To this day, it is the largest dome built using unreinforced concrete [26]. The construction was made possible using lightweight fillers in concrete, such as pumice stone, in combination with a lost timber formwork, which created hollow chambers in thick sections of the walls in the lower part of the dome [27]. The combination of these two methods resulted in stress reduction in the concrete by as much as 80% [25].
Modern applications of voided reinforced concrete slabs were extensively researched in the United States of America at the beginning of the 20th century at Purdue University [28]. One of the first documented real-world applications of a slab with dead-weight-reducing measures was the construction of Ida B. Wells housing in Chicago in 1941, where clay tiles were used as a low-weight non-load-bearing material [28].
Currently, hollow plastic elements of various shapes or polystyrene blocks are used to lighten monolithic ceiling slabs. These elements are placed in the area around the neutral axis of the slab cross-section, where the concrete is subjected to minimal stress, and serve as a lost formwork to create ribs inside the slab [29]. This technology is mainly used in the construction of long-spanning reinforced concrete slabs, the design of which would not be possible without pre/post-tensioning. The limited use of concrete and steel rebar reduces the material cost.
When it comes to the drawbacks of this technology, one commonly addressed problem associated with voided slabs is their shear puncture resistance, which is significantly reduced by voids. This is because shear stresses need to be transferred by a thin layer of concrete in between voids instead of the full cross-section of a slab. Extensive research has been carried out on this topic for the BubbleDeck (BubbleDeck International A/S, Farum, Denmark) system, the results of which were published in 2002. This research compared the experimentally measured shear resistances of voided slabs with the calculated resistance of full-section slabs. The calculations were carried out using DIANA software, considering the non-linear behavior of the materials. The results showed that the measured resistance of the slab with voids created by the BubbleDeck system was on average 0.61 times the resistance of the full cross-section slab [5]. This diminishment of shear resistance tends to be the same for all systems regarding void creation [29]. Given the reduced shear/shear puncture resistance of voided slabs, it is common practice not to use voiding elements in areas where shearing is present (e.g., areas adjacent to supporting walls or areas around columns).
Another drawback stemming from the structural properties of these slabs is their reduced stiffness, which is associated with the reduction in moments of inertia due to the presence of voids in the slab and the generally larger spans of voided slabs. This reduced stiffness results in lower eigenfrequencies of oscillation; thus, slabs become more prone to resonant oscillation caused by walking, jumping, or other human activities.
3. Dynamic Behavior of Floor Slabs
Vibrations in floor slabs are becoming an increasingly common issue in buildings. In the past, these vibrations were primarily addressed by ensuring the slabs’ robustness, which accounted for potential calculation inaccuracies at the time. This approach resulted in greater stiffness and higher natural frequencies [7]. Today, however, floor slabs are designed to be lightweight, as modern load-bearing elements are often optimized to their limits using the finite element method (FEM), enabling highly precise calculations. Additionally, voided slabs are typically used for larger areas, further reducing their overall stiffness.
Vibrations in buildings are typically caused by three primary factors:
- Human activities, such as walking and jumping.
- Continuous operation of machinery with moving parts—including air conditioning, washing machines, and presses.
- External sources of excitation, like wind, traffic, construction sites, and other nearby activities.
From a structural usage perspective, these vibrations can lead to various undesirable effects. Notably, vertical vibrations of a magnitude perceptible to humans can negatively impact the psychological well-being of building occupants. The level of annoyance caused by these vibrations for users of the structure is generally dependent on the following factors [30,31]:
- The direction of vibration (although this paper focuses on vibrations in the vertical direction);
- The posture of the affected person (lying, sitting, standing);
- The current activity of the affected person;
- A person’s health and age.
In addition to impacting human well-being, vibrations also affect various types of machinery. Precision equipment is highly sensitive to vibrations, which can lead to malfunctions or even damage. Examples include laboratory instruments like electron microscopes and hard drives in server storage systems [32].
To assess the behavior of any structure subjected to dynamic excitation, it is imperative that the natural frequencies of this structure be determined. When it comes to slabs, multiple methods may be implemented to achieve this task.
Some of these methods are simplified and designed for approximate, often preliminary calculations. Examples include the Equivalent Plate method, Jänich’s approximation [33], and Bachmann’s method [34]. A detailed description of each method is provided in the following sub-chapters. Generally, these methods offer a quick and straightforward way to calculate the first natural frequency of a slab, though they are based on the behavior of full cross-section slabs.
The Equivalent Plate Method is based on the Equivalent Beam Method and considers the effects of flexural rigidity in a plate alongside the second direction of spanning. Given the modifications allowed for approximate calculations of the first natural frequency of simply supported two-way slabs, the following was obtained:
where D is the flexural rigidity of the plate, m is the mass of the plate, lx and ly are spans in the directions of respective axes, and m is the mass per unit area of the slab. Flexural rigidity is expressed as follows:
where E is Young’s modulus, hd is the thickness of the slab, and ν is Poisson’s ratio.
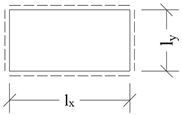
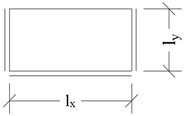
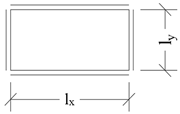
Jänich’s approximation [33] for calculating the first natural frequency is more complex than the Equivalent Plate Method. It considers both the effects of applied loads on the slab under study and the various boundary conditions (free, hinged, or clamped edges) in the calculation of the first natural frequency. The formula used to calculate the first natural frequency is as follows [33]:
where D is the flexural rigidity of the slab, g is gravitational acceleration, K is a parameter factoring in the boundary conditions of the slab, hd is the thickness of the slab, γ is the volumetric density of the slab material, and N is a parameter factoring in the loads imposed on the slab. The parameter factoring in boundary conditions of the slab is presented in the following formula [33]:
where lx and ly are spans in the directions of respective axes. K1, K2, and K3 are parameters dependent on boundary conditions. Their values for chosen boundary conditions are provided in Table 1.

Table 1.
Parameters for Jänich’s approximation [33].
To factor the effects of loads imposed on a slab in calculations, the following formula was used [33]:
where N0 is a parameter dependent on the boundary conditions of the slab, as provided in Table 1; p is the load posed on a surface of slab, P is the point load; and wP is the displacement of the slab caused by point load P.
The last calculation method to be described was developed by Hugo Bachmann in cooperation with Walter Amman [34]. They created formulas for the calculation of the first two natural frequencies of slabs with various boundary conditions. These calculation procedures were mainly empiricism-based, and the authors developed them from their vast experience in the field of structural dynamics. The formula for calculating the first two natural frequencies of a two-way slab is as follows [34]:
where φn is the parameter determined by boundary conditions based on Table 2. Index n represents the number of the eigenmode. E is Young’s modulus, hd is the thickness of the slab, ν is Poisson’s ratio, and m is the mass per area in kg/m2.

Table 2.
Exemplary parameters for Bachmann’s formulas [34].
The parameters stemming from the boundary conditions of the investigated structure are shown in Table 2.
To calculate the first eigenfrequency, the coefficient φ1,1 is used. For the second eigenfrequency, the smaller coefficient of φ2,1 or φ1,2 is chosen. Coefficient α is a ratio for the lengths of sides (lx/ly).
Besides these three hand-calculation methods, there are other viable approaches, which are listed below [19]:
- Equivalent beam method;
- Concrete society method;
- Static deflection method;
- Modified deflection method;
- Approximation by Hearmon;
- Approximation by Blevins.
Nowadays, in engineering practice, the standard approach is to use finite element analysis (FEA) to determine all structural parameters, including the dynamic properties of any given structure. This is enabled by the availability and affordability of highly capable computers, as well as computational software. When numerically analyzing the behavior of biaxial voided slabs, as well as any reinforced concrete slab in general, two analytical approaches may be used.
The first one is to model the investigated slab as a 2D surface and mesh it using triangular or quadrilateral surface finite elements. Using this approach, the slab is idealized into its midplane. This idealization, which considers stresses and internal forces, is summarized in Figure 1. The deformation vector consists of three components: displacement along the Z-axis (w), rotation about the X-axis (θx), and rotation about the Y-axis (θy). The formulation of the deformation vector is represented as {u} = {w, θx, θy}.

Figure 1.
Stresses and inner forces in the 2D slab FE model [35].
To simulate the impact of voids in a slab, Young’s modulus and volumetric mass are reduced in the areas of concrete where void formers would be placed. This reduction is based on coefficients provided by the manufacturers of each respective technology. This method is commonly used as it is time-efficient and compatible with most FEA programs. Additionally, setting up the analysis is straightforward; the main consideration is whether the analysis should account for the diversion of normal planes after deflection (Mindlin’s theory, which is applicable for thick slabs) or assume that they remain normal to the midplane of the slab after deflection (Kirchhoff’s theory, which is applicable for thin slabs). The appropriate theory is selected based on the geometrical properties of the analyzed structure.
The second analytical approach is to model the slab as a 3D solid, which is meshed using tetrahedral elements with 4 or 10 nodes and/or hexahedral elements with 8 or 20 nodes based on the approximation method used and the structure’s geometry. In these elements, there are three components to the vector of displacements: displacement in the direction of the X-axis (u), displacement in the direction of the Y-axis (v), and displacement in the direction of the Z-axis (w). Therefore, its formulation is {u} = {u, v, w}. Typical 3D FE elements are depicted in Figure 2.
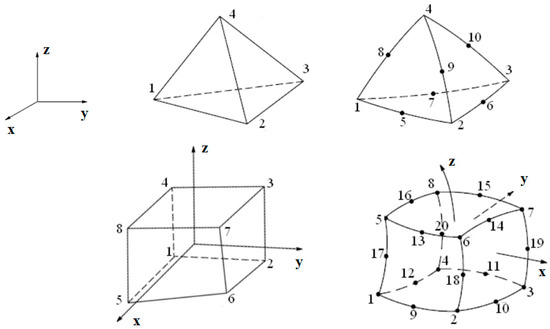
Figure 2.
Finite elements commonly used in 3D models [35].
The primary advantage of this method is that the entire slab, including all voids, can be modeled, making the analysis realistic compared to other available methods. However, this approach requires advanced FEA software, which is often expensive, and typically involves longer computation times. Additionally, it is the most skill-intensive method, as the results are highly dependent on the analysis settings and the preparation of the computational model.
As dynamic behavior is the function of stiffness and mass, it may be concluded that any finite element modeling approach that is capable of accurately representing these two parameters is suitable for the computation of dynamic parameters.
This section can be divided by subheadings. It should provide a concise and precise description of the experimental results, their interpretation, and the experimental conclusions that can be drawn.
3.1. Case Study—Calculating and Measuring Dynamic Behaviors of Biaxial Voided Slabs
To determine the extent to which each respective calculation method corresponds to reality, a case study was carried out. We investigated the dynamic behavior of a biaxial voided reinforced concrete slab located in the building of a furniture showroom in Bratislava, Slovakia. In this case, the slab was reinforced in both directions with a constant thickness of 400 mm. The void formers used were Cobiax Slim Line 220–240c (Cobiax Deutschland GmbH, Bielefeld, Germany). At the edges and in the areas around the columns, the slab had a full cross-section (i.e., there were no void-forming elements in these areas). In the center of the slab, a rectangular hole was present for the staircase. The objective of this study was to determine the dynamic properties (eigenmodes and vibration frequencies) through both calculations and field measurements and then compare measured and calculated data to determine which calculation method corresponds the most to reality. This study comprised the following steps:
- Field measurement of the elastic modulus of concrete;
- Preparation of FE models based on design drawings provided and measurements of material properties;
- Preparation of field measurements of dynamic behavior based on FE analysis results;
- Field measurements;
- Data processing and interpretation, with the comparison of results.
3.2. Calculation of the Dynamic Parameters of Biaxial Voided Slabs
Firstly, to prepare finite element models, it was necessary to determine the elastic modulus of the concrete present in the slab. To ascertain this, the compressive strength of the concrete was measured in situ using the Schmidt hammer test. Measurements were taken at six points of the structure, with five strength values recorded at each point. From these results, the concrete’s modulus of elasticity was calculated according to the European standard EN 1992-1-1 [36,37] and a relevant technical paper [38]. The value of elastic modulus was established as E = 34,656 MPa. The calculated value was then used in the development of finite element models. The geometry of the investigated structure was modeled based on the design documentation provided by the designer.
Calculation of dynamic parameters was performed using two different methods. Firstly, a simplified method, commonly used in engineering practice, was employed. In this method, the slab was modeled as a 2D structure using shell elements in SCIA Engineer 22.1, 64bit, which is FEA software common in engineering practice. To account for the effect of voids in lightened areas, the modulus of elasticity was reduced to E = 0.89 × 34,656 MPa = 30,844 MPa, based on the manufacturer’s (Cobiax) recommendations [39,40]. The self-weight of concrete was also reduced to 2250 kg/m3 based on recommendations from the design manual [39,40]. The average 2D element size used in this analysis was 0.120 m. The results are shown in Figure 3.

Figure 3.
The (a) 2nd eigenmode and (b) 4th eigenmode from the 2D FE analysis, using SCIA Engineer. Colors represent values of the unitless vector.
Next, a more complex analysis was carried out using ANSYS Workbench Mechanical 2023 R.2 FEM software. In this case, the slab was modeled in 3D “as is”, using 3D elements (SOLID187, tetrahedral element with 10 nodes; SURF154, 4–8 node surface element [41], maximal element size 0.5 m). The elements used were standard for this type of analysis, and their size was iterated based on their impact on outcomes (i.e., elements were scaled down until the change in results was negligible). In areas with void formers, actual voids were modeled according to shape. A cutout from a 3D model depicting voids in the slab and mesh is provided in Figure 4.
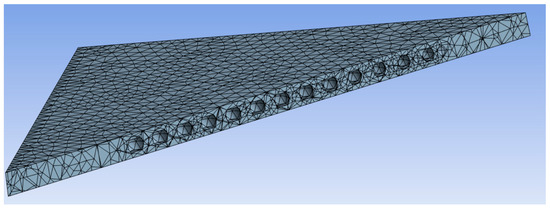
Figure 4.
Cutout from 3D FE model of slab depicting voids and mesh.
The results obtained from the 3D FE model are provided in Figure 5.

Figure 5.
The (a) 2nd eigenmode and (b) 4th eigenmode from 3D FE analysis using ANSYS Workbench Mechanical. Colors represent values of the unitless vector.
In both analyses, the Lanczos method was used to calculate the eigenmodes of vibration.
In addition, hand calculations were carried out using the methods described in Section 3 to compare these highly approximative methods based on empiricism with more precise methods based on the Finite Element Method and their measurements. It is important to mention that these methods do not incorporate all possibilities regarding support (they do not provide the coefficients needed for combinations of support). Therefore, for the hand calculations that were carried out in this study, if the coefficients for the given combination of supports were not available, a combination closest to the one present (and its coefficients were available) was chosen. In addition, the part of the whole slab measured was considered a standalone slab in these calculations.
3.3. Field Measurement
To compare and validate the accuracy and viability of various calculation approaches from previous subchapters, a field measurement was prepared and conducted.
The measurement of the dynamic properties was carried out on 7 February 2024. The vibration of the slab was recorded at eight points and was determined based on the results of the FEM model. Measured points are depicted in Figure 6.

Figure 6.
Measured points of structure.
The measuring equipment consisted of eight PCB 393 B31 accelerometers (PCB Piezotronics, Inc., Depew, NY, USA), two NI-9234 transducers (NATIONAL INSTRUMENTS CORP., Austin, TX, USA) (delta-sigma type with inherent antialiasing [42]), and one computer with data-logging software [43]. Illustrative photography of the measurement setup is provided in Figure 7.
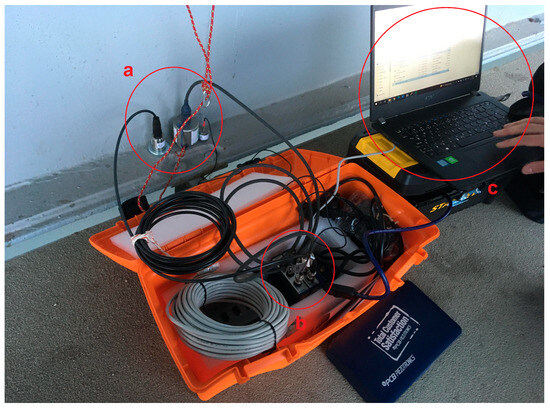
Figure 7.
Illustrative photograph of the measurement setup. (a) Accelerometers; (b) transducers; and (c) computer with data-logging software.
Excitation of the structure was provided by walking along a specified path and assessing heel-drop (dropping the foot down from toe to heel) and ambient influences (e.g., wind and traffic in the vicinity). It is necessary to mention that only one part of the whole slab was measured due to constraints posed by the building in which the measurement took place, which remained fully operational due to the possible disruption that closing it would cause to normal operation. Therefore, it was possible to measure only the second and fourth eigenmodes (Figure 3 and Figure 4), as these were present on the side accessible for the measurement. A photograph showing the set up of the measurement campaign is provided in Figure 8.
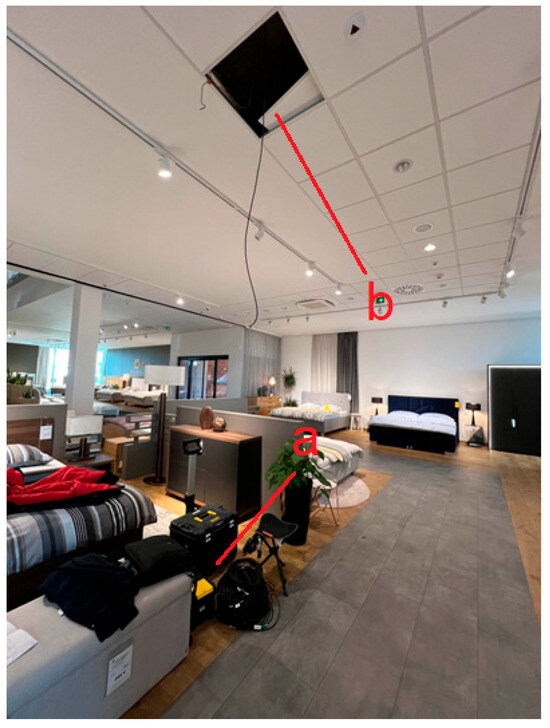
Figure 8.
Preparation of measurement campaign. (a) Transducers and computer; (b) accelerometer attached to slab inside of false plasterboard ceiling.
Data recorded on acceleration were processed to interpret the measured values. The respective processing steps are chronologically summarized in Table 3.

Table 3.
Parameters of data processing.
As evident in Table 3, records were transformed from the time to the frequency domain (FFT). This allowed eigenfrequencies to be searched using the so-called “Peak picking method” [44], the principle of which is to look for peaks in a graphic plot of accelerations, as these peaks signify higher energy oscillations, which signify resonance.
3.4. Results
Due to the aforementioned space limitations on the measurement site, it was only possible to measure one part of the slab, which determined two mode shapes. These were the second and fourth eigenmodes (Figure 9 and Figure 10, respectively). The results of measurements are summarized in Table 4 and Table 5.

Figure 9.
Second identified eigenmode—colors represent values of the unitless vector.
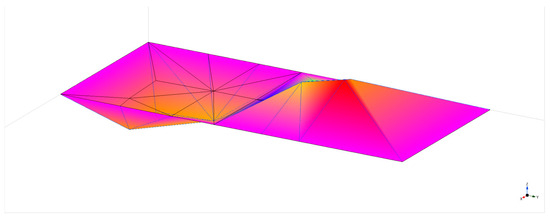
Figure 10.
Fourth identified eigenmode—colors represent values of the unitless vector.

Table 4.
Measured and calculated eigenfrequencies.

Table 5.
Comparison of resulting frequencies.
To further compare the relative accuracy of each respective method, the Modal Assurance Criterion (MAC) was used. The Modal Assurance Criterion (MAC) is a widely used tool for quantitatively comparing modal vectors. As a statistical indicator, like ordinary coherence, the MAC is based on least squares linear regression analysis. It produces an indicator that is highly sensitive to significant differences between comparative values, while remaining largely insensitive to small variations or minor magnitudes. Initially introduced in modal testing alongside the Modal Scale Factor, the MAC serves to provide additional confidence when evaluating modal vectors from different excitation locations. The MAC is calculated as the normalized scalar product of two sets of vectors: {αa} and {αb}. The resulting scalars are arranged into the MAC matrix [45]. The MAC is a commonly used tool for evaluating dynamic property measurements in the domain of civil engineering, as illustrated by various scientific papers [43,46,47,48]. The mathematical formulation is provided in Equation (7).
MAC values were obtained for each individual measurement, as the means of excitations were different. The calculated results are visualized in histograms in Figure 11.
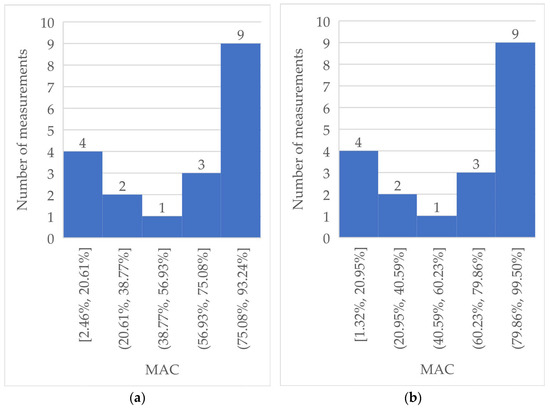
Figure 11.
(a) Histogram of MAC values for the 2nd eigenmode and comparison of values obtained via measurements and via the 3D FE model. (b) Histogram of MAC values for the 2nd eigenmode and comparison of values obtained via measurements and via the 2D FE model.
For the 4th eigenmode, the values of MAC were unsatisfactory despite the repeated efforts to tune and hone the used FE models, with only one measurement obtaining at least a 75% similarity threshold. Therefore, no further analysis of these results was carried out, as these results were considered to have no additional testimonial value. These results were probably influenced by the number of measured points taken from the structure, which was limited by its accessibility, as described in Section 3.3. To obtain better results for this eigenmode, it would be beneficial to perform a measurement covering the entire slab.
4. Discussion
As there are multiple viable approaches for analyzing the dynamic behavior of voided reinforced concrete slabs, a case study was performed, in which results obtained via different computational approaches were compared to results obtained by measurements. As the presented data suggest, both complex 3D and simplified 2D FE models are viable options when calculating the eigenfrequencies of a voided slab; both methods provide results that correspond highly with the real-world dynamic behavior of voided slabs. In addition, based on the results obtained, it can be concluded that simplified 2D FE models are highly accurate and capable in this application. In addition, simplified 2D FE models seem like a better choice in comparison with 3D models, as the time required to both prepare and compute them is significantly lower, and the software required for the creation of 2D models is much more affordable. However, complex 3D FE models are irreplaceable for analyzing local phenomena (e.g., the local distribution of vibration-invoked stresses in the slab). To conclude, when calculating the global dynamic behavior of voided reinforced concrete slabs, 3D and 2D FE models provide accurate results, and 2D models are significantly less labor- and resource-intensive. However, 2D models cannot be used in cases where local phenomena need to be analyzed; instead, 3D models need to be employed.
The hand calculations used in this study proved to be inaccurate except for Bachmann’s method [34]. However, the Equivalent Plate Method is simply designed to support rectangular slabs and does not account for various support conditions. In the case of Jänich’s approximation [33], it was necessary to approximate the choice of support conditions, because the coefficients for the present conditions were not available. Therefore, it is assumed that the results of these calculations are skewed by approximations/lack of data. Also, the value of these hand calculations in the scope of this study is illustrative, as these methods are rather obsolete given the availability of FE programs.
When it comes to comparing eigenmodes via MAC, the results were rather inconsistent, with no significant difference evident between the 2D and 3D FE models. However, this shortcoming is most likely due to a limited measurement setup, and it is assumed that a repeated measurement in which more points of the structure are examined would improve these results.
To conclude, when modeling voided slabs for the purpose of modal analysis, simplified 2D FE models considering the voided parts of slabs via reduction coefficients for the modulus of elasticity and self-weight of concrete are generally accurate for determining eigenfrequencies of vibrations. By contrast, the use of complex 3D models brings no additional benefit regarding the accuracy of analysis. This is important because, in engineering practice, the time available for analysis is constrained, and the price of software plays a significant role. However, to conclude on the accuracy of both methods when analyzing eigenmodes, a repeated, more complex measurement would be necessary, as the results obtained in this study seem to be skewed by a limited measurement setup. To further support this argument, we are currently attempting to arrange future measurement campaigns featuring other structures where voided reinforced concrete slabs are present; however, this process is lengthy and time-consuming, as it is necessary to form an agreement with the respective owners.
Author Contributions
Supervision and funding acquisition, N.J.; software and data curation, M.V.; main author and all other roles and responsibilities necessary for creation of this article, D.B. All authors have read and agreed to the published version of the manuscript.
Funding
This research was funded by the Grant Agency of the Ministry of Education, Science, Research and Sports of the Slovak Republic VEGA 1/0155/23.
Data Availability Statement
The data is not publicly available due to an agreement between the authors and the respective owner of the investigated structure.
Conflicts of Interest
The authors declare no conflicts of interest.
References
- Kröhnert, H.; Itten, R.; Stucki, M. Comparing flexible and conventional monolithic building design: Life cycle environmental impact and potential for material circulation. Build. Environ. 2022, 222, 109409. [Google Scholar] [CrossRef]
- European Commission. Stepping up Europe’s 2030 climate ambition. In Investing in a Climate-Neutral Future for the Benefit of Our People; Taylor & Francis: Brussels, Belgium, 2020. [Google Scholar]
- Chuai, X.; Lu, Q.; Huang, X.; Gao, R.; Zhao, R. China’s construction industry-linked economy-resources-environment flow in international trade. J. Clean. Prod. 2021, 278, 123990. [Google Scholar] [CrossRef]
- Hussein, L.F.; Al-Taai, A.A.S.; Khudhur, I.D. Sustainability Achieved by Using Voided Slab System. AIP Conf. Proc. 2020, 2213, 020071. [Google Scholar]
- Schnellenbach-Held, M.; Pfeffer, K. Punching behavior of biaxial hollow slabs. Cem. Concr. Compos. 2002, 24, 551–556. [Google Scholar] [CrossRef]
- Pawar, A.J.; Mathew, N.S.; Dhake, P.D.; Patil, Y.D. Flexural behavior of Two-Way voided slab. Mater. Today Proc. 2022, 65, 1534–1545. [Google Scholar] [CrossRef]
- Jendželovský, N.; Vráblová, K. Analysis of natural frequencies of voided biaxial concrete slabs. Key Eng. Mater. 2017, 738, 15–24. [Google Scholar] [CrossRef]
- Yang, J.; Guo, H.; Yang, C.; Zhang, G.; Pan, Y. Experimental investigation and evaluation of shear performance of hollow slab beams strengthened by cavity grouting method. Case Stud. Constr. Mater. 2024, 20, e03184. [Google Scholar] [CrossRef]
- Al-Gasham, T.S.; Mhalhal, J.M.; Jabir, H.A. Improving punching behavior of interior voided slab-column connections using steel sheets. Eng. Struct. 2019, 199, 109614. [Google Scholar] [CrossRef]
- Valivonis, J.; Skuturna, T.; Daugevičius, M.; Šneideris, A. Punching shear strength of reinforced concrete slabs with plastic void formers. Constr. Build. Mater. 2017, 145, 518–527. [Google Scholar] [CrossRef]
- Sagadevan, R.; Rao, B. Experimental and analytical investigation of punching shear capacity of biaxial voided slabs. Structures 2019, 20, 340–352. [Google Scholar] [CrossRef]
- Chung, J.H.; Choi, H.K.; Lee, S.C.; Choi, C.S. Shear capacity of biaxial hollow slab with donut type hollow sphere. Procedia Eng. 2011, 14, 2219–2222. [Google Scholar] [CrossRef]
- Oukaili, N.; Merie, H. Reduced area approach for predicting punching shear resistance of biaxial hollow slabs with openings. Results Eng. 2023, 19, 101261. [Google Scholar] [CrossRef]
- Oukaili, N.; Merie, H.; Allawi, A.; Wardeh, G. Reduced Volume Approach to Evaluate Biaxial Bubbled Slabs’ Resistance to Punching Shear. Buildings 2024, 14, 676. [Google Scholar] [CrossRef]
- Pawar, A.J.; Patil, Y.D.; Vesmawala, G.R.; Dhake, P.D.; Nikam, J.S. Two-way flexural behavior of biaxial voided slab using cuboidal shape of void formers. Structures 2024, 62, 106175. [Google Scholar] [CrossRef]
- Pawar, A.J.; Patil, Y.D.; Vesmawala, G.R.; Dhake, P.D.; Nikam, J.S. Investigating the flexural behaviour of biaxial voided slab with varying size and spacing of cuboidal shaped void formers with innovative type of fixing reinforcement. Structures 2024, 64, 106616. [Google Scholar] [CrossRef]
- Staszak, N.; Garbowski, T.; Ksit, B. Optimal Design of Bubble Deck Concrete Slabs: Sensitivity Analysis and Numerical Homogenization. Materials 2023, 16, 2320. [Google Scholar] [CrossRef]
- Chung, J.-H.; Jung, H.-S.; Choi, H.-K. Flexural Strength and Stiffness of Donut-Type Voided Slab. Appl. Sci. 2022, 12, 5782. [Google Scholar] [CrossRef]
- Wolski, L. Natural Frequency of Cobiax® Flat Slabs. Master’s Thesis, Coventry University, Coventry, UK, September 2006. [Google Scholar]
- Kormanikova, E.; Kotrasova, K.; Melcer, J.; Valaskova, V. Numerical Investigation of the Dynamic Responses of Fibre-Reinforced Polymer Composite Bridge Beam Subjected to Moving Vehicle. Polymers 2022, 14, 812. [Google Scholar] [CrossRef]
- Kormaníková, E.; Kotrasová, K.; Harabinová, S.; Panulinová, E. Frequency Analysis of Composite Sandwich Panel with CFRP Faces. AIP Conf. Proc. 2022, 2425, 040006. [Google Scholar] [CrossRef]
- Kormaníková, E.; Kotrasová, K. Dynamic Behavior of Composite Sandwich Panel with CFRP Outer Layers. WSEAS Trans. Appl. Theor. Mech. 2022, 17, 263–269. [Google Scholar] [CrossRef]
- Zhai, Y.; Li, S.; Zhang, X. Vibration Performance of Composite Doubly Curved Shells Embedded With Damping Layer. Int. J. Struct. Stab. Dyn. 2025, 2025, 2650265. [Google Scholar] [CrossRef]
- Zhang, C.; Li, H. Active Control for Construction Stability of Suspension Arch Rib Segments Based on ARID System. Int. J. Struct. Stab. Dyn. 2024. online ready. [Google Scholar] [CrossRef]
- Mark, R.; Hutchinson, P. On the Structure of the Roman Pantheon. Art Bull. 1986, 68, 24. [Google Scholar] [CrossRef]
- Lancaster, L.C. Concrete Vaulted Construction in Imperial Rome; Cambridge University Press: Cambridge, MA, USA, 2005. [Google Scholar]
- MacDonald, W.L.; Bishop, J.J. The Pantheon: Design, Meaning, and Progeny; Harvard University Press: Cambridge, MA, USA, 1977. [Google Scholar]
- Mota, M. Voided Slabs—Then and Now; American Concrete Institute: Farmington Hills, MI, USA, 2013. [Google Scholar]
- Smutek, M. Vyľahčované dutinové železobetónové stropné dosky. ASB, 22 October 2010. [Google Scholar]
- Passcier-Vermeer, W. Vibrations in Dwellings: Exposure and Annoyance; Ministerie van Volkshuisvesting, Ruimtelijke Ordening en Milieu: Den Haag, The Netherlands, 1995.
- European Commission. Generalisation of Criteria for Floor Vibrations for Industrial, Office, Residential and Public Buildings, and Gymnastic Halls; Publications Office of the European Union: Luxembourg, 2006. [Google Scholar]
- Thompson, R.A. Wright State University Neuroscience Building. 2017. Available online: https://www.cobiaxusa.com/wright-state-university (accessed on 24 March 2023).
- Jänich, R. Die näherungsweise Berechnung von rechteckigen Platten bei verschiedenen Randbedingungen. Bautechnik 1962, 3, 93–99. [Google Scholar]
- Bachmann, H.; Ammann, W. Vibrations in Structures Induced by Man and Machines, 3rd ed.; IABSE-AIPC-IVBH: Zürich, Switzerland, 1987. [Google Scholar]
- Králik, J. Modelovanie Konštrukcií v Metóde Konečných Prvkov Systém; A.N.S.Y.S.: Bratislava, Slovakia, 2009. [Google Scholar]
- Biasioli, F.; Mancini, G.; Just, M.; Curbach, M.; Walraven, J.; Gmeiner, S.; Robert, F. Eurocode 2: Background and Applications: Design of Concrete Buildings; Worked examples; Publications Office of the European Union: Luxembourg, 2014.
- EN 1992-1-1 (2004); Eurocode 2: Design of Concrete Structures—Part 1-1: General Rules and Rules for Buildings. European Committee for Standardization (CEN): Brussels, Belgium, 2004.
- Graybeal, B.; Davis, M. Cylinder or Cube: Strength Testing of 80 to 200 MPa (11.6 to 29 ksi) Ultra-High-Performance Fi-ber-Reinforced Concrete. ACI Mater. J. 2008, 105, 603–609. [Google Scholar]
- Cobiax Deutschland GmbH. A Deep-Dive into Cobiax Technology and Execution in Detail; Cobiax Deutschland GmbH: Bielefeld, Germany, 2022. [Google Scholar]
- Cobiax Deutschland GmbH. Engineering Manual; Cobiax Deutschland GmbH: Bielefeld, Germany, 2010. [Google Scholar]
- ANSYS Inc. ANSYS Mechanical APDL Element Referenc; ANSYS Inc.: Canonsburg, PA, USA, 2011. [Google Scholar]
- National Instruments Corporation. NI-9234 Specifications; National Instruments Corporation: Austin, TX, USA, 2023. [Google Scholar]
- Venglár, M. Dynamic Tests for System Identification of Bridges. Ph.D. Thesis, Faculty of Civil Engineering, Slovak University of Technology, Bratislava, Slovakia, 2018. [Google Scholar]
- Brincker, R.; Ventura, C. Introduction to Operational Modal Analysis; John Wiley & Sons, Ltd.: Chichester, UK, 2015. [Google Scholar]
- Pastor, M.; Binda, M.; Harčarik, T. Modal Assurance Criterion. Procedia Eng. 2012, 48, 543–548. [Google Scholar] [CrossRef]
- Venglar, M.; Sokol, M.; Aroch, R. System Identification of a Truss Beam. In Proceedings of the 22nd International Conference, Engineering Mechanics 2016, Svratka, Czech Republic, 9–12 May 2016; pp. 574–577. [Google Scholar]
- Venglár, M.; Lamperová, K. Effect of the Temperature on the Modal Properties of a Steel Railroad Bridge. Slovak J. Civ. Eng. 2021, 29, 1–8. [Google Scholar] [CrossRef]
- Sokol, M.; Venglár, M.; Lamperová, K.; Márföldi, M. Performance Assessment of a Renovated Precast Concrete Bridge Using Static and Dynamic Tests. Appl. Sci. 2020, 10, 5904. [Google Scholar] [CrossRef]
Disclaimer/Publisher’s Note: The statements, opinions and data contained in all publications are solely those of the individual author(s) and contributor(s) and not of MDPI and/or the editor(s). MDPI and/or the editor(s) disclaim responsibility for any injury to people or property resulting from any ideas, methods, instructions or products referred to in the content. |
© 2025 by the authors. Licensee MDPI, Basel, Switzerland. This article is an open access article distributed under the terms and conditions of the Creative Commons Attribution (CC BY) license (https://creativecommons.org/licenses/by/4.0/).
