Abstract
The effective visualization of urban-scale earthquake simulations is pivotal for disaster assessment but presents significant challenges in terms of computational performance and accessibility. This paper introduces a lightweight, browser-based visualization framework that leverages Web Graphics Library (WebGL) to provide real-time, interactive 3D rendering without requiring specialized software. The proposed framework implements a novel dual multi-level-of-detail (LOD) strategy that optimizes both data representation and rendering performance. At the data level, urban buildings are classified into simplified or detailed geometric and computational models based on structural importance. At the rendering level, a dynamic graphics LOD approach adjusts visual complexity based on camera proximity. To realistically reproduce dynamic behaviors of complex structures, skeletal animation is introduced, while a quad tree-based spatial index ensures efficient object culling. The framework’s scalability and efficacy were validated by successfully visualizing the seismic response of approximately 100,000 buildings in New York City. Experimental results demonstrate that the proposed strategy maintains interactive frame rates (>24 frames per second) for views containing up to 4000 detailed buildings undergoing simultaneous and dynamic seismic behaviors. This approach significantly reduces rendering latency and proves extensible to other urban regions. The source code supporting this study is available from the corresponding author upon reasonable request.
1. Introduction
Urban areas, characterized by their high concentration of population and critical building structures, are exceptionally vulnerable to seismic events. The performance of individual buildings under seismic loading is a central concern, as structural failures can lead to catastrophic loss of life and severe economic disruption [1,2]. Moreover, devastating earthquake events, such as the 2011 East Japan earthquake [3] and the 2008 Wenchuan earthquake [4], have underscored the systemic nature of urban damage, where cascading failures across interconnected systems amplify the overall impact. Consequently, simulating the seismic response of entire urban regions, rather than isolated structures, offers a more holistic and realistic foundation for disaster prevention and reduction strategies.
Visualization serves as a critical component of this process, translating complex simulation data into intelligible graphical representations. Rapid and intuitive visualization of post-earthquake simulation results helps quickly identify severely damaged areas for loss assessment, evaluate the functional status of critical buildings and infrastructure (hospitals, fire stations, bridges) after earthquakes, and formulate emergency response and resource allocation strategies. The 3D visualization of urban buildings has traditionally been the domain of 3D Geographic Information Systems (3D-GIS) [5,6], with parallel advances in point clouds [7] and artificial intelligence [8], introducing novel paradigms. However, these methods are typically designed for static, general-purpose visual requirements and do not incorporate the fundamental structural properties (e.g., storey height, structural type) or engineering demand parameters (e.g., inter-storey drifts) essential for seismic analysis.
To bridge this gap, researchers have developed specialized solutions. For instance, Fujita et al. proposed a low-precision seismic hazard visualization method for GPU workstations based on GIS data and applied it to the dynamic display of more than 100,000 structures in Tokyo [9]. They then proposed a supercomputer-based visualization module integrated with an IES (integrated earthquake simulation) system to statically visualize the inter-storey drift angle and displacement of 250,000 buildings [10]. Xiong et al. extracted structural information from 3D city polygon models and developed corresponding calculation and visualization methods [11]. Based on the work of Xiong et al., Xu et al. first introduced building models with different fineness [12]. Despite these advances, such approaches face two persistent challenges. First, computational performance remains a critical bottleneck, as the real-time dynamic rendering of thousands of building models imposes a severe workload on both Central Processing Unit (CPU) and Graphics Processing Unit (GPU). Second, platform dependency restricts accessibility; most are standalone local applications that are difficult to distribute, maintain, and update, hindering collaborative disaster response.
To overcome these limitations, particularly platform dependency, recent research has shifted towards web-based solutions. Foundational technologies like WebGL and its popular library Three.js [13] have been pivotal, enabling GPU-accelerated 3D rendering directly within any standard web browser. This has spurred the development of sophisticated techniques aimed at performance and functionality. For example, methods like GPU instancing have been leveraged to drastically reduce draw call overhead for massive urban scenes [14]. The paradigm of web-based digital twins has also gained traction, creating data-rich virtual replicas of cities for real-time analysis [15,16], with some solutions even porting powerful game engines like Unreal Engine to the web for visual fidelity [17].
While these cutting-edge web solutions represent the pinnacle of performance, their sophistication often creates barriers. The complexity of large application bundles and reliance on game engines translates directly into poor accessibility for end-users, primarily government administrators, who are forced to contend with high system configuration requirements. More critically, optimizing techniques like GPU instancing can be fundamentally incompatible with seismic simulation, which requires granular control to manipulate each building’s mesh independently to visualize unique nonlinear behaviors like inter-story drifts. Therefore, there remains a need for a lightweight framework that prioritizes not only ease of deployment but also the essential architectural freedom for per-instance scientific visualization.
To address the above limitations, this paper proposes a novel, interactive visualization framework built upon modern web technologies. By leveraging WebGL, the framework enables GPU-accelerated 3D rendering directly within any standard web browser, eliminating platform barriers and enhancing accessibility. The core contribution of this work is a dual multi-LOD strategy designed to holistically optimize performance. This strategy is applied at two distinct levels. The two levels adopt different model fineness, seismic response calculation methods, and display principles. (1) Data Modeling: Buildings are classified by importance into simplified and detailed representations. (2) Graphics Rendering: Visual complexity is dynamically adjusted based on view distance. This approach is further enhanced by efficient view frustum culling using a quad tree spatial index and the novel application of skeletal animation for complex model deformation. The interactive functions are integrated, providing a shortcut to display damage conditions and subsequent development. The framework was successfully demonstrated in a case study of nearly 100,000 buildings in New York City, proving its scalability and practical utility. This work serves as a foundational proof-of-concept, laying the necessary groundwork for the future development of practical, user-centric decision-support tools for urban planners and emergency response personnel.
2. Framework
The proposed framework is architecturally designed around two primary, interconnected modules: a data processing module and a visualization module, as depicted in Figure 1. This modular design separates data preparation from real-time interactive rendering.
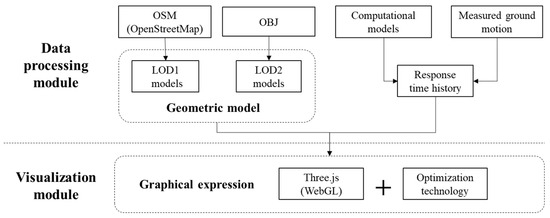
Figure 1.
Data processing module and visualization module.
The data processing module is responsible for the preprocessing of urban building data and the computation of seismic responses. It takes various data sources, such as OpenStreetMap (OSM) for building footprints and OBJ files for detailed models and generates two distinct geometric models (LOD1 and LOD2) along with their corresponding seismic response time histories. The visualization module is a lightweight, JavaScript-based application that operates entirely within a standard web browser. It consumes the pre-processed data to construct and render an interactive 3D scene. By harnessing the power of WebGL via the Three.js library, this module achieves hardware-accelerated graphics rendering without requiring any specialized software installation by the end-user. Crucially, it integrates a suite of optimization techniques to ensure fluid, real-time performance even with large-scale urban models.
3. Data Processing Module
This section elaborates on the critical functions of the data processing module, which encompasses data acquisition, multi-LOD modeling, and the computation of seismic responses.
3.1. Data Modeling with a Multi-LOD Approach
To manage the inherent complexity of urban datasets, the framework adopts the well-established concept of LOD, a methodology standardized by the City Geography Markup Language (CityGML) Encoding Standard for representing virtual 3D city models [18]. This concept allows for the representation of urban features at varying levels of geometric and semantic complexity. The proposed framework implements a pragmatic, dual-LOD strategy tailored for seismic visualization, classifying buildings into two categories based on their structural importance and complexity.
Modern cities comprise a heterogeneous building stock. The majority are low-to-mid-rise residential and commercial structures with regular geometries (e.g., reinforced concrete frames, masonry structures), which are suitable for simplified analysis and representation. In contrast, high-rise or special structures like skyscrapers, critical facilities (e.g., hospitals), and architecturally unique landmarks possess complex geometries and structural systems that demand high-fidelity modeling.
Consequently, our framework distinguishes between the following two LOD types. (1) LOD1 buildings represent the general building stock with simplified geometry and structural models. For regional-scale analysis, their seismic response can be reasonably approximated using simplified structural models, such as the multi-degree-of-freedom (MDOF) computing models. (2) LOD2 buildings represent critical or complex structures with detailed, high-fidelity geometry and advanced analysis models. The seismic performance of these buildings cannot be captured by simplified models and requires more sophisticated analysis, such as the finite element method (FEM), justifying their higher-fidelity representation. Figure 2 illustrates typical models for each category. The subsequent sections detail the data sources and preprocessing pipelines for each LOD type.
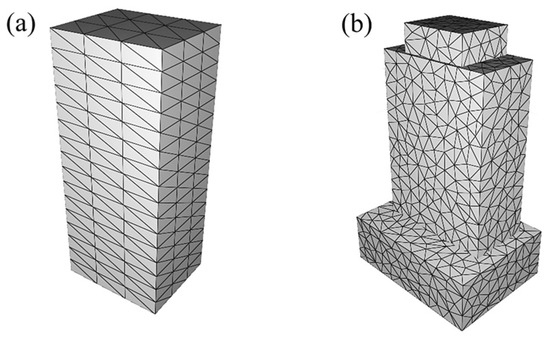
Figure 2.
Typical geometric models of (a) LOD1 and (b) LOD2 buildings.
3.1.1. LOD1 Building
The geometric representation of an LOD1 building is procedurally generated within the visualization by extruding its 2D footprint to a specified height, as shown in Figure 3a–c. This real-time generation approach minimizes upfront data storage and transmission, requiring only a basic dataset comprising 2D footprints and building height or storey count.

Figure 3.
Process of LOD1 modeling, including (a) footprint acquiring, (b) footprint extruding, and (c) final block model.
These foundational data are sourced from (1) cadastral datasets and (2) volunteered geographic information repositories, primarily OSM [19]. OpenStreetMap, founded in 2004 at University College London, is a collaborative mapping project that freely provides geographic information for the public [20]. In order to ensure the versatility of the data, OpenStreetMap datasets were chosen for subsequent processing.
OSM defines three kinds of spatial data elements (node, way, and relation) and stores them in XML (Extensible Markup Language) format, and each element is referenced by an id. Node represents the basic geographic coordinates, i.e., a point. Way consists of a series of ordered nodes representing polylines or regions. Relation describes the relationship between any two elements. In addition, the attribute data, i.e., tag, is used to record additional information of elements, such as the name of a place. However, this structure, typically stored in an XML format, is not suitable for fast data reading and contains a lot of redundant information, resulting in massive waiting time during the data import phase. Therefore, the development of corresponding preprocessing programs, including streamlining and format conversion, is necessary for optimization. Figure 4 shows the flow chart of the preprocessor for OSM data, which was implemented via a custom Python 3.9.18 script that performs three key operations.
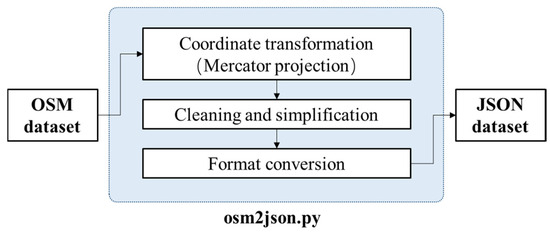
Figure 4.
Preprocessor for converting OSM data.
First, the building footprint polygons are extracted from the raw XML data, with coordinates converted into planar coordinate systems. The XML parsing was implemented with Python standard library, and the coordinate converting was implemented with GeoPandas. Specifically, OSM uses the World Geodetic System 1984 latitude and longitude system, which does not form a uniform grid. Plotting these directly on a local 2D plane leads to significant geometric distortion when visualizing large urban areas (as illustrated in Figure 5). To address this issue, the Mercator projection, an isometric cylindrical map projection, is commonly employed [21] in Web mapping services. Mercator projection produces an orthogonal (x, y) system, which preserves local angles and shapes, making it essential for accurately extruding 2D building footprints into 3D models. Equations (1) and (2) show the basic principle:
where (x, y) represents the orthogonal map plane coordinates after projection. φ and λ represent the latitude and longitude of the target point. λ0 is the central meridian.

Figure 5.
Shape deformation of a building cluster footprint, where (a) is described by Web Mercator coordinates while (b) by World Geodetic System 1984.
Second, data cleaning and simplification are performed. For urban area earthquake disaster scenarios, the original OSM dataset contains a large amount of redundant information, and the tags often contain key–value pairs that are not related to the entity attributes. Figure 6 shows the tag structure of a way element. “NJDOT_SRI” in Tag [3] is the identification information for the editor, for which it is difficult to distinguish the true meaning. Such information should be removed in the data simplification process.
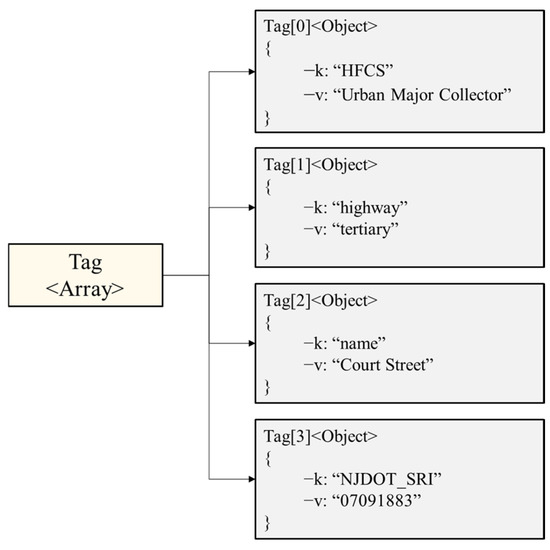
Figure 6.
Data structure of tag from a “way” element.
Finally, the script serializes the processed data into JSON (JavaScript Object Notation). Compared with the XML format, JSON has a simpler structure, smaller bandwidth during transmission, and lower difficulty to parse, which make it more suitable for this application. This conversion serializes the data into a streamlined structure, significantly reducing file size and parsing time for the web application. This well-defined procedure ensures that the foundational data is both geometrically accurate and optimized for web delivery.
3.1.2. LOD2 Building
Due to the geometric complexity of LOD2 buildings, their models must be pre-built and stored in a standardized 3D format for efficient import. The OBJ format was selected for its simplicity and broad compatibility. While sources like Google Earth provide extensive repositories of detailed building models, manual modeling remains a viable alternative for critical structures.
However, these pre-existing LOD2 models present significant challenges for dynamic engineering visualization. Unlike the structured LOD1 models, they typically have an unstructured topology consisting of large, irregular polygons with a sparse and uneven vertex distribution (Figure 2). Crucially, this geometry lacks explicit floor-level information, making it programmatically difficult to identify and animate the floor-by-floor seismic displacements required for a meaningful visualization. To solve this problem, Xiong et al. used a floor plan generation method to structure the model and accommodate processes similar to the LOD1 building [11]. However, such a method is complicated in generation and matches with the IES system.
Therefore, this paper proposes an unstructured model processing approach that circumvents the need for complex floor plan generation. The key to this approach is using skeletal animation, a technique common in computer graphics, which is enabled by a remeshing preprocessing step. The core challenge is that skeletal animation requires a “skin” that can be smoothly deformed by an underlying “skeleton”. The sparse, irregular vertices of an original LOD2 model provide an inadequate skin for this process, as there are not enough points to bind to the bones for a realistic deformation.
Figure 7 shows the workflow from preprocessing to visualization of the LOD2 model. The original OBJ model first undergoes a remeshing operation. As shown in the comparison in Figure 8, this step algorithmically reconstructs the model’s surface to create a dense and uniform distribution of vertices. A simple hierarchical skeleton is generated for floor levels (described in detail in Section 4). This method circumvents the need for complex floor plan generation and is suitable for general-purpose visualization schemes. The remeshing operation was performed using standard algorithms available in Blender 4.3 (or other 3D modeling software), via its Python scripting API.
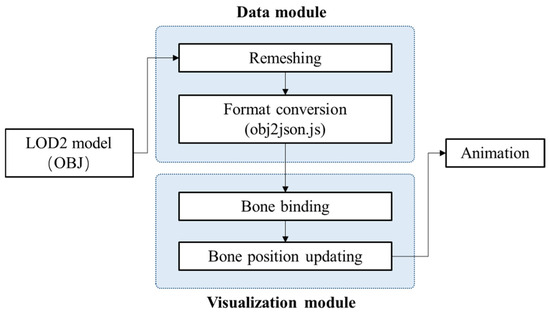
Figure 7.
Preprocessing and rendering process for the LOD2 model.
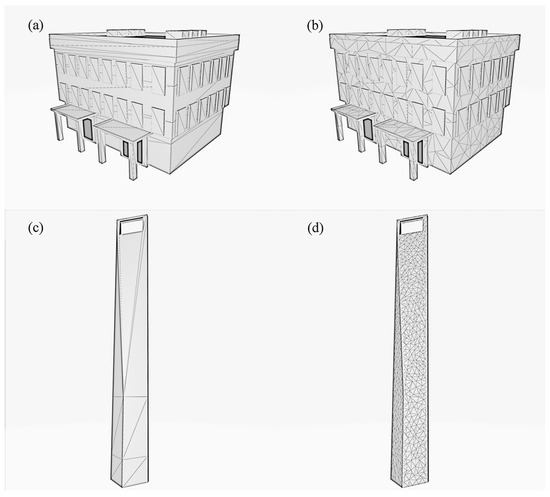
Figure 8.
Comparison of meshes before and after remeshing, where (a,c) are original models, (b,d) are remeshed models.
After the remeshing operation, the model will be converted to a 3D object defined in Three.js and stored in a JSON file. This process is carried out by the program obj2json.js provided by Three.js.
3.2. Seismic Response Calculation
Dynamic visualization of structural seismic damages requires detailed time history response data as a primary input. The generation of this data, while outside the primary scope of this visualization framework, is a critical prerequisite. Before the earthquake, the simulation serves the assessment of the buildings’ seismic capacity, providing a scientific basis for the development of seismic planning. After the earthquake, fast and accurate simulation strongly affects the effectiveness of the disaster relief. This section briefly outlines the established structural analysis methods used to generate the necessary input data for the proposed system. It is important to emphasize that the primary innovation of this paper lies in the visualization framework, not in the seismic simulation methodology itself.
Different analysis models have been proposed for earthquake disaster simulation of urban buildings. Early approaches, such as the vulnerability matrix [22], provided probabilistic damage estimates for large areas based on historical seismic damage records. However, it could not resolve damage for individual structures. The Hazus methodology [23] advanced this by predicting building-specific damage based on a capability and demand spectrum. However, a significant limitation is that Hazus typically calculates only the maximum displacement and acceleration demands, often considering only the first mode of vibration [24]. Consequently, these methods do not produce the continuous time history response needed to animate structural behavior over the duration of an earthquake event. To overcome this limitation, modern approaches like the integrated earthquake simulation (IES) system developed by Hori et al. [25] are employed. These systems utilize multi-degree-of-freedom (MDOF) models to compute the full displacement time history for each floor of a building.
Consistent with the dual-LOD data strategy, different computational models are used for LOD1 and LOD2 buildings to balance accuracy and efficiency. For LOD1 buildings (simple structures), time history results from efficient MDOF lumped parameter models are utilized. This common engineering simplification idealizes the building as a series of lumped masses (representing the mass of each floor) connected by springs and dashpots (representing the lateral stiffness and damping of the columns and walls at each storey). The equation of motion for this system is solved numerically to obtain the time history of floor displacements. The floor area and equivalent mass properties of the structures are calculated based on the footprints and structural types [26], while dynamic characteristics such as the fundamental period are estimated according to seismic codes and the number of stories [27]. The nonlinear behavior of the structural system was characterized by using the Bouc–Wen hysteresis model, with model parameters being identified following the methodology proposed by Xiang et al. [28].
For LOD2 buildings (critical or complex structures), seismic responses are obtained by FEM considering the large difference in seismic performance compared to general buildings. In an FEM analysis, the building is discretized into a detailed mesh of elements (e.g., beam, column, and shell elements) that represent the actual structural components. This allows for a much more accurate simulation of complex behaviors like torsional effects and localized stress concentrations.
4. Visualization Module and Optimization Technologies
This section details the architecture of the real-time visualization module and the critical optimization strategies employed to render large-scale urban seismic scenarios interactively in a web browser.
4.1. Visualization Module
After preprocessing, the building data will be transmitted into the visualization module for the construction of the 3D scenarios and the expression of the earthquake disaster. The visualization module is driven by a JavaScript program that orchestrates the 3D scene using the Three.js library, which runs on web page accesses and renders the scene in real time. Its core logic is encapsulated within two primary functions, as illustrated in Figure 9.
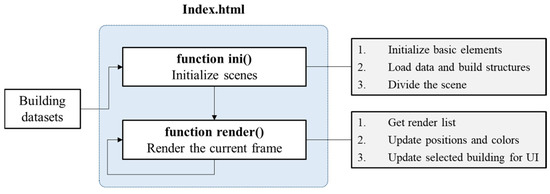
Figure 9.
Visualization module.
The role of “function ini()” is 3D scene initialization. This function executes once upon loading. It sets up the fundamental components of the 3D scene, including the WebGL renderer, camera, and lighting. It then proceeds to load the pre-processed building datasets and procedurally constructs the corresponding Three.js geometric objects. The final and most critical initialization step is the construction of a quad tree spatial index (detailed in Section 4.3.2) to partition the scene for efficient object culling.
Render is a self-calling function that performs the rendering of the current frame. First, it queries the quad tree to efficiently determine the set of buildings currently visible within the camera’s view frustum. Then, it iterates through the visible buildings, updating their floor displacements and color-coding based on the pre-computed seismic response time histories. This is where the animation occurs. Next, it updates user interface elements and responds to user inputs, such as selecting a specific building for detailed inspection. After the above steps are completed, the function calls itself to render the next frame.
4.2. Animation of Seismic Response
The graphical representation of a building’s dynamic response is achieved by animating its geometry according to the time history data. The implementation differs significantly between the two LOD types.
The simple, structured geometry of LOD1 models contains vertex positions representing the building’s floor planes, allowing for direct manipulation. The vertices corresponding to each floor plane are programmatically displaced at each time step according to the MDOF analysis results. This method is straightforward and computationally inexpensive.
However, the complex, unstructured topology of LOD2 models makes direct vertex manipulation impractical. Interpolation needs to be performed for each vertex at runtime, which is very complicated and error prone. To this end, this paper draws on the idea of skeletal animation and applies it to the building animation.
Skeletal animation is a technique in computer animation and games. An object (or character) using skeletal animation can be represented by two parts, the surface portion of the object itself (skin) and the bones that drive the skin movement. A skeleton is a hierarchical system in which each bone (except the root bone) has a parent and moves together. For example, the movement of the thigh bone drives the movement of the calf bone. In other words, the global transformation matrix of the child bone is the product of the parent bone transformation matrix and its local transformation matrix. At the same time, the skin is bound to and moves with the corresponding bones. For a 3D model, a series of vertices with spatial coordinates are attached to one or more adjacent bones with the weighting factors set in advance. As the bone moves, all associated vertex coordinates are interpolated based on the weighting factors.
Building models have a standard hierarchical structure and are well suited for single-parent skeletons. The bones of the building model are connected in series with each other in the vertical direction, and the number of bones is exactly the number of building floors, as shown in Figure 10. In actual 3D scenes, only the position of the floor mapping bone node needs to be changed. The skin of the model, i.e., the coordinates of building vertex, will automatically move with the interpolation operation.
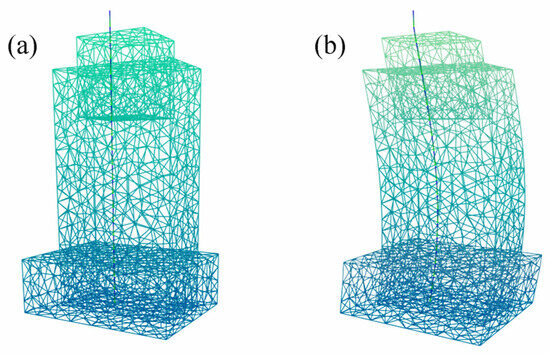
Figure 10.
Demonstration of skeletal animation for buildings. (a) The initial bone structure. (b) The model deformation driven by the bones in a dynamic scenario.
4.3. Performance Optimization Technologies
Achieving real-time frame rates for scenes with tens of thousands of objects on consumer-grade hardware requires aggressive optimization. The framework implements a two-pronged optimization strategy addressing both per-object update costs and scene-level query costs.
According to Section 4.1, the visualization framework proposed in this paper includes two parts: initialization and rendering. The waiting time of the initialization process is mainly related to the size of the imported datasets, which has already been simplified in the aspects of structure and content in the data processing module. The waiting time of the rendering process, i.e., the duration for which each frame is rendered, is the main factor in measuring visual performance, and hence, some targeted optimization techniques are introduced. For the stage of obtaining the render list, a quad tree-based scene division method (frustum culling algorithm) is used. For the stage of data updating, the LODs in the aspect of graphics performance are employed.
4.3.1. Dynamic Graphics LOD for Rendering
Distinct from the data-level LOD which governs model geometry and simulation fidelity, the graphics LOD is a dynamic optimization performed at rendering time. It addresses the performance bottleneck associated with updating vertex attributes for every visible building in every frame. The principle is to reduce the computational load for distant objects that contribute minimally to the user’s perception. For buildings far away from the camera, a proper reduction in rendering effects can reduce the updating time and improve the operating efficiency.
In the computer graphics rendering pipeline, a perspectival image is obtained by perspective projection from the frustum space of the camera. View frustum is a frustum of the pyramid of vision. It is the adaptation of the cone of vision that a camera or eye would have to a rectangular viewport typically used in computer graphics [29,30]. The planes that cut the cone perpendicular to the viewing direction are called the near plane and the far plane, which defines the extent of the rendered object. Objects outside the view frustum will not be rendered.
For 3D scenes of urban buildings, the number of same-screen buildings is often very high: sometimes tens of thousands of buildings are rendered at the same time. It is very time consuming to update the vertices of these buildings sequentially. Owing to the limitation of hardware performance, it is nearly impossible to perform the same fine-grained dynamic rendering for all buildings, and thus, a concept of animation LOD is introduced. In this paper, the frustum space (Figure 11) is divided into two parts, called LOD1 and LOD2, as shown in Figure 12.
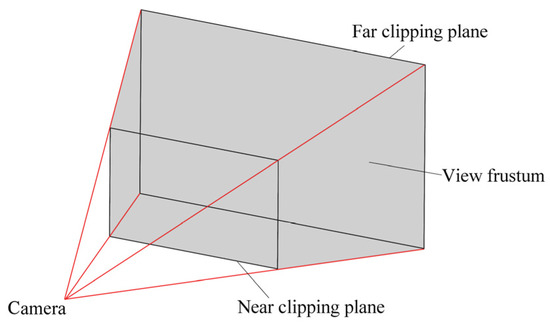
Figure 11.
View frustum and its clipping planes.
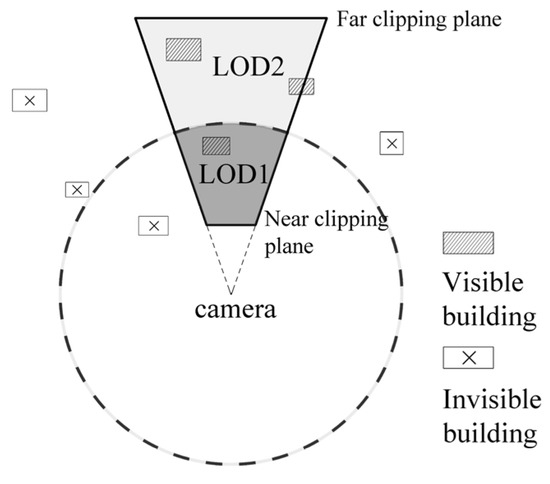
Figure 12.
Levels of detail for graphics.
LOD1 refers to the range in which the frustum space coincides with a circle of a certain size centered on the camera. All buildings in this range go through the complete process, including attributes update and rendering. LOD2 refers to the complementary set of LOD1 in the view frustum space. All buildings in this range are static without updates of position and color. Since the buildings in the LOD2 range are far from the camera, users usually do not pay much attention to the damage of each layer. Therefore, by setting an appropriate boundary circle radius, the operation efficiency can be improved with minimum information loss. Figure 13 shows the step durations of the render function.
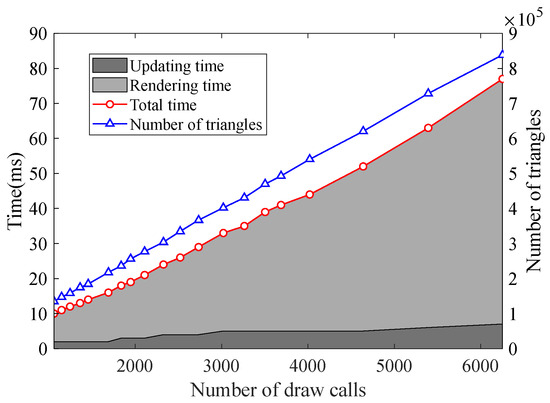
Figure 13.
Comparison of step durations of the render function in a frame and scene.
Draw call indicates that the CPU calls the graphics programming interface (such as DirectX or OpenGL) to command the GPU to perform the rendering operation. The number of draw calls considerably affects the graphics rendering performance [31]. In this program, each building model is rendered in a separate draw call. The number of triangles indicates the total number of triangle patches of polygon models in the scene, which can represent the rendering workload of the current frame. The time for updating and time for rendering represents the time taken by the update and render steps in the rendering of each frame, respectively. In addition, the time for obtaining the render list is basically less than 1 ms with the quad tree spatial index (see Section 4.3.2).
Note that the number of draw calls is basically proportional to the rendering time of stage. The update and render steps take up most of the rendering time. The update time growth is not obvious, whereas the rendering time grows fast. Therefore, it can be inferred that in the scenes where number of draw calls is limited, reducing the update time by LOD division is effective for performance improvement. FPS (frames per second) is an important indicator in animation smoothness measures. The FPS of a certain frame can be calculated in real time by
where 1000 (ms) refers to the duration of a second, and refers to the total duration of the previous frame rendering.
Table 1 lists the durations for each stage and FPS with different workloads. Dynamic FPS refers to the frame rate when LOD optimization is not performed. Static FPS refers to the frame rate when all buildings are classified as LOD2, which is in a static form. Currently, the radius of the LOD circle is 0. The maximum performance improvement Pmax refers to the extent to which the rendering time is reduced, and it is calculated by
where , , and represent the durations for obtaining the render list, updating, and rendering. It can be observed that the performance improvement achieved by the LOD division method is more obvious in the frame rate interval (30 to 60 Hz) adapted to human eyes. However, for space scenarios that contain many draw calls, the performance gains are limited.

Table 1.
Duration for each stage and FPS in a single frame.
4.3.2. Scene Culling via Quad Tree Spatial Index
The graphics LOD optimization significantly reduces the per-object update cost without affecting the visual effects. However, a remaining bottleneck is the process of identifying which buildings lie within the camera’s view frustum. In a spatial database, such a problem belongs to the nearest neighbor search, which means searching for the closest targets for a particular point or range. The simplest nearest neighbor search method is to traverse the building information (linear search) with a time complexity of . We say that this method has a linear time. Existing methods for the visualization of building areas have all used this method [11,12,32]. However, linear search is only applicable to small-scale databases, and it takes a long time in the case of many messages. Experiments have shown that for a 100,000-level urban building scenario, a linear search requires a duration of 15 ms, which seriously affects the real-time rendering coherence. Therefore, spatial index is needed to optimize the spatial queries.
To overcome this limitation, we employ a quad tree spatial index, a highly efficient data structure for partitioning two-dimensional space [33]. The quad tree spatial index is often used in the analysis and classification of two-dimensional spatial data such as collision detection. The quad tree divides the space of the known range into four equal subspaces and performs the same recursive division to the next level, until a certain level or requirement is reached. The quad tree spatial index for an urban scene and the corresponding data structure are shown below.
In the 3D coordinate system, urban buildings are widely distributed in the horizontal direction but restricted in the vertical direction, which can be simplified into a two-dimensional spatial distribution. In addition, because of the constraints of surrounding road network system, city buildings are usually subject to a dense and regular distribution, which matches with the structure of a quad tree. Figure 14 shows a simple 2-level quad tree indexed scene, where a single building is stored on the leaf node according to its central coordinates of the bounding sphere, and the intermediate node and root node do not store building information. Figure 15 shows the quad tree’s structure.
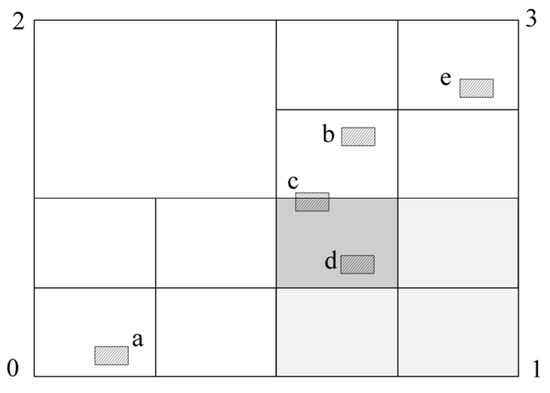
Figure 14.
The quad tree spatial index.
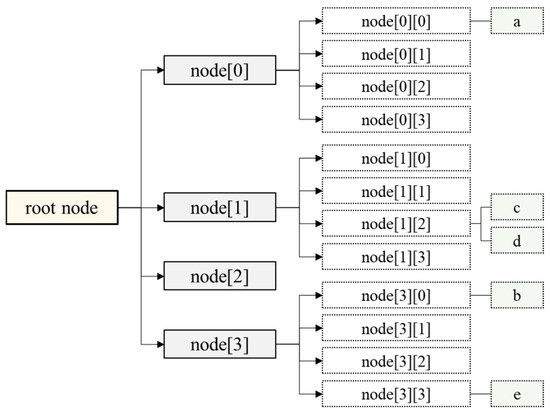
Figure 15.
Structure of a quad tree spatial index.
For the actual visualization process, it is necessary to pre-build a quad tree and embed the buildings into leaf nodes in the initialization stage. The squares in Figure 14 represent the buildings at this point, e.g., building c being embedded into leaf node [1,2]. In each frame rendering, the spatial extent of level 0 node (root node) and the view frustum are determined first. If some or all of them overlap, the four children (nodes of the next level) are recursively checked. If not coincident, the recursion of this branch is stopped. Eventually, a list of buildings contained by the view frustum in the current frame is obtained, which will be processed or rendered in the later steps.
The quad tree-based scene division technique can reduce time complexity of searching from to . A comparison of the two algorithms is shown in Figure 16. The horizontal axis represents the scale of the input, and the vertical axis represents the time complexity , which is the maximum running time of the algorithm.
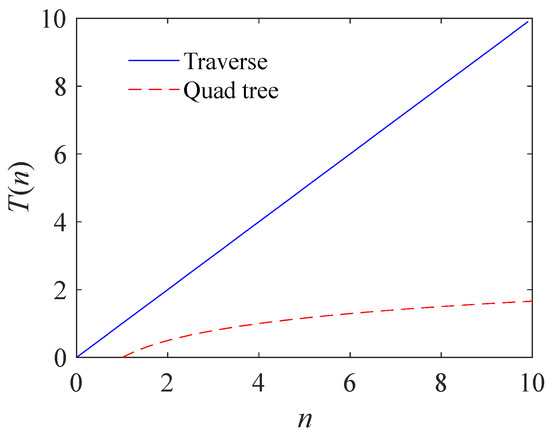
Figure 16.
Time complexities of traversing (linear search) and quad tree index.
In the scenario with nearly 100,000 buildings used in this paper (see Section 5), a 7-level quad tree spatial index is constructed based on the size of site. The time required to perform the obtaining render list operation in different circumstances is shown in Figure 17. Notably, the time spent traversing each building is positively related to the number of buildings, which reaches 15 ms when the number of buildings is 97,367. The quad tree spatial indexing method always requires a computation time of less than one millisecond. Moreover, the delay in searching for the rendered object is substantially eliminated in this method, further improving the computing efficiency.
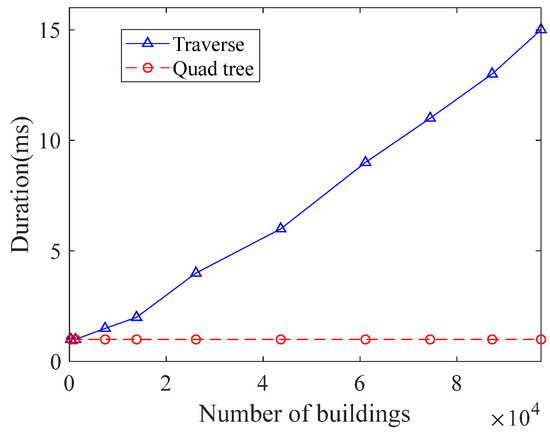
Figure 17.
Durations of obtaining render list operation in both methods.
4.4. Interactive Function
Traditional methods for visualizing urban seismic damage, such as static maps in reports or pre-rendered images, are fundamentally limited. They typically present a single, final snapshot of damage, imposing a one-way flow of information from the media to the user. This approach is inadequate for the vast and dynamic datasets generated by large-scale seismic simulations, as it cannot convey the time-varying nature of structural responses or allow for user-driven exploration. For a dataset encompassing nearly 100,000 buildings, each with a complex seismic response time history, a static display struggles to handle such a vast amount of information and fails to provide the necessary depth required for structural-level or floor-level damage analysis. Interactive visualization has brought a lot of convenience to data display and analysis. Information publishers may display a larger amount of data, and users may transfer information to the media, such as geographic maps, internet maps, and graph data on user social networks, so as to obtain the required data and analyze it more flexibly and quickly.
Therefore, dat.GUI [34], a lightweight graphical user interface library, was employed to provide direct, real-time control over the visualization, addressing the shortcomings of static methods. As shown in Figure 18, the interface provides several key interactive functions that empower users like emergency planners and engineers. (1) Dynamic Exploration and Filtering: The General Options allow users to toggle the visibility of different model types or switch between static and animated views. This allows them to filter the visual information and focus on either the overall urban fabric or specific high-fidelity structures. (2) Detailed Inspection: The Selectable function enables users to click on any building to retrieve and display its specific response data, potentially in combination with other HyperText Markup Language (HTML) or JavaScript elements. This transforms the visualization from a broad overview into a precise inspection tool, allowing for deep dives into the performance of individual assets. (3) Parameter Control: The Animation Options allow for real-time adjustment of the animation’s amplitude and speed. This enables users to exaggerate motion to better identify patterns of structural behavior or slow down the simulation to observe critical moments of the seismic response. (4) Performance Management: Crucially, the Performance Options allow dynamical adjustment of the rendering load by modifying the number of visible buildings or the graphics LOD threshold. By implementing these controls, the framework provides a basis for further development of user-centric features tailored for disaster assessment and planning.
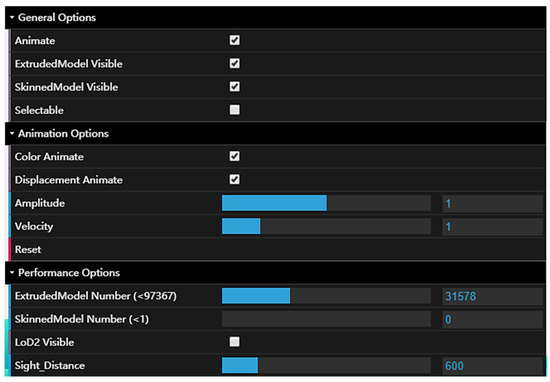
Figure 18.
Some interactive functions in the visualization scheme.
5. Application
To verify the proposed framework’s practical effectiveness for regional buildings, a case study was conducted on a dense urban area of New York City. The dataset, derived primarily from OSM, encompasses 97,367 individual building models within a 9025 m × 7392 m region. This large-scale, complex environment serves as a robust testbed to evaluate the performance of our proposed visualization strategies under real-world conditions.
The framework successfully processed and rendered this entire dataset, demonstrating its capability to handle large-scale urban models. The quality of the visualization is illustrated in Figure 19, which showcases both a macro-level overview of the entire district and a detailed street-level perspective where individual building responses are clearly discernible. This dual-view capability, combined with the ability to integrate high-fidelity LOD2 models on demand, highlights the effectiveness of the multi-LOD data strategy.
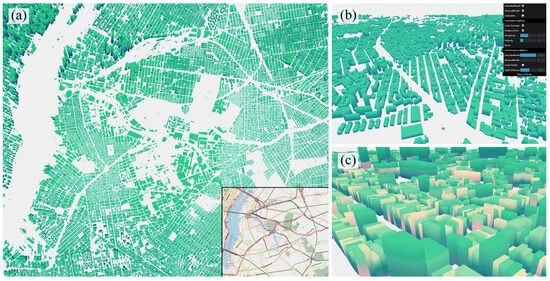
Figure 19.
(a) Overall and (b,c) partial effects of the New York case in visualization module.
The core of the evaluation focused on real-time rendering performance, with detailed results presented in Table 1 (Section 4.3.1). The tests were conducted on a consumer-grade system equipped with an Intel(R) Core(TM) i5-8600 CPU @ 3.10 GHz and an NVIDIA GeForce GTX 1070Ti GPU. The results demonstrate that the framework maintains interactive frame rates (>24 FPS) for views containing up to 4000 simultaneously rendered buildings, even at such low hardware levels. This level of interactivity in a browser-based environment for a dataset of this magnitude is a direct result of the proposed combined optimization approach. The quad tree spatial index ensures efficient view frustum culling, while the dynamic graphics LOD minimizes the computational load for distant objects.
As the number of visible buildings surpasses 4000, performance degradation is observed. This is primarily attributed to the high number of draw calls, a well-known bottleneck in real-time graphics where each building requires a separate rendering instruction from the CPU to the GPU [31]. However, in most practical use cases, such as street-level or low-altitude navigation, natural occlusion and the camera’s view frustum inherently limit the number of visible buildings to well within the optimal performance range. Note that although the information presented is specific to a case study, the developed method is transferable to other cities.
6. Conclusions
This paper presented a novel, web-based framework for the interactive visualization of large-scale urban seismic scenarios, making advanced simulation results accessible on personal computers without specialized software. The core of the contribution is a dual multi-LOD strategy that optimizes both data complexity and rendering workload. By classifying buildings into distinct LODs, employing skeletal animation for complex model deformation, and implementing a high-performance quad tree spatial index, our framework achieves real-time interactivity for scenes containing up to 100,000 buildings.
The performance evaluation confirmed the efficacy of the quad tree index and graphics LOD system. However, it also revealed that the number of draw calls becomes the primary bottleneck in densely populated scenes, a known limitation of 3D-GIS applications.
Future work will focus on addressing this challenge. A promising direction is the implementation of geometry merging for buildings that do not require individual interaction, which can drastically reduce the number of draw calls by batching many buildings into a single rendering instruction. Additionally, integrating dynamic data streaming techniques overcomes local memory constraints, enabling the visualization of city-scale models of virtually unlimited sizes. Beyond technical advancements, a critical next step will be to engage in formal usability studies in collaboration with domain experts, such as municipal engineers and emergency management professionals. These studies will be essential for gathering user feedback, refining the interactive functionalities to meet the specific needs of disaster assessment and planning, and ultimately validating the practical utility of the framework in real-world scenarios.
Author Contributions
Conceptualization, J.W. and Z.X.; methodology, J.W. and Z.X.; visualization, J.W.; writing—original draft, Z.X. and Y.L.; writing—review and editing, Z.X. and Y.L. All authors have read and agreed to the published version of the manuscript.
Funding
This research was funded by the National Natural Science Foundation of China, grant number 52408556 and 52108158, and the Shanghai Rising-Star Program, grant number 24QB2703100.
Data Availability Statement
The original contributions presented in this study are included in the article. Further inquiries can be directed to the corresponding author.
Conflicts of Interest
Author Zekun Xu was employed by the company Shanghai Key Laboratory of Engineering Structure Safety, Shanghai Research Institute of Building Sciences Co., Ltd. Author Yang Li was employed by the company China United Engineering Co., Ltd. The remaining author declares that the research was conducted in the absence of any commercial or financial relationships that could be construed as a potential conflict of interest.
Abbreviations
The following abbreviations are used in this manuscript:
| CityGML | City Geography Markup Language |
| CPU | Central Processing Unit |
| FEM | Finite Element Method |
| FPS | Frames Per Second |
| GIS | Geographic Information System |
| GPU | Graphics Processing Unit |
| HTML | HyperText Markup Language |
| IES | Integrated Earthquake Simulation |
| JSON | JavaScript Object Notation |
| LOD | Level of Detail |
| MDOF | Multi-Degree-of-Freedom |
| OSM | OpenStreetMap |
| WebGL | Web Graphics Library |
| XML | Extensible Markup Language |
References
- Borghini, A.; Gusella, F.; Vignoli, A. Seismic vulnerability of existing RC buildings: A simplified numerical model to analyse the influence of the beam-column joints collapse. Eng. Struct. 2016, 121, 19–29. [Google Scholar] [CrossRef]
- Nicoletti, V.; Carbonari, S.; Gara, F. Nomograms for the pre-dimensioning of RC beam-column joints according to Eurocode 8. Structures 2022, 39, 958–973. [Google Scholar] [CrossRef]
- Mimura, N.; Yasuhara, K.; Kawagoe, S.; Yokoki, H.; Kazama, S. Damage from the great east Japan earthquake and tsunami—A quick report. Mitig. Adapt. Strateg. Glob. Change 2011, 16, 803–818. [Google Scholar] [CrossRef]
- Wang, Z. A preliminary report on the great Wenchuan earthquake. Earthq. Eng. Eng. Vib. 2008, 7, 225–234. [Google Scholar] [CrossRef]
- Zhou, Q.; Zhang, W. A preliminary review on 3-dimensional city model. Geo-Spat. Inf. Sci. 2004, 7, 79–88. [Google Scholar]
- Miranda, F.; Ortner, T.; Moreira, G.; Hosseini, M.; Vuckovic, M.; Biljecki, F.; Silva, C.T.; Lage, M.; Ferreira, N. The state of the art in visual analytics for 3D urban data. Comput. Graph. Forum 2024, 43, e15112. [Google Scholar] [CrossRef]
- Yu, S.; Guo, T.; Wang, Y.; Han, X.; Du, Z.; Wang, J. Visualization of regional seismic response based on oblique photography and point cloud data. Structures 2023, 56, 104916. [Google Scholar] [CrossRef]
- Turki, H.; Ramanan, D.; Satyanarayanan, M. Mega-NERF: Scalable construction of large-scale nerfs for virtual fly-throughs. In Proceedings of the IEEE/CVF Conference on Computer Vision and Pattern Recognition (CVPR), New Orleans, LA, USA, 18–24 June 2022; pp. 12912–12921. [Google Scholar]
- Fujita, K.; Ichimura, T.; Hori, M.; Wijerathne, M.L.L.; Tanaka, S. A quick earthquake disaster estimation system with fast urban earthquake simulation and interactive visualization. Procedia Comput. Sci. 2014, 29, 866–876. [Google Scholar] [CrossRef]
- Fujita, K.; Ichimura, T.; Hori, M.; Maddegedara, L.; Tanaka, S. Scalable multicase urban earthquake simulation method for stochastic earthquake disaster estimation. Procedia Comput. Sci. 2015, 51, 1483–1493. [Google Scholar] [CrossRef]
- Xiong, C.; Lu, X.; Hori, M.; Guan, H.; Xu, Z. Building seismic response and visualization using 3D urban polygonal modeling. Autom. Constr. 2015, 55, 25–34. [Google Scholar] [CrossRef]
- Xu, Z.; Lu, X.; Law, K.H. A computational framework for regional seismic simulation of buildings with multiple fidelity models. Adv. Eng. Softw. 2016, 99, 100–110. [Google Scholar] [CrossRef]
- Three.js—JavaScript 3D Library. Available online: https://threejs.org/ (accessed on 29 June 2024).
- Steeger, S.; Atzberger, D.; Scheibel, W.; Döllner, J. Instanced rendering of parameterized 3D glyphs with adaptive level-of-detail using three.js. In Proceedings of the 29th International ACM Conference on 3D Web Technology, New York, NY, USA, 25 September 2024. [Google Scholar]
- Schrotter, G.; Hürzeler, C. The digital twin of the city of Zurich for urban planning. PFG–J. Photogramm. Remote Sens. Geoinf. Sci. 2020, 88, 99–112. [Google Scholar] [CrossRef]
- La Guardia, M.; Koeva, M. Towards digital twinning on the web: Heterogeneous 3D data fusion based on open-source structure. Remote Sens. 2023, 15, 721. [Google Scholar] [CrossRef]
- Rantanen, T.; Julin, A.; Virtanen, J.-P.; Hyyppä, H.; Vaaja, M.T. Open geospatial data integration in game engine for urban digital twin applications. ISPRS Int. J. Geo-Inf. 2023, 12, 310. [Google Scholar] [CrossRef]
- Gröger, G.; Kolbe, T.H.; Nagel, C.; Häfele, K. City Geography Markup Language (CityGML) Encoding Standard; OGC: Arlington, VA, USA, 2012. [Google Scholar]
- OpenStreetMap. Available online: https://www.openstreetmap.org/ (accessed on 12 September 2023).
- Neis, P.; Zipf, A. Analyzing the contributor activity of a volunteered geographic information project—The case of OpenStreetMap. ISPRS Int. J. Geo-Inf. 2012, 1, 146–165. [Google Scholar] [CrossRef]
- Briney, A. A Look at the Mercator Projection. 2014. Available online: https://www.gislounge.com/look-mercator-projection/ (accessed on 1 December 2022).
- Rojahn, C.; Sharpe, R.L. ATC-13 Earthquake Damage Evaluation Data for California; ACT: Redwood City, CA, USA, 1985. [Google Scholar]
- Federal Emergency Management Agency (FEMA). Earthquake Loss Estimation Methodology-HAZUS 97; Federal Emergency Management Agency (FEMA): Washington, DC, USA; National Institute of Building Sciences (NIBS): Washington, DC, USA, 1999.
- Hori, M. Introduction to Computational Earthquake Engineering; World Scientific: Singapore, 2006. [Google Scholar]
- Hori, M.; Ichimura, T.; Nakamura, H.; Wakai, A.; Ebisawa, T.; Yamaguchi, N. Integrated earthquake simulator for seismic response analysis of structure set in city. Struct. Eng./Earthq. Eng. 2006, 23, 297s–306s. [Google Scholar]
- Xu, Z.; Chen, J.; Shen, J.; Xiang, M. Regional-scale nonlinear structural seismic response prediction by neural network. Eng. Fail. Anal. 2023, 154, 107707. [Google Scholar] [CrossRef]
- American Society of Civil Engineers. Minimum Design Loads and Associated Criteria for Buildings and Other Structures; American Society of Civil Engineers: Reston, VA, USA, 2022. [Google Scholar]
- Xiang, M.; Chen, J.; Shen, J.; Wang, Z. Regional-scale stochastic nonlinear seismic time history analysis of RC frame structures. Bull. Earthq. Eng. 2022, 20, 8123–8149. [Google Scholar] [CrossRef]
- Parekh, R. Principles of Multimedia, 2nd ed.; Tata McGraw-Hill: New Delhi, India, 2012. [Google Scholar]
- Akenine-Moller, T.; Haines, E.; Hoffman, N. Real-Time Rendering; A K Peters/CRC Press: New York, NY, USA, 2018; p. 1198. [Google Scholar]
- Wloka, M. Batch, batch, batch: What does it really mean? In Proceedings of the Game Developers Conference, San Jose, CA, USA, 4–8 March 2003. [Google Scholar]
- Lu, X.; Xu, Z.; Xiong, C.; Zeng, X. High performance computing for regional building seismic damage simulation. Procedia Eng. 2017, 198, 836–844. [Google Scholar] [CrossRef]
- Finkel, R.A.; Bentley, J.L. Quad trees: A data structure for retrieval on composite keys. Acta Inform. 1974, 4, 1–9. [Google Scholar] [CrossRef]
- Google Inc. dat.GUI. Available online: https://github.com/dataarts/dat.gui (accessed on 5 January 2022).
Disclaimer/Publisher’s Note: The statements, opinions and data contained in all publications are solely those of the individual author(s) and contributor(s) and not of MDPI and/or the editor(s). MDPI and/or the editor(s) disclaim responsibility for any injury to people or property resulting from any ideas, methods, instructions or products referred to in the content. |
© 2025 by the authors. Licensee MDPI, Basel, Switzerland. This article is an open access article distributed under the terms and conditions of the Creative Commons Attribution (CC BY) license (https://creativecommons.org/licenses/by/4.0/).