Article

Small-Rib-Height Perfobond Strip Connectors (SRHPBLs) in Steel–UHPC Composite Beams: Static Behavior Under Combined Tension–Shear Loads

School of Civil and Transportation Engineering, Guangdong University of Technology, Guangzhou 510006, China
*
Authors to whom correspondence should be addressed.
Buildings 2025, 15(16), 2892; https://doi.org/10.3390/buildings15162892
Submission received: 14 July 2025 / Revised: 12 August 2025 / Accepted: 14 August 2025 / Published: 15 August 2025
(This article belongs to the Special Issue UHPC Materials: Structural and Mechanical Analysis in Buildings)

Abstract

Steel–ultra-high-performance concrete (UHPC) composite beams with small-rib-height perfobond strip connectors (SRHPBLs) exhibited advantages of light weight and high bearing capacity, demonstrating the potential for applications of UHPC in bridge engineering. During service stages, the composite beams were usually under combined tension–shear loads, rather than pure shear loads. Nevertheless, there were research gaps in the static behavior of SRHPBLs embedded in UHPC under combined tension–shear loads, which limited their applications in practice. To address this issue, systematic experimental and theoretical analyses were conducted in the present study, considering the test variables of tension–shear ratio, row number, and strip number. It was demonstrated that the tension–shear ratio had less effect on ultimate shear strength, initial shear stiffness, and ultimate slip of SRHPBLs. When the tension–shear ratio was increased from 0 to 0.42, the shear capacity, initial shear stiffness, and slip at peak load of SRHPBLs decreased by 24.31%,19.02%, and 22.00%, respectively. However, increasing the row number and strip number significantly improved the shear performance of SRHPBLs. Compared to the single-row specimens, the shear capacity and initial shear stiffness of the three-row specimens increased by an average of 92.82% and 48.77%, respectively. The shear capacity and initial shear stiffness of the twin-strip specimens increased by an average of 103.84% and 87.80%, respectively, compared to the single-strip specimens. Finally, more accurate models were proposed to predict the shear–tension relationship and ultimate shear capacity of SRHPBLs embedded in UHPC under combined tension–shear loads.

1. Introduction

Owing to the remarkable mechanical properties and high durability of ultra-high-performance concrete (UHPC), steel–UHPC composite beams exhibit enormous potential in bridge engineering [1]. To ensure the monolithic action, the shear stresses along the steel–UHPC interface are transmitted by shear connectors [2]. As one competitive shear connector, perfobond strip connectors (PBLs) have superior ultimate shear capacity, shear stiffness, and durability compared to traditional welded studs [3,4]. As indicated in Figure 1, the PBLs are composed of steel perforated strips welded to the steel beam and transverse reinforcements crossing the preformed holes. Consequently, the shear strength of PBLs is primarily supplied by transverse reinforcements, concrete end-bearing action, concrete dowels (concrete in pre-drilled holes), as well as interfacial bond and friction between steel strips and surrounding concrete [5]. Owing to the demand for long-span and highly durable structures in bridge engineering, a substantial body of research has tended to focus on new materials and new technologies [6,7,8,9,10]. Owing to the high toughness and micro-crack control capability of UHPC, the bearing capacity and ductility of PBLs are higher when UHPC is utilized instead of normal concrete (NC) [11]. To further reduce the structural dead weight of steel–UHPC composite beams, small-rib-height perfobond strip connectors (SRHPBLs) should be employed in thin UHPC slabs [12,13]. In addition, steel–UHPC composite beams are under complex stress conditions, leading to combined tension–shear loads during the service stage. However, the static behavior of SRHPBLs encased in UHPC under combined tension–shear loads remains unclear.
Until now, several investigations on the static behavior of PBLs were performed [14]. Extensive studies demonstrated that the typical failure modes of PBLs included concrete slab failure, transverse reinforcement fracture, concrete dowel fracture, and steel strip fracture [15,16,17,18]. Furthermore, Zhao et al. [19] conducted push-out tests, which demonstrated that the shear strength of PBLs was significantly improved when concrete strength and hole diameter were increased. Moreover, Zheng et al. [20] demonstrated that when the hole shape varied, only insignificant effects on shear capacity were observed. In addition, Xiao et al. [21] demonstrated that the shear capacity and ductility of PBLs also grew when adopting thicker steel strips through push-out tests. However, Rodrigues and Laím [22] conducted push-out tests under high temperatures, indicated that the ultimate shear strength of PBLs was significantly reduced when exposed to high temperatures. In addition, Vianna et al. [23] demonstrated that PBLs could be arranged in multiple rows to enhance the shear capacity. Nevertheless, the single-hole shear capacity of PBLs with a multi-row arrangement was reduced due to the grouped effect [24,25]. However, these investigations primarily focused on the PBLs embedded in NC.
In recent years, the static behavior of PBLs embedded in UHPC was extensively investigated [26,27,28]. Furthermore, steel–UHPC composite bridges using PBLs were constructed, including the Shishou Yangtze River Bridge [29], Danjiangkou Reservoir Bridge [30], and Fulong Xijiang Bridge [31]. As the demand for improved performance and lower costs grows, a growing body of research is focusing on enhancing or developing the mechanical properties of structures through the use of innovative materials, structures, and techniques [32,33,34,35,36,37,38,39]. Compared to NC, the shear capacity of PBLs in UHPC was noticeably improved by the outstanding mechanical properties of UHPC [29]. Furthermore, the crack propagation and expansion around steel strips were effectively limited, owing to the dispersed steel fibers in UHPC [40,41,42]. Liu et al. [43] found that PBLs embedded in UHPC exhibited superior fatigue performance. Moreover, Liu et al. [44] found that PBLs exhibited a strength enhancement as the thickness of steel strips increased, based on push-out results. Gao et al. [45] used low-elastic-modulus material to wrap the transverse reinforcements of the PBLs, which further improved the cracking resistance. Similarly, the grouped effect was noticed when adopting PBLs with a multi-row arrangement embedded in UHPC [46,47]. However, steel–UHPC composite beams were usually under combined tension and shear loads, but not pure shear loading during the service stage. Unfortunately, there were limited investigations focused on the PBLs under combined tension–shear loads.
Existing studies demonstrated that increasing the tension–shear ratio negatively affected conventional studs [48,49,50]. Furthermore, increasing the tension–shear ratio also decreased the shear capacity and shear stiffness of T-type PBLs [51,52]. In addition, Huang et al. conducted push-out tests, which demonstrated that excessively large tension–shear ratios caused severe damage to the concrete slab [52]. Similarly, Luan et al. [53], using push-out tests, found that tension force enlarged the damage zone of UHPC dowels, which reduced the shear resistance and initial shear stiffness of PBLs. However, there were no investigations concentrated on the shear behavior of SRHPBLs steel–UHPC composite beams under combined tension–shear loads.
Against this background, systematic experimental and theoretical analyses were performed to investigate the static behavior of SRHPBLs in steel–UHPC composite beams under combined tension and shear loads. The effects of the tension–shear ratio, row number, and strip number on failure modes, load–slip relationships, load–uplift relationships, ultimate shear capacity, initial shear stiffness, slip at peak load, and uplift at peak load were explored. Furthermore, more accurate design models were established to predict the relationships of shear–tension interaction and the ultimate shear capacity of SRHPBLs in steel–UHPC composite beams under combined tension–shear loads.

2. Experimental Program

2.1. Specimens Design

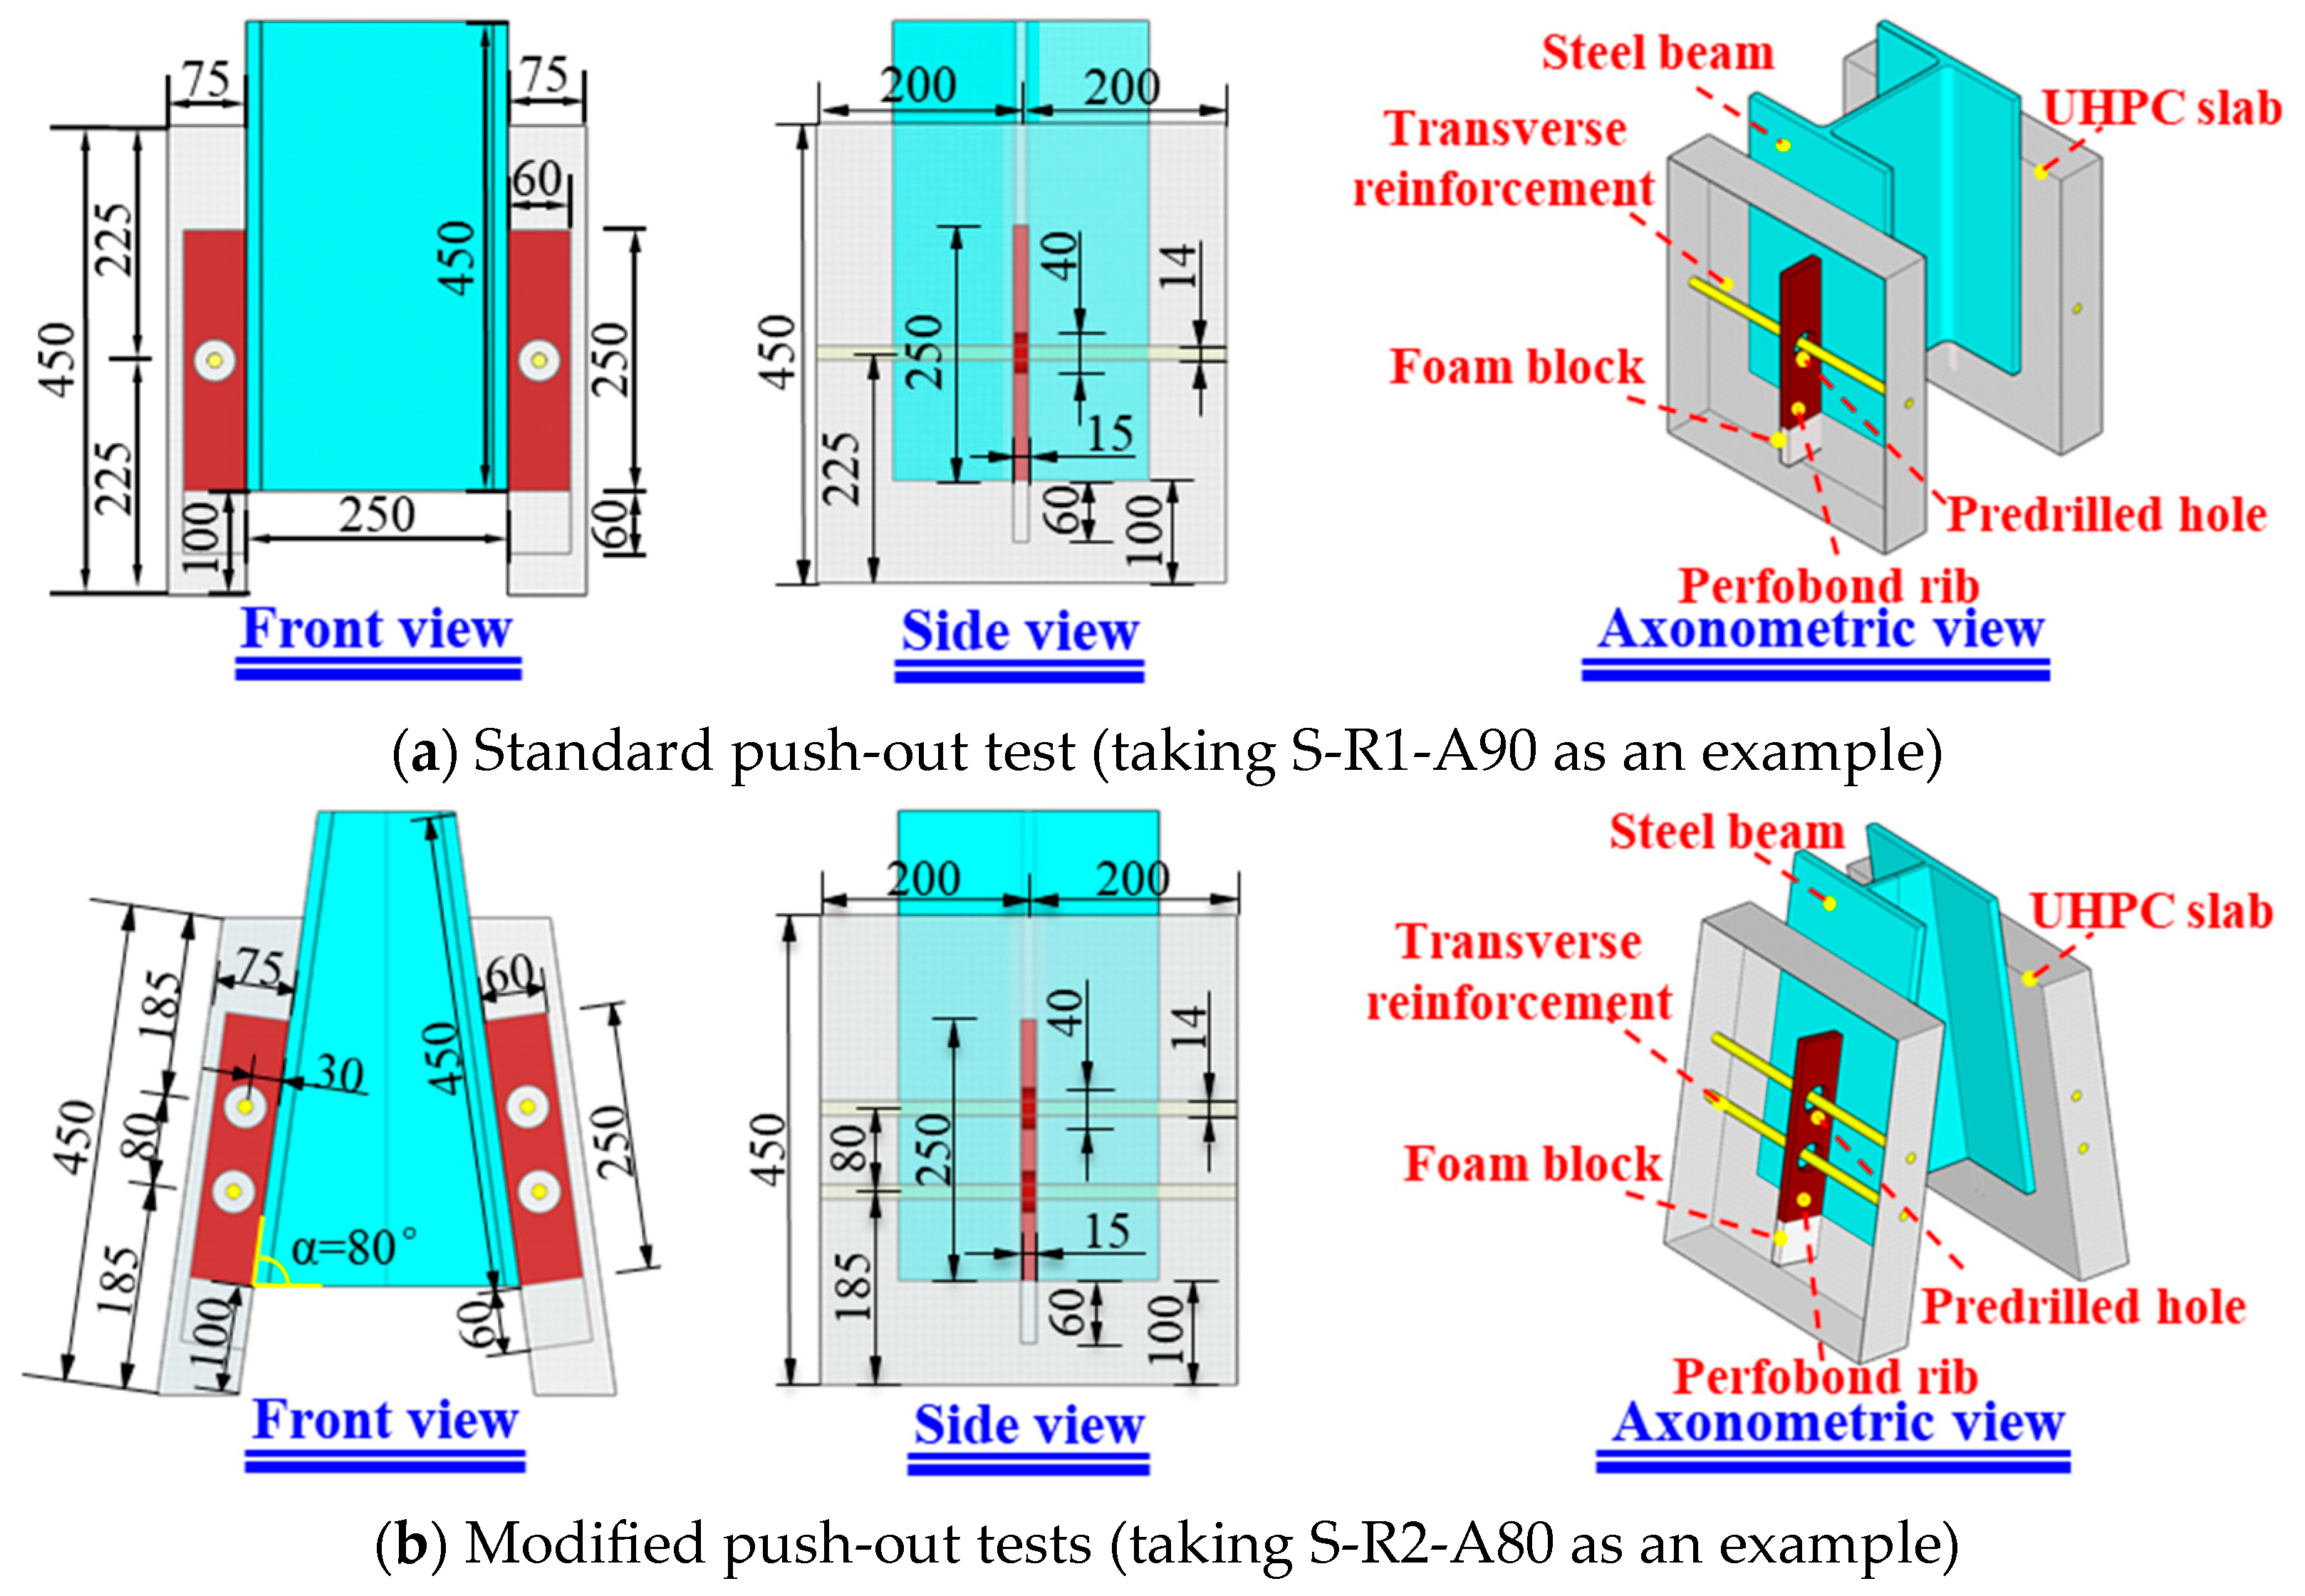
To clarify the combined tension–shear behavior of SRHPBLs in UHPC slabs, classical push-out tests were performed. A standard push-out test (SP test) comprised a steel beam and two concrete slabs [54], as indicated in Figure 2a. The HW 250 × 250 × 14 × 9 H-beam was employed as the steel beam, which had a height of 450 mm. The UHPC slabs had a dimension of 450 mm high, 400 mm wide, and 75 mm thick. The steel beam and UHPC slabs were connected by SRHPBLs, which utilized steel strips with a size of 250 mm (length) × 60 mm (height) × 15 mm (thickness). To ensure a sufficient welding area, the diameter of pre-drilled holes was selected as 40 mm. To avoid the premature failure of steel strips, 14 mm diameter transverse reinforcements (400 mm in length) were installed in the center of the holes [29]. To prevent end-bearing effects, 60 mm length foam blocks with the same height and width as the steel strip were installed below the steel strip [15]. To prevent serious concrete damage, 15 mm thick protective layers were reserved above the shear connectors. In addition, a distance of 100 mm was set between the base of the UHPC slabs and steel beam to allow interfacial slip during testing.
To further explore the combined tension–shear behavior of SRHPBLs, modified push-out tests (MP tests) as suggested by Shen et al. [49] were conducted, as illustrated in Figure 2b. Trapezoidal-section steel beams with various inclined angles α were utilized to achieve different tension–shear ratios. The trapezoidal-section steel beams were fabricated from identical H-shaped steel beams as the SP tests through additional cutting and welding processes. More detailed dimensions for the MP tests are presented in Figure 2.
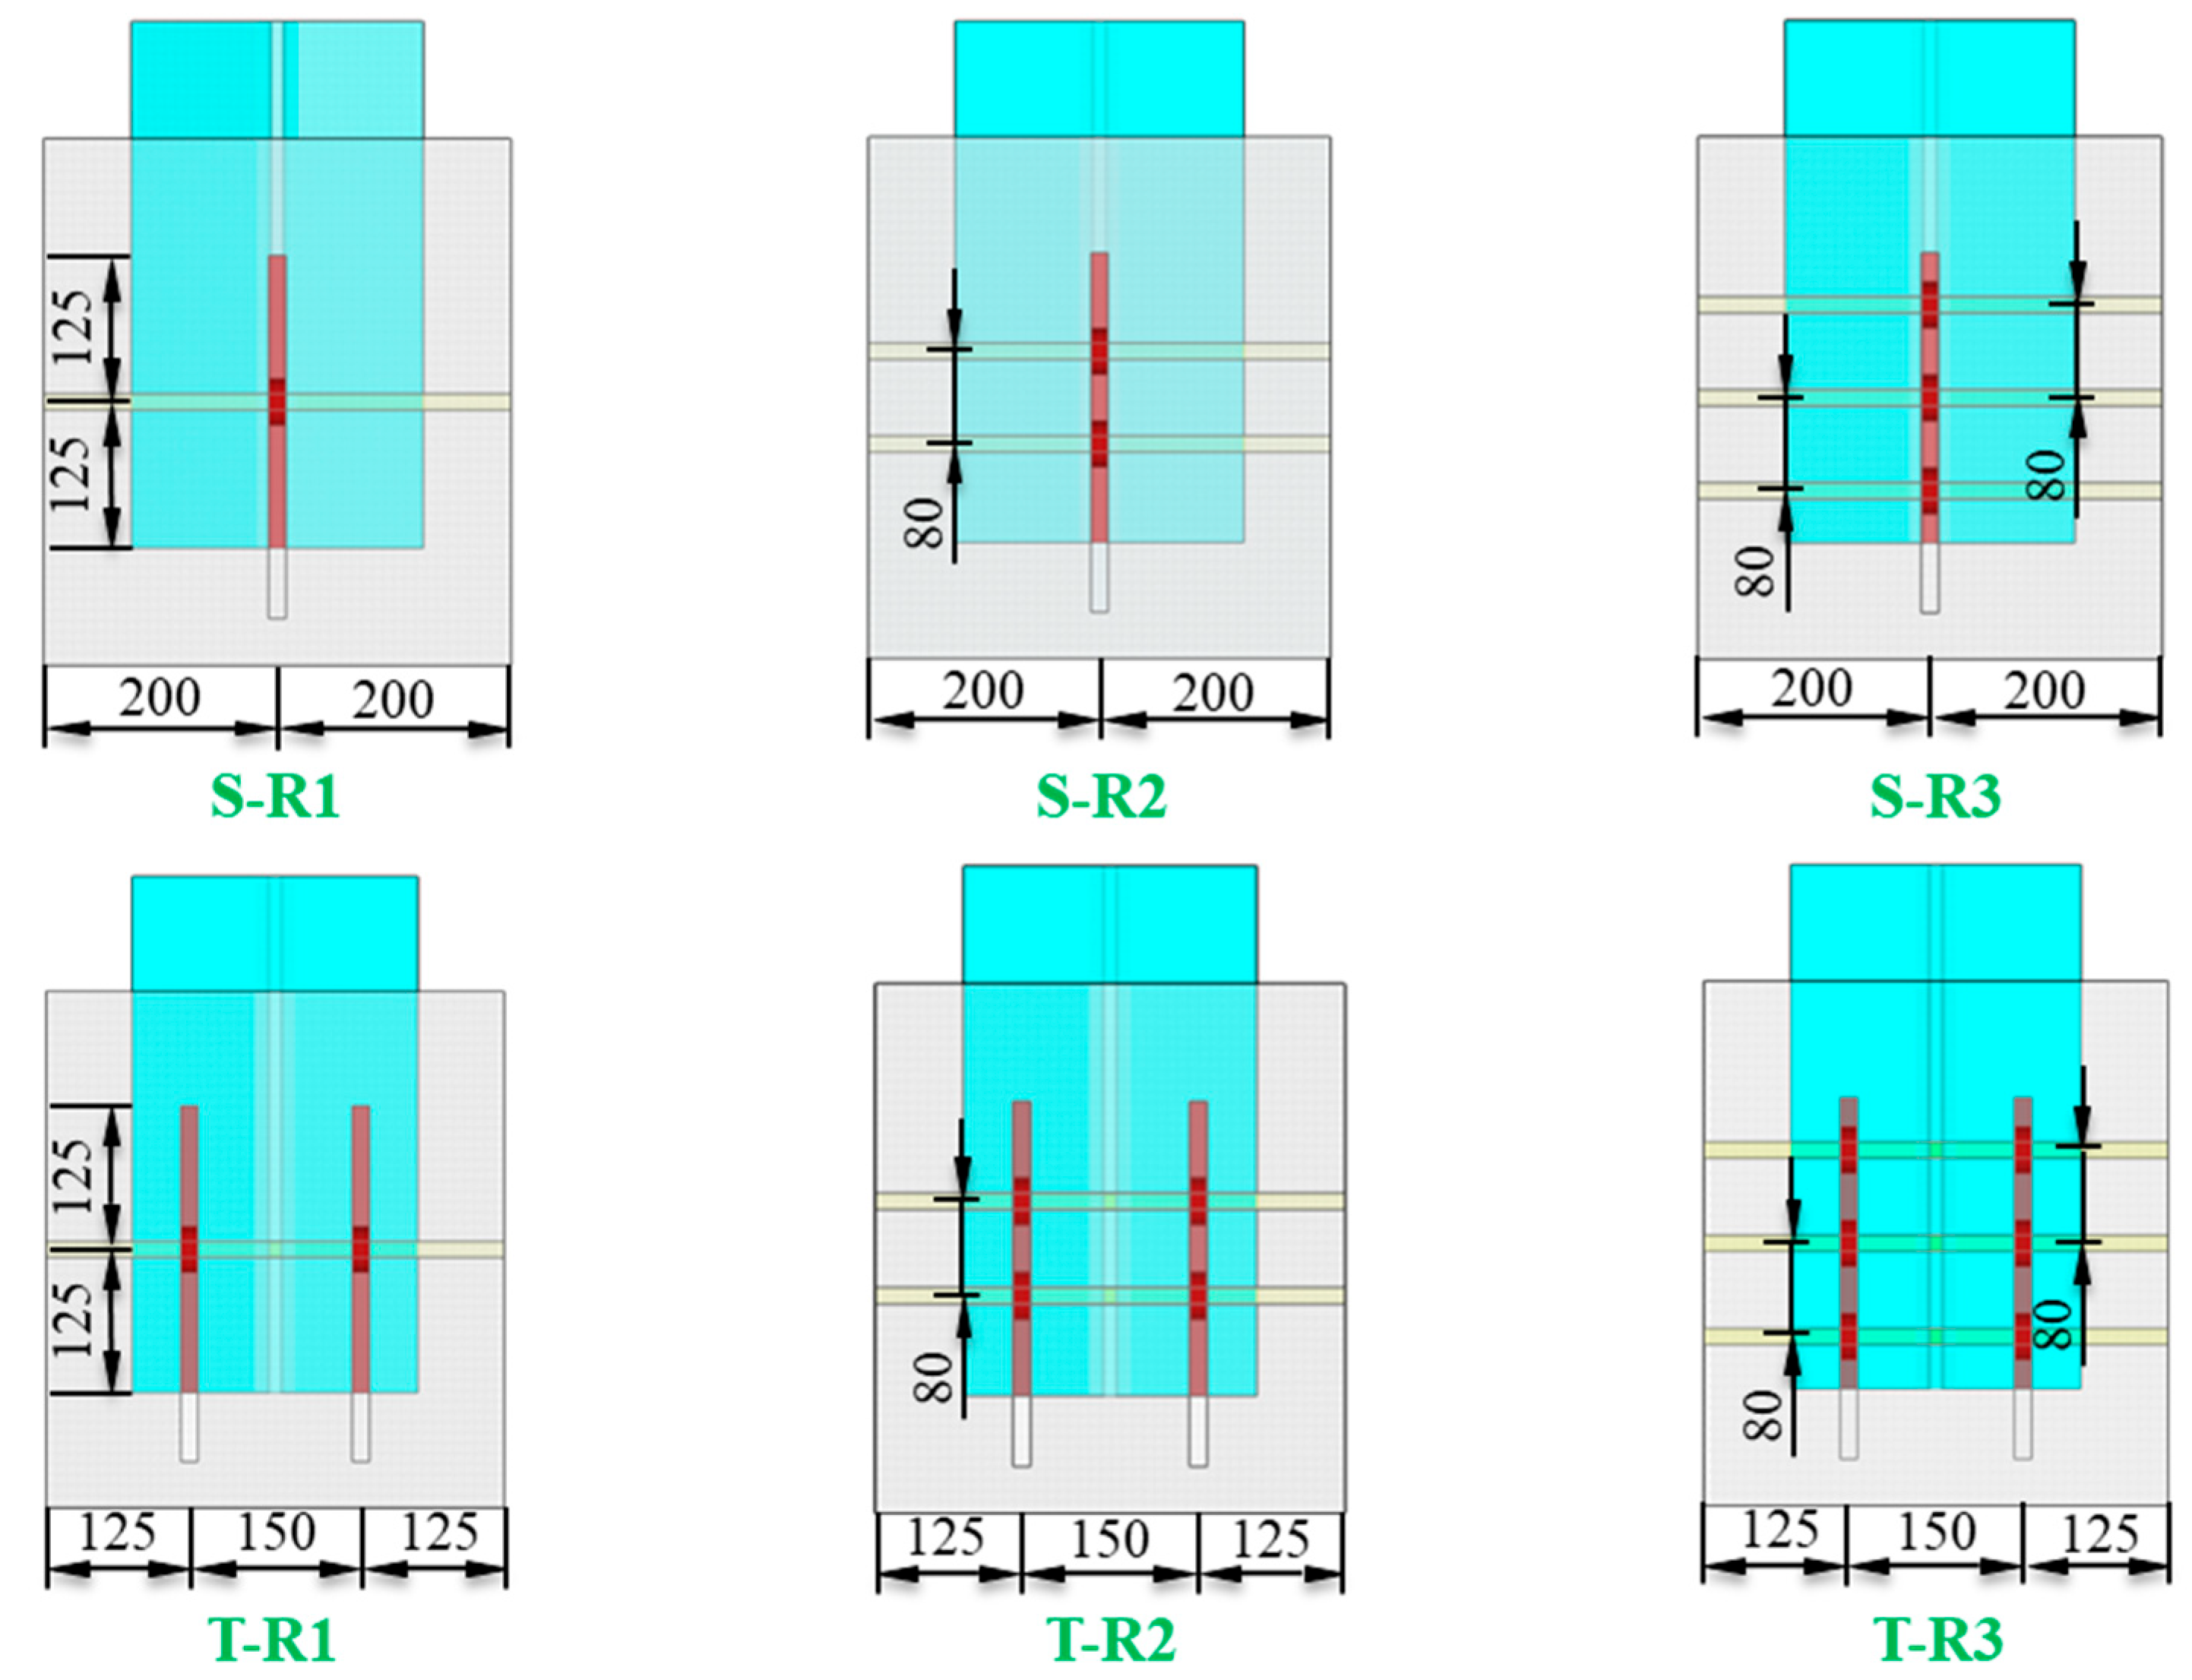
As summarized in Table 1, a total of ten push-out tests were conducted, considering the test variables of the tension–shear ratio, row number, and strip number. Considering the minimal variations observed in push-out tests with the same experimental parameters [29,55], only one specimen was fabricated for each variable combination, which was consistent with recent studies [44,56]. The specimens were named by “strip number-row number-inclined angle”. The first part indicated specimens with a single-strip (S) or twin-strip (T). To prevent stress concentration caused by excessively small spacing (less than 100 mm) and insufficient end anchorage of transverse reinforcement due to excessively large spacing (larger than 200 mm), the steel strip spacing was determined as 150 mm in this study [12]. The section portion represented the row number (1, 2, or 3). To prevent premature fracturing of the steel strips, the row spacing was determined to be 80 mm [12]. As for the last one, five inclined angles (90°, 80°, 75°, 70°, 65°) were labeled, corresponding to the tension–shear ratio of 0, 0.17, 0.26, 0.34, and 0.42, respectively. The five tension–shear ratios selected above can cover most of the conditions in practical engineering. For example, S-R1-A80 represented a single-strip push-out test with one row and an inclined angle of 80°. The SRHPBL configurations for all tests are shown in Figure 3.

2.2. Specimen Fabrication

As indicated in Figure 4, the manufacture of push-out tests consisted of three processes. After welding SRHPBLs to the cut steel beams, transverse reinforcements were then fixed in the center of the pre-drilled holes. The foam blocks were installed below the steel strips to eliminate end-bearing effects, as depicted in Figure 4a. Before pouring the UHPC, the steel beams were oiled to prevent bonding action with the UHPC slabs (Figure 4b). After UHPC hardening (24 h after casting), all push-out tests underwent steam-curing for 72 h and then naturally cured for 30 days until testing (Figure 4c). Specifically, to obtain the material properties of UHPC, six cylindrical specimens ( Φ   100   ×   200   m m 2 ) were cast and cured in the same condition.

2.3. Material Properties

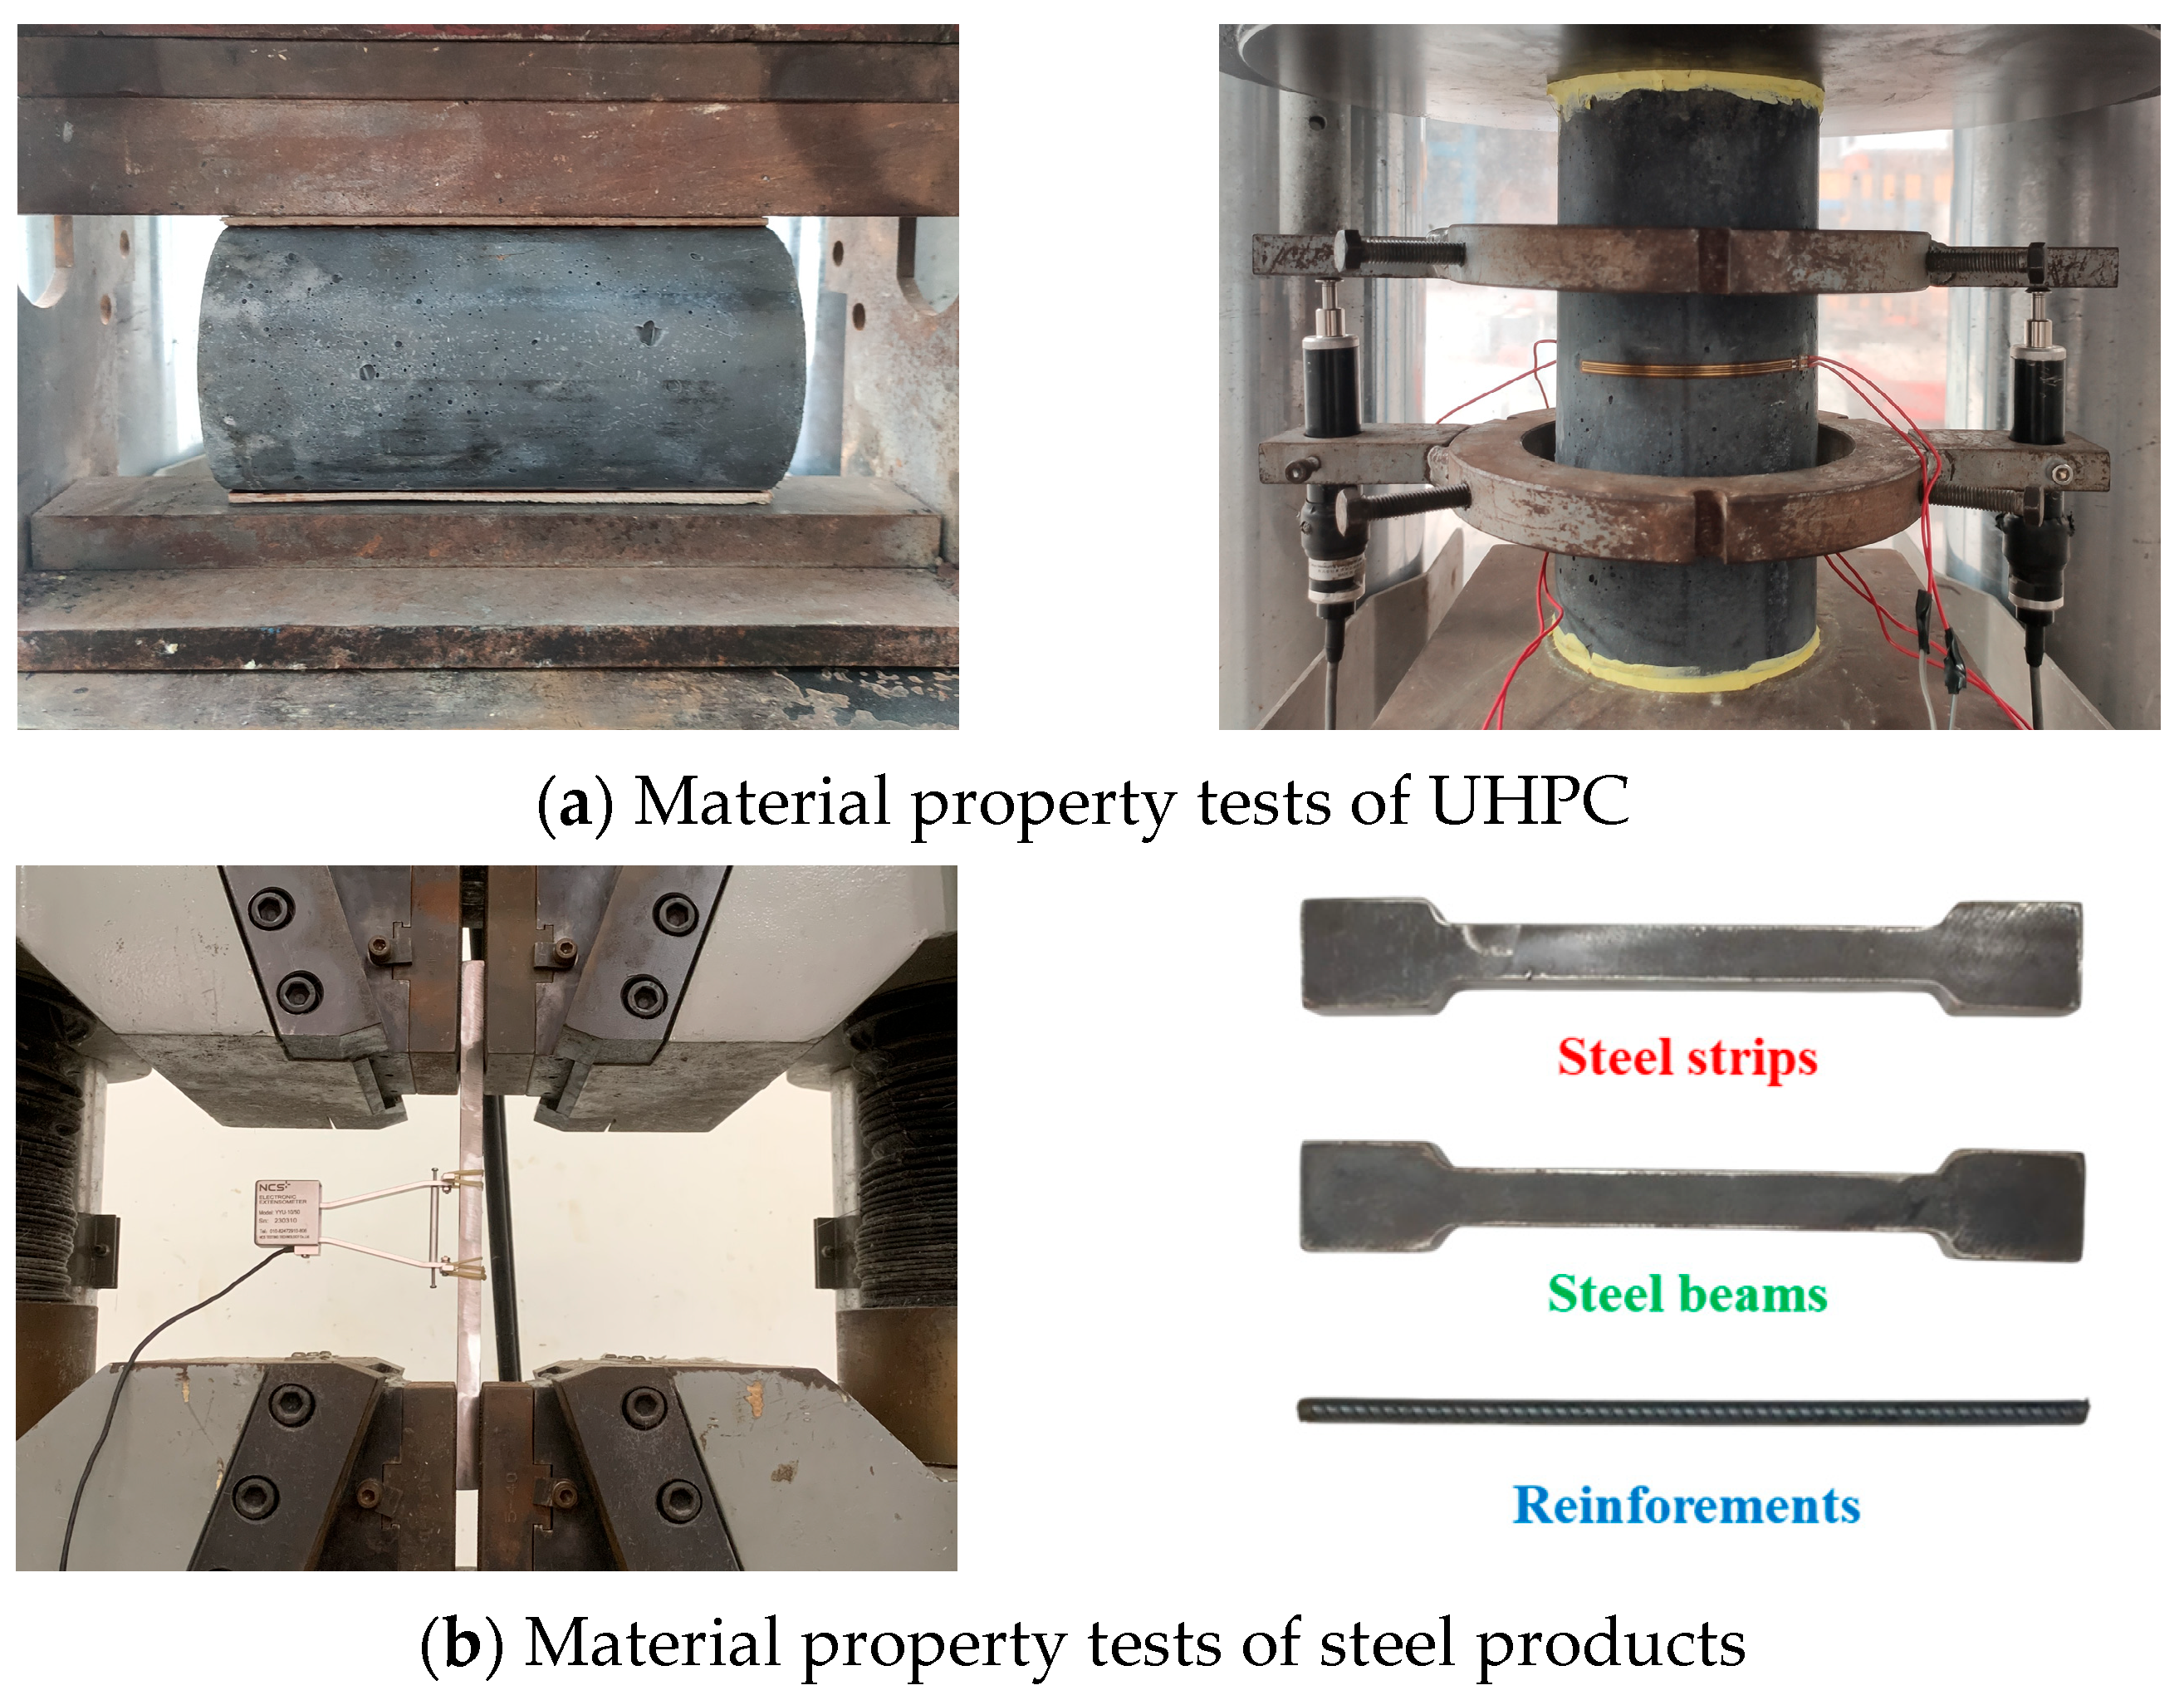
Commercial UHPC was adopted to minimize the concrete material property variations in this study, which consisted of silicate cement, silica fume, nano CaCO3, super-plasticizers, water, silica sand, and hook-end steel fibers. The UHPC mixture contained 2% hook-end steel fibers by volume, in which the length–diameter ratio of hook-end steel fibers was 60 (13/0.22). Notably, all specimens were made of UHPC with steel fibers in this study. The material property tests of UHPC were conducted when the push-out tests were performed (38 days after the concrete pouring), as shown in Figure 5a. The mechanical properties of hardened UHPC are summarized in Table 2, in which f c denotes compressive strength [57], f t indicates splitting tensile strength [58], E c is the elastic modulus [59], and ν represents Poisson’s ratio [59]. The results were obtained from the average of three samples.
This study employed three types of steel products. The transverse reinforcements utilized HRB 400 bars. However, the Q235 steel was employed to fabricate the steel beam and SRHPBLs. The material property tests for steel products in this study are shown in Figure 5b. The material properties of all the steel products, which were obtained from the average value of three samples, are summarized in Table 3, including the yielding strength f y , elastic modulus E s , and ultimate tensile strength f u [60].

2.4. Test Setup and Instruments

The test setup and instrumentation are illustrated in Figure 6. All the push-out tests were conducted using a 500-ton computer-controlled servo-hydraulic loading machine. To eliminate eccentric action, an inner spherical seated plate was set in the machine. Moreover, the load was evenly distributed to the specimens by a steel plate placed on the top of the steel beam. To prevent UHPC slabs from slipping and avoid the local stress concentration, gypsum was placed under the UHPC slabs. Furthermore, to acquire the steel–concrete interfacial slip, four vertical linear variable displacement transducers (LVDTs) were employed, while the corresponding uplift was monitored by four horizontal LVDTs. Notably, the measurement range of vertical LVDTs was 50 mm, while for the horizontal LVDTs, it was 10 mm. The installation height of all LVDTs matched that of the center of the SRHPBLs.
To verify instrument functionality and to eliminate potential gaps, a preloading phase was employed before formal loading. During this phase, a small preload (100 kN) was applied to the specimens. After zeroing the load, the formal loading was performed at a speed of 0.3 mm/min in a displacement-controlled manner. All tests were terminated when the load fell to half of the ultimate shear resistance. Notably, no significant slip was observed between the bottom of the UHPC slabs and the platform until the termination of the test. In addition, steel beam and UHPC slabs remained almost parallel during the test, indicating that the variation in the tension–shear ratio during the test could be neglected.

3. Results and Discussions

3.1. Load–Slip and Load–Uplift Relationships

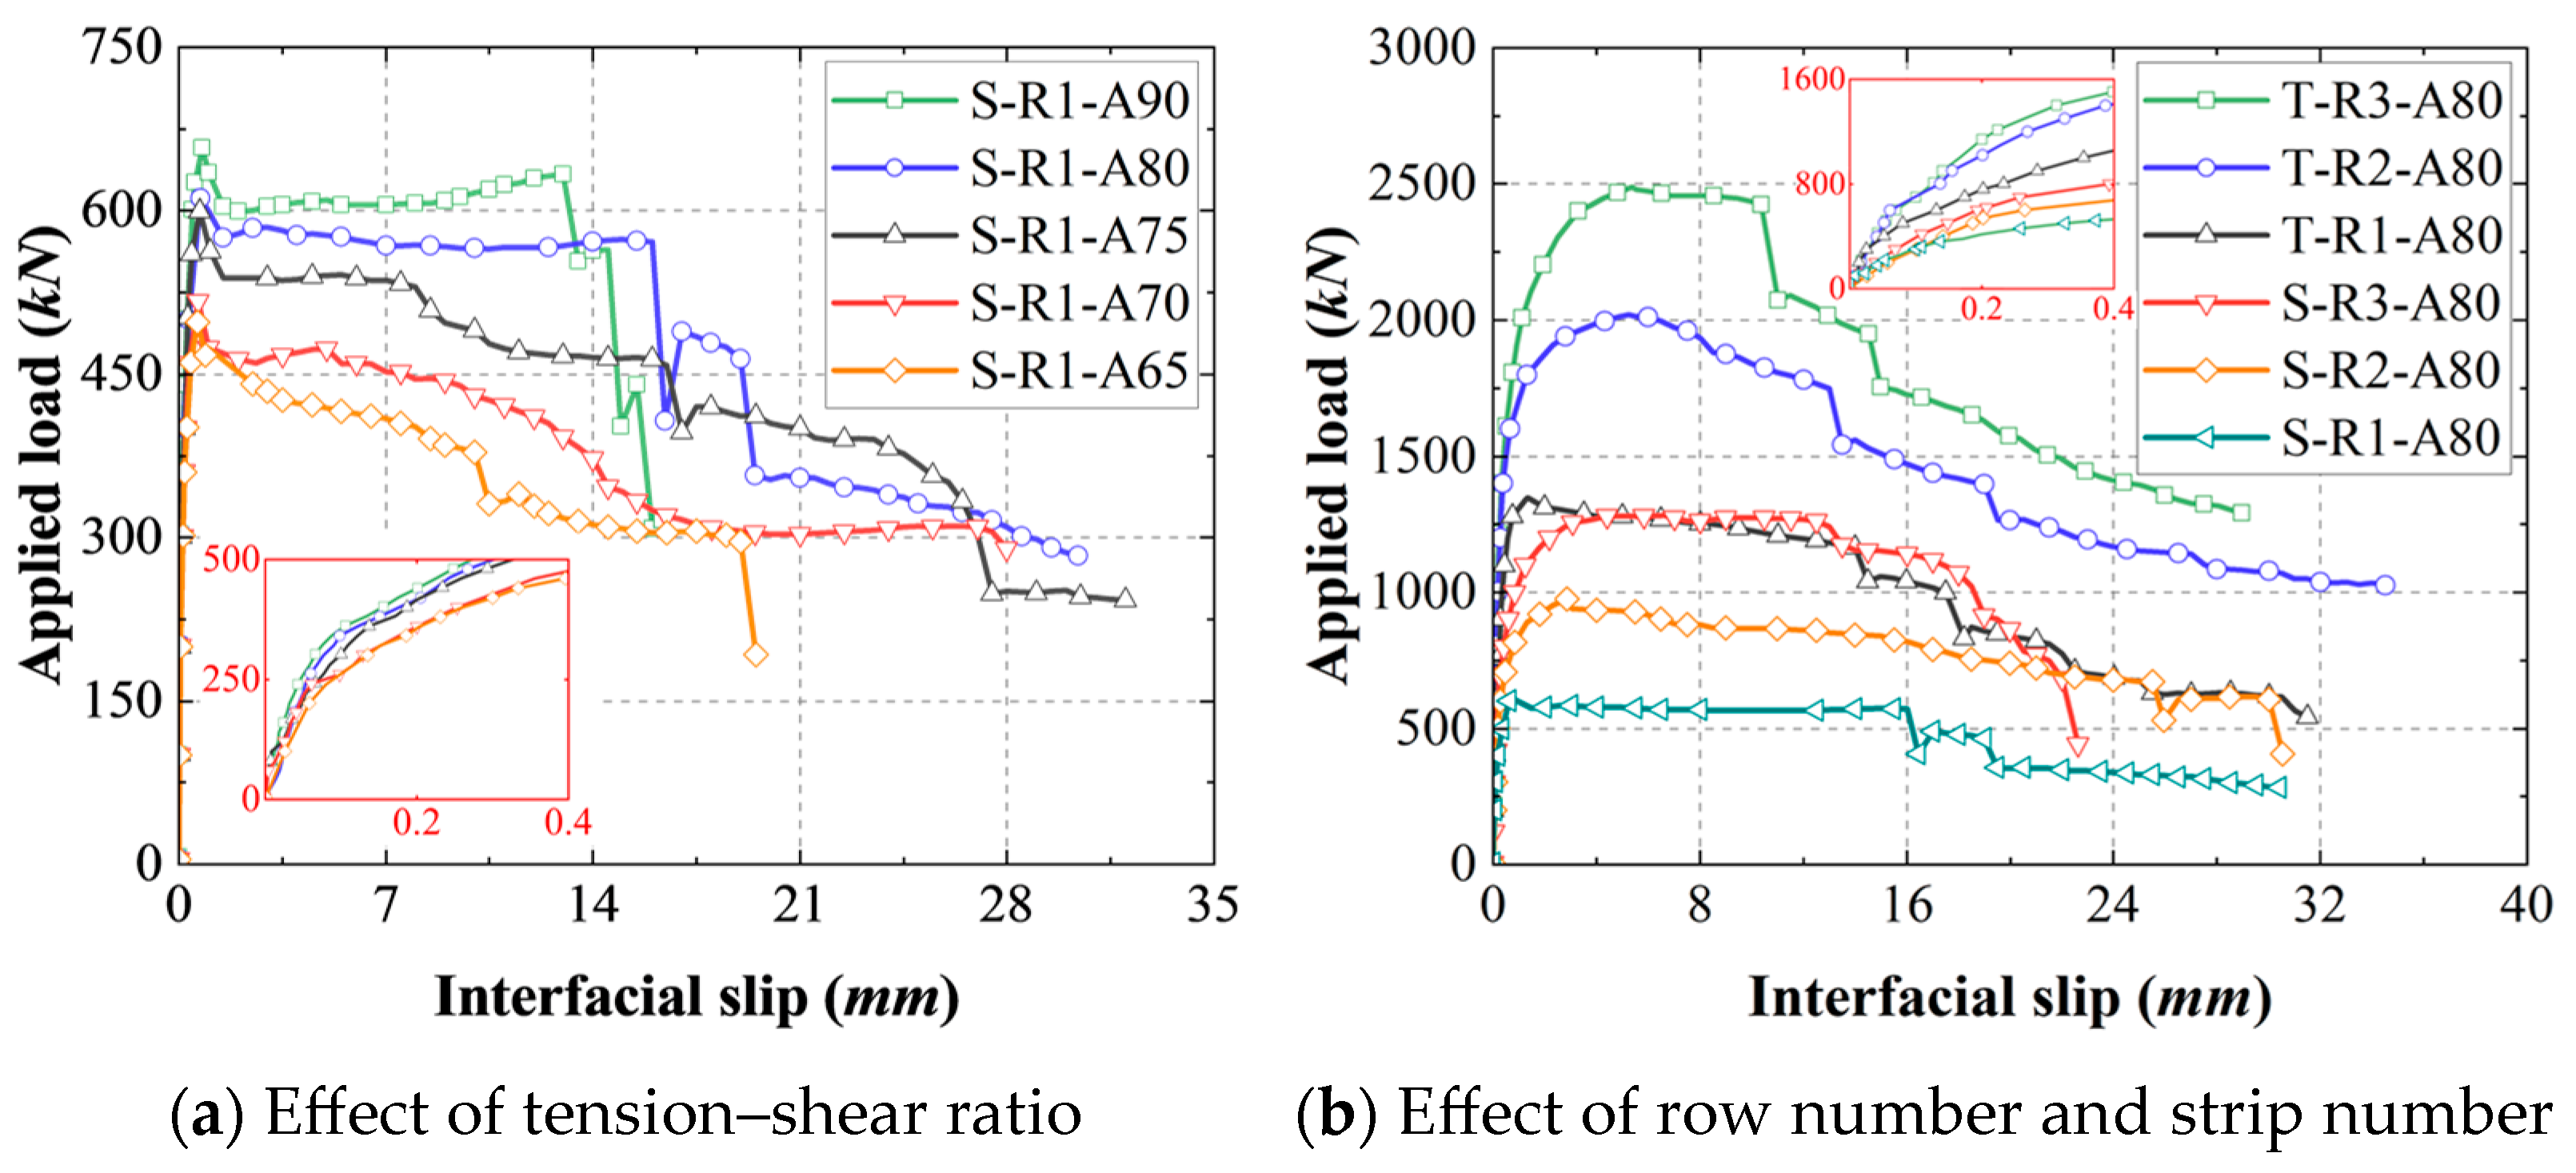
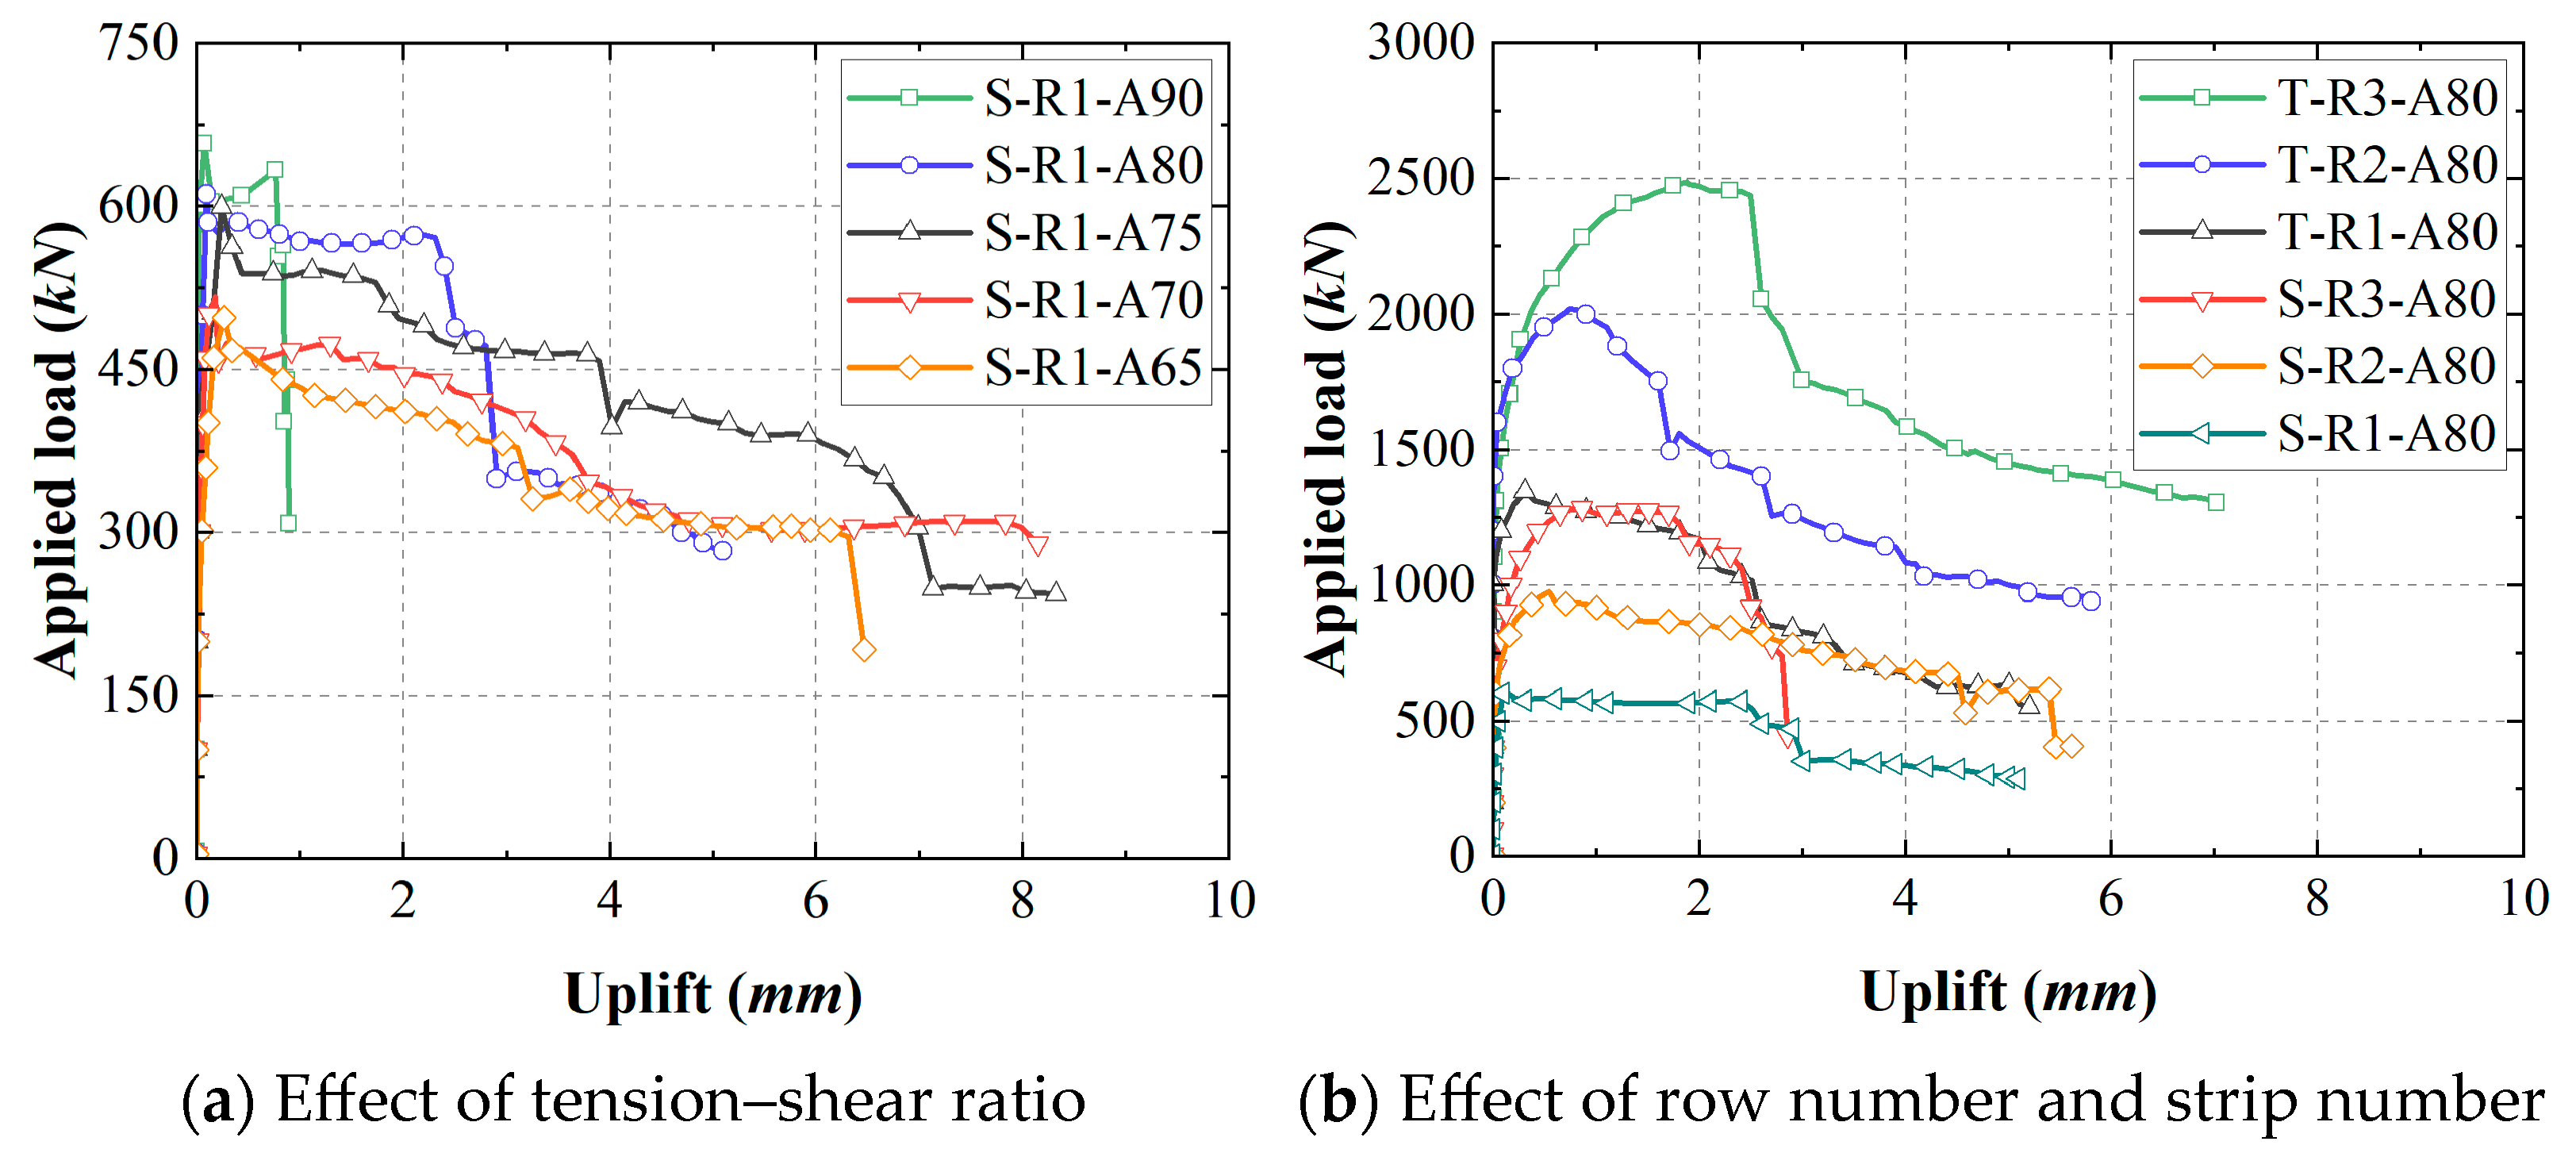
The relationships between load and slip for all specimens are indicated in Figure 7. Similar five-stage behavior was observed among these curves, including the elastic stage, plastic stage, softening stage, ductile stage, and failure stage. The interfacial slip grew in a linear trend, with the application of load in the initial elastic stage. When SRHPBL–UHPC interfacial bonding was diminished, the curves exhibited a decrease in slope, demonstrating the beginning of the plastic stage [12]. In this stage, the applied load was primarily balanced by UHPC dowels and transverse reinforcements. Once reaching the ultimate shear capacity, the load declined drastically due to UHPC dowel fracture, indicating the beginning of the softening stage. In the subsequent ductile stage, the applied load was primarily resisted by the mechanical interlocking action of the fractured UHPC dowel surface, the bridging action of steel fibers, and the shear resistance of transverse reinforcements [15]. Although the shear capacity provided by UHPC dowels was decreased continuously, the shear contribution of the transverse reinforcements increased, which led to a steady load level in this stage [15]. In addition, a sharp slip increase and rapid crack widening were observed, owing to the high ductility of transverse reinforcements [12]. When the transverse reinforcements reached their ultimate tensile strength, the fracture of transverse reinforcements occurred. As a result, the loads decreased sharply, indicating the arrival of the failure stage. The multiple drops of shear capacity in this stage were primarily due to the non-simultaneous fracture of transverse reinforcements in multi-PBL specimens [61].
With careful observations, minor differences were noticed among the push-out tests with various parameters. A minor strength improvement was observed in the load–slip relationships of the SP test during the ductile stage due to stress hardening of the transverse reinforcements. Accordingly, only a slow decrease during the ductile stage was observed in MP tests, which could be related to the weakening stress hardening of transverse reinforcements at larger bending deformation [62]. Although MP tests exhibited reduced shear capacity at the ductile stage, most of them demonstrated a later fracture of transverse reinforcements compared to SP tests. This indicated that the fracture of transverse reinforcements might be delayed owing to the bending deformation resulting from tensile forces [53].
Figure 8 illustrates the load–uplift relationships. A similar five-stage behavior, similar to the load–slip curves, was also observed in the load–uplift relationships. However, uplift variations were insignificant before the UHPC dowel fracture. In addition, the uplift of the MP tests was significantly increased compared to the SP tests in the ductile stage, due to the tension–shear ratio increase. Notably, Eurocode 4 [54] stipulates that the uplift shall be below 50% of the corresponding slip under 80% ultimate shear capacity. In this study, the vertical slip in all push-out tests significantly exceeded the corresponding uplift.

3.2. Crack Patterns and Failure Modes

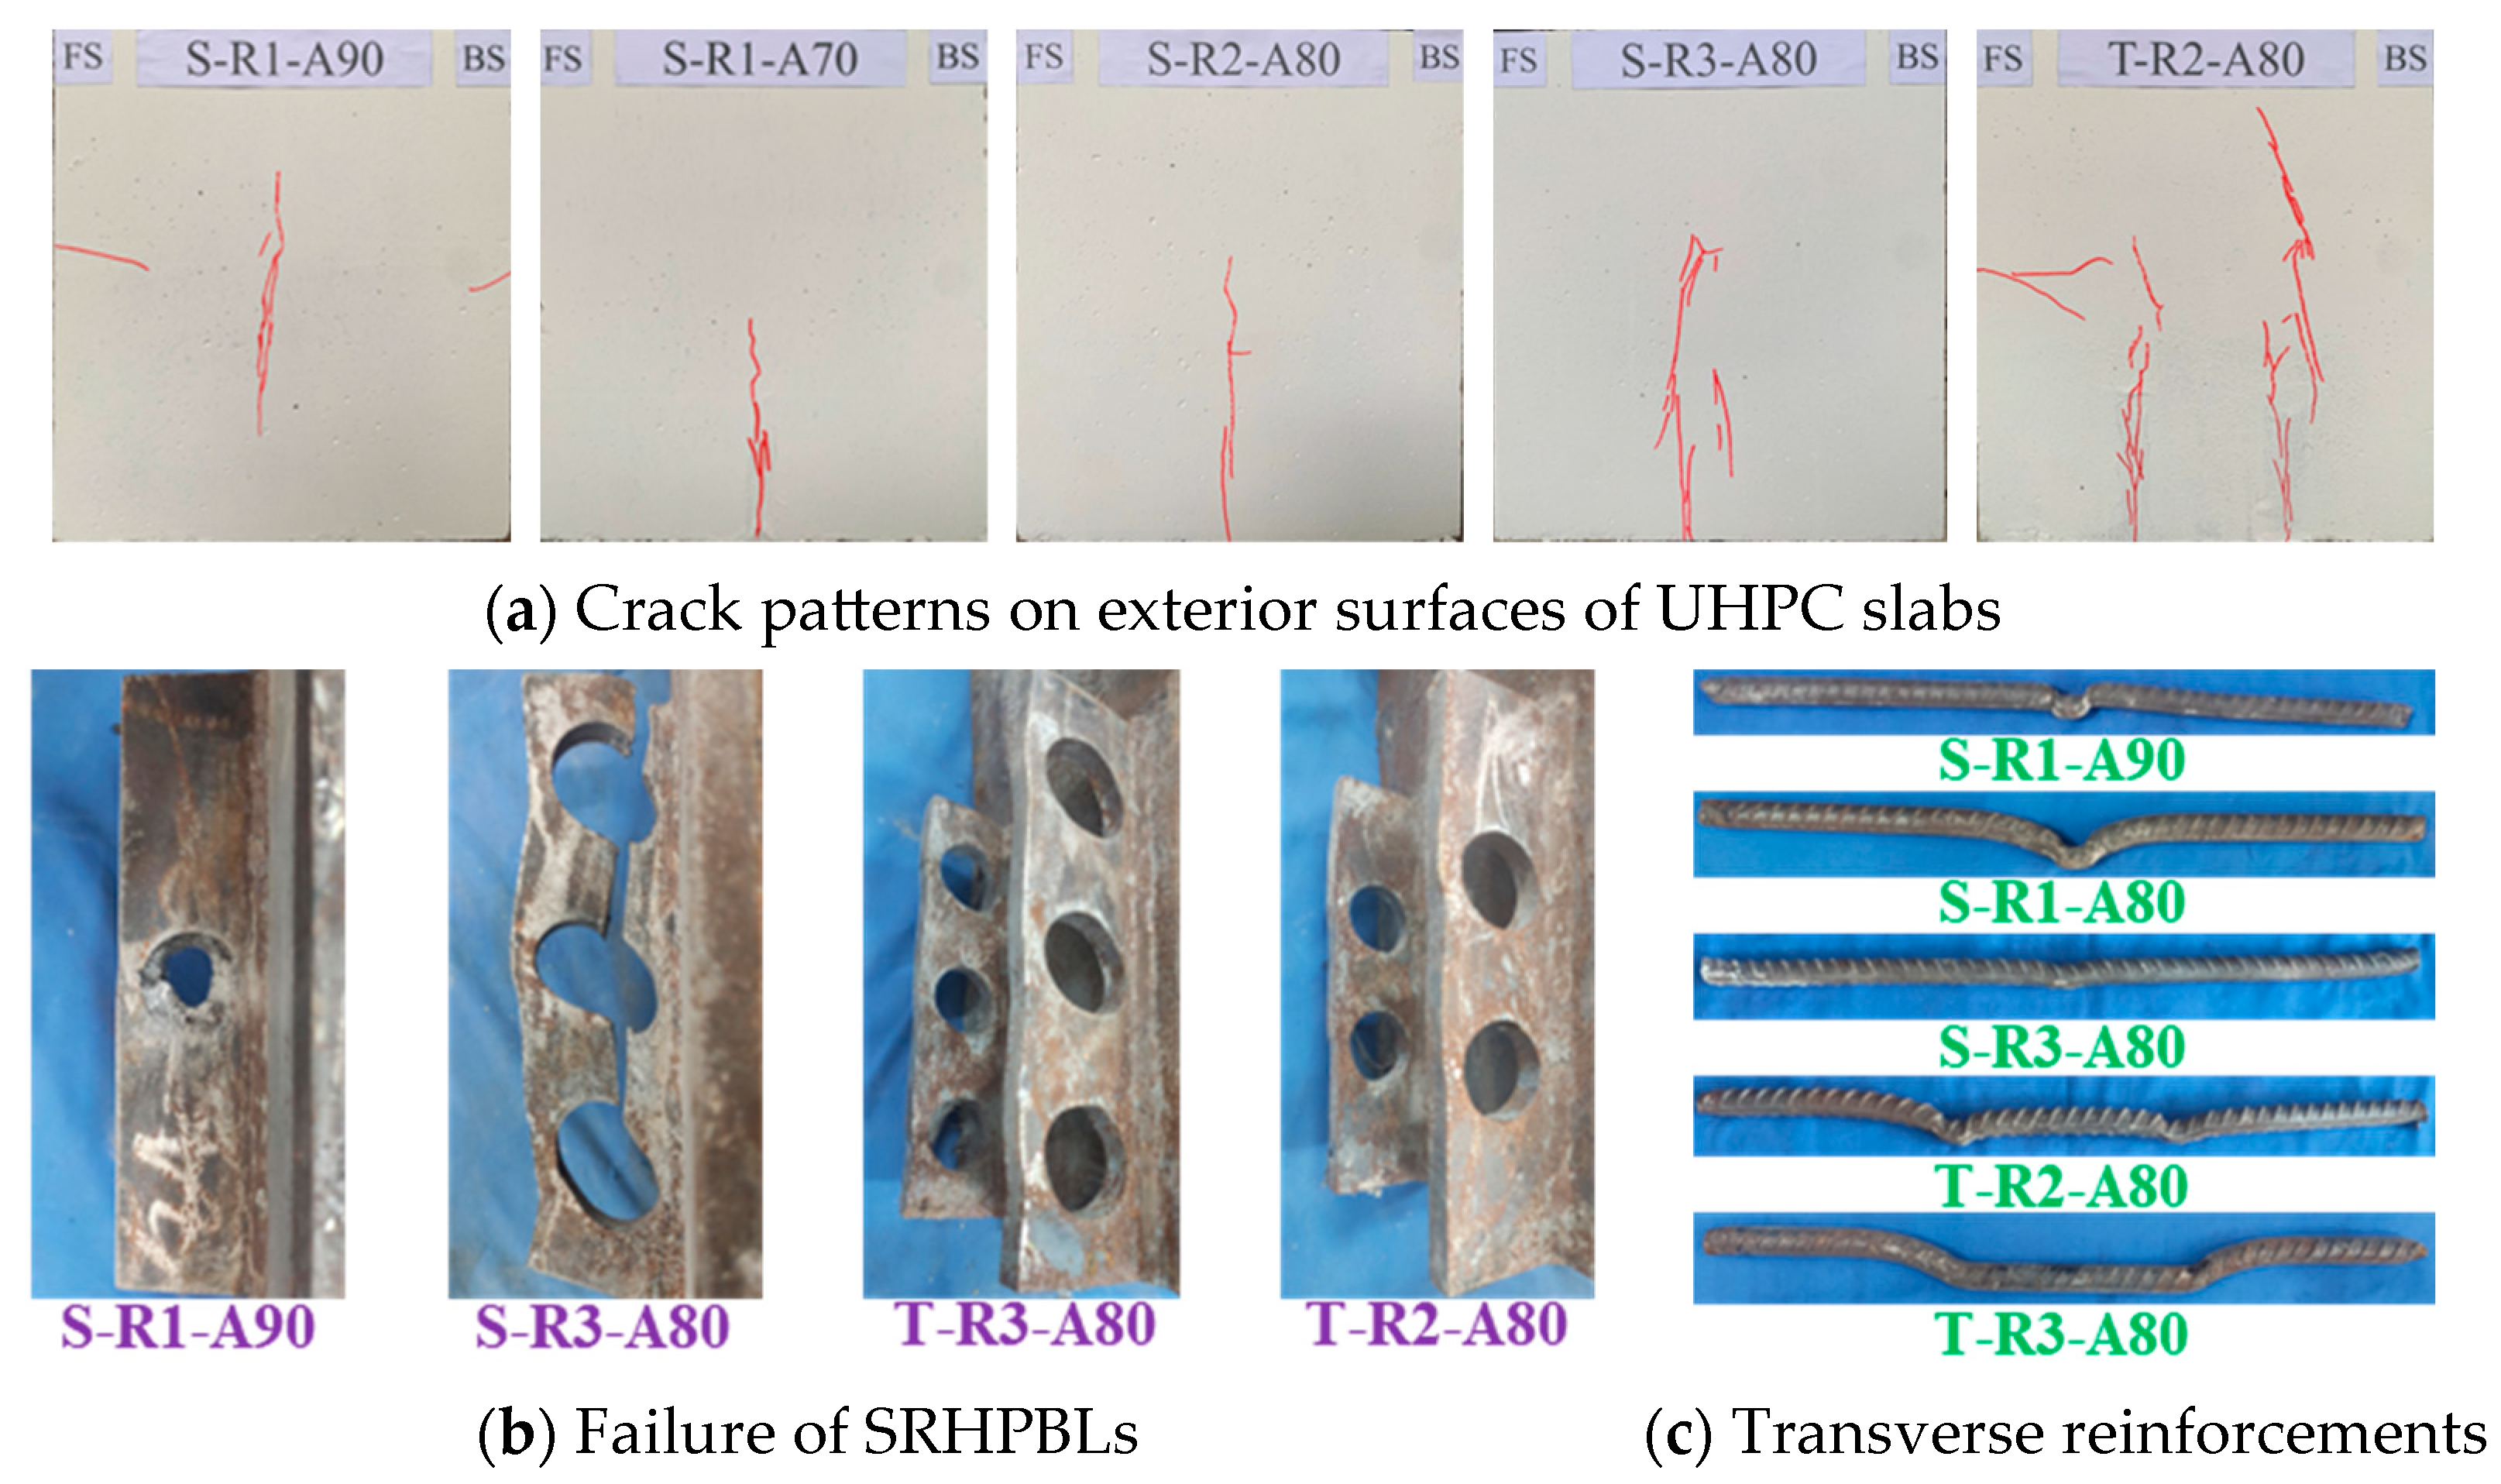
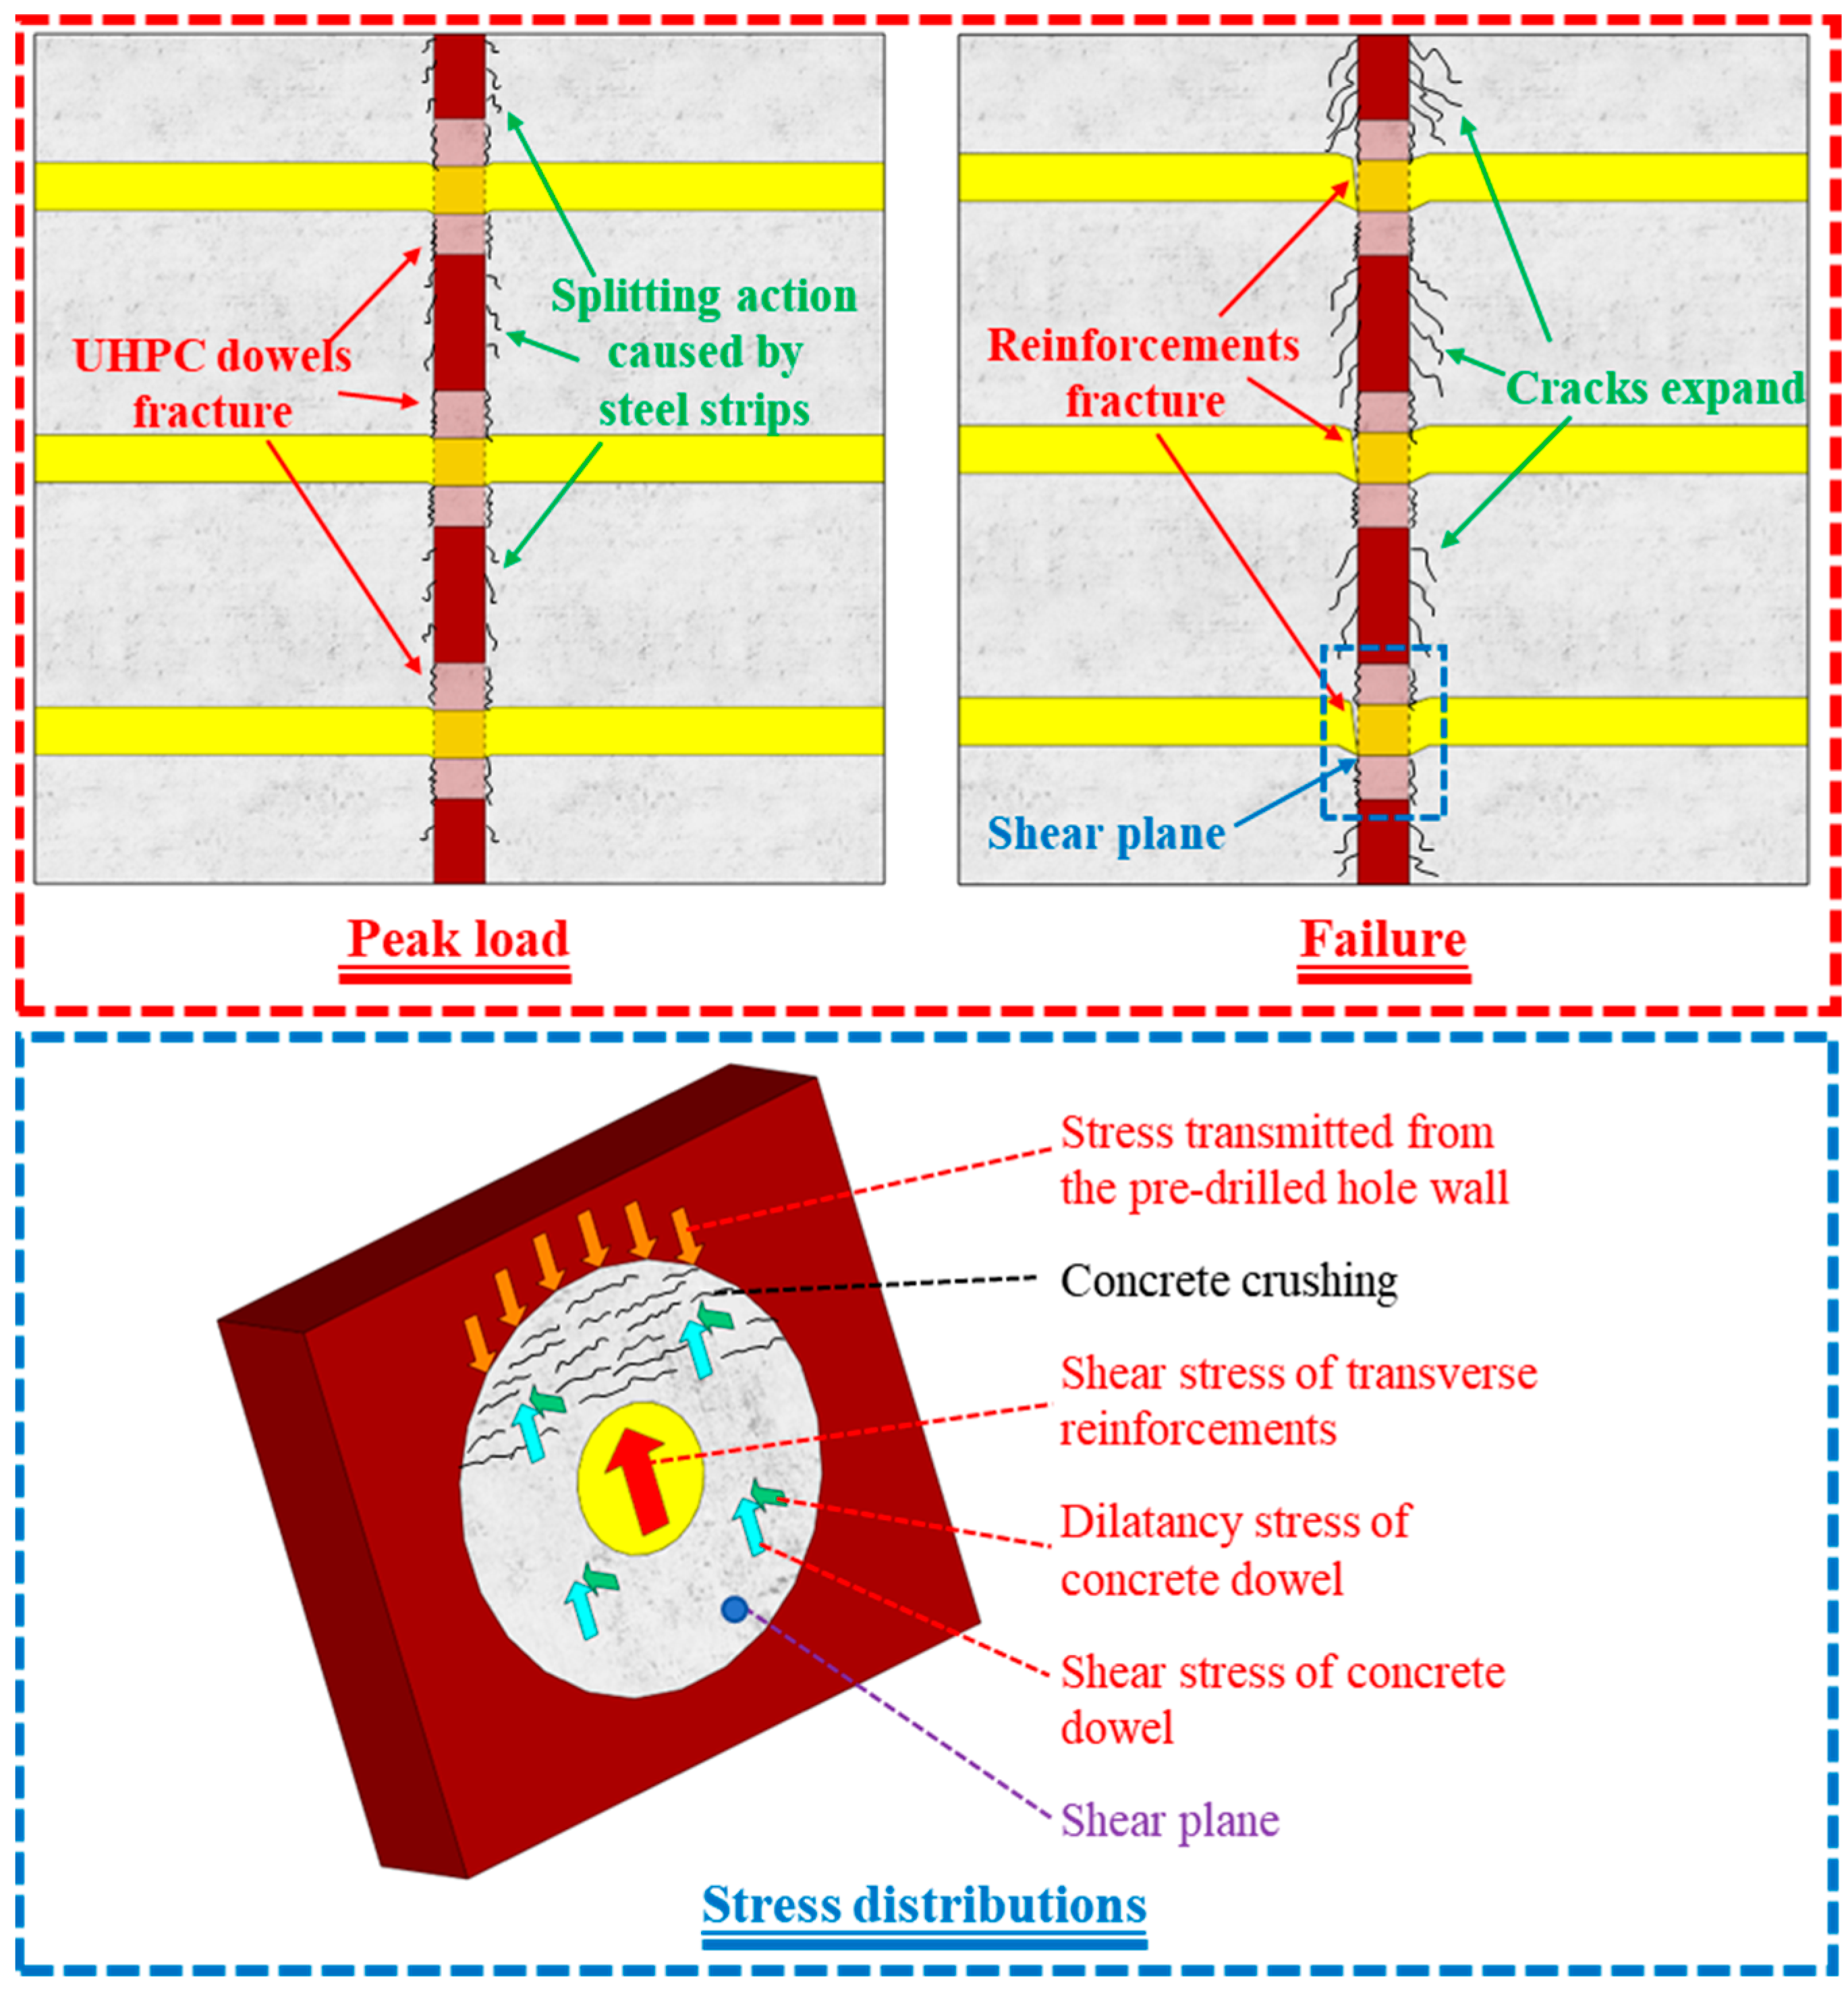
The cracking patterns and failure modes of the specimens are shown in Figure 9, which are typical of all observed modes in this study. All the push-out tests exhibited similar cracking patterns, as depicted in Figure 9a. Cracks initiated and propagated at the interface between SRHPBLs and UHPC, leading to the formation of vertical cracks on the outer surface of the UHPC slab, as shown in Figure 9a. This phenomenon was related to the splitting effect caused by steel strips [29,63], as shown in Figure 10. Therefore, only one vertical crack zone was observed on the outer surface of the UHPC slab in the single-strip specimens, while two vertical crack zones were observed in the twin-strip specimens. However, the cracks observed on UHPC surfaces were insignificant, which was attributed to the restriction of crack propagation by transverse reinforcements [12]. In addition, the load was distributed to the surrounding concrete by the steel fiber bridging effect of UHPC, which further improved the crack resistance of the concrete [64]. Except for vertical cracks, horizontal cracks were also observed in some test specimens (S-R1-A90, S-R1-A80, T-R1-A80, T-R2-A80, and T-R3-A80). Coincidentally, the horizontal cracks appeared near the transverse reinforcements, suggesting that the horizontal cracks might be related to the splitting action caused by the transverse reinforcements [12]. In addition, an increased tension–shear ratio caused a reduction in crack widths, whereas larger row numbers exhibited more serious vertical cracking.
To clarify the plastic deformation of SRHPBLs, UHPC slabs were removed after the tests, as indicated in Figure 9b,c. Most push-out tests exhibited typical PBL failure modes. Taking S-R1-A90 as an example, the specimen eventually failed due to the fracture of the transverse reinforcement, along with the local deformation of pre-drilled holes and the fracture of the UHPC dowels. Typically, UHPC dowels fractured at peak load, while the fracture of transverse reinforcements represented the failure of the specimen [17]. Except for interfacial bonding, the applied load was mainly resisted by UHPC dowels and transverse reinforcements, as shown in Figure 10. Furthermore, owing to the dilatancy action of UHPC, concrete dowels provided additional dilatancy stress [65]. Shear stress was transmitted from the pre-drilled hole wall to the UHPC dowels, causing pressure concentration above the shear plane. Therefore, apart from the fracture of UHPC dowels, concrete crushing below the pre-drilled hole wall was also observed. Except for the fracture of transverse reinforcements, bending deformation and necking of reinforcements were also observed. This phenomenon indicated the non-simultaneous fracture of transverse reinforcements [29,61]. Generally, more severe bending deformation of the transverse reinforcements was observed as the tension–shear ratio increased, which is consistent with a previous investigation [53]. However, increasing the row number or decreasing the strip number led to more evident local deformation in the pre-drilled holes. For the single-strip specimen with the highest row number (S-R3-A80), steel strip fracture was observed rather than transverse reinforcement fracture. Meanwhile, only slight bending deformation was observed in the transverse reinforcements. This phenomenon was related to the reduction in the distance between the pre-drilled holes and the upper edge of the steel strips, as well as the increase in the number of transverse reinforcements. For T-R2-A80 and T-R3-A80, both of them failed due to significant deformation of the transverse reinforcements and steel strips. To be clear, Table 4 presents a summary of the failure modes for all specimens.

3.3. Static Behavior of SRHPBLs Under Combined Tension–Shear Loads

The characteristic indexes employed for assessing the combined tension–shear behavior of SRHPBLs are listed in Table 4. P u denotes the ultimate shear capacity. K is the initial shear stiffness, which is equaled to the secant slope at a 0.2 mm interfacial slip. S u denotes the slip at peak load, while L u represents the uplift at peak load.

3.3.1. Influence of Tension–Shear Ratio

As shown in Figure 11, five tension–shear ratios varied from 0 to 0.42 were chosen in this study to discuss the impact of the tension–shear ratio on the static behavior of SRHPBLs. As illustrated in Figure 11a, a rise in the tension–shear ratio led to a decrease in the P u of push-out tests. As the tension–shear ratio went up from 0 to 0.42, the P u of push-out tests decreased by 24.32%. This decreasing trend was also observed in a previous investigation [53], which was primarily related to the more serious UHPC dowels damage by tensile force. As indicated in Figure 11b, a reduction in K was observed when the tension–shear ratio rose, which is consistent with the results of previous studies [66]. This was primarily attributed to the increased tensile force as the tension–shear ratio increased, which further induced greater tensile damage around UHPC dowels [53]. As presented in Figure 11c, with the increasing tension–shear ratio, the S u reduced. This phenomenon could be attributed to the increased tensile force as the tension–shear ratio increased, which further accelerated UHPC dowel damage [53]. As illustrated in Figure 11d, specimens with a larger tension–shear ratio enlarged the uplift at peak load. The higher L u for MP tests could be attributed to the larger separation between the UHPC slab and steel beam, due to increased tensile force.

3.3.2. Influence of Row Number

To explore the static behavior of SRHPBLs under combined tension–shear loads as affected by row number, three different row numbers (1, 2, and 3) were set in this study, which could be classified into two groups (single strip and twin strips), as presented in Figure 12. As illustrated in Figure 12a, the P u of the push-out tests enhanced as the row number increased, which was also observed in previous studies [12,23]. Specifically, the P u was only 54.12% (T-R1-A80) and 47.52% (S-R1-A80) of the corresponding three-row push-out tests (T-R3-A80 and S-R3-A80), respectively. This result could be caused by the increase in the UHPC dowel number as the row number rose [12]. However, the significant grouped effect was observed as the row number increased, which is consistent with previous studies [46,47]. The single-row average shear capacity of SRHPBLs for both groups decreased significantly as the row number increased. For example, the average ultimate shear capacities for S-R3-A80 and S-R2-A80 were 70.15% and 70.0% of those for S-R1-A80, respectively. This decrease primarily related to the non-simultaneous fracture of UHPC dowels due to uneven stress distribution among different SRHPBLs [29]. As illustrated in Figure 12b, the K in both groups improved with the increased row number, which demonstrated that the growth of the UHPC dowel number had a substantial positive impact on the K of the SRHPBLs. As presented in Figure 12c,d, when the row number rose, both slip and uplift at peak load increased, which was possibly related to the fact that the growth in the row number increased the number of transverse reinforcements in the steel strips [12].

3.3.3. Influence of Strip Number

To further discuss the impact of strip number on the static behavior of SRHPBLs, push-out tests with a single strip and twin strips were conducted, which could be categorized into three groups (single row, twin rows, and triple rows), as illustrated in Figure 13. Consistent with a previous study [12], when the strip number rose, significant enhancement in both the P u and K of SRHPBLs was observed, as demonstrated in Figure 13a,b. This phenomenon could be associated with the expansion of the bonding zone between steel strips and concrete as well as the growth in the UHPC dowel number [12]. Specifically, the P u for twin-strip push-out tests was 2.20 (T-R1-A80), 2.07 (T-R2-A80), and 1.93 (T-R3-A80) times that for single-strip counterparts, while initial shear stiffness increased by 80.92% (T-R1-A80), 89.84% (T-R2-A80), and 90.81% (T-R3-A80) compared to the corresponding single-strip push-out tests, respectively. Notably, both S u and L u increased as the strip number increased, as indicated in Figure 13c,d. This result could be associated with the increase in the transverse reinforcement number passing through the UHPC dowels [12]. Significantly, S-R3-A80 exhibited higher S u than T-R3-A80 due to altered failure modes.

4. Recommendations

4.1. Shear–Tension Interaction Relationships

The relationships between shear ratio (Pu-s/Ps) and tension ratio (Pu-t/Pt) were essential in evaluating the combined tension–shear behavior of shear connectors. Up to now, to assess the shear–tension interaction, several models have been developed for studs in existing studies, as shown in Equations (1)–(3) [67,68,69], where P u s and P u t denoted the ultimate shear resistance under combined tension–shear loads and the corresponding tensile force, respectively. P s and P t represented the ultimate shear capacity and ultimate tensile capacity under pure shear and pure tensile loads, respectively. Because of the uniform force distribution of SRHPBLs, P t and P s were defined as the ultimate tensile and shear capacity at a tension–shear ratio of zero.
P u t P t 5 3 + P u s P s 5 3 = 1
P u t P t 3 2 + P u s P s 3 2 = 1
P u t P t 2 + P u s P s 2 = 1
However, these models required that the tension–shear interactions could not be ignored, irrespective of the tensile force magnitude. Owing to the insignificant impact of excessively small tensile or shear forces on the tension–shear interaction, Equation (4) [70] was proposed. In this formula, when the tension ratio or shear ratio was less than 20%, the effect of tension–shear interaction was recommended to be excluded.
P u s P s = 1 , P u t P t 0.2 P u t P t = 1 , P u s P s 0.2 P u t P t + P u s P s = 1.2 , P u t P t > 0.2 , P u s P s > 0.2
However, the shear resistance of studs still decreased to certain degree when the tensile ratio was 20% [71]. Therefore, Equation (5) was proposed, which ignored the impact of shear–tension interaction when tension ratio or shear ratio were less than 10%.
P u s P s = 1 , P u t P t 0.1 P u t P t = 1 , P u s P s 0.1 P u t P t + 0.5 2 + P u s P s + 0.5 2 = 2.61 , P u t P t > 0.1 , P u s P s > 0.1
Under combined tension–shear loads, the ultimate shear capacity of high-strength bolts was higher than studs; thus, a more accurate model was proposed [72], as shown in Equation (6).
P u t P t 3 + P u s P s 3 = 1
Radial   ratio = P u t / P t test 2 + P u s / P s test 2 P u t / P t predicted 2 + P u s / P s predicted 2
A P u t P t α + B P u s P s β = 1
The feasibility of the above formulas for the shear–tension interaction relationships of SRHPBLs was evaluated, as shown in Figure 14. To more accurately assess the applicability of shear–tension interaction relationships, the radial ratio suggested by Pallarés and Hajjar [73] was employed in this study, as shown in Equation (7). The average values (AVEs), standard deviations (STDEVs), and coefficient of variation (COV) of the radial ratio for the above-mentioned formulas are summarized in Table 5. The AVEs for the radial ratios of SRHPBLs from Equation (1) to Equation (6) ranged from 0.89 to 0.95. Generally, more accurate predictions were observed in specimens with smaller tension–shear ratios. For SRHPBLs with tension–shear ratios from 0.34 to 0.42, the AVEs of radial ratios varied from 0.78 to 0.92. This indicated that the above formulas were not applicable to shear connectors with a large tension–shear ratio. Therefore, there was a need to propose a more accurate formula to predict the shear–tension interaction for SRHPBLs. It could be noticed that the above-mentioned models followed a similar form, which was also adopted in this study, as presented in Equation (8). The constant coefficients A, B, α, and β could be determined based on regressive analyses of the experimental results.
Considering the limited impact of excessively small tension forces and shear forces, the tension–shear interaction was disregarded when the tension ratio or shear ratio were less than 0.1 [71]. Through regressing the experimental results, the model to predict the shear–tension interaction of SRHPBLs in steel–UHPC composite beams was developed, as expressed in Equation (9).
P u s P s = 1 , P u t P t 0.1 P u t P t = 1 , P u s P s 0.1 0.66 P u t P t 1.18 + 0.96 P u s P s 0.45 = 1 , P u t P t > 0.1 , P u s P s > 0.1
As indicated in Figure 14b, Equation (9) provided an accurate prediction for the test results, with an AVE of 1.01, an STDEV of 0.05, and a COV of 0.05, as summarized in Table 5. Compared with Equations (1)–(6), Equation (9) exhibited more accurate predictions for SRHPBLs with large tension–shear ratios. This indicated that Equation (9) provided more accurate predictions than other formulas. Although different failure modes were observed among the specimens in this study, the proposed model exhibited acceptable accuracy in predicting their shear–tension interaction relationships. This phenomenon could be related to the fact that the ultimate shear/tensile capacity was recorded when the UHPC dowel fracture occurred. Except for the experimental results in the present work, additional test results [53] on PBLs encased in UHPC under combined tension and shear loads were also utilized to verify the applicability of Equation (9). The model also exhibited certain accuracy in predicting the results in Luan et al. [53] within 10% of error, as illustrated in Figure 14b. Nevertheless, more test results of SRHPBLs in UHPC under combined tension–shear loads are needed to further verify the accuracy of the developed formula.

4.2. Shear Capacity of SRHPBLs Under Combined Tension–Shear Loads

Shear capacity was the dominant characteristic indicator to evaluate the static behavior of shear connectors. Until now, numerous models have been developed to predict the shear resistance of PBLs in NC [19,65]. However, PBLs embedded in UHPC had superior shear capacity. Therefore, a number of formulas were developed for calculating the shear strength of PBLs in UHPC [29]. However, the composite beams were usually under combined tension–shear loads during service stages, which decreased the shear strength of the connectors. To predict the shear strength of studs under combined load, Equation (10) was developed by Ding et al. [48]. Moreover, considering that combined tension–shear loads had an unfavored impact on the ultimate shear capacity of T-type PBLs, Equation (11) was developed by Zhan et al. [51]. In these Equations, R t / s is defined as the tension–shear ratio.
P u s = P s ( 0.55 R t / s 2 1.84 R t / s + 1.30 ) P s ; R t / s 0.17 ; R t / s > 0.17
P u s = P s 1 + R t / s 2
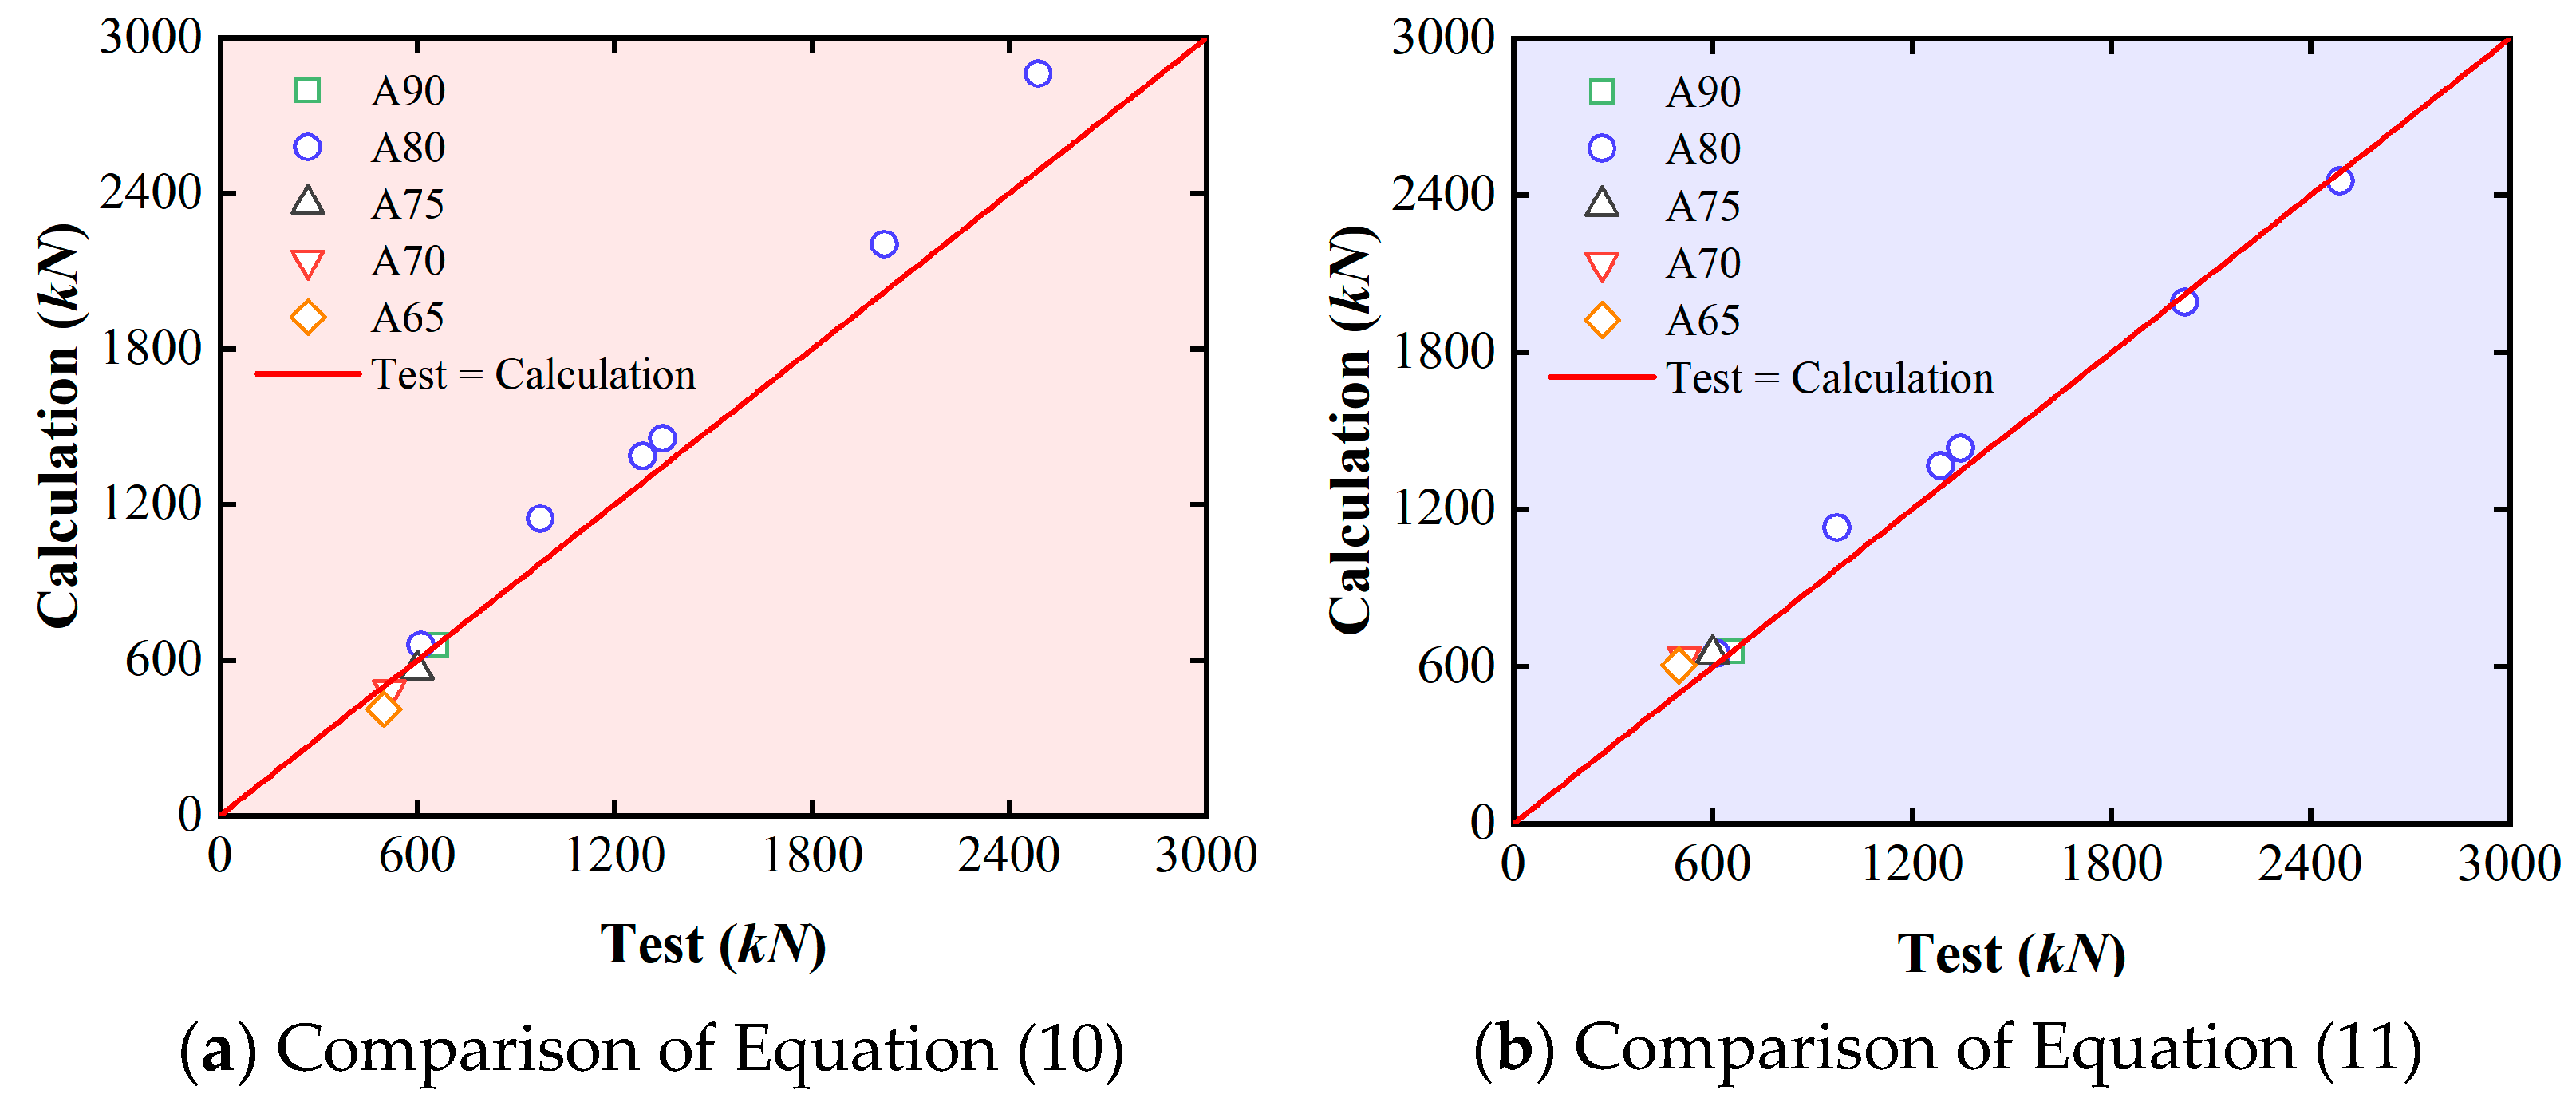
As illustrated in Figure 15, the predictions provided by Equations (10) and (11) were contrasted with the existing results in this study. Since the influence of a small tension–shear ratio was neglected in Equation (10), the ratio of predicted to tested results for Equation (10) ranged from 1.18 to 0.82. Meanwhile, Equation (11) provided more accurate predictions for SRHPBLs with a tension–shear ratio of less than 0.26, with an AVE, STDEV, and COV between calculated and test results of 1.05, 0.05, and 0.05, respectively. However, the predictions for push-out tests with a higher tension–shear ratio exhibited significant overestimations, with an AVE of 1.22. Consequently, it was essential to establish an accurate model for predicting the ultimate shear capacity of SRHPBLs in steel–UHPC composite beams under combined tension–shear loads.
Through analyzing the experimental results, different extents of strength reduction were observed under combined shear–tension forces. When the tension–shear ratio grew, the shear capacity of SRHPBLs had an average reduction rate of 12.47% in this study. Therefore, by incorporating the tension-to-shear ratio R t / s , the reduction factor α f was established to calculate the ultimate shear resistance of SRHPBLs encased in UHPC under combined tension–shear loads. Through regressive analyses on the experimental results, α f was calculated according to Equation (12).
α f = 1 0.63 R t / s 2 0.36 R t / s
Based on Equation (12), the shear strength of SRHPBLs under combined loads was determined as Equation (13).
P u s = P s 0.63 P s R t / s 2 0.36 P s R t / s
As illustrated in Figure 16, compared to Equations (10) and (11), Equation (13) exhibited more accurate predictions for SRHPBLs in this study, with the AVE, STDEV, and COV of the ratios between the calculated and test results of 1.01, 0.04, and 0.04, respectively. Similarly, the experimental results of Ref. [53] were utilized to assess the applicability of Equation (13). As shown in Figure 16, this model also exhibited certain accuracy in predicting the experimental results in Luan et al. with an AVE of 1.06 [53]. These results confirmed that Equation (13) yielded accurate predictions to calculate the shear strength of PBLs in steel–UHPC composite beams under combined shear–tension loads. Nevertheless, the tension–shear ratios of the specimens in this study were all less than 0.42, so the above model inherently exhibited limitations in applicability. Specifically, the prediction accuracy of the model might deteriorate when the tension–shear ratio exceeded 0.42. In future work, the range of tension–shear ratios could be expanded and additional experimental results incorporated to revise the above model.

5. Conclusions

Ten push-out tests were conducted in this study to explore the combined tension–shear behavior of SRHPBLs embedded in UHPC, considering the effects of the tension–shear ratio, row number, and strip number. Based on the test results, the following conclusions were drawn:
(1)
Most of the push-out tests demonstrated a similar failure mode, transverse reinforcements fracture, steel strip fracture, and excessive deformation of transverse reinforcements and steel strips. However, steel strip fracture was observed in three-row single-strip specimen. In addition, only UHPC dowel fracture and significant deformation in both steel strips and reinforcements were observed in specimens with excessive UHPC dowels.
(2)
The load–slip relationships showed similar five-stage behavior, including the initial elastic stage, the plastic stage induced by the breaking of SRHPBL–UHPC interfacial bonding, the softening stage due to UHPC dowel fracture, the ductile stage with strain hardening of transverse reinforcements, and the failure stage caused by transverse reinforcement fracture.
(3)
The tension–shear ratio exhibited a small effect on the static behaviors of SRHPBLs. When the tension–shear ratio was increased from 0 to 0.42, the shear capacity, initial shear stiffness, and slip at peak load of SRHPBLs decreased by 24.31%, 19.02%, and 22.00%, respectively. However, the increase in the tension–shear ratio substantially increased the uplift at the peak load of SRHPBLs.
(4)
Both row number and strip number exhibited a significant effect on the static behaviors of SRHPBLs. Compared to the single-row specimens, the shear capacity and initial shear stiffness of the three-row specimens increased by an average of 92.82% and 48.77%, respectively. The shear capacity and initial shear stiffness of the twin-strip specimens increased by an average of 103.84% and 87.80%, respectively, compared to the single-strip specimens.
(5)
A more accurate model was developed to predict the shear–tension interaction of SRHPBLs in UHPC slabs, with an error within 10%. Furthermore, considering the effect of tensile action on the ultimate shear capacity of SRHPBLs, a more accurate formula was developed, with an AVE, STDEV, and COV of the ratios between calculations and test results of 1.01, 0.04, and 0.04, respectively.
However, the above conclusions were derived from only a limited number of experimental results. The above conclusions may be inapplicable to SRHPBLs with tension–shear ratios larger than 0.42.

Author Contributions

Conceptualization, S.F.; methodology, S.F. and F.M.; validation, F.M., B.X. and G.W.; formal analysis, F.M.; investigation, F.M., R.S., B.X. and G.W.; resources, S.F. and H.J.; data curation, F.M. and B.X.; writing—original draft preparation, F.M.; writing—review and editing, F.M., S.F. and H.J.; visualization, F.M. and S.F.; supervision, H.J.; project administration, H.J.; funding acquisition, S.F. All authors have read and agreed to the published version of the manuscript.

Funding

This research was funded by the Applied Basic Research Foundation of Guangdong Province, grant number 2023A1515111073.

Data Availability Statement

The original contributions presented in the study are included in the article; further inquiries can be directed to the corresponding authors.

Conflicts of Interest

The authors declare no conflicts of interest.

References

  1. Jiang, J.; Wang, H.; Zhou, Z.; Liang, H.; Zhang, Z.; He, Z.; Zou, Y. Flexural behavior of prefabricated steel-UHPC composite beams with hollow UHPC bridge deck. J. Constr. Steel Res. 2025, 226, 109267. [Google Scholar] [CrossRef]
  2. Liu, L.; Zhou, M.; Su, H.; Lu, W.; Zhang, L. Mechanical properties of plug-in perfobond strip connector in ultra-high-performance concrete. Structures 2025, 72, 108282. [Google Scholar] [CrossRef]
  3. He, S.; Zhou, D.; Bai, B.; Liu, C.; Dong, Y. Experimental study on shear performance of prefabricated HSS-UHPC composite beam with perfobond strip connectors. Eng. Struct. 2025, 324, 119318. [Google Scholar] [CrossRef]
  4. He, S.; Zhong, H.; Huang, X.; Xu, Y.; Mosallam, A.S. Experimental investigation on shear fatigue behavior of perfobond strip connectors made of high strength steel and ultra-high performance concrete. Eng. Struct. 2025, 322, 119181. [Google Scholar] [CrossRef]
  5. Kong, F.; Huang, P.; Han, B.; Wang, X.; Liu, C. Experimental study on behavior of corrugated steel-concrete composite bridge decks with MCL shape composite dowels. Eng. Struct. 2021, 227, 111399. [Google Scholar] [CrossRef]
  6. Jiang, H.; Chen, Z.; Fang, Z.; Fang, S.; Tu, W.; Mo, F.; Xie, S.; Liu, J. Rapid hardening high performance concrete (RHHPC) for bridge expansion joints: From material properties to interfacial shear performance. Constr. Build. Mater. 2025, 458, 139638. [Google Scholar] [CrossRef]
  7. Zou, S.; Chen, R.; Wang, H.; Fang, Z.; Qu, C.; Zhang, C. Effect of shear key geometrical dimensions on seismic performance of prefabricated concrete piers with shallow socket connections. Structures 2025, 71, 107975. [Google Scholar] [CrossRef]
  8. Zou, S.; Wang, H.; Fang, S.; Fang, Z.; Wenliuhan, H.; Qu, C.; Zhang, C. Seismic isolation effect and parametric analysis of simply supported beam bridges with multi-level sliding friction adaptive isolation bearing. Soil Dyn. Earthq. Eng. 2025, 188, 109000. [Google Scholar] [CrossRef]
  9. Chen, Z.; Wu, C.; Chen, B.; Yang, Y.; Liang, W.; Tang, Y.; Zheng, J. Long-term creep behavior of expansive agent core concrete in full-scale concrete-filled steel tube from the world’s largest span arch bridge study. Front. Struct. Civ. Eng. 2025, 19, 319–340. [Google Scholar] [CrossRef]
  10. Zhou, J.; Leng, J.; Yang, J.; Zhang, Z.; Du, J.; Zou, Y. Experimental investigation on shear behavior of damaged and acid rain-corroded RC T-beams strengthened with ultra-high-performance concrete. Eng. Struct. 2025, 327, 119618. [Google Scholar] [CrossRef]
  11. Li, Y.; Zhou, H.; Zhang, Z.; Yang, J.; Wang, X.; Wang, X.; Zou, Y. Macro-micro investigation on the coefficient of friction on the interface between steel and cast-in-place UHPC. Eng. Struct. 2024, 318, 118769. [Google Scholar] [CrossRef]
  12. Wu, N.; Liao, S.; Pan, Z.; Fang, Z.; Fang, S.; Liu, F.; Li, L.; Xiong, Z. Shear performance of small-rib-height perfobond strip connector groups embedded in UHPC: Experimental investigations and design recommendations. Eng. Struct. 2024, 311, 118175. [Google Scholar] [CrossRef]
  13. Tan, X.; Fang, Z.; Yin, Y.; Yuan, R.; Liu, X.-H.; Liu, Q. Shear behavior of low-profile perfobond strip connectors for steel–thin UHPC composite deck structures. Eng. Struct. 2025, 322, 119204. [Google Scholar] [CrossRef]
  14. Xu, Y.; He, S.; Guan, P.; Mosallam, A.S.; Zeng, J.; Wan, Z.-Y. Shear behavior of flexible-sleeve perfobond strip connectors: Experimental and analytical studies. Eng. Struct. 2022, 264, 114380. [Google Scholar] [CrossRef]
  15. Su, Q.; Yang, G.; Bradford, M.A. Bearing capacity of perfobond rib shear connectors in composite girder bridges. J. Bridge Eng. 2016, 21, 06015009. [Google Scholar] [CrossRef]
  16. Kim, S.; Ahn, J.; Choi, K.; Jung, C. Experimental evaluation of the shear resistance of corrugated perfobond rib shear connections. Adv. Struct. Eng. 2011, 14, 249–264. [Google Scholar] [CrossRef]
  17. Su, Q.; Wang, W.; Luan, H.; Yang, G. Experimental research on bearing mechanism of perfobond rib shear connectors. J. Constr. Steel Res. 2014, 95, 22–31. [Google Scholar] [CrossRef]
  18. Wang, X.; Zhu, B.; Cui, S.; Lui Eric, M. Experimental research on PBL connectors considering the effects of concrete stress state and other connection parameters. J. Bridge Eng. 2018, 23, 04017125. [Google Scholar] [CrossRef]
  19. Zhao, C.; Li, Z.; Deng, K.; Wang, W. Experimental investigation on the bearing mechanism of Perfobond rib shear connectors. Eng. Struct. 2018, 159, 172–184. [Google Scholar] [CrossRef]
  20. Zheng, S.; Liu, Y.; Yoda, T.; Lin, W. Parametric study on shear capacity of circular-hole and long-hole perfobond shear connector. J. Constr. Steel Res. 2016, 117, 64–80. [Google Scholar] [CrossRef]
  21. Xiao, L.; Li, X.; Ma, Z.J. Behavior of perforated shear connectors in steel–concrete composite joints of hybrid bridges. J. Bridge Eng. 2017, 22, 04016135. [Google Scholar] [CrossRef]
  22. Rodrigues, J.P.C.; Laím, L. Behaviour of Perfobond shear connectors at high temperatures. Eng. Struct. 2011, 33, 2744–2753. [Google Scholar] [CrossRef]
  23. Vianna, J.d.C.; Costa-Neves, L.F.; da S Vellasco, P.C.G.; de Andrade, S.A.L. Experimental assessment of perfobond and T-perfobond shear connectors’ structural response. J. Constr. Steel Res. 2009, 65, 408–421. [Google Scholar] [CrossRef]
  24. Zou, Y.; Zheng, K.; Zhou, J.; Zhang, Z.; Li, X. Mechanical behavior of perfobond connector group in steel–concrete joint of hybrid bridge. Structures 2021, 30, 925–936. [Google Scholar] [CrossRef]
  25. Cândido-Martins, J.P.S.; Costa-Neves, L.F.; Vellasco, P.C.G.d.S. Experimental evaluation of the structural response of Perfobond shear connectors. Eng. Struct. 2010, 32, 1976–1985. [Google Scholar] [CrossRef]
  26. Liu, J.; Zhang, Q.; Cheng, Z.; Cui, C.; Tang, K. Study on the rational construction methods and mechanical properties of composite beams in transverse negative bending moment zones. Eng. Struct. 2025, 324, 119348. [Google Scholar] [CrossRef]
  27. Leng, J.; Yang, J.; Zhang, Z.; Zou, Y.; Du, J.; Zhou, J. Mechanical behavior of a novel compact steel-UHPC joint for hybrid girder bridges: Experimental and numerical investigation. J. Constr. Steel Res. 2024, 218, 108742. [Google Scholar] [CrossRef]
  28. Xiao, J.; Guo, L.; Nie, J.; Li, Y.; Fan, J.; Shu, B. Flexural behavior of wet joints in steel-UHPC composite deck slabs under hogging moment. Eng. Struct. 2022, 252, 113636. [Google Scholar] [CrossRef]
  29. Tan, X.; Fang, Z.; Xiong, X. Experimental study on group effect of perfobond strip connectors encased in UHPC. Eng. Struct. 2022, 250, 113424. [Google Scholar] [CrossRef]
  30. Tan, X.; Fang, Z.; Peng, Z.; Zheng, H.; Tang, S.; Liao, Y. Tensile behavior of a prefabricated Steel–UHPC composite deck system with notched perfobond strips. Eng. Struct. 2022, 268, 114737. [Google Scholar] [CrossRef]
  31. Xiao, J.; Yang, T.; Nie, X.; Li, B.; Fan, J.-S.; Shu, B. Experimental and numerical investigation on mechanical performance of continuous steel-UHPC composite slabs. Eng. Struct. 2022, 270, 114804. [Google Scholar] [CrossRef]
  32. Mai, G.; Xiong, Z.; Zhu, H.; Zhou, L.; Zhou, H.; Li, L.-J. Durability of GFRP bars embedded in seawater sea sand concrete in marine environments. Constr. Build. Mater. 2025, 458, 139488. [Google Scholar] [CrossRef]
  33. Chen, Z.; Su, J.; Luo, R.; Lin, J.; Chen, X.; Huang, P.; Guo, Y. Experimental investigation on fracture behavior of rubberized engineered cementitious composites under thermo-mechanical loadings. Eng. Fract. Mech. 2025, 315, 110838. [Google Scholar] [CrossRef]
  34. Wan, S.; Li, S.; Chen, Z.; Tang, Y. An ultrasonic-AI hybrid approach for predicting void defects in concrete-filled steel tubes via enhanced XGBoost with Bayesian optimization. Case Stud. Constr. Mater. 2025, 22, e04359. [Google Scholar] [CrossRef]
  35. Wang, J.; Liu, F.; Luo, Z.; He, M.; Chen, G.; Xiong, Z. Behaviour of FRP-rubber concrete-steel double-skin tubular slender columns under eccentric compression: An experimental and theoretical study. J. Build. Eng. 2025, 104, 112265. [Google Scholar] [CrossRef]
  36. Xiao, J.; Shuai, J.; Deng, W.; Liu, L.; Wang, P.; Li, L. Low-carbon and green materials in construction: Latest advances and prospects. Buildings 2025, 15, 1508. [Google Scholar] [CrossRef]
  37. Cao, X.; Feng, D. Probabilistic resilience assessment of structures considering the functional uncertainty: A case study for external prestressed subframe in strengthening. Eng. Struct. 2025, 332, 119968. [Google Scholar] [CrossRef]
  38. Cao, X.; Shen, D.; Ji, K.; Ju, J.W.; Xie, L. A novel stochastic IDA-CSM based design framework of the externally-attached sub-system for seismic upgrading. Bull. Earthquake Eng. 2025, 23, 1707–1735. [Google Scholar] [CrossRef]
  39. Cao, X.; Shen, D.; Ji, K.; Qu, Z.; Wang, C. Recovery resilience framework of replaceable AB-BRB for seismic strengthening during the aftershock stage. Thin-Walled Struct. 2024, 205, 112389. [Google Scholar] [CrossRef]
  40. Deng, K.; Wang, K.; Liang, H.; Zhao, C.; Cui, B. Experimental and analytical study on crack resistance of fully prefabricated steel-UHPC composite deck using PBL connectors. Eng. Struct. 2023, 275, 115249. [Google Scholar] [CrossRef]
  41. Luo, Z.; Zhao, H.; Qiao, D.; Zhang, Y.; An, J.; Tan, C.; Liang, L.; Liu, A.; Shao, X. Shear behavior on PBL shear connector with a relatively thin perforated steel plate in steel-UHPC composite bridge deck system. Eng. Struct. 2024, 316, 118583. [Google Scholar] [CrossRef]
  42. Xiao, R.; Song, C.; Sun, B.; Guo, R.; Chen, H. Design and experimental study of a replaceable steel-UHPC composite bridge deck. Structures 2022, 40, 1107–1120. [Google Scholar] [CrossRef]
  43. Liu, Y.; Xiao, L.; Wei, X.; Liao, X.; Wang, S. Investigation on fatigue performance and life prediction of PBL connectors in steel-UHPC composite structure. Eng. Struct. 2025, 329, 119762. [Google Scholar] [CrossRef]
  44. Liu, Y.; Yang, H.; Luan, L.; Xu, X.; Liu, Y.; Du, X. Three failure modes of High-Strength Steel (HSS) perfobond connector embedded in UHPC. Eng. Struct. 2023, 286, 116147. [Google Scholar] [CrossRef]
  45. Gao, X.; Shen, S.; Guo, Y.; Guo, J. Experimental study on the shear and slip behaviors of perfobond strip connectors with low elastic modulus material wrapped perforated rebars. Eng. Struct. 2024, 316, 118521. [Google Scholar] [CrossRef]
  46. Duan, M.; Zhang, S.; Wang, X.; Dong, F. Mechanical behavior in perfobond rib shear connector with UHPC-steel composite structure with coarse aggregate. KSCE J. Civ. Eng. 2020, 24, 1255–1267. [Google Scholar] [CrossRef]
  47. Ni, Y.; Hu, M.; Jia, Z.; Han, Q. Shear behavior of Y-shaped perfobond rib shear connector with UHPC grout. J. Struct. Eng. 2024, 150, 04024102. [Google Scholar] [CrossRef]
  48. Ding, J.; Zhu, J.; Shi, T. Performance of grouped stud connectors in precast steel-UHPC composite bridges under combined shear and tension loads. Eng. Struct. 2023, 277, 115470. [Google Scholar] [CrossRef]
  49. Shen, M.; Chung, K. Experimental investigation into stud shear connections under combined shear and tension forces. J. Constr. Steel Res. 2017, 133, 434–447. [Google Scholar] [CrossRef]
  50. Shen, M.; Chung, K.; Elghazouli, A.Y. Performance of stud shear connections under combined shear and pull-out forces. Structures 2023, 51, 415–434. [Google Scholar] [CrossRef]
  51. Zhan, Y.; Huang, W.; Li, Y.; Li, J.; Shao, J.; Tian, B. Experimental investigation on mechanical behavior of T-type perfobond rid shear connectors under combined shear and tension. J. Build. Eng. 2023, 73, 106840. [Google Scholar] [CrossRef]
  52. Huang, W.; Zhan, Y.; Zhang, C.; Lyu, W.; Li, Y.; Shao, J. Tensile resistance and shear-tension interaction relationship of T-type perfobond rid shear connectors. J. Build. Eng. 2024, 89, 109183. [Google Scholar] [CrossRef]
  53. Luan, L.; Xu, X.; Liu, Y.; Lin, W.; Du, X.; Liu, Y. Combined tensile and shear behavior of perfobond connectors embedded in UHPC with a new orthotropic rubber ring. J. Constr. Steel Res. 2024, 219, 108796. [Google Scholar] [CrossRef]
  54. Eurocode 4. EN 1994-1-1; Design of Composite Steel and Concrete Structures. Part 1.1: General Rules and Rules for Buildings. Europan Committee for Standardization: Brussels, Belgium, 2005.
  55. He, S.; Mosallam, A.S.; Fang, Z.; Sun, X.; Su, J. Experimental evaluation of shear connectors using reactive powder concrete under natural curing condition. Constr. Build. Mater. 2018, 191, 775–786. [Google Scholar] [CrossRef]
  56. Shoaib Karam, M.; Nakamura, H.; Yamamoto, Y.; Miura, T. Numerical evaluation of the perfobond (PBL) shear connector with transverse rebar using coupled rigid Body spring model (RBSM) and solid finite element method (FEM). Structures 2022, 45, 1544–1560. [Google Scholar] [CrossRef]
  57. TableASTM C1231/C1231M-15; Standard Practice for Use of Unbond Caps in Determination of Compressive Strength of Hardened Cylindrical Concrete Specimens. ASTM International: West Conshohocken, PA, USA, 2015.
  58. ASTM C496/C496M-11; Standard Test Method for Splitting Tensile Strength of Cylindrical Concrete Specimens. ASTM International: West Conshohocken, PA, USA, 2011.
  59. ASTM C469/C469M-14e1; Standard Test Method for Static Modulus of Elasticity and Poisson’s Ratio of Concrete in Compression. ASTM International: West Conshohocken, PA, USA, 2014.
  60. ASTM E8/E8M-22; Standard Test Methods for Tension Testing of Metallic Materials. ASTM International: West Conshohocken, PA, USA, 2022.
  61. Ahn, J.; Lee, C.; Won, J.; Kim, S. Shear resistance of the perfobond-rib shear connector depending on concrete strength and rib arrangement. J. Constr. Steel Res. 2010, 66, 1295–1307. [Google Scholar] [CrossRef]
  62. Liu, Y.; Xin, H.; Liu, Y. Experimental and analytical study on tensile performance of perfobond connector in bridge engineering application. Structures 2021, 29, 714–729. [Google Scholar] [CrossRef]
  63. Harsányi, P.; Randl, N.; Tue, N.V. DIC-based failure analysis of high-strength continuous steel shear dowels for composite UHPFRC steel construction. Eng. Struct. 2021, 247, 113093. [Google Scholar] [CrossRef]
  64. Weng, R.; He, Z.; Liu, J.; Lei, B.; Huang, L.; Xu, J.; Liu, L.; Xiao, J. Shear performance of UHPC-NC composite structure interface treated with retarder: Quantification by fractal dimension and optimization of process parameters. Buildings 2025, 15, 2591. [Google Scholar] [CrossRef]
  65. Di, J.; Zou, Y.; Zhou, X.; Qin, F.; Peng, X. Push-out test of large perfobond connectors in steel–concrete joints of hybrid bridges. J. Constr. Steel Res. 2018, 150, 415–429. [Google Scholar] [CrossRef]
  66. Xian, B.; Wang, G.; Ma, F.; Fang, S.; Jiang, H.; Xiao, J. Shear performance of single embedded nut bolted shear connectors in precast steel–UHPC composite beams under combined tension-shear loads. Case Stud. Constr. Mater. 2024, 21, e03558. [Google Scholar] [CrossRef]
  67. McMackin, P.J.; Slutter, R.G.; Fisher, J.W. Headed steel anchor under combined loading. Eng. J. 1973, 10, 43–52. [Google Scholar] [CrossRef]
  68. Mirza, O.; Uy, B. Effects of the combination of axial and shear loading on the behaviour of headed stud steel anchors. Eng. Struct. 2010, 32, 93–105. [Google Scholar] [CrossRef]
  69. Takami, K.; Nishi, K.; Hamada, S. Shear strength of headed stud shear connector subjected to tensile load. J. Constr. Steel Res. 2000, 7, 233–240. [Google Scholar]
  70. Bode, H.; Roik, K. Headed studs-embedded in concrete and loaded in tension. Symp. Publ. 1987, 103, 61–88. [Google Scholar] [CrossRef]
  71. Lin, Z.; Liu, Y.; He, J. Behavior of stud connectors under combined shear and tension loads. Eng. Struct. 2014, 81, 362–376. [Google Scholar] [CrossRef]
  72. Zhang, Y.; Zhang, J.; Liu, A.; Chen, B.; Safaei, B.; Yang, Z. Study on the behavior of high-strength friction-grip bolts under combined shear and tensile forces. Structures 2022, 45, 854–866. [Google Scholar] [CrossRef]
  73. Pallarés, L.; Hajjar, J.F. Headed steel stud anchors in composite structures, Part II: Tension and interaction. J. Constr. Steel Res. 2010, 66, 213–228. [Google Scholar] [CrossRef]
Figure 1. Schematic diagram of typical perfobond strip connectors (PBLs) [12].
Buildings 15 02892 g001
Figure 2. Details of experimental specimens.
Buildings 15 02892 g002
Figure 3. Configurations of SRHPBLs.
Buildings 15 02892 g003
Figure 4. Fabrication procedure of push-out tests.
Buildings 15 02892 g004
Figure 5. Material property tests.
Buildings 15 02892 g005
Figure 6. Setup of the test and instrumentation arrangement.
Buildings 15 02892 g006
Figure 7. Load–slip relationships for push-out tests.
Buildings 15 02892 g007
Figure 8. Load–uplift relationships for push-out tests.
Buildings 15 02892 g008
Figure 9. Failure modes obtained from experiments.
Buildings 15 02892 g009
Figure 10. Shear mechanism of SRHPBLs.
Buildings 15 02892 g010
Figure 11. Static behavior of SRHPBLs affected by the tension–shear ratio.
Buildings 15 02892 g011
Figure 12. Static behavior of SRHPBLs affected by row number.
Buildings 15 02892 g012
Figure 13. Static behavior of SRHPBLs affected by strip number.
Buildings 15 02892 g013
Figure 14. Evaluation of shear–tension interaction relationships for SRHPBLs in UHPC.
Buildings 15 02892 g014
Figure 15. Evaluation of Equations (10) and (11).
Buildings 15 02892 g015
Figure 16. Evaluation of the developed equation.
Buildings 15 02892 g016
Table 1. Designations and variables of push-out test.
SpecimensStrip NumberRow NumberInclined AngleTension–Shear Ratio
S-R1-A901190°0
S-R1-A801180°0.17
S-R1-A751175°0.26
S-R1-A701170°0.34
S-R1-A651165°0.42
S-R2-A801280°0.17
S-R3-A801380°0.17
T-R1-A802180°0.17
T-R2-A802280°0.17
T-R3-A802380°0.17
Table 2. Material properties of hardened UHPC.
Type f c (MPa) f t  (Mpa) E c (Gpa) ν
AVE COV AVE COV AVE COV AVE COV
UHPC172.080.0618.420.0150.460.010.2320.05
Table 3. Tensile properties of steel beams, steel strips, and transverse reinforcements.
Types f y (MPa) E s (Gpa) f u (Mpa)
AVE COV AVE COV AVE COV
Steel beam274.650.02202.110.01462.660.01
Steel strip292.990.01199.250.05419.850.01
Transverse reinforcement447.310.01197.230.02634.990.01
Table 4. Characteristic values of experimental results.
Push-Out Tests P u
(kN)
K
(kN/mm)
S u
(mm)
L u
(mm)
Failure   Mode   *
S-R1-A90657.472190.550.8000.071VC&HC&UF&RF
S-R1-A80611.352081.150.7260.107VC&HC&UF&RF
S-R1-A75599.602049.760.7090.159VC&UF&RF
S-R1-A70517.081802.500.6430.175VC&UF&RF
S-R1-A65497.601773.890.6240.266VC&UF&RF
S-R2-A80975.102677.232.8510.532VC&UF&RF
S-R3-A801286.642991.796.5510.863VC&UF&SF
T-R1-A801346.723765.841.3440.305VC&HC&RF&UF
T-R2-A802020.785082.095.2450.740VC&HC&UF&ED
T-R3-A802489.005707.005.3821.879VC&HC&UF&ED
* VC means vertical cracks; HC indicates horizontal cracks; RF denotes transverse reinforcements fracture; UF means UHPC dowel fracture SF indicates steel strip fracture; ED means excessive deformation of transverse reinforcements and steel strips.
Table 5. Evaluation of shear–tension interaction models.
Push-Out TestsEquation (1)Equation (2)Equation (3)Equation (4)Equation (5)Equation (6)Equation (9)
S-R1-A901.001.001.001.001.001.001.00
S-R1-A800.960.980.940.930.960.931.01
S-R1-A750.710.990.940.960.980.911.08
S-R1-A700.870.890.840.890.880.801.02
S-R1-A650.880.910.840.920.890.781.07
S-R2-A800.880.890.860.850.880.850.93
S-R3-A800.960.970.940.930.960.931.01
T-R1-A800.960.970.940.930.960.931.01
T-R2-A800.950.960.930.920.950.921.00
T-R3-A800.900.910.880.870.900.870.95
AVE0.910.950.910.920.940.891.01
STDEV0.080.040.050.040.040.070.05
COV0.090.040.060.050.050.080.05
Disclaimer/Publisher’s Note: The statements, opinions and data contained in all publications are solely those of the individual author(s) and contributor(s) and not of MDPI and/or the editor(s). MDPI and/or the editor(s) disclaim responsibility for any injury to people or property resulting from any ideas, methods, instructions or products referred to in the content.