Article

Notch Frequency Prediction of Prestressed Seven-Wire Steel Strand Based on Ultrasonic Guided Wave

1
Department of Civil Engineering, Hefei University of Technology, Hefei 230009, China
2
School of Mechanics and Construction Engineering, Jinan University, Guangzhou 510632, China
3
Guangzhou Central District Transportation Project Management Center, Guangzhou 510030, China
*
Author to whom correspondence should be addressed.
Buildings 2025, 15(17), 3166; https://doi.org/10.3390/buildings15173166
Submission received: 30 July 2025 / Revised: 22 August 2025 / Accepted: 30 August 2025 / Published: 3 September 2025
(This article belongs to the Special Issue UHPC Materials: Structural and Mechanical Analysis in Buildings)

Abstract

The traditional research methods of the notch frequency phenomenon are mainly discussed by experimental observation or the semi-analytical finite element method. In this paper, the notch frequency characteristics of ultrasonic guided waves are simulated by the general finite element method. Firstly, the theoretical dispersion curve of the longitudinal mode in the axially loaded rod is derived by the acoustic elasticity theory, and the finite element simulation is carried out by ABAQUS/Explicit 6.14 to simulate the wave propagation in the seven-wire steel strand. In order to verify the model, laboratory experiments are carried out on three types of prestressed steel strands with diameters of 12.7 mm, 15.2 mm, and 17.8 mm, respectively. Each specimen is gradually loaded from 50 kN to 110 kN in increments of 30 kN. At each loading level, the ultrasonic signal is obtained, and the corresponding notch frequency is extracted from the spectrum. The experimental results confirm the accuracy of the model, and the maximum deviation between the predicted notch frequency and the measured value is 3%. The results show that the proposed method provides a robust and non-destructive means for structural health monitoring in civil engineering applications, and has the potential to be more widely used in complex waveguide structures.

1. Introduction

Prestressed steel strands play a crucial role in the integrity of various civil engineering structures, including cable-stayed bridges, suspension systems, and prestressed concrete members [1,2,3,4]. Accurate monitoring of prestress levels in these strands is essential to ensuring long-term structural performance and safety. However, due to complex boundary conditions, material heterogeneity, and the difficulty of accessing embedded elements, the evaluation of axial tension during service remains a significant challenge. Among the existing non-destructive testing technologies [5], ultrasonic guided waves (UGWs) have been increasingly applied in non-destructive evaluation (NDE) of large-scale civil structures in engineering practice. For example, guided waves have been used for cable force monitoring of cable-stayed bridges, steel wire fracture and corrosion detection of main cables in suspension bridges, and prestress evaluation of concrete prestressed tendons [6,7,8,9,10]. Compared with traditional static load tests or vibration-based methods, UGWs have unique advantages, including long-distance inspection capability, high sensitivity to local damage, and applicability without direct access to the entire strand length. These practical applications demonstrate that the guided wave technology has great potential as a reliable tool for long-term structural health monitoring (SHM) of cable-supported systems. Specifically, the longitudinal mode L(0,1) is particularly effective in tension-sensitive applications because it exhibits a characteristic phenomenon known as the notch frequency, i.e., the frequency band in which the wave energy undergoes significant attenuation [11]. This notch frequency varies with the applied axial tension, thus providing a promising indicator for in situ stress evaluation.
Previous studies have confirmed the correlation between notch frequency and axial force in strands. Kwun et al. [12] proved an exponential relationship between the two under controlled laboratory conditions. Chaki and Bourse [13] used the simplified acoustoelastic formula and the change rate of the propagation velocity of the longitudinal mode guided wave to measure the stress of the steel strands. Bartoli et al. [14] concluded that the nonlinear ultrasonic technique appears more sensitive to the prestress levels and has stronger robustness to the change of the excitation power of the transmitting transducer or the change of transducer/tendon bond conditions. Cui et al. [15] proposed a method for estimating cable tension using normalized complex frequency analysis and multiple nonlinear regression, which achieved high accuracy in the range of 50~150 kN, and the average error was only 1.843 kN. This work highlights the effectiveness of notch frequency-based techniques in non-destructive prestressing assessment and their robustness to signal noise, and further enhances the practical value of guided wave methods in long-distance structural health monitoring. Similarly, other studies have also used analytical dispersion models, wave velocity changes, or simplified inversion techniques to interpret wave-based stress indicators [16,17,18]. However, these methods often rely on idealized geometries, assume fixed material properties, or ignore the effects of helix pitch and inter-wire contact in multi-wire strand systems.
Numerical model simulation is one of the methods used to study the characteristics of UGW notch frequency in axially loaded seven-wire steel strands. Frikha et al. [19] and Treyssède et al. [20] proposed a numerical model to calculate the dispersion curve of the prestressed helical seven-wire waveguide based on the semi-analytical finite element method. Qian et al. [7] solved the dispersion curves of single steel wire and steel strand under different boundary conditions and used singular value decomposition to process the simulated and experimental signals. While existing methods for notch frequency prediction, such as semi-analytical finite element methods or simplified acoustoelastic formulas, have provided valuable insights, they often assume idealized geometries or neglect inter-wire contact dynamics in multi-wire strands. This study introduces a novel approach by employing a general finite element model (FEM) with ABAQUS/Explicit 6.14 to simulate the complex helical structure and inter-wire interactions of prestressed seven-wire steel strands, validated through multi-diameter experiments (12.7 mm, 15.2 mm, 17.8 mm). Unlike previous studies, this work uniquely addresses the gap in accurately modeling realistic helical effects and validating them across a range of geometric and loading conditions, achieving a maximum deviation of 3% between simulated and experimental notch frequencies. This advancement enhances the reliability of notch frequency-based structural health monitoring for steel strands.
Recently, artificial intelligence and deep learning methods have been widely introduced into structural health monitoring (SHM). For example, convolutional neural networks (CNNs), recurrent neural networks such as long short-term memory, and hybrid frameworks such as CNN-BiGRU have been successfully applied to automatic feature extraction, cable force estimation, and damage identification in cable-supported structures [21,22,23,24]. These studies demonstrate the strong capability of data-driven methods in dealing with large-scale data sets and capturing nonlinear patterns. However, such models are often regarded as black-box methods and lack clear physical interpretability. In this study, using the ultrasonic guided wave notch frequency as a stress-sensitive indicator, the physics-informed strategy not only provides reliable physical insight but also maintains high accuracy. Furthermore, the method can be combined with machine learning techniques for automatic notch frequency detection and adaptive calibration in future SHM applications.
The structure of this paper is as follows. Section 2 introduces the theoretical background of guided wave propagation in axially loaded rods, including the acoustoelastic effect and the dispersion characteristics of longitudinal modes. In Section 3, the FEM of multi-wire steel strands is presented, and the dispersion behavior under axial tension is analyzed by using two-dimensional Fourier transform (2D-FFT). Section 4 describes the experimental setup, including the measurement of notch frequencies under different loading conditions and comparing them with the simulation results. Finally, Section 5 summarizes the main findings of this study, and Section 6 discusses the potential applications of the proposed method in SHM of cable-supported bridges.

2. Theoretical Methodology for an Axially Stressed Rod

When ultrasonic waves propagate in a bounded medium, reflection occurs due to the presence of the boundary, resulting in waveform conversion. Waves with different wave velocities are coupled with each other to form ultrasonic guided waves [25]. Guided waves have multi-modality during the propagation process, that is, there are multiple modes at the same frequency, and each mode propagates in the medium at a different speed. In rod-like structures, for the guided waves propagating along the axial direction, if the vibration and propagation directions are only in the axial and radial directions, they are longitudinal modes L(0, n), where n is the circumferential order of the mode. As the wave group with multiple modes and multiple frequency components propagates over an increasing distance, the wave packet in the time domain will stretch and the amplitude will decrease. Meanwhile, each component will gradually disperse, resulting in the dispersion of guided waves. Based on the above issues, in this section, the exact acoustoelastic theory of axially loaded circular rods is derived. Then, the theoretical dispersion curves of the circular rod under the longitudinal guided wave mode are plotted, which provides a theoretical basis for the subsequent plotting of the dispersion curves of steel strands.

2.1. Acoustoelastic Theory of Axially Stressed Rod

In the stressed structure, the propagation characteristics of guided waves are not only related to the elastic constants but also to the magnitude of the applied stress. The fundamental reason is that stress causes material anisotropy, which is caused by the nonlinearity in the strain–displacement relationship and the constitutive relationship of the material. This causes the material change from an elastic body to a hyper-elastic body, and this effect is known as the acoustoelastic effect. The acoustoelastic effect studies the relationship between the stress state of a solid waveguide medium and the velocity of guided waves. The premise for applying the acoustoelastic theory is that the waveguide medium should meet the following assumptions:
(1)
The guided-wave medium is continuous and isotropic.
(2)
The waveguide is a hyper-elastic body, and the stress-strain constitutive relationship is nonlinear.
(3)
Under the action of loads, the perturbation of the waveguide to the acoustic wave is based on small deformations.
(4)
The material properties of the waveguide are not affected by external environments such as temperature.
According to the acoustoelastic theory, the propagation characteristics of ultrasonic waves in a medium are affected by stress. This effect is mainly reflected in the fact that the propagation speed of ultrasonic waves varies with different stresses. The material properties are replaced with the corresponding relationship of the second-order elastic constants of the material to achieve the acoustoelastic simulation of ultrasonic guided waves in the waveguide structure. For an infinite medium, the acoustoelastic theory involves body waves in three mutually orthogonal directions, and the relationship between stress and wave speed is the relationship between components in multiple directions [26]. As shown in Figure 1, for a uniform and isotropic slender rod under uniaxial stress, the propagation of ultrasonic waves is in the longitudinal guided wave mode along the direction of tensile stress. Therefore, the acoustoelastic theory can be simplified to the relationship between stress and body waves under a uniaxial stress state:
V L σ = λ + 2 μ ρ 1 + σ 2 ( λ + 2 μ ) ( 3 λ + 2 μ ) × λ + μ μ ( 4 λ + 10 μ + 4 m ) + λ + 2 l V T σ = μ ρ 1 + σ 2 μ ( 3 λ + 2 μ ) 4 λ + 4 μ + m + λ n 4 μ
where V L σ represents the ultrasonic longitudinal body wave propagating along the stress direction; V T σ represents the shear wave propagating perpendicular to the stress direction; ρ represents the density; σ represents the tensile stress; λ and μ represent the second-order Lame elastic constants; m and n represent the third-order Murnaghan elastic constants. This equation describes how the tensile stress changes the velocity of longitudinal ( V L σ ) and shear ( V T σ ) waves through the acoustoelastic effect, where the stress-induced material anisotropy changes the wave propagation speeds. The terms involving the second-order ( λ , μ ) and third-order (m, n) elastic constants reflect the nonlinear response of the material to deformation. Under the zero-stress state, the above formula can be simplified as:
V L 0 = λ + 2 μ ρ V T 0 = μ ρ
where V L 0 , V T 0 represents the initial ultrasonic longitudinal wave and shear wave in the stress-free state, respectively. Under the zero-stress condition, this simplified form gives the baseline velocity of longitudinal and shear waves ( V L 0 , V T 0 ), which can be used as a reference for understanding how the applied stress affects the motion of the wave in the loading state.

2.2. Theoretical Dispersion Curve of Cylindrical Rod

In the absence of physical force, the elastic wave propagating in an isotropic solid at time t should satisfy the following Navier equation:
λ + μ u ¯ + μ 2 u ¯ = ρ 2 u ¯ / t 2
where u ¯ represents the displacement field, λ and μ are the Lame constants, ρ is the material density, is the Hamiltonian, and 2 is the Laplace operator. This Navier equation describes the propagation of elastic waves in isotropic solids, where the displacement field u ¯ is affected by the Lame constants ( λ , μ ) and density ρ . It balances the inertial force and elastic stress, laying the foundation for the guided wave mode in rod-like structures. Generally speaking, the more complex the structural form and the more irregular the geometric shape, the more difficult it is to determine the boundary conditions of the wave equation. Currently, the analytical solutions obtained are mainly for regular components such as flat plates, cylinders, and hollow circular tubes. By transforming the equations of motion in the Cartesian coordinate system into three displacement components in the cylindrical coordinate system, the following can be obtained:
u r = U ( r ) cos n u θ e i ( k z ω t ) u θ = V ( r ) sin n u θ e i ( k z ω t ) u z = W ( r ) cos n u θ e i ( k z ω t )
where nu is 0 or an integer, k is the wave number, ω is the angular frequency, and t is the time. u r , u θ and u z represent, respectively, the longitudinal vibration only in the axial and radial directions, the torsional vibration only in the circumferential direction, and the bending vibration in all three directions in the cylinder.
In the longitudinal mode, there are only radial and axial displacement components. The circumferential component in displacement u = u r , 0 , u z is zero, and the displacements of all points on the rod are axisymmetric about the center axis of the rod. For a single high-strength steel wire with a radius of a, when the stress components on the cylindrical surface are equal to 0, its propagation mode only includes longitudinal waves. The boundary conditions expressed in terms of stress should satisfy the following relationship:
σ r r = σ r z = σ r θ = 0
The modal frequency equation obtained by solving the wave equation only considering the longitudinal motion is the classical Pochhammer-Chree equation:
2 α a ( β 2 + k 2 ) J 1 ( α a ) J 1 ( β a ) ( β 2 k 2 ) 2 J 0 ( α a ) J 1 ( β a ) 4 k 2 α β J 1 ( α a ) J 0 ( β a ) = 0
where ω represents the angular frequency, k is the wave number, cL is the longitudinal wave velocity of the material, cT is the shear wave velocity of the material, α 2 = ω 2 / c L 2 k 2 , β 2 = ω 2 / c T 2 k 2 , and Jn are the n-th order Bessel functions. The Pochhammer-Chree equation defines the modal frequency solution of the longitudinal wave in a cylindrical rod. The transcendental property of the equation shows that there are many modes, and its solution reveals how the wave velocity changes with frequency due to geometric constraints.
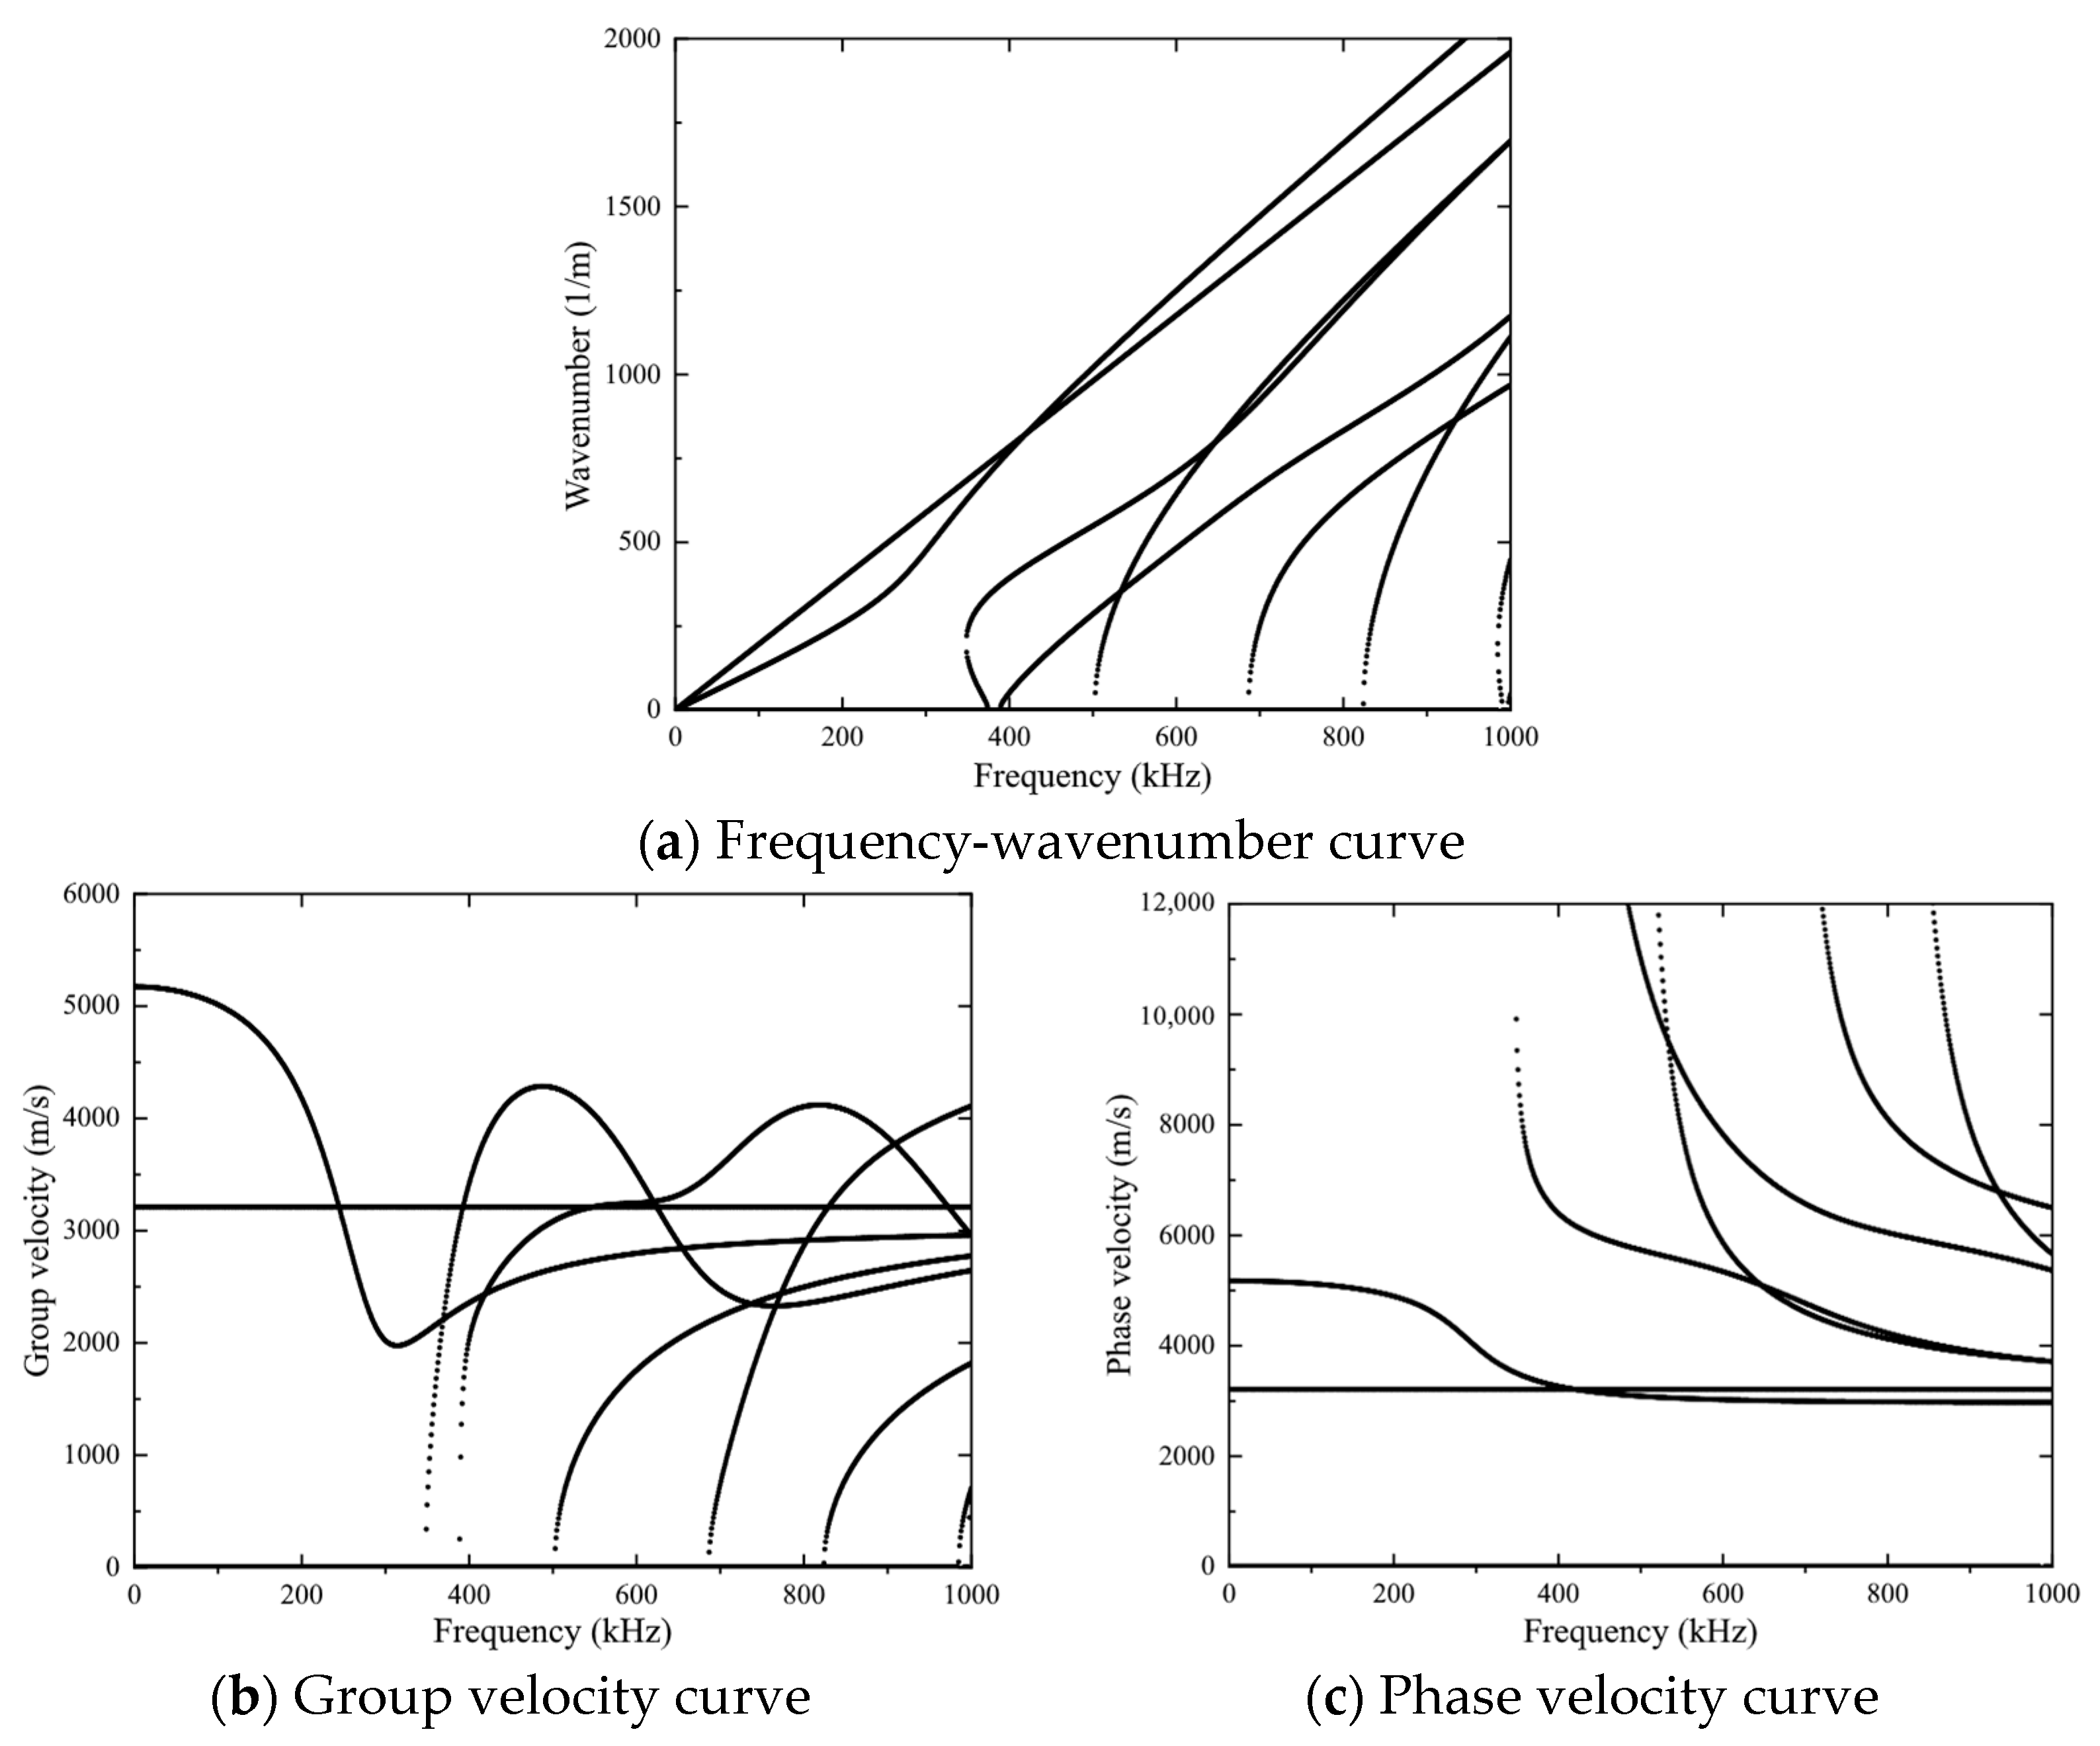
The core of researching ultrasonic guided waves is to solve the frequency equation. Intuitively, the frequency equation is represented by the dispersion curve. Mathematically, multimodality means that the frequency equation has multiple solutions. By numerically solving the transcendental equation for ω and k, the relationship between the angular frequency and the wave number of the circular rod under a stress-free state can be obtained. Then, according to the phase velocity calculation formula and by transforming the abscissa into the frequency f, the phase velocity frequency dispersion curve can be obtained. Similarly, according to the group velocity calculation formula and by further substituting the result variables, the group velocity frequency dispersion curve can be obtained. The dispersion curves of the circular rod under a stress-free state can all be solved by numerical methods. The longitudinal mode dispersion curve of a steel wire with a diameter of 5.22 mm, solved by the GUIGUW 2.2 guided wave dispersion curve software, is shown in Figure 2. This diameter is selected to match the actual wire size of 5.22 mm in the seven-wire strand, which ensures that the theoretical model can accurately reflect the physical properties of the strand and improve the accuracy of wave propagation prediction. In addition, the use of a diameter of 5.22 mm also enhances the correlation with the experimental setup, which helps directly correlate the theoretical prediction with the measured notch frequency under different axial loads.

3. Finite Element Model

To gain deeper insight into the guided wave propagation behavior and dispersion characteristics in prestressed steel strands, this chapter presents a finite element simulation of a seven-wire strand structure. Taking into account the helical geometry and the influence of axial tension, the model is constructed with realistic geometric parameters and solved based on elastic wave propagation theory. A displacement excitation is applied at one end of the strand, and axial transient acceleration signals are recorded at multiple sampling points. 2D-FFT is then employed to extract dispersion curves and reveal the evolution of guided wave modes under different structural parameters and boundary conditions. The simulation results provide theoretical support for subsequent experimental validation and notch frequency feature extraction.

3.1. Finite Element Analysis of Guided Wave of Strand

A steel strand consists of seven steel wires, and the core wire is in contact with the other six wires. Since it is difficult to obtain theoretical solutions for steel strands under various boundary conditions, the FEM is used to calculate and plot the dispersion curves. The effectiveness of the traditional FEM in simulating the propagation of elastic waves in structural components has been proven in the past. In this paper, the ABAQUS/Explicit method is adopted to establish an FEM of a steel strand for simulation. The steel strand has a length L of 480 mm, a nominal diameter d of 15.7 mm, and a pitch ρ h of 240 mm. The physical parameters of the steel strand are shown in Table 1. At the same time, in order to reduce the computational complexity and speed up the model operation, the model does not consider damping. Because damping only affects the amplitude of the wave, it has no effect on the wave of a specific frequency.
In order to obtain appropriate spatial and temporal resolutions in the results, specific criteria for grid size and time increment must be met. Datta and Kishore [27] pointed out that the number of computational nodes n required for each shortest wavelength should be no less than 8 nodes. Considering the frequency band within the maximum frequency f max = 1500 kHz as the research object to avoid the influence of modal separation of guided waves in the high-frequency band, the maximum grid length should satisfy:
L max = λ min 8 1 = c T / f max 7 = 0.31 mm
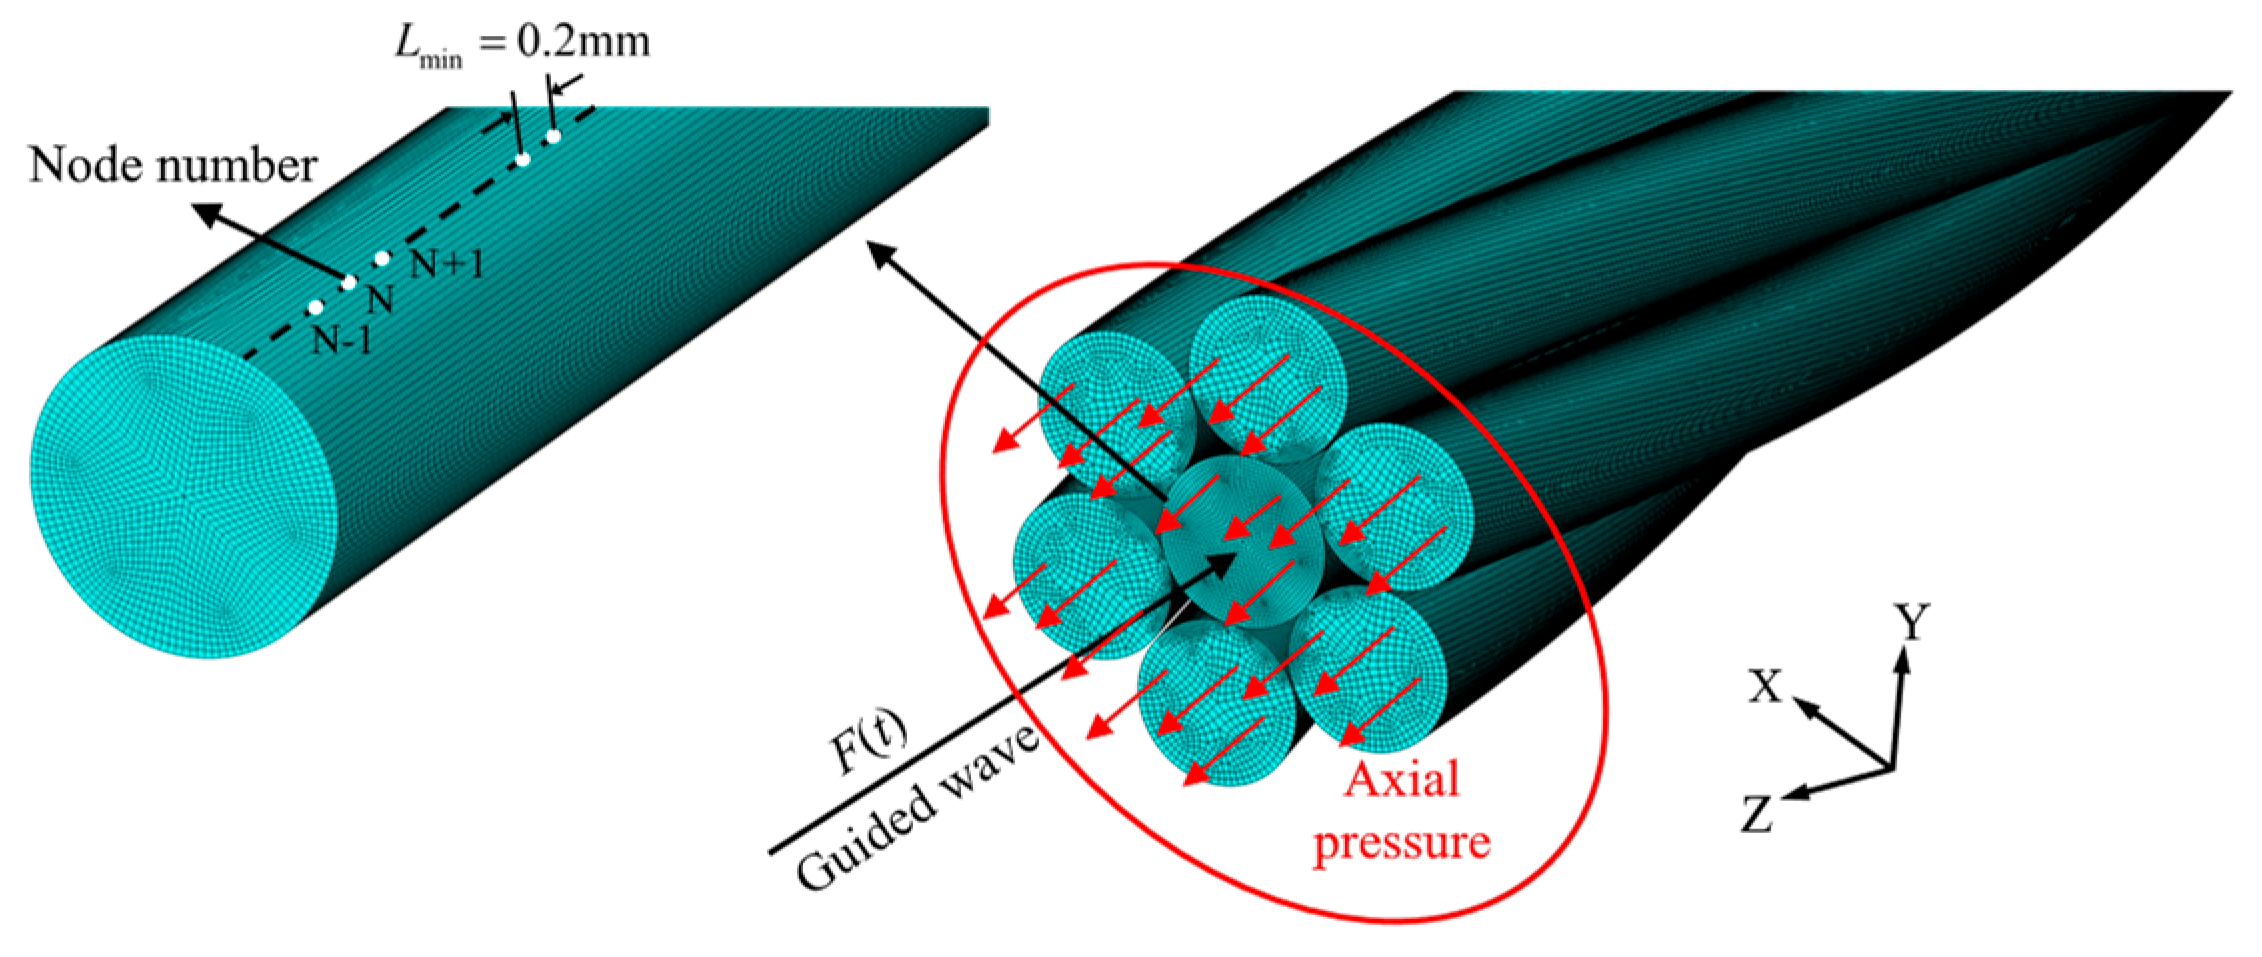
where λ min is the shortest wavelength. Therefore, the axial element size of the steel strand is rounded to 0.3 mm, and the minimum cross-section element size is approximately L min = 0.2 mm. The element type is defined as C3D8R (three-dimensional stress 8-node linear hexahedral element with reduced integration), and the hourglass control in the enhanced element control attributes is enabled. The results of the mesh division are shown in Figure 3.
Since the sensitivity characteristics of guided waves to stress in a steel strand under axial tension simulated by the FEM are affected by the limitations of the excitation time sequence and to make it a quasi-static loading process, it is considered to conduct a static analysis (Standard) first, and then import the results of the static analysis into the dynamic analysis (Explicit) in the form of a predefined field. This method can avoid the influence on the effectiveness of guided wave propagation caused by the instantaneously applied tension. The guided wave propagation process is carried out after the steel strand becomes stable under the action of the axial force. The fully automatic integration time step is used in the static analysis step. When simulating the wave propagation process dynamically, it is recommended that the time integration step Δ t should be small enough to ensure good temporal resolution, and the propagation of the longitudinal wave at the minimum spatial resolution should be captured within a unit integration time. In addition, the time integration step should meet the Shannon criterion of FFT. In summary, the time integration step should satisfy:
Δ t min L min c L = 3.3 × 10 8 s 1 20 f max = 3.3 × 10 8 s 1 2 f max = 3.3 × 10 7 s
where the time integration step Δ t is rounded to 0.03 μs. The geometric nonlinearity (Nlgeom) switches in both analysis steps need to be turned on.
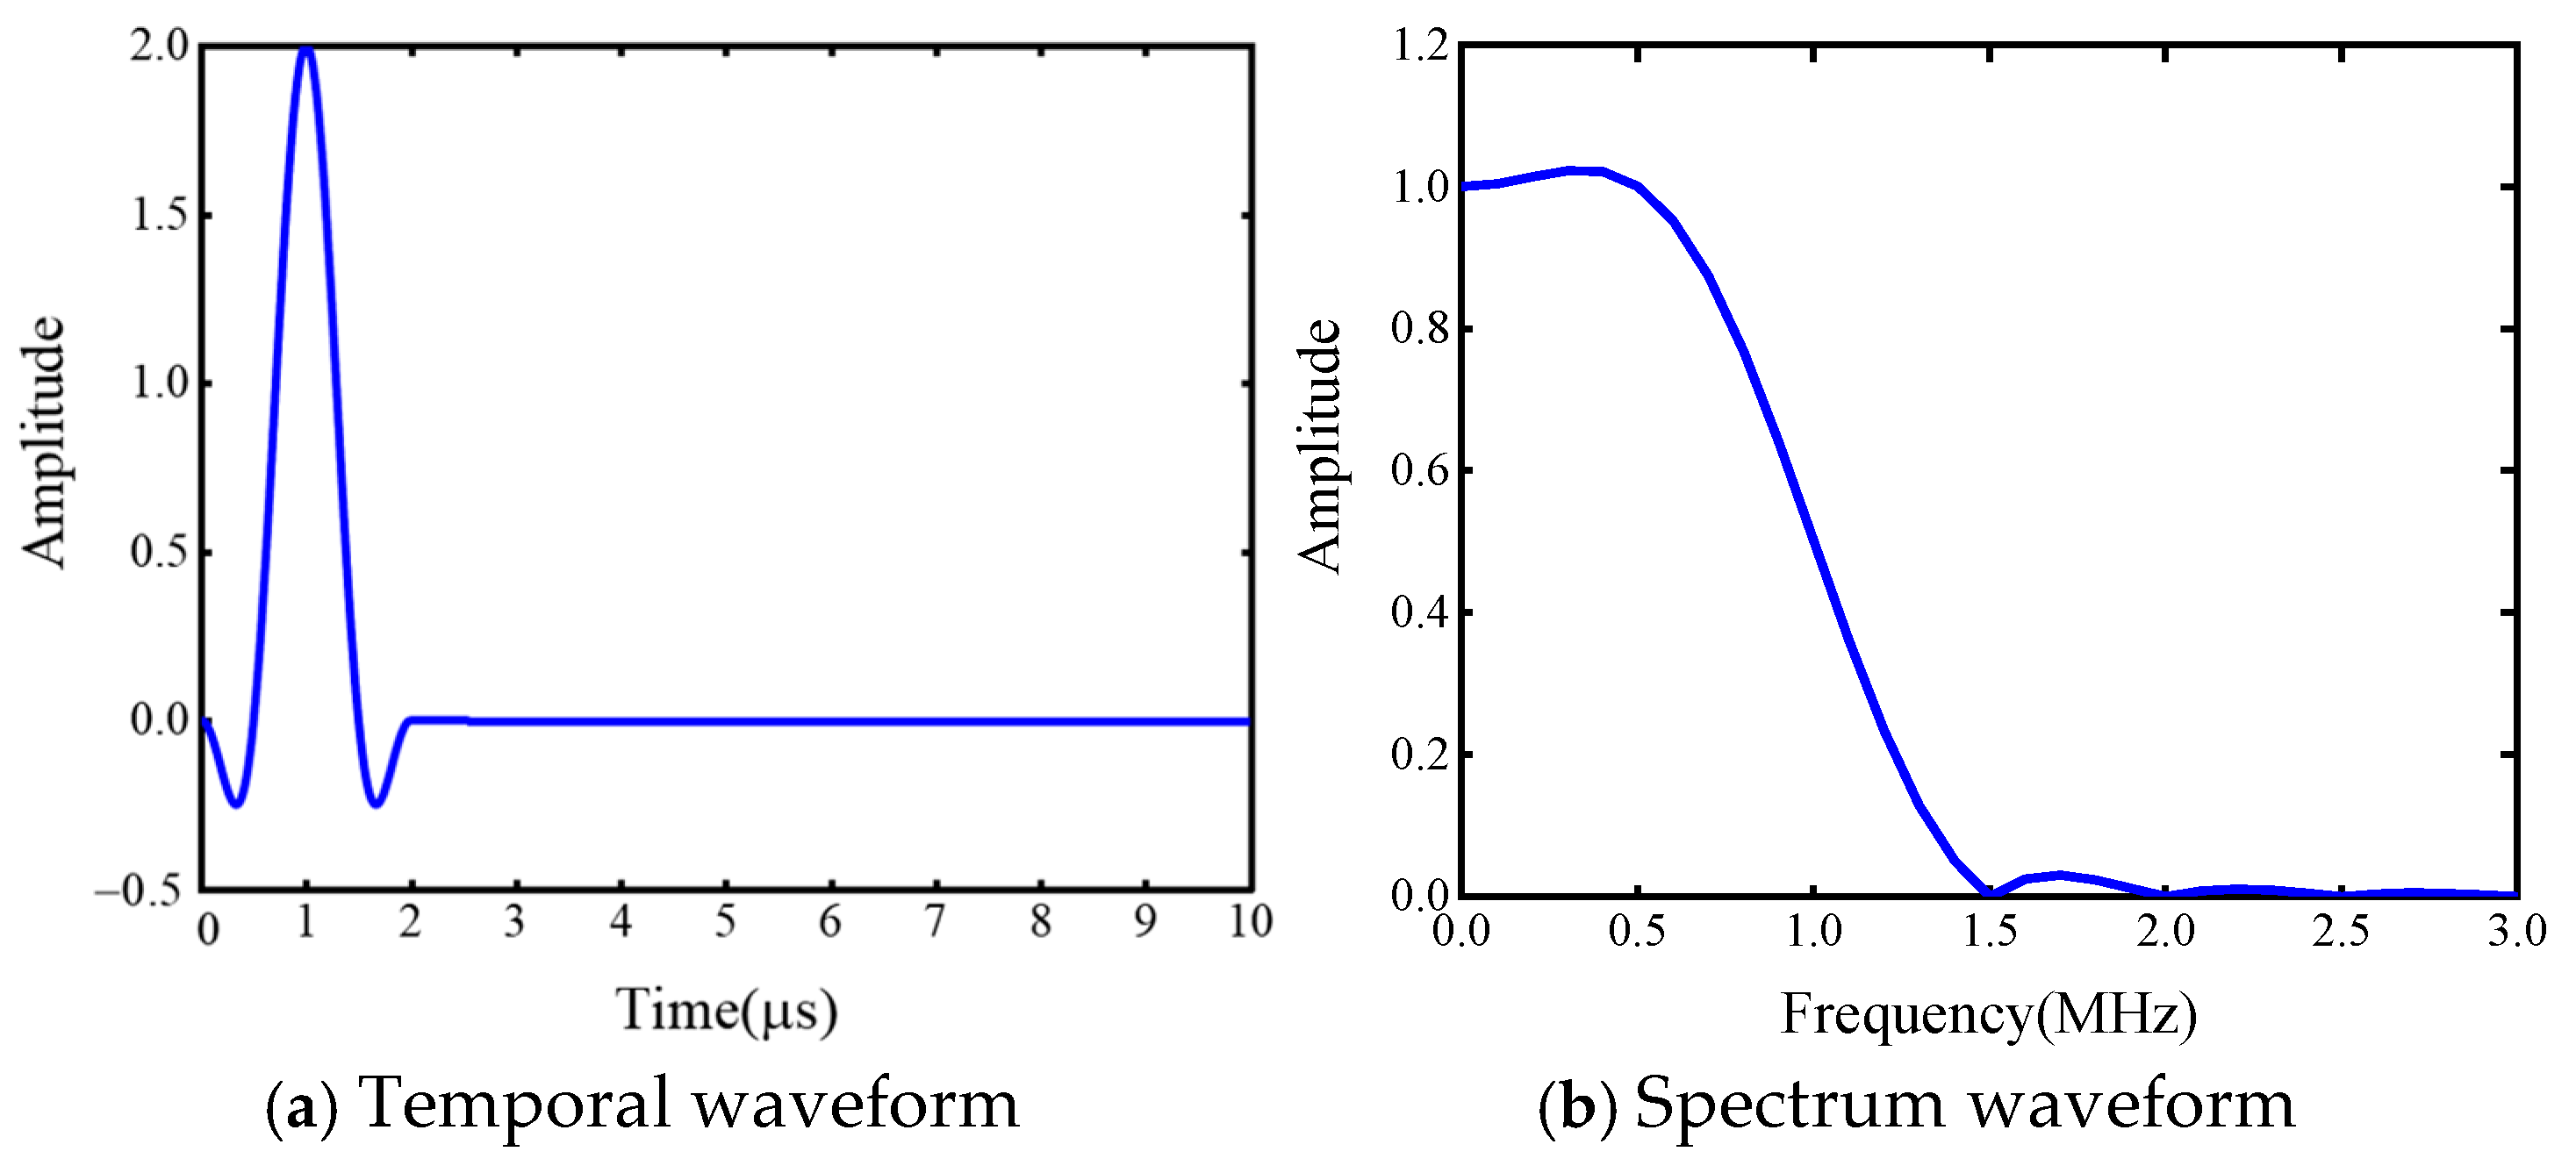
Since the steel strand is a spatial spiral structure, in practical engineering applications, extrusion and friction will occur when the two ends of the steel strand are subjected to tension, so it is necessary to simulate the contact relationship between the steel wires inside the steel strand. The finite slip surface-to-surface contact is used to simulate the extrusion and sliding friction between steel wires when the steel strand is subjected to axial tension, and the ‘penalty’ contact method is used to ensure that different steel wire units are not interconnected. The contact between the steel wires is set as the hard contact in the normal direction of the two contact surfaces, the tangential friction contact is set and simulated by the ‘penalty’ friction formula, and the friction coefficient between the steel wires is 0.6 [28]. In the actual steel strand tensioning process, because the peripheral steel wire at both ends of the steel strand is clamped by the anchor, the internal steel wire will be elongated at the same time. In this paper, simulation modeling simplifies this process as all steel wires at one end of the model are completely fixed, that is, there is no displacement and rotation, and all steel wires at the other end only release axial displacement. The first static analysis only simulates the process of steel strand under the action of axial tension, and the tension is applied when the axial displacement is lifted. The second dynamic analysis simulates the wave propagation process when the steel strand is subjected to a stable axial force. The Ricker wavelet with a broadband and a concentrated frequency is applied at the tension loading end, and the amplitude spectrum of the waveform is asymmetric. At the same time, its spectrum is a smooth single-valued curve, and the frequency will decay quickly within a certain range. Therefore, it is used for the excitation of structural modal signals. The time-frequency domain diagram of the excitation signal is shown in Figure 4. The peak frequency of the signal is close to 1.4 MHz, and the frequency band is mainly in the range of 0~2 MHz.
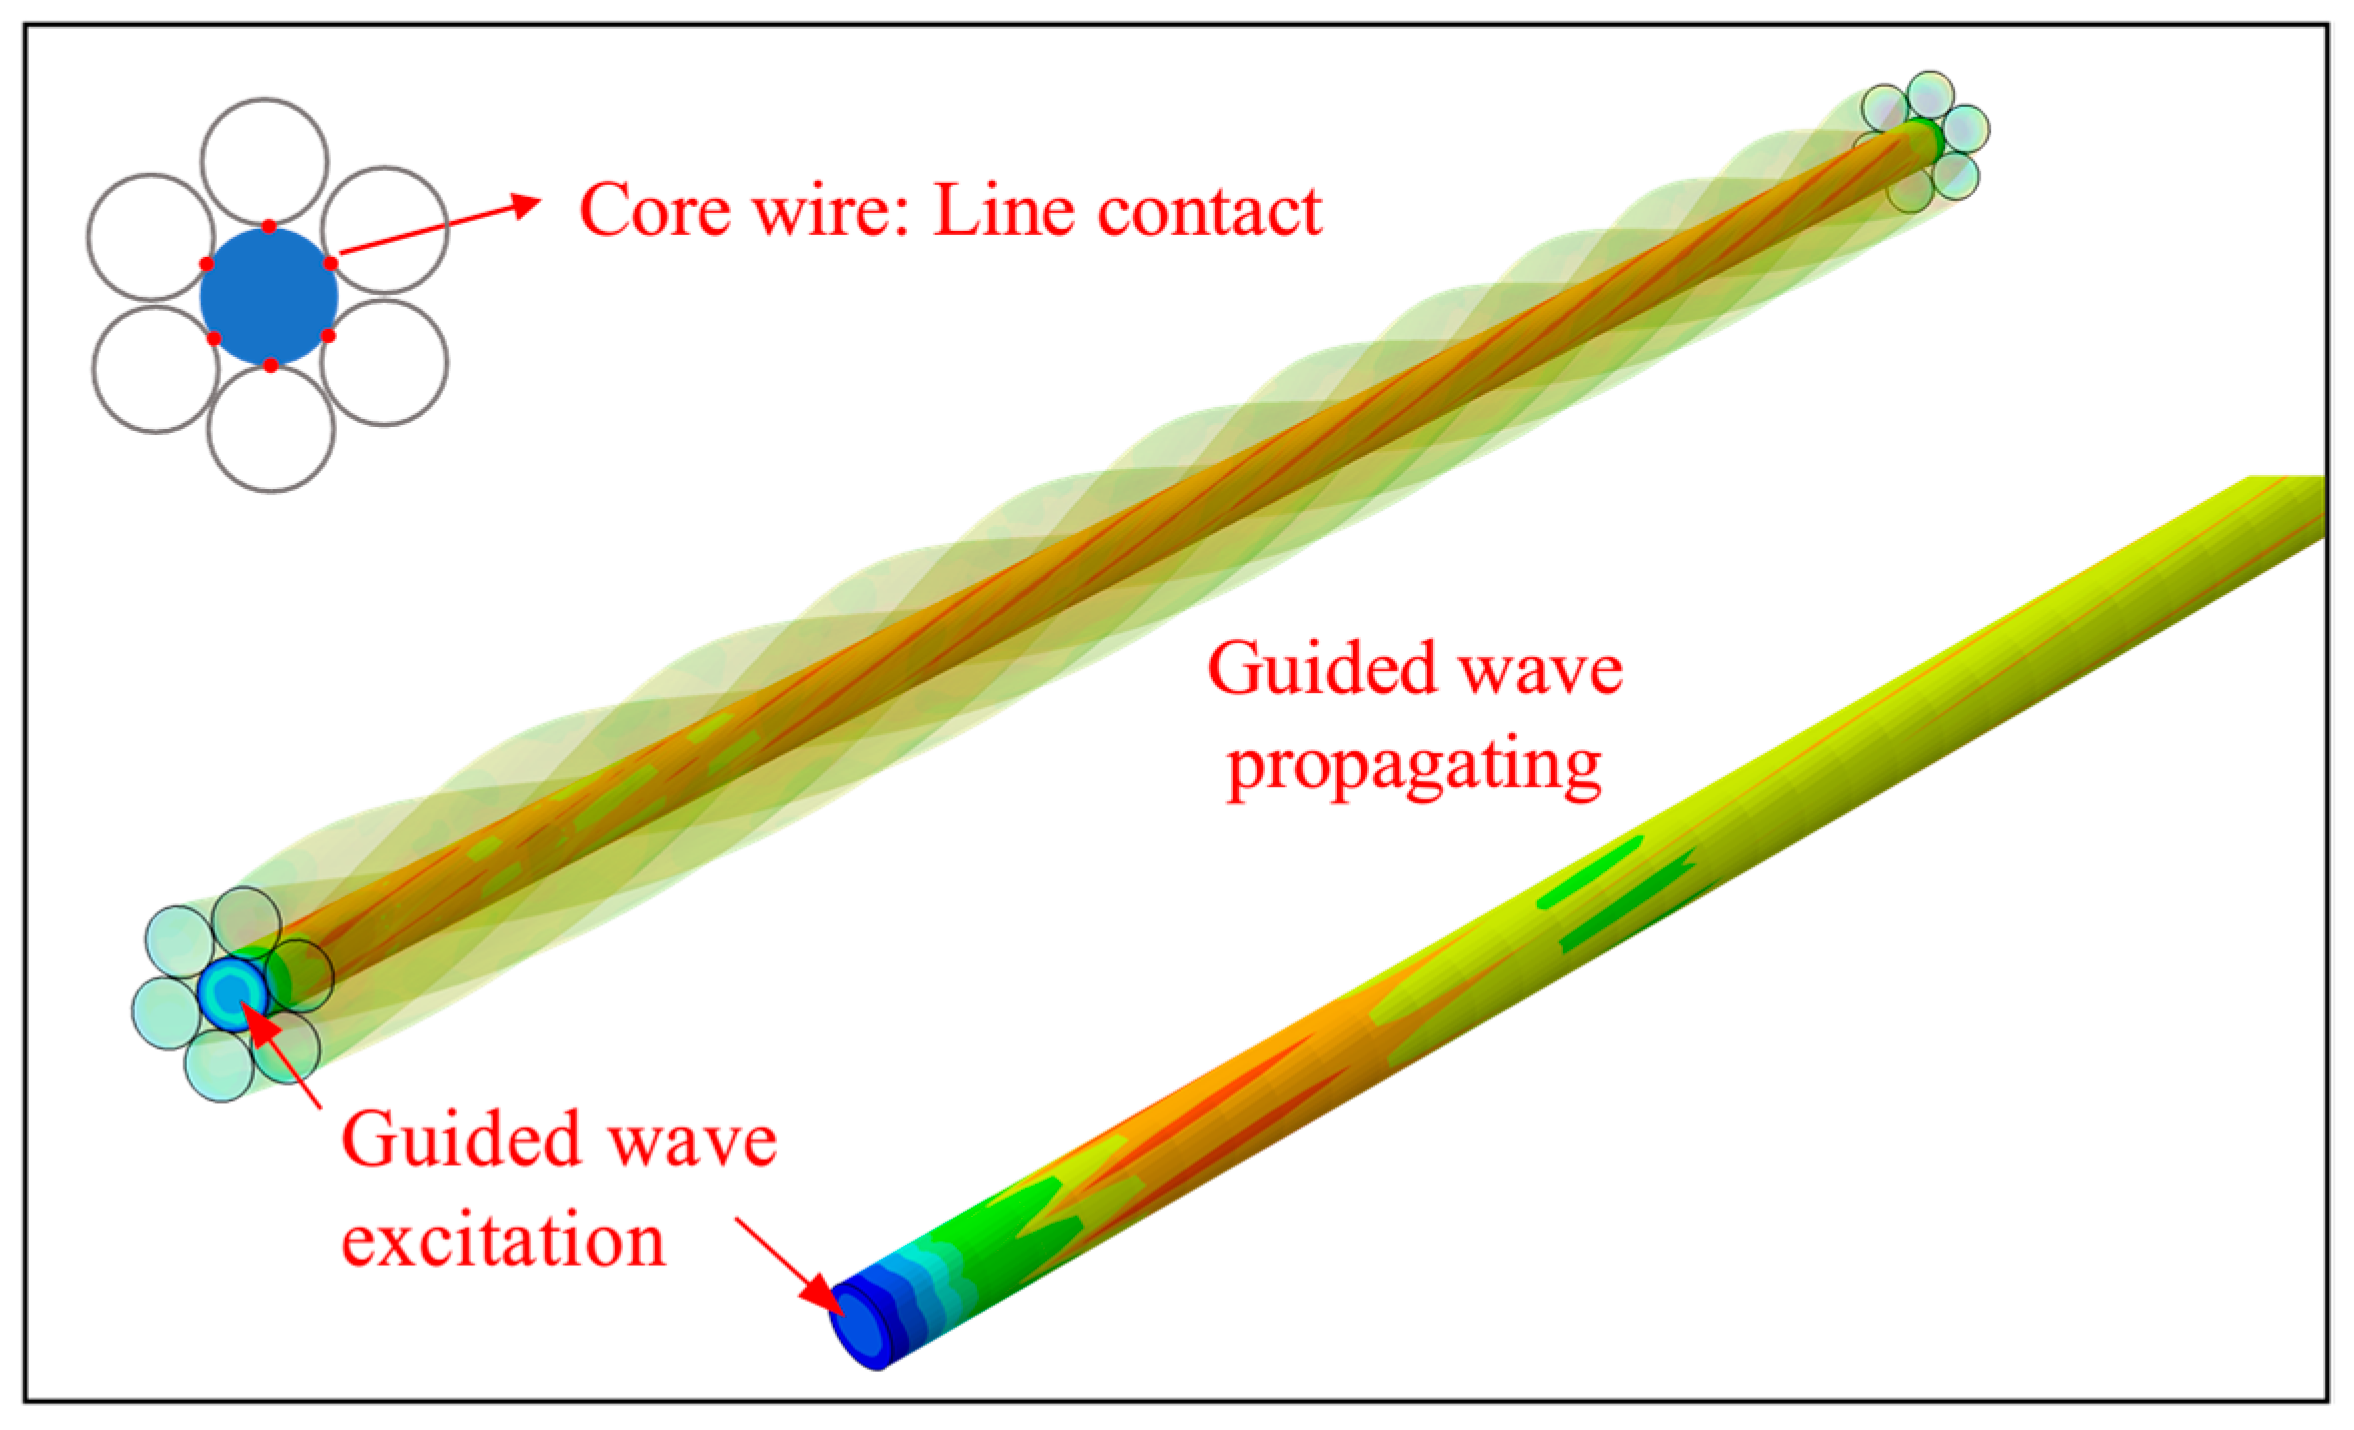
Figure 5 shows the Mises equivalent stress cloud diagram of the steel strand at the end of the 60% UTS loading stage. The figure shows that axial tension makes the wires contact with each other along the central axis, and the stress concentration phenomenon appears at the junction of the central wire and the surrounding helical wires, which is presented in the form of a red curve. At the same time, the excitation signal in the cloud image is expressed as an equal interval wavelet packet, and the ultrasonic wave excited from the end face of the central steel wire will continuously leak to the peripheral steel wire during the propagation process.

3.2. 2D-FFT Signal Analysis

Spatial discretization requires multiple equidistant measurements at a sufficiently small distance to capture the minimum wavelength of interest. The acceleration time history signals of 1000 nodes in the FEM are extracted from the wave propagation path to form a time-space matrix h ( t , x ) , and the dispersion curve in the excitation frequency range can be obtained by 2D-FFT [29]. Figure 6 presents the normalized signal amplitude plots of transient acceleration signals at three different locations of the steel strand core wires. It can be observed from the figure that the presence of multimodal superposition prevents modal identification based on time domain signals.
Fourier transform is a conventional method for analyzing time domain signals, and the two-dimensional Fourier transform is an effective method to analyze signals in the time-space domain by directly extending the one-dimensional Fourier transform to multi-dimensional signals. Essentially, it is a spatial Fourier transform based on the time Fourier transform. Through the two-dimensional Fourier transform, the waves coupled in the time domain signal can be separated from each other in the frequency-wavenumber domain to achieve the purpose of waveform decoupling. At the same time, the dispersion phenomenon of each mode of ultrasonic guided wave can be obtained, which is suitable for analyzing multimode dispersion signals. The advantage of this method is that different modes can be easily distinguished in the wavenumber-frequency domain because each mode can be isolated by its wavenumber and frequency.
The one-dimensional Fourier transform is extended to the two-dimensional Fourier transform, which is used to analyze the space-time wave field and obtain the guided wave characteristics in the frequency-wavenumber domain. From the perspective of wave propagation, the two-dimensional Fourier transform maps the time domain signal to the signal H k , f in the wavenumber k-angular frequency ω domain, and the two-dimensional Fourier transform is expressed as:
H k , f = + + h t , x e i k z + ω t d x d t
where h(t, x) is the time domain signal of each equidistant point on the surface of the bar. According to the above transformation, the time-space domain signal can be converted into a frequency-wavenumber domain signal. In the actual calculation, the discrete two-dimensional Fourier transform is used. Several equidistant signal acquisition points are set at the signal-receiving end, and the time–space matrix h(t, x) is formed by recording the time domain signal at the same time. The essence of the two-dimensional Fourier transform is to perform two one-dimensional Fourier transforms, and the implementation process is to perform one-dimensional Fourier transform on the time domain signal of each equidistant signal acquisition point to obtain the frequency spectrum of each position and form the frequency-space matrix Ht(t, x). Then the frequency is fixed, and the space vector at each frequency is subjected to a one-dimensional Fourier transform to form the frequency-wavenumber moment [H(f,k)]. The discrete calculation of the two-dimensional Fourier transform is as follows:
H k , f = n x = 1 N x n t = 1 N t h ( n x , n t ) e i ( k n x + ω n t )
where Nx, Nt is the length of the sequence of discrete space and discrete time, nx is the sequence of discrete space, and nt is the sequence of discrete time. The frequency-wavenumber diagram can be obtained by projecting the obtained frequency-wavenumber matrix on the frequency-wavenumber plane.
From the definition of the discrete two-dimensional Fourier transform, it is known that the application of the two-dimensional Fourier transform requires discrete data in both time and space domains, so it is necessary to choose sampling rates in both space and time domains to avoid aliasing of frequencies and wave numbers. Therefore, spatial domain sampling and time domain sampling alike need to satisfy the Nyquist sampling theorem, otherwise signal aliasing will occur. The sampling theorem states that when the sampling frequency of a signal is greater than twice the frequency of interest of the original signal, the original signal can be faithfully recorded. When sampling in space, the sampling interval should not exceed half of the shortest wavelength. However, in practical operation, the sampling frequency needs to be five times of the value to effectively record the original signal. In this paper, when using two-dimensional Fourier transform for steel wire rope, the spacing between adjacent signal acquisition points should also satisfy the sampling theorem.
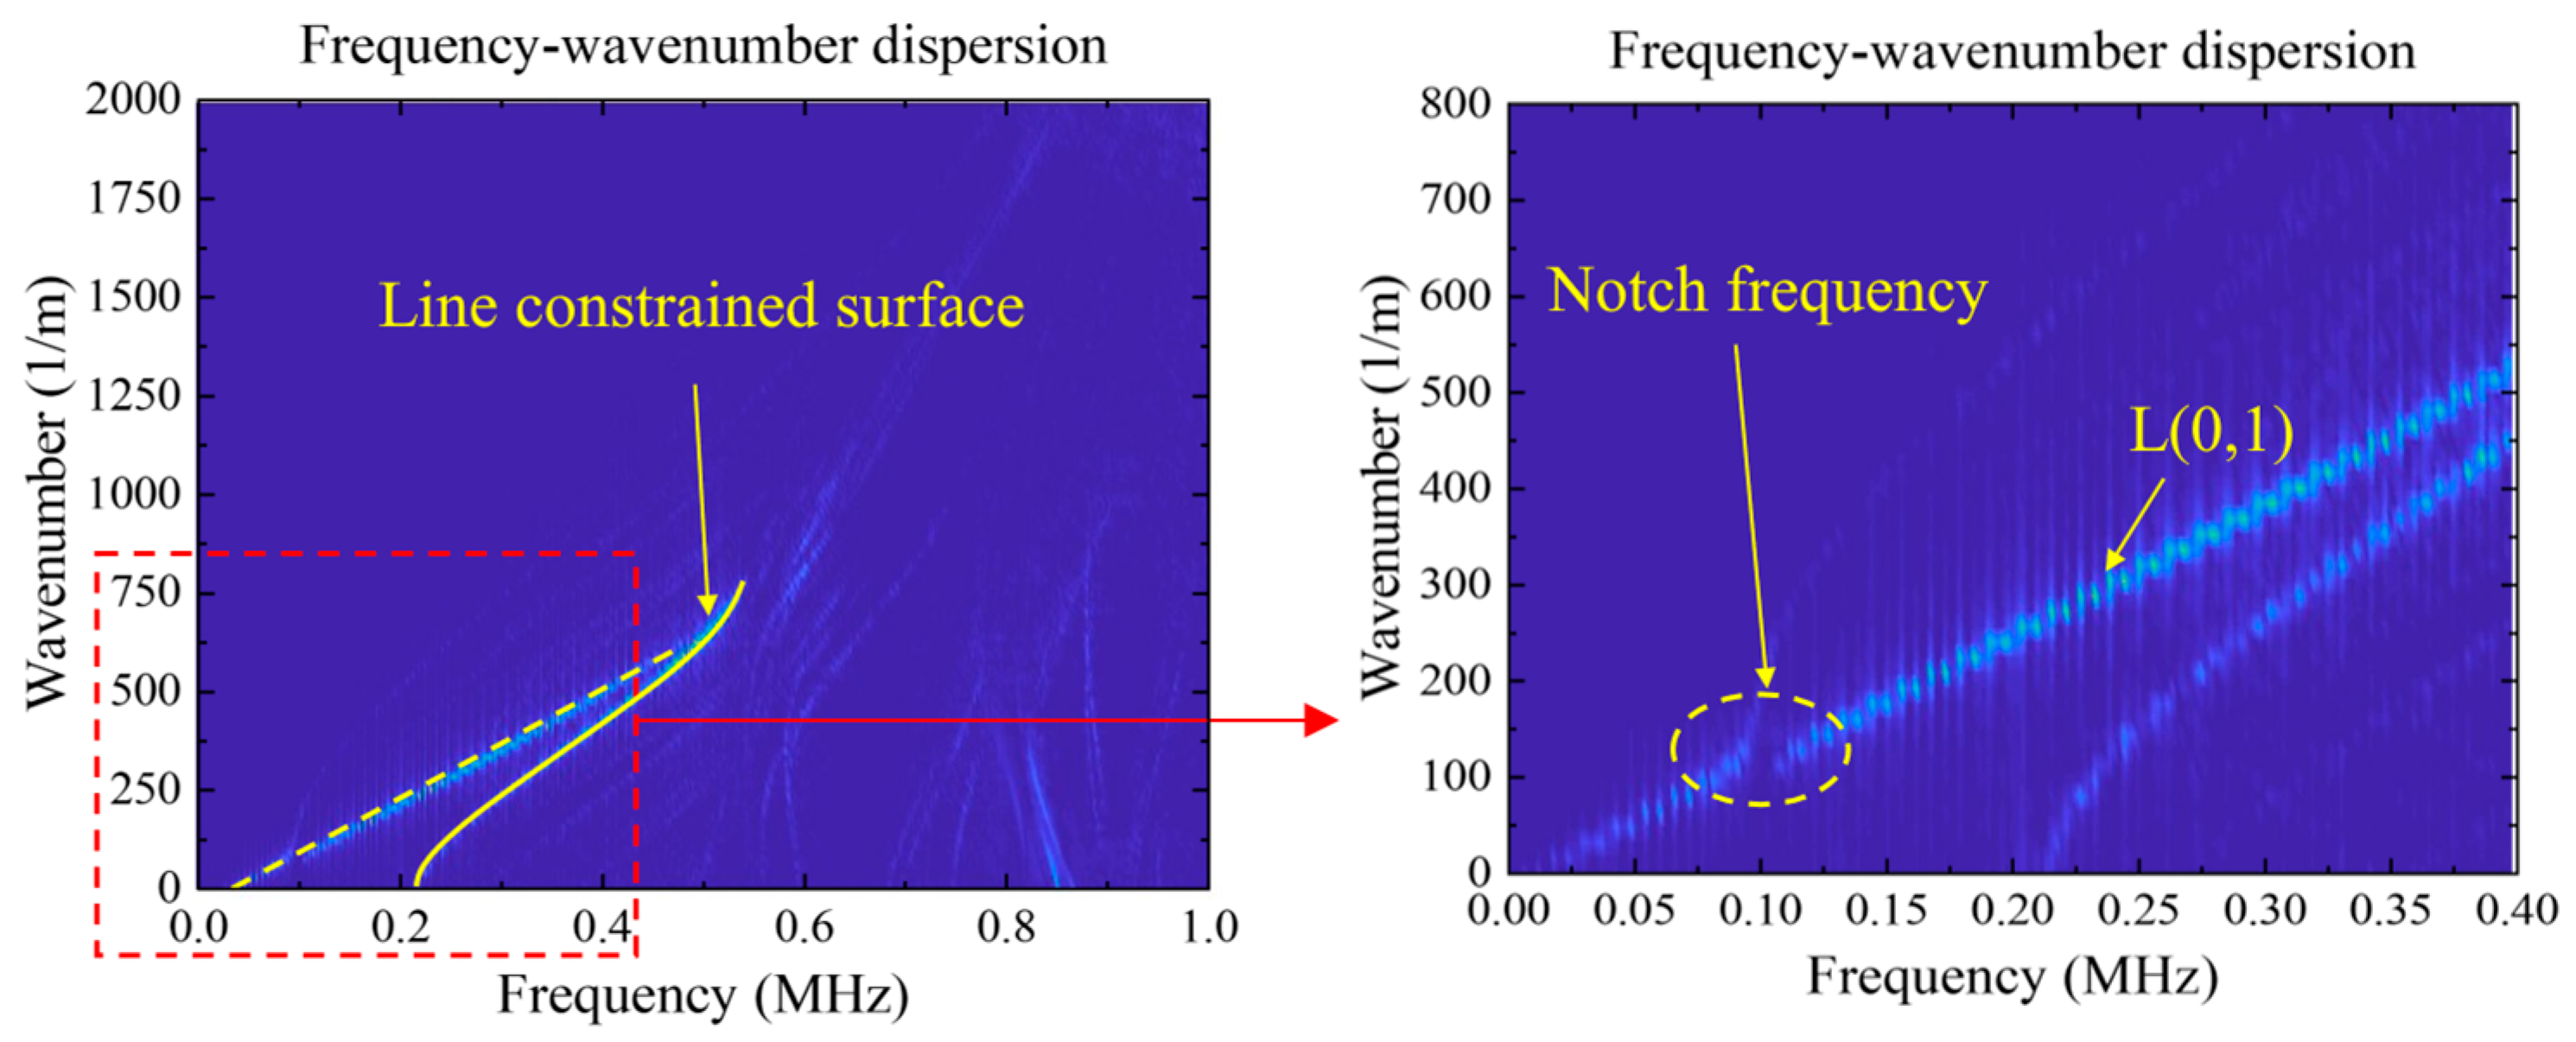
A two-dimensional Fourier transform is performed on the time-space matrix composed of the axial transient acceleration signals of each point on the central round bar of the steel strand, and the frequency-wavenumber diagram is obtained, as shown in Figure 7. Under the condition of applied axial force, due to the influence of inter-wire contact from the surrounding steel ropes, the central round bar is subjected to the torsional force exerted by the surrounding steel ropes, indicating that the behavior of guided wave propagation under loading force is different. From the figure, it can be seen that the longitudinal L(0,1) mode seems to carry most of the energy, while many other modes also appear, and these modes have dispersion characteristics different from those of a single wire waveguide. As the boundary constraints increase, the dispersion curve of the L(0,1) mode of the stranded steel wire shifts toward the high-frequency part, which means that the change in boundary conditions theoretically leads to a change in the wave propagation. It can be concluded that the loaded steel strand exhibits very complex dispersion characteristics of different waveguides and, therefore, cannot be represented by a simple circular rod model.
The regular movement of the dispersion curve indicates that the characteristics of the guided wave are influenced by the interfacial tension caused by contact effects. However, due to the limitations of the actual sensor installation position, it is difficult to apply this influence to the evaluation of prestress using 2D-FFT. Additionally, using directly detected physical quantities such as velocity and frequency, they vary relatively weakly with tension. Therefore, further signal processing techniques are needed to simplify operation and improve recognition capability. Further observation of the dispersion characteristics of guided waves in the L(0,1) mode shows that there is a gap-like region at a frequency of about 100 kHz. Kwun et al. [12] called this frequency band as notch frequency, which points out that there is an approximate exponential change between notch frequency and prestress, and a large number of related studies have proved the accuracy of the results. Therefore, the notch frequency can be considered a parameter to identify the prestress of steel strands.

3.3. Simulation Results

In multi-strand steel cables, the adjacent wires are not in the ideal point contact state, but they form a finite-width surface contact under the action of force. The contact half-width (denoted by α) is a key geometric parameter used to describe this surface contact, which is defined as half of the maximum width of the contact band in the cross-section. This parameter not only reflects the contact condition between steel wires but also directly affects the propagation characteristics of guided waves in cables. Previous studies have shown that changes in the contact half-width change the coupling stiffness between the steel wires, thereby affecting the shape of the dispersion curves and shifting the position of the notch frequency. Therefore, accurately determining the contact half-width under different tensile loads is of great significance for elucidating the mechanism of notch frequency variation.
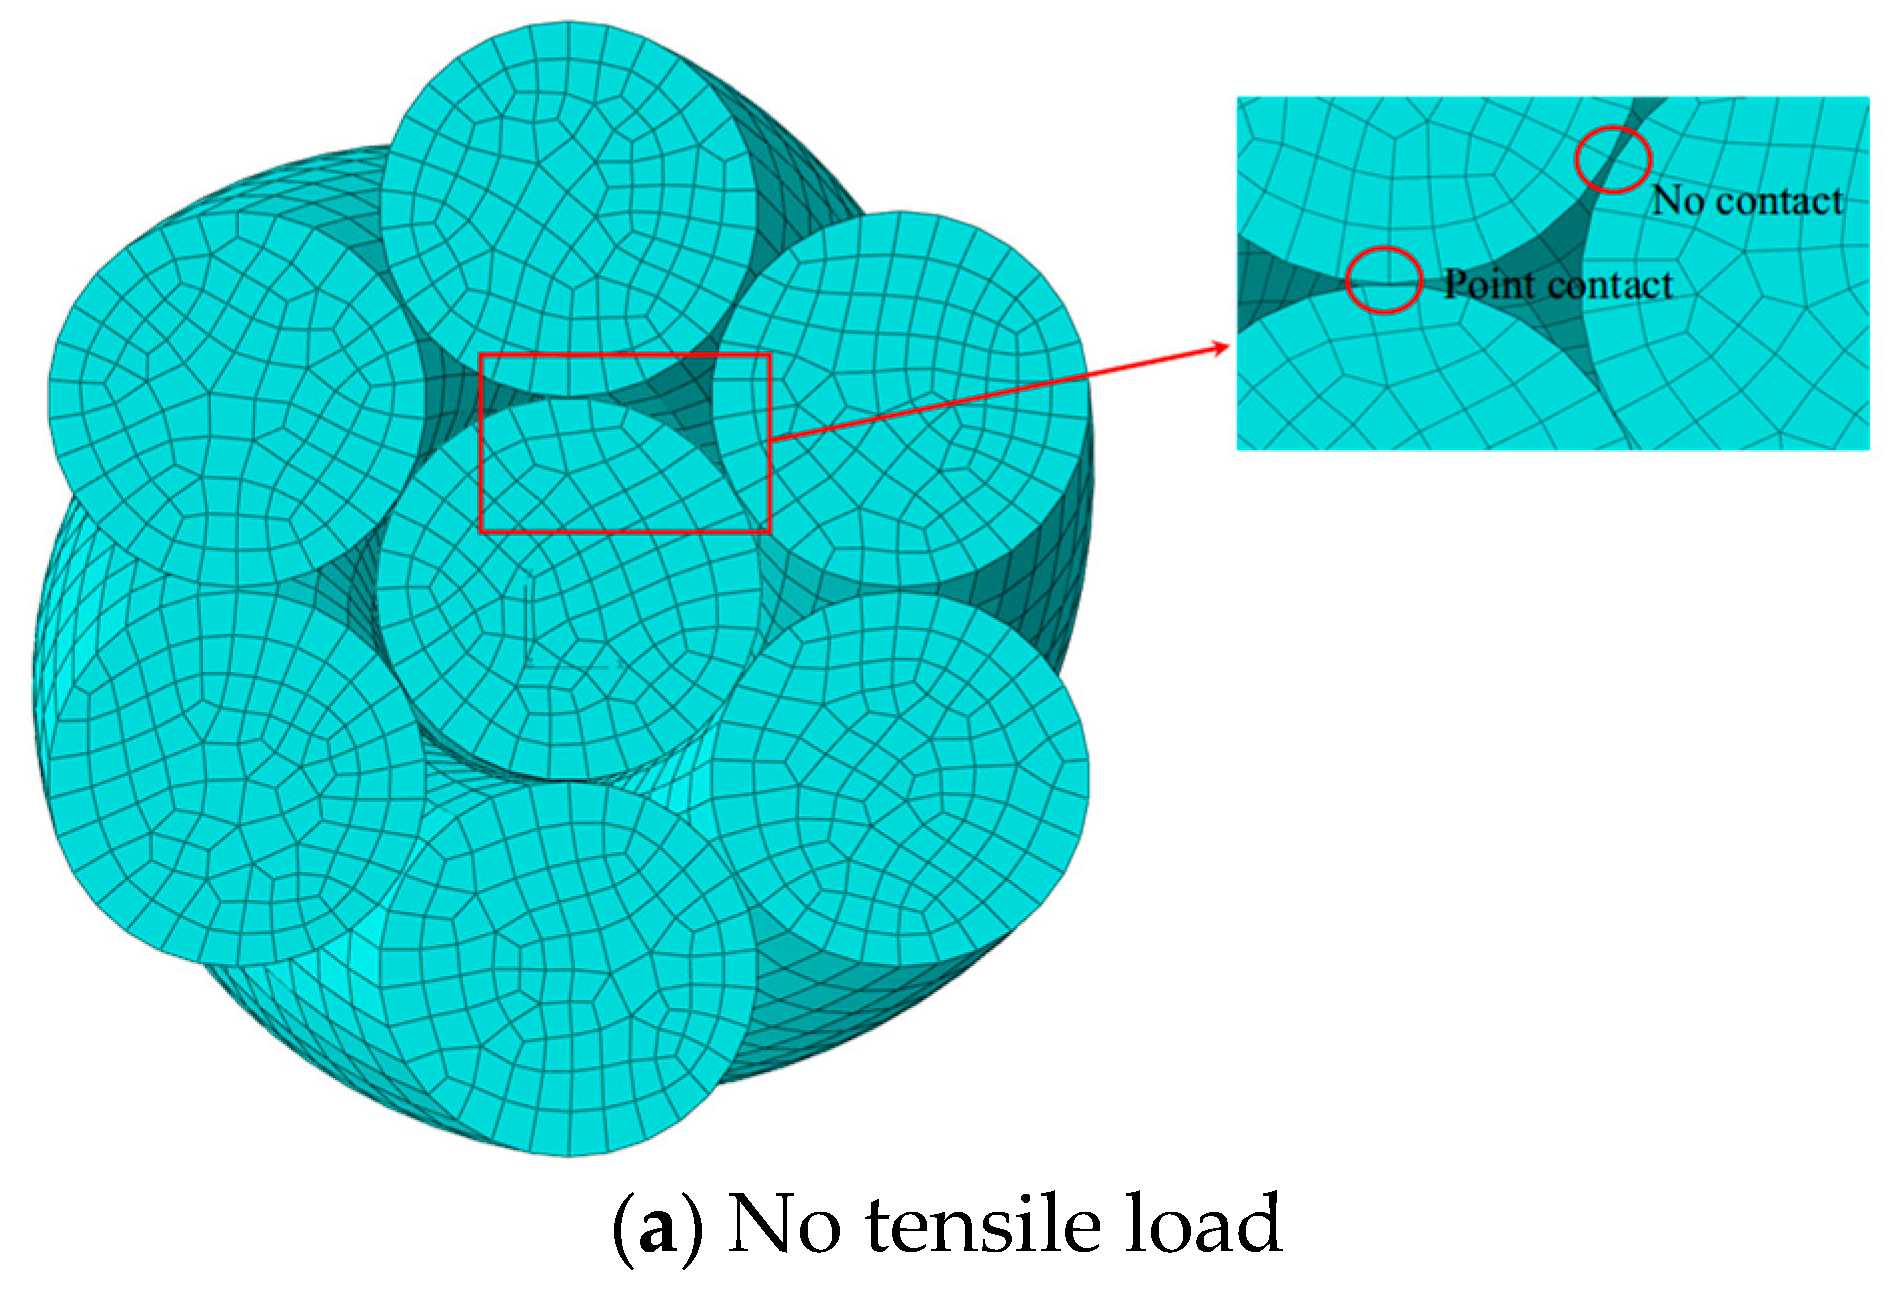
In this study, a three-dimensional FEM of a seven-wire steel strand is established using ABAQUS 6.14, with one end fixed and the other end subjected to an axial tensile load. After loading, the contact state of the cross-section of the strand is extracted. By using the cross-section contact analysis function, the contact half-width generated under different load conditions can be measured, thus providing a basis for establishing the relationship between tensile load and notch frequency. Figure 8 shows the cross-section contact of the steel strand under different tensile loads. In the absence of tensile load, the outer steel wires are in point contact with the central wire, and there is no contact between the adjacent outer wires. In the case of tension, the outer steel wires deform radially and form tangentially distributed surface contact with the central wire, and the contact half-width changes significantly with the change of load. These geometric differences provide key parameter support for subsequent notch frequency analysis.
Each size of the steel strand has a stable notch frequency range. The simple estimation formula of notch center frequency is as follows [30]:
f n = 0.33 c T 2 π r p
where f n is the central frequency of the notch frequency, r p is the radius of the wire.
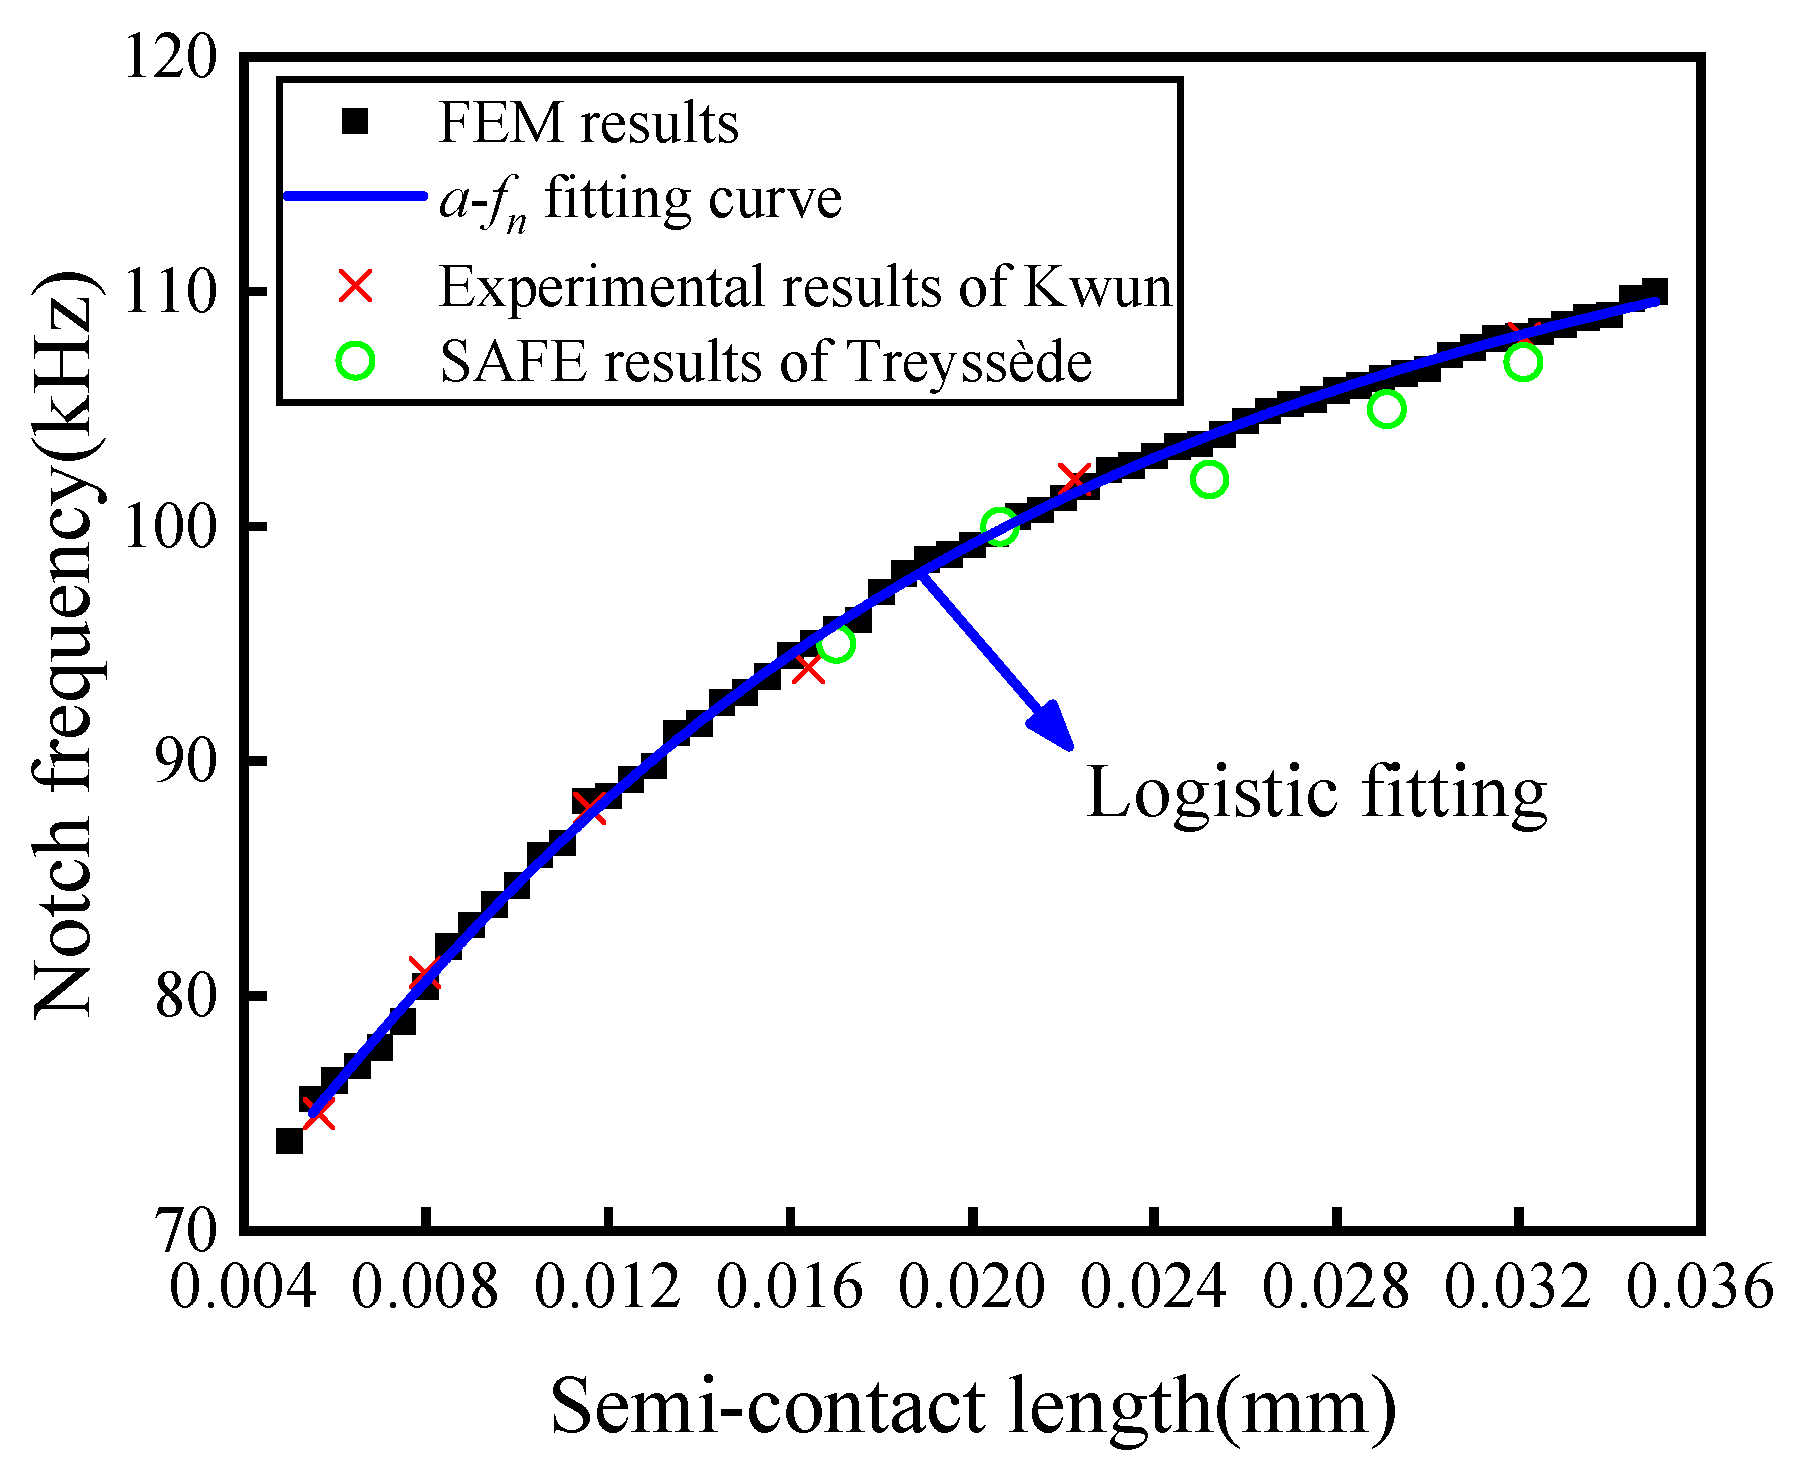
The premise of studying the variation law of center notch frequency with tensile force is to clarify the relationship between contact half-width and notch frequency. Taking the steel strand with a radius of 12.7 mm as the research object, the contact half-width a of the steel strand is plotted as the relationship with the center notch frequency f n calculated by the FEM, as shown in Figure 9. The experimental results provided by Kwun et al. [12] and the SAFE results of Treyssède et al. [20] are converted to calculate the tension and contact half-width, and the corresponding center notch frequency values are marked in the figure. The finite element calculation results are in good agreement with the numerical and experimental results in the literature. It is found that the notch frequency increases with the increase in the contact half-width and changes approximately logarithmically. By fitting the center notch frequency data to the contact half-width, the function relationship between the center notch frequency of the steel strand guided wave and the contact half-width is given in Equation (12). The determination coefficient R2 of data fitting is greater than 0.95, which means that the function can accurately describe the relationship.
f n = 123.82 59.84 1 + a 0.0155 1.43 ,   R 2 = 0.997
As shown in Figure 9, the contact half-width between adjacent helical wires increases with the increase in axial tension, which indicates that the contact area between wires increases and the mechanical coupling is stronger. This change directly affects the stiffness distribution in the cross-section of the wires, thus changing the dispersion characteristics of the L(0,1) mode. The change of the dispersion curve will change the destructive interference conditions leading to the notch frequency. Therefore, the observed notch frequency variation can be physically explained by the combined effect of the axial load and the resulting change in inter-wire contact state.
The axial force significantly affects the contact half-width α, which is due to the increase in the pressure between the wires in the tensile state. The FEM is initially a seven-wire steel strand configuration without stress, at which time the initial contact is minimal. Then, the static analysis step is carried out, and the tensile load is applied to simulate the axial force of 50 kN to 110 kN, with an increment of 30 kN as the predefined stress field. This process calculates the deformed geometry and the resulting contact half-width α according to the Hertzian contact theory, where α is proportional to the square root of the applied load and the wire stiffness (as approximated in Equation (12)). Subsequently, the updated contact half-width values (for example, for the 12.7 mm steel strand, from 0.15 mm at 50 kN to 0.22 mm at 110 kN) are incorporated into the dynamic explicit model for ultrasonic guided wave propagation to ensure the real simulation of inter-wire interaction without assuming constant contact.
This force-dependent modeling method can accurately predict the notch frequency shifts. As shown in Figure 10, for a fixed strand diameter of 12.7 mm, when the axial force increases from 50 kN to 110 kN, the notch frequency increases from 98.88 kHz to 104.67 kHz. The reason for this trend is that the higher tension increases the contact half-width and enhances the destructive interference of the L(0,1) mode, thus pushing the attenuation band to a higher frequency.
In addition, the influence of geometric parameters under constant load is also shown in Figure 11, which shows the notch frequency spectrum of strands with different diameters (12.7 mm, 15.2 mm, and 17.8 mm) under fixed axial force of 30 kN. As the diameter increases, the notch frequency decreases from 99.88 kHz (12.7 mm) to 70.09 kHz (17.8 mm), reflecting a decrease in the effective stiffness and a change in the effect of the helix pitch on the contact half-width. The larger diameter leads to a wider contact area (for every 2.5 mm increase in diameter, α increases by about 20%), thereby reducing the frequency band of mode interference.

4. Experimental Verification

To verify the reliability of the finite element simulation results and further investigate the evolution of notch frequency in steel strands under different axial loads and geometric configurations, a series of controlled laboratory experiments were conducted. Three types of commercial seven-wire prestressed steel strands with varying diameters were tested. Ultrasonic guided wave signals were introduced to measure the notch frequency under each loading condition, and its correlation with structural geometry and axial tension was analyzed. The experimental results serve to validate the dispersion behavior observed in simulations and demonstrate the potential of notch frequency as a key parameter for structural health monitoring.

4.1. Experimental Material

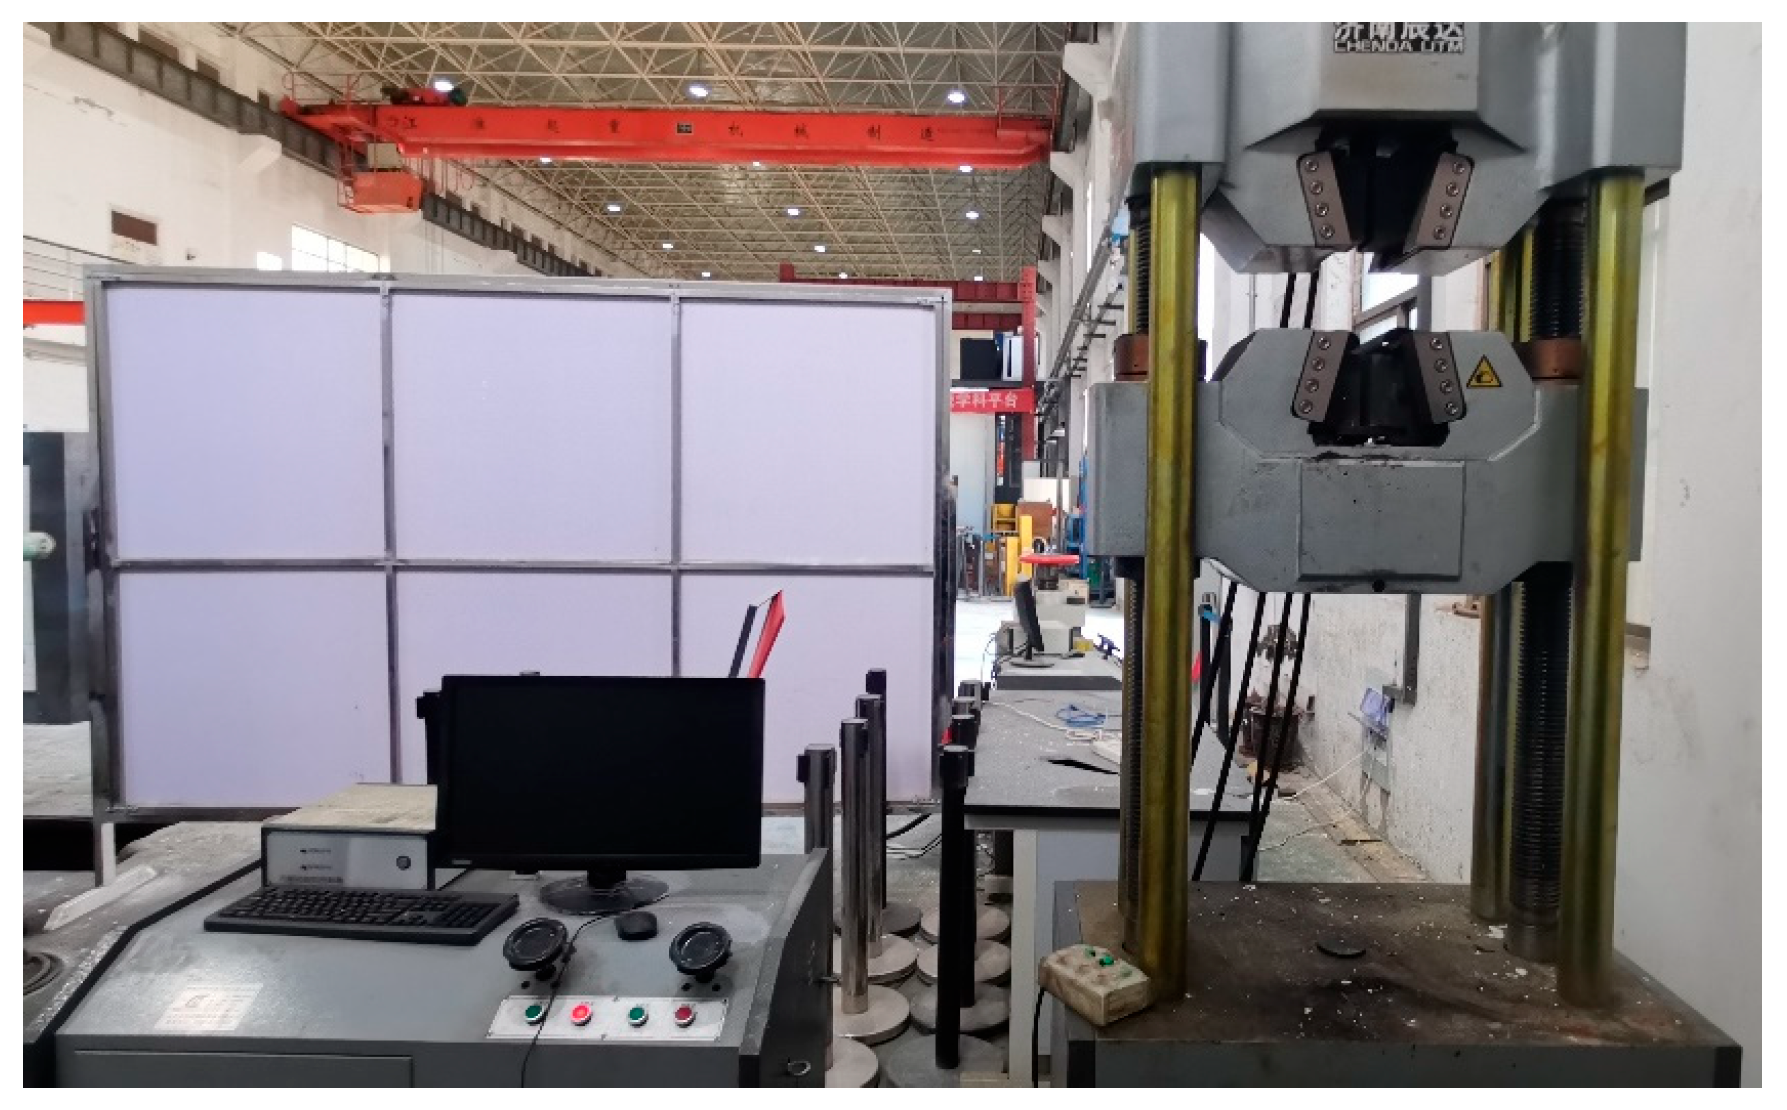
Experimental setup: Three types of prestressed steel strands were selected for testing, with nominal diameters of 12.7 mm, 15.2 mm, and 17.8 mm, respectively. Each specimen was cut to a length of 400 mm, and both ends were tightly gripped using high-strength hydraulic anchors to prevent slippage during loading. The strands were mounted on a universal testing machine equipped with a fully digital control system, as shown in Figure 12. To ensure quasi-static loading conditions and avoid transient stress effects, the axial tension was applied incrementally from 50 kN to 110 kN in steps of 30 kN, and a stabilization period of 5 min was maintained at each loading stage before signal acquisition.
Both ends of the steel strand are polished as flat as possible, and then a piezoelectric ceramic (PZT) is bonded with an epoxy resin. The PZT is connected to the oscilloscope, and then each wire is tapped gently to ensure that the vibration signal of each wire can be converted into a displayable electrical signal through the PZT. The transmitting transducer was driven by a high-frequency function generator amplified by a broadband power amplifier, while the receiving transducer was connected to a high-speed oscilloscope. The transducers were aligned to preferentially excite the L(0,1) longitudinal guided wave mode, which is known for its strong sensitivity to axial tension and geometric features. The partial experimental setup is shown in Figure 13. Table 2 shows the technical specifications of DG-812 waveform signal generator, and Table 3 lists the performance parameters of PZT-5H piezoelectric ceramic.
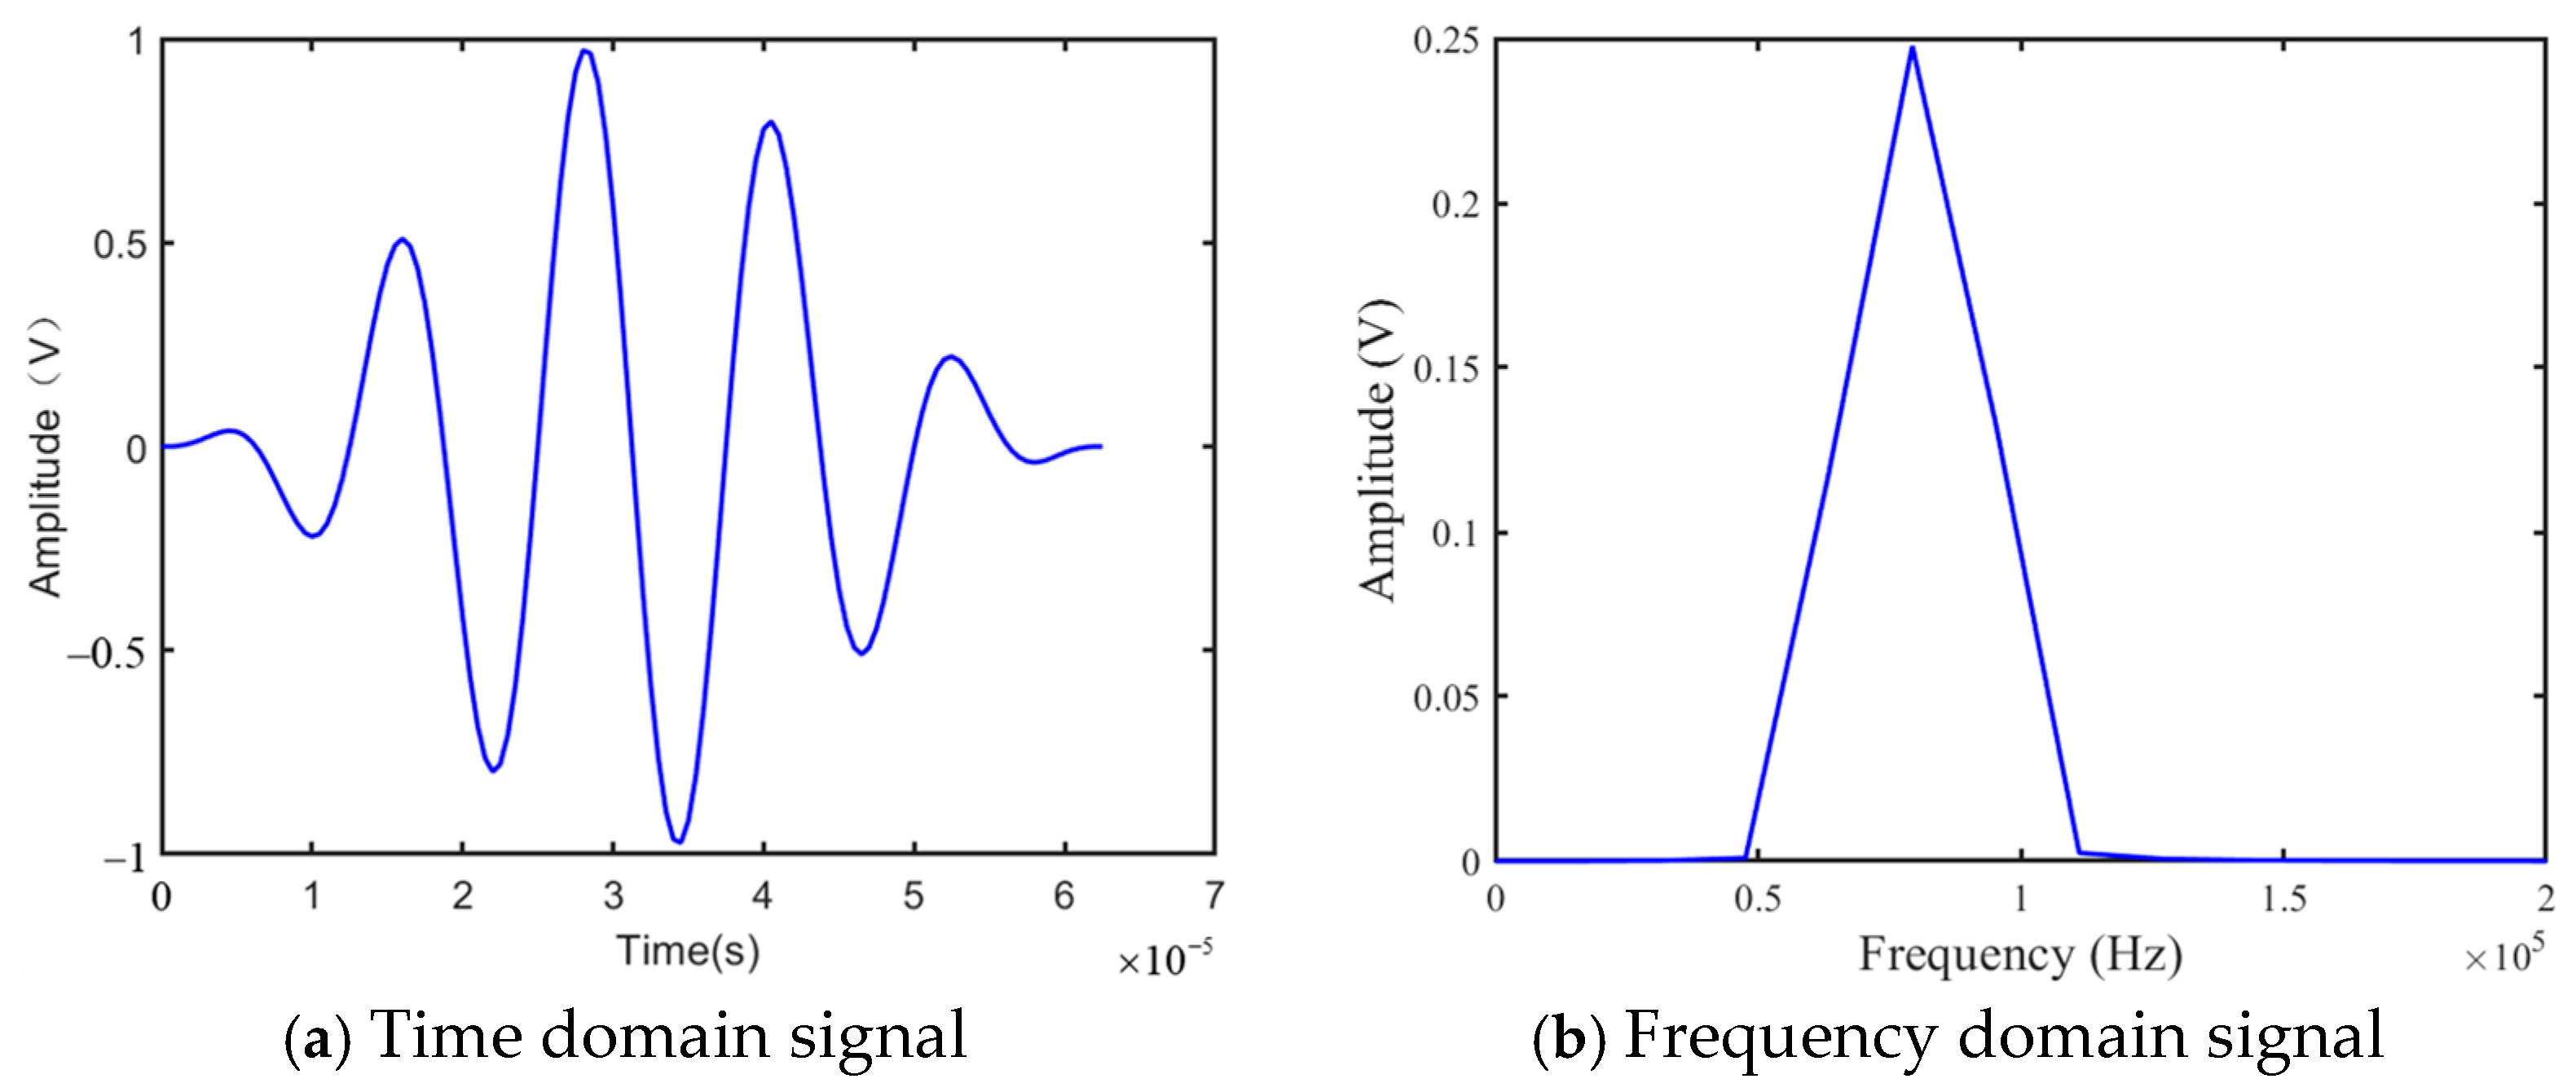
To improve frequency selectivity and avoid multimode interference, the excitation signal was designed as a five-cycle sine wave modulated with a Hanning window, with a center frequency of 80 kHz, as shown in Figure 14. This configuration provides a narrowband response with minimal spectral leakage and effectively concentrates energy within the typical notch frequency range of the L(0,1) mode.
In order to ensure the repeatability of the experimental results, environmental factors and transducer alignment are carefully controlled. All tests are conducted in a temperature-controlled laboratory, where the temperature is maintained between 20~25 °C to minimize the effect of temperature on wave propagation. A digital thermometer is used to monitor the maximum temperature change of ±1 °C. By using a laser alignment system with an accuracy of ±0.5°, the small alignment deviation of the PZT-5H piezoelectric ceramic transducer directly attached to the central wire at both ends is offset, and the consistency of the excitation and reception of the L(0,1) mode is ensured. The influence of residual alignment deviation is further reduced by an average of 256 signal acquisitions, thereby improving the signal-to-noise ratio and stabilizing the spectrum response. The recorded time domain waveforms were subsequently transformed into the frequency domain via fast FFT for further analysis.

4.2. Experimental Result Analysis

The measured frequency spectrum of three steel strands with diameters of 12.7 mm, 15.2 mm, and 17.8 mm under a constant axial load of 80 kN is presented in Figure 15. In each spectrum, a distinct notch in amplitude is observed within the 70~105 kHz range, corresponding to the destructive interference of the L(0,1) guided wave mode. This notch represents a localized suppression of wave energy and serves as a stress-sensitive feature.
The experimental results clearly indicate that the strand diameter significantly influences the location of the notch frequency. Specifically, the 12.7 mm strand exhibited a notch near 101 kHz, while the 15.2 mm and 17.8 mm strands showed lower notch frequencies at approximately 87 kHz and 73 kHz, respectively. This trend can be attributed to the increase in cross-sectional stiffness and helix geometry with larger strand diameters, which alters the dispersion characteristics and results in a lower cutoff frequency for the L(0,1) mode. These findings confirm that the notch frequency is not solely dependent on axial tension but also strongly affected by geometric parameters, particularly the strand diameter. Therefore, notch frequency should be interpreted as a compound indicator reflecting both mechanical and structural conditions.
To validate the accuracy of the FEM in predicting notch frequencies of prestressed steel strands, guided wave measurements were conducted under nine different loading and geometric conditions. The experimental results were compared with the FE-simulated notch frequencies, as summarized in Table 4. Across all test cases, the FE results demonstrated excellent agreement with the measured data, with discrepancies within 3%. The maximum deviation was 2.94%, while the minimum was as low as 0.02%, confirming the reliability of the FE model in capturing the dispersion behavior of the L(0,1) mode under various mechanical and structural conditions.
A clear upward trend in notch frequency was observed with increasing axial tension, while larger strand diameters consistently exhibited lower notch frequencies under the same loading. For instance, at 80 kN, the strands with diameters of 12.7 mm, 15.2 mm, and 17.8 mm showed notch frequencies of 102.5 kHz, 87.3 kHz, and 73.2 kHz, respectively. This trend was well captured by the FE simulations, indicating that the notch frequency is jointly influenced by axial load and strand geometry. This trend reflects the complex interaction between mechanical loads and geometric properties. With the increase in axial tension, the increase in notch frequency is attributed to the increase in inter-wire contact pressure, which enhances the acoustoelastic effect and accelerates the dispersion of L(0,1) mode. On the contrary, the larger strand diameter reduces the notch frequency, because the contact area becomes wider, so that the wave energy is more effectively dissipated in the helical structure [20].
The error analysis of the notch frequency comparison in Table 4 is performed. For experimental measurements, the uncertainty estimation range is between ±1.5 and ±1.7 kHz, which is due to the signal-to-noise ratio, repeated measurements during 256 acquisition processes, and environmental factors controlled during the test (temperature change ±1 °C). For the simulation results, the uncertainty is estimated to be between ±0.7 and ±0.8 kHz, reflecting mesh sensitivity, parameter variation (contact half-width), and numerical convergence. Sensitivity analysis confirms that the discrepancy is less than 1% [13].
The observed correlation between notch frequency and axial tension shows that this method can be used to measure prestress loss. By monitoring the change of notch frequency for a long time and calibrating with the known loss model, the method can detect the decrease in tension, such as a change of about 6 kHz observed between 50 kN and 80 kN, as shown in Table 4.
Moreover, the FE model effectively accounted for the impact of helical geometry on guided wave propagation, including changes in wave dispersion due to inter-wire contact and strand structure. These results support the use of finite element simulations as a robust tool for notch frequency prediction, parameter identification, and damage assessment in structural health monitoring of cable-supported systems.

5. Conclusions

In this study, the propagation of UGW in the prestressed steel strand is simulated by FEM. The model effectively captured the nonlinear relationship between the L(0,1) mode notch frequency and multiple influencing factors, including axial force and strand diameter. The reasons and influencing factors of UGW missing frequency band change in steel strands under tension are studied. Through the simulation of different sizes of prestressed steel strands, the obtained UGW notch frequency shifts to a smaller range with the increase in diameter, indicating that the larger the helical wire size, the greater the effect of reducing the notch frequency. The experimental validation confirmed the strong correlation between notch frequency and both mechanical and geometric parameters of the strand. The frequency spectrum obtained from guided wave measurements was consistent with FEM simulations, and the observed exponential relationship between notch frequency and axial tension further validated the physical basis of the proposed method.
The proposed method has great potential in practical applications for structural health monitoring of cable-supported structures. In these structures, real-time detection of notch frequency change can indicate prestress loss or fatigue damage. This method can control the maximum deviation between the simulation results and experimental results within 3%, which indicates that it is reliable in field implementation, and may be integrated with the automation system for continuous monitoring. In addition, the sensitivity of this method to environmental factors such as temperature fluctuation and humidity requires attention, and calibration adjustment may be needed.

6. Discussion

Preliminary analysis shows that the change in notch frequency can be used to measure the prestress loss caused by relaxation or creep. However, its application to loss prediction requires verification under dynamic loading conditions, taking into account environmental factors such as temperature and corrosion. Future work can be focused on the development of a calibration model to quantify the magnitude of the loss based on long-term notch frequency data.
Moreover, future work can further expand the applicability and engineering value of the proposed method in the following directions. While this study focuses on the L(0,1) mode, future research could incorporate additional guided wave modes to enhance feature robustness and improve adaptability to complex structural conditions. To ensure applicability under real-world service conditions, future models should consider the effects of temperature variation, corrosion, and anchorage degradation, potentially through environment-compensated modeling or adaptive calibration strategies. By integrating multiple features such as notch frequency, wave velocity, and time delay, and combining them with machine learning or deep learning techniques, more accurate and efficient inverse models can be developed for structural parameter identification. The proposed approach holds great potential for deployment in practical structures, including cable-stayed bridges, prestressed concrete members, and suspension systems. It supports long-term, online, and non-destructive evaluation of prestress and can contribute to the advancement of structural health monitoring and digital twin technologies in civil engineering.

Author Contributions

Conceptualization, J.Z.; methodology, Y.P. and P.X.; software, P.X. and X.W.; validation, J.Z. and S.Y.; writing—original draft preparation, Y.P.; writing—review and editing, S.Y. All authors have read and agreed to the published version of the manuscript.

Funding

Financial support from the National Natural Science Foundation of China (Grant No. 52278303), Gansu Provincial Major Scientific and Technological Project (Project No. 24ZDGA001), and Guangzhou Municipal Science and Technology Bureau, China (Grant No. 2023A03J0072), is acknowledged.

Data Availability Statement

The original contributions presented in the study are included in the article, further inquiries can be directed to the corresponding author.

Conflicts of Interest

The authors declare no conflicts of interest.

References

  1. Al-Kaimakchi, A.; Rambo-Roddenberry, M. Flexural behavior of concrete bridge girders prestressed with stainless steel strands. ACI Struct. J. 2021, 118, 137–152. [Google Scholar] [CrossRef]
  2. Hou, J.; Wang, C.; Li, S. Study on propagation mechanism and attenuation law of acoustic emission waves for damage of prestressed steel strands. Measurement 2023, 219, 113240. [Google Scholar] [CrossRef]
  3. Obaydullah, M.; Jumaat, M.Z.; Alengaram, U.J. Prestressing of NSM steel strands to enhance the structural performance of prestressed concrete beams. Constr. Build. Mater. 2016, 129, 289–301. [Google Scholar] [CrossRef]
  4. Stefaniuk, D.; Mechaala, A.; Belarbi, A. Transfer length of stainless-steel strands in prestressed bridge elements: A combined experimental and numerical modeling approach. Eng. Struct. 2025, 325, 119482. [Google Scholar] [CrossRef]
  5. Deng, Z.; Huang, M.; Wan, N.; Zhang, J. The current development of structural health monitoring for bridges: A review. Buildings 2023, 13, 1360. [Google Scholar] [CrossRef]
  6. Chen, J.; Wan, X.; Guo, Q. Monitoring of stress variation of strands in prestressed concrete by second harmonic generation measurements based on piezoelectric sensors. Smart Mater. Struct. 2021, 31, 015004. [Google Scholar] [CrossRef]
  7. Qian, J.; Li, J.; Liu, F.; Zhou, J.; Wang, X. Stress evaluation in seven-wire strands based on singular value feature of ultrasonic guided waves. Struct. Health Monit. 2021, 21, 518–533. [Google Scholar] [CrossRef]
  8. Pei, Y.; Zhang, J.; Yuan, Y.; Yang, D.; Au, F.T.K. Ultrasonic guided wave topological data analysis for corrosion characterization of steel strand based on Morse theory. Mech. Syst. Signal Process. 2025, 237, 113119. [Google Scholar] [CrossRef]
  9. Dubuc, B.; Ebrahimkhanlou, A.; Salamone, S. Data fusion approach for characterization of corrosion-induced stress change in prestressing strands using modulated higher-order guided ultrasonic waves. In Proceedings of the Health Monitoring of Structural and Biological Systems XIII, Denver, CO, USA, 1 April 2019; 10972, pp. 296–304. [Google Scholar]
  10. Dubuc, B.; Ebrahimkhanlou, A.; Salamone, S. Stress measurement in seven-wire strands using higher order guided ultrasonic wave modes. Transp. Res. Rec. 2018, 2672, 123–131. [Google Scholar] [CrossRef]
  11. Liu, S.; Sun, Y.; Ma, W. A new signal processing method based on notch filtering and wavelet denoising in wire rope inspection. J. Nondestruct. Eval. 2019, 38, 39. [Google Scholar] [CrossRef]
  12. Kwun, H.; Bartels, K.A.; Hanley, J.J. Effects of tensile loading on the properties of elastic-wave propagation in a strand. J. Acoust. Soc. Am. 1998, 103, 3370–3375. [Google Scholar] [CrossRef]
  13. Chaki, S.; Bourse, G. Stress level measurement in prestressed steel strands using acoustoelastic effect. Exp. Mech. 2009, 49, 673–681. [Google Scholar] [CrossRef]
  14. Bartoli, I.; Nucera, C.; Srivastava, A. Nonlinear ultrasonic guided waves for stress monitoring in prestressing tendons for post-tensioned concrete structures. In Proceedings of the Sensors and Smart Structures Technologies for Civil, Mechanical, and Aerospace Systems 2009 SPIE, San Diego, CA, USA, 8–12 March 2009; Volume 7292, pp. 677–687. [Google Scholar]
  15. Cui, X.; Li, D.; Liu, J.; Ou, J. An NCFA-based notch frequency feature extraction method for guided waves and its application in steel strand tension detection. J. Bridge Eng. 2023, 28, 04023099. [Google Scholar] [CrossRef]
  16. Zhu, S.; Xu, X.; Han, J.; Luo, Y. Axial stress measurement of steel tubes using ultrasonic guided waves. Sensors 2022, 22, 3111. [Google Scholar] [CrossRef]
  17. Chen, X.; Xu, J.; Li, Y. Characteristic parameters of magnetostrictive guided wave testing for fatigue damage of steel strands. Materials 2023, 16, 5215. [Google Scholar] [CrossRef]
  18. Shen, S.; Yang, F.; Wang, H. Measurement of stress variation in unbonded and semi-bonded prestressing steel strands using the peak time shift of guided ultrasonic waves. J. Civ. Struct. Health Monit. 2025, 15, 2339–2358. [Google Scholar] [CrossRef]
  19. Frikha, A.; Cartraud, P.; Treyssede, F. Mechanical modeling of helical structures accounting for translational invariance. Part 1: Static behavior. Int. J. Solids Struct. 2013, 50, 1373–1382. [Google Scholar] [CrossRef]
  20. Treyssède, F.; Frikha, A.; Cartraud, P. Mechanical modeling of helical structures accounting for translational invariance. Part 2: Guided wave propagation under axial loads. Int. J. Solids Struct. 2013, 50, 1383–1393. [Google Scholar] [CrossRef]
  21. Huang, M.; Zhang, J.; Hu, J. Nonlinear modeling of temperature-induced bearing displacement of long-span single-pier rigid frame bridge based on DCNN-LSTM. Case Stud. Therm. Eng. 2024, 53, 103897. [Google Scholar] [CrossRef]
  22. Huang, M.; Wan, N.; Zhu, H. Reconstruction of structural acceleration response based on CNN-BiGRU with squeeze-and-excitation under environmental temperature effects. J. Civ. Struct. Health Monit. 2025, 15, 985–1003. [Google Scholar] [CrossRef]
  23. Zhang, J.; Huang, M.; Wan, N. Missing measurement data recovery methods in structural health monitoring: The state, challenges and case study. Measurement 2024, 231, 114528. [Google Scholar] [CrossRef]
  24. Yuan, Y.; Au, F.T.K.; Yang, D. An active learning Kriging-based Bayesian framework for probabilistic structural model exploration. J. Sound Vib. 2025, 596, 118730. [Google Scholar] [CrossRef]
  25. Rose, J.L. Ultrasonic Guided Waves in Solid Media; Cambridge University Press: Cambridge, UK, 2014. [Google Scholar]
  26. Hughes, D.S.; Kelly, J.L. Second-order elastic deformation of solids. Phys. Rev. 1953, 92, 1145. [Google Scholar] [CrossRef]
  27. Datta, D.; Kishore, N.N. Features of ultrasonic wave propagation to identify defects in composite materials modelled by finite element method. Ndt E Int. 1996, 29, 213–223. [Google Scholar] [CrossRef]
  28. Dreher, R.C. Studies of Friction and Wear Characteristics of Various Wires for Wire-Brush Skids; National Aeronautics and Space Administration (NASA): Washington, DC, USA, 1977.
  29. Li, G.; Zhang, J.; Cheng, J.; Wang, K.; Yang, D.; Yuan, Y. Multi-order mode excitation and separation of ultrasonic guided waves in rod structures using 2D-FFT. Sensors 2023, 23, 8483. [Google Scholar] [CrossRef] [PubMed]
  30. Treyssède, F.; Laguerre, L. Investigation of elastic modes propagating in multi-wire helical waveguides. J. Sound Vib. 2010, 329, 1702–1716. [Google Scholar] [CrossRef]
Figure 1. A slender rod subjected to uniaxial stress.
Buildings 15 03166 g001
Figure 2. Theoretical dispersion curves of the longitudinal mode.
Buildings 15 03166 g002
Figure 3. Steel strand mesh division.
Buildings 15 03166 g003
Figure 4. Ricker wavelet excitation signal.
Buildings 15 03166 g004
Figure 5. FEM of core wire and von Mises stress during guided wave propagation.
Buildings 15 03166 g005
Figure 6. Normalized signal amplitude of the transient acceleration signal.
Buildings 15 03166 g006
Figure 7. Dispersion curve of L(0,1) mode of the strand corresponding to 60% UTS.
Buildings 15 03166 g007
Figure 8. Contact states of the steel strand under different tensile loads.
Buildings 15 03166 g008aBuildings 15 03166 g008b
Figure 9. The relationship between the notch frequency and the contact half-width curve.
Buildings 15 03166 g009
Figure 10. Simulated notch frequency spectrum for a steel strand with a diameter of 12.7 mm under different axial forces (50 kN, 80 kN, and 110 kN).
Buildings 15 03166 g010
Figure 11. Simulated notch frequency spectrum of steel strands with different diameters (12.7 mm, 15.2 mm, and 17.8 mm) under constant axial force of 30 kN.
Buildings 15 03166 g011
Figure 12. Steel strand tensile test module physical diagram.
Buildings 15 03166 g012
Figure 13. Ultrasonic guided wave detection system.
Buildings 15 03166 g013aBuildings 15 03166 g013b
Figure 14. Excitation signal time domain and frequency domain diagram.
Buildings 15 03166 g014
Figure 15. Spectrum of steel strands with different diameters under 80 kN tension.
Buildings 15 03166 g015
Table 1. Geometrical and mechanical characteristics of the steel strand.
Geometric CharacteristicMechanical Characteristic
Core wire diameter D c (mm)5.4Elastic modulus E (GPa)210
Helical wire diameter D p (mm)5.22Poisson’s ratio ν 0.3
Strand diameter D (mm)15.7Ultimate tension strength (MPa)1860
Pitch of helical wire ρ h (mm)240Dilatational wave velocity c L (m/s)6001
Helix lay angle ϕ (deg)7.9Shear wave velocity c T (m/s)3207.7
Table 2. Technical parameters of the DG-812 waveform signal generator.
Performance ParameterMaximum Output FrequencyNumber of ChannelsVertical ResolutionSampling RateArbitrary Waveform Length
Value (Unit)10 MHz2 CH16 bit125 Msa/s2 M (8 M opt.)
Table 3. Performance parameters of PZT-5H piezoelectric ceramics.
Performance ParameterSymbolPerformance Indicator (Unit)
Electromechanical coupling coefficientKP0.62
K310.36
k330.8
k150.68
kt0.47
Relative permittivityer3T3400
er1T3800
Dielectric losstgd2.3
CapacitanceF0.9 nf
Table 4. Comparison of experimental and simulated notch frequencies.
No.Force (kN)Diameter (mm)Elastic Modulus (GPa)Helix Pitch (mm)Measured Notch Frequency (kHz)Simulated Notch Frequency (kHz)Discrepancy (%)
15012.721024097.898.881.1
28012.7210240102.5103.541.01
311012.7210240105.7104.67−0.97
45015.221024080.282.562.94
58015.221024087.389.452.46
611015.221024089.591.832.6
75017.821024070.170.09−0.02
88017.821024073.274.271.46
911017.821024076.4177.511.44
Disclaimer/Publisher’s Note: The statements, opinions and data contained in all publications are solely those of the individual author(s) and contributor(s) and not of MDPI and/or the editor(s). MDPI and/or the editor(s) disclaim responsibility for any injury to people or property resulting from any ideas, methods, instructions or products referred to in the content.