Article

Evolution of the Damping Ratio Considering Cyclic Confining Pressure Under Intermittent Cyclic Loading

1
State Key Laboratory of Geomechanics and Geotechnical Engineering Safety, Institute of Rock and Soil Mechanics, Chinese Academy of Sciences, Wuhan 430071, China
2
School of Civil Engineering, Chang’an University, Xi’an 710064, China
*
Author to whom correspondence should be addressed.
Buildings 2025, 15(16), 2882; https://doi.org/10.3390/buildings15162882
Submission received: 2 July 2025 / Revised: 10 August 2025 / Accepted: 13 August 2025 / Published: 14 August 2025

Abstract

The damping ratio is essential to conducting dynamic analysis for underground engineering under traffic loading. Variations in the damping ratio are usually studied using cyclic triaxial tests with continuous cyclic loading; however, intermittent loading is observed under traffic loading. Moreover, both the deviator stress and confining pressure vary cyclically. So far, the development of the damping ratio under intermittent cyclic loading with cyclic confining pressure has rarely been studied. Thus, cyclic triaxial tests with continuous and intermittent cyclic loading were conducted. Unlike continuous loading, where the normalized damping ratio progressively decreases, the corresponding variations under intermittent cyclic loading showed a sudden increase in the initial damping ratio at each restart. Critically, the cyclic confining pressure significantly reduced the normalized damping ratio, with greater attenuation under intermittent loading at higher cyclic confining pressures. In addition, an empirical model incorporating these effects for the damping ratio under intermittent cyclic loading was developed.

1. Introduction

The damping ratio is crucial for the dynamic analysis of underground engineering under traffic loads. Moreover, the damping ratio is usually determined with laboratory tests, whereas traffic loads are simulated with cyclic triaxial tests with continuous cyclic loading [1,2,3,4,5]. The variations in the damping ratio in terms of physical indexes and loading parameters were analyzed [6]. Okur et al. [7] analyzed the development of the damping ratio under different consolidated confining pressures and concluded that both the physical index and consolidated confining pressure had a strong influence on the dynamic behaviors of fine-grained soils. Ling et al. [3] analyzed the dynamic properties of frozen clays under cyclic loading and concluded that the damping ratio was higher with lower confining pressure and higher moisture content. Based on that, they developed a damping ratio calculation model with normalized accumulated axial strains. Accompanied by test results, some empirical formulas were proposed to calculate the damping ratio [8]. For example, Hardin and Drnevich [9] supposed that the stress–strain relationship satisfied a hyperbolic function and proposed a model to calculate the damping ratio for clays. Subramaniam and Banerjee [10] developed a model to calculate the damping ratio with some correction factors, in which the effects of both the plasticity index and modulus degradation were considered. Based on the above research results, there was a limitation that only the cyclic deviator stress was employed during the application of cyclic loading. However, both the confining pressure and deviator stress varied cyclically under traffic loads [11,12]. This indicated that the simulation of traffic loads was not accurate enough because the cyclic confining pressure was not incorporated into the laboratory tests. The simulation of traffic loads needs further study.
Reviewing previous studies, cyclic triaxial tests with variable confining pressure were conducted, in which cyclical variations in deviator stress and confining pressure were imposed on soils simultaneously. The developments of strain under cyclic loading with and without cyclic confining pressure were studied, and the differences in strain between the two test conditions were analyzed [13]. Moreover, the development of strain was also affected by the drained conditions under cyclic loading; the strain decreased as the cyclic confining pressure increased under undrained conditions [14], whereas it increased under partially drained conditions [15]. Similar test results were observed by Sun and Wang [15]. Huang et al. [16,17] concluded that the damping ratio of clay decreased as the cyclic confining pressure increased and developed a model for the damping ratio in relation to accumulated axial strains. However, there was a phenomenon in which the interval period of adjacent trains existed, meaning that the subgrade underwent intermittent cyclic loads [18,19]. Therefore, simulations of traffic loads need to consider the effect of intermittent loading as much as possible, and the variations in the damping ratio under intermittent cyclic loading require further analysis.
Reviewing previous studies, some scholars have conducted cyclic triaxial tests with intermittent cyclic loading [20,21,22]. Nie et al. [19] concluded that lower deformation of subgrade soil was obtained with greater intermittent time. Similar test results were found by Zheng et al. [21]. They considered that the adjustment of the soil skeleton was related to the duration of intermittent periods and analyzed the variation in excess pore water pressure. Moreover, the development of the resilient modulus was studied and increased with an increase in the duration of intermittent periods [23]. In addition, the effect of the drained conditions during intermittent periods was analyzed. The duration of intermittent periods was 60 min under partially drained conditions in the tests conducted by Yıldırım and Ersan [24]; however, the differences in deformation behaviors between undrained and partially drained conditions during intermittent periods were analyzed [25]. Although cyclic triaxial tests with intermittent loading were used to simulate the loading intermittence of traffic loads, and the mechanical properties of soil were studied under intermittent cyclic loading, this research mainly focused on the development of deformation and the variation in excess pore water pressure. There was little mention of the development of the damping ratio. Moreover, the cyclic confining pressure was not considered under intermittent cyclic loading.
Previous studies have concluded that intermittent loading and cyclic confining pressure need to be incorporated into the simulation of traffic loads. Moreover, the effects of intermittent loading and cyclic confining pressure under intermittent cyclic loading should not be ignored. As a result, research on the variation in the damping ratio under intermittent cyclic loading while considering cyclic confining pressure is required.
Two types of tests, i.e., cyclic triaxial tests with continuous and intermittent cyclic loading, were carried out; then, the differences in the damping ratio between the two types of tests were analyzed; moreover, the impact of cyclic confining pressure under intermittent cyclic loading was clarified; finally, an empirical model was used to calculate the damping ratio under intermittent cyclic loading with cyclic confining pressure.

2. Materials and Methods

2.1. Soil Descriptions

Undisturbed specimens were obtained with a thin-wall soil sampler in Zhuhai city with a burial depth of 12.0–14.0 m according to the Ministry of Water Resources of the People’s Republic of China [26]. The obtained specimens were stored in a cylindrical sample barrel and sealed with wax and plastic tape under constant temperature and humidity conditions. Furthermore, according to specifications of the Ministry of Water Resources of the People’s Republic of China [24], the fundamental physical–mechanical indices of the tested material were obtained. The unit weight was 17.60 kN/m3; the natural water content, the liquid limit, and the plastic limit were 48.60%, 51.90%, and 19.80%, respectively. The permeability of the specimens was poor, i.e., the coefficient of permeability was 2.26 × 10⁻⁷cm/s. Furthermore, the grain size distribution was obtained as follows: clay (diameter < 0.005 mm) and silt particles (0.005 mm < diameter < 0.075 mm) accounted for 35.1% and 64.9% of the overall composition, respectively. According to the specifications of ASTM [27], the tested soil was classified as CH.

2.2. Test Procedures

Cyclic triaxial tests were performed on the undisturbed specimens, in which advanced test equipment was used, i.e., a GDS dynamic triaxial system. The diagram of the GDS dynamic triaxial system is shown in Figure 1. The advanced device used here includes five parts, namely, an axial loading system, cell pressure controller, back pressure controller, data acquisition system, and measuring and controlling system. Here, the range and resolution of the axial displacement sensor are 100 mm and 0.208 μm, indicating that the advanced apparatus has high accuracy for measuring the deformation of soil. The axial loading system includes axial displacement sensors and an actuator. When the specimen is in contact with the axial load sensor, the initial value of the axial displacement sensor is cleared. Then, when this is combined with the upward movement of the base, the deformation of the specimen can be obtained by reading the axial displacement sensor.
To minimize the disturbance of the sample, specimens of 38 mm diameter and 76 mm height were hand-trimmed from the center of the cylindrical sample with the sample maker. Here, the excess soil samples could be removed using a wire saw by adjusting the size of the sample maker. Then, many cylindrical specimens were placed on the base of the apparatus for saturation, where both back pressure and confining pressure were applied simultaneously. To protect the stability of the sample, an effective consolidated confining pressure of 20 kPa was used. When the Skempton B-value exceeded 0.95, the saturation process of the specimen was completed. Then, when this was combined with the increasing confining pressure, all specimens were isotropically consolidated under a constant back pressure. When the specimen’s drainage rate was less than 100 mm3/h [15], the consolidation of the specimen was completed, and the corresponding effective consolidated confining pressure was 100 kPa. After that, cyclic loading was performed on the isotropically consolidated specimens.
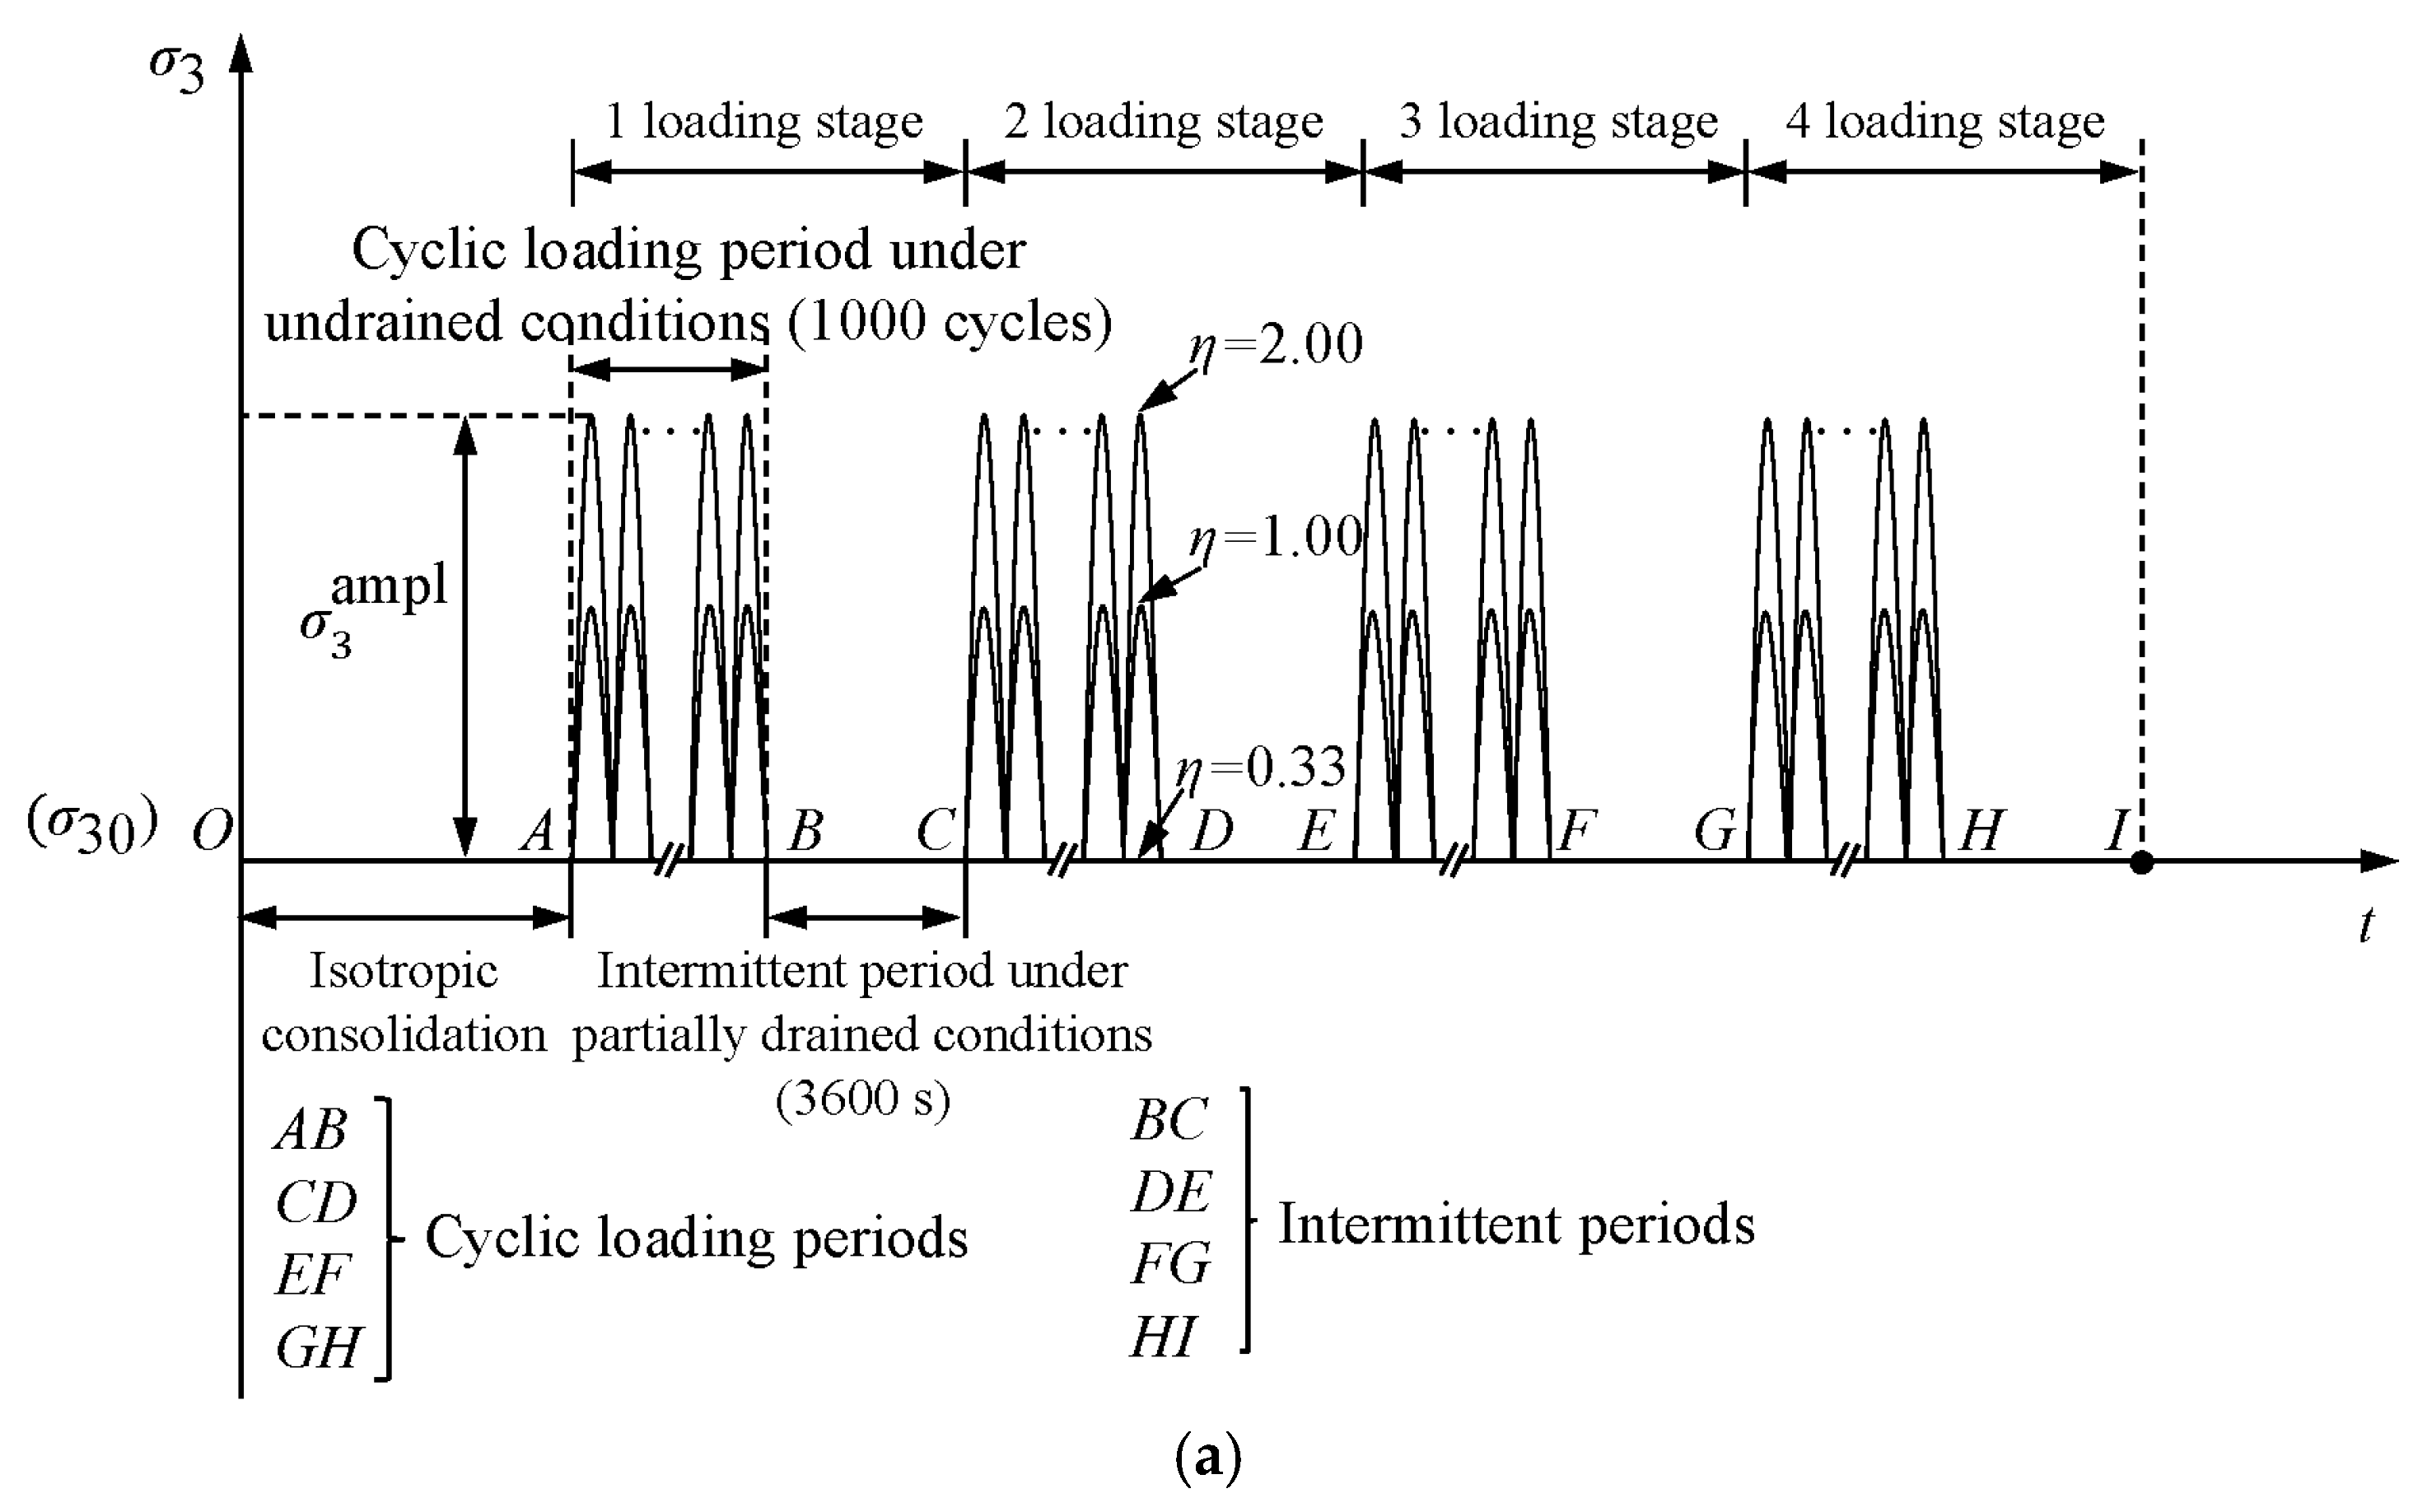
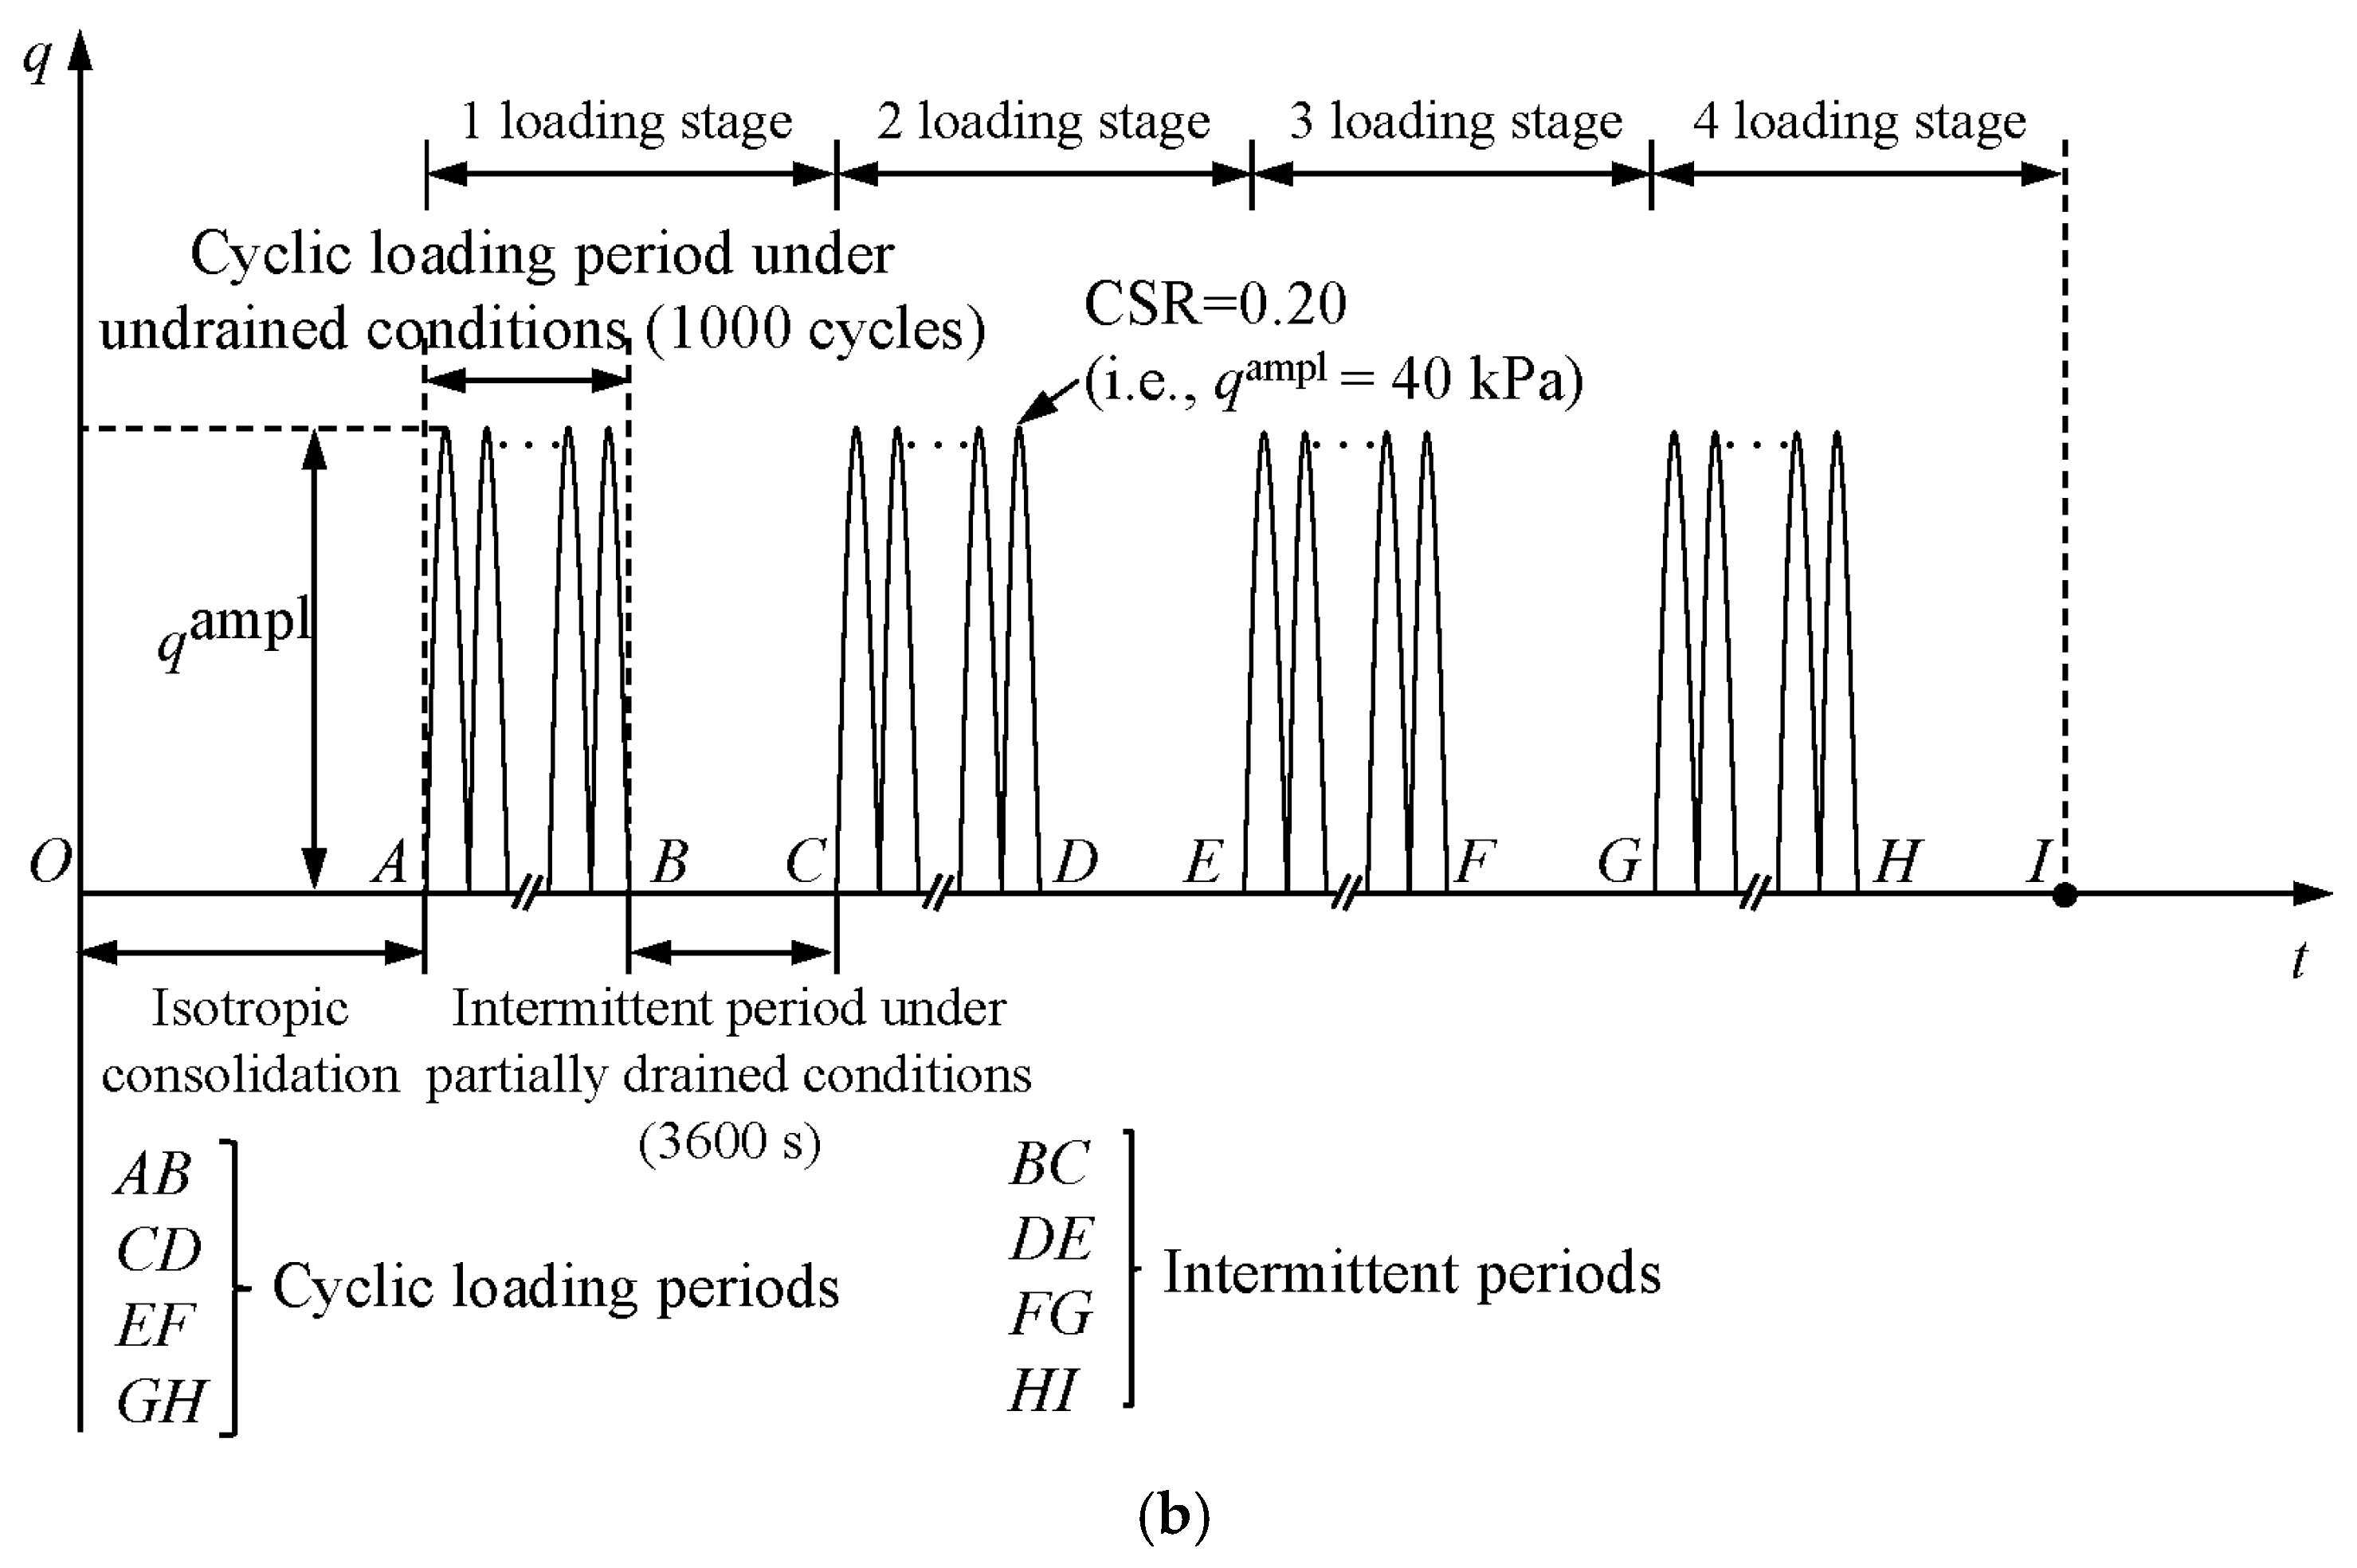
Figure 2 shows the schematic diagram of cyclic triaxial tests with intermittent cyclic loading; Figure 2a presents the variations in the cyclic confining pressure, and Figure 2b shows the cyclic deviator stress under intermittent cyclic loading. Here, four loading stages (i.e., loading stages AC, CE, EG, and GI) were performed on the tested specimens to shorten the test duration and ensure stable operation of the testing system based on previous studies [18,19,24]. Each loading stage was divided into cyclic loading and intermittent periods. During cyclic loading periods, i.e., stages AB, CD, EF, and GH, the cyclic stresses were applied in a stress-controlled mode. Moreover, both stress waveforms were half-sine waves. To depict the amplitude values of both the cyclic deviator stress and cyclic confining pressure, two parameters, i.e., the inclination of the stress path (η) and the cyclic stress ratio (CSR), were used and defined as pampl/qampl and qampl/2Po′, respectively [2,28], in which pampl and qampl are the amplitude of the cyclic mean principle total stress and cyclic deviator stress, and Po′ is the effective mean principle total stress after isotropic consolidation.
Recalling Figure 1, there is a rubber sealing ring between the axial loading system and the base. Based on previous studies [16,29,30], greater cyclic loading can wear the rubber sealing ring, affecting the stable functioning of the test equipment. Thus, the amplitudes of cyclic stress should be reduced. In this study, three values of η = 1/3, 1.0, and 2.0 were used to study the effect of the cyclic confining pressure. η = 1/3 represents the test condition with constant confining pressure, whereas the other η values represent cyclic loading with cyclic confining pressure. Then, due to the limited number of specimens, the effect of the cyclic deviator stress was not considered. Thus, the value of CSR was constant; CSR = 0.20 was used (i.e., qampl = 40 kPa) based on the study of Huang et al. [29].
Moreover, an excessive number of cycles can wear the equipment sealing ring. Thus, the number of cycles employed should also be reduced. According to previous studies [22,30], the number of cycles during a cyclic loading period was 1000 cycles.
Recalling Figure 1, measuring excess pore water pressure accurately in low-permeability soil proved problematic because the pore water pressure was only measured at the bottom of the sample [14,31]. The mechanical behaviors of soils are affected significantly by excess pore water pressure. Therefore, a smaller loading frequency was chosen for the variation in excess pore water with enough time, and a loading frequency of 0.1 Hz was utilized [32].
After that, considering the test results of Yıldırım and Ersan [24], the duration of the intermittent period, i.e., in stages BC, DE, FG, and HI, was 3600 s because the physical properties of soil in the literature are close to those of the soil tested in this study. When a train passes quickly, there is not enough time to discharge pore water because of the poor permeability of soft soil and the short duration of cyclic loading. Thus, the specimens are considered to be in an undrained condition during the cyclic loading period, and this condition can be replicated by closing the drainage valve. After the train passes, the excess pore water pressure caused by cyclic loading gradually decreases over a long period as the pore water is drained. Because the permeability of clayey soil is low, the pore water in specimens cannot be fully discharged during intermittent periods. Consequently, the clayey subsoils are deemed to be in a partially drained state [2,12]. The partially drained condition can be realized by opening the drainage valve in tests [28,33]. Therefore, the drainage valves were opened during intermittent periods.
To analyze the effect of intermittent loading, cyclic triaxial tests with continuous cyclic loading were conducted. Figure 3 presents a schematic diagram of the cyclic triaxial tests with continuous cyclic loading; Figure 3a presents the variations in cyclic confining pressure, and Figure 3b shows the cyclic deviator stress. Here, cyclic variations in both the confining pressure and deviator stress were imposed on the isotropically consolidated specimens under partially drained conditions, in which the opening drainage valve represented a partially drained condition. The amplitudes of cyclic stresses were consistent with those under intermittent cyclic loading. The total number of cycles was 4000, and these were divided into a loading stage every 1000 cycles. Moreover, the loading frequency of the tests was 0.1 Hz. The test parameters for each specimen are shown in Table 1.

3. Test Results

3.1. Determination of the Damping Ratio Under Cyclic Loading

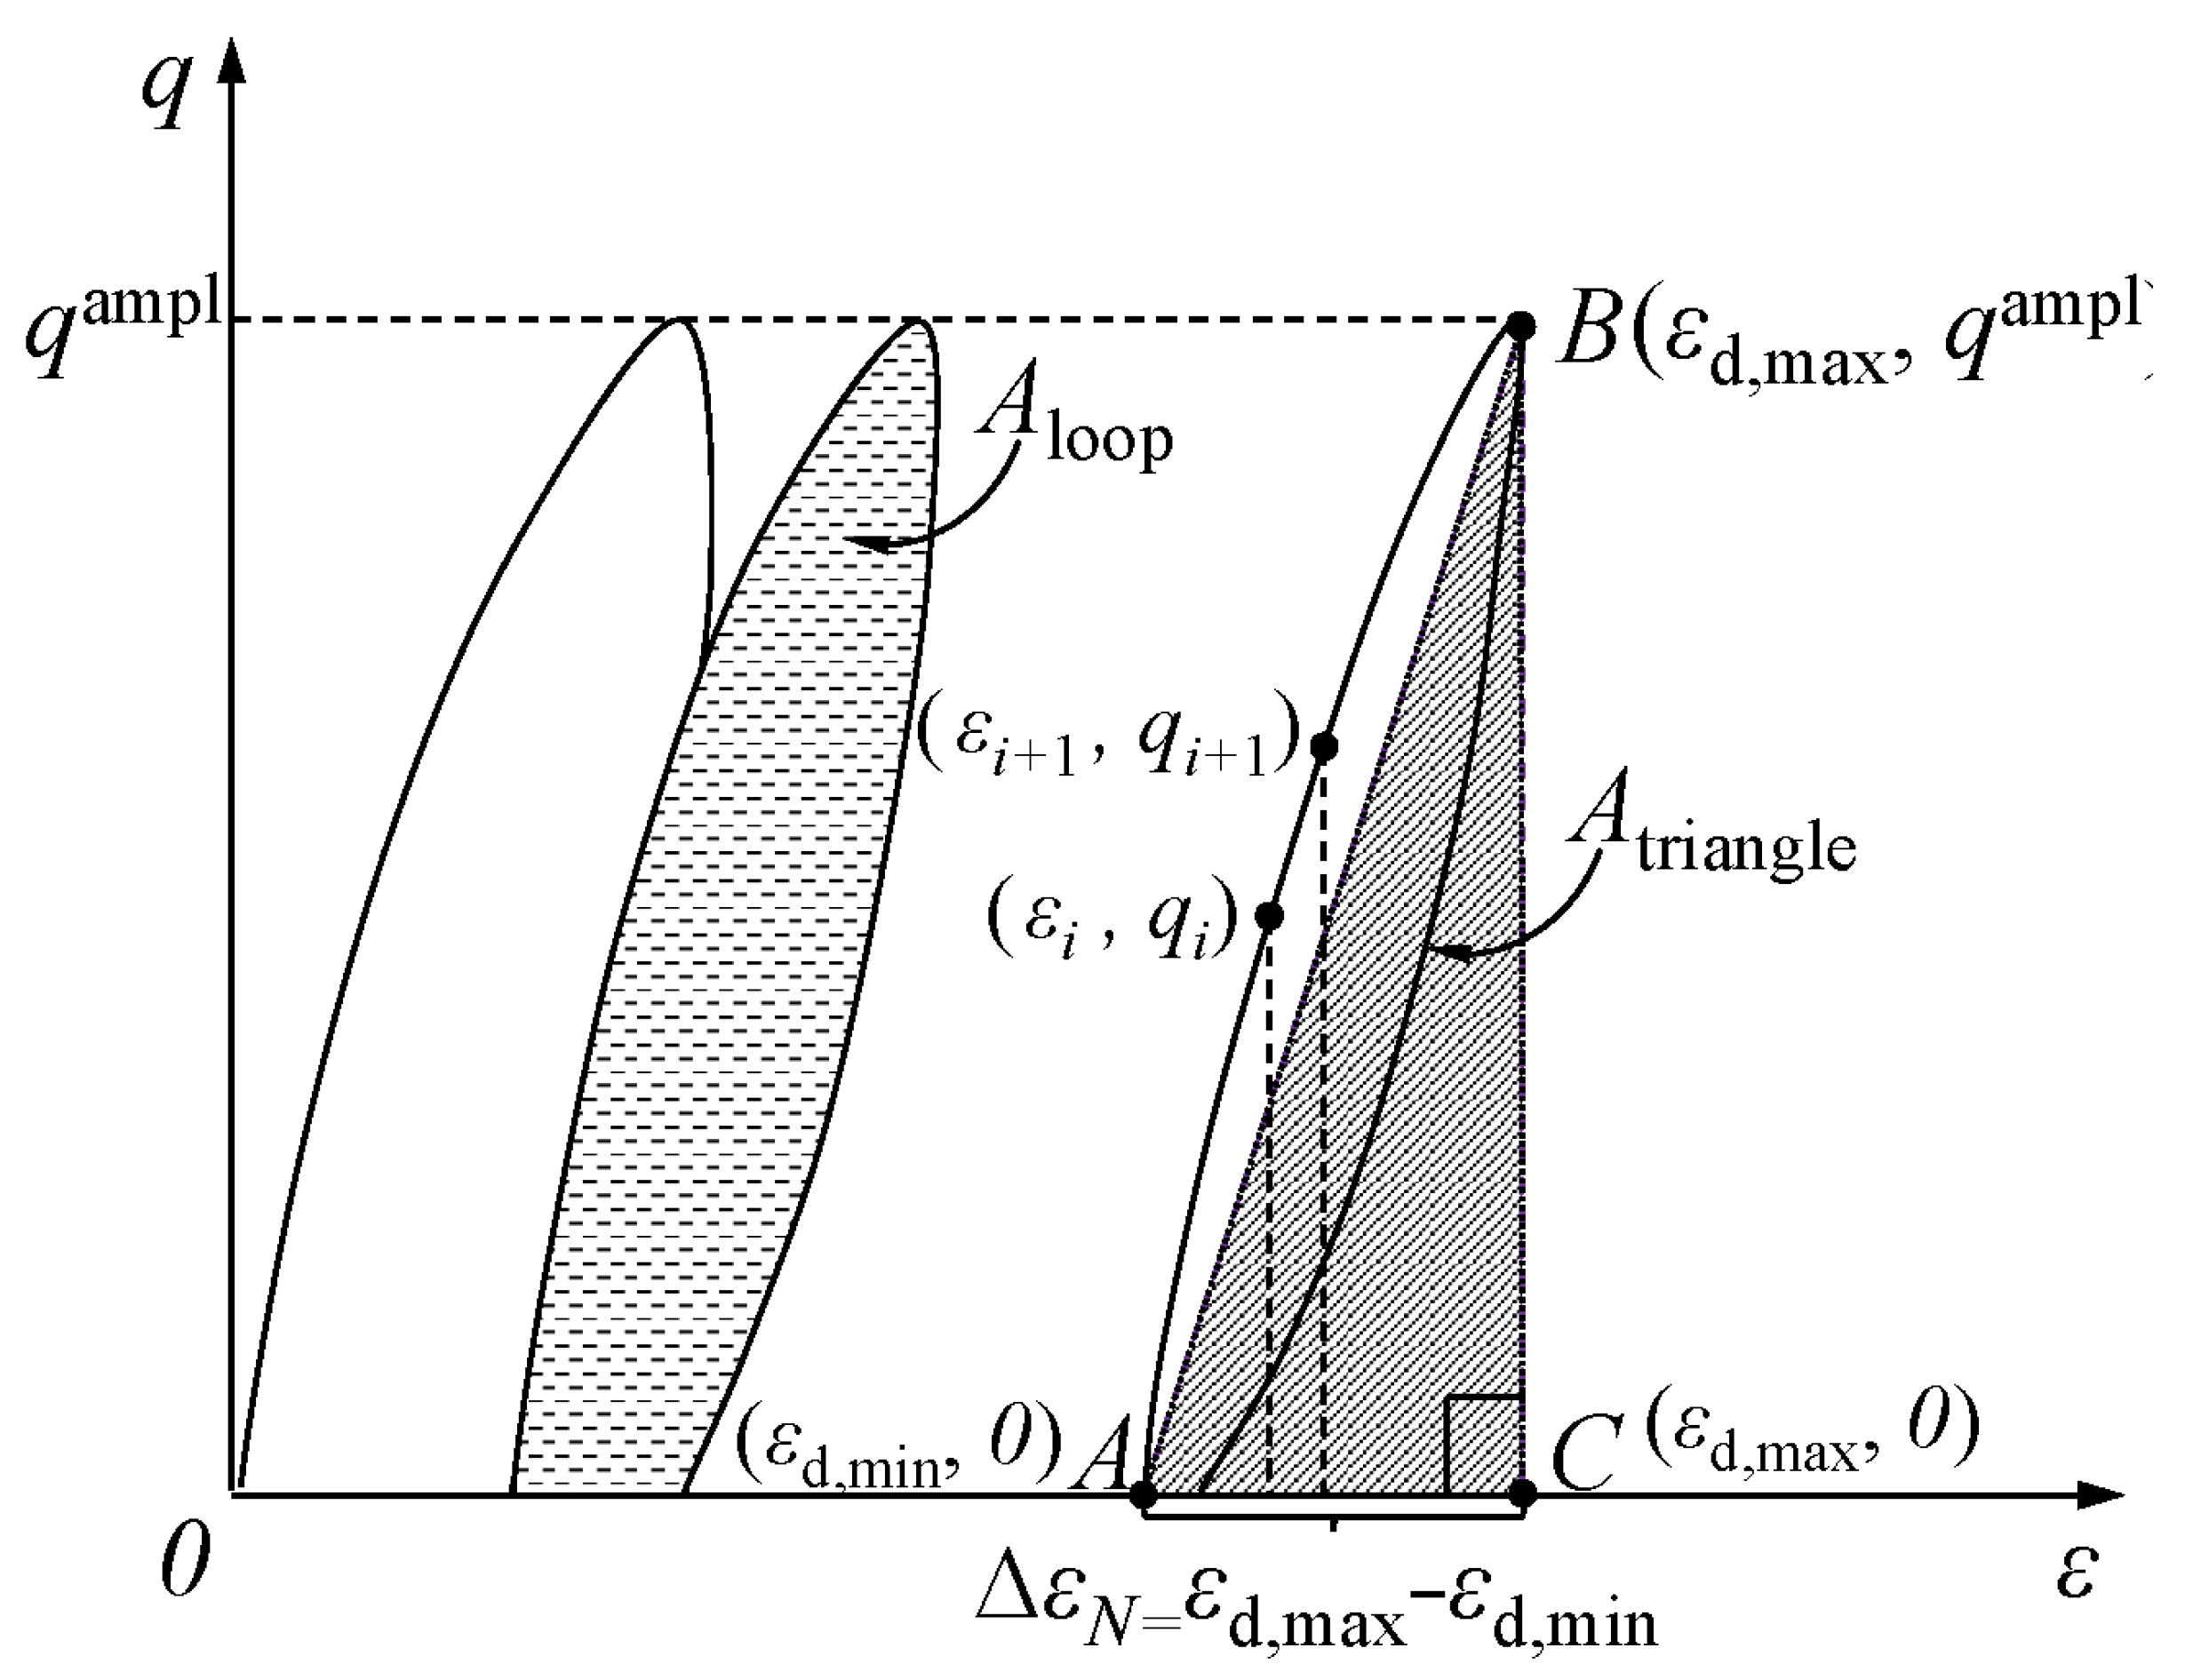
A diagram of hysteresis loops under cyclic loading is shown in Figure 4. According to the results of Lin et al. [34], the damping ratio is calculated as follows:
D N = A loop π A triangle
where DN is the damping ratio at cycle N; Aloop and Atriangle represent the dissipated energy and total applied energy during one cycle, respectively. Furthermore, Aloop and Atriangle can be calculated with the area of the enclosed hysteresis loop and the area of the triangle ABC, respectively.
Recalling Figure 4, the above parameters Aloop and Atriangle can be presented as follows:
A t r i a n g l e = 1 2 q ampl Δ ε N
A l o o p = i = 1 n 1 1 2 q i + 1 + q i ε i + 1 ε i
where Δ ε N = ε d , max ε d , min represents the variation in axial strain during one cycle. Furthermore, εd,max and εd,min are the maximum and minimum axial strain during one cycle; qi and ε i are the deviator stress and axial strain at each point, respectively; n is the number of points recorded during one cycle and is set to 50.
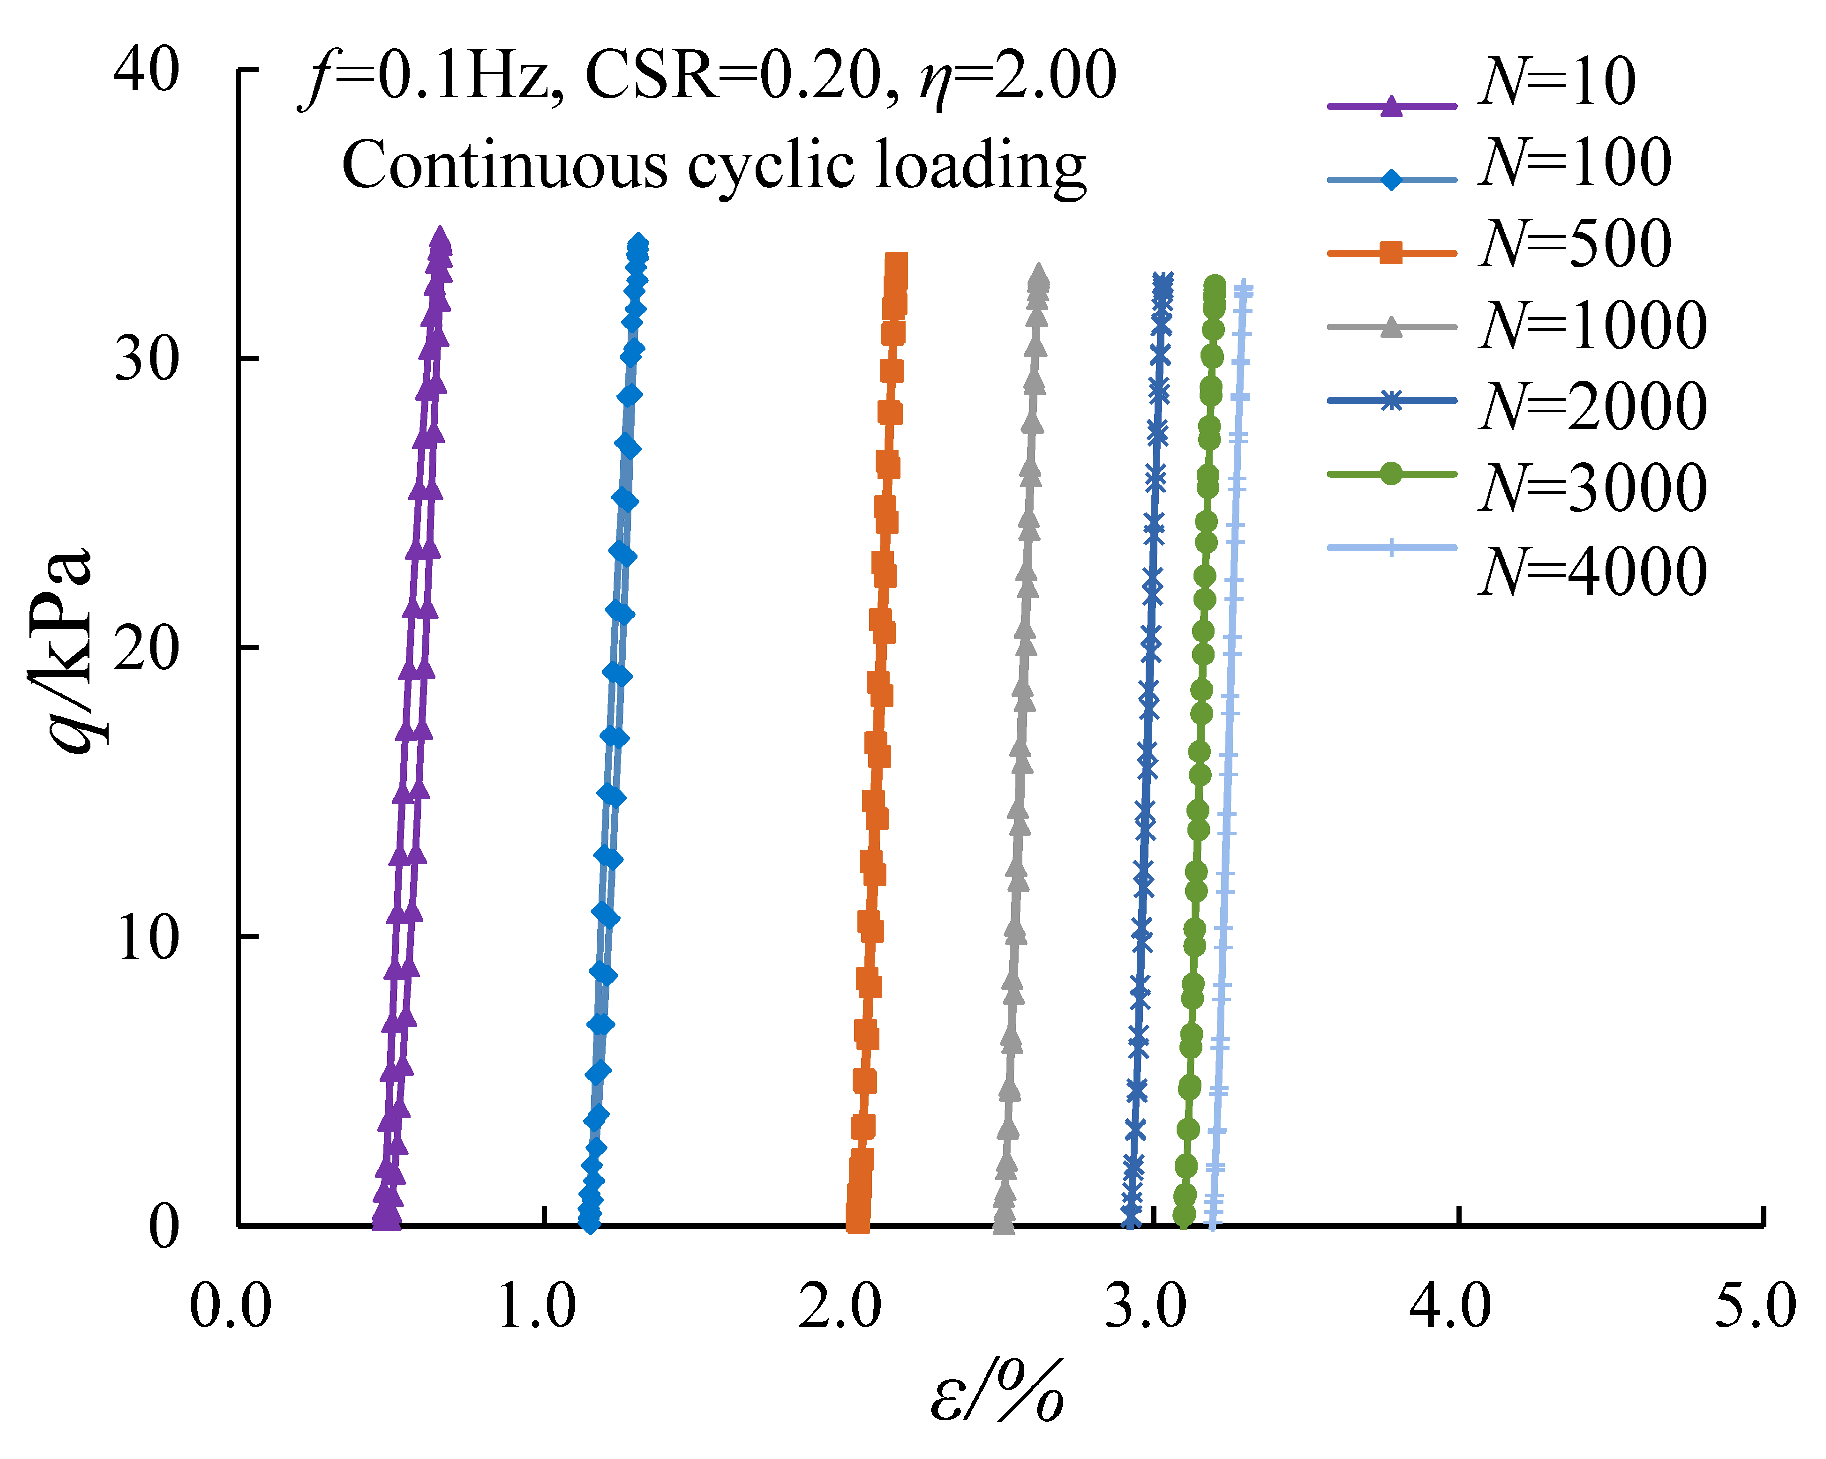
Taking the test results of cyclic triaxial tests in the continuous cyclic loading mode as an example, Figure 5 shows the relationships between the deviator stress and axial strain at 10, 100, 500, 1000, 2000, 3000, and 4000 cycles. Here, the residual axial strain produced in each cycle gradually decreases with an increasing number of cycles, implying that the hysteresis loop becomes flatter after several cycles. The obtained test results were consistent with previous studies conducted by Ling et al. [3], Sun and Wang [15], and Huang et al. [16,33]. As the hysteresis loop becomes flatter, the corresponding area of the hysteresis loop decreases. Recalling Figure 5, the Aloop values are 13.84, 7.09, 3.31, 1.87, 0.84, 0.60, and 0.31 J/m3 at 10, 100, 500, 1000, 2000, 3000, and 4000 cycles, respectively, based on Equation (3); the corresponding Atriangle values are 29.62, 26.29, 20.49, 18.61, 16.93, 16.18, and 16.05 J/m3 using Equation (2). Thus, the damping ratios are 0.148, 0.086, 0.051, 0.032, 0.016, 0.012, and 0.006 according to Equation (1), meaning that a greater damping ratio can be obtained with fewer cycles.

3.2. Evolution of the Damping Ratio Under Continuous Cyclic Loading

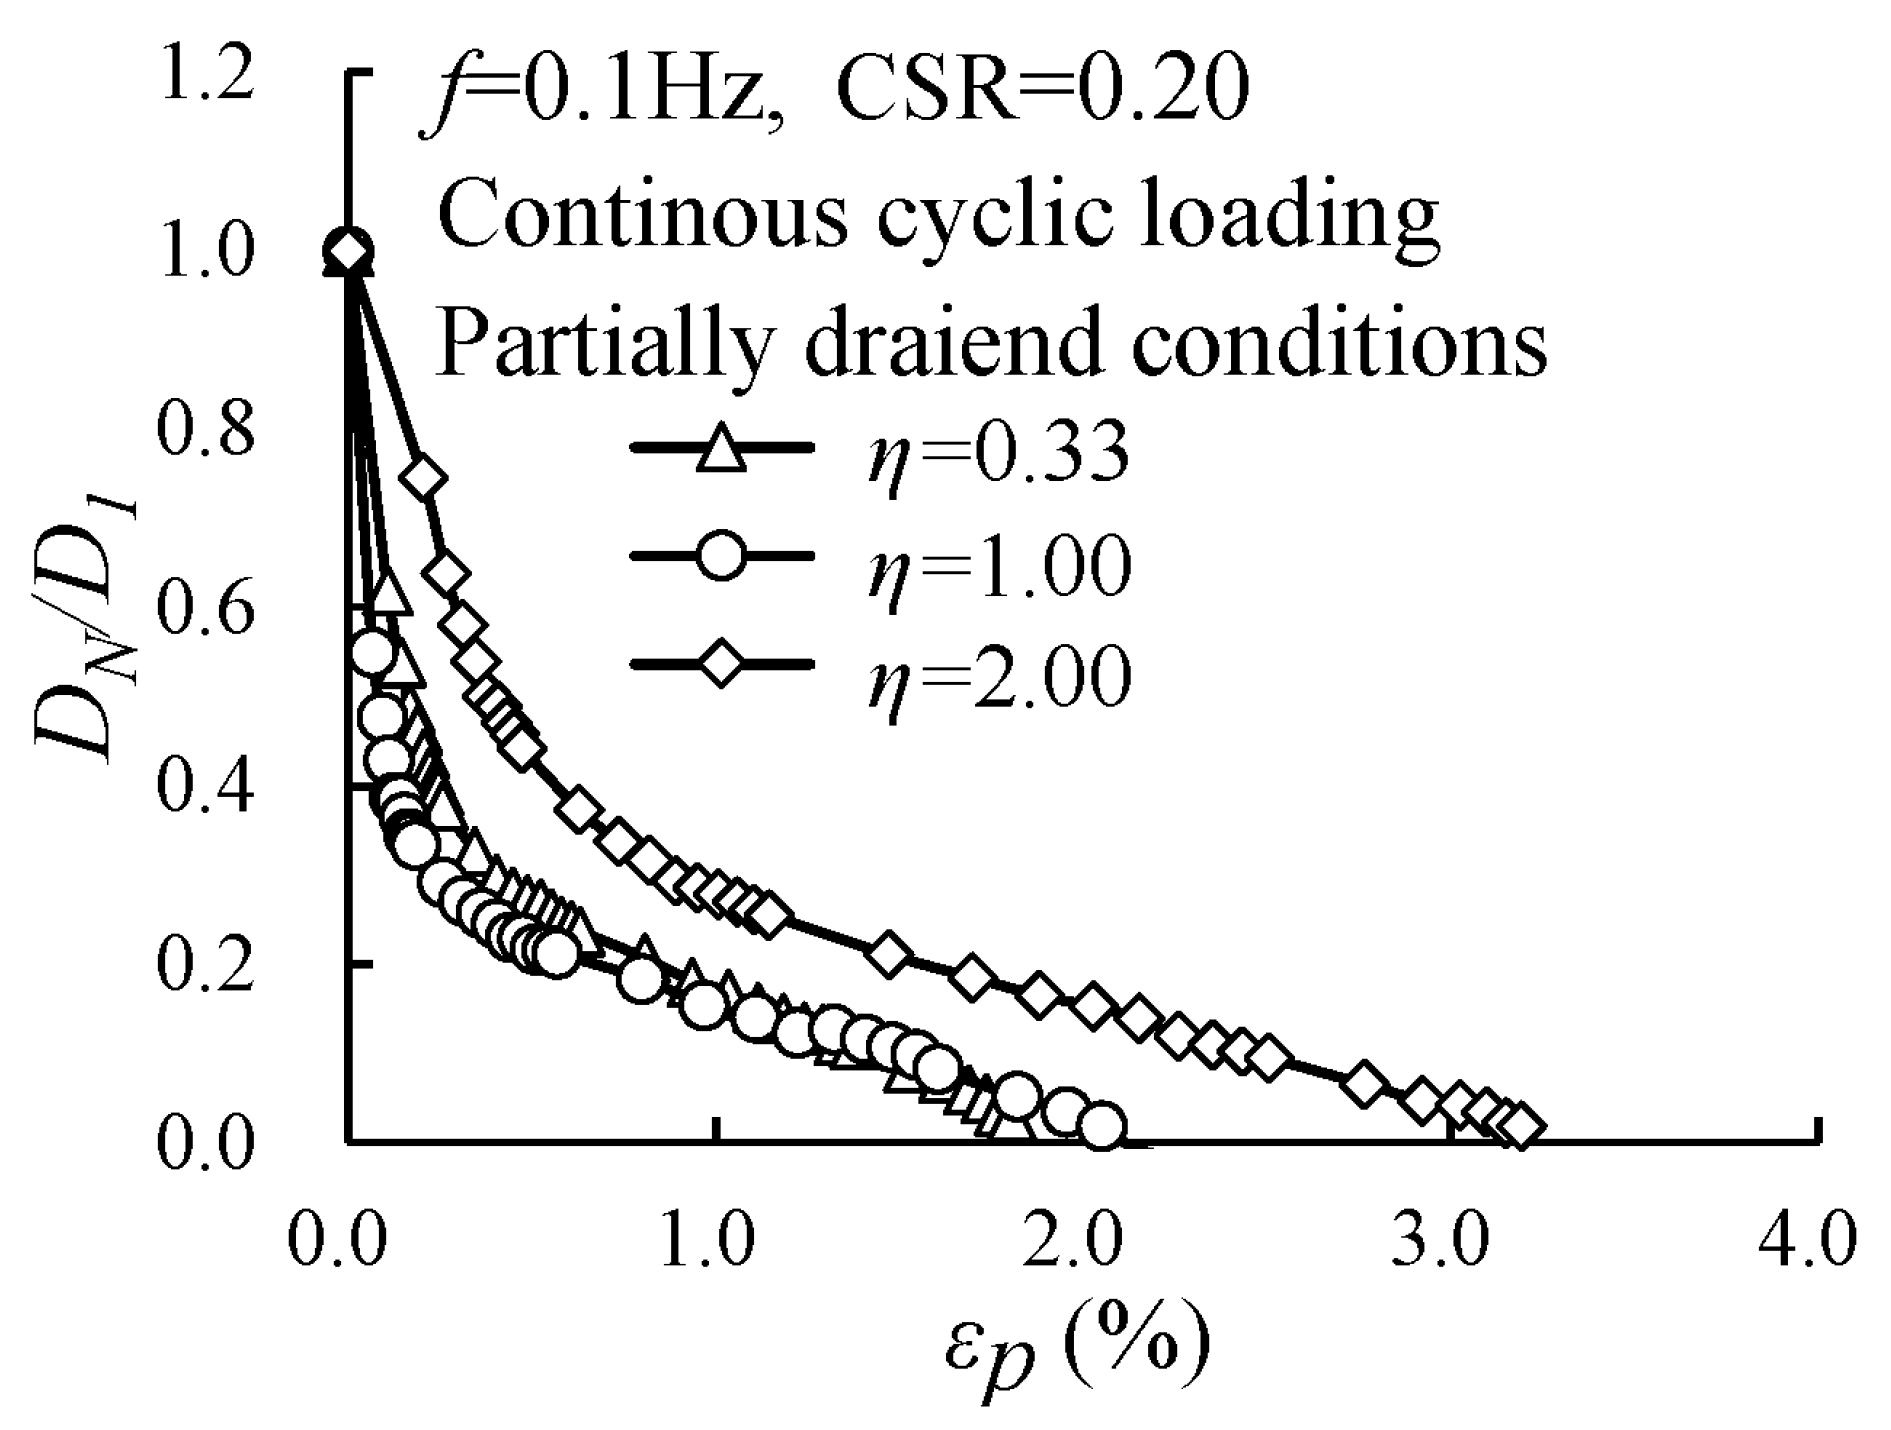
To clarify, the damping ratio of each cycle is normalized with the corresponding damping ratio of the first cycle, i.e., DN/D1. Here, the parameter D1 was the damping ratio in the first cycle. Figure 6 shows the variation in DN/D1 under continuous cyclic loading. Here, the variations in DN/D1 under different cyclic confining pressure conditions are consistent; DN/D1 rapidly decays at small strains, and then the decay rate of DN/D1 decreases. This phenomenon was also observed by Huang et al. [16,33].
Moreover, a greater normalized damping ratio is obtained with greater cyclic confining pressure, implying that the reduction in the damping ratio increases with a decrease in cyclic confining pressure. However, the phenomenon is opposite to that obtained by Huang et al. [16], in which a lower normalized damping ratio can be obtained under conditions with a higher cyclic confining pressure. The possible reason for this phenomenon is that the drained conditions of the specimens are inconsistent under cyclic loading. For example, the DN/D1 values with η = 0.33 and 2.00 are 0.181 and 0.278, respectively, at the accumulated axial strain of 1.00%.
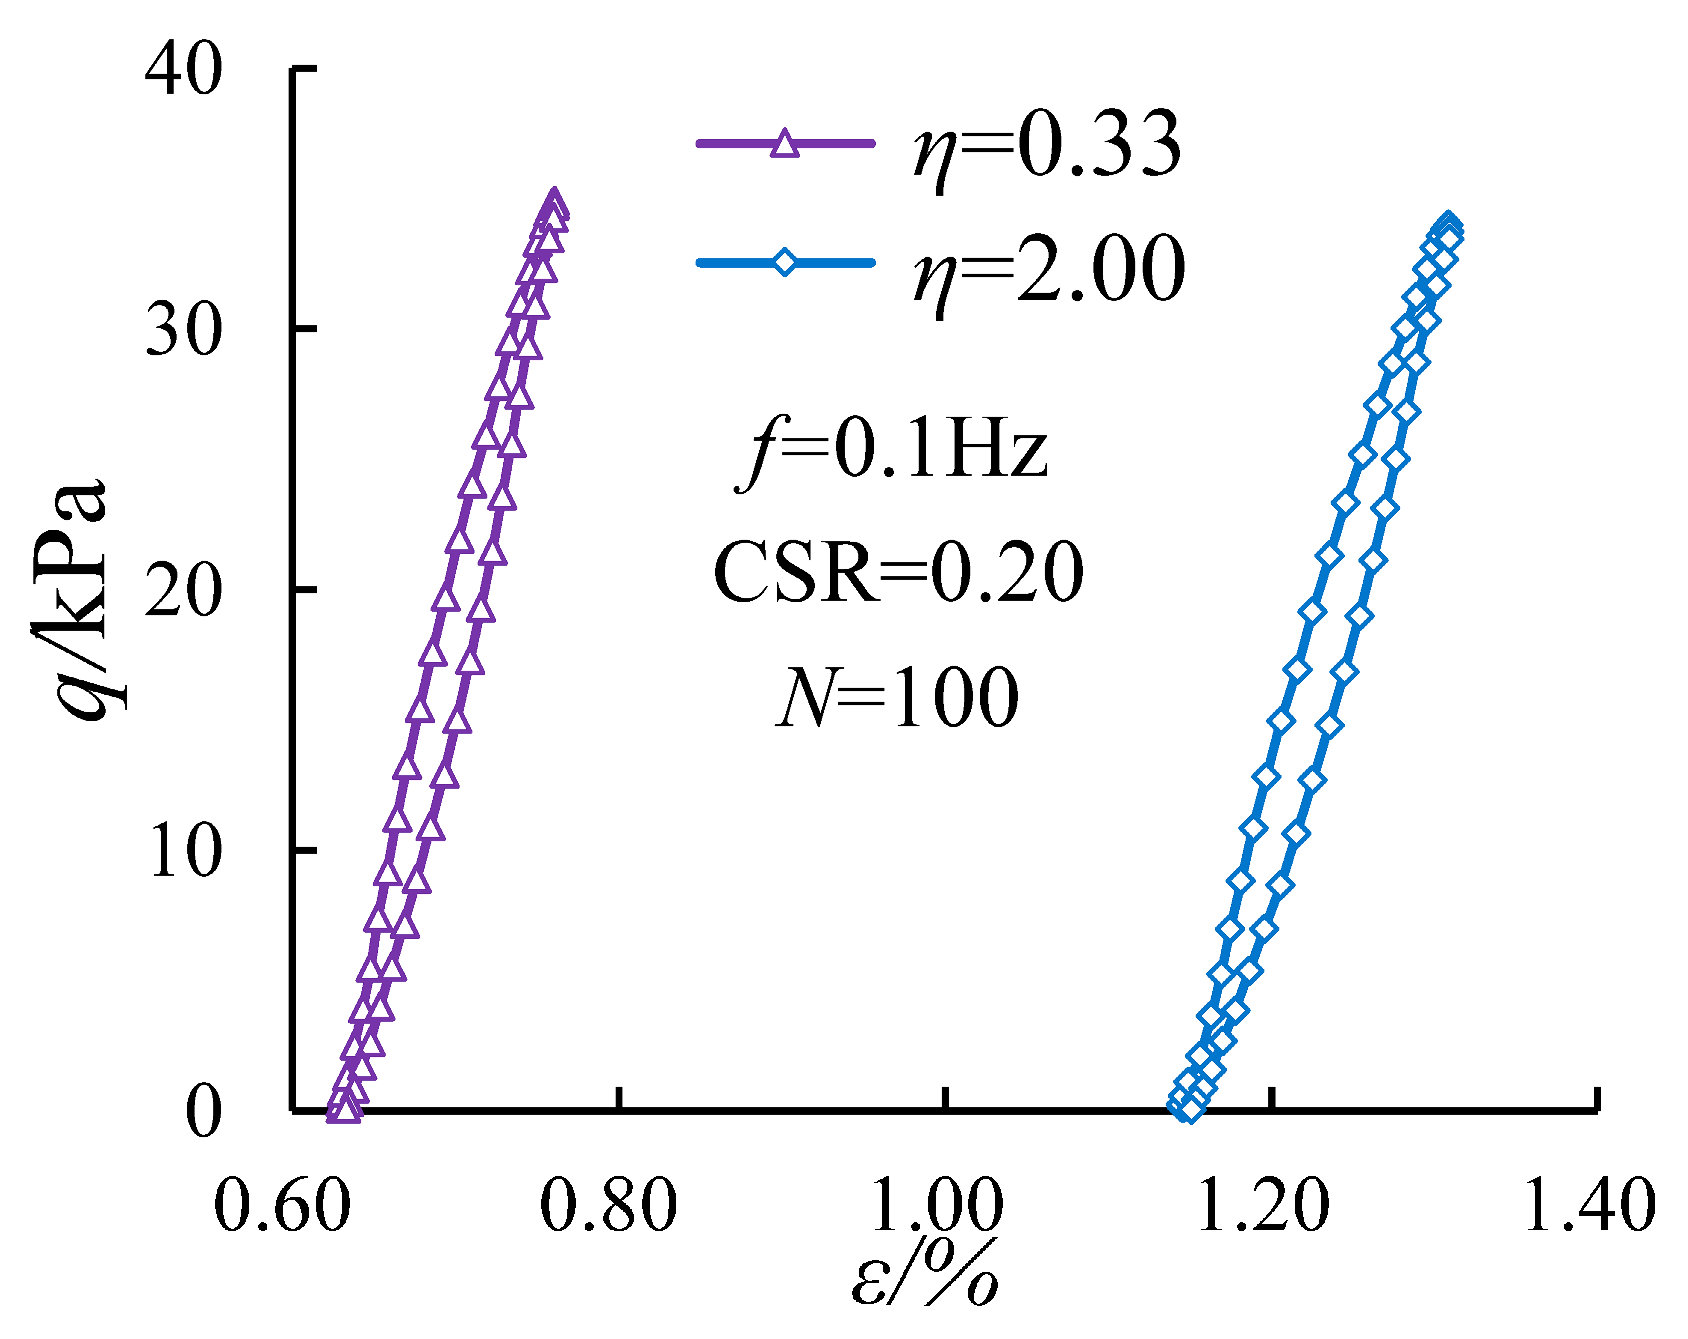
Furthermore, the damping ratio is lower under test conditions with η = 0.33 than that in test conditions with η = 2.00, implying that more energy is dissipated with greater cyclic confining pressure. Recalling previous studies, Ling et al. [3] considered that the variations in dynamic behaviors of soils were related to the generated accumulated axial strains under cyclic loading. Thus, the reason for the differences in the energy loss of specimens with different cyclic confining pressures may be related to the deformation behaviors under corresponding conditions; greater accumulated axial strains are generated with greater cyclic confining pressures under partially drained conditions. Figure 7 presents the differences in the hysteresis loops between η = 0.33 and 2.00 at 100 cycles. As seen, the areas of the hysteresis loops and the corresponding generated accumulated axial strains are different. The accumulated axial strains are 0.629% and 1.145% for the specimens with η = 0.33 and 2.00, respectively. Moreover, Aloop increases from 5.74 to 7.09 J/m3, and Atriangle increases from 21.79 to 26.29 J/m3; consequently, the damping ratio increases from 0.083 to 0.085.

3.3. Evolution of the Damping Ratio Under Intermittent Cyclic Loading

Figure 8 presents the development of DN/D1 for soft clay with different η-values. Figure 8a–c present the test conditions with η = 0.33, 1.00, and 2.00, respectively. Here, the trend of all curves is similar to that shown in Figure 6, as well as that shown in studies by some scholars [16,33,35]. Moreover, a greater DN/D1 value is obtained in the first loading stage, and DN/D1 decreases with the increase in loading stages.
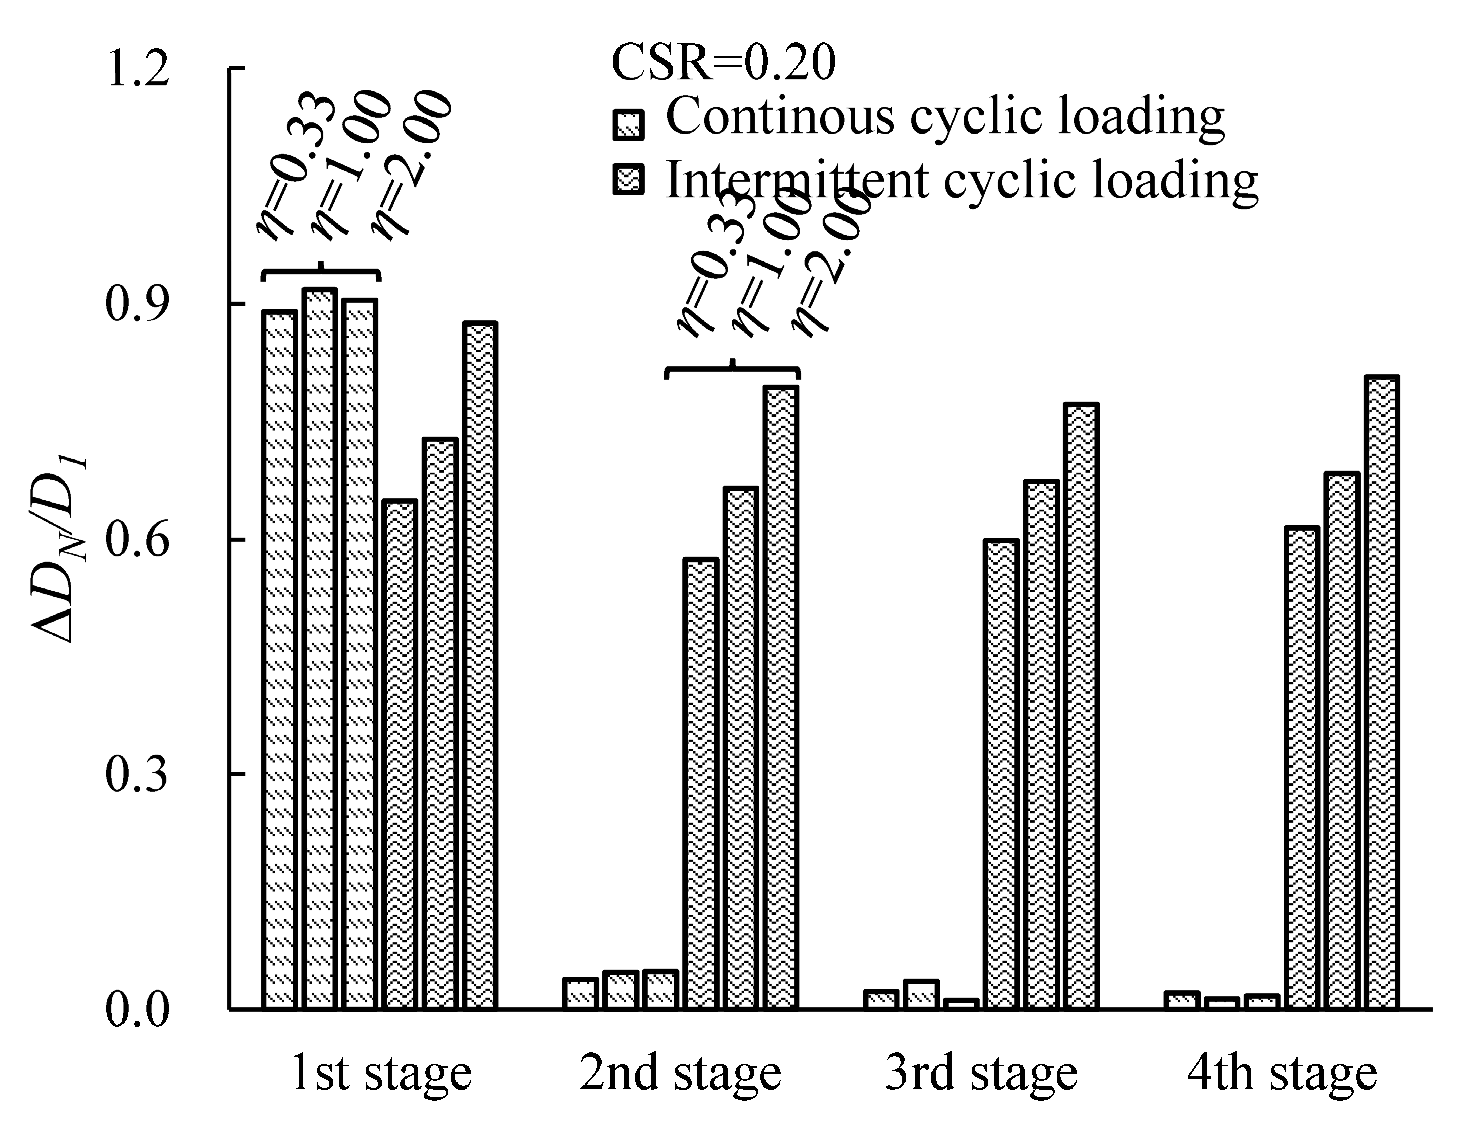
The variations in the normalized damping ratio in each loading stage under continuous and intermittent cyclic loading are counted, as shown in Figure 9. Divisions of 1000 cycles are considered to constitute each loading stage under continuous cyclic loading, i.e., cycle numbers of 1000, 2000, 3000, and 4000 represent the first, second, third, and fourth loading stages. As seen, the evolutions of the variation in the normalized damping ratio (i.e., ΔDN/D1) are different between the two loading modes; a greater value of ΔDN/D1 is observed in the first loading stage, and then it gradually decreases under continuous cyclic loading. Most of the variations are developed in the first loading stage, reaching 0.918; however, ΔDN/D1 is greater in the first loading stage, while the corresponding variations of the other loading stages are similar under intermittent cyclic loading. This indicates that the attenuation degrees of the normalized damping ratios are different in each loading stage. For example, the values of ΔDN/D1 for the specimen with η = 1.00 are 0.728, 0.665, 0.674, and 0.684 with the increase in the loading stage under intermittent cyclic loading, and the corresponding values are 0.918, 0.047, 0.036, and 0.013 under continuous cyclic loading. The above test results demonstrate that the effect of intermittent loading cannot be ignored.
Furthermore, recalling Figure 5, during a cycle at the end of each loading stage (i.e., N = 1000, 2000, 3000, and 4000 cycles), both Aloop and Atriangle can be obtained under continuous cyclic loading. Aloop decreases from 1.87 to 0.31 J/m3, and Atriangle decreases from 18.61 to 16.05 J/m3; thus, the damping ratio drops from 0.032 to 0.006. Similarly, Figure 10 illustrates the variations in hysteresis loops at the end of each loading stage. Herein, both Aloop and Atriangle vary with the increase in the loading stage; the values of Aloop are 3.14, 2.02, 1.49, and 0.95 J/m3, and the corresponding Atriangle values are 23.72, 21.18, 19.62, and 18.88 J/m3. Consequently, the corresponding damping ratios are 0.042, 0.030, 0.024, and 0.016, respectively. The above test results mean that most of the energy is consumed in the first loading stage, regardless of the different types of tests.
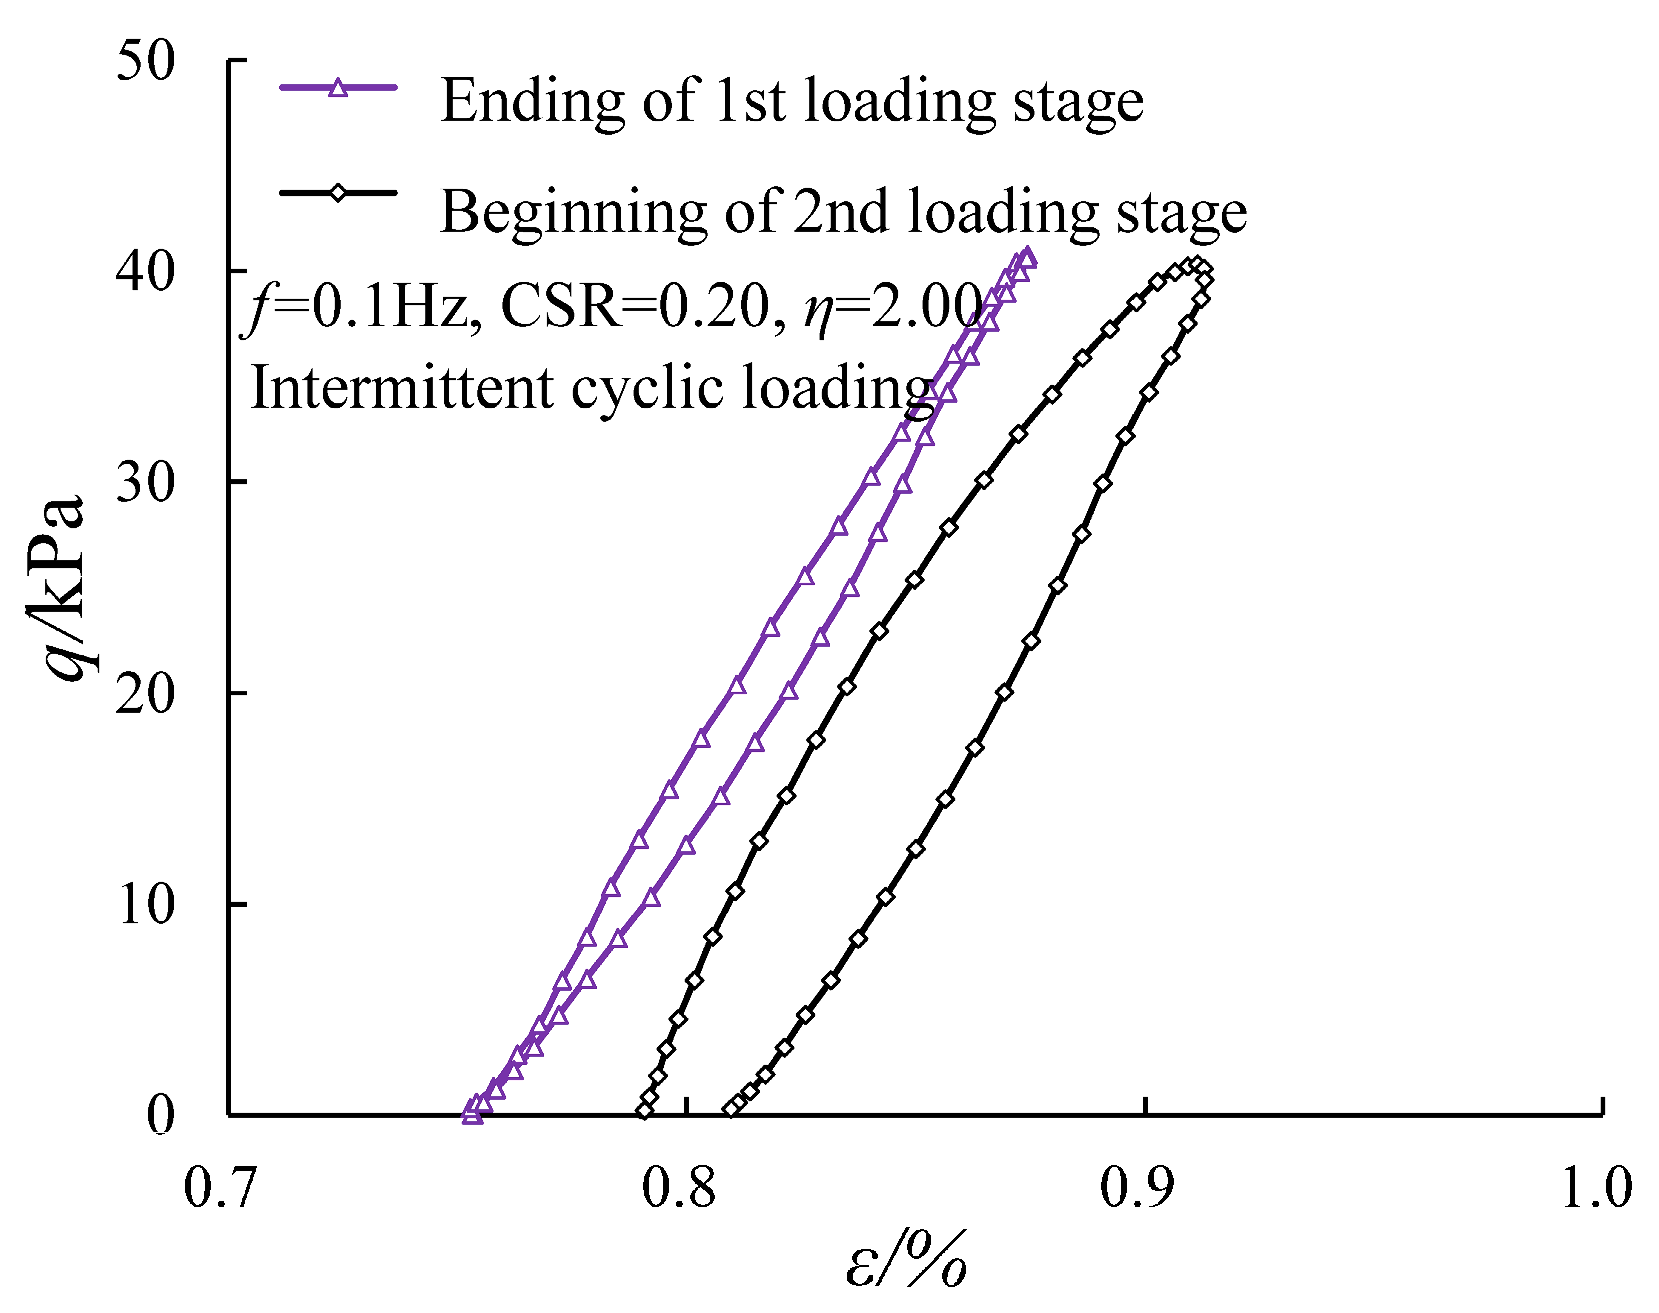
The values of D1 are 0.339, 0.147, 0.106, and 0.083 for each loading stage under intermittent cyclic loading with η = 2.00, meaning that the energy consumption during the first cycle of each loading stage decreases. Compared to the final damping ratio of the previous loading stage, the initial damping ratio of the current loading stage increases. Figure 11 shows the variations in the hysteresis loop at N = 1000 cycles for the first loading stage and N = 1 cycle for the second loading stage. Herein, Aloop increases from 3.14 to 11.39 J/m3, and Atriangle increases from 23.72 to 24.61 J/m3. Thus, the damping ratio increases from 0.042 to 0.147 when starting the second loading stage. This means that more energy is consumed, accompanied by an increase in the accumulated axial strain for the discharge of pore water during intermittent periods.

3.4. Evolution of the Damping Ratio with Various Cyclic Confining Pressures

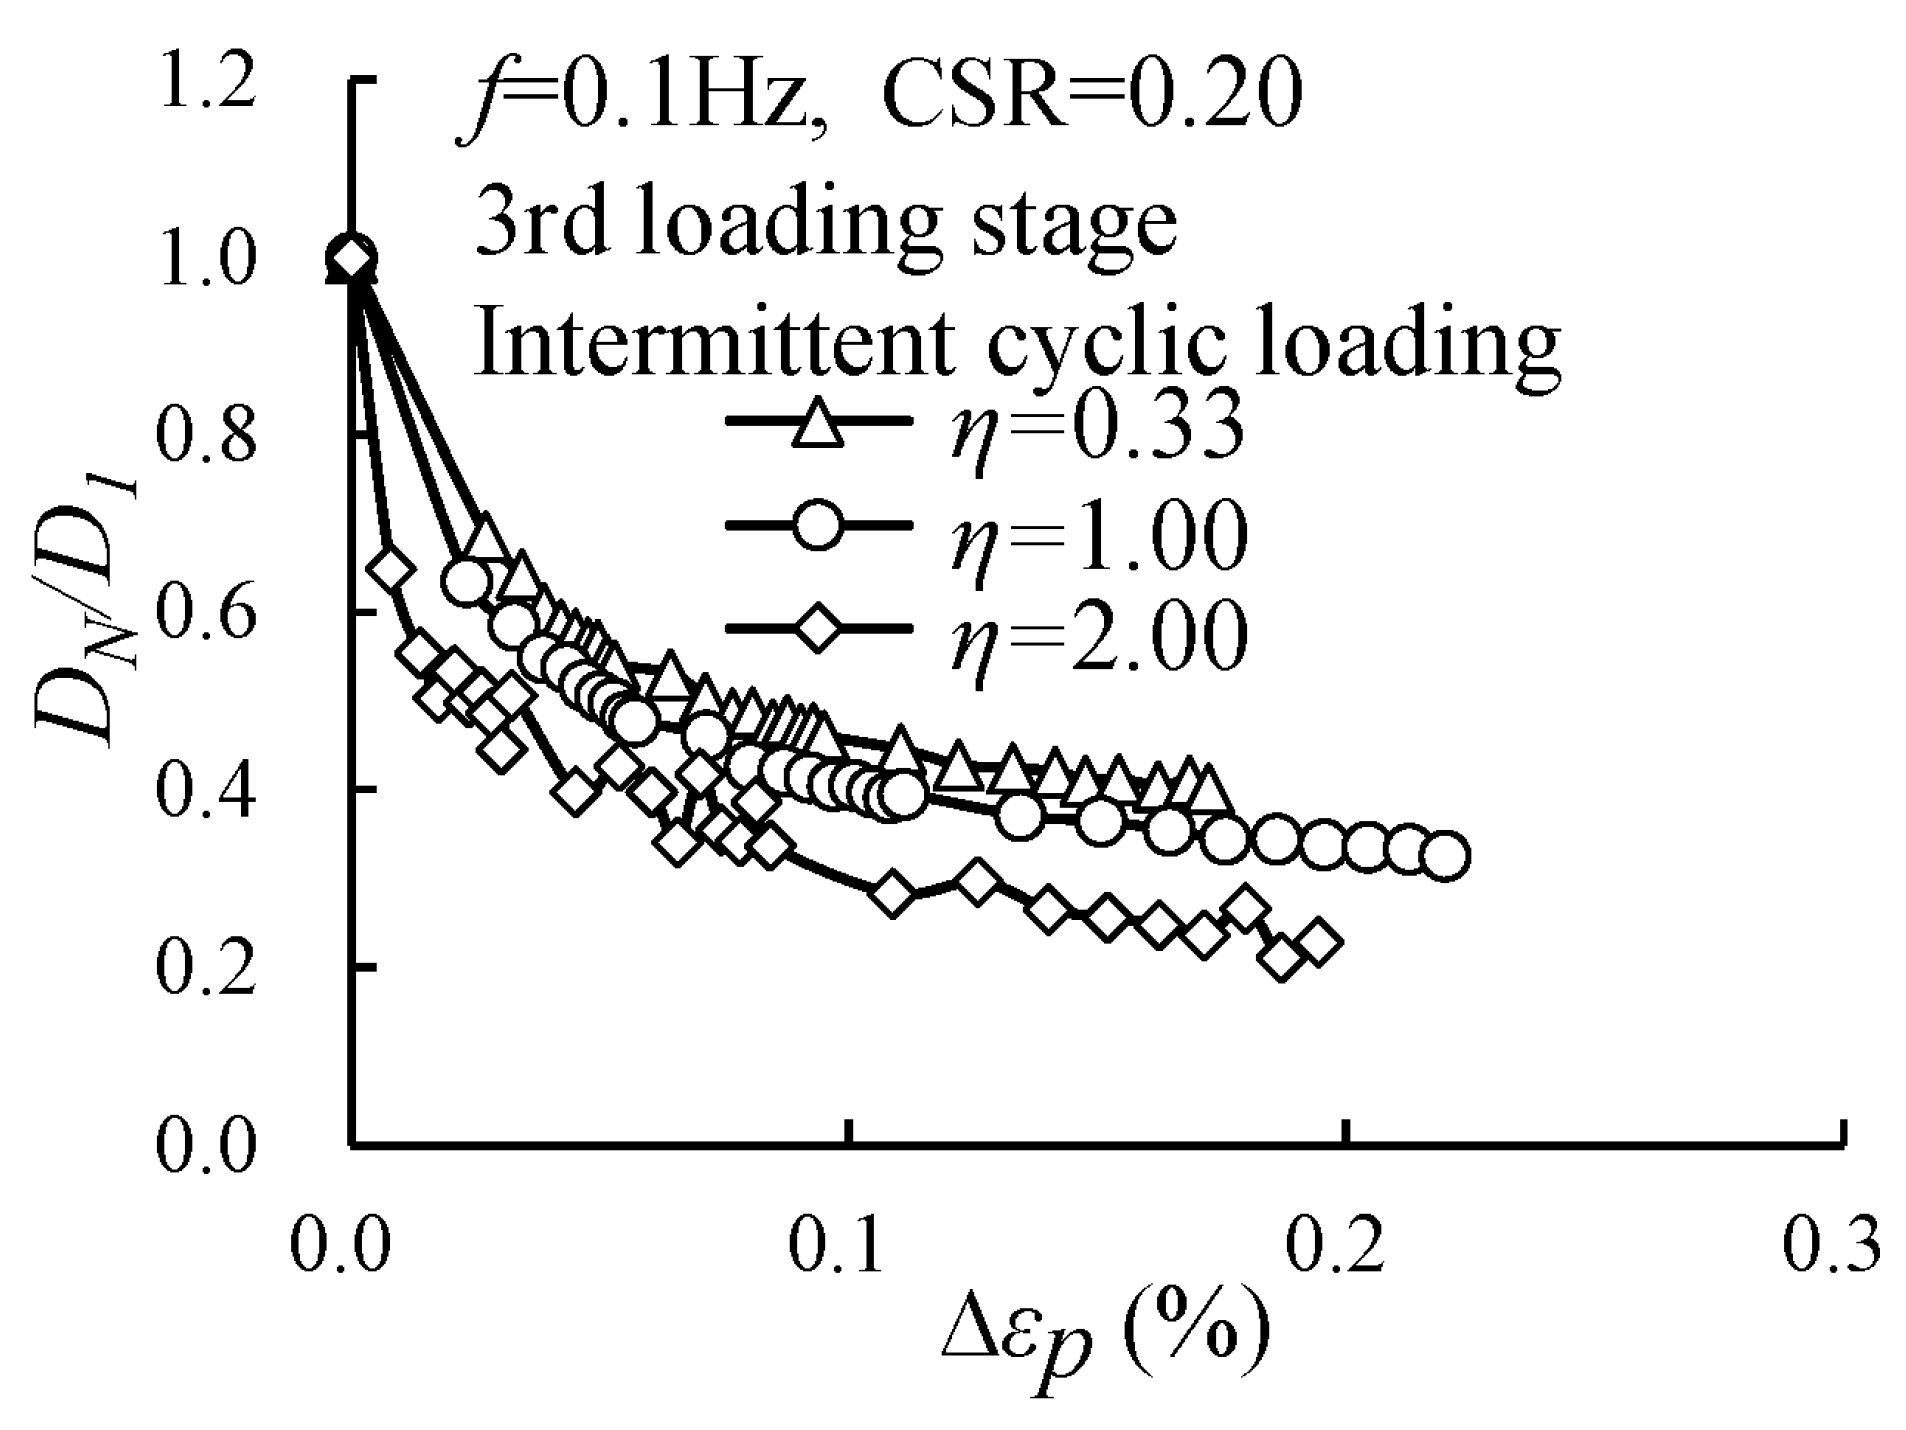
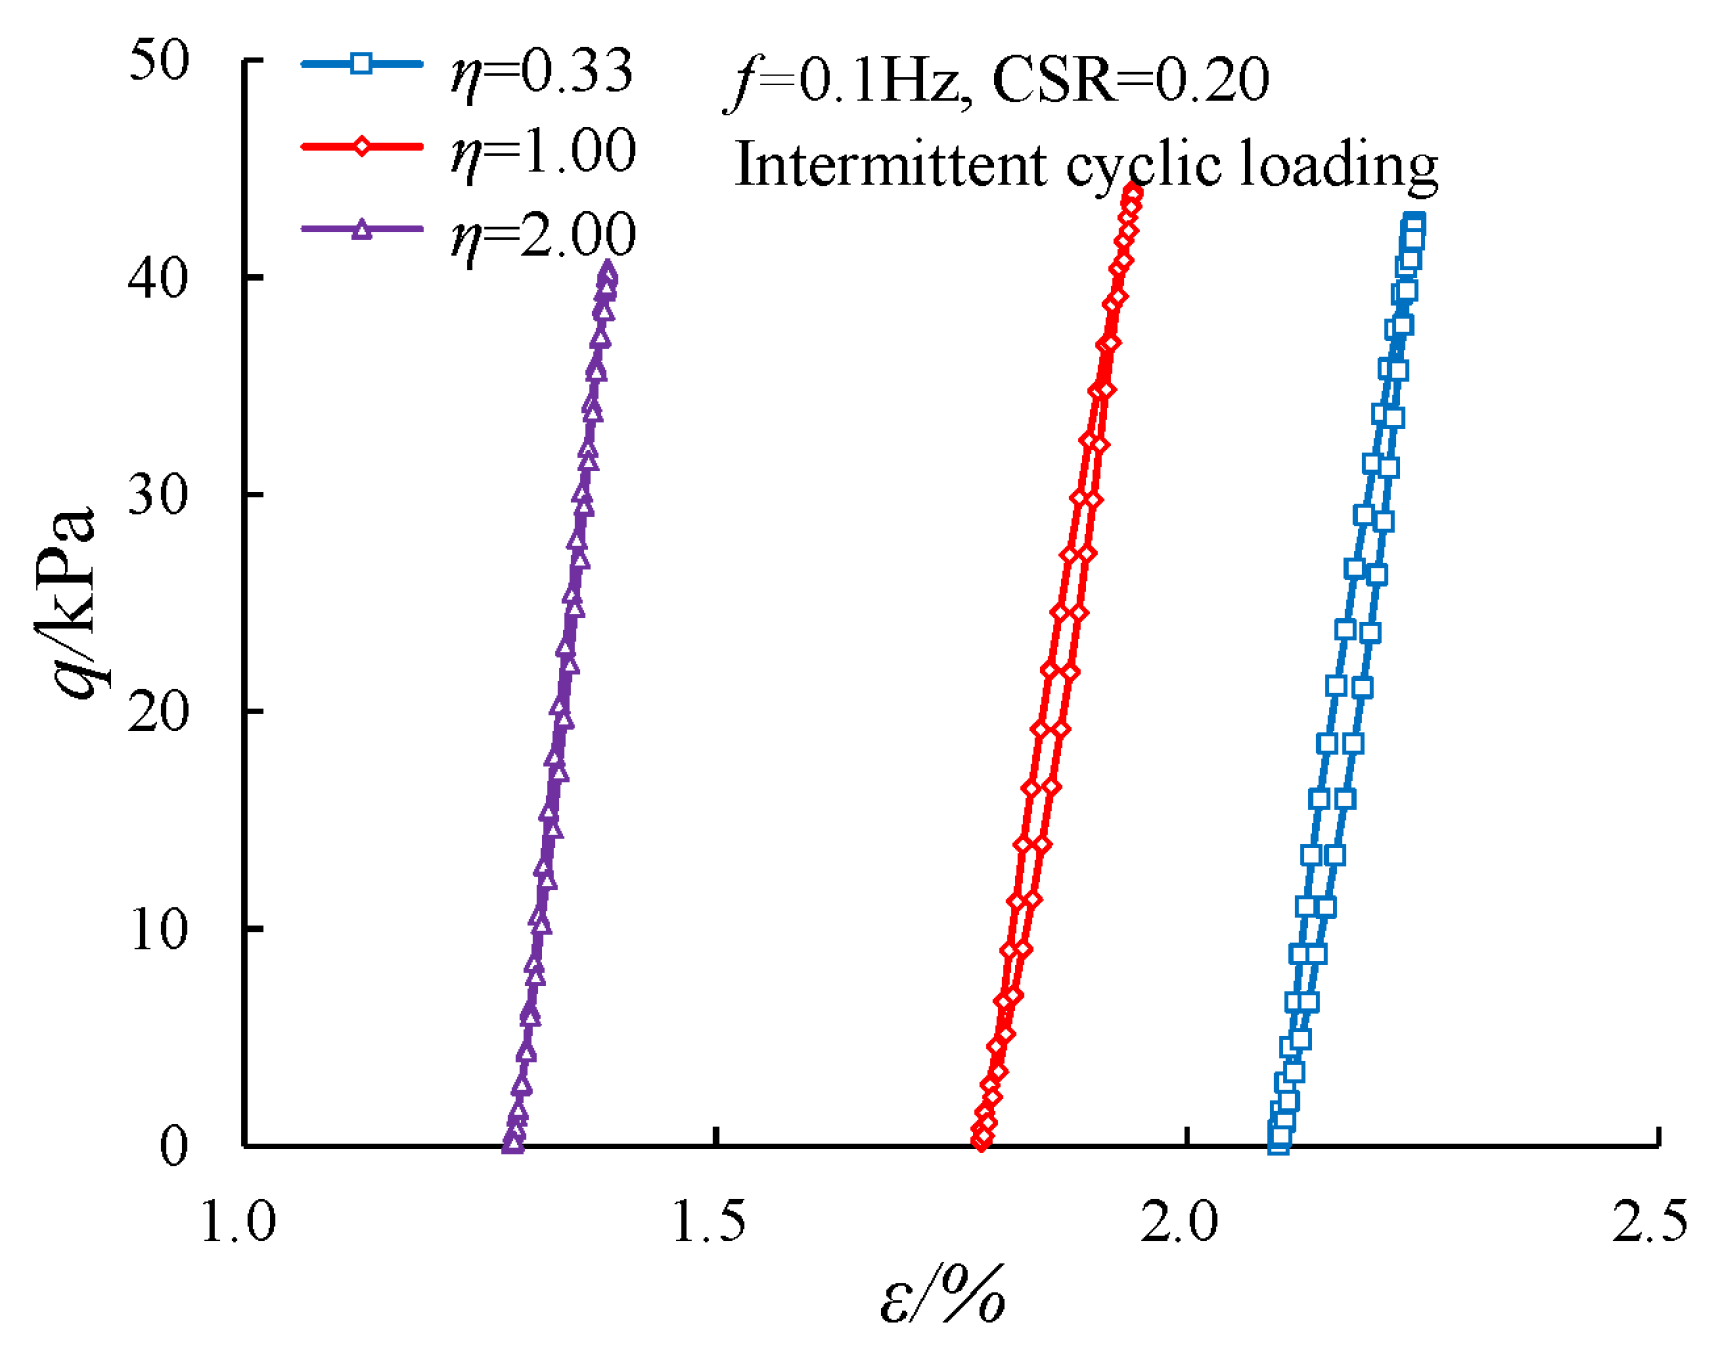
Figure 12 shows the evolution of the normalized damping ratio with various cyclic confining pressures. Here, the attenuation degrees of DN/D1 are different; the normalized damping ratio for the specimen with η = 0.33 decays by 60.0%, while the corresponding attenuation of the normalized damping ratio for the specimen with η = 2.00 reaches 77.2%. Moreover, a lower normalized damping ratio can be obtained under conditions with higher cyclic confining pressures; the corresponding normalized damping ratios are 0.411, 0.326, and 0.228 with η = 0.33, 1.00, and 2.00. Figure 13 shows the variations in hysteresis loops under different η-values at the end of the third loading stage (i.e., 3000 cycles). Here, the hysteresis loops become flatter under test conditions with a greater cyclic confining pressure. Moreover, both Aloop and Atriangle decrease as the cyclic confining pressure increases; Aloop decreases from 7.39 to 1.49 J/m3, and Atriangle drops from 29.31 to 19.62 J/m3.
There is less energy dissipated during one cycle under test conditions with cyclic confining pressure compared to those without cyclic confining pressure. The reason may be related to the generated accumulated axial strain of specimens with different cyclic confining pressure; a greater accumulated axial strain is generated with lower cyclic confining pressure during cyclic loading periods under undrained conditions. Based on that, the accumulated axial strains decrease from 2.097% to 1.284% as η increases from 0.33 to 2.00, and the damping ratio decreases from 0.080 to 0.024. Consequently, a lower cyclic confining pressure corresponds to a larger damping ratio.
Furthermore, the variations in the normalized damping ratios in each loading stage (i.e., ΔDN/D1) for the specimens with η = 0.33, 1.00, and 2.00 are counted and shown in Figure 14. Here, a greater value of ΔDN/D1 is obtained in the first loading stage, while the differences in ΔDN/D1 in other loading stages can be ignored in all cases. For example, the ΔDN/D1 values are 0.728, 0.665, 0.674, and 0.684 in each loading stage for the specimen with η = 1.00. The presence of cyclic confining pressure leads to a greater value of ΔDN/D1. For example, in the first loading stage, the value of ΔDN/D1 for the specimen with η = 0.33 was 0.649, while the corresponding values were 0.728 and 0.875 at η = 1.00 and 2.00, respectively.

3.5. Damping Ratio Model Under Intermittent Cyclic Loading

Based on the above test results, the effects of both intermittent loading and cyclic confining pressure on the evolution of the damping ratio cannot be ignored. Thus, regarding previous studies [16], the following model is employed to calculate the damping ratio:
D N D 1 = 1 1 + a ε p b
where a and b are fitting parameters related to the cyclic confining pressure and intermittent loading.
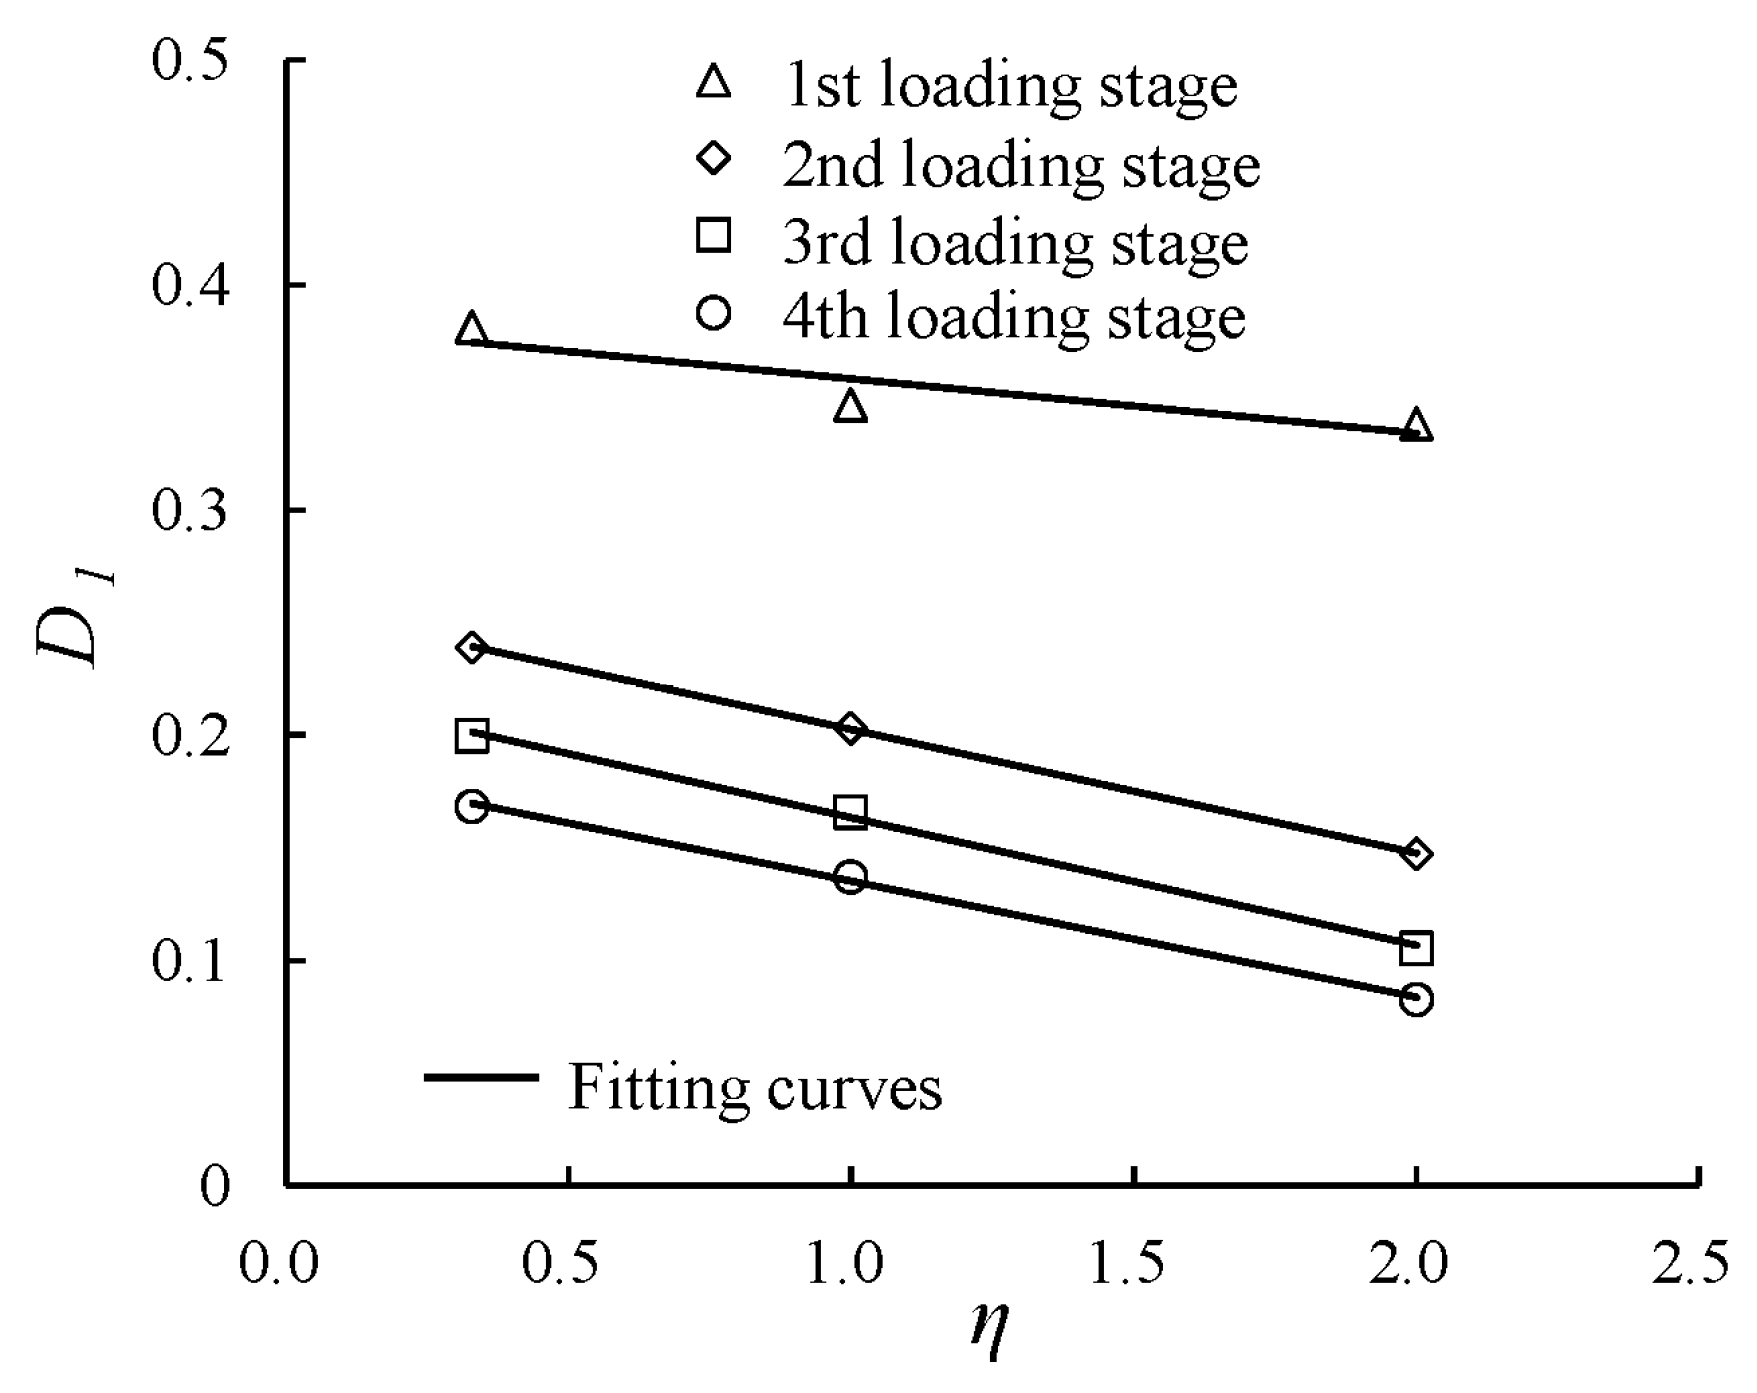
Recalling Figure 8, the variations in the normalized damping ratio are fitted using Equation (4). Table 2 lists the fitting parameters for many cases. As seen, Equation (4) is better for calculating the damping ratio. Furthermore, an analysis is conducted on the correlation between the fitting parameters of Equation (4) and the factors (i.e., cyclic confining pressure and intermittent loading). Recalling Table 2, the variations in fitting parameters (i.e., a and D1) versus the cyclic confining pressure show the opposite trends; the parameter a increases with an increase in the cyclic confining pressure, while the parameter D1 decreases in each loading stage. Figure 15 depicts the relationships between D1 and η in each loading stage. As seen, the values of D1 are greater in test conditions without cyclic confining pressure than the corresponding values in test conditions with cyclic confining pressure. Moreover, the variations in D1 concerning η can be depicted by a linear function as follows:
D 1 = α η + β
where α and β are fitting parameters. Table 3 lists the fitting parameters of Equation (5) using regression analysis.
Figure 16 depicts the relationship between a and η. Here, the relationships for different loading stages can be depicted by a linear function, as shown in Equation (6).
a = c η + d
where c and d are regression parameters.
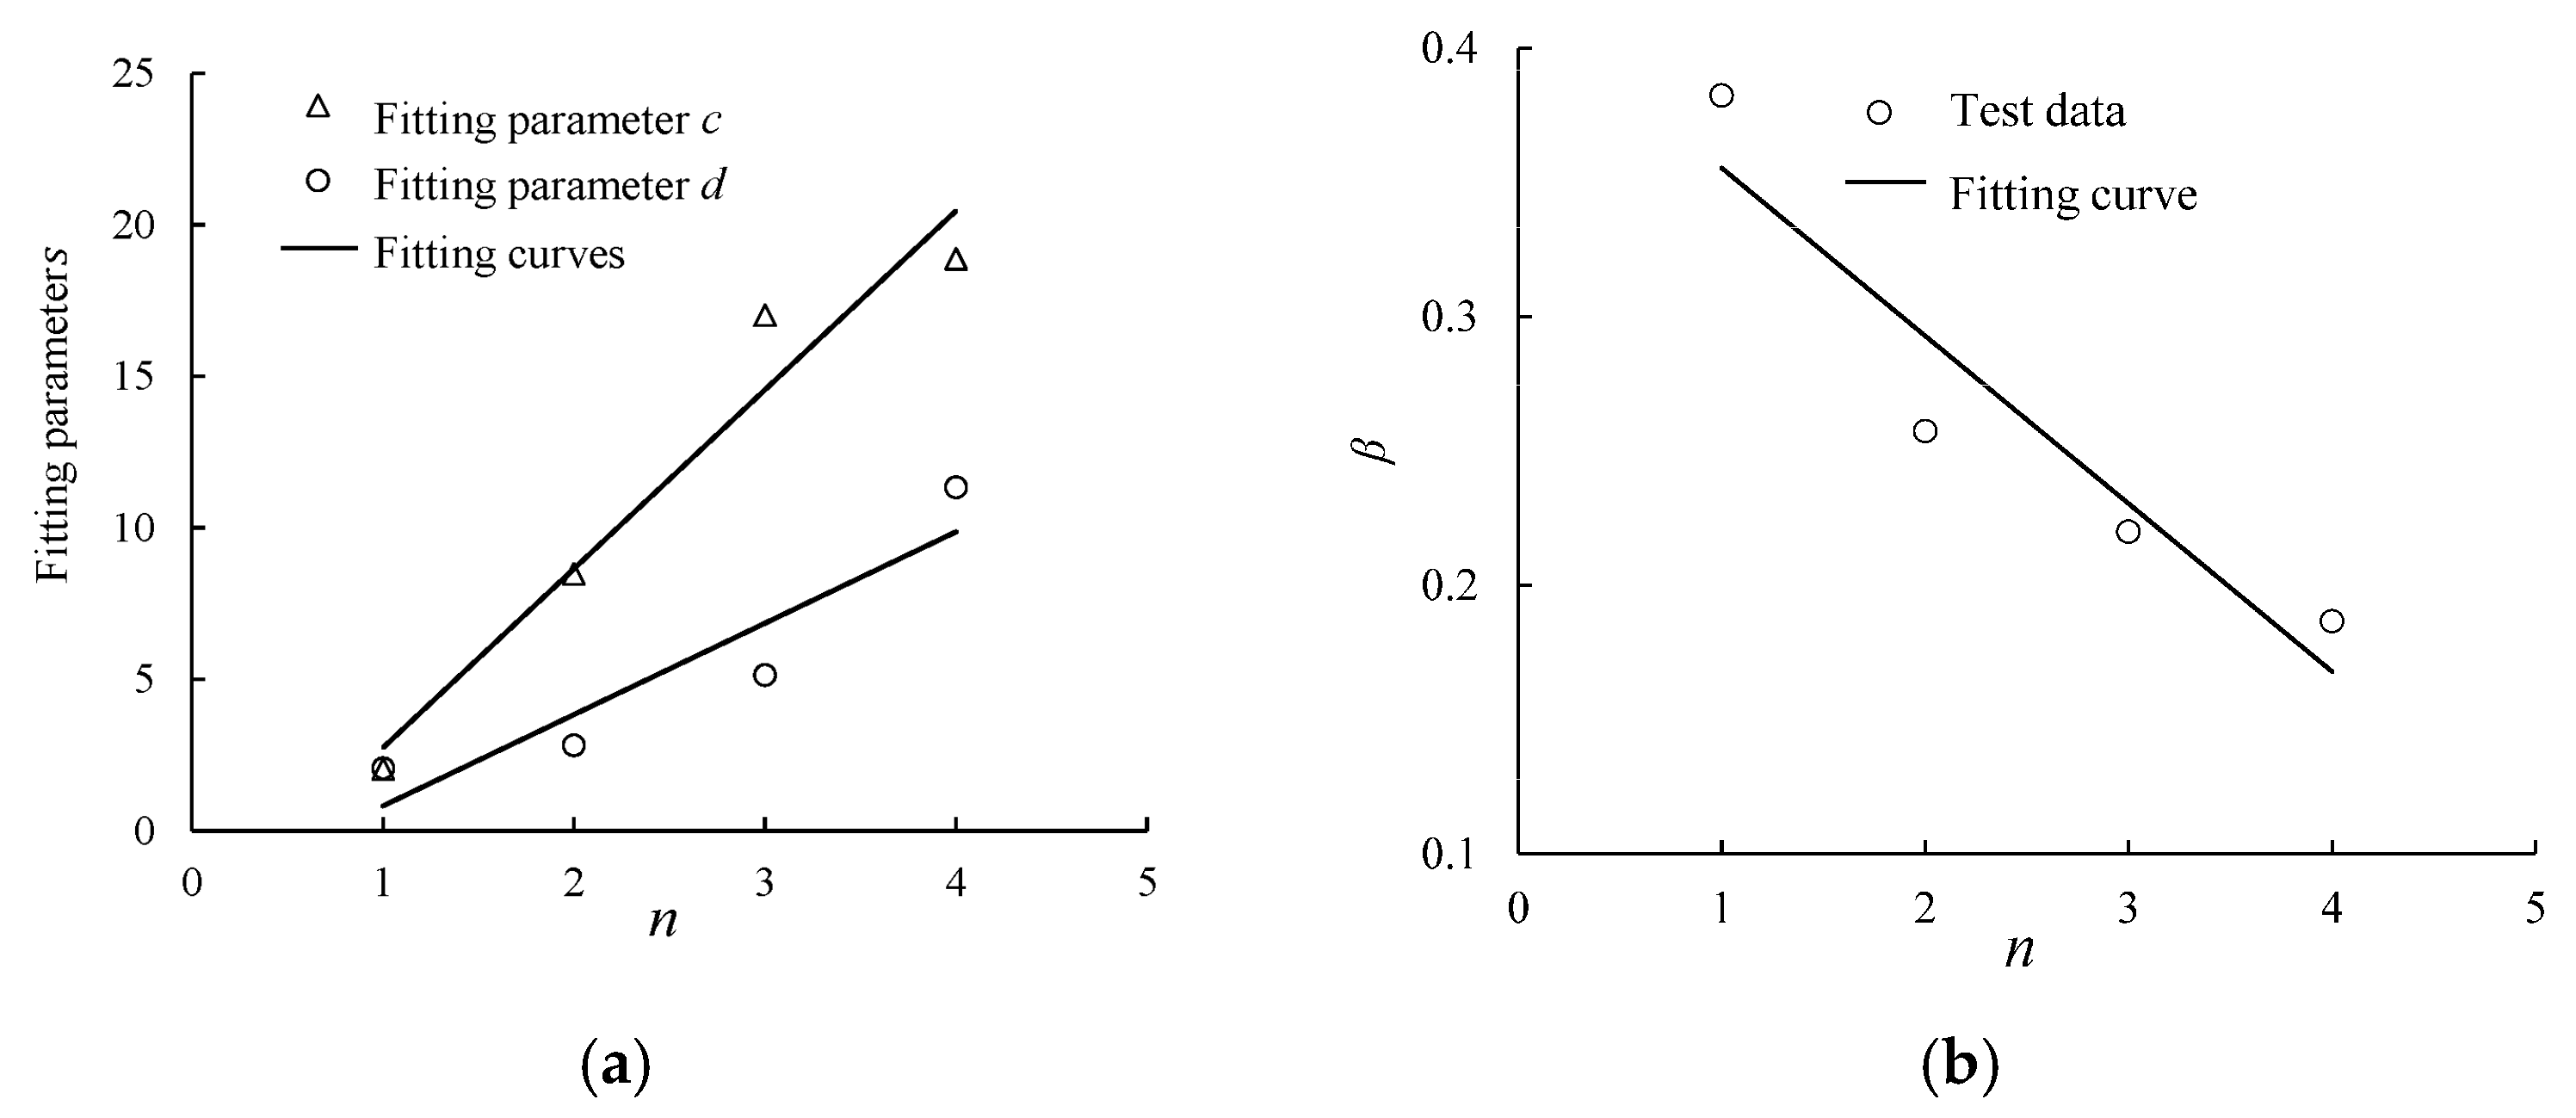
Furthermore, Figure 17 shows the variations in the fitting parameters in Equations (5) and (6) versus the loading stages; Figure 17a depicts the variations in parameters c and d, and Figure 17b presents the evolution of parameter β. Here, fitting parameters c and d show a linear increase with the loading stage, whereas parameter β decreases. The above relationships can be depicted as follows:
c = 5.91 n 3.17
d = 3.01 n 2.19
β = 0.06 n + 0.42
where n represents the loading stage index.
The variations in parameter b are not further studied due to their lack of clear representation through regression analysis. However, based on Table 2, the standard deviation and average value of parameter b under all test conditions are 0.194 and 0.661, respectively. Consequently, for simplicity, the value of parameter b in Equation (4) is considered constant at 0.661. The purpose of doing this is to facilitate the use of Equation (12). Similarly, the variation in parameter α in Equation (5) also cannot be described considering the above impact factors; thus, the average value of parameter α is taken as −0.047, and the standard deviation is 0.015. Taking Equations (7)–(9) into Equations (5) and (6), the formulas of fitting parameters a and D1can be modified as follows:
a = ( 5.91 n 3.17 ) η + 3.01 n 2.19
D 1 = 0.047 η 0.06 n + 0.42
Here, both Equations (5) and (6) are modified using Equations (10) and (11), considering the effects of the cyclic confining pressure and loading stage. Finally, combining Equations (10) and (11) and b = 0.661, Equation (4) is modified into Equation (12), which is related to the cyclic confining pressure and loading stage, as follows:
D N = 0.047 η 0.06 n + 0.42 1 1 + ( 5.91 n 3.17 ) η + 3.01 n 2.19 ε p b
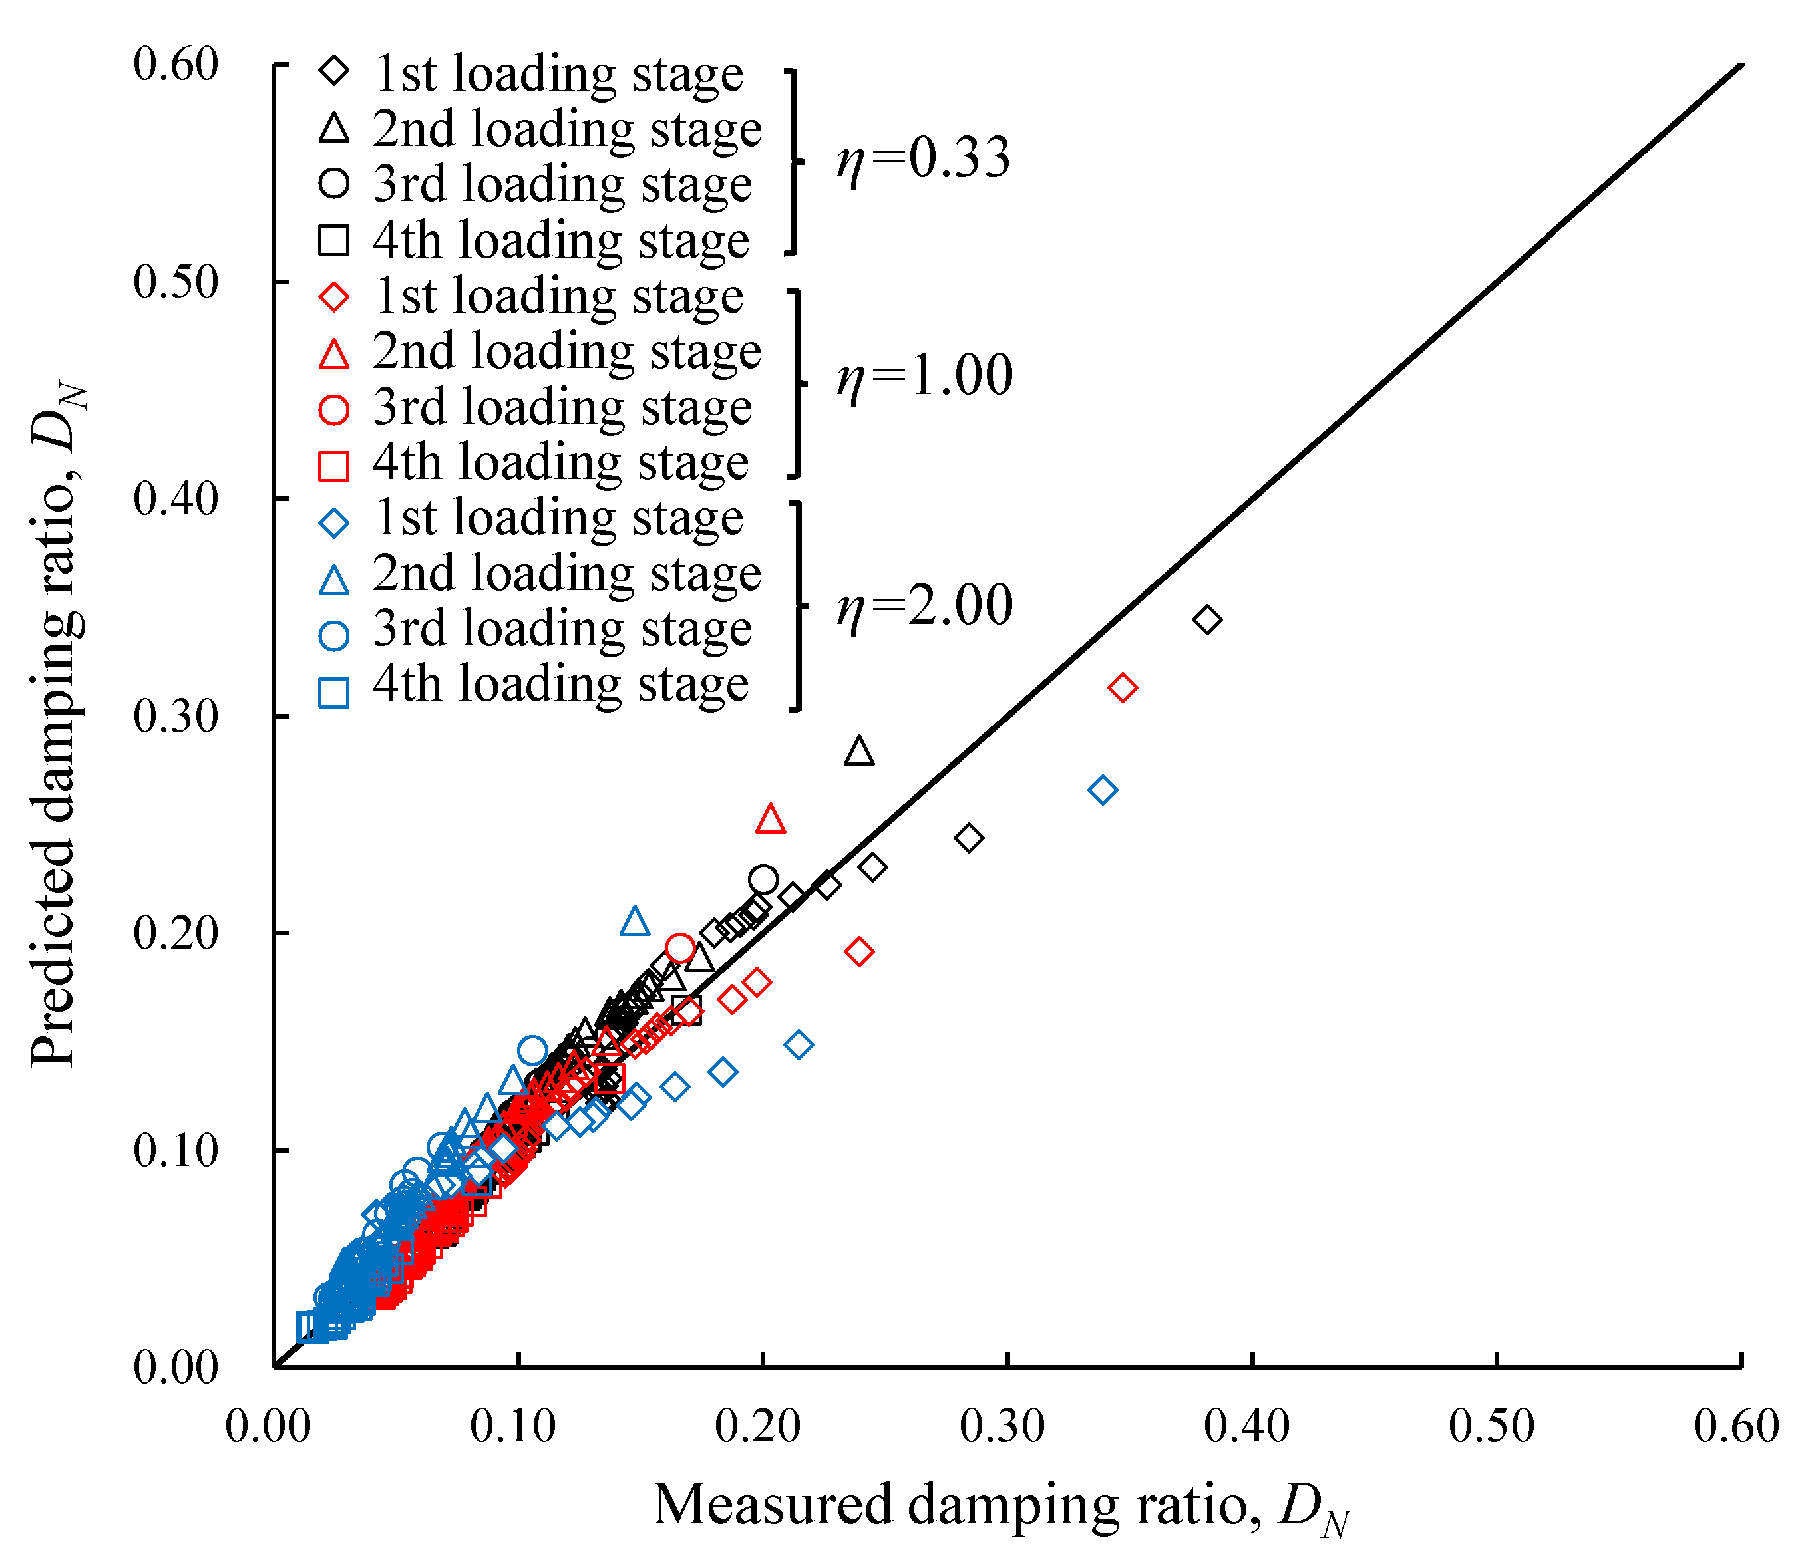
The application of Equation (4) is validated. The damping ratios at different cycles of each loading stage in Tests I01–I03, i.e., N = 1–10, 20, 30, 40, 50, 60, 70, 80, 90, 100, 200, 300, 400, 500, 600, 700, 800, 900, and 1000, are calculated using Equation (4). Figure 18 shows a comparison of the predicted results against test data. Herein, all data points are closely clustered around a line. Moreover, continuous cyclic loading could be regarded as a type of intermittent cyclic loading when the intermittent time equals zero. Moreover, the results of Tests C01–C03 and similar tests conducted by Liu et al. [35] and Huang et al. [33] are also used to validate the application of Equation (4). Table 4 lists the fitting parameters. The comparison between the predicted results and the experimental results from the literature is shown in Figure 19. Herein, the predicted results align well with the measured data. Thus, combining Figure 18 and Figure 19, the proposed empirical model can also predict the damping ratio well under intermittent cyclic loading with cyclic confining pressure.

4. Conclusions

Two types of cyclic triaxial tests were carried out to study the evolution of the damping ratio, in which continuous and intermittent cyclic loadings were applied to undisturbed soft clay. The effects of intermittent loading and cyclic confining pressure were analyzed. Additionally, an empirical model was used to calculate the damping ratio under intermittent cyclic loading. The main findings of this research are presented in the following.
(1)
Unlike continuous loading, where the normalized damping ratio progressively decreases, the corresponding variations, except those in the first loading stage, showed similar variation across later stages under intermittent cyclic loading. The normalized damping ratio showed a sudden increase in the initial damping ratio at each restart under intermittent cyclic loading.
(2)
Higher cyclic confining pressure reduced the normalized damping ratio. Under intermittent loading, the attenuation was significantly greater at higher cyclic confining pressures; the normalized damping ratio for the specimen with η = 0.33 decayed by 60.0%, while the corresponding attenuation for the specimen with η = 2.00 reached 77.2%.
(3)
The developed model accurately predicted the damping ratio under intermittent loading, and it was validated against test and literature data. Fitting parameters linking the effects of cyclic confining pressure and intermittent loading were analyzed.
Due to the limited number of specimens and to ensure the normal operation of the test system, the loading parameters in this study were insufficient. Thus, the evolution of the damping ratio was not investigated deeply enough, and the fitting functions employed were only applicable to the tested soil under the loading conditions employed in this study. However, this research approach can be used in the study of other soils. Microscopic tests will be performed on specimens after the application of intermittent cyclic loading with different cyclic confining pressures to discuss the mechanisms underlying the phenomena. The obtained test results will be assessed with supplementary test results while considering more factors.

Author Contributions

Conceptualization, methodology, and formal analysis, J.H., C.M. and M.W.; Writing—review and editing, J.H., Y.Z., J.C., X.F. and M.W.; Supervision, J.H., C.M., Y.Z., J.C., X.F. and M.W. All authors have read and agreed to the published version of the manuscript.

Funding

This research was funded by the Key R&D Program of Yunnan Province (No. 202303AA080010), the National Natural Science Foundation of China (No. 52079135) and the Youth Innovation Promotion Association of CAS (No. 2021325).

Data Availability Statement

The data generated or analyzed during this study are available from the corresponding author upon reasonable request.

Acknowledgments

We fully appreciate the editors and all anonymous reviewers for their constructive comments on this manuscript.

Conflicts of Interest

The authors declare no conflicts of interest.

References

  1. Cerni, G.; Cardone, F.; Virgili, A.; Camilli, S. Characterisation of permanent deformation behaviour of unbound granular materials under repeated triaxial loading. Constr. Build. Mater. 2012, 28, 79–87. [Google Scholar] [CrossRef]
  2. Cai, Y.Q.; Gu, C.; Wang, J.; Juang, C.H.; Xu, C.J.; Hu, X.Q. One-way cyclic triaxial behavior of saturated clay: Comparison between constant and variable confining pressure. J. Geotech. Geoenviron. Eng. 2013, 139, 797–809. [Google Scholar] [CrossRef]
  3. Ling, X.Z.; Li, Q.L.; Wang, L.N.; Zhang, F.; An, L.S.; Xu, P.J. Stiffness and damping ratio evolution of frozen clays under long-term low-level repeated cyclic loading: Experimental evidence and evolution model. Cold Reg. Sci. Technol. 2013, 86, 45–54. [Google Scholar]
  4. Rui, Y.C.; Chen, J.; Du, J.S.; Peng, X.; Zhou, Z.L.; Zhu, C. Optimizing microseismic sensor networks in underground space using Cramér–Rao Lower Bound and improved genetic encoding. Undergr. Space 2025, 23, 307–326. [Google Scholar] [CrossRef]
  5. Rui, Y.C.; Chen, J.; Pu, Y.Y.; Du, X.M. An innovative analytical solution of AE/MS source location with singular value decomposition and weight estimation. Measurement 2025, 253, 117652. [Google Scholar] [CrossRef]
  6. Kumar, S.S.; Krishna, M.A.; Dey, A. Evaluation of dynamic properties of sandy soil at high cyclic strains. Soil Dyn. Earthq. Eng. 2017, 99, 157–167. [Google Scholar] [CrossRef]
  7. Okur, D.V.; Ansal, A. Stiffness degradation of natural fine-grained soils during cyclic loading. Soil Dyn. Earthq. Eng. 2007, 27, 843–854. [Google Scholar] [CrossRef]
  8. Ishibashi, I.; Zhang, X. Unified dynamic shear moduli and damping ratios of sand and clay. Soils Found. 1993, 33, 182–191. [Google Scholar] [CrossRef]
  9. Hardin, B.O.; Drnevich, V.P. Shear modulus and damping in soils: Design equation and curves. J. Soil Mech. Found. ASCE 1972, 98, 667–692. [Google Scholar] [CrossRef]
  10. Subramaniam, P.; Banerjee, S. Shear modulus degradation model for cohesive soils. Soil Dyn. Earthq. Eng. 2013, 53, 210–216. [Google Scholar] [CrossRef]
  11. Rondon, H.A.; Wichtmann, T.; Triantafyllidis, T.; Lizcano, A. Comparison of cyclic triaxial behavior of unbound granular material under constant and variable confining pressure. J. Transp. Eng. 2009, 135, 467–478. [Google Scholar] [CrossRef]
  12. Gu, C.; Wang, J.; Cai, Y.Q.; Sun, L.; Wang, P.; Dong, Q.Y. Deformation characteristics of overconsolidated clay sheared under constant and variable confining pressure. Soils Found. 2016, 56, 427–439. [Google Scholar] [CrossRef]
  13. Wichtmann, T.; Niemunis, A.; Triantafyllidis, T.H. On the influence of the polarization and the shape of the strain loop on strain accumulation in sand under high-cyclic loading. Soil Dyn. Earthq. Eng. 2007, 27, 14–28. [Google Scholar] [CrossRef]
  14. Gu, C.; Wang, J.; Cai, Y.Q.; Yang, Z.X.; Gao, Y.F. Undrained cyclic triaxial behavior of saturated clays under variable confining pressure. Soil Dyn. Earthq. Eng. 2012, 40, 118–128. [Google Scholar]
  15. Sun, L.; Wang, P. Effects of cyclic confining pressure on the deformation characteristics of natural soft clay. Soil Dyn. Earthq. Eng. 2015, 78, 99–109. [Google Scholar] [CrossRef]
  16. Huang, J.H.; Chen, J.; Ke, W.H.; Zhong, Y.; Lu, Y.; Yi, S. Damping ratio evolution of saturated Ningbo clays under cyclic confining pressure. Soil Dyn. Earthq. Eng. 2021, 143, 106581. [Google Scholar]
  17. Huang, J.H.; Chen, J.; Ke, W.H.; Zhong, Y.; Lu, Y.; Yi, S. Post-cyclic mechanical behaviors of laterite clay with different cyclic confining pressures and degrees of reconsolidation. Soil Dyn. Earthq. Eng. 2021, 151, 106986. [Google Scholar] [CrossRef]
  18. Nie, R.S.; Li, Y.F.; Leng, W.M.; Mei, H.H.; Dong, J.L.; Chen, X.X. Deformation characteristics of fine-grained soil under cyclic loading with intermittence. Acta Geotech. 2020, 15, 3041–3054. [Google Scholar] [CrossRef]
  19. Nie, R.S.; Mei, H.H.; Leng, W.M.; Ruan, B.; Li, Y.F.; Chen, X.X. Characterization of permanent deformation of fine-grained subgrade soil under intermittent loading. Soil Dyn. Earthq. Eng. 2020, 139, 106395. [Google Scholar] [CrossRef]
  20. Mamou, A.; Powrie, W.; Priest, J.A.; Clayton, C. The effects of drainage on the behaviour of railway track foundation materials during cyclic loading. Géotechnique 2017, 67, 845–854. [Google Scholar] [CrossRef]
  21. Zheng, Q.; Xia, T.; Ding, Z.; He, S. The effect of periodic intermittency on the cyclic behavior of marine sedimentary clay. Mar. Georesour. Geotec. 2019, 37, 945–959. [Google Scholar] [CrossRef]
  22. Lei, H.Y.; Liu, M.; Feng, S.X.; Liu, J.J.; Jiang, M.J. Cyclic behavior of Tianjin soft clay under intermittent combined-frequency cyclic loading. Int. J. Geomech. 2020, 20, 04020186. [Google Scholar] [CrossRef]
  23. Chen, X.X.; Nie, R.S.; Li, Y.F.; Guo, Y.P.; Dong, J.L. Resilient modulus of fine-grained subgrade soil considering load interval: An experimental study. Soil Dyn. Earthq. Eng. 2021, 142, 106558. [Google Scholar] [CrossRef]
  24. Yildirim, H.; Ersan, H. Settlements under consecutive series of cyclic loading. Soil Dyn. Earthq. Eng. 2007, 27, 577–585. [Google Scholar] [CrossRef]
  25. Wang, J.; Cai, Y.Q.; Guo, L.; Yang, F. Pore pressure and strain development of Wenzhou saturated soft soil under cyclic loading by stages. Chin. J. Geotech. Eng. 2012, 34, 1349–1354. [Google Scholar]
  26. GB/T 50123-2019; Standard for Geotechnical Testing Method. MWR (Ministry of Water Resources): Beijing, China, 2019.
  27. ASTM D2487; Standard Practice for Classification of Soils for Engineering Purposes (Unified Soil Classification System). ASTM: West Conshohocken, PA, USA, 2017.
  28. Sakai, A.; Samang, L.; Miura, N. Partially-drained cyclic behavior and its application to the settlement of a low embankment road on silty-clay. Soils Found. 2003, 43, 33–46. [Google Scholar] [CrossRef]
  29. Huang, B.; Ding, H.; Chen, Y.M.; Bian, X.C. Experimental study of undrained strength property of saturated silty clay after traffic load. Chin. J. Rock Mech. Eng. 2010, 29, 3986–3993. [Google Scholar]
  30. Chen, W.B.; Yin, J.H.; Feng, W.Q.; Borana, L.; Chen, R.P. Accumulated permanent axial strain of a subgrade fill under cyclic high-speed railway loading. Int. J. Geomech. 2018, 18, 04018018. [Google Scholar] [CrossRef]
  31. Hyodo, M.; Hyde, A.F.L.; Yamamoto, Y.; Fujii, T. Cyclic shear strength of undisturbed and remoulded marine clays. Soils Found. 1999, 39, 45–58. [Google Scholar] [CrossRef] [PubMed]
  32. Simomsen, E.; Isacsson, U. Soil behavior during freezing and thawing using variable and constant confining pressure triaxial tests. Can. Geotech. J. 2001, 38, 863–875. [Google Scholar] [CrossRef]
  33. Huang, J.H.; Chen, J.; Yu, S.; Fu, X.D.; Zhang, G.C.; Tian, N. Dynamic behaviors of overconsolidated clay under cyclic confining pressure. Int. J. Geomech. 2022, 22, 04022197. [Google Scholar] [CrossRef]
  34. Lin, B.; Zhang, F.; Feng, D.C.; Tang, K.W.; Feng, X. Dynamic shear modulus and damping ratio of thawed saturated clay under long-term cyclic loading. Cold Reg. Sci. Technol. 2018, 145, 93–105. [Google Scholar] [CrossRef]
  35. Liu, F.C.; Shang, S.P.; Wang, H.D. Study of strain accumulation strengthened model for clay under cyclic loadings. Rock Soil Mech. 2018, 29, 2457–2462. [Google Scholar]
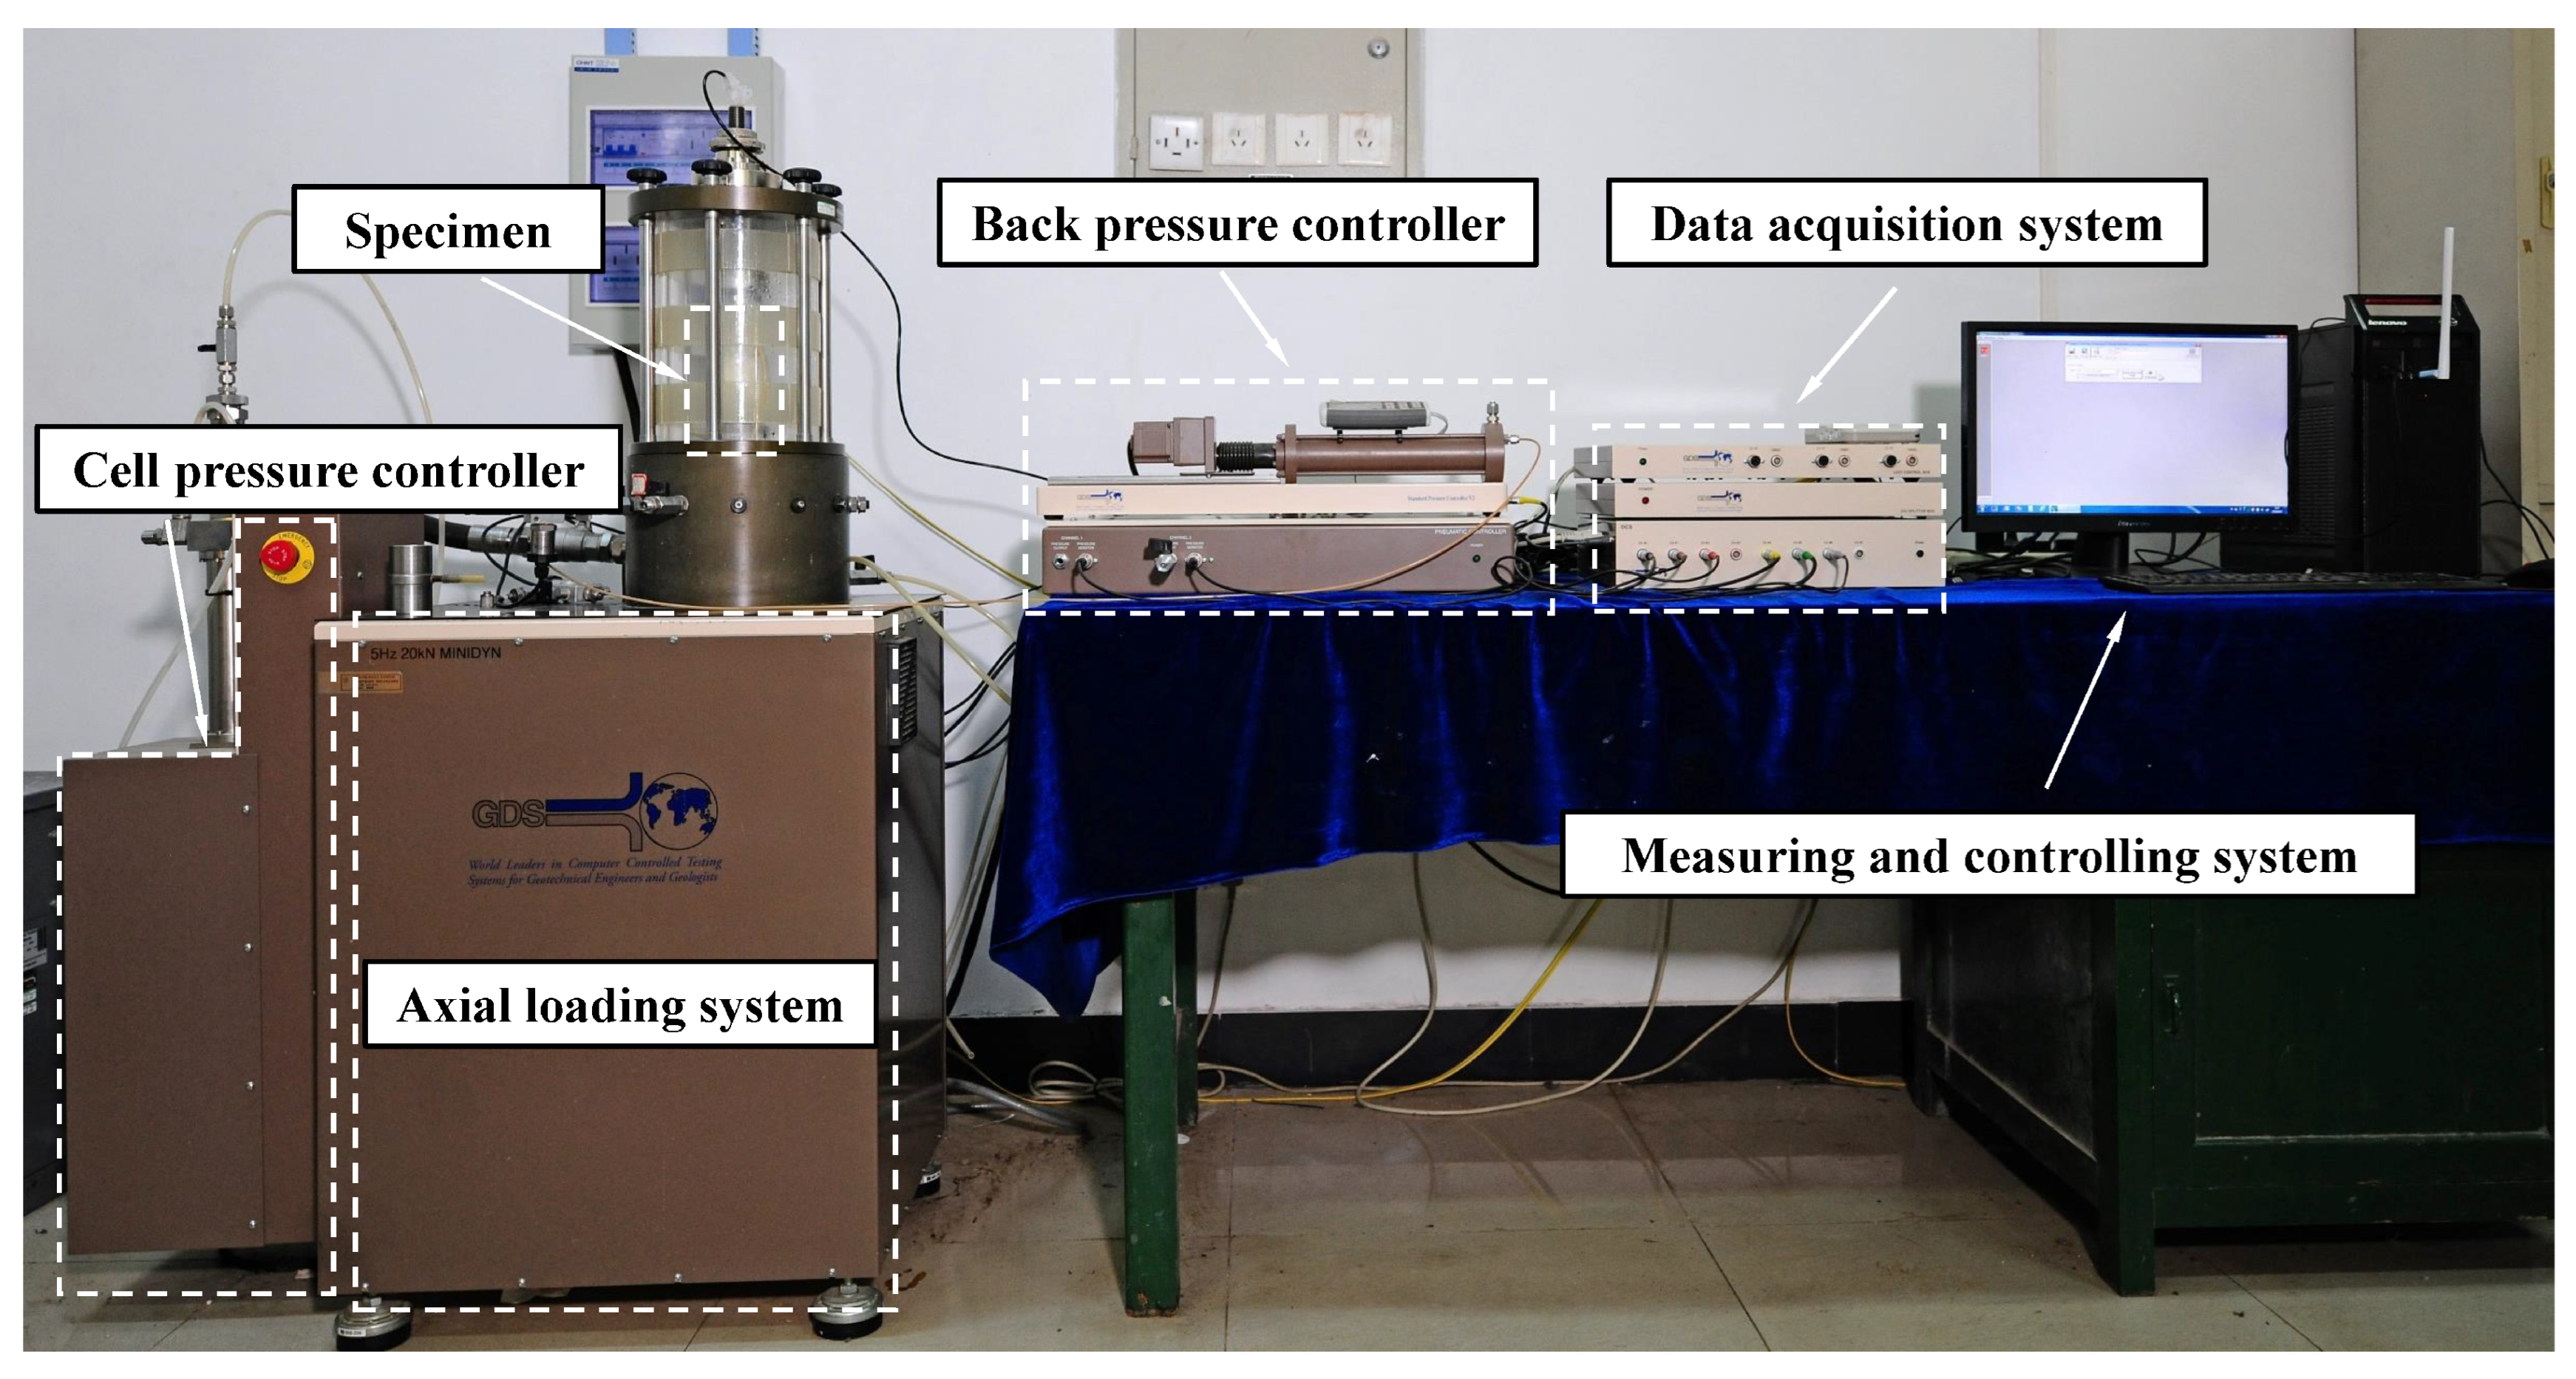
Figure 1. Diagram of the GDS dynamic triaxial system.
Buildings 15 02882 g001
Figure 2. Schematic illustration of cyclic triaxial tests with intermittent cyclic loading: (a) variations in the cyclic confining pressure; (b) variations in the cyclic deviator stress.
Buildings 15 02882 g002aBuildings 15 02882 g002b
Figure 3. Schematic illustration of cyclic triaxial tests with continuous cyclic loading: (a) variations in the cyclic confining pressure; (b) variations in the cyclic deviator stress.
Buildings 15 02882 g003
Figure 4. Schematic illustration of a hysteresis loop.
Buildings 15 02882 g004
Figure 5. Variations in hysteresis loops with different numbers of cycles.
Buildings 15 02882 g005
Figure 6. Variations in the normalized damping ratio with accumulated axial strain under different η-values in continuous cyclic loading.
Buildings 15 02882 g006
Figure 7. Differences in hysteresis loops between tests with and without cyclic confining pressure at 100 cycles.
Buildings 15 02882 g007
Figure 8. Evolution of the normalized damping ratio of soft clay under intermittent cyclic loading: (a) η = 0.33, (b) η = 1.00, and (c) η = 2.00.
Buildings 15 02882 g008
Figure 9. Statistics of the normalized damping ratio variations in each loading stage under different cyclic loading modes.
Buildings 15 02882 g009
Figure 10. Variations in hysteresis loops at the end of each loading stage under intermittent cyclic loading with η = 2.00.
Buildings 15 02882 g010
Figure 11. Variations in the hysteresis loop at N = 1000 cycles for the first loading stage and N = 1 cycle for the second loading stage.
Buildings 15 02882 g011
Figure 12. Evolution of the normalized damping ratio with various cyclic confining pressures.
Buildings 15 02882 g012
Figure 13. Variations in hysteresis loops under different η-values at the end of the third loading stage.
Buildings 15 02882 g013
Figure 14. Statistics of normalized damping ratio variations in each loading stage for the specimens with η = 0.33, 1.00, and 2.00.
Buildings 15 02882 g014
Figure 15. Relationships between D1and η in each loading stage.
Buildings 15 02882 g015
Figure 16. Relationship between a and η.
Buildings 15 02882 g016
Figure 17. Determination of fitting parameters in Equations (5) and (6): (a) variations in fitting parameters c and d and (b) evolution of fitting parameter β.
Buildings 15 02882 g017
Figure 18. Comparison of the predicted results with test data.
Buildings 15 02882 g018
Figure 19. Comparison of the model with the experimental results in the literature of references [33,35].
Buildings 15 02882 g019
Table 1. Summary of the cyclic triaxial tests.
No. of TestsLoad ModesEffective Confining Pressure Po′ (kPa)η σ 3 ampl
(kPa)
CSRqampl (kPa)Loading Cycles, NIntermittent Time △t (s)Drained Conditions
C01Continuous cyclic loading1000.3300.20404000/Partially drained conditions
C021.0027
C032.0067
I01Intermittent cyclic loading0.3301000 × 43600Cyclic loading period: undrained conditions
Intermittent period: partially drained conditions
I021.0027
I032.0067
Table 2. Fitting parameters of Equation (4).
No. of the Loading StageηabD1R2
First loading stage0.332.7150.5920.3810.935
1.004.1160.7430.3470.972
2.006.1111.2370.3390.998
Second loading stage0.336.3160.6750.2390.976
1.0010.1270.6430.2030.989
2.0020.2330.7050.1470.988
Third loading stage0.3312.8050.5850.2000.989
1.0018.7420.5500.1660.994
2.0040.5480.5510.1060.977
Fourth loading stage0.3319.1130.5350.1680.992
1.0027.6130.5300.1370.997
2.0050.1170.5910.0830.965
Table 3. Fitting parameters of Equation (5).
No. of the Loading StageαβR2
First loading stage−0.0240.3820.805
Second loading stage−0.0550.2570.999
Third loading stage−0.0570.2200.997
Fourth loading stage−0.0520.1870.998
Table 4. Fitting results.
No. of TestsSoilReferenceηabR2
C01ClayPresent study0.336.0360.9750.987
C021.0012.3770.7770.972
C032.002.4041.2090.987
Y01[33]0.3331.5010.7670.991
Y021.508.2720.5950.985
Y031.5048.4710.6740.983
Y040.3311.4410.5690.987
S4[35]0.3312.7441.3450.984
S50.338.5811.440.991
Disclaimer/Publisher’s Note: The statements, opinions and data contained in all publications are solely those of the individual author(s) and contributor(s) and not of MDPI and/or the editor(s). MDPI and/or the editor(s) disclaim responsibility for any injury to people or property resulting from any ideas, methods, instructions or products referred to in the content.