Article

A Living Lab for Indoor Air Quality Monitoring in an Architecture School: A Low-Cost, Student-Led Approach

by
Robiel Manzueta
1,*,
César Martín-Gómez
1,
Leire Gómez-Olagüe
1,
Amaia Zuazua-Ros
1,
Sara Dorregaray-Oyaregui
1 and
Arturo H. Ariño
2
1
Department of Construction, Building Services and Structures, Universidad de Navarra, 31008 Pamplona, Spain
2
Institute of Biodiversity and the Environment (BIOMA), Universidad de Navarra, 31008 Pamplona, Spain
*
Author to whom correspondence should be addressed.
Buildings 2025, 15(16), 2873; https://doi.org/10.3390/buildings15162873
Submission received: 1 July 2025 / Revised: 8 August 2025 / Accepted: 11 August 2025 / Published: 14 August 2025
(This article belongs to the Special Issue Indoor Air Quality and Ventilation in the Era of Smart Buildings)

Abstract

Students and educators spend considerable time in indoor learning spaces on university campuses, where indoor air quality (IAQ), of which particulate matter (PM) is an important component, is a critical concern that architecture students must address. However, IAQ is seldom monitored and very rarely, if at all, reported in these spaces. We used a novel living lab approach to provide third-year students of building services with a hands-on learning activity. During a two-week monitoring period, students designed, assembled, and operated low-cost PM sensors using Arduino platforms. The data analysis showed hotspots where the IAQ was consistently compromised and showed repetitive patterns in time. Workshop and laboratory areas repeatedly recorded the highest PM levels in 15 min sampling events distributed over daily two-hour segments, averaging 43.3 and 47.9 μg/m3 PM10, respectively, with maxima of 118.6 and 119.9 μg/m3 PM10. These measurements would have qualified as ‘moderate’ IAQ if sustained over a full day. A distinct weekly pattern was discovered, with Mondays being worse. The results demonstrated a new practical approach to monitoring the building’s IAQ at minimal cost while obtaining reproducible data. This tool provided educators with a valuable teaching tool that provided students with a deeper understanding of indoor air pollution.

Graphical Abstract

1. Introduction

Exposure to particulate matter (PM) is currently a major global health concern. PM can carry, among other pollutants, heavy metals and polycyclic aromatic hydrocarbons [1,2]. Scientific reports indicate that in Europe, people spend more than 85–90% of their time in an indoor environment [3] where air pollution caused by particles is a major problem [4]. In educational buildings, many sources contribute to particle pollution, including soil dust, new furniture, cleaning operations, particle resuspension during student movements, combustion sources, and outdoor sources [2]. In universities, students spend considerable time in classrooms, which play an important role in their educational experience. The quality of the indoor environment may exacerbate short- and long-term health problems affecting students and staff, impacting learning [5,6]. Prolonged exposure to polluted indoor air in classrooms can lead to dry skin, dizziness, headaches, fatigue, and nausea [7]. PM can contribute to the development and aggravation of various diseases (lung cancer, atopic dermatitis, and others), depending on the duration of exposure [8].
When inhaled, coarse particles of 5 to 10 microns (PM10: particles up to 10 microns in aerodynamic diameter) become lodged in the trachea and bronchioles [9], but the smaller PM2.5 (up to 2.5 microns) can enter the bloodstream and accumulate in alveolar ducts and capillaries, as well as in every organ of the human body [8]. In children with chronic respiratory diseases, exposure to PM1 (one micron or less) at school had toxicological effects on baseline lung function. Having exposure to PM2.5 concentrations of 20.5 + 2.2 mg/m3 was linked to conjunctivitis, fever, rash, and sensitization to outdoor allergens [10]. The risks described above make it essential to understand how students experience the classroom environment to improve classroom design and management [11]. However, many educational buildings face well-known budgetary constraints, so the proposed mitigation solutions must be designed as cost-effective solutions that can be practically implemented to improve IAQ without straining limited financial resources [6].
The availability of air pollution data has increased in recent years, thanks to the use of various low-cost sensors (LCSs) and sensor networks [12,13]. While no standard defining what is ‘low cost’ for a sensor has been set, its range spans from a few tens of USD [14] up to EUR 500 for single sensors [15]. The literature contains some ambiguity regarding the terminology, blurring the line between individual sensors and complete monitoring systems [12]. In this research, we refer to an LCS as a self-contained system (i.e., providing a human-readable data stream) costing less than EUR 150. Compared with more sophisticated monitors in the tens of thousands of USD range, LCS’s sensitivity, accuracy, and time response may be challenging to characterize subtle changes in the indoor environment [16].
Despite their limitations, an LCS network can make it possible to identify emission sources, manage and mitigate IAQ problems, and at the same time assess health risks [16,17]. However, IAQ monitoring data can be challenging to interpret, as there are multiple factors in their production besides the quality and density of the deployed sensors. For example, in a similar context to this study, Rose et al. point out that it is important to recognize the possible influence that seasonal variability, driven by meteorology and human behavior, may have on PM concentrations in classrooms [18]. Other research has highlighted the need for a stabilization period for the sensors during deployment before collecting data, without which inaccurate measurements could be produced [19]. Concurrently, concerted efforts must be made to interpret the sensor data to ascertain the provenance of the particulate matter, thus informing control measures [20].
In the educational field, the goal of the Department of Construction, Building Services, and Structures of the School of Architecture of the Universidad de Navarra is to ensure that newly graduated students are trained to design, calculate, and integrate the various building-related services [21]. In Spain, the schools of architecture are officially designated as technical schools of architecture, reflecting the advanced training in structures, construction, and building services that students receive. This contrasts with other models, such as the Anglo-Saxon schools, where design training is prioritized [22]. The methodology embraced by the Universidad de Navarra, combining theoretical and practical training in both architecture and engineering, has generated multiple results in the form of teaching innovation projects, conferences, and scholarly publications that endorse the interest of its development [21]. The students of the bachelor’s degree in architectural studies train in hygrothermal conditioning when taking building services II, a third-year, 3-ECTS subject in which they study concepts and systems associated with the primary loop, secondary loop, transport, and control of these installations in buildings. Over the last twenty years, a few innovative teaching projects have been developed, including thermoelectric prototypes [23], technical cabinets [21], and specific technical training programs [24]. The experience presented here is the last step in this training string about HVAC systems in architecture.
Despite these initiatives, the teaching team identified a gap in the curriculum for architecture students whereby the topics on indoor environments, a fundamental factor in the comfort of buildings, were not being properly addressed, leaving students lacking knowledge of indoor air quality indexes, types of pollutants and their effects on health, the equipment with which indoor pollution can be measured, and how to perform an analysis or manage data that needed to be closed. This gap may lead future architects to neglect issues related to healthy indoor environments in their practice, resulting in their projects suffering from sick building syndrome (SBS) [25,26]. For the study of the topic, the World Health Organization (WHO) guidelines on air quality [4] are an essential tool for both researchers and educators who must remain up to date about environmental issues and for students, although it can be challenging to get them interested at both the conceptual and the practical levels. Consequently, one of the difficulties in designing coursework lies in making it attractive to students.
Subsequently, the teaching team formulated the following research questions: How can air quality topics be integrated into the course content? Is it possible to incorporate this content with practical learning for students? Is it possible to develop a teaching innovation project that can be replicated not only in the university but also in other educational buildings? This objective led the authors of this article to design a firsthand approach for students to learn about air quality [27]. The activity spans the innovation from a theoretical background on indoor environmental issues in the course content for the first time and the practical incorporation of experimental design, including sensor prototyping, data collection, and interpretation. The specific parameter to measure was airborne particulate matter, a well-known IAQ component whose effects on human health have been amply studied and documented [28].
The chosen approach, known as living labs, was already included in the 2020 strategy of the Universidad de Navarra. This approach aims to promote collaboration between students, researchers, businesses, and society to co-create innovative solutions that drive sustainability and efficiency on the university campus [29]. It emphasizes hands-on learning, allowing students to actively participate in and directly engage with research activities during their time on campus. The European Network of Living Labs (ENoLL) defines living labs as “open innovation ecosystems in real-life environments based on a systematic user co-creation approach that integrates research and innovation activities in communities and/or multi-stakeholder environments, placing citizens and/or end-users at the centre of the innovation process [30].” Other authors, such as Leminen et al., define them as “reconstructing the interaction space. It can be any space, anywhere, suitable for collaborative design, the application of knowledge for empowerment, uplift, and development of people and communities for the use of innovation [31].” Aligned with this definition, the study presented here is part of a global vision to improve the energy and air quality performance of all the buildings at the Universidad de Navarra [32] and a pilot test of the installation of sensors in the School of Architecture [33]. In addition, the availability of PM data at different points throughout the School of Architecture could enable making data-informed decisions to improve the work and study environment in the future. Within this strategy, the students engaged in research about the PM contents on campus.

2. Area of Study

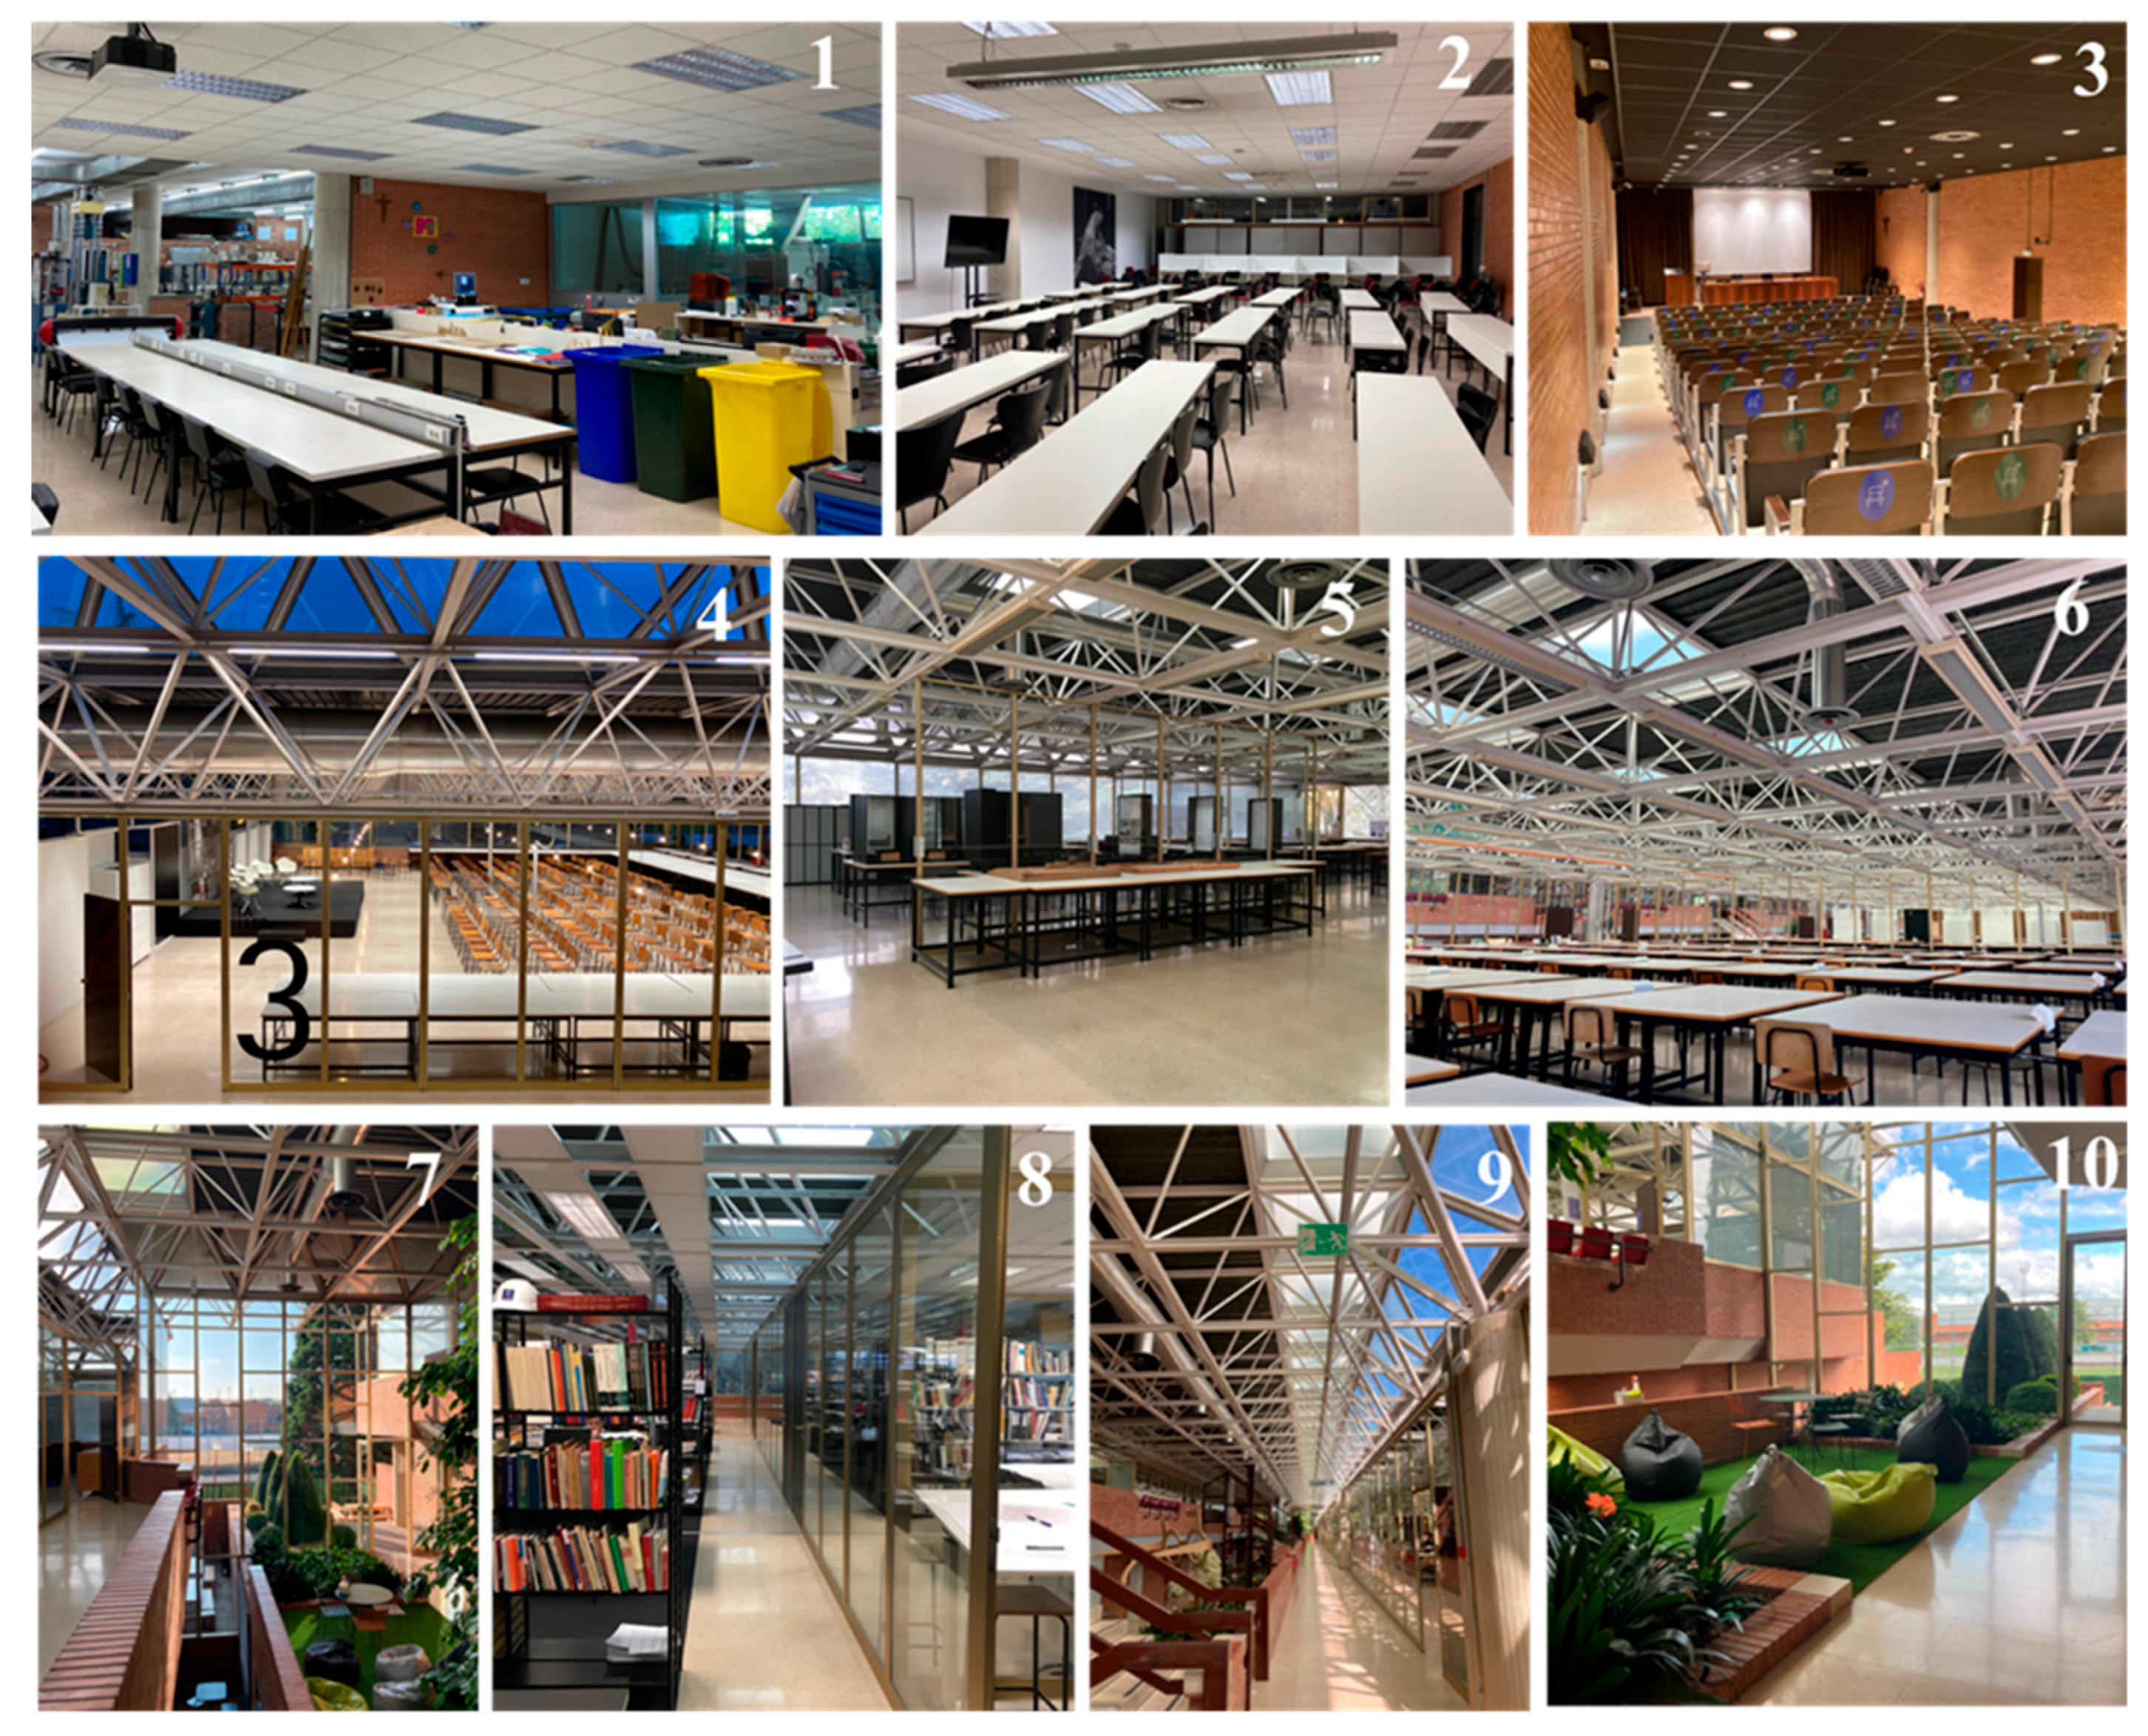
The measurements were performed inside the building of the School of Architecture, located in the Universidad de Navarra’s main campus in Pamplona, northenSpain. The building is surrounded by a campus full of vegetation and trees that has been awarded four Green Flags [34]. The school itself is a brick, glass, and steel building, finished in 1975. A large metal truss, raised on concrete pillars with brick walls and large windows on the upper floors, encloses a large central space and four staggered floors plus an underground basement. The ground floor entrance leads to a conference room, the architecture laboratory, the fashion classroom, and a multi-purpose room. The first floor is staggered across the central space and contains six classrooms and the women’s restrooms. The second floor staggers back and rests atop the ground floor, divided into six free-occupancy workshops. The third floor, directly on top of the first floor, consists of academic and research offices, and it is segmented into open floor plans and personal offices. Finally, the materials room and the machine room occupy the basement spaces underground (Figure 1 and Figure 2).

Ventilation System

In the field of educational buildings specifically for university teaching, mechanical ventilation systems respond to the use of spaces for classrooms, workshops, laboratories, administrative areas, offices, and common spaces. These spaces primarily require thermal regulation and optimal air renewal. The Spanish regulation governing non-residential buildings is the Thermal Installations in Buildings Regulation (Reglamento de Instalaciones Térmicas en los Edificios, RITE). This document establishes that buildings must have a ventilation system that provides sufficient outside airflow to prevent high concentrations of pollutants from forming in areas where people engage in activities. Depending on the use of the building, they are classified into four levels of indoor air quality (IDA). Educational buildings should reach at least IDA 2 (good quality air), where a minimum air renewal of 12.5 dm3 per person per second should be guaranteed. Their ventilation systems should also follow a minimum level of outdoor air filtration, depending on the outdoor air quality and the required indoor air quality [35].
To improve energy efficiency, some educational buildings opt for mechanical ventilation systems enabling some form of heat recovery. This is the case in the school studied, fitted with air handling units (AHUs) that cover the building’s thermal and ventilation demands. This system extracts air from the machine room (a mixture of outdoor air coming in through intake grilles and stale indoor air returned via the plenum, providing partial heat recovery), filters it through a G4 filter and air-conditions it, and then distributes it into the spaces.
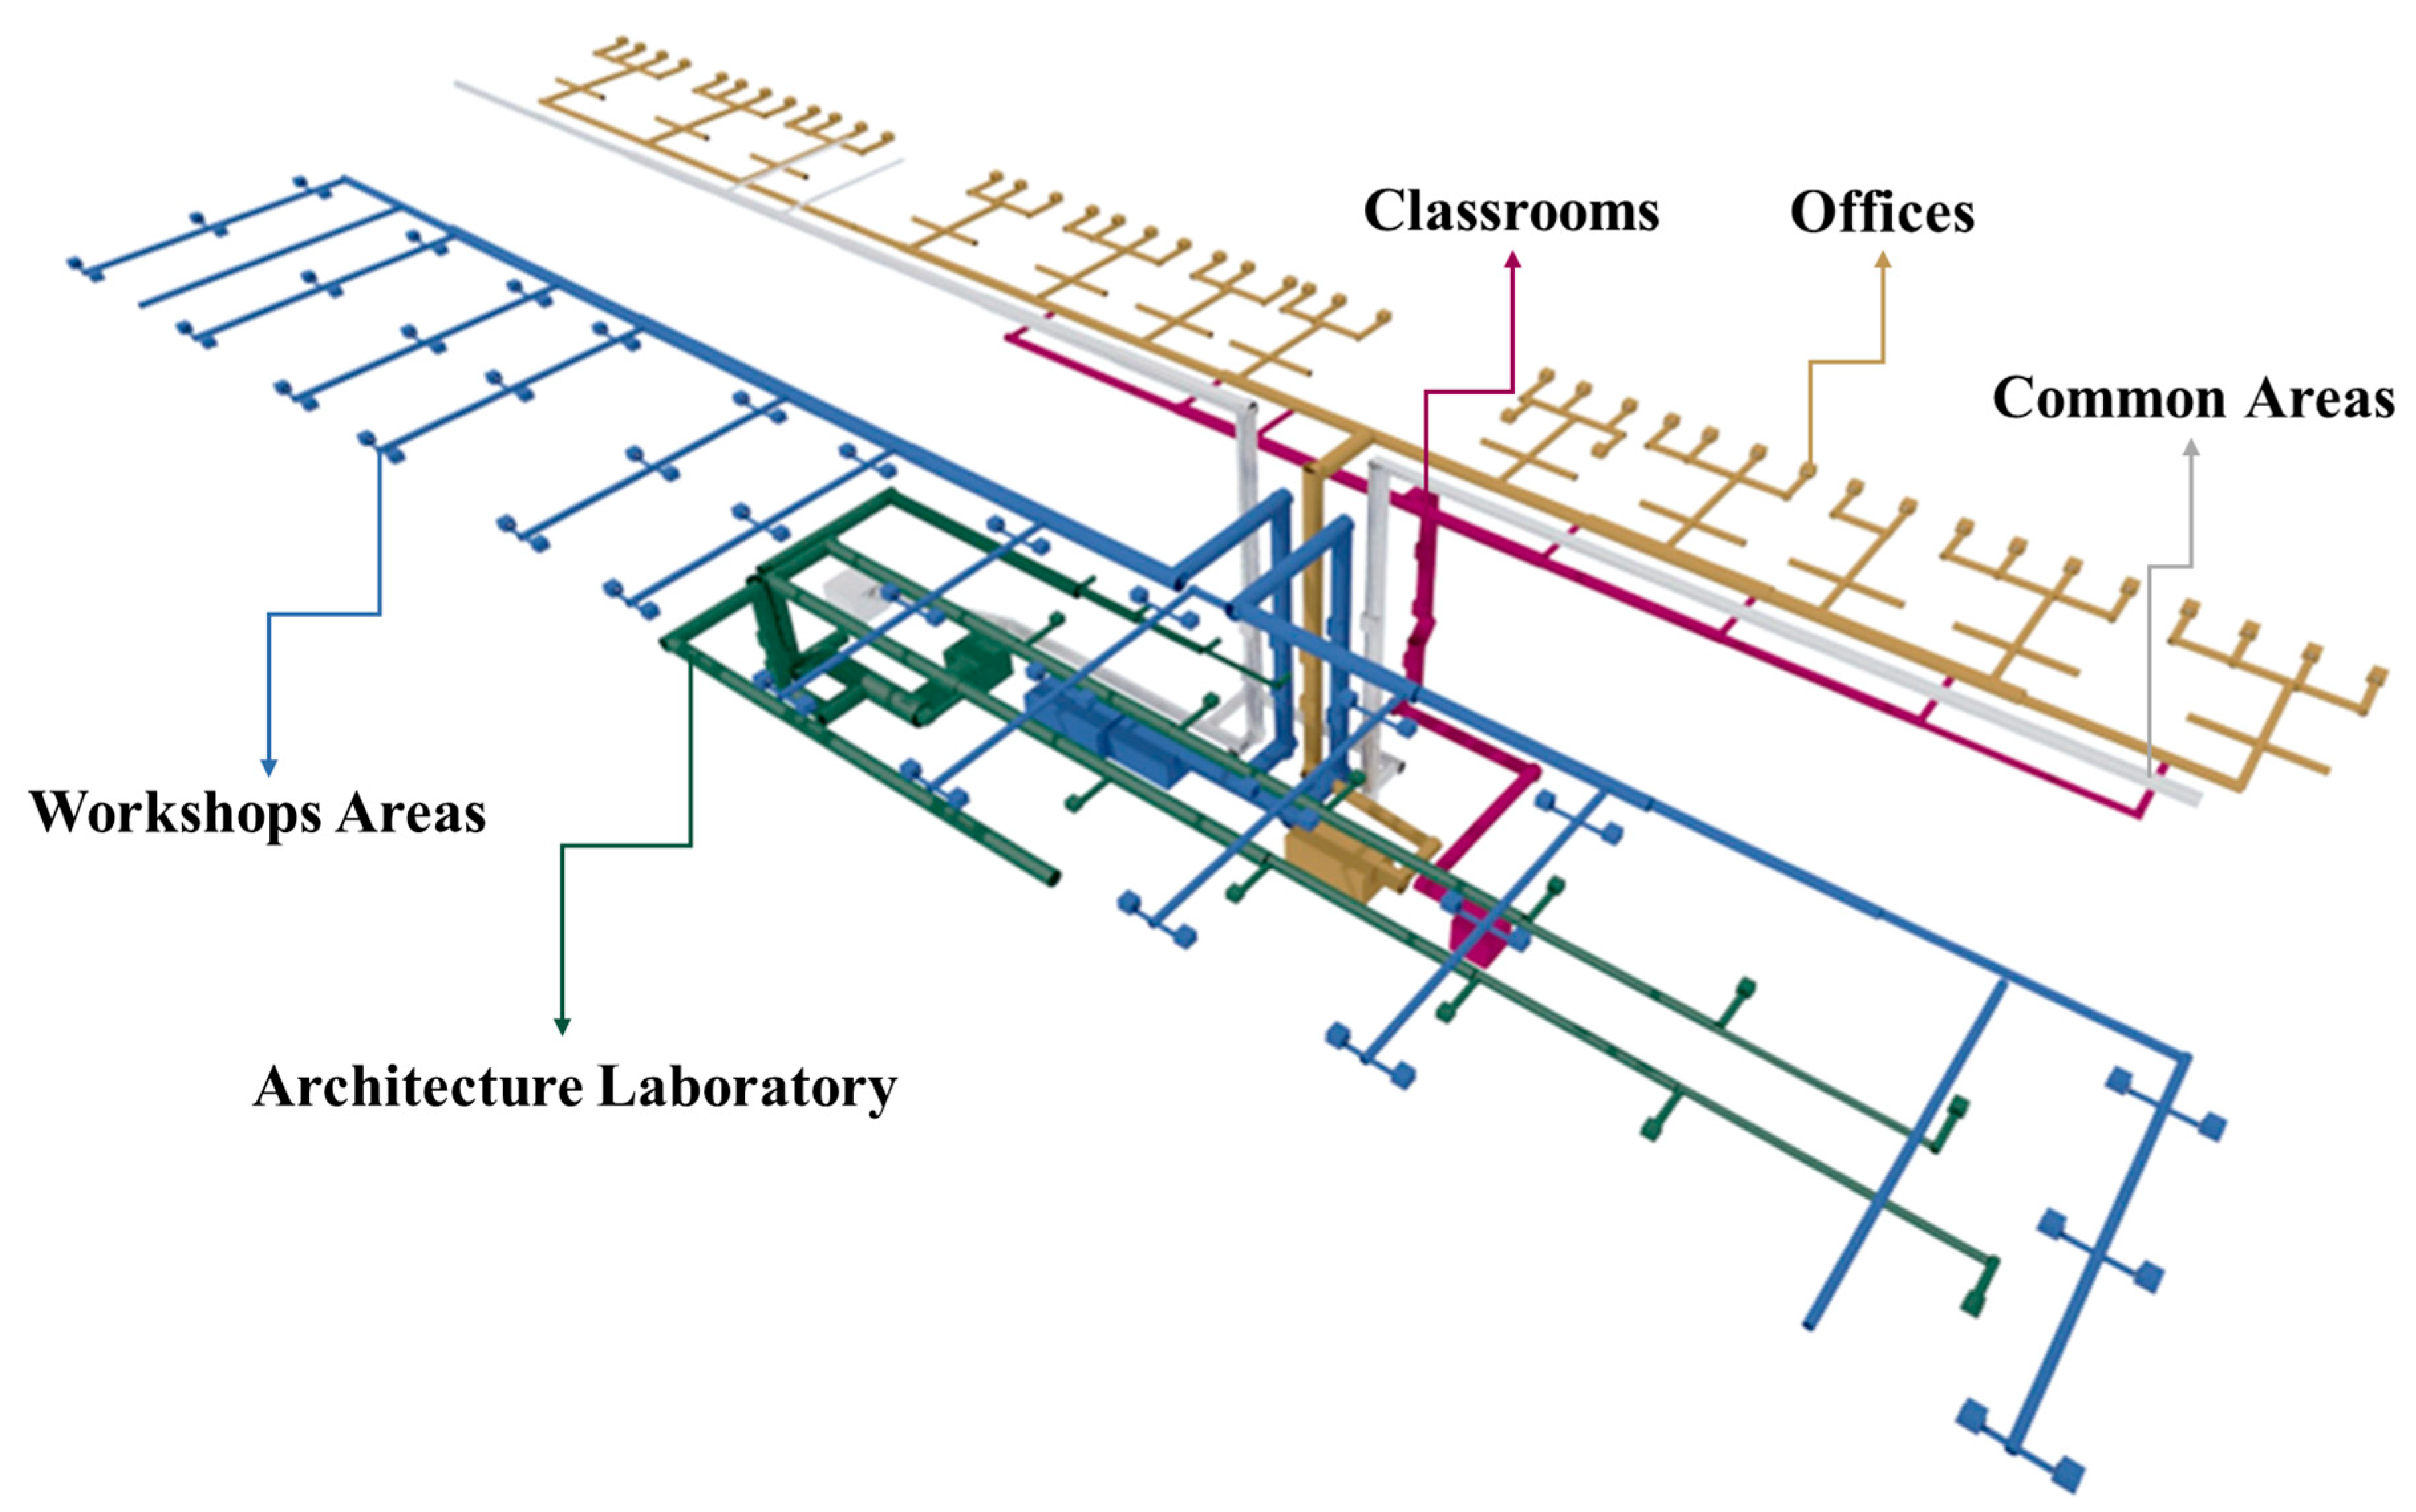
The ventilation of the spaces is segmented with at least one air handling unit (AHU) per floor, the basic equipment being unchanged since the first commission from 1975 (Figure 3). However, throughout the life of the building, the installation of fans has supplemented the ventilation system, implementing changes in the ventilation impulses and returns.
According to the Spanish RITE regulations, to estimate the air conditioning of an educational building, a general density of 5 m2/person must also be taken into consideration [35]. Although specific areas may be designed for higher or lower densities, the required allowance of 12.5 L/s must be met. While some areas do meet or exceed the required flows, others may be noncompliant. For example, the classroom zone (601.56 m2) assigns 1.5 m2/person and thus requires a renewal of 5013 L/s. The AHU that supports this space has an impulsion capacity of 12,700 m3/h, equivalent to 3528.1 L/s. This means that the existing AHU, taken by itself (i.e., without considering other horizontal or convective exchanges with neighboring areas through open doors and spaces), is short by 29.6% from the regulations for the classrooms, although the actual occupancy is generally much lower than the capacity (thereby negating the deficit).
A complex case is the 1057 m2 architectural laboratory (regulated density: 5 m2/person), where activities may naturally produce significant air challenges, as among other equipment, a range of 3D printers, milling machines or laser cutters working on acrylics, cardboard, methacrylate, polymers, and wood are operating, using up one-third of the space (the remaining area is used for other activities, but both uses share the same air volume and ventilation). This space, a former basement storage room, has a 12,400 m3/h (3444.72 L/s) AHU, but the requirements are 5017.65 L/s, resulting in a 31.3% deficit. The nature of the activities, though, recommended supplementing the impulsion with two fans with their own ducting (green in Figure 3) blowing through high-velocity diffusers that air-condition by mixing, with one taking air from the machine room (mixed indoor/outdoor air) and another from the basement (indoor air).
In contrast, other areas meet or exceed requirements. The office area has a surface area of 946.40 m2 and has an AHU with an impulsion of 14,000 m3/h (3888.9 L/s) for a density of 10 m2/person, supplying three times the required impulse of 1173.1 L/s. Also at this density, the 307.32 m2 lobby is served by a 20,400 m3/h (5666.7 L/s) AHU for a 3814.12 L/s impulse requirement. At the higher 5 m2/person density, the workshop area (2198.49 m2) requires 5496.2 L/s, but its AHU supplies almost twice that flow, 40,300 m3/h (11,194.4 L/s). All this excess flow may help alleviate deficits in other areas through natural convection, diffusion, or flow-induced drag throughout the building.
Unfortunately, over the years, the uses of the spaces have evolved, leaving the air conditioning system unbalanced due to the implementation of changing demands. For example, the building’s return system was experimentally tested by measuring the air pressure difference outside and inside the first floor plenum, fed by two 0.38 m × 4.5 m grilles and a 0.38 m × 2.3 m grille. The calculated total flow rate through the plenum of 27,864 m3/h indicates a decompensation of 12,936 m3/h, air that is not renewed by design. On the other hand, the architecture laboratory lacks an independent extraction system to ensure that the emissions generated are efficiently extracted, although this deficiency was compensated by small windows along its perimeter acting as vents for the additional blow fans. The office floor, with an initially low occupancy, has become fully occupied by offices, resulting in an insufficient airflow due to the original duct layout.

3. Methodology

The monitoring of PM concentrations in the School of Architecture was conducted at 66 points in different areas of the building. Measurements were performed by seven teams of 9–10 students each. Each team was responsible for assembling a complete prototype (PM sensor and Arduino controller with ancillary modules) and was assigned a zone (Figure 4), where each student in the team had a separate data collection point assigned (therefore, measurements within a team were sequential, sharing the same prototype, while measurements across teams could overlap, as there were seven prototypes in operation).
Measurements were taken throughout the building from 25 October 2022 to 15 November 2022, mostly from 14 h to 16 h, when most lunch breaks occurred. This ensured that students could conduct the sampling without disrupting their regular academic schedules while simultaneously allowing them to roam areas other than classrooms and workshops. The sensors were programmed to a frequency of 0.1 Hz (the achieved frequency varied slightly with the performance of the board), and the sampling runs lasted at least 15 min each. Although sensors were natively able to produce 1 Hz data, the sampling frequency was downgraded to minimize the probability of data dropouts due to processing clogs in the platforms, a phenomenon observed during calibration, while still ensuring at least 100 individual readings to be averaged during a sampling event.

3.1. Instruments

The low-cost sensor Plantower PMS5003, Plantower Technology, Beijing, China (see Table 1 for specifications and experimental data) was used to measure the PM1, PM2.5, and PM10 levels inside the building. The sensor is an optical particle counter (OPC), a commonly used type of sensor that uses laser light scattering to count the number of particles suspended in the air classified by size, which translates to concentration as mass per unit air volume according to built-in size/mass functions. These OPCs typically have an accuracy of ± 10% [36]. Individual sensors were intercalibrated in a separate laboratory experiment by co-location in a closed chamber with high-end sensors (Grimm laser spectrometer and Dekati electrometrical sensor) used in another project on residential building indoor pollution [37,38,39] using a particle generator, showing a high agreement among sensors (r ≥ 0.93 ± 0.2 for the 0–200 µg/m3 range) [40].
The sensors were compatible with the open-source Arduino electronics platform, an easy-to-use hardware and software solution. Therefore, they were integrated into autonomous systems (Figure 5), each including an Arduino Mega 2560 (controller and data receiver); the PMS5003 OPC; a MicroSD card adapter (data storage) module; and an RTC DS3231 real-time clock module (timekeeping and timestamping). Modules were set up on a breadboard, and power was provided by a 36,800 mAh power bank. One of the aims of the workshop was to instruct the students to assemble the air quality sensors. Therefore, a document was created explaining all the steps necessary to put the sensor into operation. Guidelines were also produced to operate the Arduino board with a program previously created and tested by the teaching staff. In the Supplementary Files can be found: 1. instructions on how to connect the components used to build the prototype to the Arduino board; 2. a list of the prototype components, to facilitate the search and acquisition of the components; and 3. the programming lines for the low-cost sensor used in this study with the Arduino software (version Arduino 1.8.19).

3.2. Procedure

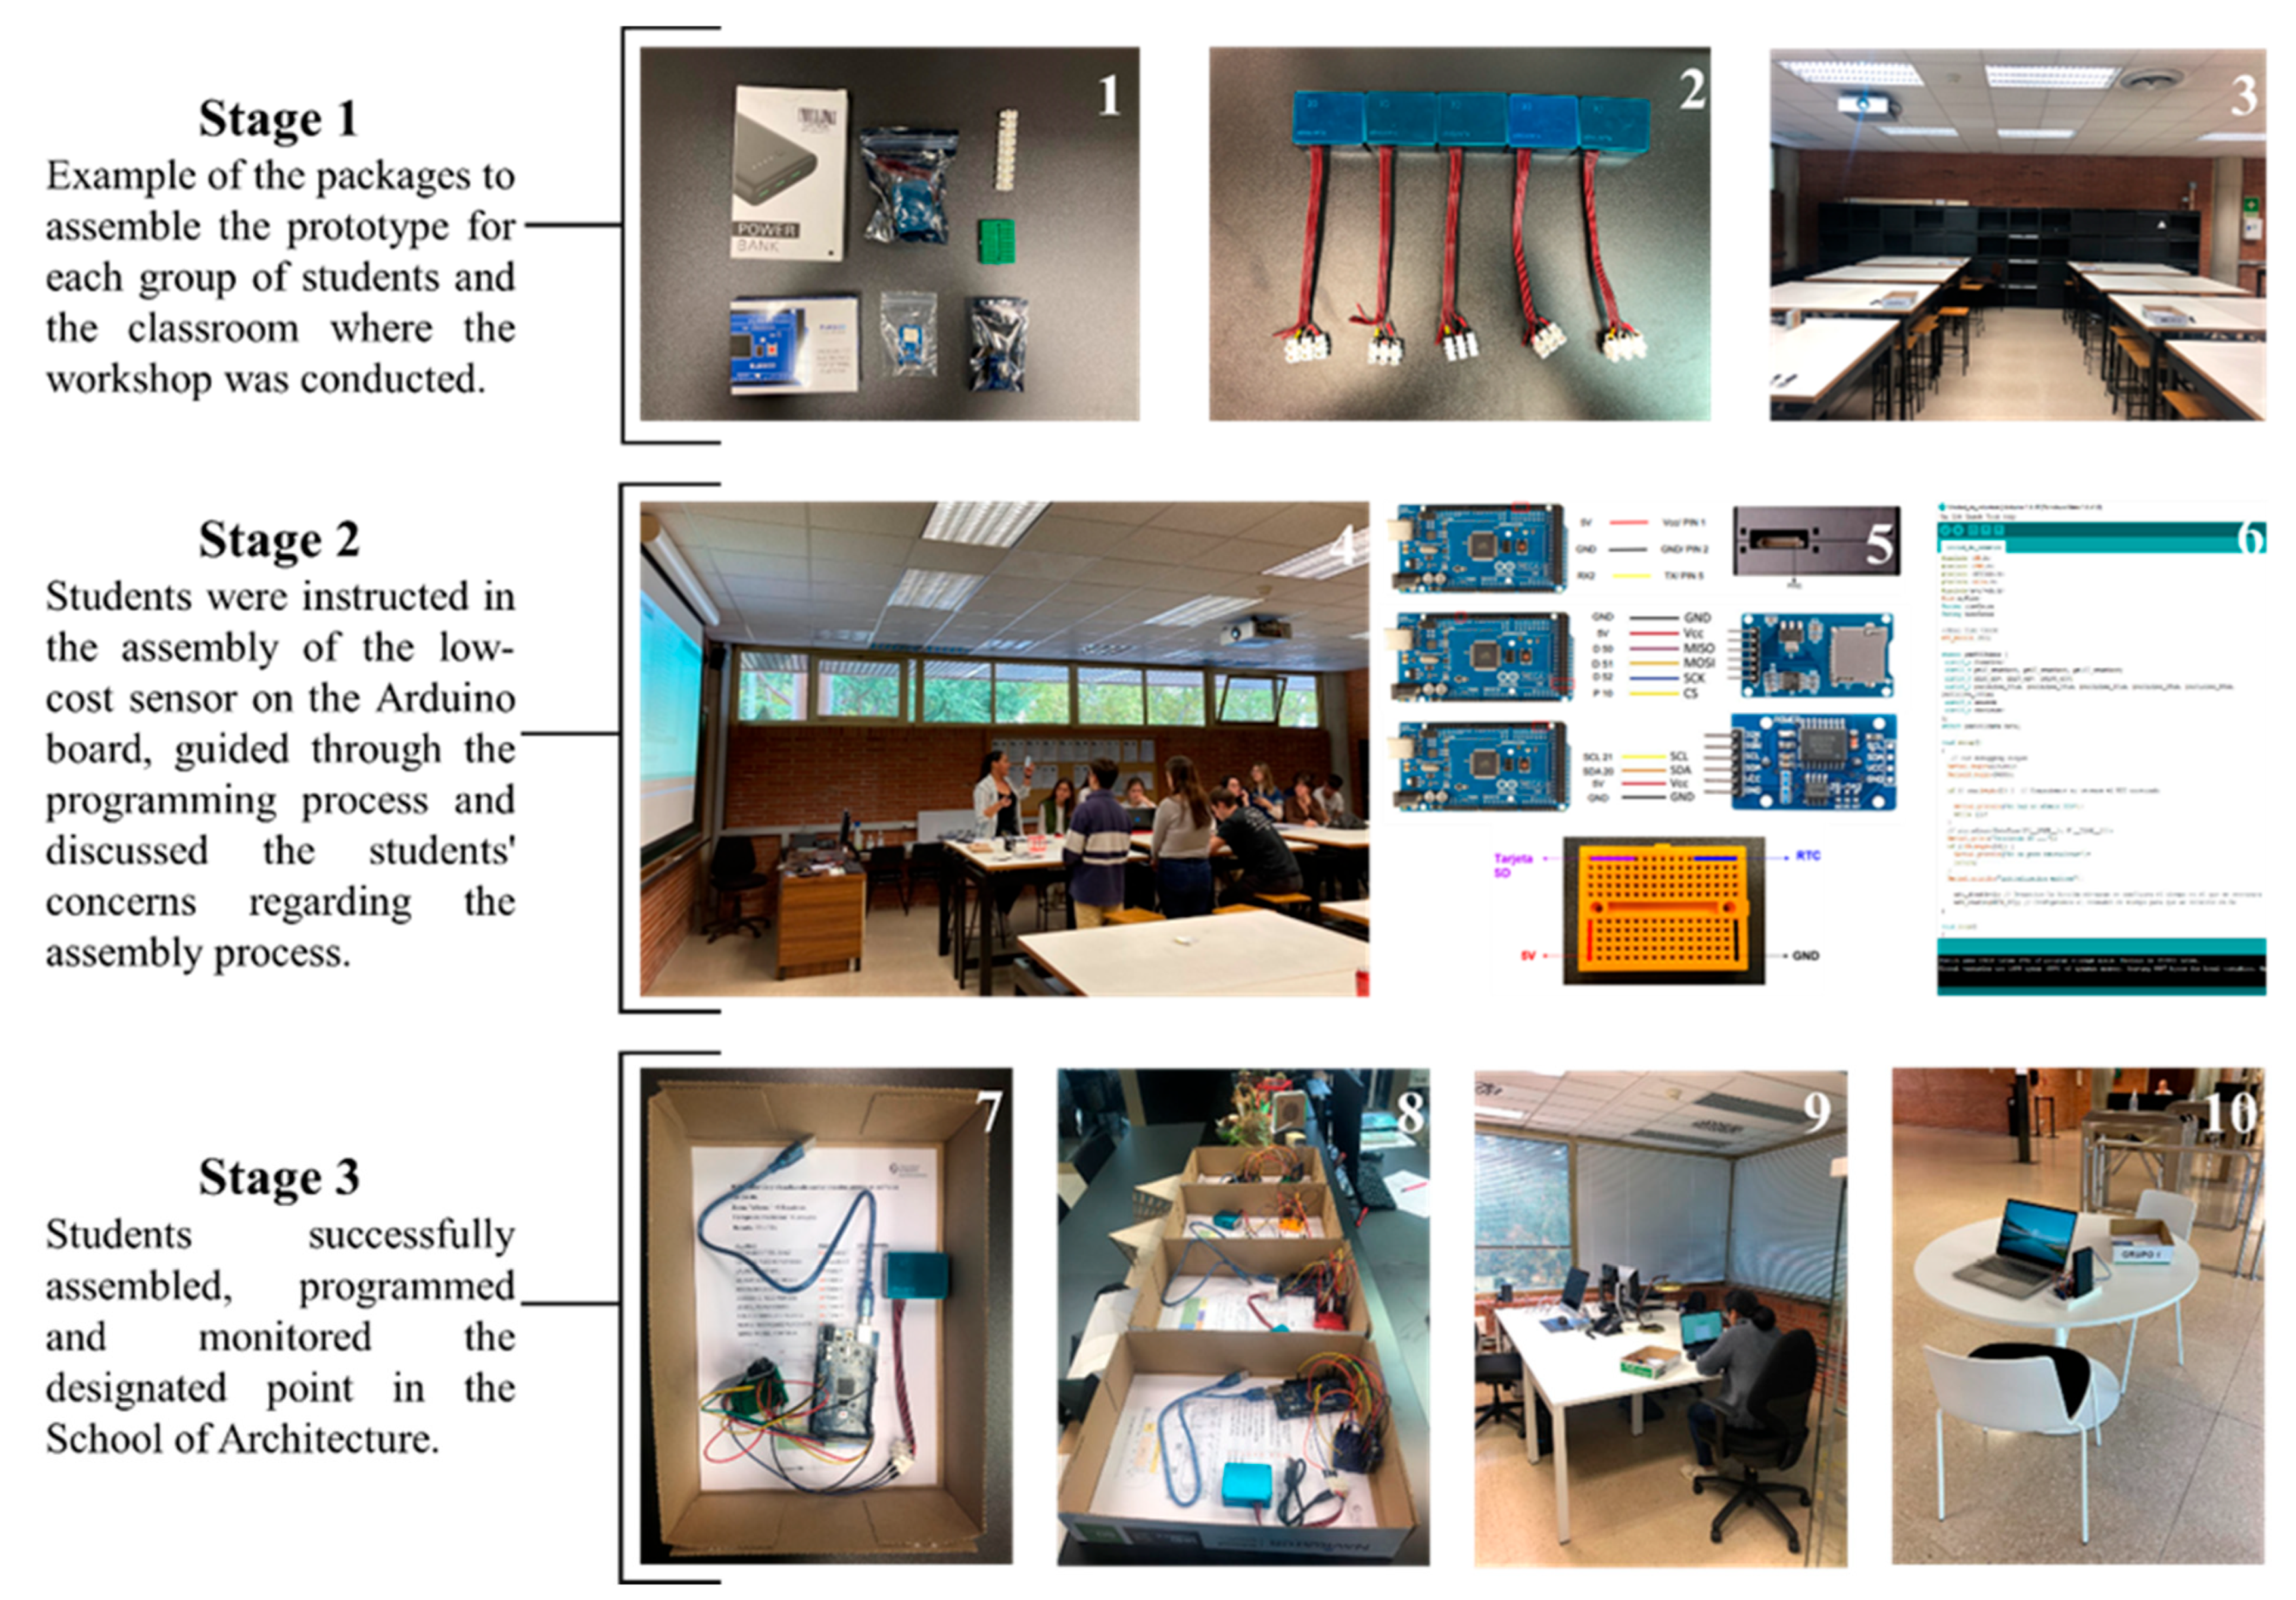
A three-stage workshop was conducted with building services II students to sample PM concentrations in the School of Architecture (Figure 6). During Stage 1 (preparation), materials and organization related to the workshop were prepared by the staff. During Stage 2 (lectures and workshops), students were first introduced to the world of electronics with Arduino, then they were given a session on indoor air quality and the effects on human health, and finally the different types of sensors that are used to monitor air pollution and the ways they are used to quantify air pollution were examined. In Stage 3 (experiments), each student collected data during the 14–16 h time window of 25–28 October and 7–15 November 2022, placing the low-cost sensor at the assigned point. Afterwards, all data were organized, and each zone’s results were analyzed and discussed. A debate was held with students on the possible causes of pollution in the School of Architecture.

4. Results and Discussion

Sixty-six sampling events each reading about 90–100 measurements were recorded by the students at eight sampling points in the classroom zone, five sampling points in the common areas, eight sampling points in the architecture laboratory, four sampling points in the offices zone, four sampling points in the workshop’s areas, and one sampling point in each restroom. After inspection by the instructors, eleven sampling events were discarded because of incorrect manipulation, insufficient sampling, poor data keeping, or programming bugs manifested by data quality indicators: out-of-range measurements, short data series, invalid timestamps not matching the scheduled sampling times, lost or erased files or data rows, or importing errors. Some data had correctable errors, such as PM1 and PM10 swaps manifested by higher PM1 readings, which could be readily fixed by swapping back the corresponding fields. Table 2 shows the mean and maxima of PM10, PM2.5, and PM1 concentrations in μg/m3 over the sampling events.
Workshop and laboratory areas consistently recorded the highest PM10 levels, averaging 43.3 and 47.9 μg/m3, respectively, during 15 min intervals, with maximums at 118.6 and 119.9 μg/m3. Measured over a full day rather than over short 15 min periods spanning two hours each day, laboratories and workshop areas would have qualified as ‘moderate’ European Air Quality Index (AQI) [41], meaning that members of sensitive groups might experience health effects. All other areas would be ‘fair’ (air quality is acceptable, although risk for some particularly sensitive people might exist), except for the offices and restrooms that recorded 9.5 and 14.0 μg/m3 PM10 (‘good’ AQI where air pollution poses little or no risk if sustained over a day), the only places where measured PM10 stayed below outside PM levels, as recorded by an official external reference located 1 km NE from the school (Felisa Munárriz Background Urban Air Quality Station). The average PM10 content in the urban background was 22.1 μg/m3 PM10 over the sampling period, with a maximum hourly concentration of 49 μg/m3 PM10.
In contrast, the average maximum among the school’s sampling points (each composed of at least 15 min of readings every 10 s) could reach almost 120 μg/m3 PM10 in certain laboratories and workshop areas (Figure 7), a ‘very poor’ AQI if these readings were sustained, with individual measurements registering up to 285 μg/m3 PM10. A ‘very poor’ AQI is indicative of increased health effects risk for all populations [41]. Certain classrooms and common areas sustained more than 60 μg/m3 PM10 over the sampling period and would fall into AQI’s ‘poor’ label (some members of the general public may experience health effects) if unabated during the whole day. PM2.5 levels stayed within good levels, except for one workshop point that exceeded 10 μg/m3 PM2.5. PM1 readings were always low, although the sensors were closer to their operational range limits.
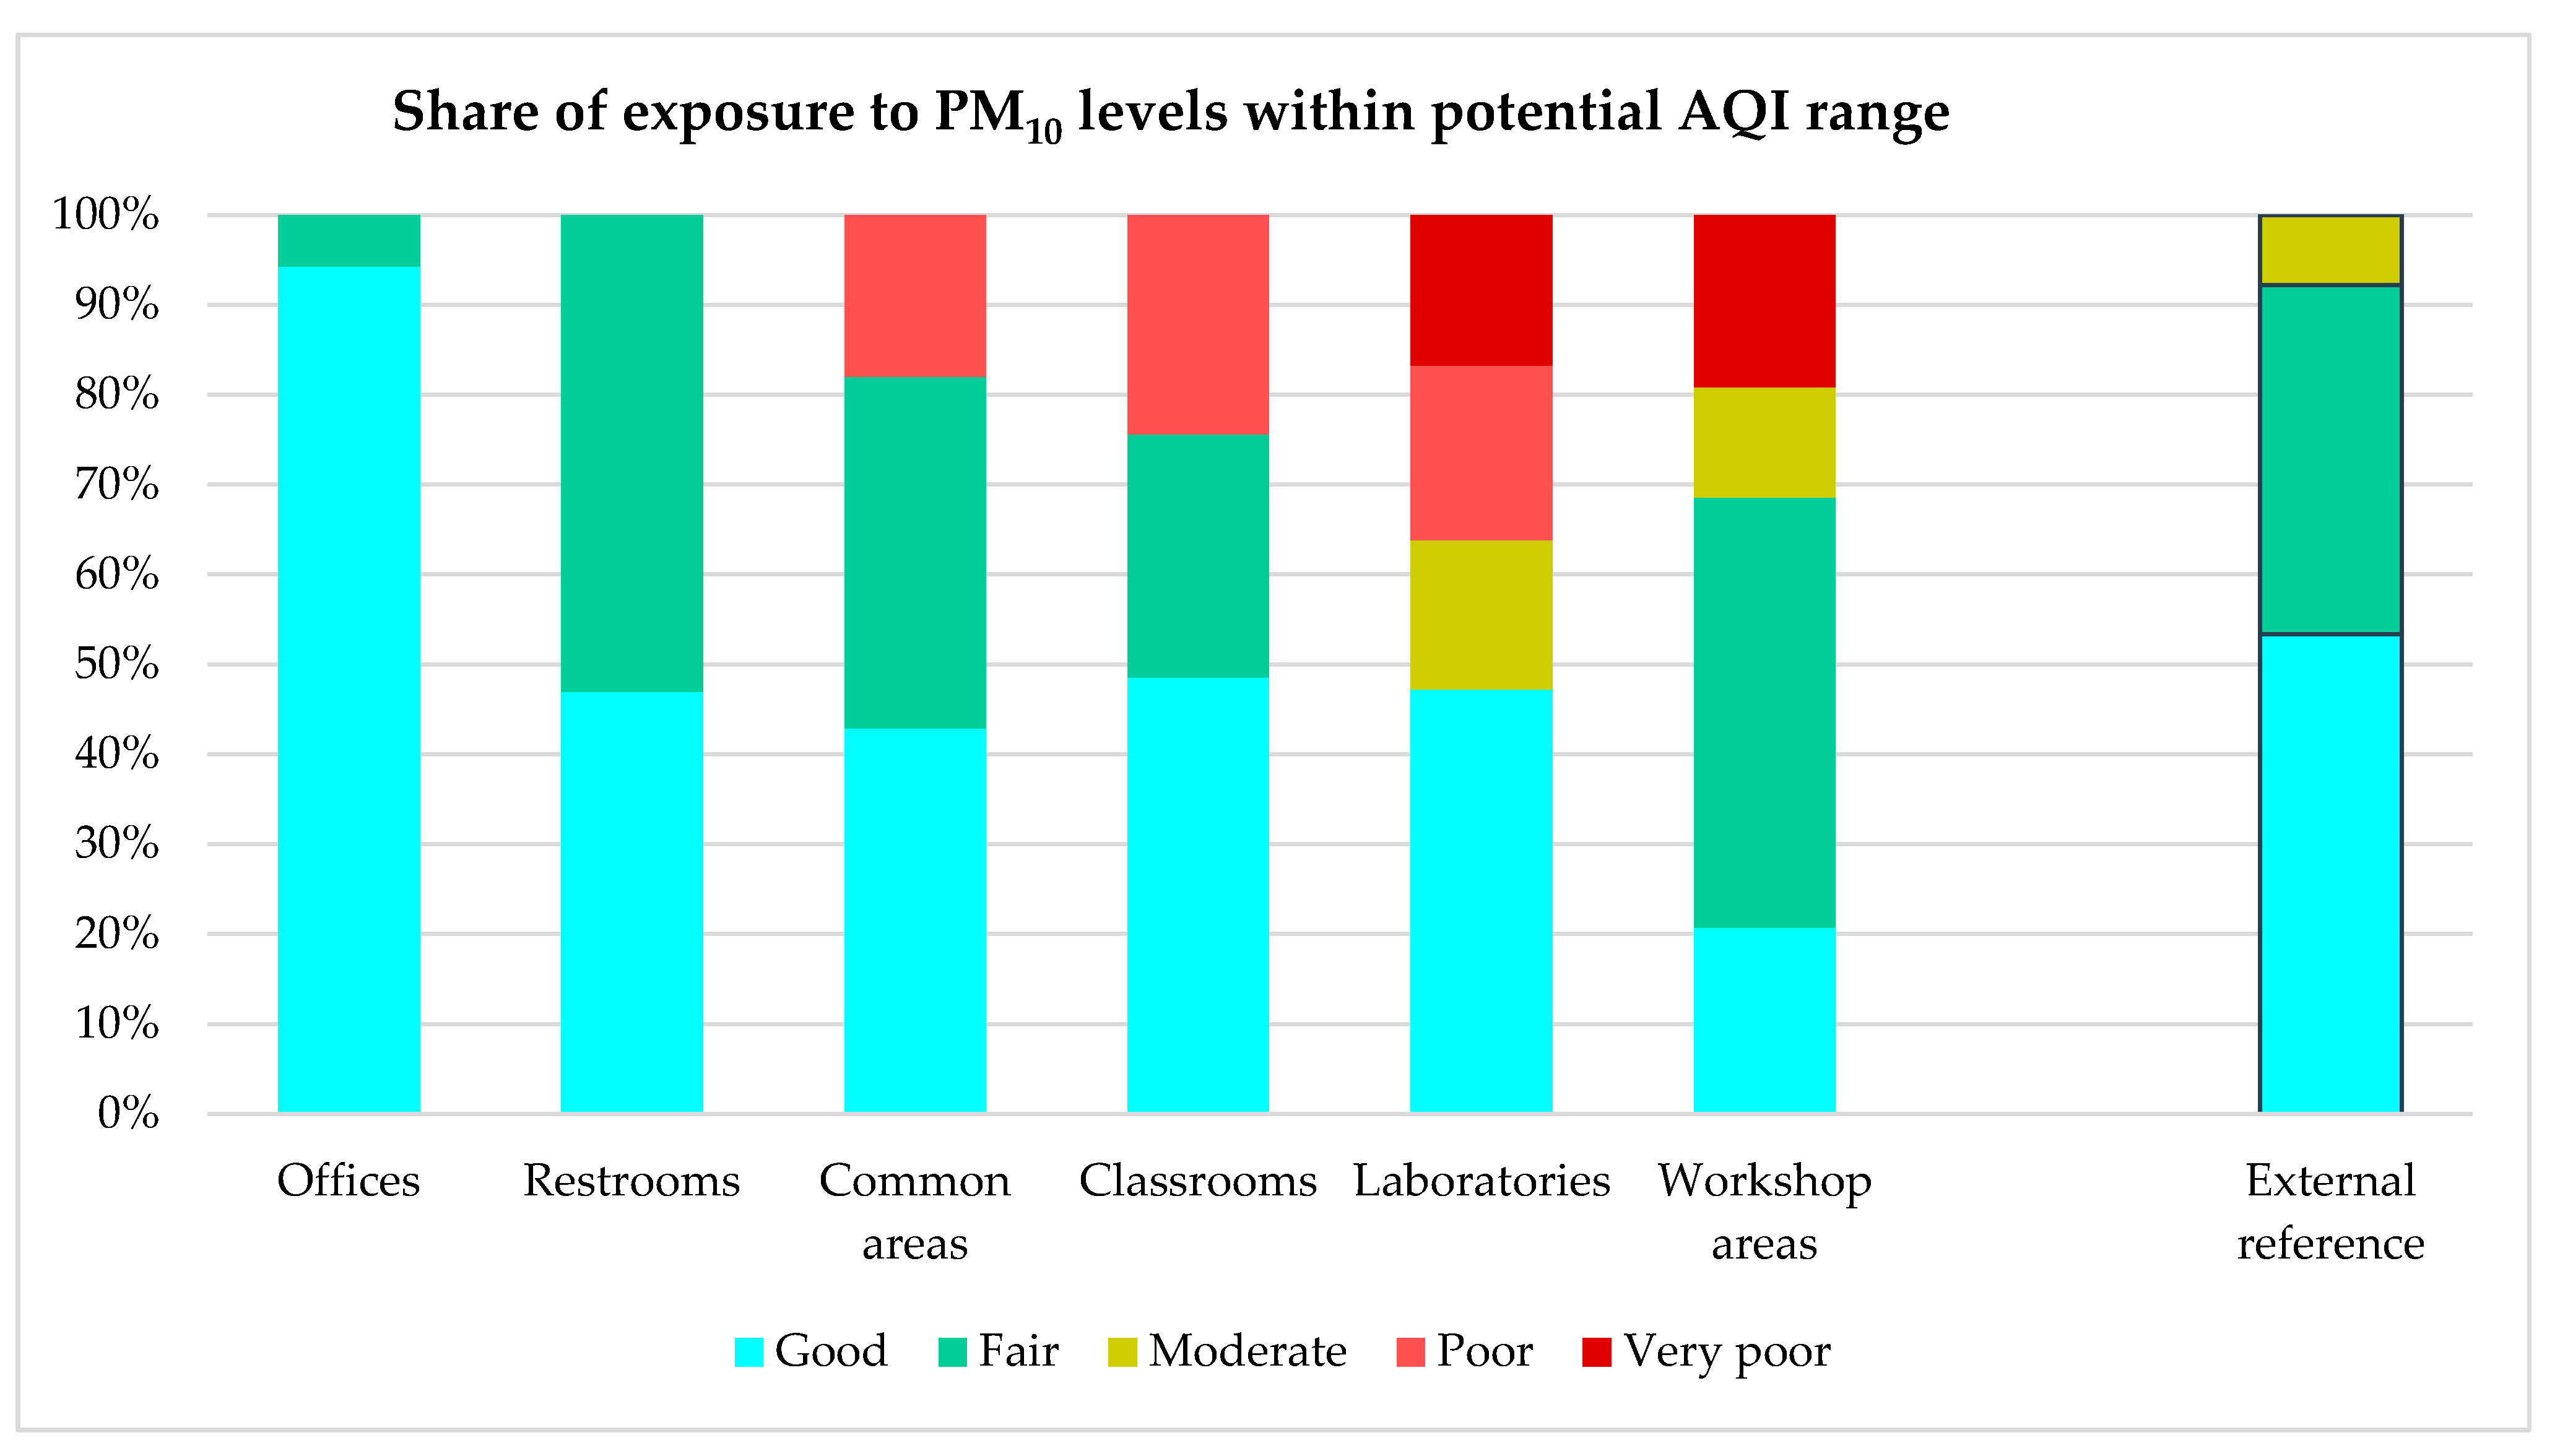
Individual measurements were used to estimate the proportion of time each school area was experiencing PM levels that, if sustained over time, would result in the corresponding AQI levels (Figure 8). While 90% of measurements in the office area stayed below 20 μg/m3 PM10 (good air quality), better than the external reference, all other areas except restrooms were subject to worsening conditions with less than 50% good air quality. Especially, laboratories and workshop areas would be subject to high levels of more than 10% of the time for PM10, although all areas stayed within low PM2.5 levels.
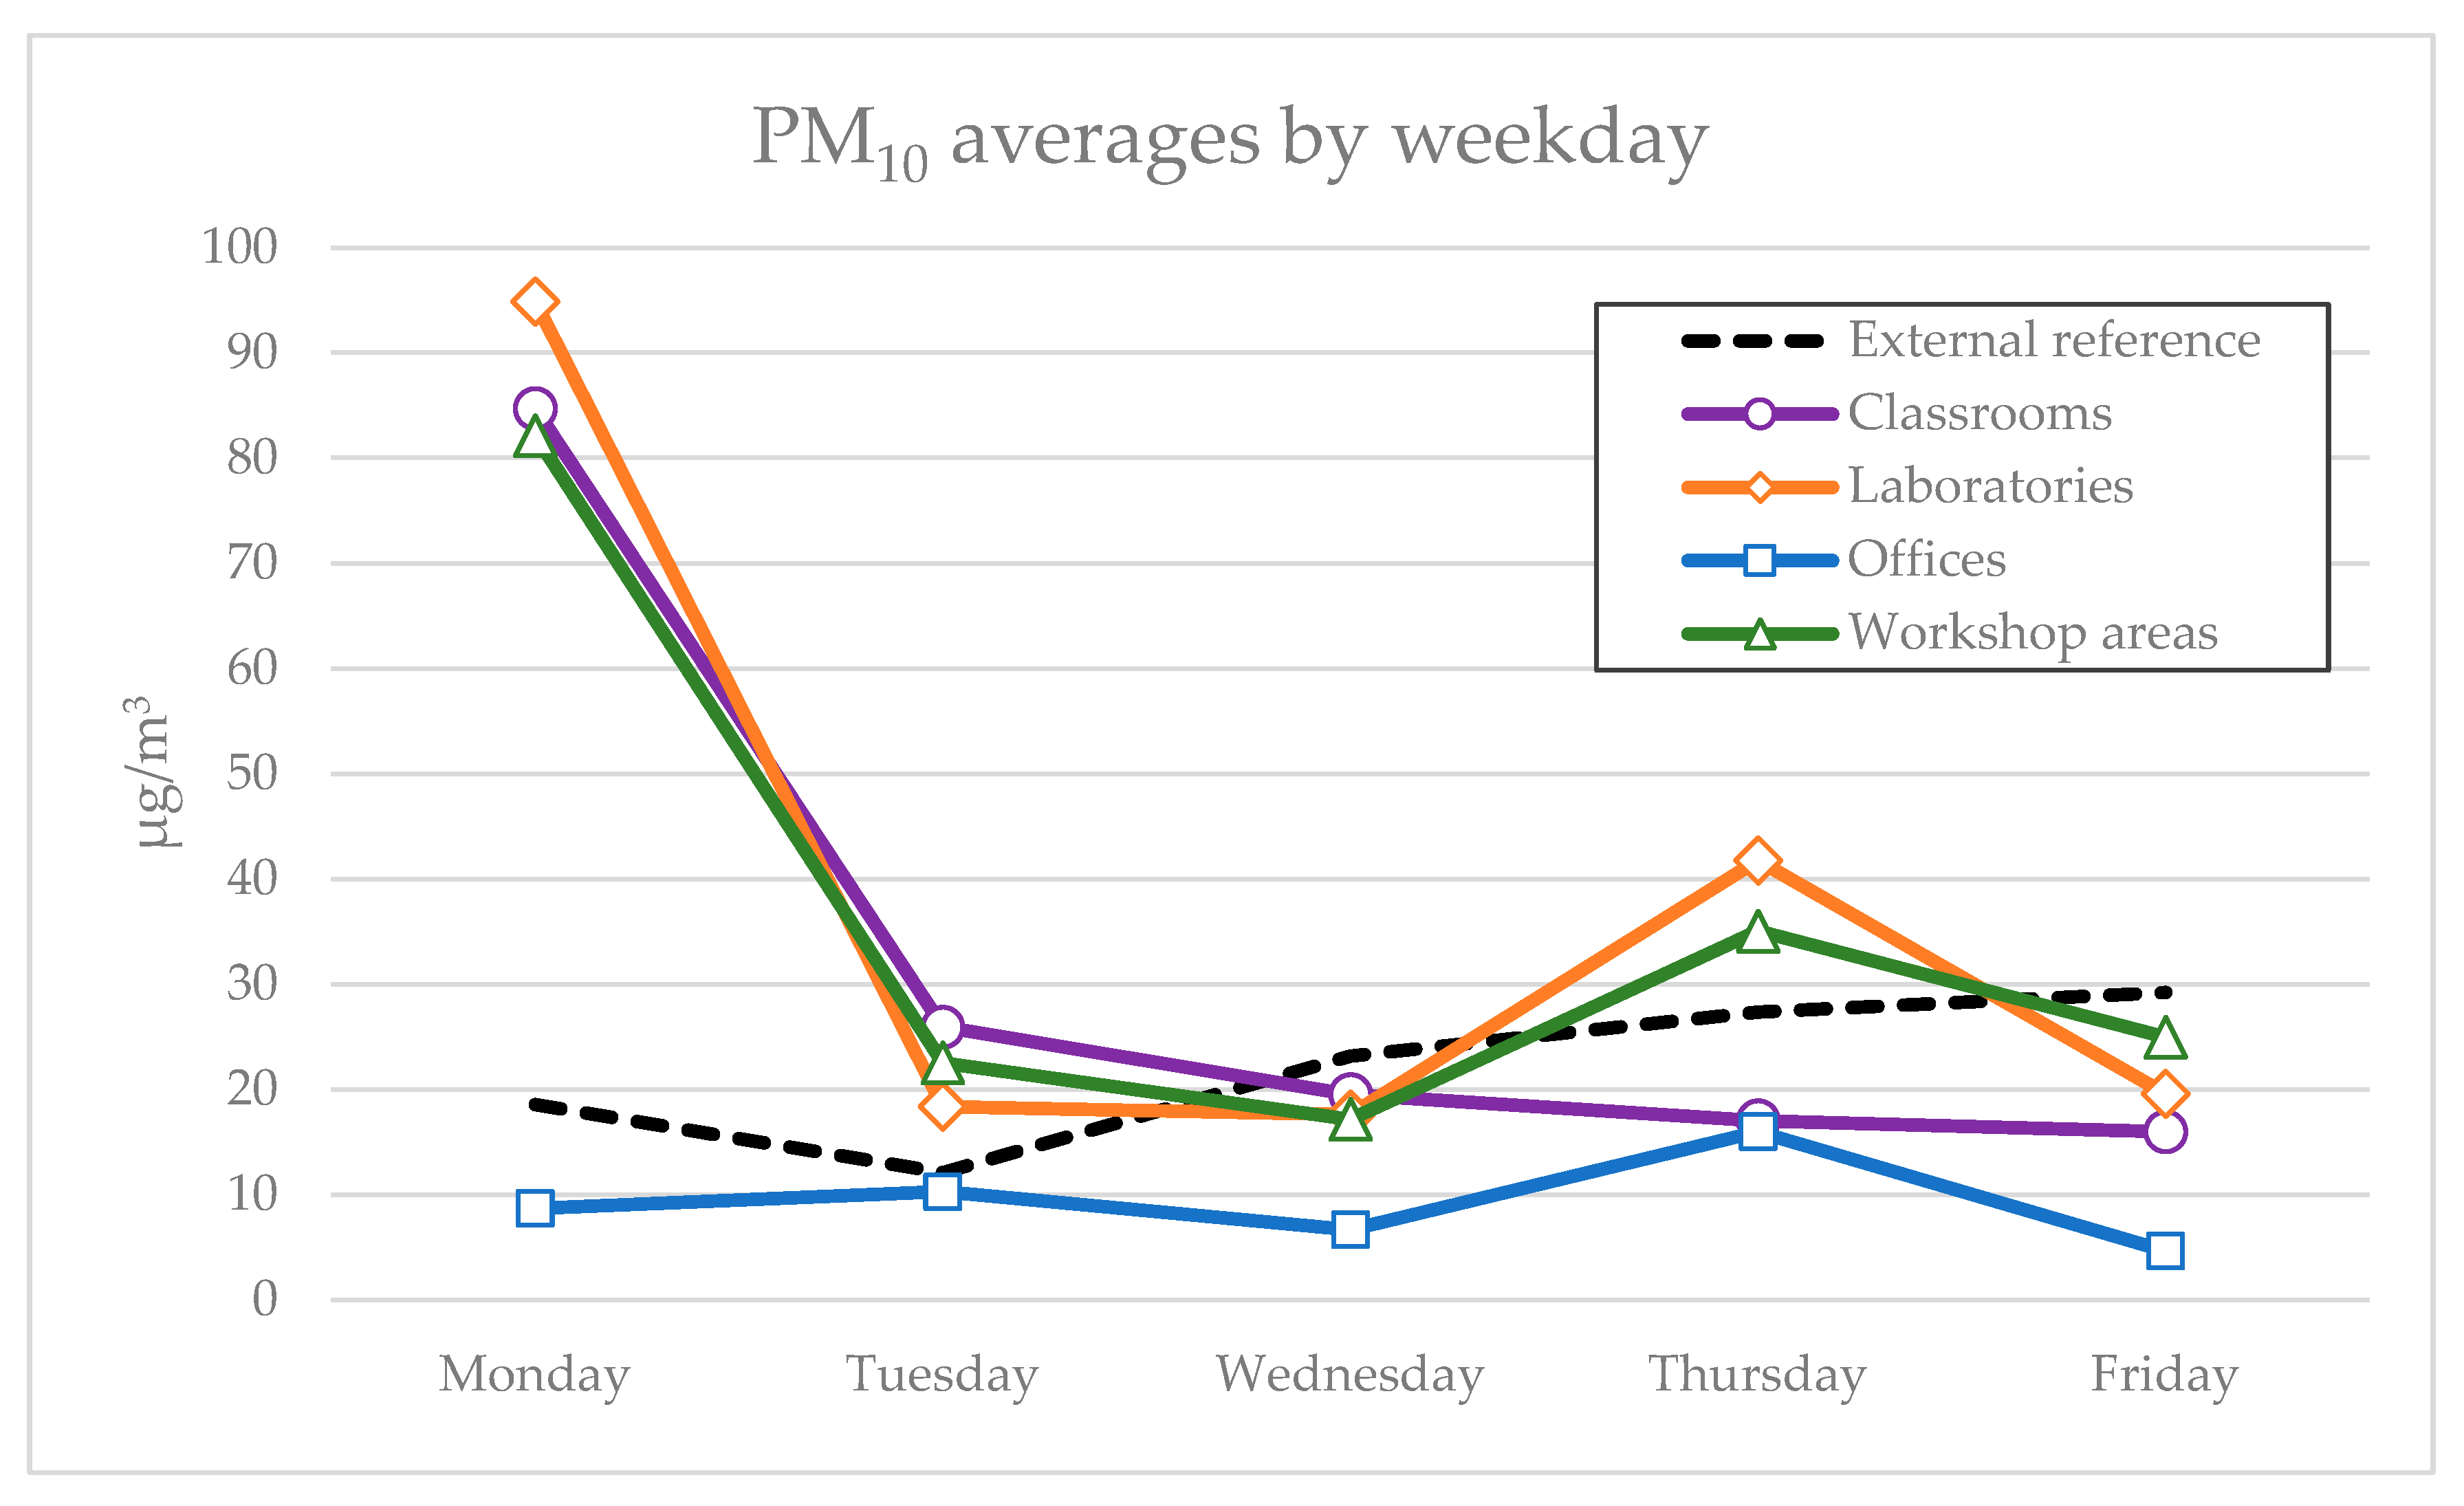
With the exception of the restrooms and office areas, which consistently showed PM10 concentrations below those of the external reference, all other indoor environments displayed elevated levels. This suggests the likely presence of indoor emission sources related to specific activities or localized point sources within these spaces. Notably, while PM10 concentrations peaked on Mondays, the external reference did not show a corresponding increase, indicating that outdoor sources are unlikely to be the cause. The temporal distributions of contaminants do not appear to be homogeneous either. A distinct weekly pattern was observed at PM10 levels, with Mondays consistently exhibiting higher concentrations than other days of the week (Figure 9) except for the office areas, which remained stable throughout the entire week, matching at a lower level the external environment.
During significant portions of the day on Mondays, PM10 concentrations in laboratories and classrooms consistently exceeded 50 µg/m3. If sustained over a 24 h period, such levels would correspond to an AQI classification in the ‘poor’ category. It would also exceed the WHO’s global air quality guideline recommendation of 45 µg/m3 over 24 h [4]. This finding is of particular concern given that students spend a substantial amount of time in these environments, as opposed to staff or academics, who may use a higher share of office time. For the lighter fractions, PM2.5 average daily concentrations never surpassed 10 μg/m3; in this case, they do not exceed the recommended 24 h mean levels of 15 µg/m3 established by the WHO [4]. On the other hand, PM1 concentrations were no higher than 1 μg/m3.
It is important to consider the operational schedule of the building: it remains closed over weekends, with the heating and air conditioning systems turned off from Saturday noon until early Monday morning. It is plausible that the elevated concentrations on Monday’s result from the accumulation of indoor pollutants over the weekend, in the absence of regular ventilation, coupled with emissions generated by renewed activity at the start of the week. However, the low and stable levels in the office areas suggest that the pollution sources are likely dependent on specific educational activities deployed according to schedule. Based on these findings, the researchers recommended the implementation of corrective measures. The initial step involved encouraging school staff to maintain constant vigilance over their respective work areas. Furthermore, a comprehensive roadmap for the continuous monitoring of key locations within the school was presented to the administration. To support this monitoring effort, sensors were installed throughout the building (Figure 10). In addition, a research project (E3LAB) was developed in the building that consisted of the installation of more than 50 sensors, allowing the precise monitoring of variables such as temperature, humidity, CO2 levels, and solar radiation [33]. This will serve as a foundation for future projects involving the installation of air quality sensors. Additionally, the research team presented its research to the administration on mitigation strategies, the ease of implementation, and the costs of implementing an HVAC system with ventilation filters or using portable cleaners in buildings [42]. To bridge the gap in the curriculum identified in this research, the teaching team has published a book (Indoor Air Quality. Notes for Architects [43]), which will be part of the content of the building services II subject. Thus, an educational workshop deployed within a living campus setting turned out to produce results that were both useful and actionable, resulting in effective management decisions with the potential to improve the educational, environmental, and health conditions for a large cohort of people in the university.

Limitations

While this study’s objectives called specifically for low-cost sensors to be used in this educational setting, this did not result in an evident lack of data quality for the purposes of the study. They had been intercalibrated in the laboratory against reference systems in another experiment and were found to be in excellent agreement across a wide range of air quality challenges, averaging high correlation coefficients as described in the Methods section [40] and showing an accuracy better than 10%. However, at the low end of the range, it should be considered that these sensors have a precision of 1 µ/m3, as opposed to the reference systems that have a typical precision of 0.1 µ/m3. While for monitoring purposes this precision should be enough as potential health effects start one order of magnitude above the lower end, for fine-scale research involving subtle effects, they might be lacking.
The short sampling window (2 h/day) might not capture daily variations or peak events. Sampling during lunch hours may introduce bias due to increased human activity and movement; this could be a confounding factor worth discussing. A compilation of class schedules, along with a diary of spatial activity and door and window openings, are needed to link PM sources to specific actions and events.
A limited period was used to evaluate air quality in our analysis. Therefore, it is important to recognize the possible influence that different variables, such as seasonal changes and human behavior, among others, can have on PM concentrations in the air space.
Correctly analyzing indoor air quality data in educational buildings requires knowledge of interior equipment and occupants, as well as the type of ventilation system in the building. The teaching team is aware that the lack of information or the lack of accessibility to the ventilation systems of the building to be analyzed can be an obstacle to the replication of this project.

5. Conclusions

This research was based on the implementation of a teaching innovation project that was conducted by the living labs strategy of the Universidad de Navarra in the School of Architecture. The project consisted of a workshop in which third-year students were given a lecture on the theoretical basis of environmental issues and encouraged to assemble a low-cost prototype sensor (PMS5003) based on Arduino software to measure particulate matter in different areas of the school. The students were also tasked with figuring out how to conduct a preliminary analysis of the data each had obtained, although the cleanup and full ensemble analysis were performed by the authors of this work. The conclusions pointed out by the students, the teaching staff, and the school’s administration are as follows:
  • The teaching innovation project on ambient air quality based on the living labs strategy fulfilled both the educational and analytical objectives, as it allowed a group of students to perform measurements and analysis of PM in the real world using sensors distributed in their school.
  • The documentation gathered from the workshop will enable replication across other university buildings with the aim of improving air quality (and energy performance) throughout the Universidad de Navarra campus and adoption by other researchers and professors from different disciplines.
  • After the analysis of the data obtained and the advice of the research team, the administration of the school has installed air quality sensors in the architecture laboratory to continuously monitor laser cutting, 3D printing, and milling areas. By analyzing these initial emission points, we hope to obtain a more complete picture of the architecture laboratory and continue to implement mitigation measures.
  • The administration and professors are examining the incorporation of indoor environment topics into the curriculum of the program in architectural studies.

Supplementary Materials

The following supporting information can be downloaded at: https://www.mdpi.com/article/10.3390/buildings15162873/s1. 1. connection of the Arduino board to the components; 2. list of the prototype components; 3. programming lines.

Author Contributions

Conceptualization, S.D.-O., R.M., C.M.-G., and A.Z.-R.; methodology, S.D.-O., R.M., C.M.-G., and A.Z.-R.; software, A.H.A., L.G.-O., and R.M.; validation, A.H.A.; data curation, A.H.A., L.G.-O., and R.M.; data analysis, A.H.A.; writing—original draft preparation, S.D.-O., R.M., C.M.-G., and A.Z.-R.; writing—review and editing, A.H.A., C.M.-G., and R.M.; visualization, A.H.A. and R.M.; supervision, A.H.A. and C.M.-G. All authors have read and agreed to the published version of the manuscript.

Funding

A.H.A., A.Z.-R., C.M.-G., and R.M. acknowledge the support received from the Spanish Ministerio de Ciencia, Innovación y Universidades for funding the research project Quantifying pollutants originated by the exhalation of buildings in urban environments EXHAL (PID2019-104083RB-I00). R.M. acknowledges the support received from the Ayudas para la Formación de Profesorado Universitario by Ministerio de Universidades, Spain (FPU2020/04936). S.D.-O. acknowledges the support received from Fundación Cátedra Saltoki, Universidad de Navarra.

Data Availability Statement

The raw data supporting the conclusions of this article will be made available by the authors on request.

Acknowledgments

The teaching team S.D.-O., R.M., C.M.-G., and A.Z.-R. would like to thank the third-year students of the Buildings Services II subject in the academic year 2022-2023, for contributing to the assembly of the systems and carrying out the sampling.

Conflicts of Interest

The authors declare no conflicts of interest.

References

  1. Cohen, A.J.; Brauer, M.; Burnett, R.; Anderson, H.R.; Frostad, J.; Estep, K.; Balakrishnan, K.; Brunekreef, B.; Dandona, L.; Dandona, R.; et al. Estimates and 25-Year Trends of the Global Burden of Disease Attributable to Ambient Air Pollution: An Analysis of Data from the Global Burden of Diseases Study 2015. Lancet 2017, 389, 1907–1918. [Google Scholar] [CrossRef] [PubMed]
  2. Sadrizadeh, S.; Yao, R.; Yuan, F.; Awbi, H.; Bahnfleth, W.; Bi, Y.; Cao, G.; Croitoru, C.; de Dear, R.; Haghighat, F.; et al. Indoor Air Quality and Health in Schools: A Critical Review for Developing the Roadmap for the Future School Environment. J. Build. Eng. 2022, 57, 104908. [Google Scholar] [CrossRef]
  3. Pourkiaei, M.; Romain, A.-C. Scoping Review of Indoor Air Quality Indexes: Characterization and Applications. J. Build. Eng. 2023, 75, 106703. [Google Scholar] [CrossRef]
  4. World Health Organization. WHO Global Air Quality Guidelines. Particulate Matter (PM2.5 and PM10), Ozone, Nitrogen Dioxide, Sulfur Dioxide and Carbon Monoxide. Available online: https://www.who.int/publications/i/item/9789240034228 (accessed on 25 July 2023).
  5. Ramprasad, V.; Subbaiyan, G. Perceived Indoor Environmental Quality of Classrooms and Outcomes: A Study of a Higher Education Institution in India. Archit. Eng. Des. Manag. 2017, 13, 202–222. [Google Scholar] [CrossRef]
  6. Canha, N.; Correia, C.; Mendez, S.; Gamelas, C.A.; Felizardo, M. Monitoring Indoor Air Quality in Classrooms Using Low-Cost Sensors: Does the Perception of Teachers Match Reality? Atmosphere 2024, 15, 1450. [Google Scholar] [CrossRef]
  7. Jurado, S.R.; Bankoff, A.D.P.; Sanchez, A. Indoor Air Quality in Brazilian Universities. Int. J. Environ. Res. Public Health 2014, 11, 7081–7093. [Google Scholar] [CrossRef]
  8. Lim, E.Y.; Kim, G.-D. Particulate Matter-Induced Emerging Health Effects Associated with Oxidative Stress and Inflammation. Antioxidants 2024, 13, 1256. [Google Scholar] [CrossRef]
  9. Kastury, F.; Smith, E.; Juhasz, A.L. A Critical Review of Approaches and Limitations of Inhalation Bioavailability and Bioaccessibility of Metal (Loid)s from Ambient Particulate Matter or Dust. Sci. Total Environ. 2017, 574, 1054–1074. [Google Scholar] [CrossRef]
  10. Janssen, N.A.H.; Brunekreef, B.; van Vliet, P.; Aarts, F.; Maliefste, K.; Harssema, H.; Fischer, P. The Relationship between Air Pollution from Heavy Traffic and Allergic Sensitization, Bronchial Hyperresponsieness Byperresponsiveness, and Respiratory Symptoms in Dutch Schoolchildren. Environ. Health Perspect. 2003, 111, 1512–1518. [Google Scholar] [CrossRef]
  11. Feng, Z.; Hou, H.C.; Lan, H. Understanding University Students’ Perceptions of Classroom Environment: A Synergistic Approach Integrating Grounded Theory (GT) and Analytic Hierarchy Process (AHP). J. Build. Eng. 2024, 83, 108446. [Google Scholar] [CrossRef]
  12. Higgins, C.; Kumar, P.; Morawska, L. Indoor Air Quality Monitoring and Source Apportionment Using Low-Cost Sensors. Environ. Res. Commun. 2024, 6, 012001. [Google Scholar] [CrossRef]
  13. Castell, N.; Dauge, F.R.; Schneider, P.; Vogt, M.; Lerner, U.; Fishbain, B.; Broday, D.; Bartonova, A. Can Commercial Low-Cost Sensor Platforms Contribute to Air Quality Monitoring and Exposure Estimates? Environ. Int. 2017, 99, 293–302. [Google Scholar] [CrossRef]
  14. Sá, J.P.; Alvim-Ferraz, M.C.M.; Martins, F.G.; Sousa, S.I.V. Application of the Low-Cost Sensing Technology for Indoor Air Quality Monitoring: A Review. Environ. Technol. Innov. 2022, 28, 102551. [Google Scholar] [CrossRef]
  15. Rai, A.C.; Kumar, P.; Pilla, F.; Skouloudis, A.N.; Di Sabatino, S.; Ratti, C.; Yasar, A.; Rickerby, D. End-User Perspective of Low-Cost Sensors for Outdoor Air Pollution Monitoring. Sci. Total Environ. 2017, 607, 691–705. [Google Scholar] [CrossRef]
  16. Ródenas García, M.; Spinazzé, A.; Branco, P.T.B.S.; Borghi, F.; Villena, G.; Cattaneo, A.; Di Gilio, A.; Mihucz, V.G.; Gómez Álvarez, E.; Lopes, S.I.; et al. Review of Low-Cost Sensors for Indoor Air Quality: Features and Applications. Appl. Spectrosc. Rev. 2022, 57, 747–779. [Google Scholar] [CrossRef]
  17. Pandya, S.; Ghayvat, H.; Sur, A.; Awais, M.; Kotecha, K.; Saxena, S.; Jassal, N.; Pingale, G. Pollution Weather Prediction System: Smart Outdoor Pollution Monitoring and Prediction for Healthy Breathing and Living. Sensors 2020, 20, 5448. [Google Scholar] [CrossRef]
  18. Rose, O.G.; Bousiotis, D.; Rathbone, C.; Pope, F.D. Investigating Indoor Air Pollution Sources and Student’s Exposure Within School Classrooms: Using a Low-Cost Sensor and Source Apportionment Approach. Indoor Air 2024, 2024, 5544298. [Google Scholar] [CrossRef]
  19. Apostolopoulos, I.D.; Dovrou, E.; Androulakis, S.; Seitanidi, K.; Georgopoulou, M.P.; Matrali, A.; Argyropoulou, G.; Kaltsonoudis, C.; Fouskas, G.; Pandis, S.N. Monitoring of Indoor Air Quality in a Classroom Combining a Low-Cost Sensor System and Machine Learning. Chemosensors 2025, 13, 148. [Google Scholar] [CrossRef]
  20. Morawska, L.; Asbach, C.; Patel, H. Application of PM2.5 Low-Cost Sensors for Indoor Air Quality Compliance Monitoring. Aerosol Sci. Technol. 2025, 1–11. [Google Scholar] [CrossRef]
  21. Martín-Gómez, C.; Zapata, O.; Zuazua, A.; Villanueva, S.; Olaizola, P. Building Services Cabinets as Teaching Material in a Degree in Architecture. Eur. J. Eng. Educ. 2014, 39, 143–156. [Google Scholar] [CrossRef]
  22. Monedero Isorna, J. Enseñanza y Práctica Profesional de la Arquitectura en Europa y Estados Unidos. Available online: https://futur.upc.edu/427658 (accessed on 2 September 2024).
  23. Martín Gómez, C.; Ibañez Puy, E.; Zuazua Ros, A. Heat Kit: Creación de un prototipo para ‘tocar’ el calor. In Libro de Actas IN-RED 2018: IV Congreso Nacional de Innovación Educativa y Docencia en Red; Universitat Politècnica València: Valencia, Spain, 2018; pp. 1–12. [Google Scholar] [CrossRef]
  24. Martín-Gómez, C.; Eguaras, M.; Mambrilla, N.; Domingo, E. IV Jornadas Internacionales sobre Investigación en Arquitectura y Urbanismo; General de Ediciones de Arquitectura: Valencia, Spain, 2011. [Google Scholar]
  25. Sayan, H.E.; Dülger, S. Evaluation of the Relationship between Sick Building Syndrome Complaints among Hospital Employees and Indoor Environmental Quality. Med. Lav. 2021, 112, 153–161. [Google Scholar] [CrossRef] [PubMed]
  26. EPA, U.S. Environments Division, I. Indoor Air Facts No. 4 Sick Building Syndrome. 1991. Available online: https://www.epa.gov/sites/default/files/2014-08/documents/sick_building_factsheet.pdf (accessed on 6 August 2025).
  27. Mandrikas, A.; Stavrou, D.; Skordoulis, C. Teaching Air Pollution in an Authentic Context. J. Sci. Educ. Technol. 2017, 26, 238–251. [Google Scholar] [CrossRef]
  28. World Health Organization. Review of Evidence on Health Aspects of Air Pollution-REVIHAAP Project. Available online: https://www.ncbi.nlm.nih.gov/books/NBK361805/ (accessed on 11 June 2025).
  29. Universidad de Navarra. Living Labs. Available online: https://www.unav.edu/web/instituto-de-biodiversidad-y-medio-ambiente/catedra-campus-home/living-labs (accessed on 6 August 2025).
  30. ENoLL. European Network of Living Labs. Available online: https://enoll.org/ (accessed on 6 August 2025).
  31. Leminen, S.; Westerlund, M.; Nyström, A.-G. Living Labs as Open-Innovation Networks. Technol. Innov. Manag. Rev. 2012, 2, 6–11. [Google Scholar] [CrossRef]
  32. Dorregaray-Oyaregui, S.; Muñoz Corsini, C.; Eugenia Clouet, M. Measuring the Carbon Footprint at Universidad de Navarra (Spain). In ICARB Conference on Carbon Accounting Measuring Net Zero: Carbon Accounting for Buildings and Communities; Roaf, S., Bros-Williamson, J., Finlayson, W., Eds.; ICARB: Edinburgh, UK, 2023; pp. 294–307. [Google Scholar]
  33. Naya, C.; Dorregaray-Oyaregui, S.; Alonso, F.; Roquette, J.L.; Yoldi, J.M.; Martín-Gómez, C. Transforming a Heritage Building into a Living Laboratory: A Case Study of Monitoring. Energies 2025, 18, 3622. [Google Scholar] [CrossRef]
  34. Green Flag Award. Campus de la Universidad de Navarra. Available online: https://www.greenflagaward.org/park-summary/?park=3268 (accessed on 10 June 2025).
  35. Ministerio de la Presidencia. Reglamento de Instalaciones Térmicas en Los Edificios; BOE-A-2007-15820; Ministerio de la Presidencia: Madrid, Spain, 2007; pp. 1–97.
  36. Yong, Z.; Haoxin, Z. Product Data Manual of Plantower. Available online: https://www.aqmd.gov/docs/default-source/aq-spec/resources-page/plantower-pms5003-manual_v2-3.pdf (accessed on 2 September 2024).
  37. Manzueta Felix, R.E.; Martín-Gómez, C.; Zuazua-Ros, A.; Ramos González, J.C.; De Brito Andrade, L.; Ariño, A.H. Methodology for Quantification of Exhaled Pollutant Emissions in Residential Buildings. In Proceedings of the 3rd Valencia International Biennial of Research in Architecture, VIBRArch, València, Spain, 9–11 September 2022; pp. 162–171. [Google Scholar] [CrossRef]
  38. Dorregaray-Oyaregui, S.; Ariño, A.; Andrade De Brito, L.; Zuazua-Ros, A.; Ramos, J.C.; Manzueta, R.; Sánchez Sáiz-Ezquerra, B.; Martín-Gómez, C. The Conceptualization of Exhalation in Buildings. In Proceedings of the 2022: CLIMA 2022 the 14th REHVA HVAC World Congress, Rotterdam, The Netherlands, 22–25 May 2022. [Google Scholar] [CrossRef]
  39. Zuazua-Ros, A.; de Brito Andrade, L.; Dorregaray-Oyaregui, S.; Martín-Gómez, C.; Ramos González, J.C.; Manzueta, R.; Sánchez Saiz-Ezquerra, B.; Ariño, A.H. Crosscutting of the Pollutants and Building Ventilation Systems: A Literature Review. Environ. Sci. Pollut. Res. 2023, 30, 66538–66558. [Google Scholar] [CrossRef]
  40. Ariño, A.H.; Manzueta, R.; Martín-Goméz, C. Cost-Effectiveness of Particulate Matter Sensors for Urban Pollution Assessment; Department of Construction, Building Services and Structures, Universidad de Navarra: Pamplona, Spain, 2025. [Google Scholar]
  41. European Environment Agency. European Air Quality Index. Available online: https://airindex.eea.europa.eu/AQI/index.html# (accessed on 26 July 2025).
  42. Manzueta, R.; Kumar, P.; Ariño, A.H.; Martín-Gómez, C. Strategies to Reduce Air Pollution Emissions from Urban Residential Buildings. Sci. Total Environ. 2024, 951, 175809. [Google Scholar] [CrossRef]
  43. Manzueta, R.; Dorregaray-Oyaregui, S.; Martín-Gómez, C.; Zuazua-Ros, A. Calidad Del Aire Interior. Apuntes Para Arquitectos, 1st ed.; EUNSA: Pamplona, Spain, 2025; Volume 1, ISBN 978-84-313-4048-3. [Google Scholar]
Figure 1. Cross-section of the four staggered floors and the underground of the School of Architecture, Universidad de Navarra.
Buildings 15 02873 g001
Figure 2. Interior of the School of Architecture of the Universidad de Navarra. Ground floor: (1). architecture laboratory; (2). multi-propose classroom; (3). conference room. Second floor: (4). view of a workshop classroom from the staggered third floor; (5,6). workshop classrooms; (7). axial view of the first + third (right) and second (left) floors. Third floor: (8). office floor; (9). axial view of the second floor (right) and third floor (left); (10). view of the first floor.
Buildings 15 02873 g002
Figure 3. Isometric view of the ventilation system of the School of Architecture. Blue: ducts supplying the workshop areas. Green: architecture laboratory area. Yellow: office area. Purple: classroom area. Grey: common area ducts.
Buildings 15 02873 g003
Figure 4. Zoning of the School of Architecture for the sampling of particulate matter concentrations. The zones were attributed according to the type of use. Left: lower floors; right: upper floors.
Buildings 15 02873 g004
Figure 5. Main components used to build the prototype of the particulate matter concentration low-cost sensor Plantower PMS5003.
Buildings 15 02873 g005
Figure 6. Photographs of the three stages involved in the workshop. Stage 1: (1). One of the component kits was handed out. (2). Pre-assembly of the LCS. (3). Classroom with the kits. Stage 2: (4). Students and researchers during the workshop. (5). Sample of handout materials. (6). Sample of the Sketch code uploaded to the Arduino boards. Stage 3: (7,8). Prototypes already assembled by the different groups of students. (9). A student prepares to monitor office 1111. (10). Monitoring at the ground floor’s hall.
Buildings 15 02873 g006
Figure 7. Distribution of PM10 (µg/m3) across the building. Data interpolated by inverse distance weighting among all sampling points from the maximum of each 15 min average over the entire sampling campaign. Left: lower floors; right: upper floors. The architecture laboratory shares a classroom volume with the adjacent classroom block (dashed line). RR: Restrooms. (N.B. Color scale does not intend to represent the AQI color scheme but the mapped PM levels.).
Buildings 15 02873 g007
Figure 8. Share of exposure time to PM10 measurements that fall within the AQI level boundary in the different zones of the building compared with an external reference.
Buildings 15 02873 g008
Figure 9. PM10 concentrations (μg/m3) by day of week during the experimental weeks and external reference for the same weeks. Restrooms and common areas are not shown because data was missing for specific weekdays at those locations.
Buildings 15 02873 g009
Figure 10. Some of the sensors and monitors that have been placed in the School of Architecture as a consequence of the workshop’s raised awareness across the academic corpus.
Buildings 15 02873 g010
Table 1. Low-cost sensor specifications. From Ariño et al. [40].
ModelPlantower PMS5003 LCS
TypeIntegrable sensor module
TechnologyOptical laser-scattering
Minimal additional assembly for operationArduino board with RTC and SD card adapter
Other assembly in the experimental setup36 A power pack, box
Sensor cost range<EUR 100
Operational cost range (assembled)EUR 100–200
Size (mm) (H × W × L)21 × 50 × 38 (sensor only), ~70 × 120 × 200 (with Arduino board, modules, battery and box)
Weight42 g (sensor only), ~0.5 kg (all up)
Power supply, typical draw (assembly)12 V, ~0.2 A
Detection range (aerodynamic diameter)0.3–10 μm
Concentration range0–500 μg/m3
Particle data channels3 (PM1, PM2.5, PM10)
Reported data precision1 μg/m3
Sampling frequency1 Hz (max), 0.1 Hz (typical)
Table 2. PM concentrations in μg/m3 in the different zones of the School of Architecture. Means of n 15 min or more sampling events in each area, each being averaged from (m) individual readings spaced 10 s, and maxima among the area’s samplings events (in brackets: peak readings across all area’s individual measurements), color-coded according to the European Air Quality Index if the corresponding means (for each entire area) or maxima (from specific sampling points within the area) were sustained over a full day The external reference was an official, calibrated background air quality station located 1 km NE from the School, providing hourly averages for PM10. Mean across the sampling period and maximum hourly value recorded in that period.
PM10PM2.5PM1
AREAMeanMaxMeanMaxMeanMaxn (m)
Laboratories47.9 ± 16.5118.6 (164)3.4 ± 1.29.1 (36)0.3 ± 0.10.5 (7)6 (625)
Workshop areas43.3 ± 9.3119.9 (285)3.7 ± 0.810.6 (54)0.3 ± 0.00.5 (4)15 (1391)
Classrooms35.6 ± 10.989.9 (158)2.9 ± 0.76.4 (18)0.3 ± 0.00.6 (6)8 (762)
Common areas31.2 ± 10.762.9 (98)2.8 ± 0.74.8 (20)0.3 ± 0.10.4 (4)4 (378)
Restrooms14.0 ± 8.922.9 (41)1.6 ± 0.92.5 (8)0.2 ± 0.20.3 (2)2 (198)
Offices9.5 ± 2.339.1 (78)1.1 ± 0.47.6 (14)0.1 ± 0.00.9 (4)20 (1972)
Overall28.5 ± 4.1119.9 (285)2.5 ± 0.310.6 (54)0.2 ± 0.00.9 (7)55 (5326)
External22.1 ± 2.449
Disclaimer/Publisher’s Note: The statements, opinions and data contained in all publications are solely those of the individual author(s) and contributor(s) and not of MDPI and/or the editor(s). MDPI and/or the editor(s) disclaim responsibility for any injury to people or property resulting from any ideas, methods, instructions or products referred to in the content.