Abstract
This study develops a comprehensive evaluation framework for urban street alfresco spaces by integrating the Analytic Hierarchy Process (AHP) and Entropy Weight Method. Daxue Road in Shanghai is selected as a representative case to analyze key factors influencing urban street alfresco spaces, which refer to commercially utilized outdoor extensions of building facades along streets, typically in the form of semi-open, publicly accessible areas used for dining, vending, seating, or temporary retail activities. These spaces are typically operated by adjacent businesses or regulated by local policies, and they integrate pedestrian circulation, commercial vibrancy, and spatial adaptability. They serve as critical urban interfaces that foster street-level vibrancy, social interaction, and public life. The evaluation system covers five dimensions: Cognizability, Accessibility, Participation, Emotional Design, and Spatial Diversity. The methodological innovation lies in integrating subjective weights derived from AHP with objective weights obtained through entropy calculations, which enhances the scientific rigor and neutrality of the evaluation. The results show that traffic safety (weight = 0.0644) and locational attributes of streets (weight = 0.0574) are the most influential factors affecting user perception. Compared to previous studies that often prioritize visual aesthetics or commercial density, this study underscores the significance of traffic-related factors, indicating a shift in user preferences in high-density urban environments. The findings provide practical guidance for urban design and policy to improve the quality, safety, and vitality of street-level public spaces in high-density cities. This research contributes to the theoretical foundation for sustainable and human-oriented street regeneration.
1. Introduction
With the advancement of urbanization, lifestyles, social structures, and spatial configurations have undergone significant transformations. In recent years, shifts in public consciousness have led to a sharp rise in the demand for urban social interaction, thereby revealing a critical shortage of public spaces that can accommodate such needs. In many first-tier cities, high-density living conditions have constrained the availability of open spaces, particularly for young populations whose social lives often rely on cultural and recreational infrastructure such as parks, plazas, cultural venues, and commercial complexes. While these facilities provide partial relief, they fail to fully meet the evolving spatial and social requirements of urban dwellers. Moreover, challenges such as spatial scarcity in historic urban cores, inflexible governance, and excessive commercialization frequently undermine the freedom and spontaneity of public social engagement. How, then, can cities provide inclusive and functional public spaces for social interaction in increasingly urbanized environments? One promising avenue may lie in the strategic utilization of urban streets.
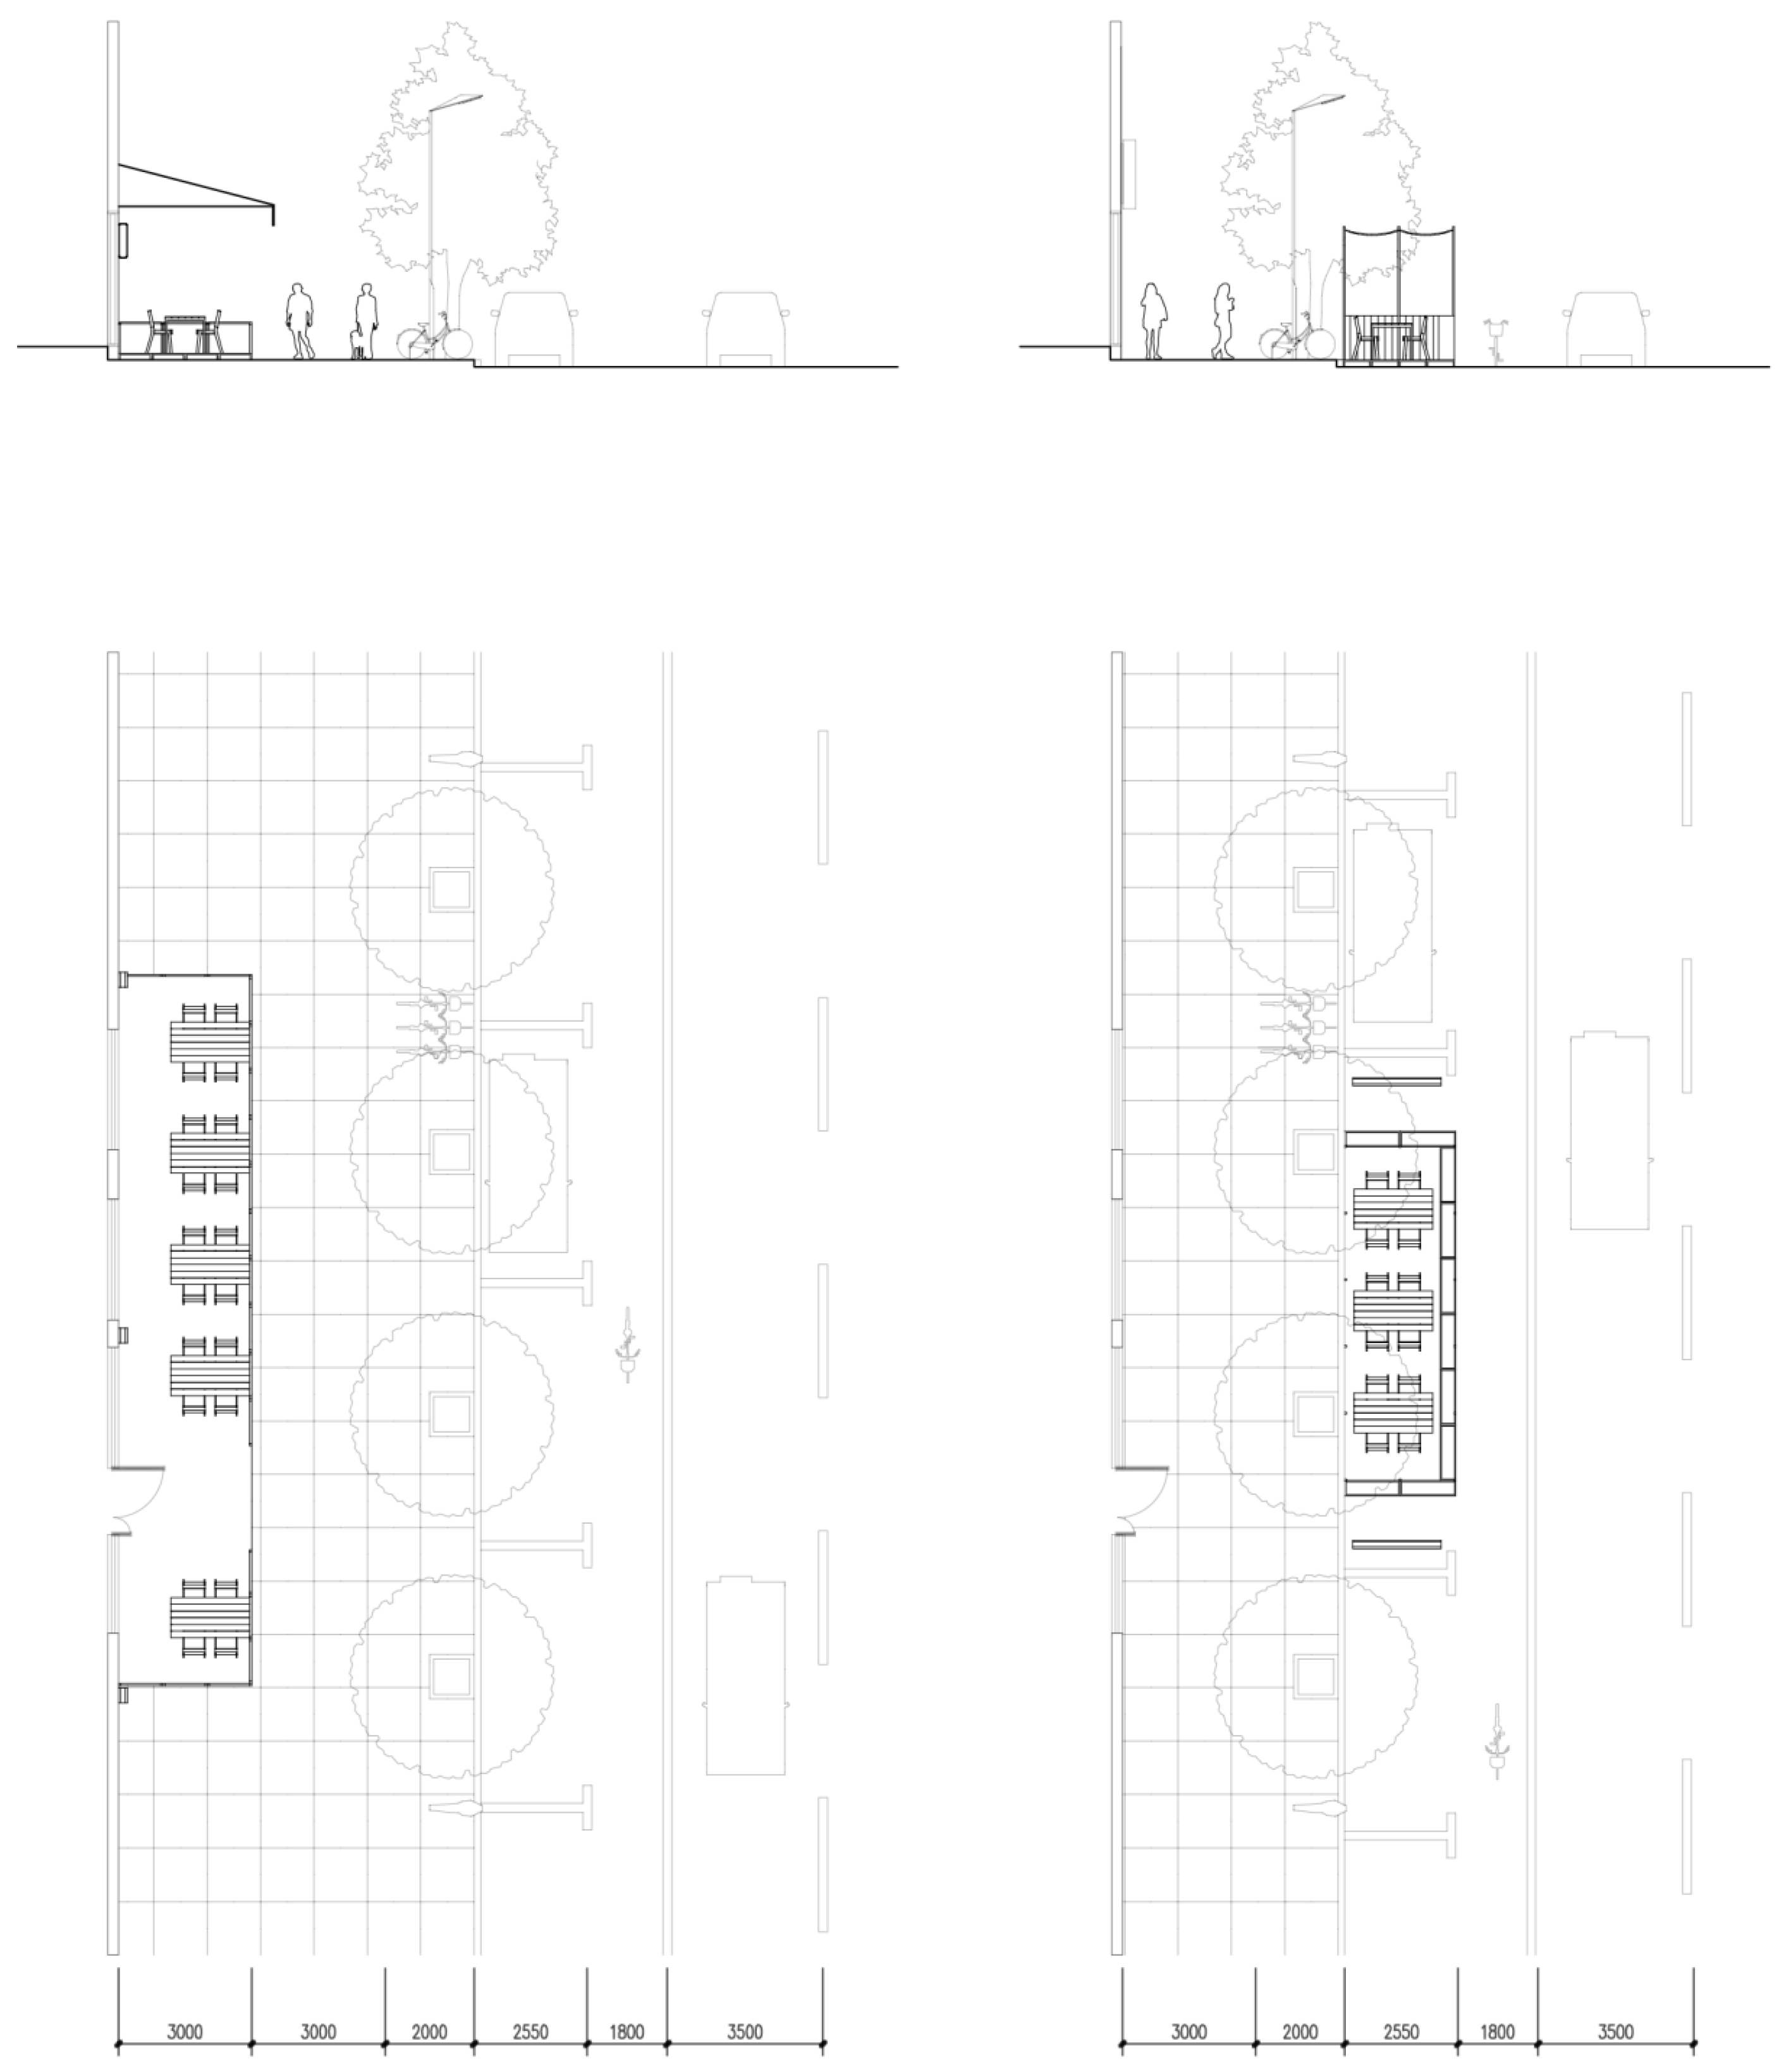
For many years, street space has been regarded as a “leftover” or residual component in urban design, and everyday activities—such as resting, waiting, socializing, shopping, dining, and leisure—have often been overlooked or discouraged [1]. Since the launch of China’s 14th Five-Year Plan, new directives have emerged for the renovation of aging urban areas, and the notion of “organic urban renewal” has gained increasing clarity and emphasis. As urbanization progresses, the role of street space has gained growing attention. Its vitality now denotes not only safety and attractiveness but also the capacity to support diverse social activities and serve as venues for cultural exchange. Such spaces represent the successful outcome of people-centered placemaking processes [2]. Under these conditions, enhancing street vitality becomes a strategic priority, directly influencing urban competitiveness and residents’ well-being [3]. How then can urban streets be effectively utilized to provide comfortable public spaces and enhance street vitality? The urban street alfresco space model may offer a viable solution, with its spatial scope illustrated in Figure 1.
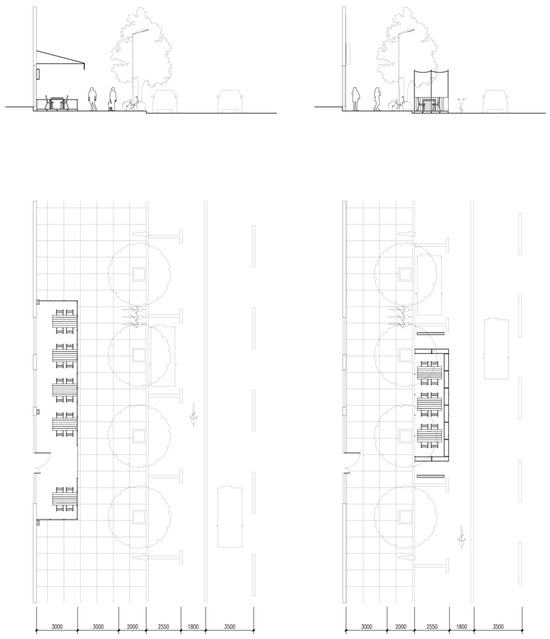
Figure 1.
Schematic of the scope of the urban street alfresco space model.
The study of urban street spaces is grounded in a robust academic tradition. In 1961, Jane Jacobs, in The Death and Life of Great American Cities, argued that streets are not merely transportation corridors but essential platforms for urban social interaction [4]. She emphasized the significance of the “uses” of streets—such as safety, social engagement, and children’s play—in fostering urban vitality. This perspective laid the theoretical foundation for evaluating urban street alfresco spaces, highlighting that streets are both physical constructs and social conduits. In The Architecture of the City (1966), Aldo Rossi contended that urban design must engage with historical memory, monumentality, publicness, and privacy. He argued that urban design is not solely the arrangement of physical space but also a mirror of social dynamics. Rossi proposed designing short, winding streets and incorporating buildings of different eras and conditions within urban blocks to enhance spatial vibrancy and diversity [5]. This theoretical lens offers both historical depth and cultural insight for evaluating urban street alfresco spaces. In Life Between Buildings, Jan Gehl further emphasized the linkage between streets and public life, proposing that streets serve as gateways to communal interaction by guiding pedestrian flows and catalyzing social exchanges. He advocated for street design grounded in human behavior and user needs, with an emphasis on accessibility, safety, and comfort [6]. This framework articulates a human-centered design philosophy and offers methodological grounding for the evaluation of urban street alfresco spaces. In 1980, William H. Whyte, through his influential work The Social Life of Small Urban Spaces, examined the interrelationship between social behavior and environmental quality in small-scale urban contexts. He demonstrated that human behavioral patterns are closely correlated with spatial design and that streets—as public spaces—should be designed in response to users’ behavioral tendencies and preferences [7]. This suggests that evaluating alfresco street spaces requires attention not only to physical characteristics but also to their social functionality, thus contributing to sustainable urban development. In recent years, in response to urban regeneration and sustainability goals, researchers have increasingly adopted data-driven and quantitative methods to assess alfresco street spaces. For example, Long Ying and Tang Jingxian, in their work “Advances in Large-Scale Quantitative Measurement of Urban Street Spatial Quality”, proposed a multidimensional assessment model based on street view imagery, incorporating traffic, social, and environmental dimensions [8]. This approach enhances assessment objectivity and replicability, offering critical data support for evidence-based urban planning. In practical applications, it is also imperative to account for user perceptions and behavioral responses. In “Lively Streets”, V. Mehta conducted observational studies and surveys on commercial streets, identifying elements such as seating, street width, and localized commerce as key determinants of people’s willingness to linger and engage socially [9]. These findings underscore the importance of incorporating user behavior and perception into alfresco space evaluation to ensure alignment with real-world needs. Furthermore, Xiao Yang and Fang Ying, in their study “A Study on Street Evaluation Based on Sociability: A Case Study of Julu Road in Shanghai”, highlighted the centrality of social interaction in street evaluation and introduced targeted assessment indicators. Their work reinforces the imperative of integrating social dimensions into evaluation frameworks to better capture the influence of alfresco spaces on residents’ quality of life [10]. nalysis—resIn summary, research on the evaluation system of urban street alfresco spaces is of both theoretical and practical significance. It contributes to a deeper understanding of the social functions of urban spaces and provides a scientific foundation for urban planning, architectural design, and public policy-making. By employing multidimensional and quantitative evaluation methods—combined with user behavior and perception aearchers can more comprehensively assess the quality of alfresco street spaces, thereby supporting the sustainable development of cities.
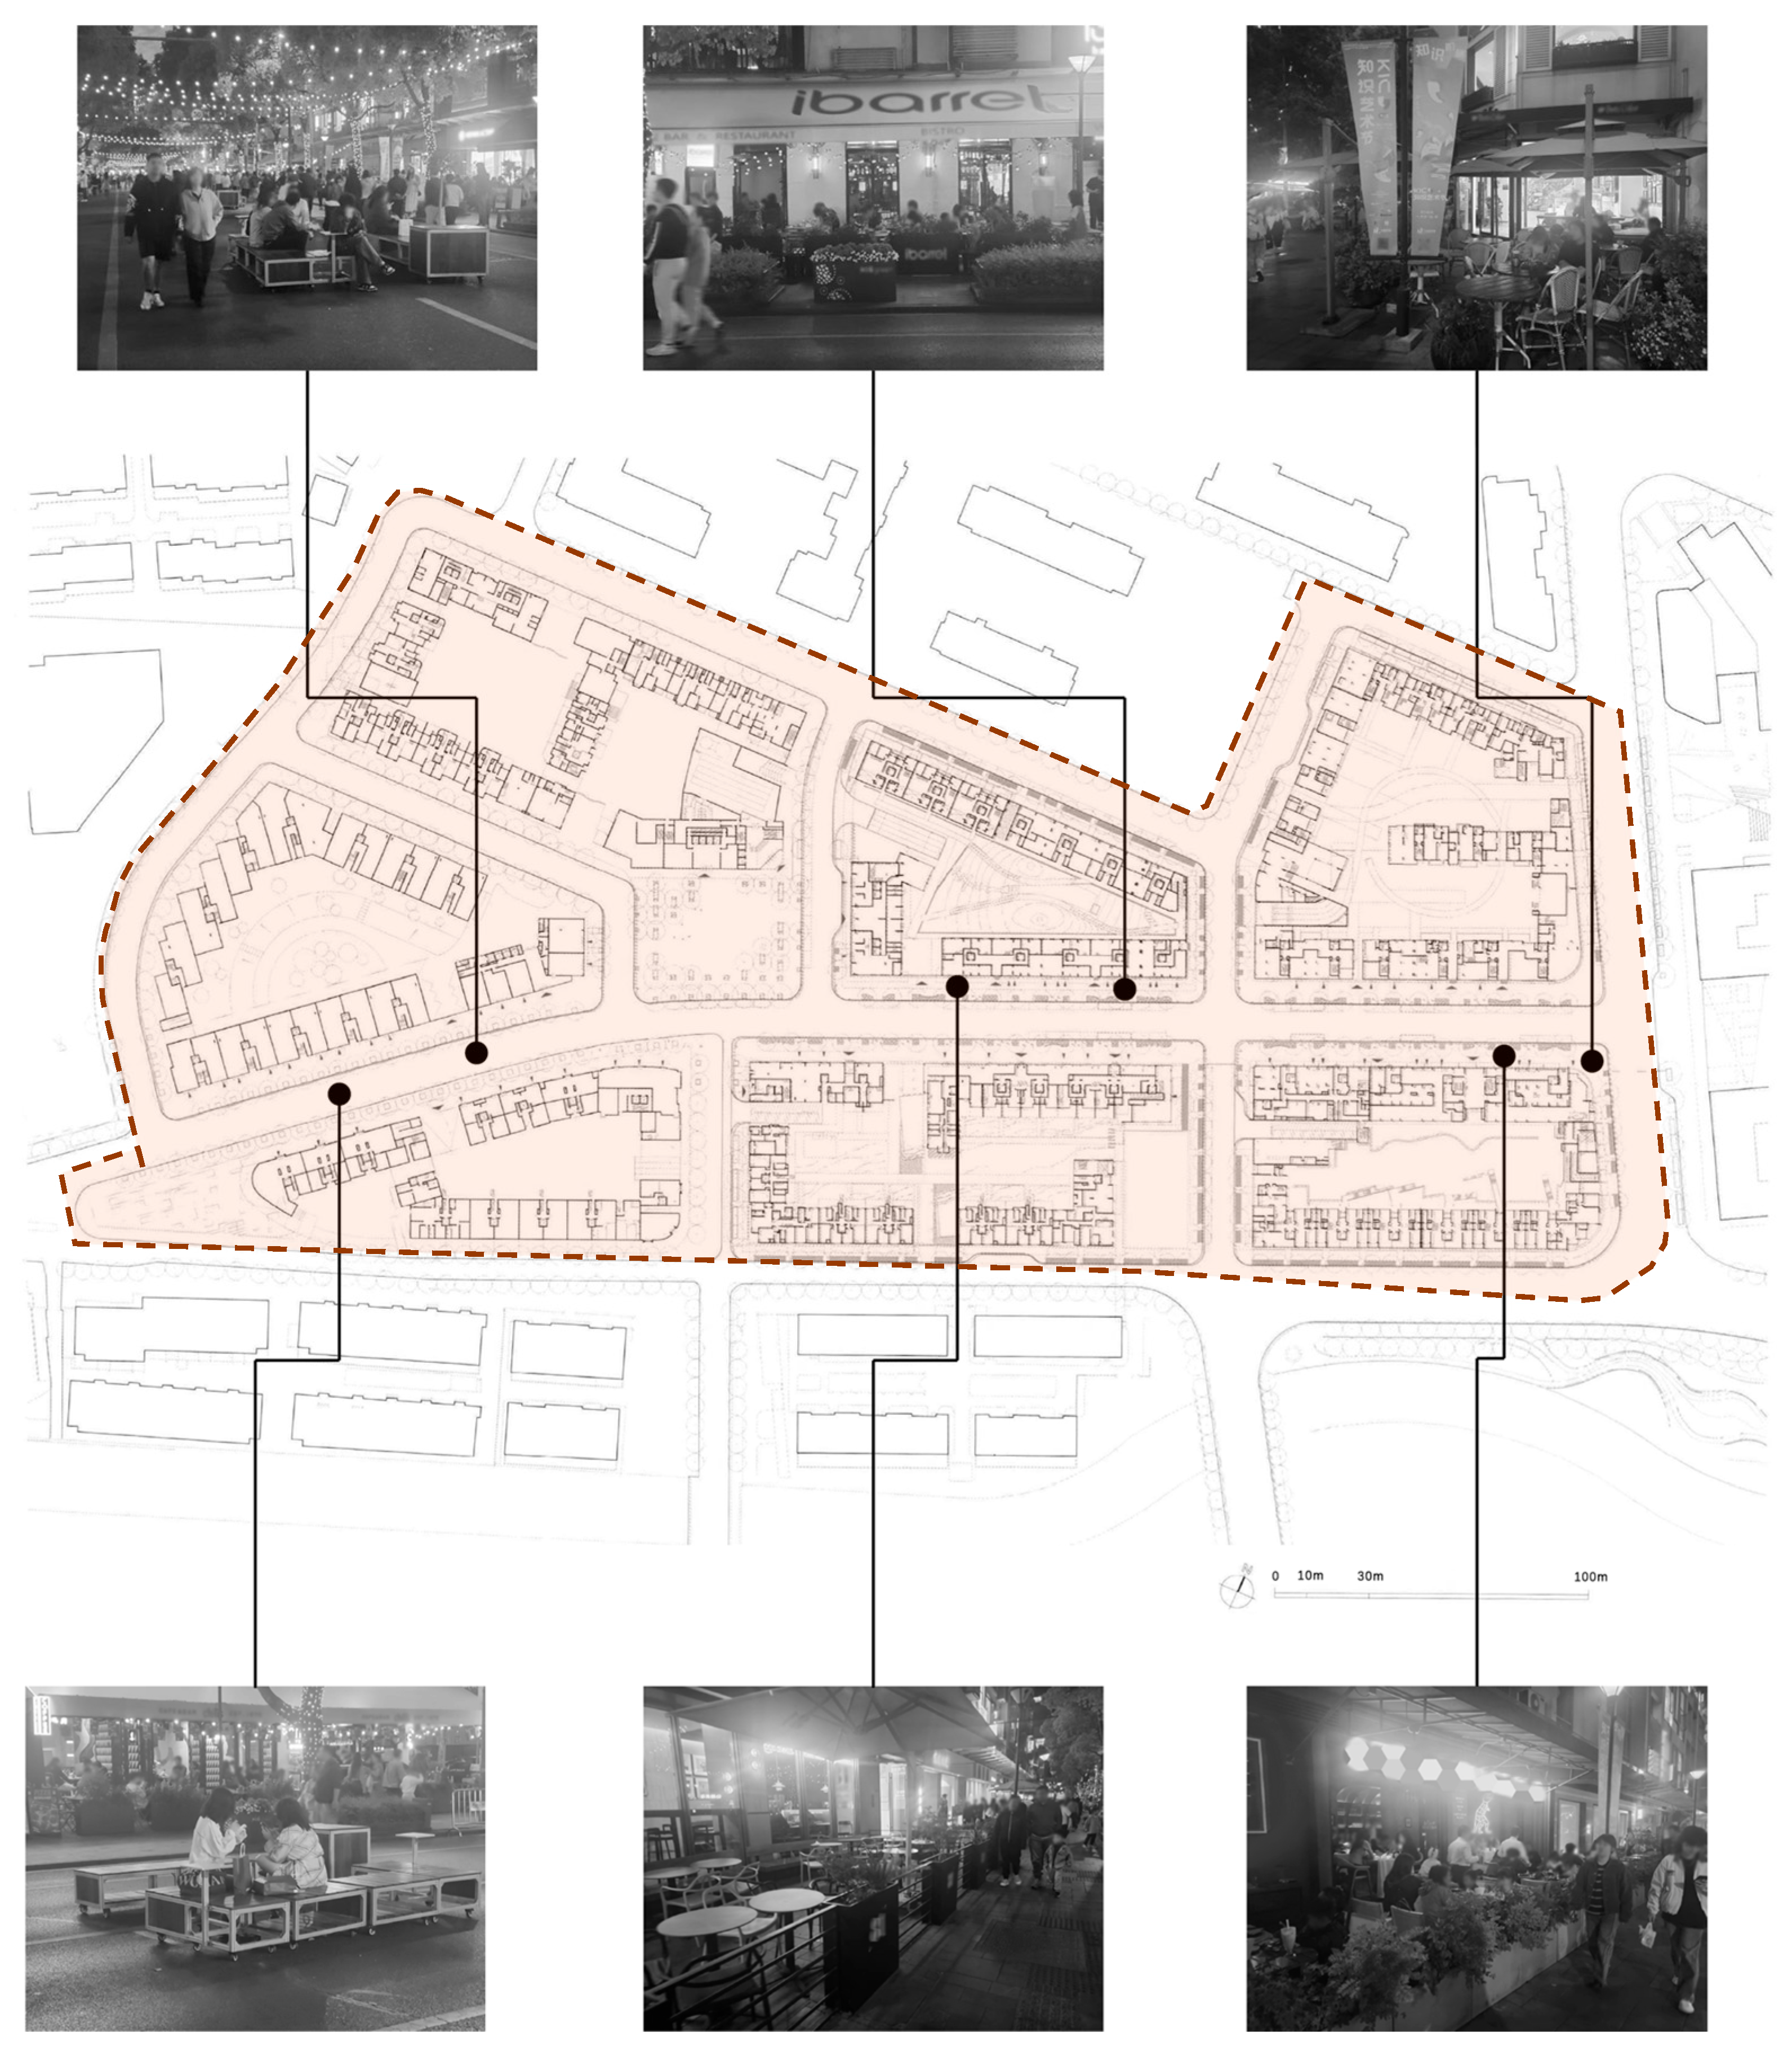
Since the official opening of Shanghai Port in 1843, the city has gradually emerged as the financial hub of China and the broader Far East. Daxue Road—situated in Yangpu District near Fudan University, Tongji University, and other higher education institutions—is a distinctive neighborhood known for its academic ambiance, commercial vibrancy, and strong community identity. In recent years, as shown in Figure 2, it has garnered significant attention due to its innovative alfresco space implementation [11]. Daxue Road was selected as the focal case study for the following primary reasons:
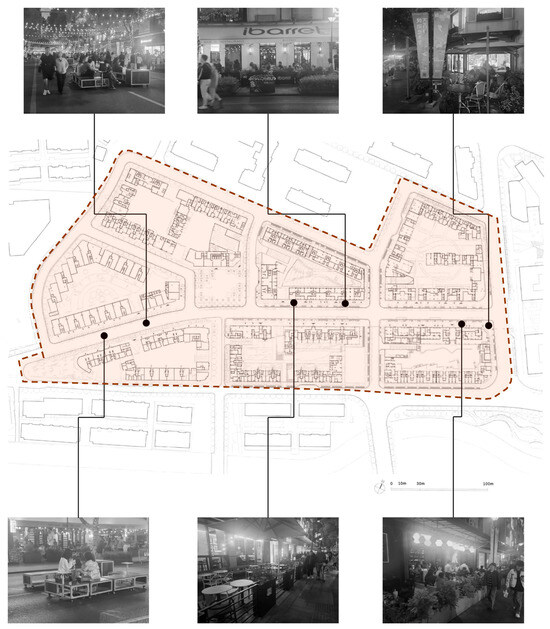
Figure 2.
Shanghai Daxue Road plan and some urban street alfresco spaces.
First, representativeness and demonstrative value: Daxue Road stands as one of the earliest pilot neighborhoods in Shanghai to implement the alfresco space initiative. Its combination of policy experimentation and spatial innovation offers a replicable model for the renewal of other urban neighborhoods. Furthermore, it serves as a nexus that integrates academic resources, youth-driven consumption, and community needs. The operational forms of its outdoor spaces—such as sidewalk cafés and bookstore extensions—exemplify a balanced approach to urban micro-renewal and neighborhood vibrancy.
Second, it possesses distinct social and cultural attributes. Situated amidst several major universities, Daxue Road’s alfresco spaces function not only as sites of commerce but also as vital social commons for students, residents, and creatives. These spaces facilitate a unique form of cultural symbiosis and participatory public life. Its identity as a “knowledge-based neighborhood”—evidenced through recurring bazaars and academic salons—resonates strongly with the flexibility and openness inherent in alfresco spatial configurations.
Third, Daxue Road serves as a policy testing ground. In recent years, Shanghai has actively promoted urban renewal strategies centered on the “nighttime economy” and “walkable streets”. Daxue Road exemplifies the practical implementation of these initiatives, particularly in the regulation of alfresco space operations—such as setting specific hours of activity, delineating spatial boundaries, and standardizing business formats.
Nowadays, alfresco spaces involve many conflicting interests, such as the business needs of commercial tenants and residents’ complaints about noise and street occupation, personalized design and the unity of the urban landscape, etc.; however, alfresco spaces can also bring obvious practical benefits: in high-density cities, alfresco spaces can activate the vitality of the street, make up for the lack of public spaces, and promote interactions between business and the community. In the post-epidemic era, the outfitting economy has become one of the means to boost consumption and enhance urban resilience (e.g., in 2023, Shanghai issued the “Guidelines on Further Regulating the Activities of Setting Up Stalls” [12]), so how to balance the interests of all parties has become an urgent task. Examining the case of Daxue Road in Shanghai can reveal how to achieve “orderly fireworks” through planning and management.
In this study, we not only analyze the planning logic, operation mode, and user behavior of alfresco spaces on Daxue Road but also summarize its successes and potential problems and propose optimization strategies to provide empirical evidence for alfresco space policies in Shanghai and other cities. It will also provide an actionable collaborative framework for city administrators, merchants, and the community to promote “fine-governance” and explore how alfresco spaces can enhance the sense of belonging of the community and balance commercial vitality and quality of life. The case of urban street alfresco spaces on Daxue Road in Shanghai is a product of the triple driving forces of “policy innovation, commercial demand, and community culture”, and the study of this case not only can refine the localization experience but also has a revelation value on how to create “humanized streets” in global cities.
2. Materials and Methods
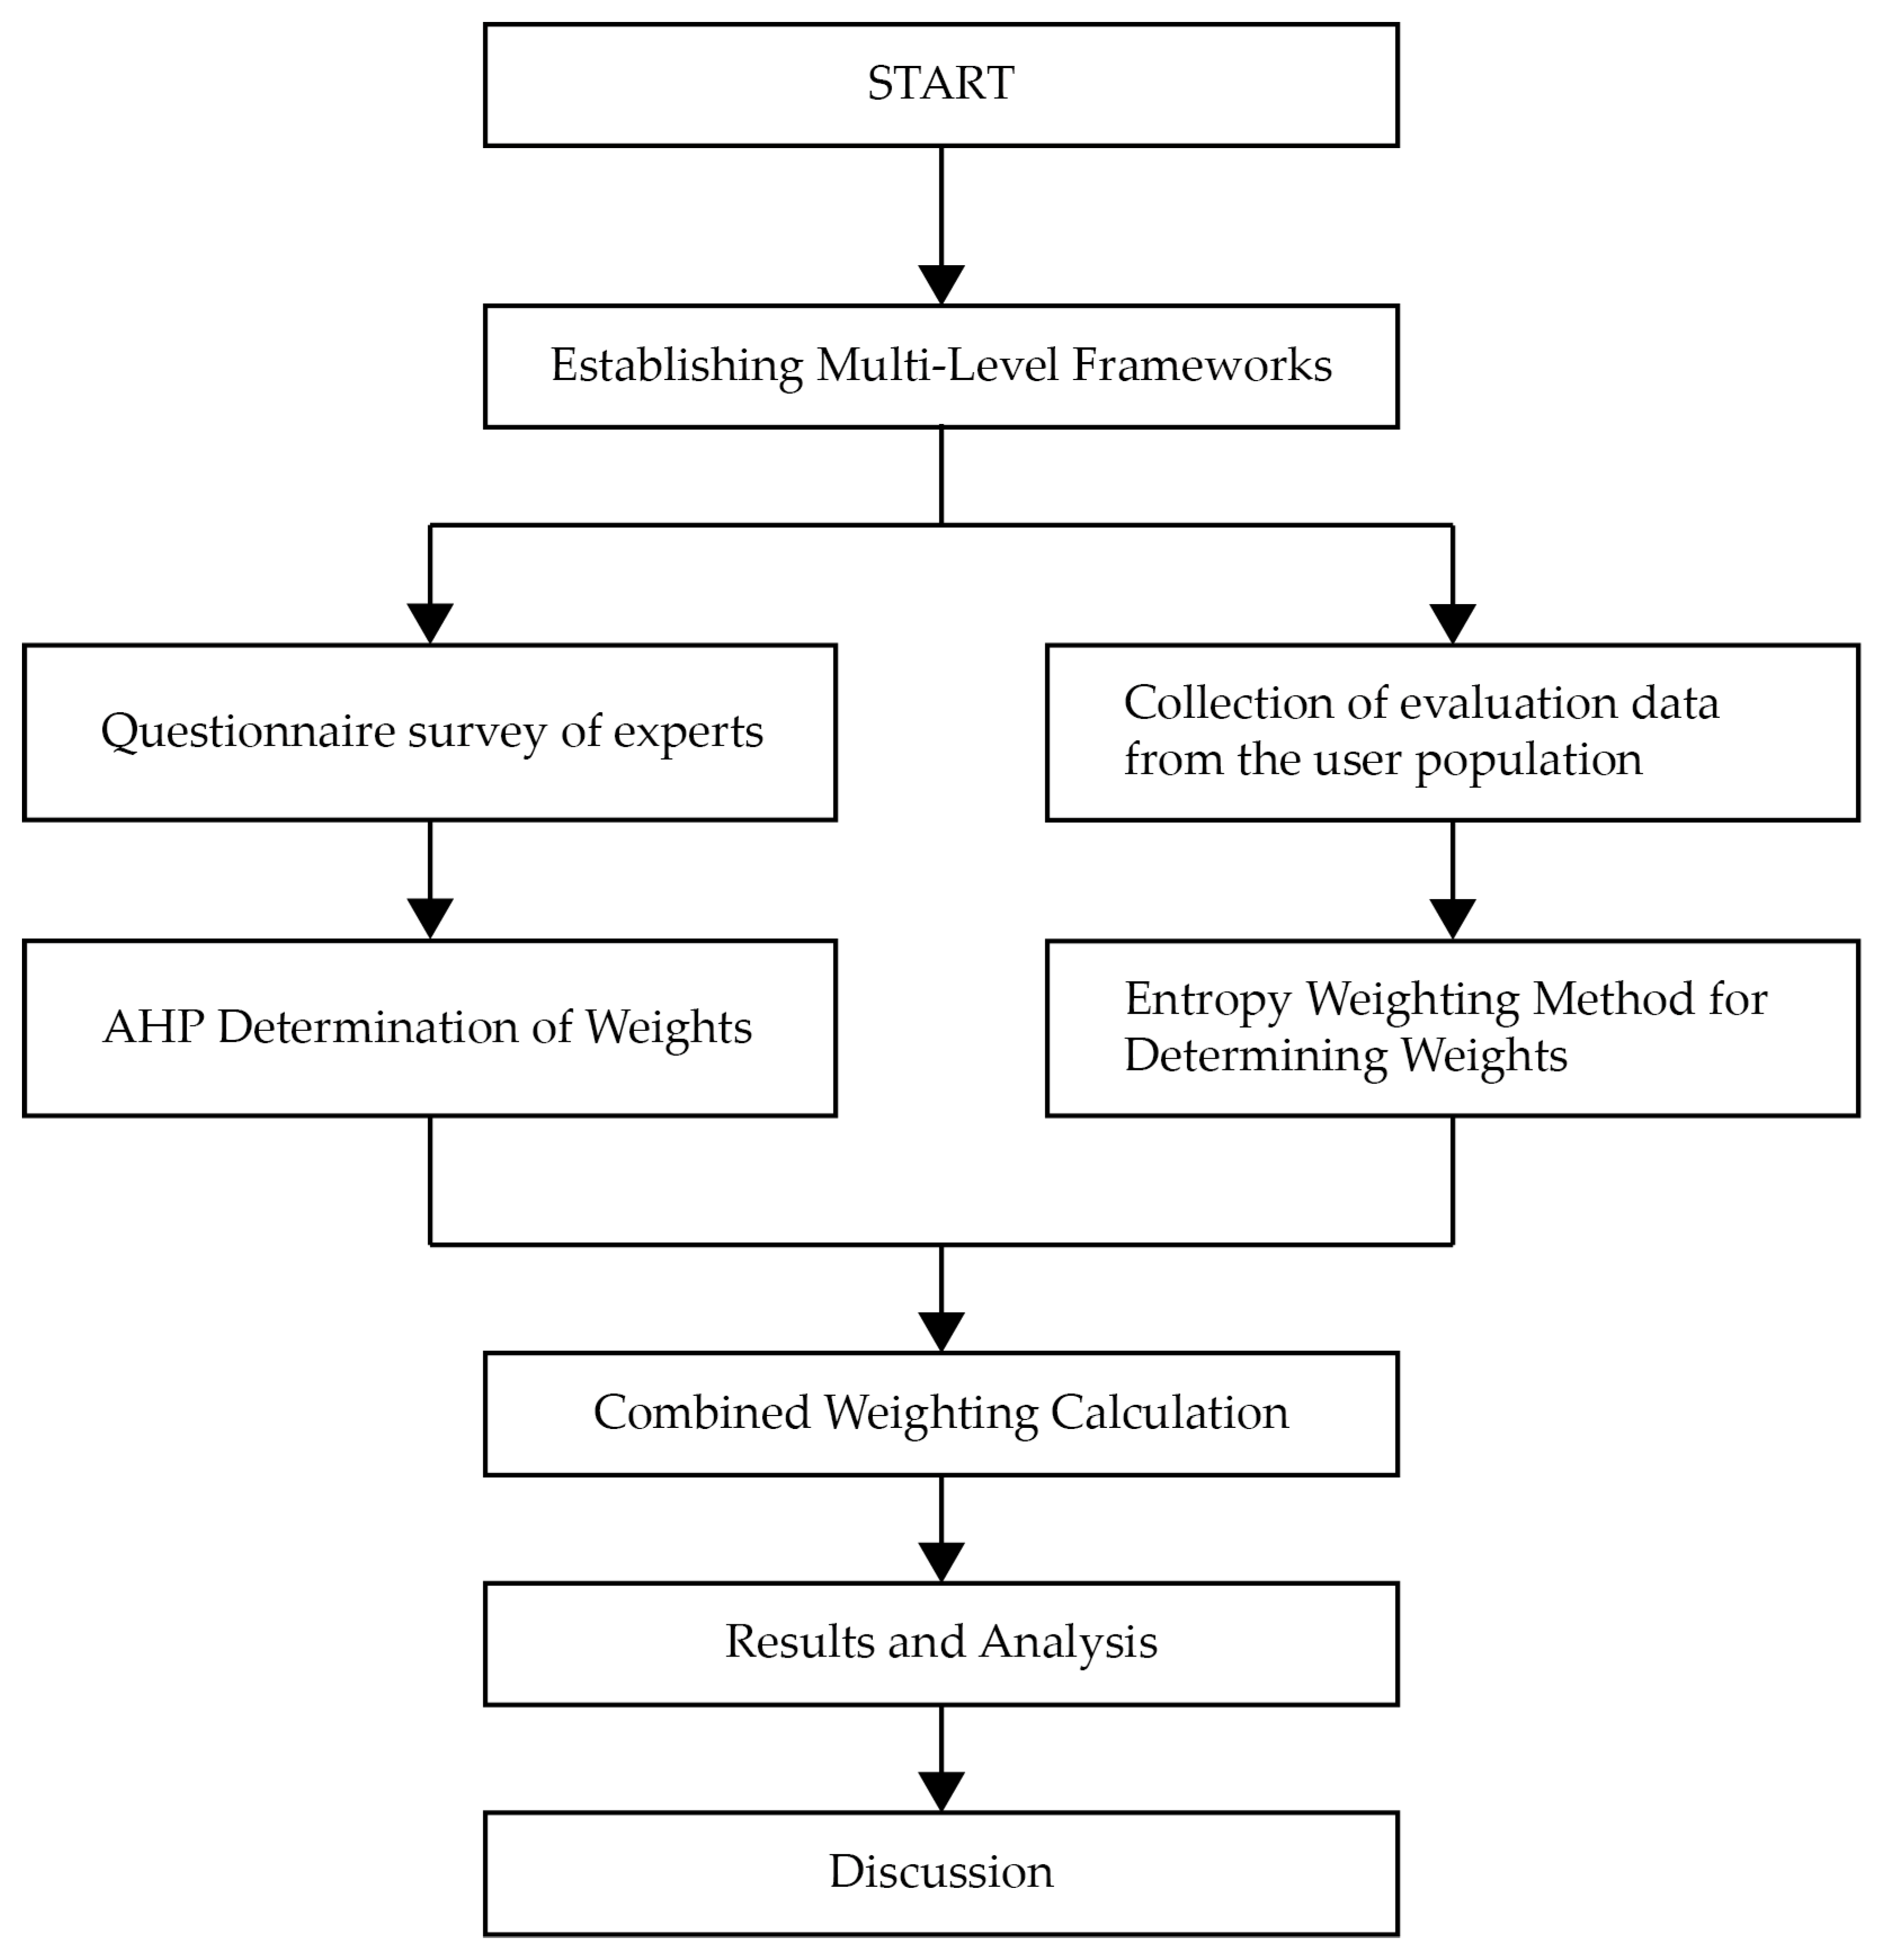
This research firstly selects the evaluation indexes of alfresco spaces; then, designs a questionnaire; calculates the weights of the indexes through AHP and the entropy value method; makes a comprehensive weighting calculation to obtain the evaluation system of alfresco spaces; and finally, comes up with a rationalized design guideline. The specific research route is shown in Figure 3.
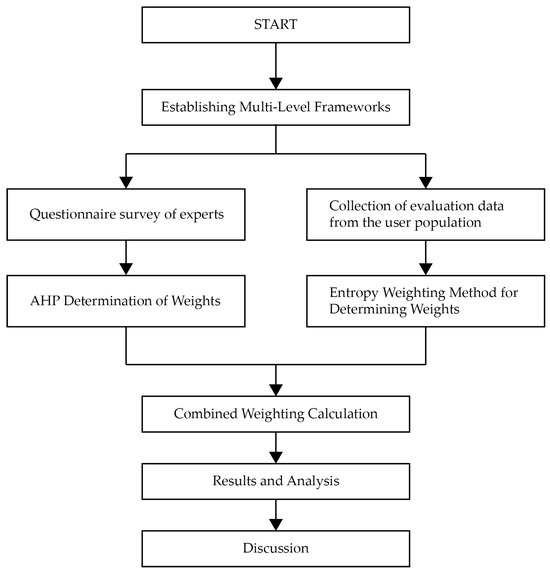
Figure 3.
Research route.
2.1. Construction of Alfresco Space Evaluation System and Selection of Factors
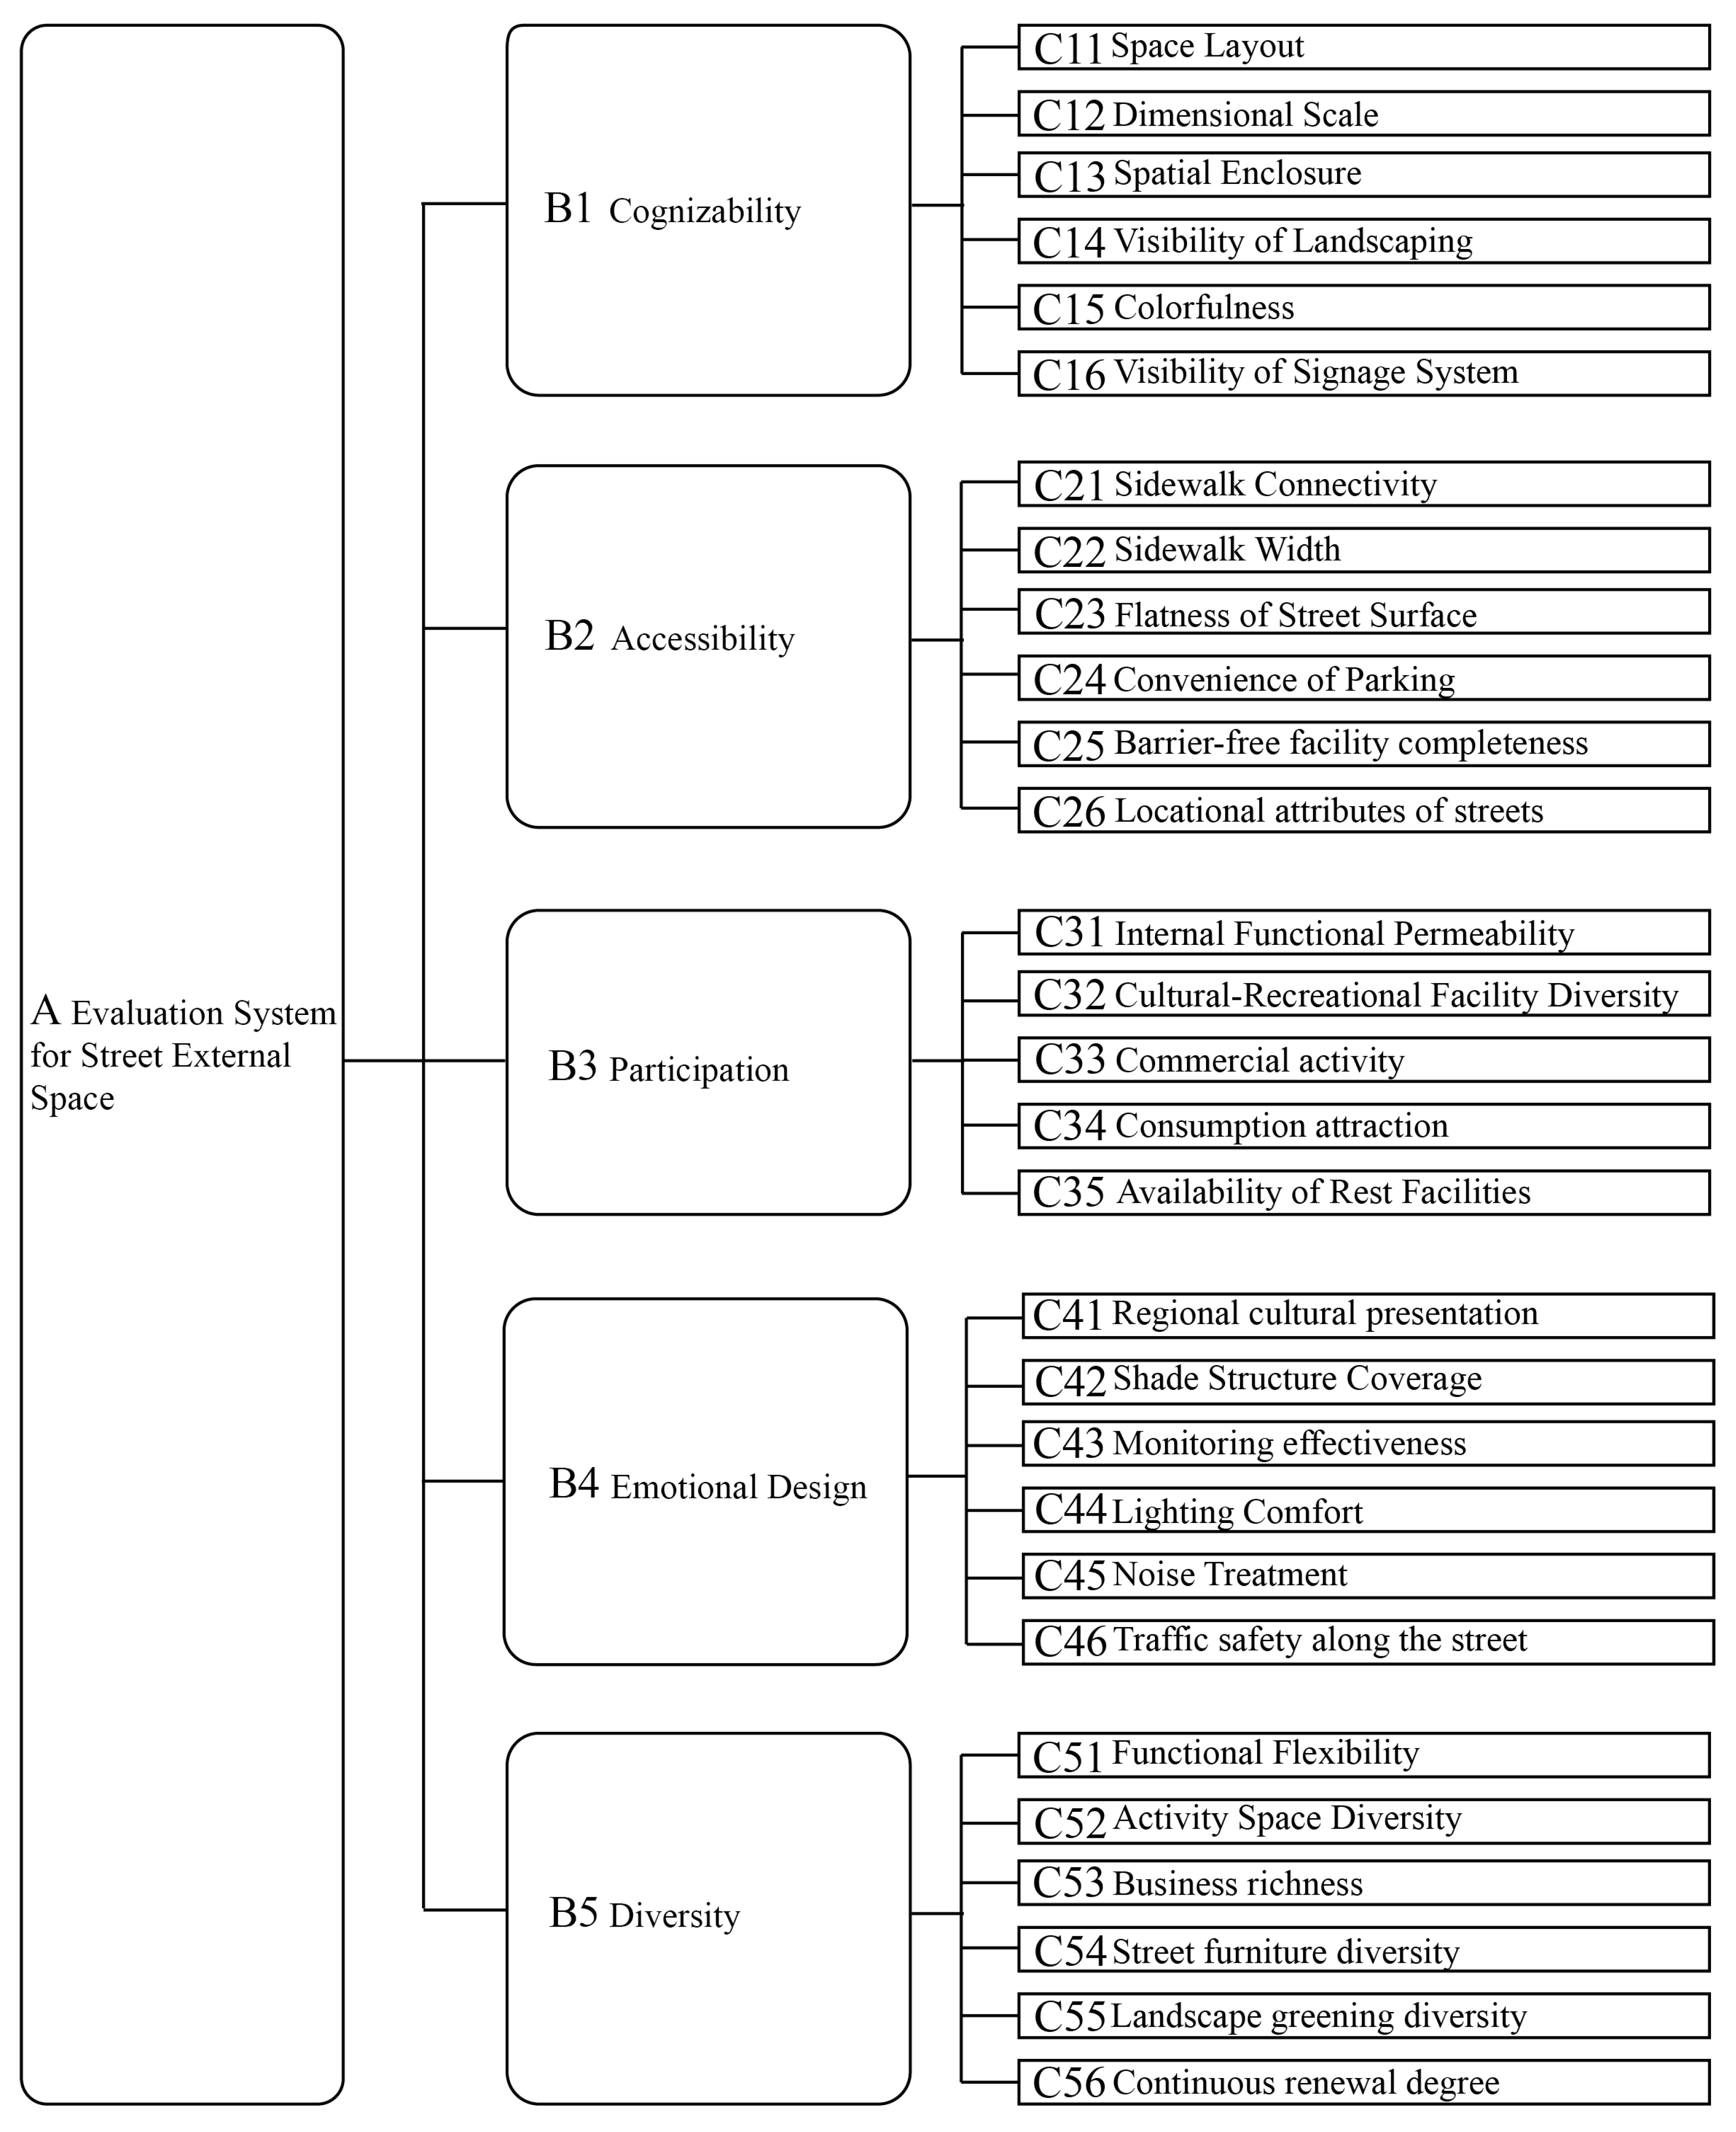
First of all, a comprehensive evaluation system for urban street alfresco spaces is constructed. The reasonableness and scientificity of the index system largely depend on the selection of evaluation indexes, so the selection of indexes should be based on the authoritative documents, research results, and mature research theories in related research fields and combined with the characteristics of the research object in a comprehensive manner, while following the principles of scientific objectivity, systematicity, and feasibility of the evaluation. Taking the two dimensions of spatial justice [13] and the public nature of urban street alfresco spaces as the basis of indicator screening, we extracted the common influencing factors in urban street alfresco spaces by organizing the domestic and international street design guidelines, and then prior to the large-scale distribution, a pilot test was conducted with 20 participants (including local residents and graduate students in urban planning) to examine the clarity, relevance, and internal consistency of the questionnaire items. Feedback from the pilot phase was used to revise ambiguous terms and optimize the logical structure of the indicator descriptions. Finally, the factors affecting urban street alfresco spaces are discussed in five dimensions, namely, Alfresco Space Cognizability, Alfresco Space Accessibility, Alfresco Space Participation, Alfresco Space Emotional Design, and Alfresco Space Diversity Design.
2.1.1. Evaluation Factors of Alfresco Space Cognizability
The recognizability of an urban street alfresco space should be viewed from two aspects: on the one hand, whether it is possible to intuitively judge whether there is a public space from the appearance, with the balance between sufficient openness and the appropriate sense of enclosure being one of the ways that the space attracts people’s activities and effective use; on the other hand, the sizable dimensional scale of an alfresco space in terms of its use, which is a concept that corresponds to the human body’s scale [14]. The perceivable scale of a public space allows for the easy formation of interactions between people and spaces, which makes the public space the closest place of interaction that attracts citizens with different interests and willingness to stay there for a long time [15]. Therefore, this study will analyze the effects of Alfresco Space Layout, Dimensional Scale of Landscaping, Spatial Enclosure, and Colorfulness and Visibility of Signage Systems on the people who use them.
2.1.2. Evaluation Factors of Alfresco Space Accessibility
In the design of alfresco spaces, there is a contradiction between the public space where it is located and the sidewalk; therefore, we need to address how to balance this contradiction and to determine the most effective measures needed to build a safe and complete walking network, create a vibrant and comfortable walking environment, balance the relationship between walking and other means of transportation, and address the function of the walking–connecting space to create continuity and experiential realization [14]. This study will analyze the influence of factors such as Pedestrian Sidewalk Connectivity, Pedestrian Sidewalk Width [16], Flatness of the Street Surface, Convenience of Parking, Barrier-Free Facility Completeness, and Locational Attributes of Streets where Alfresco Spaces are Located [17] on the people who use it.
2.1.3. Evaluation Factors of Participation in Alfresco Space
Participation in alfresco spaces is divided into active participation and passive participation [18]. Active participation refers to the active participation of the user group in the activities of the place, such as Cultural–Recreational Facility Diversity [19], Internal Functional Permeability, and Consumption Attraction. Passive participation refers to the demand for contact with the place but not the need to actively participate in the activities, which mainly includes the appreciation of the scenery and the observation of other users in order to obtain the feeling of participation in public life. The influencing factors are Commercial Activity and Availability of Rest Facilities.
2.1.4. Evaluation Factors for Emotional Design of Alfresco Space
As a part of urban public spaces, alfresco spaces should have more inclusiveness, and its emotionality should be able to satisfy the basic physiological, safety, and social needs of the users [20]. In addition, alfresco spaces also carry the mission to continue the local spiritual and cultural lineages, and the emotions and common memories give the space its vitality and cohesion. Therefore, in this study, factors such as the Degree of Regional Culture Display, Shade Structure Coverage, Monitoring Effectiveness, Lighting Comfort, Noise Handling, and Traffic Safety Along the Street will be discussed as evaluation points of whether the Emotional Design can be satisfied.
2.1.5. Evaluation Factors for Diversity Design of Alfresco Space
With the development of time, people’s demand for alfresco spaces is no longer limited to traditional business activities such as catering and sales; rather, whether these needs can be actively satisfied in the face of more and more demands is also an important factor in evaluating the merits of public space design, so this study will discuss the Functional Flexibility, Activity Space Diversity, Business Richness [21], Street Furniture Diversity, Landscape Greening Diversity, Sustainable Design, Diversity [22], and Continuous Renewal Degree [14] of urban street alfresco spaces.
Based on the influencing factors screened under the five dimensions, a multi-level framework for the evaluation system of an urban street alfresco space is established, as shown in Figure 4.
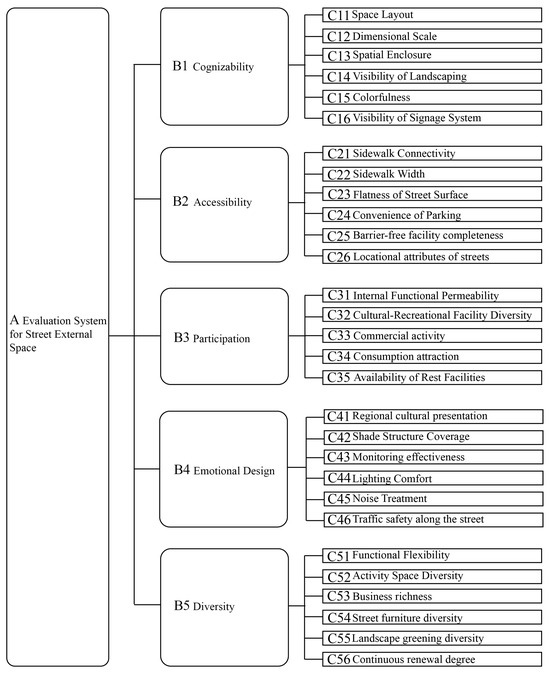
Figure 4.
Establishing multi-level frameworks.
2.2. Questionnaire Design
The initial pool of 42 indicators was developed through a review of national and international urban street design guidelines and the academic literature. These were then evaluated using three criteria: (1) frequency of appearance in authoritative planning documents, (2) relevance to alfresco spaces based on observational interviews along Daxue Road, and (3) feasibility of user perception measurement. Based on these criteria and iterative feedback from two rounds of expert consultation, the final 29 indicators were selected for inclusion in the evaluation system, as shown in Table 1. The data were obtained by means of a questionnaire, and all respondents were required to be residents of Daxue Road in Shanghai, or tourists who had visited the area. A scale was formed for the evaluation indicators and nine levels were set to indicate the importance of the degree of impact. The questionnaires were distributed by professionally trained members at locations including, but not limited to, intersections of Daxue Road and nearby universities in Shanghai.

Table 1.
Description of the indicator conversion questionnaire.
3. Methodology
To ensure the comprehensiveness, methodological rigor, and representativeness of the evaluation data, this study invited 15 experts from relevant fields—including architecture, urban design, and land-use planning—and collected 138 valid questionnaires from users familiar with the alfresco space on Daxue Road. For constructing the AHP judgment matrices, only expert responses were utilized, as AHP relies on consistent pairwise comparisons grounded in professional expertise. Each expert completed a full set of pairwise comparisons spanning 5 dimensions and 29 indicators. In contrast, entropy weights were derived from the responses of 138 general users, each of whom rated the importance of all 29 indicators using a 9-point Likert scale. Consequently, each indicator in the entropy matrix incorporated 138 individual data points, ensuring the statistical reliability and robustness of the derived objective weights. The questionnaire data have been deposited on Zenodo and are accessible via DOI: [https://doi.org/10.5281/zenodo.15819422] (accessed on 6 July 2025) [23]. The integration of expert and user perspectives enabled a balanced representation of structural reasoning and empirical perception within the evaluation system.
3.1. Reliability and Validity Analysis
In the Daxue Road project, feedback on 29 evaluation indicators was obtained through questionnaires and expert interviews. To assess the internal reliability of the questionnaire, Cronbach’s alpha coefficient was computed. This statistical method is widely applied to evaluate the internal consistency of survey items. A higher α value reflects stronger coherence among the items, indicating greater reliability. The reliability coefficient was calculated according to Equation (1):
- N: number of items;
- : average inter-item covariance;
- : average variance of individual items.
As shown in Table 2, in this case, α = 0.933, indicating excellent internal consistency for the questionnaire as a whole.

Table 2.
Cronbach reliability analysis.
An exploratory factor analysis (EFA) was conducted to uncover the latent structure underlying the 29 evaluation indicators. Principal component analysis (PCA) was used for factor extraction, followed by Varimax orthogonal rotation to enhance interpretability. Factors were retained based on the Kaiser criterion (eigenvalues > 1), and a scree plot was examined to confirm the number of components. Six factors were ultimately extracted, accounting for 61.86% of the total variance. Only loadings with absolute values greater than 0.40 were considered meaningful for interpretation.
To ensure the suitability of the data for factor analysis, the Kaiser–Meyer–Olkin (KMO) measure and Bartlett’s test of sphericity were applied. As shown in the Table 3, the KMO value was 0.895, which exceeds the commonly accepted threshold of 0.80. This indicates a high level of sampling adequacy and supports the appropriateness of proceeding with factor extraction.

Table 3.
KMO and Bartlett tests.
3.2. Weight Calculation of AHP–Entropy Method
The way to determine the weights of evaluation factors can be divided into two categories: subjective and objective. The subjective assignment method relies on the experience of experts and assigns weights based on expert judgment through hierarchical analysis and expert surveys; the objective assignment method is based on the statistical characteristics of the data itself, such as entropy weighting, principal component analysis, and other methods of calculating the weights. The advantage of the subjective method is that it can reflect the experience judgment of experts, but the results are easily affected by personal preferences; although the objective method can avoid human interference and rely on mathematical calculations, it may deviate from the actual demand and cannot accurately express the tendency of decision makers.
Analytic Hierarchy Process was proposed by Thomas L. Saty, an American operations researcher, in the 1970s, aiming at solving complex decision-making problems [24]. The analysis of decision-making problems usually adopts the recursive hierarchy model, which is decomposed into three levels: the objective level, the criterion level, and the solution level. Firstly, the 1-9 scale method is used to compare the indicators at the same level two by two to determine their relative importance; then, the weights of each indicator are calculated by the eigenvector method or the geometric mean method. After the weights are calculated, the consistency ratio (CR) is calculated to test the reasonableness of the judgment matrix—if CR < 0.1, the matrix is considered to pass the consistency test, otherwise the judgment matrix needs to be adjusted. Finally, the comprehensive score of the program is calculated by combining the weights of each layer, so as to make the optimal decision. By constructing a hierarchical model, the qualitative problem is quantified, which helps decision-makers conduct systematic analysis under multi-criteria conditions. However, the method has certain defects, mainly reflected in its reliance on expert experience, and the construction of the judgment matrix is easily influenced by subjective preferences, which may lead to biased results.
The theoretical basis of the entropy method can be traced back to the concept of entropy in information theory, which was first proposed by Shannon in 1948 to quantify the uncertainty of information and then introduced into the field of multi-criteria decision analysis (MCDA) in the 1970s, which gradually developed into the entropy method. The core principle of this method is to measure the degree of data dispersion by calculating the entropy value of each indicator, thus realizing the objective assignment of the indicators [25], which effectively avoids the subjective bias that may exist in the traditional assignment method. However, it should be pointed out that, when the indicators have different importance, this kind of assignment method, which completely relies on the objectivity of the data, may lead to deviation of the evaluation results from the actual needs.
The AHP–entropy method combines the hierarchical analysis and entropy method for dealing with complex decision-making problems. It aims to use the subjective judgment of AHP and the objective data of the entropy value method to improve the science and accuracy of decision-making. AHP decomposes the problem into multiple levels and factors by constructing a hierarchical structure and determines the weights by comparing the factors two by two using expert judgment. The entropy method calculates weights based on the variability of the data. The combination of the two is suitable for multi-objective and multi-criteria decision-making scenarios, and the method improves the reliability of decision-making.
3.2.1. AHP Determination of Weights
The hierarchical analysis method (AHP) is used to determine the weights of each grading index in the evaluation system. The factors at the guideline and indicator levels are compared two by two using the 1 to 9 scale of proportions, i.e., the constituent elements at each level are quantitatively compared, evaluated, and scored based on the priority scale. The judgment matrix is established after collecting and organizing the feedback from a number of experts from architecture, urban and rural planning, and other professions. The values and meanings of the priority scales of the pairwise comparison judgment matrix are shown in Table 4.

Table 4.
AHP matrix rating scale.
- Construct a judgment matrix. The judgment matrix represents a two-by-two comparison of all evaluation factors under the same level. This paper uses the nine-scale method to construct the judgment matrix. The judgment matrix A is constructed using Equation (2) as shown below.
Subsequently, Formula (3) is applied to calculate the feature vector M (i), and Formula (4) is used to normalize the vector in order to calculate the weight of each evaluation factor.
- 2.
- Consistency Check: a consistency check is required to ensure that the evaluators do not contradict themselves in evaluating the AHP matrix, the steps are as follows:
Calculate the maximum eigenvalue of the matrix λmax by using Equation (5)
Then, calculate the consistency index (CI) using Equation (6)
Select the corresponding random index (RI) from Table 5.

Table 5.
RI values of matrix order 1–10.
Use Formula (7) to calculate the consistency ratio (CR).
If CR < 0.10, then the judgment matrix passes the consistency test; otherwise, the matrix needs to be readjusted. The data are brought into the formula to calculate the C11–C56 weight values (Table 6, Table 7, Table 8, Table 9 and Table 10).

Table 6.
Judgment matrix and weights of influencing factors in Alfresco Space Cognizability.

Table 7.
Judgment matrix and weights of influencing factors in Alfresco Space Accessibility.

Table 8.
Judgment matrix and weights of the influencing factors in Alfresco Space Participation.

Table 9.
Judgment matrix and weights of the influencing factors in the Emotional Design of Alfresco Spaces.

Table 10.
Judgment matrix and weights of influencing factors in the Diversity Design of Alfresco Spaces.
3.2.2. Entropy Weighting Method for Determining Weights
Using the entropy weighting method to determine objective weights, weights were calculated for the indicator descriptions in Table 1, the specific weights were calculated for the indicator descriptions in Table 1, and the specific calculation process for the entropy weighting method is as follows.
- 3.
- Create a judgment matrix for n samples and m evaluation factors.
Normalize the judgment matrix to obtain the normalized judgment matrix , as shown in Formula (8).
- 4.
- Calculate the entropy and entropy weight of the j-th indicator, as shown in Formula (9)–(11).
Here, Hj is the entropy of the indicator; fij is the element of the i-th row and j-th column of the matrix; and wi is the entropy weight of the indicator.
3.2.3. Combined Weighting Calculation
The AHP and entropy methods are used to calculate the weights: one for the subjective assignment and one for the objective assignment. The two methods are combined to calculate the final weights, as shown in Equation (12).
4. Results and Analysis
4.1. Results of AHP Matrix Weight Calculation
The pairwise comparison matrices obtained from 15 expert respondents were used to construct the AHP data matrix in accordance with Equation (2). To ensure internal consistency of judgments, consistency checks were conducted using Equations (5)–(7). Upon confirmation that all consistency ratios met the required threshold (CR < 0.10), the data were aggregated into a unified matrix. The final weights of each influencing factor were then computed using Equations (3) and (4).
4.1.1. Judgment Matrix and Weights of Influencing Factors in Alfresco Space Cognizability
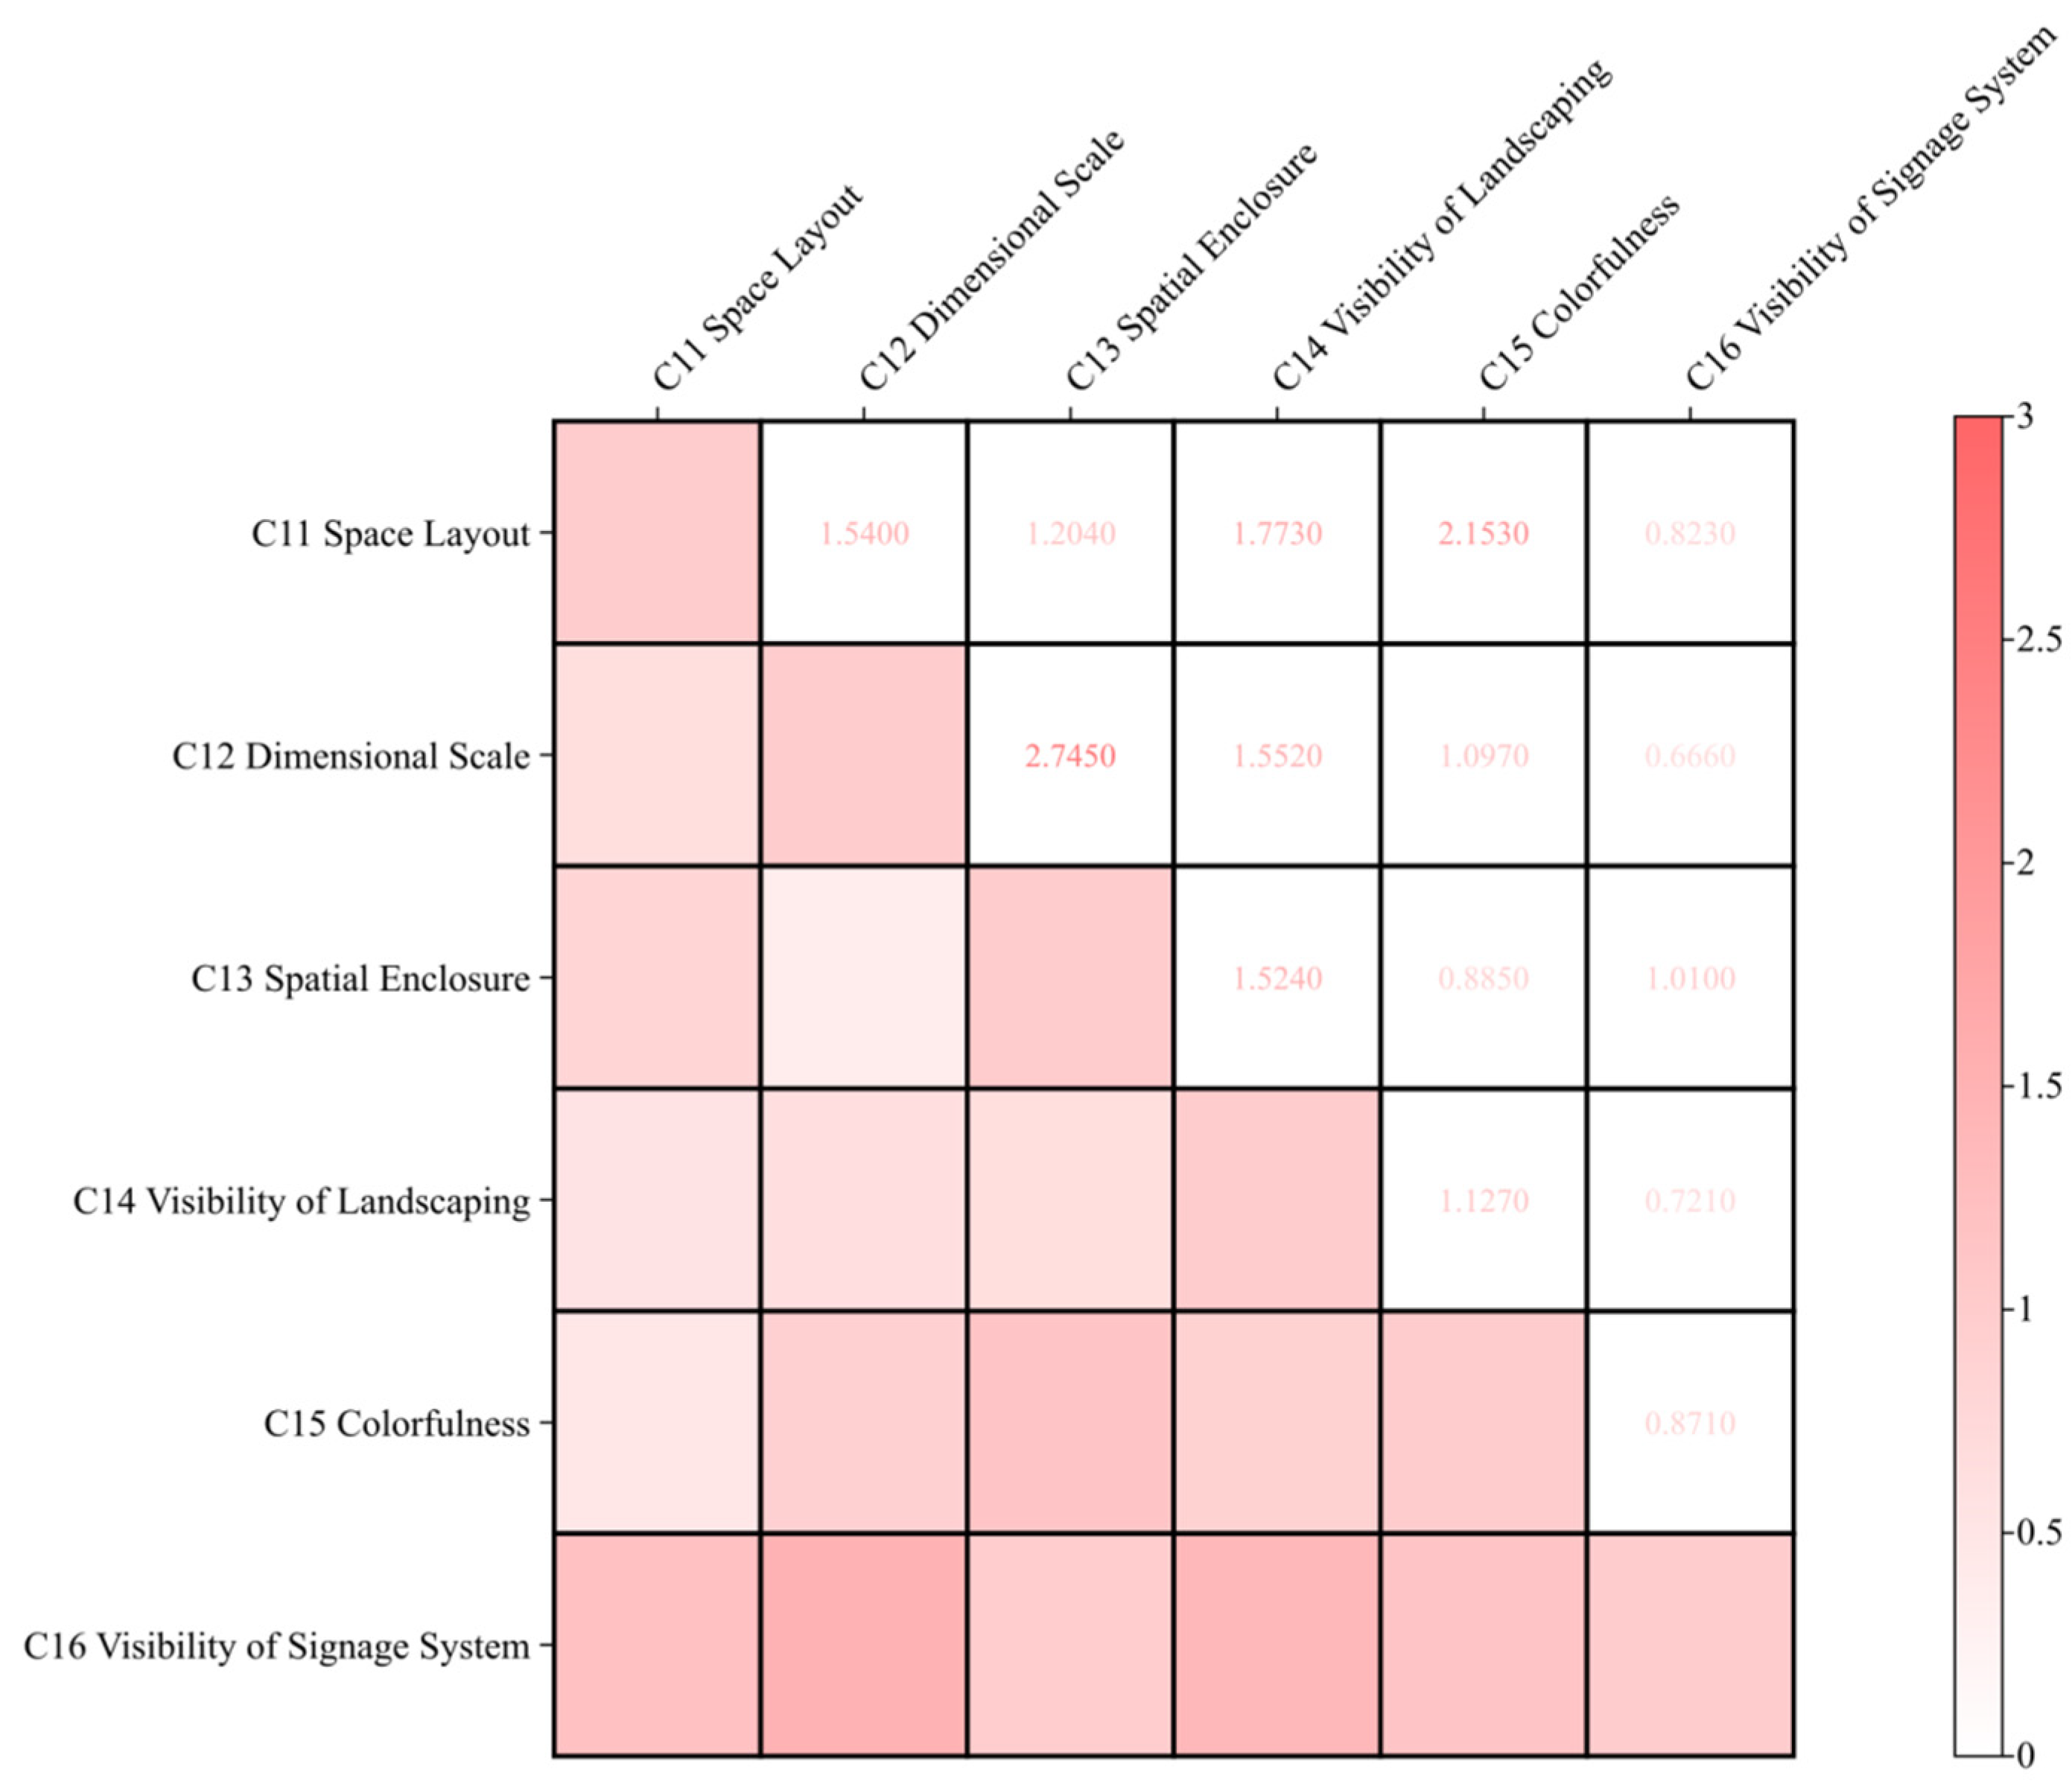
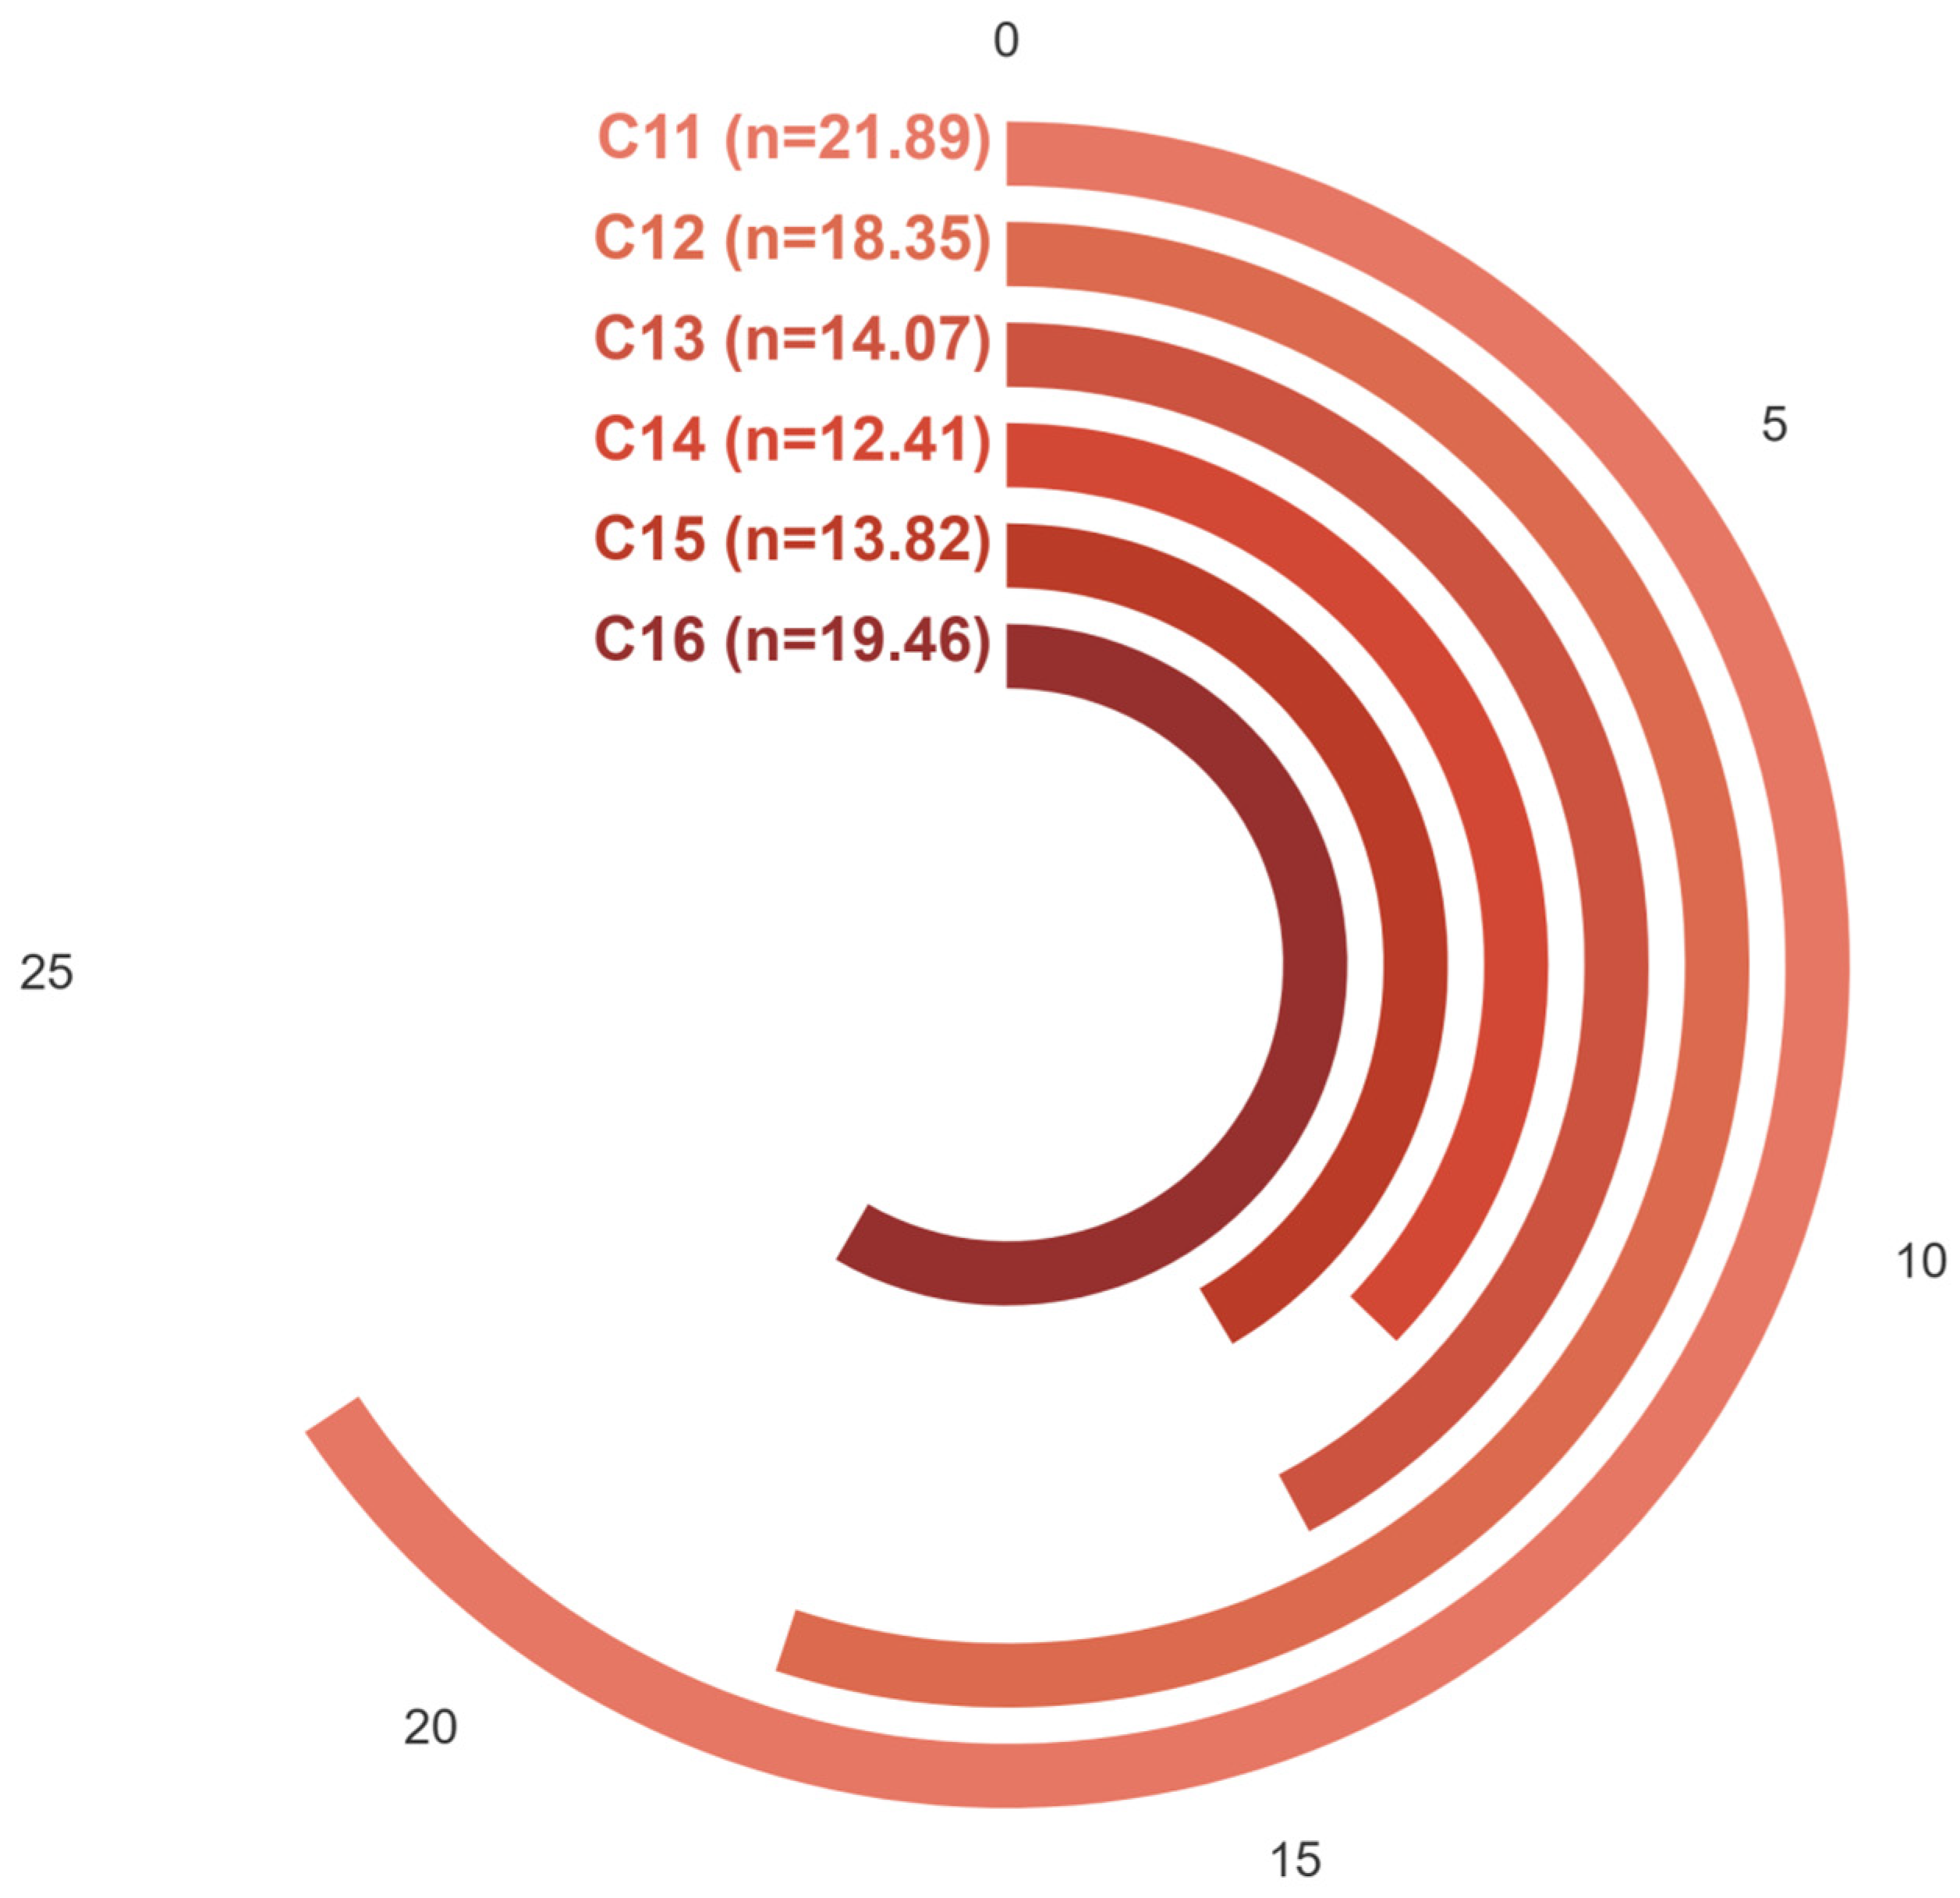
As shown in Figure 5 and Figure 6, in the Cognizability group (B1), Space Layout (21.89%) and Visibility of the Signage Systems (19.46%) emerged as the most critical indicators, highlighting the importance of visual clarity and spatial organization in facilitating users’ recognition of alfresco spaces. This suggests a shift in user priorities from enclosed physical forms to accessible visual cues. In contrast, indicators such as Spatial Enclosure (14.07%) and Landscaping Visibility (12.41%) received lower weights, indicating that users place greater emphasis on identification and wayfinding rather than aesthetic enclosure.
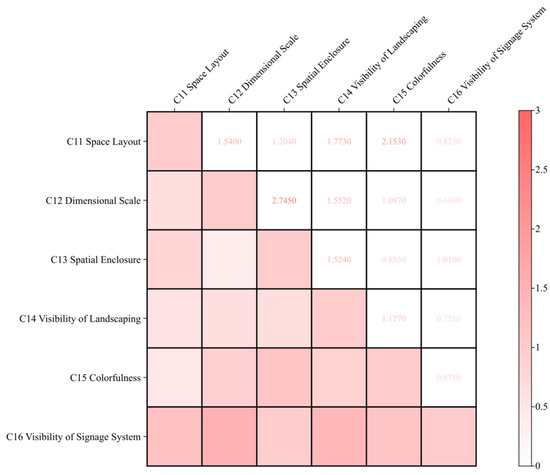
Figure 5.
Visualization of the evaluation matrix for Group B1.
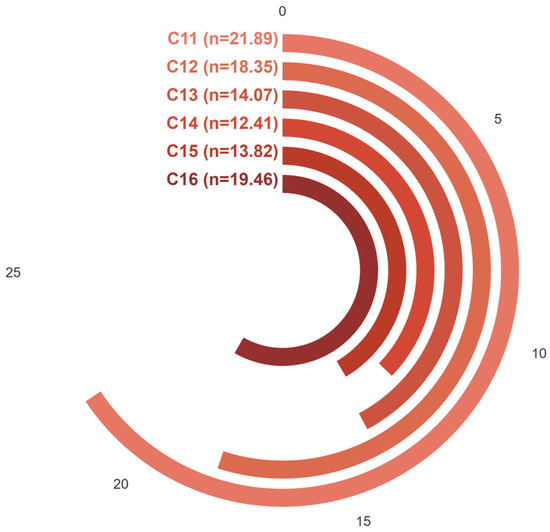
Figure 6.
Visualization of AHP-derived weights for Group B1.
4.1.2. Judgment Matrix and Weights of Influencing Factors in Alfresco Space Accessibility
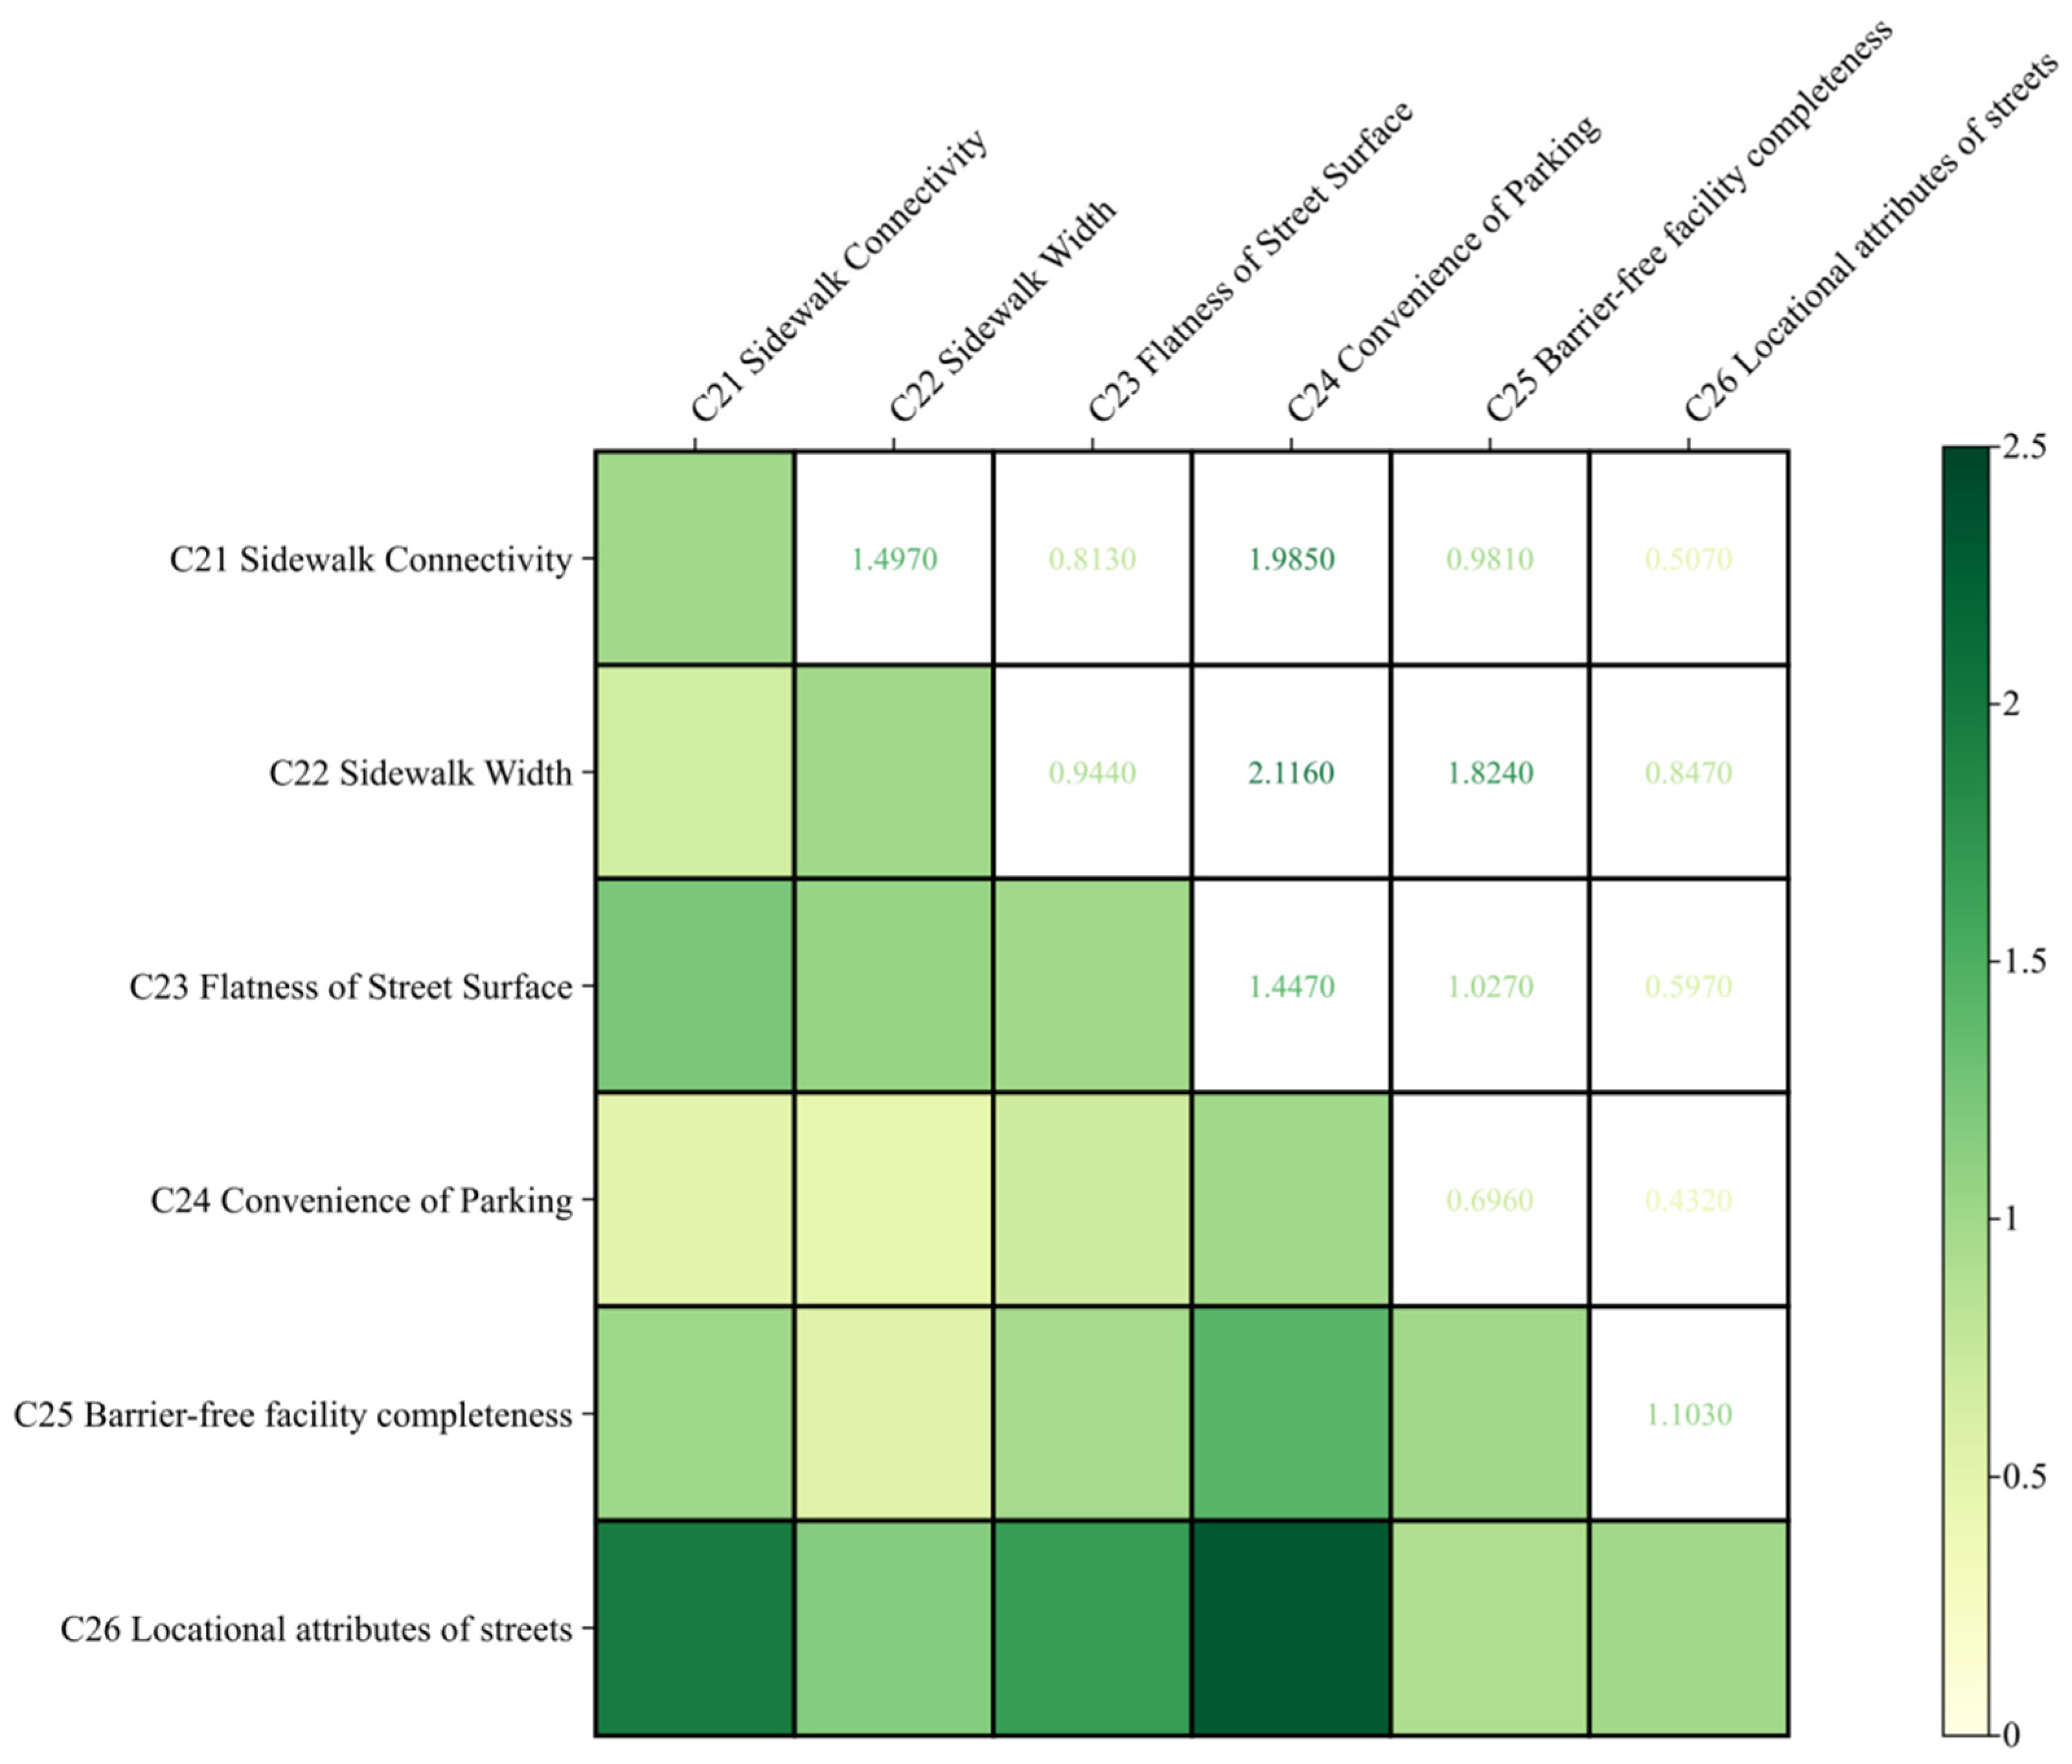
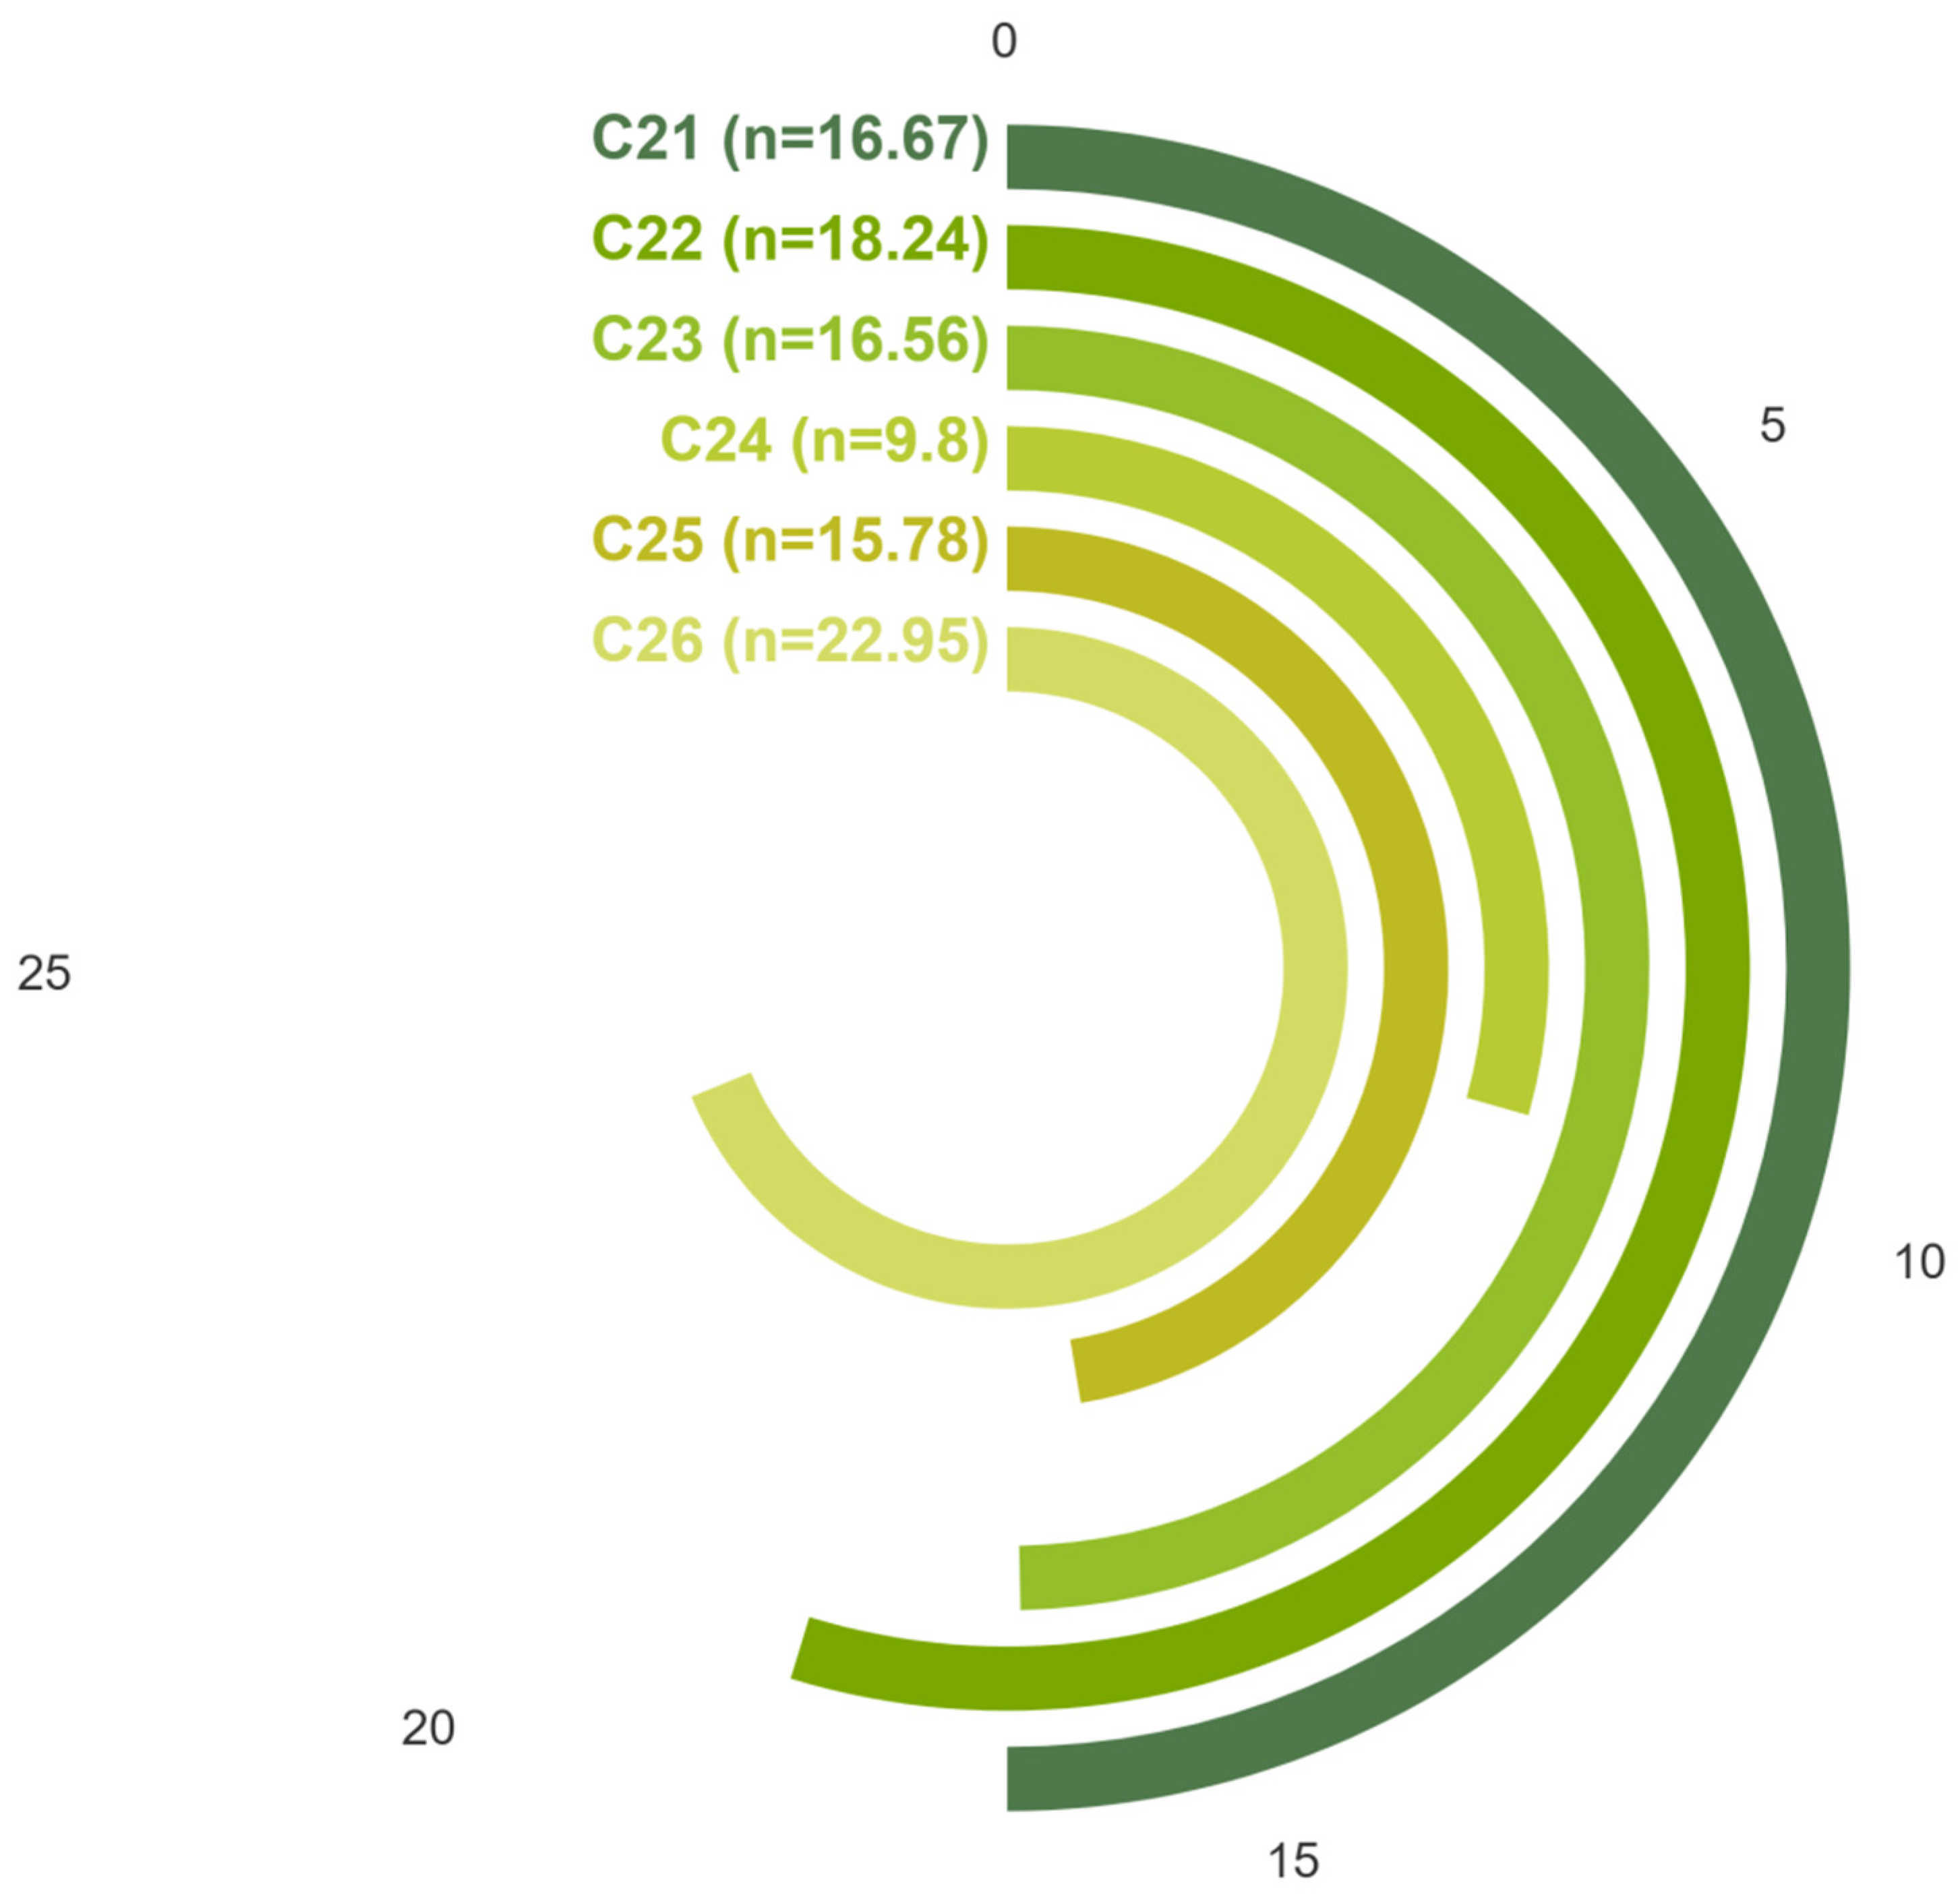
As shown in Figure 7 and Figure 8, in the Accessibility group (B2), Locational Attributes of Streets (22.95%) had the highest weight, indicating that visibility, pedestrian flow, and multidirectional access strongly influence user preferences. Sidewalk Width (18.24%) and Sidewalk Connectivity (16.67%) were also highly valued, reaffirming the dominance of walkability in high-density urban areas. Meanwhile, Convenience of Parking (9.80%) was rated lowest, showing a shift away from car-oriented urban design.
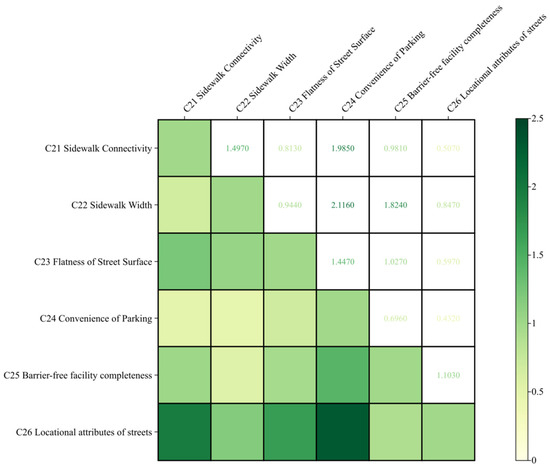
Figure 7.
Visualization of the evaluation matrix for Group B2.
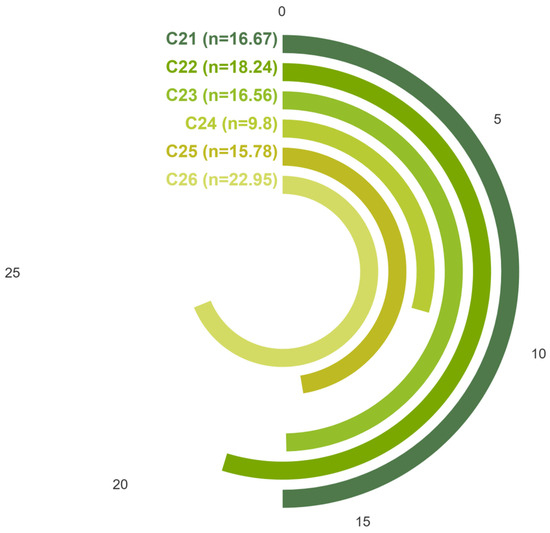
Figure 8.
Visualization of AHP-derived weights for Group B2.
4.1.3. Judgment Matrix and Weights of the Influencing Factors in Alfresco Space Participation
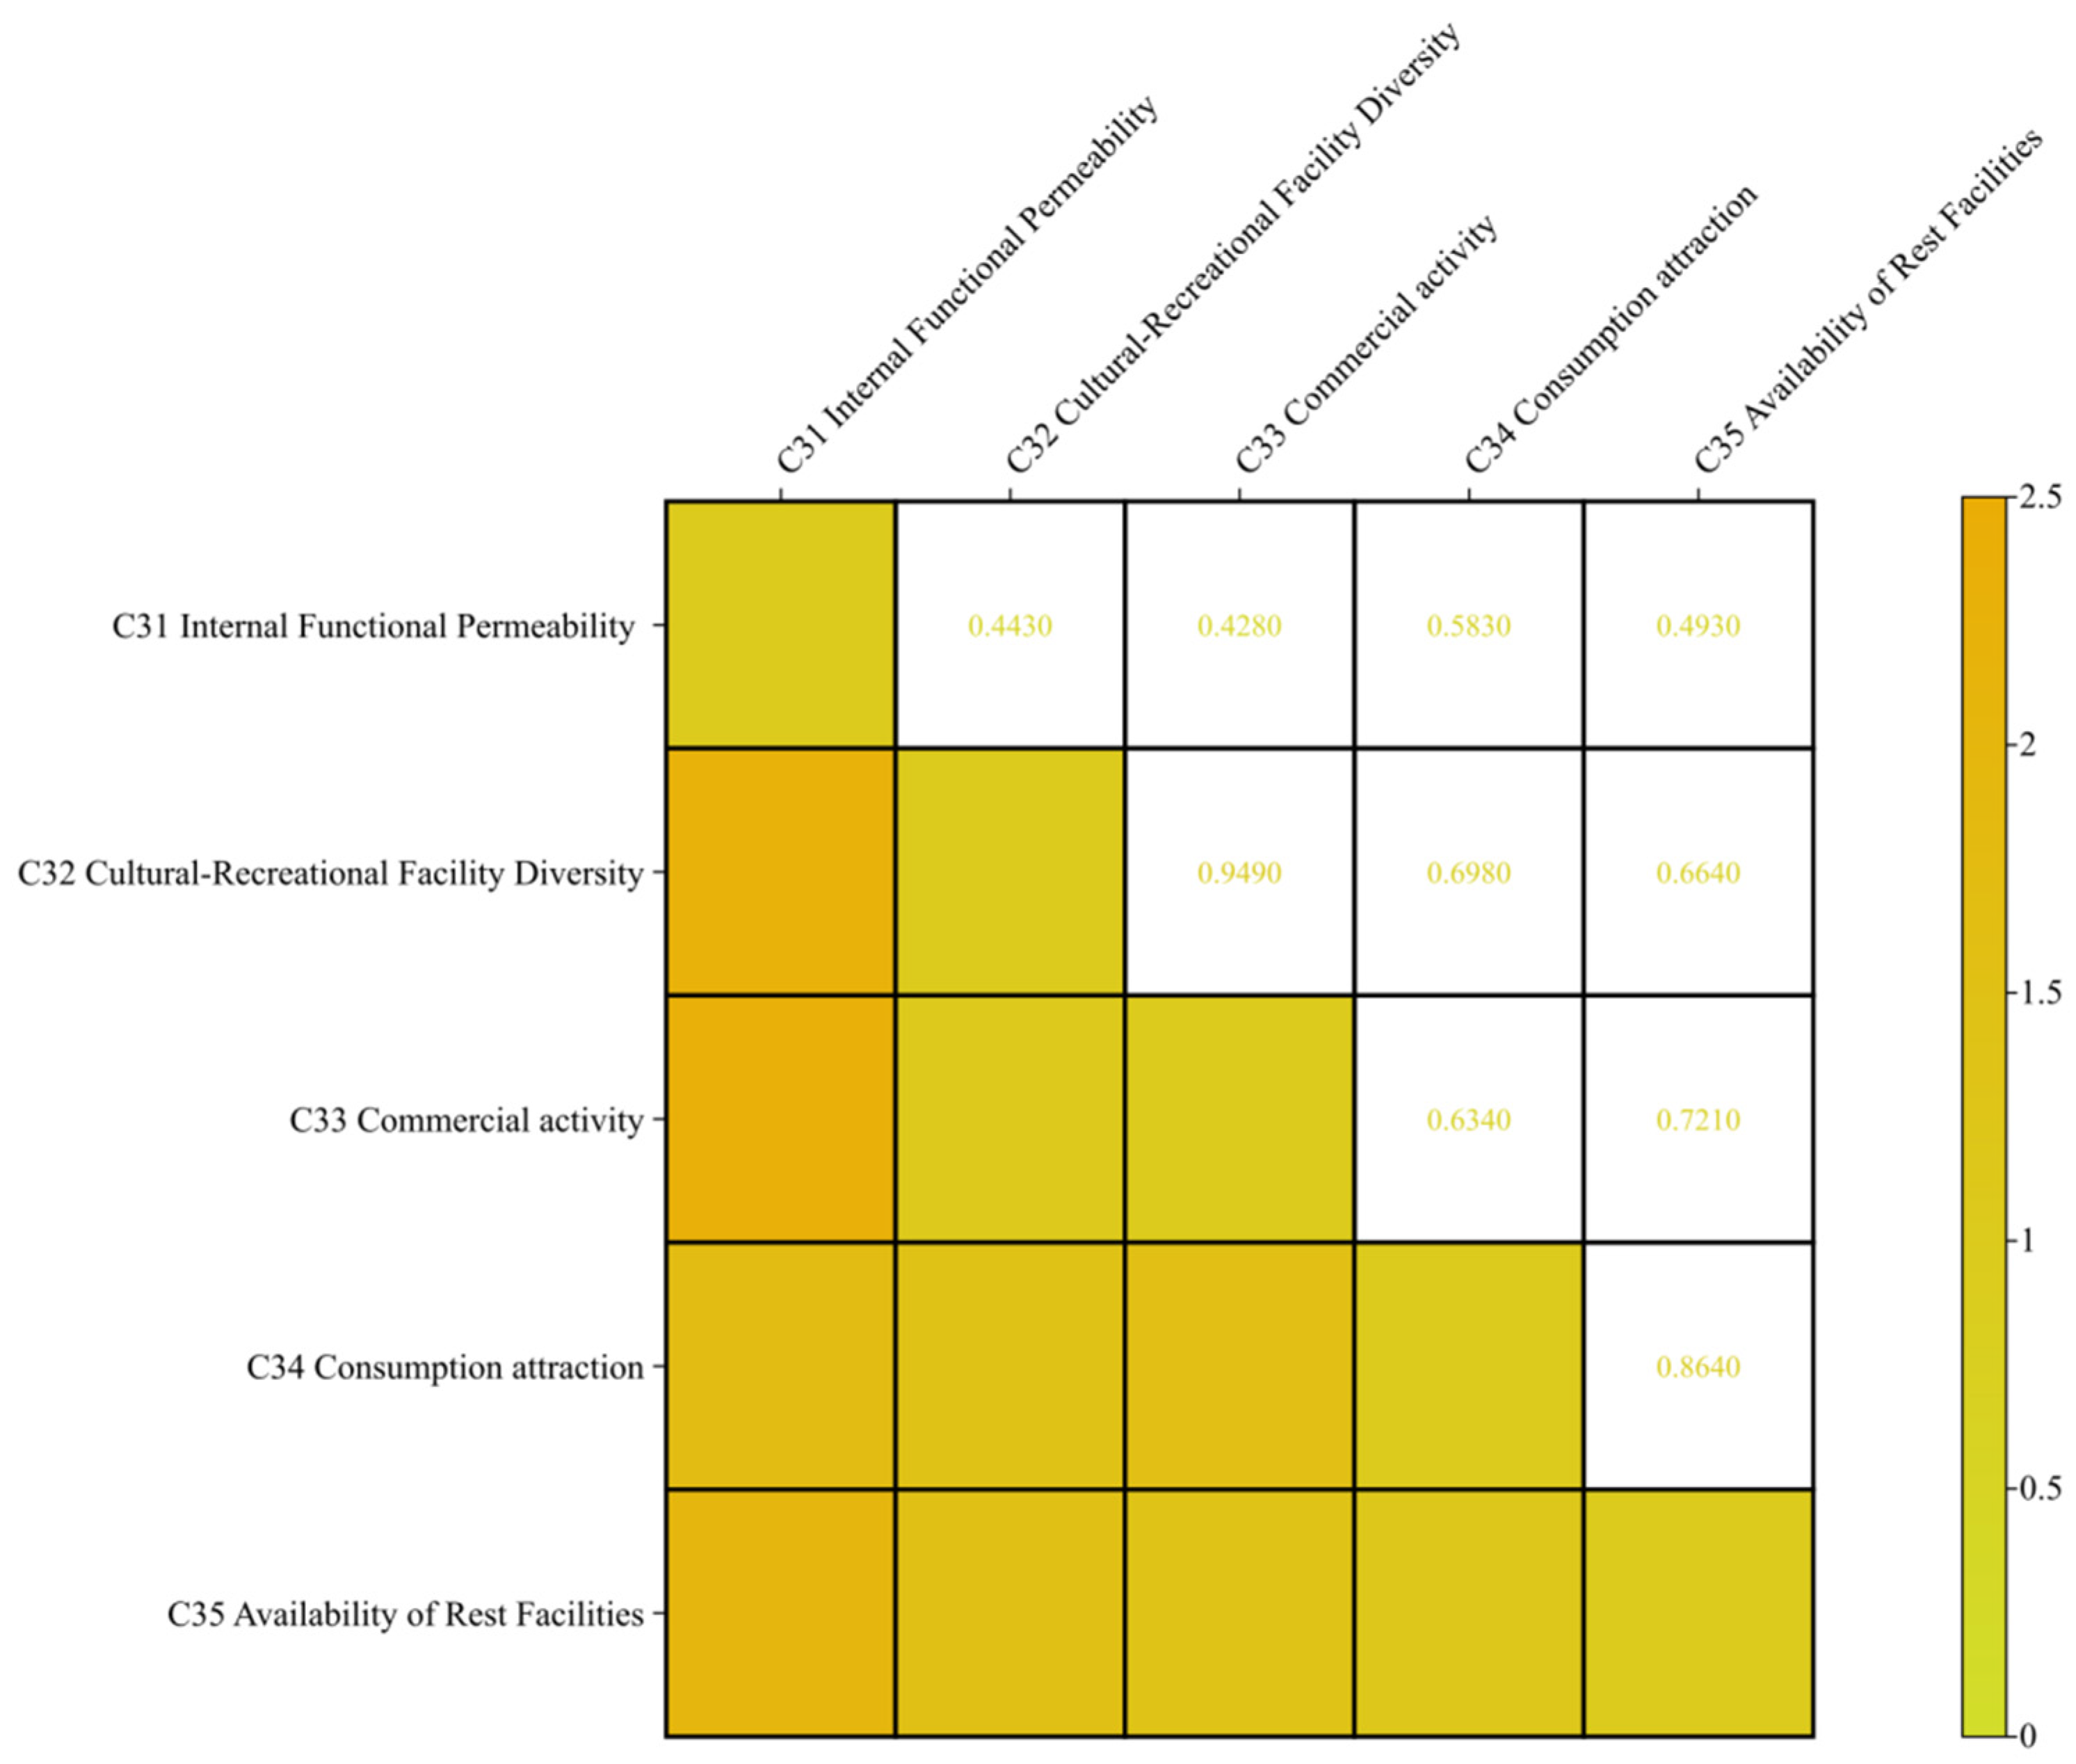
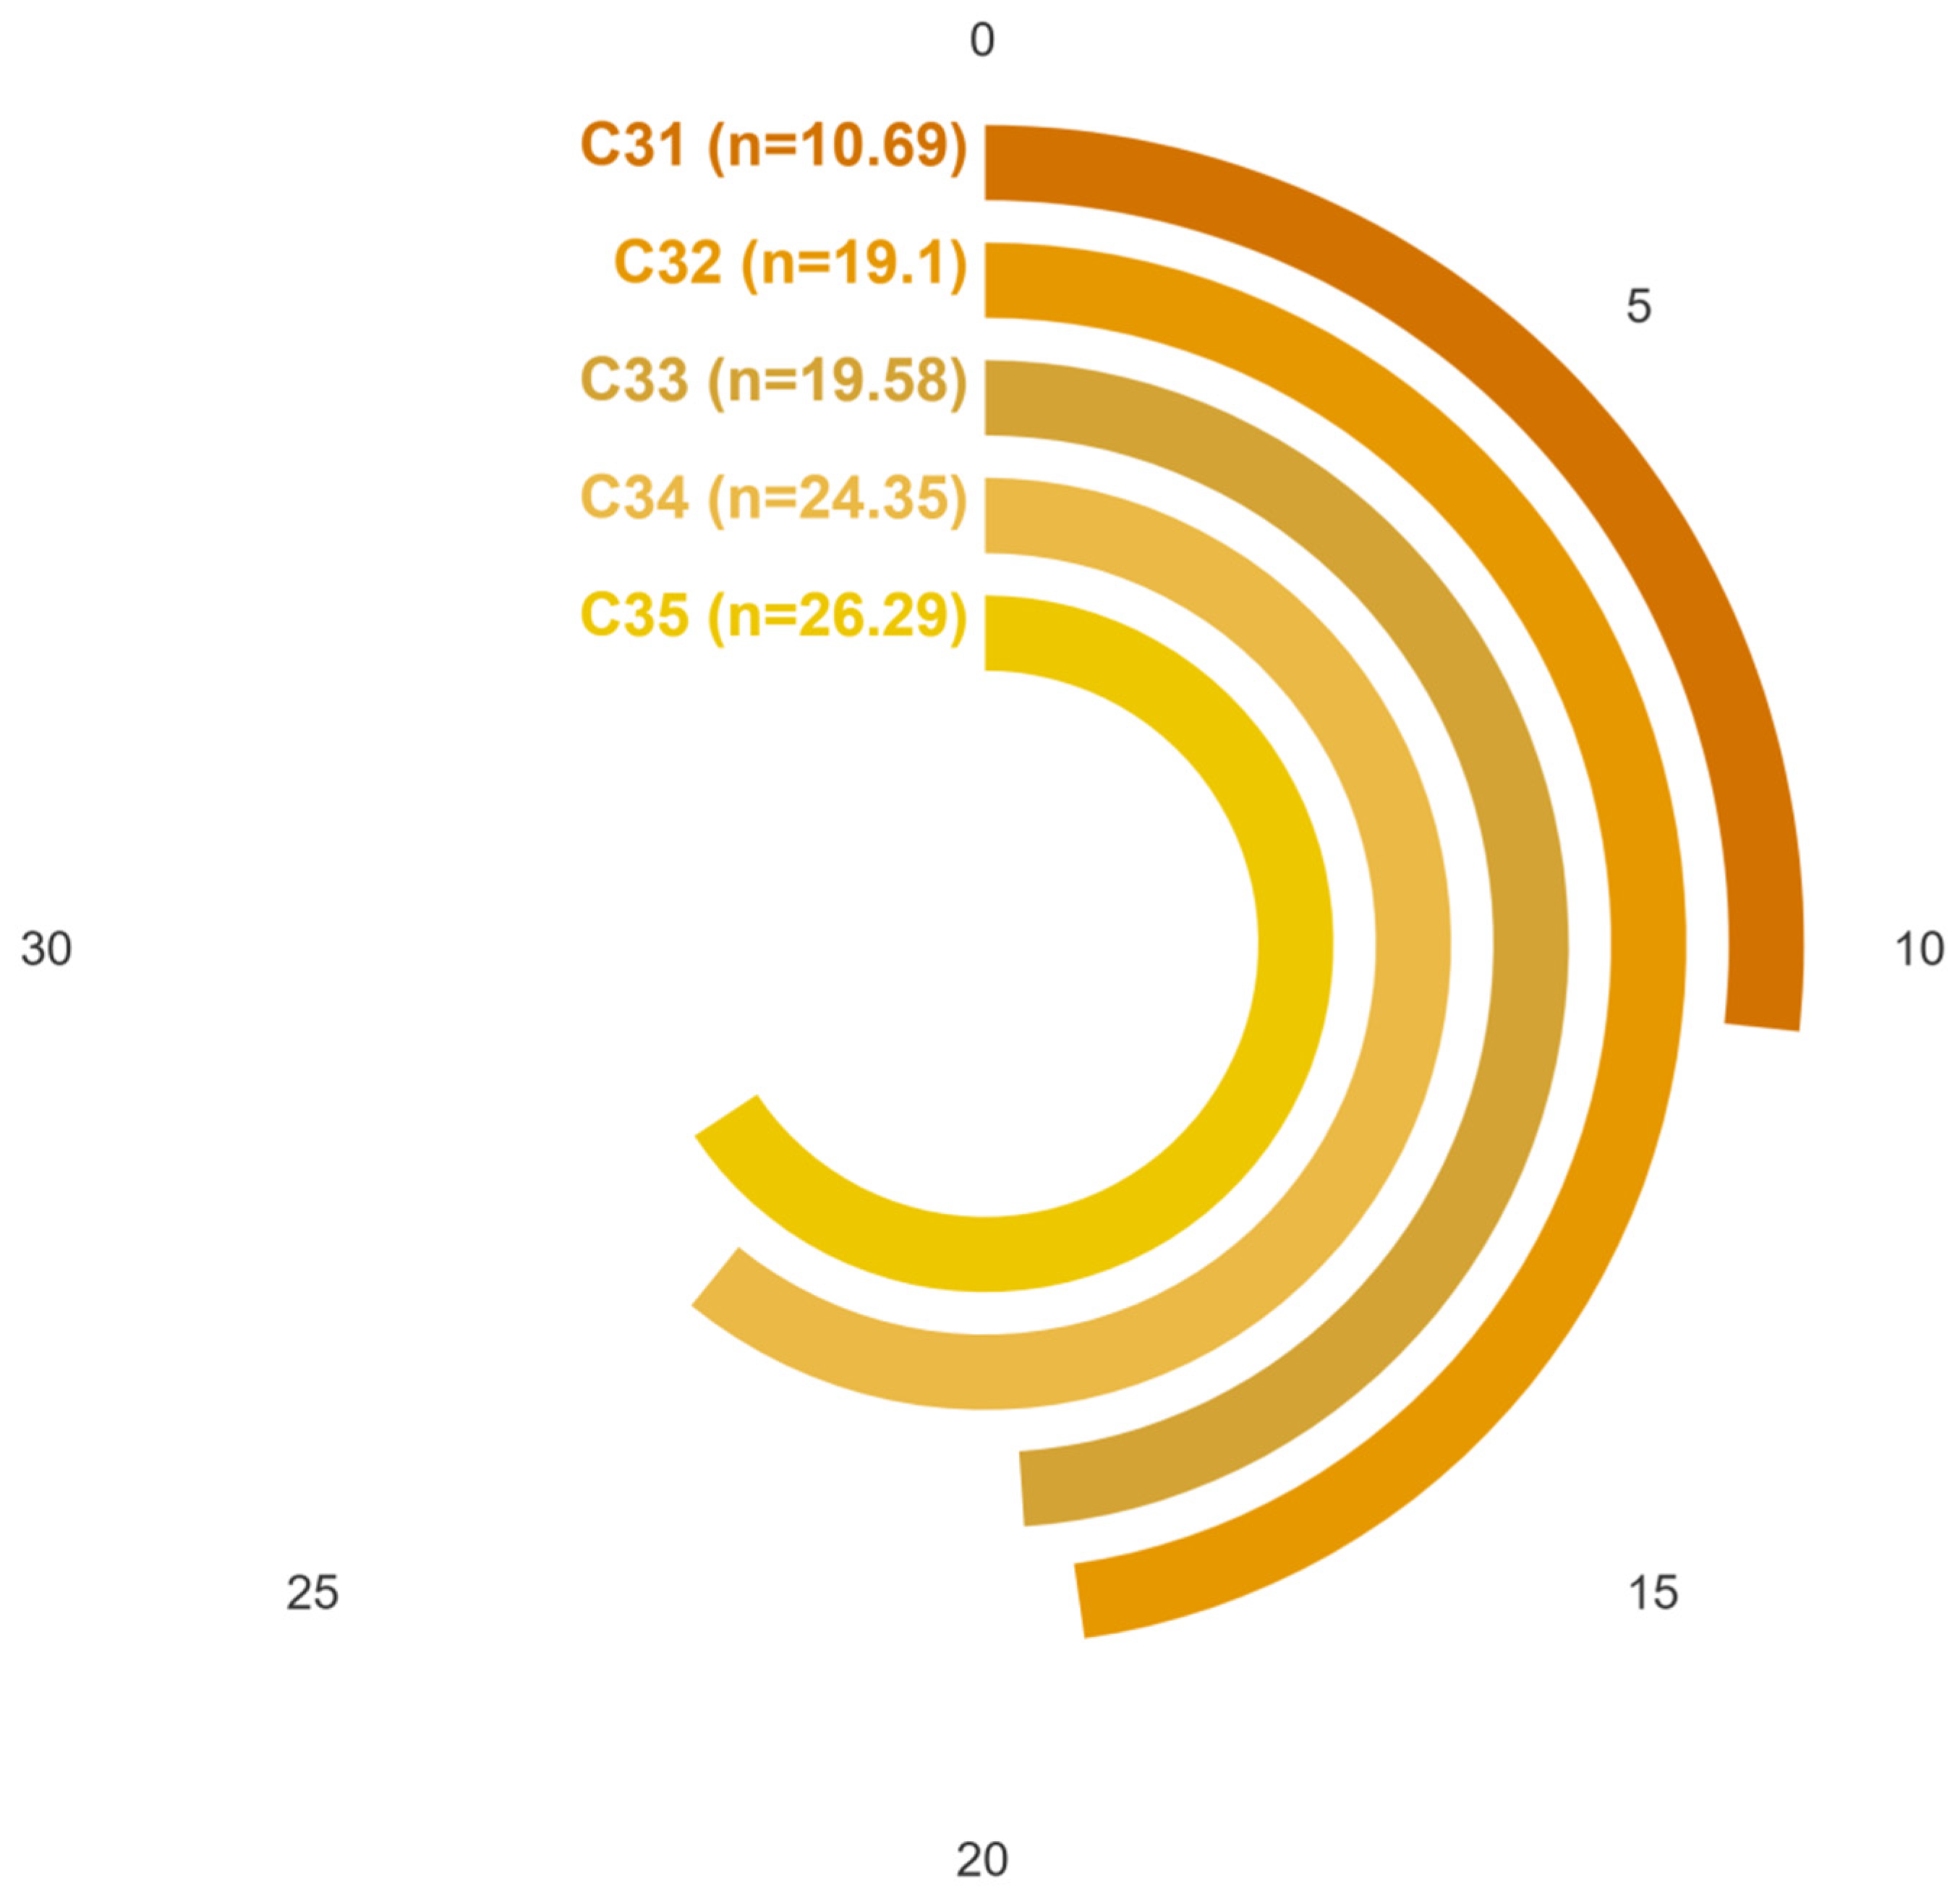
As shown in Figure 9 and Figure 10, in the Participation group (B3), Availability of Rest Facilities (26.29%) and Consumption Attraction (24.35%) ranked highest, highlighting the value users place on experiential comfort and commercial engagement. In contrast, Internal Functional Permeability (10.69%) was rated lowest, implying that direct interactions in the alfresco space are more appreciated than spatial linkage to indoor areas.
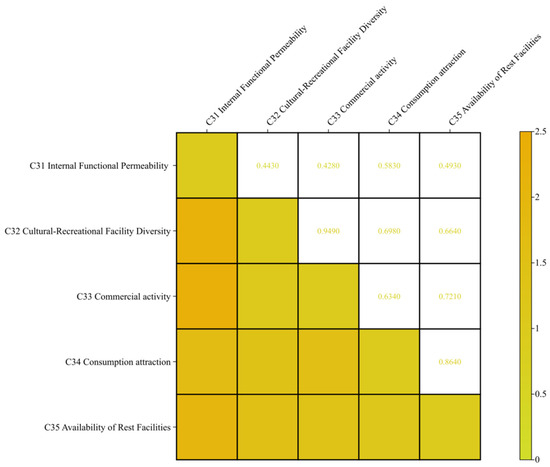
Figure 9.
Visualization of the evaluation matrix for Group B3.
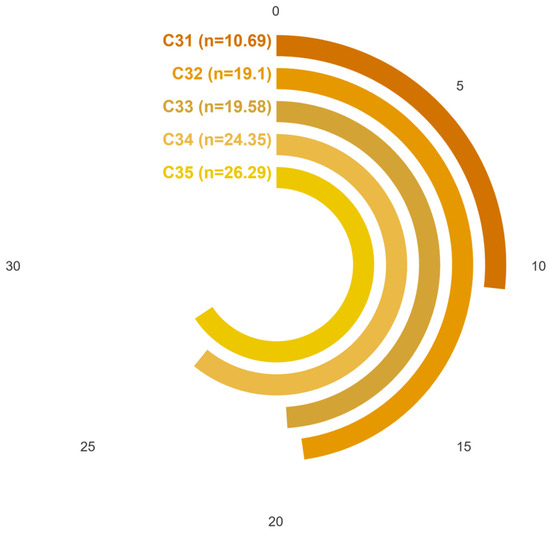
Figure 10.
Visualization of AHP-derived weights for Group B3.
4.1.4. Judgment Matrix and Weights of the Influencing Factors in the Emotional Design of Alfresco Space
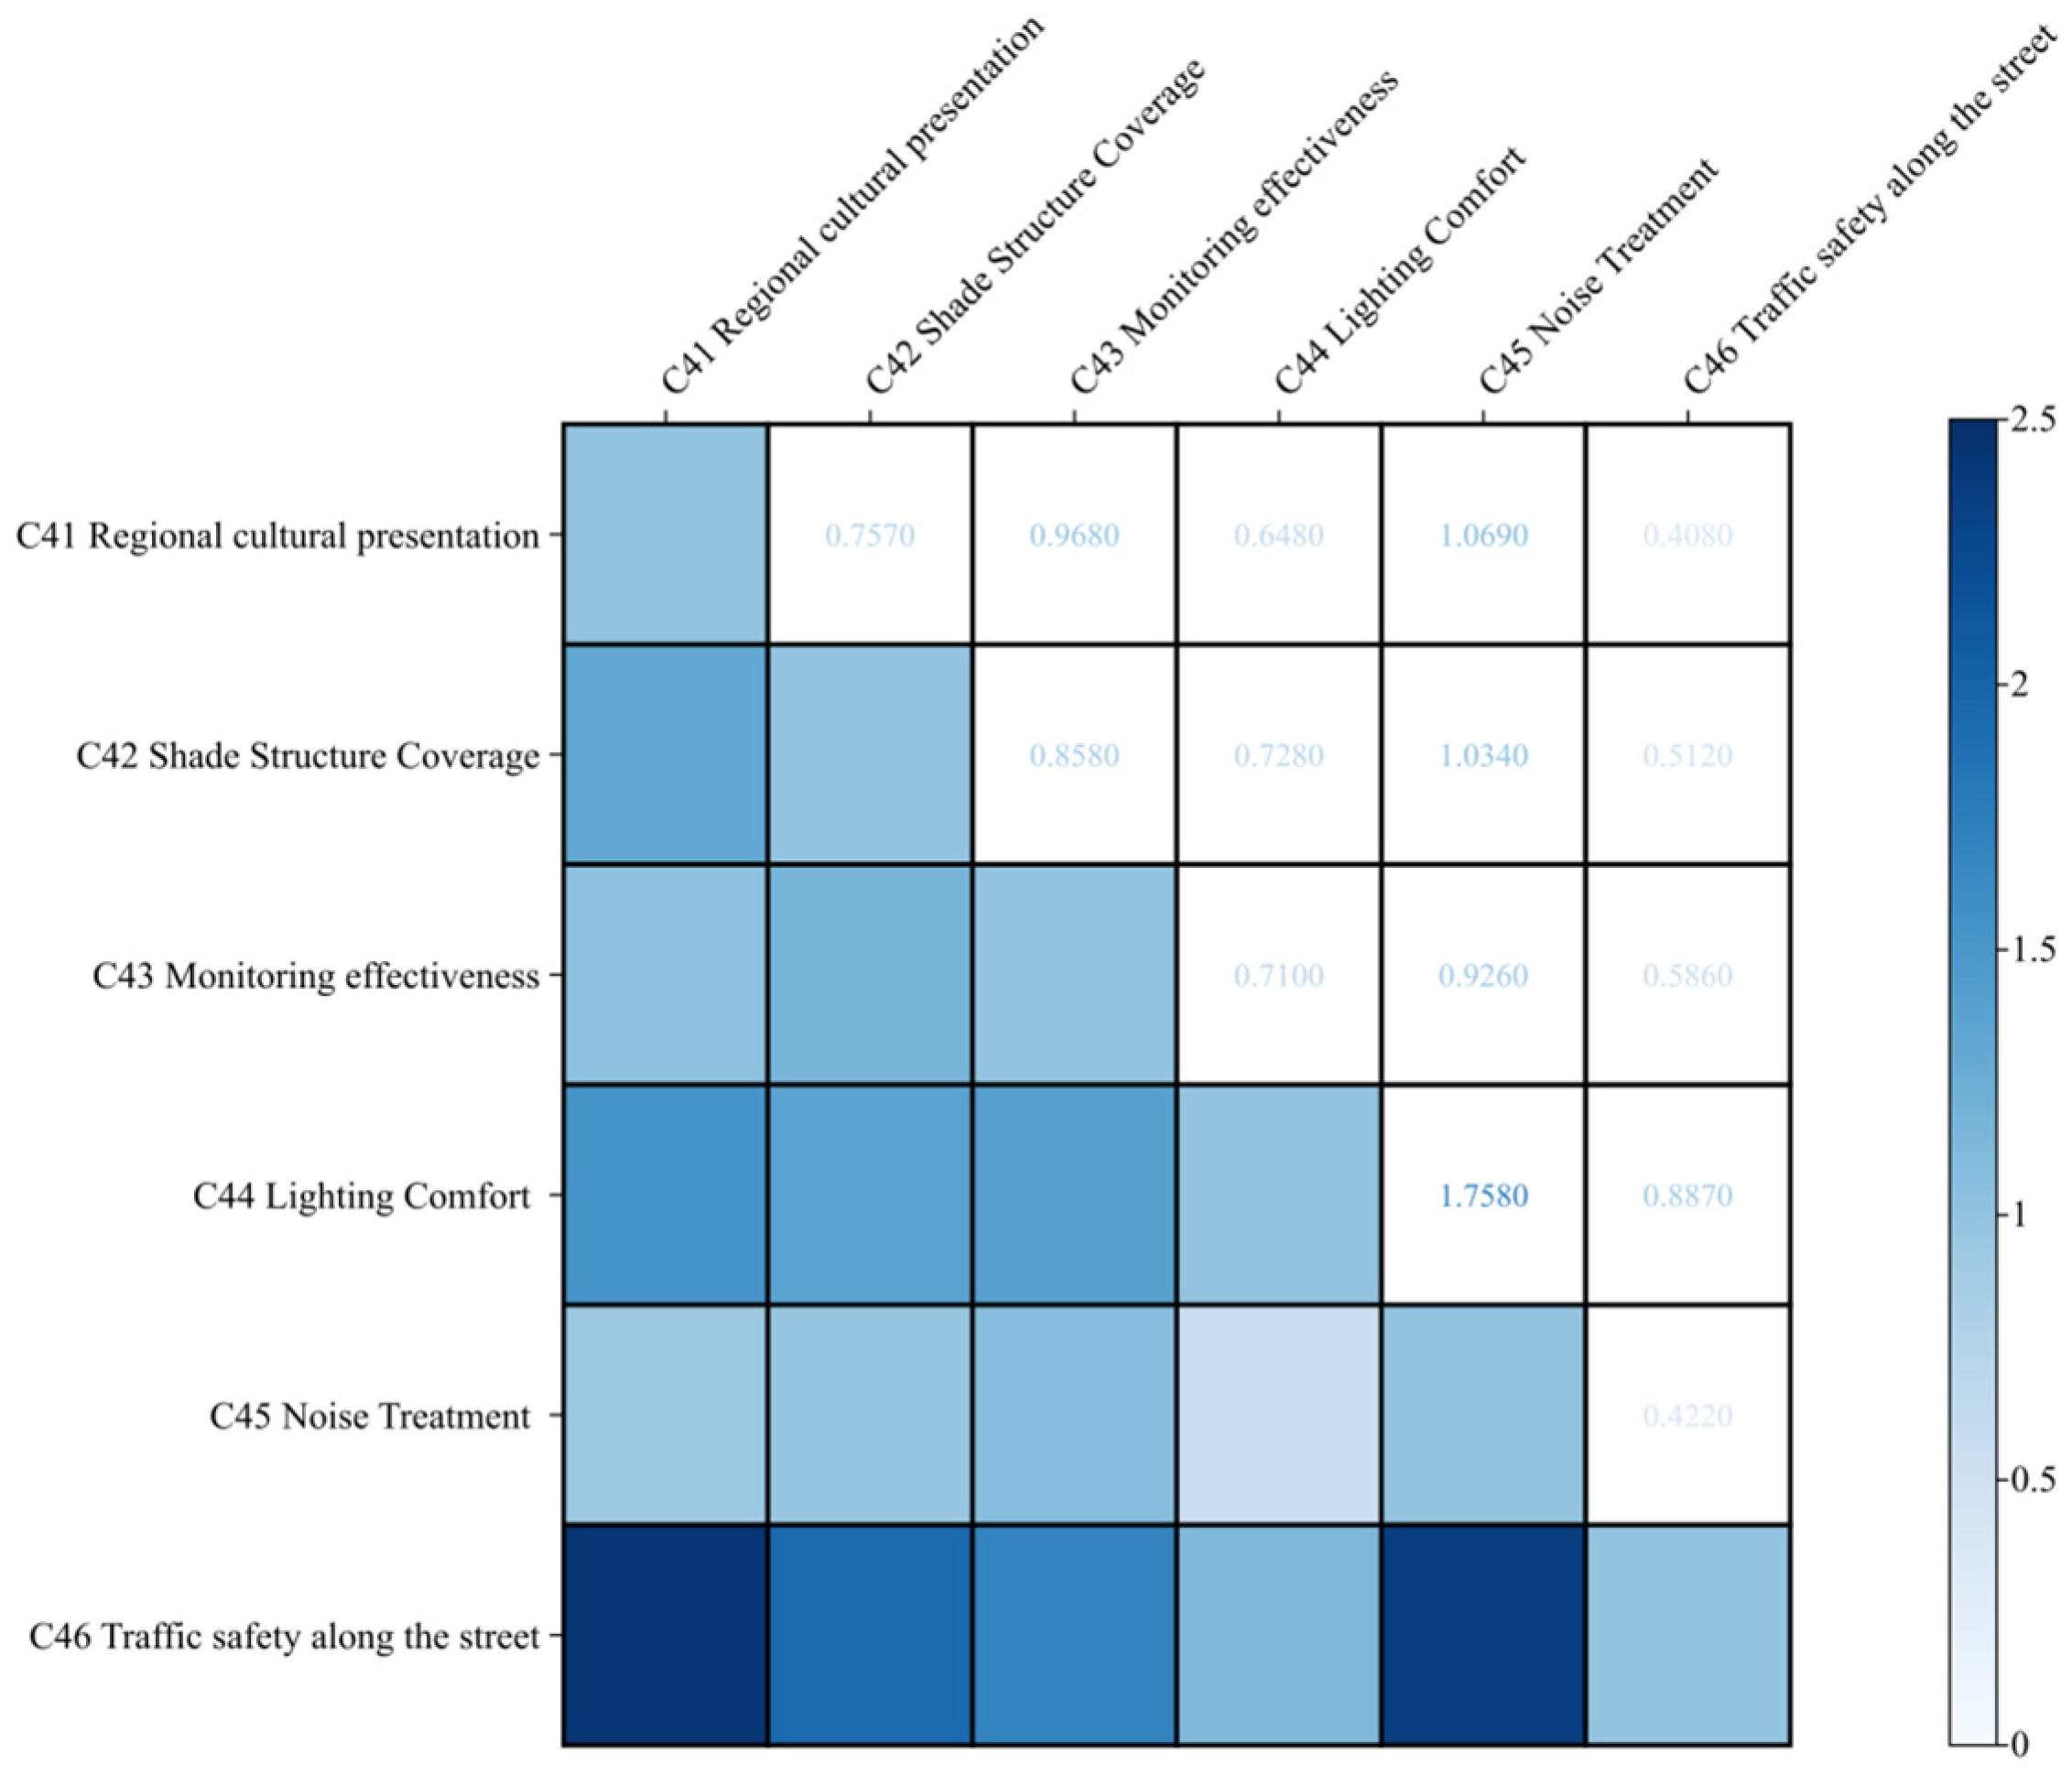
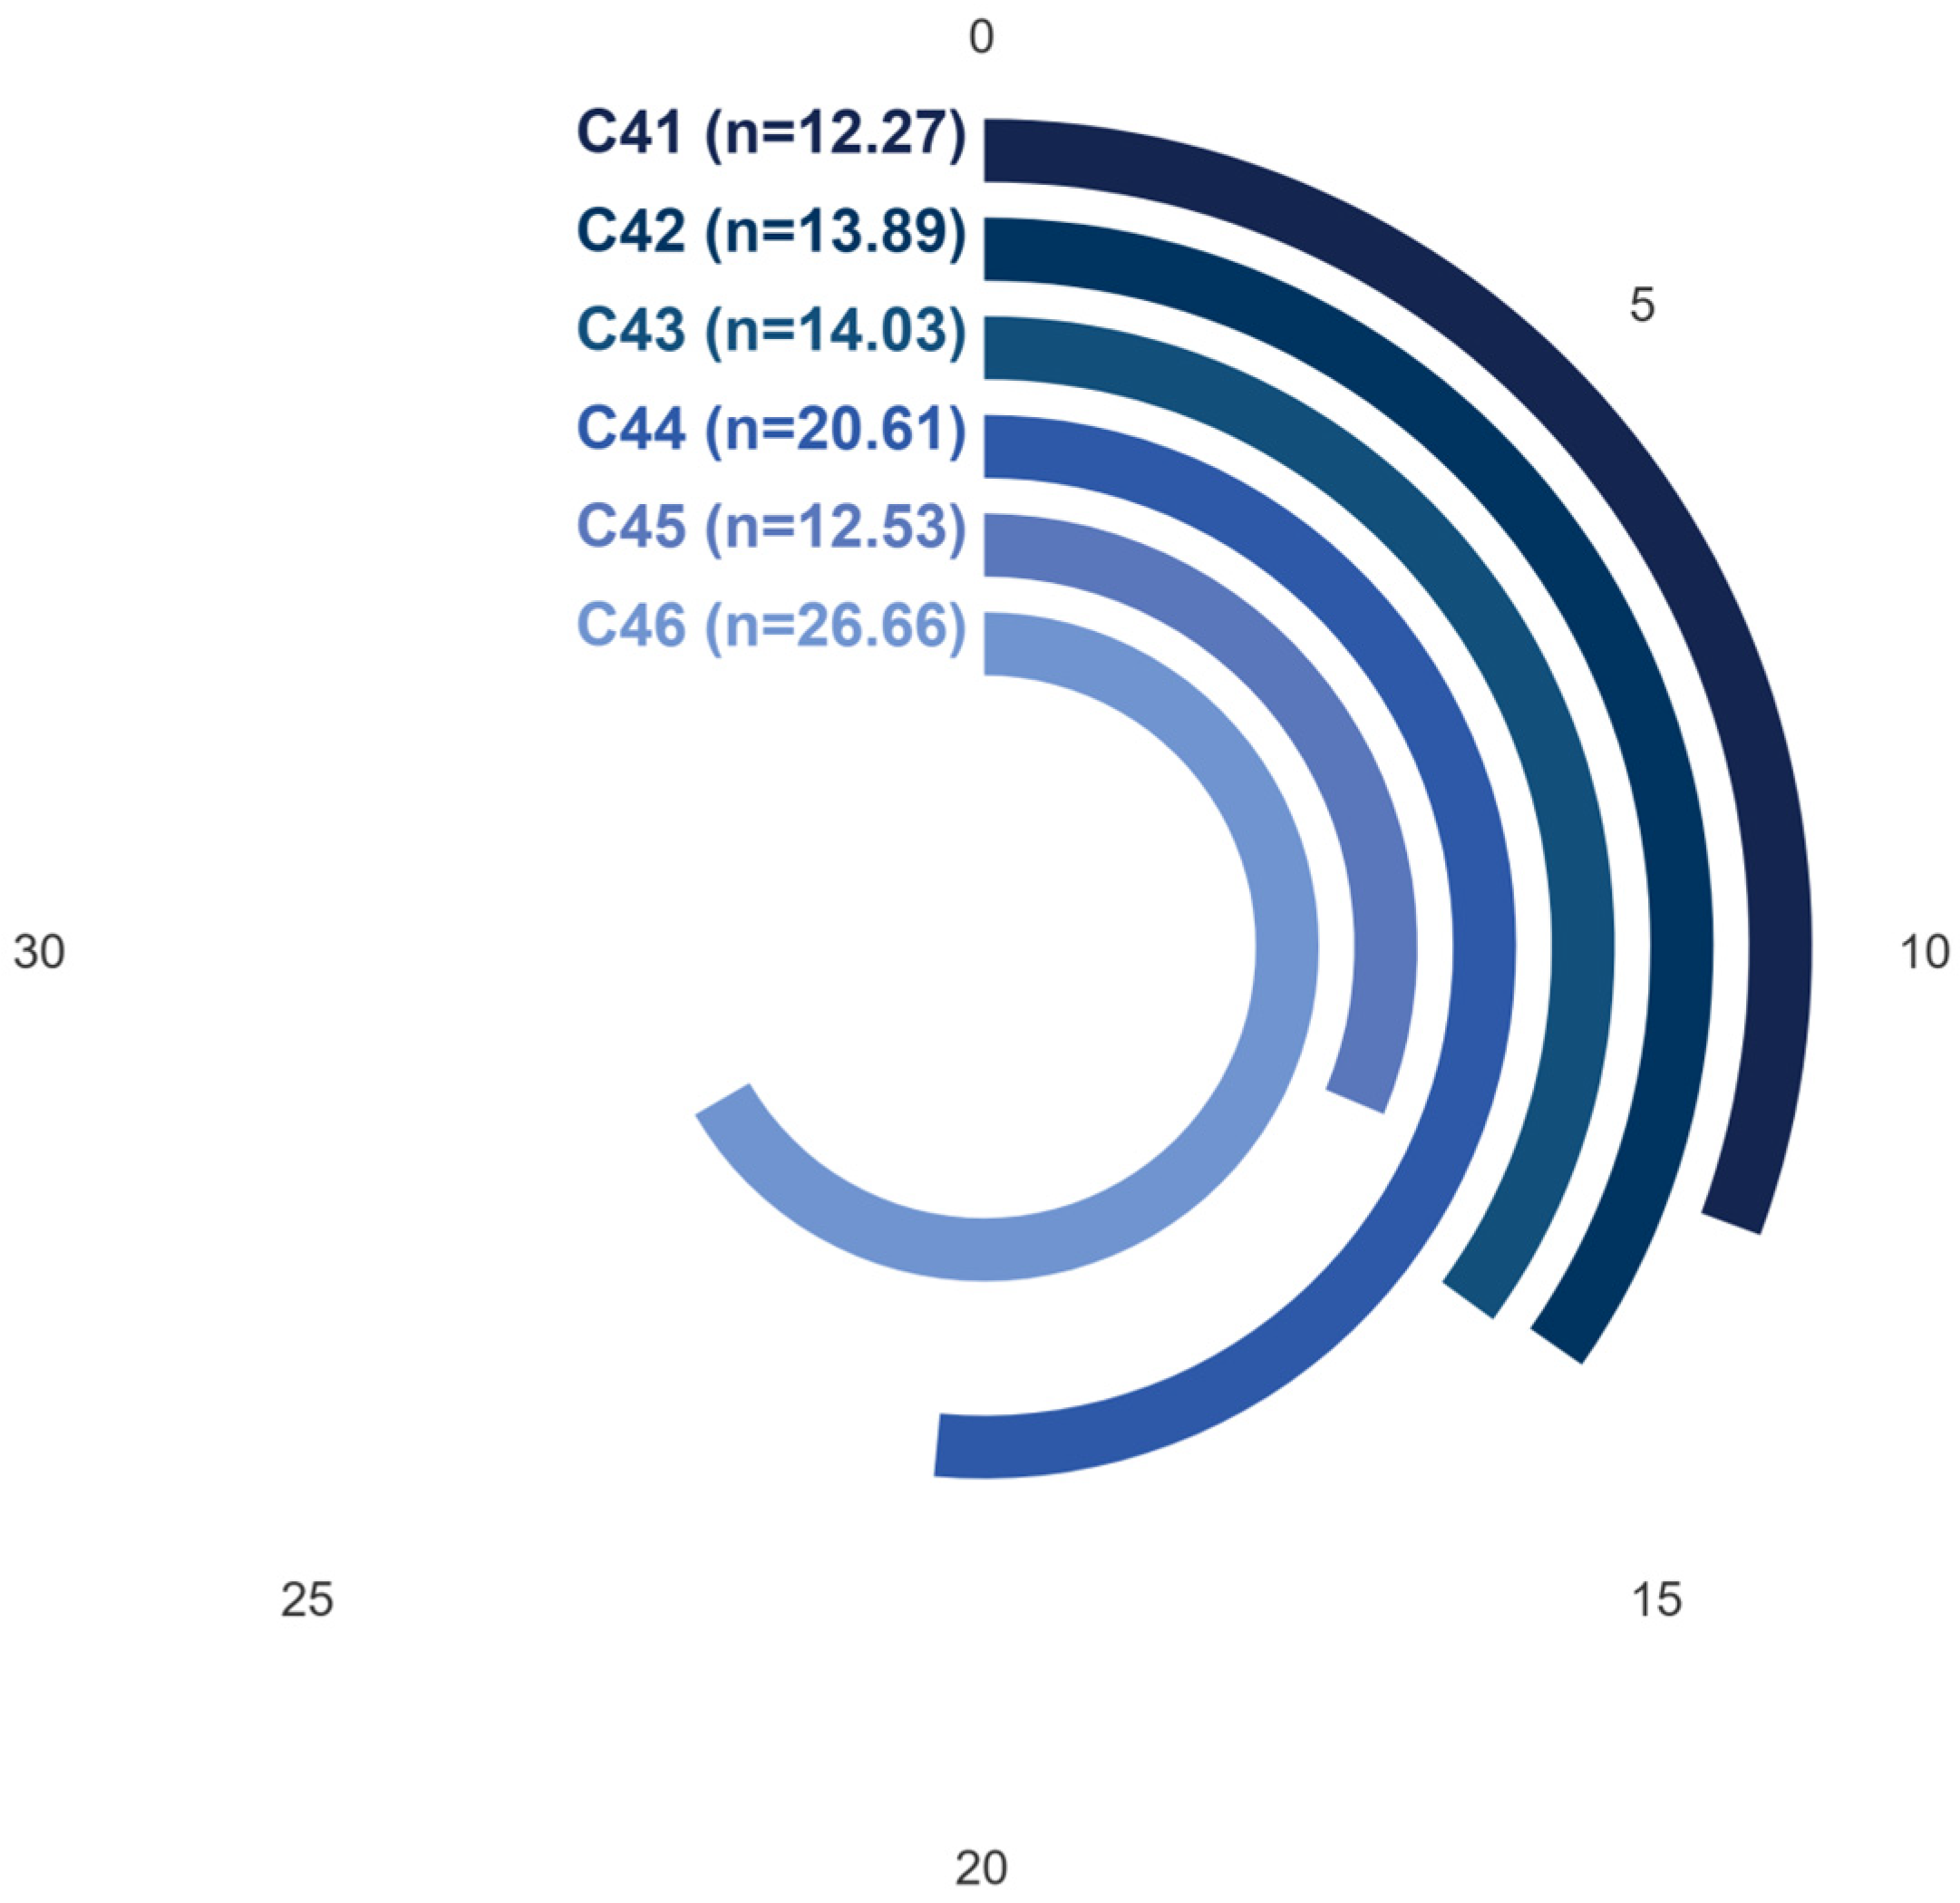
As shown in Figure 11 and Figure 12, in the Emotional Design group (B4), Traffic Safety Along the Street (26.66%) and Lighting Comfort (20.61%) emerged as dominant indicators, showing that physical safety and nighttime ambience are central to emotional satisfaction. In contrast, indicators such as Noise Treatment (12.53%) and Shade Structure Coverage (13.89%) were considered less impactful. This reflects a value orientation that emphasizes security and perception over micro-environmental refinement.
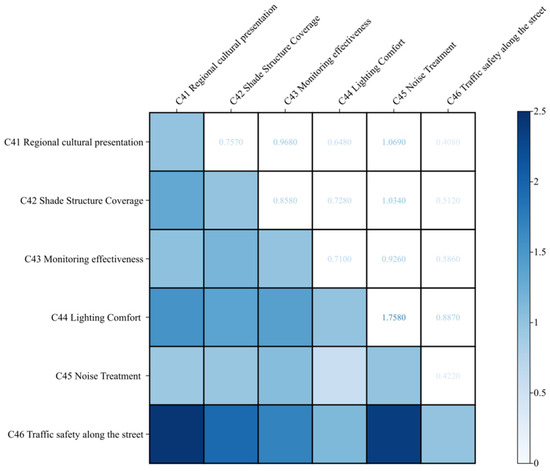
Figure 11.
Visualization of the evaluation matrix for Group B4.
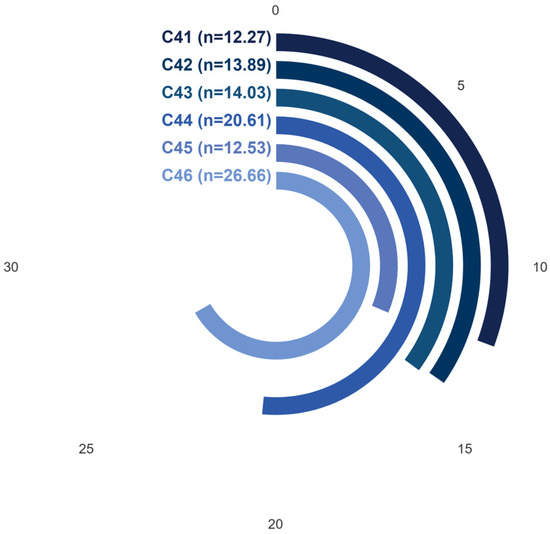
Figure 12.
Visualization of AHP-derived weights for Group B4.
4.1.5. Judgment Matrix and Weights of Influencing Factors in the Design of Diversity in Alfresco Space
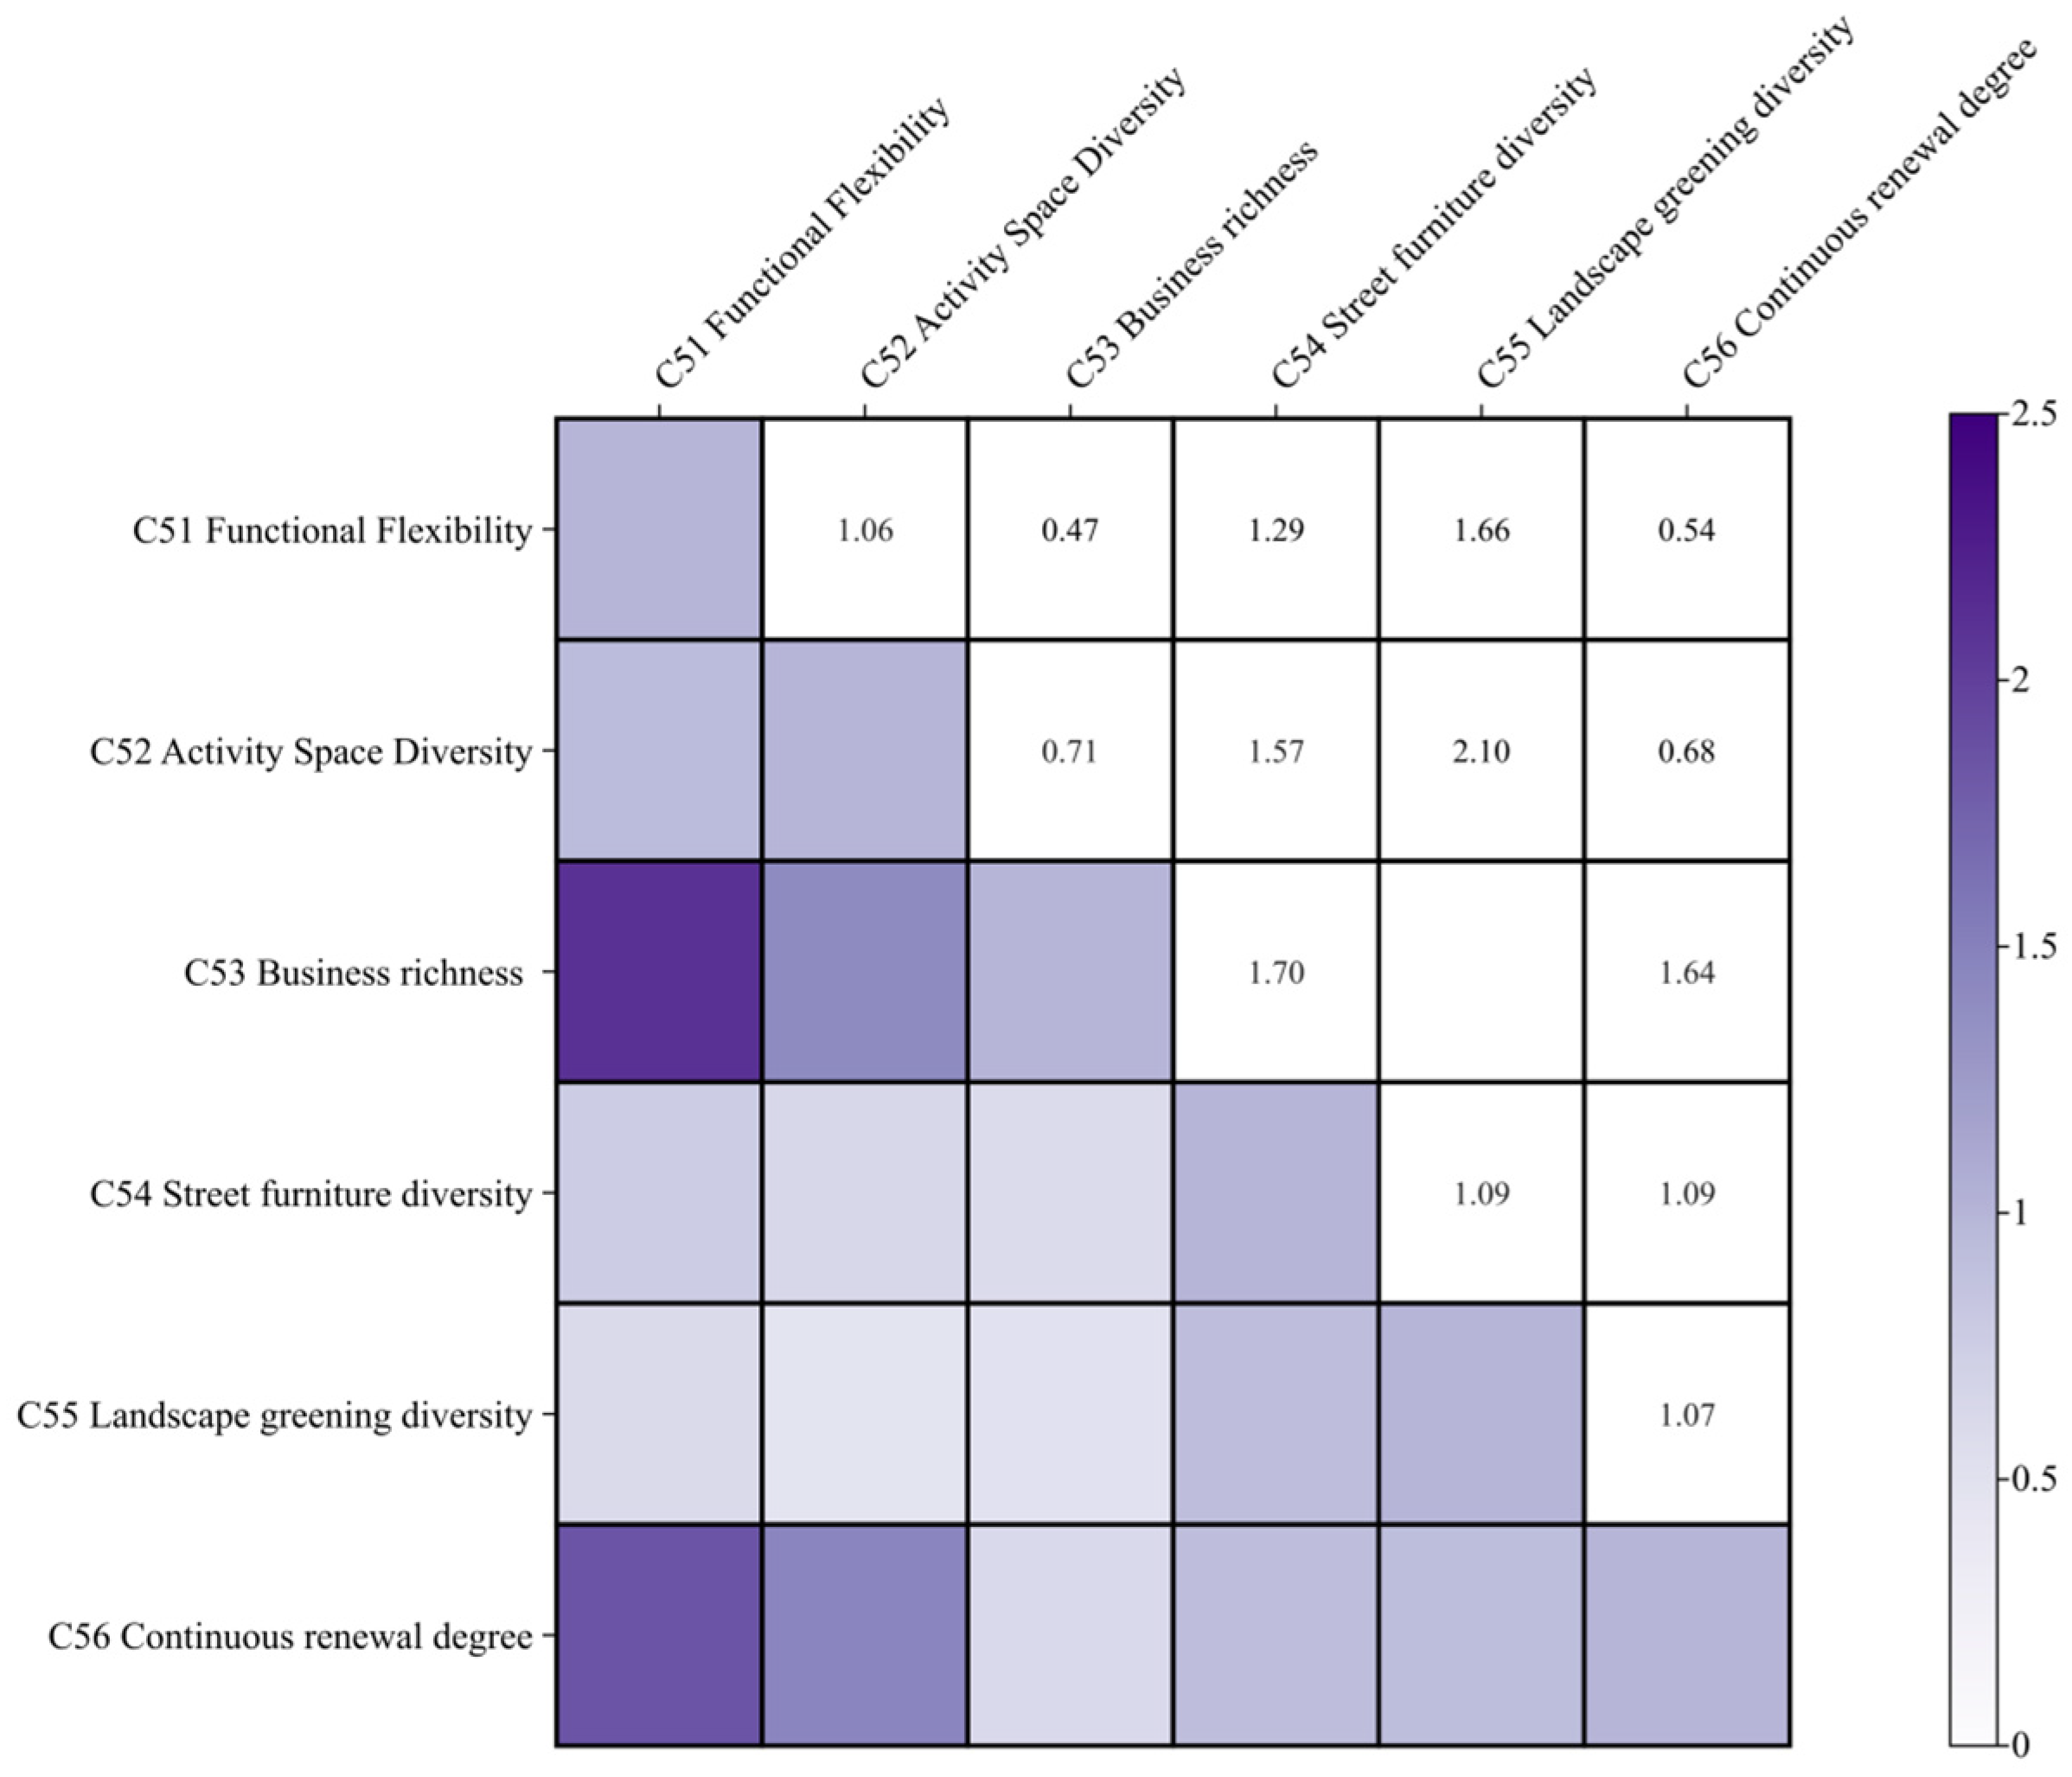
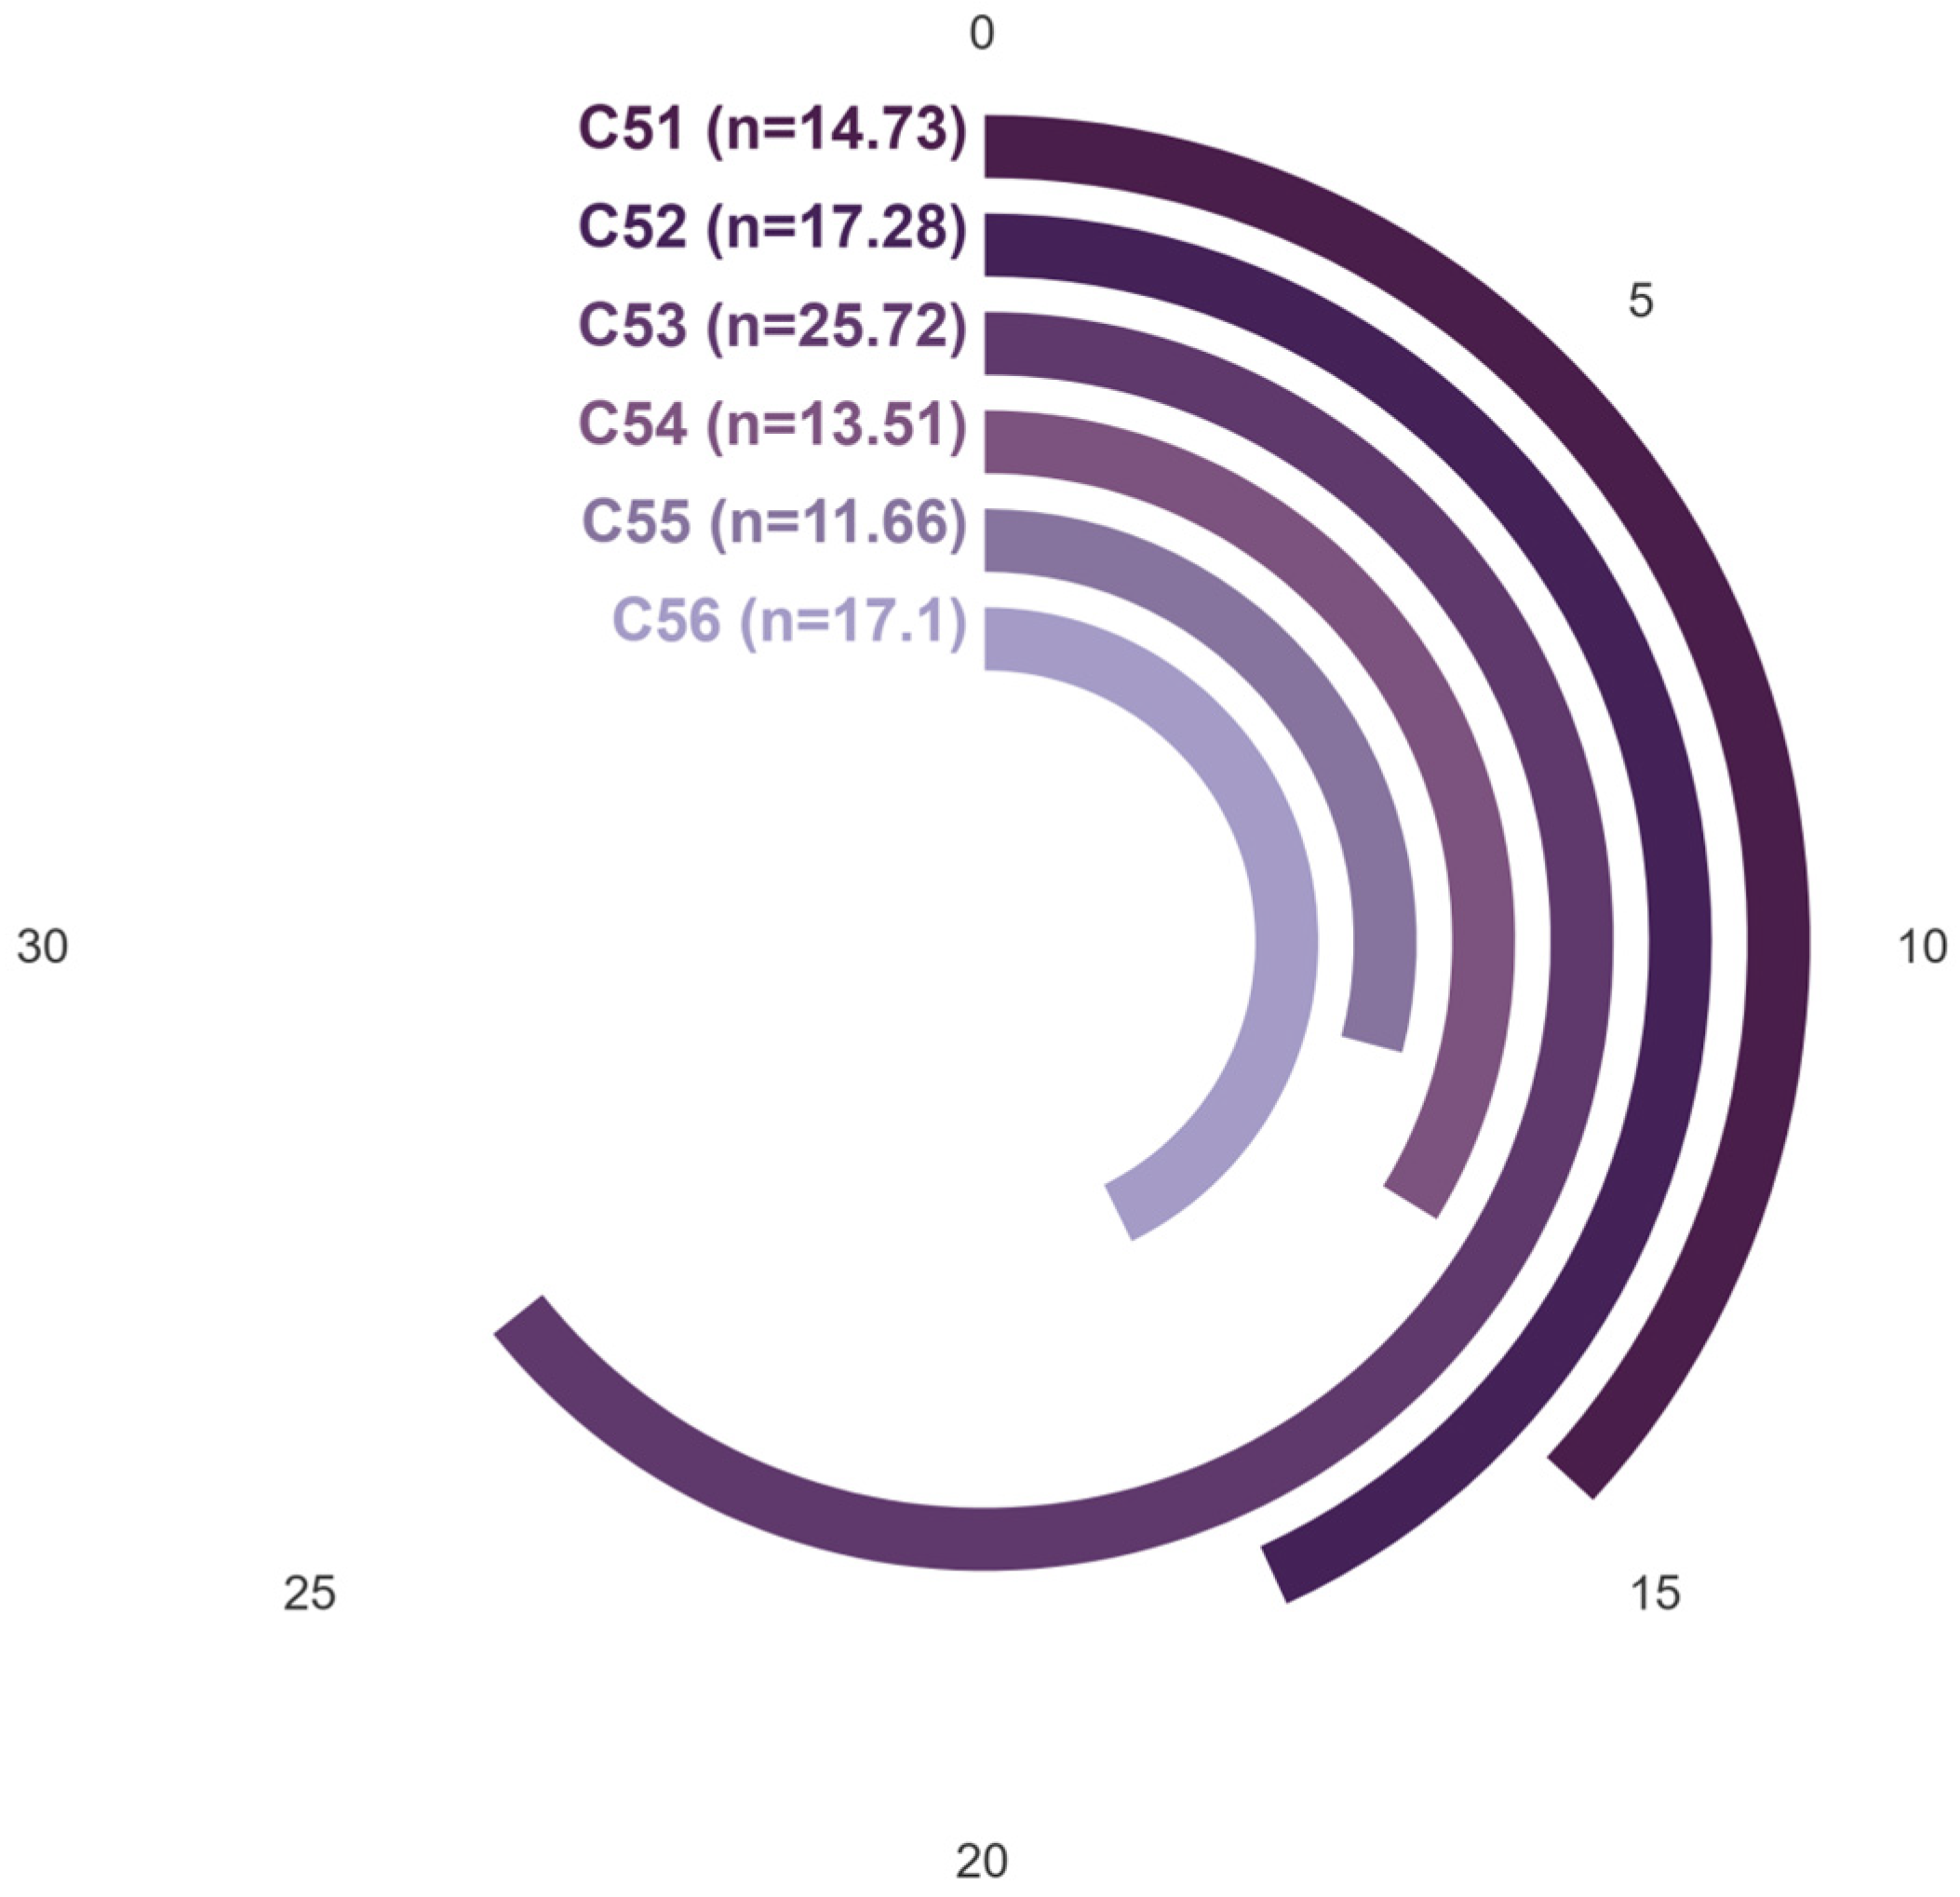
As shown in Figure 13 and Figure 14, in the Diversity group (B5), Business Richness (25.72%) received the highest weighting, signifying that a variety of commercial formats enhances spatial vitality and user retention. Activity Space Diversity (17.28%) and Continuous Renewal Degree (17.10%) also contributed notably, suggesting that users value both functional diversity and adaptability.
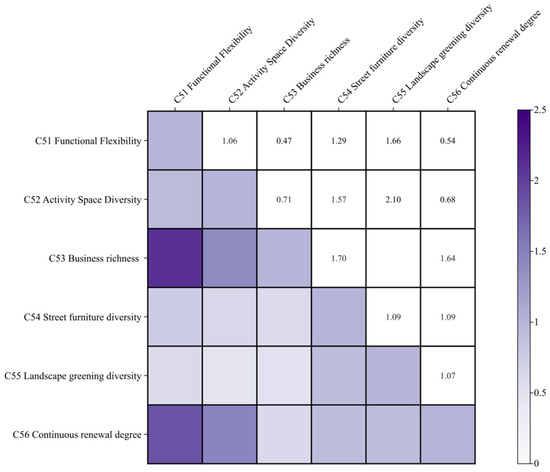
Figure 13.
Visualization of the evaluation matrix for Group B5.
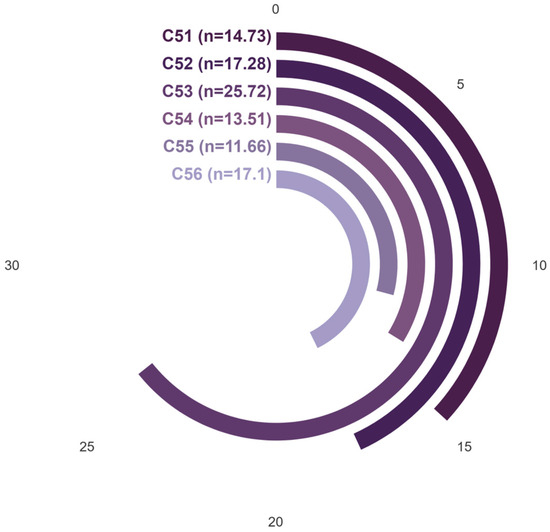
Figure 14.
Visualization of AHP-derived weights for Group B5.
4.1.6. Consistency Test
The results of the consistency test are shown below, as shown in Table 11. The CR values for all factors are less than 0.1, which means that the judgment matrix of this study satisfies the consistency test and the calculated weights are consistent.

Table 11.
Summary of consistency test results.
4.2. Entropy Value Method Weight Calculation Results
The data were standardized using Equation (8) to obtain the information matrix, and the entropy values of each evaluation factor are calculated using Equations (9)–(11), as shown in Table 12.

Table 12.
Entropy method indicator weighting values.
4.3. Results of the Combined Weighting Calculation
According to the weighting results of the evaluation indicators for an urban street alfresco space, derived through the Analytic Hierarchy Process (AHP) and the Entropy Weight Method (EWM), the final comprehensive weights were calculated by integrating subjective and objective weights using Equation (12).
This integrated approach combines the strengths of both methods:
- AHP introduces expert knowledge and structured judgment, ensuring the alignment of weights with decision-makers’ priorities.
- EWM leverages the inherent variability in data, enhancing objectivity and reducing human bias.
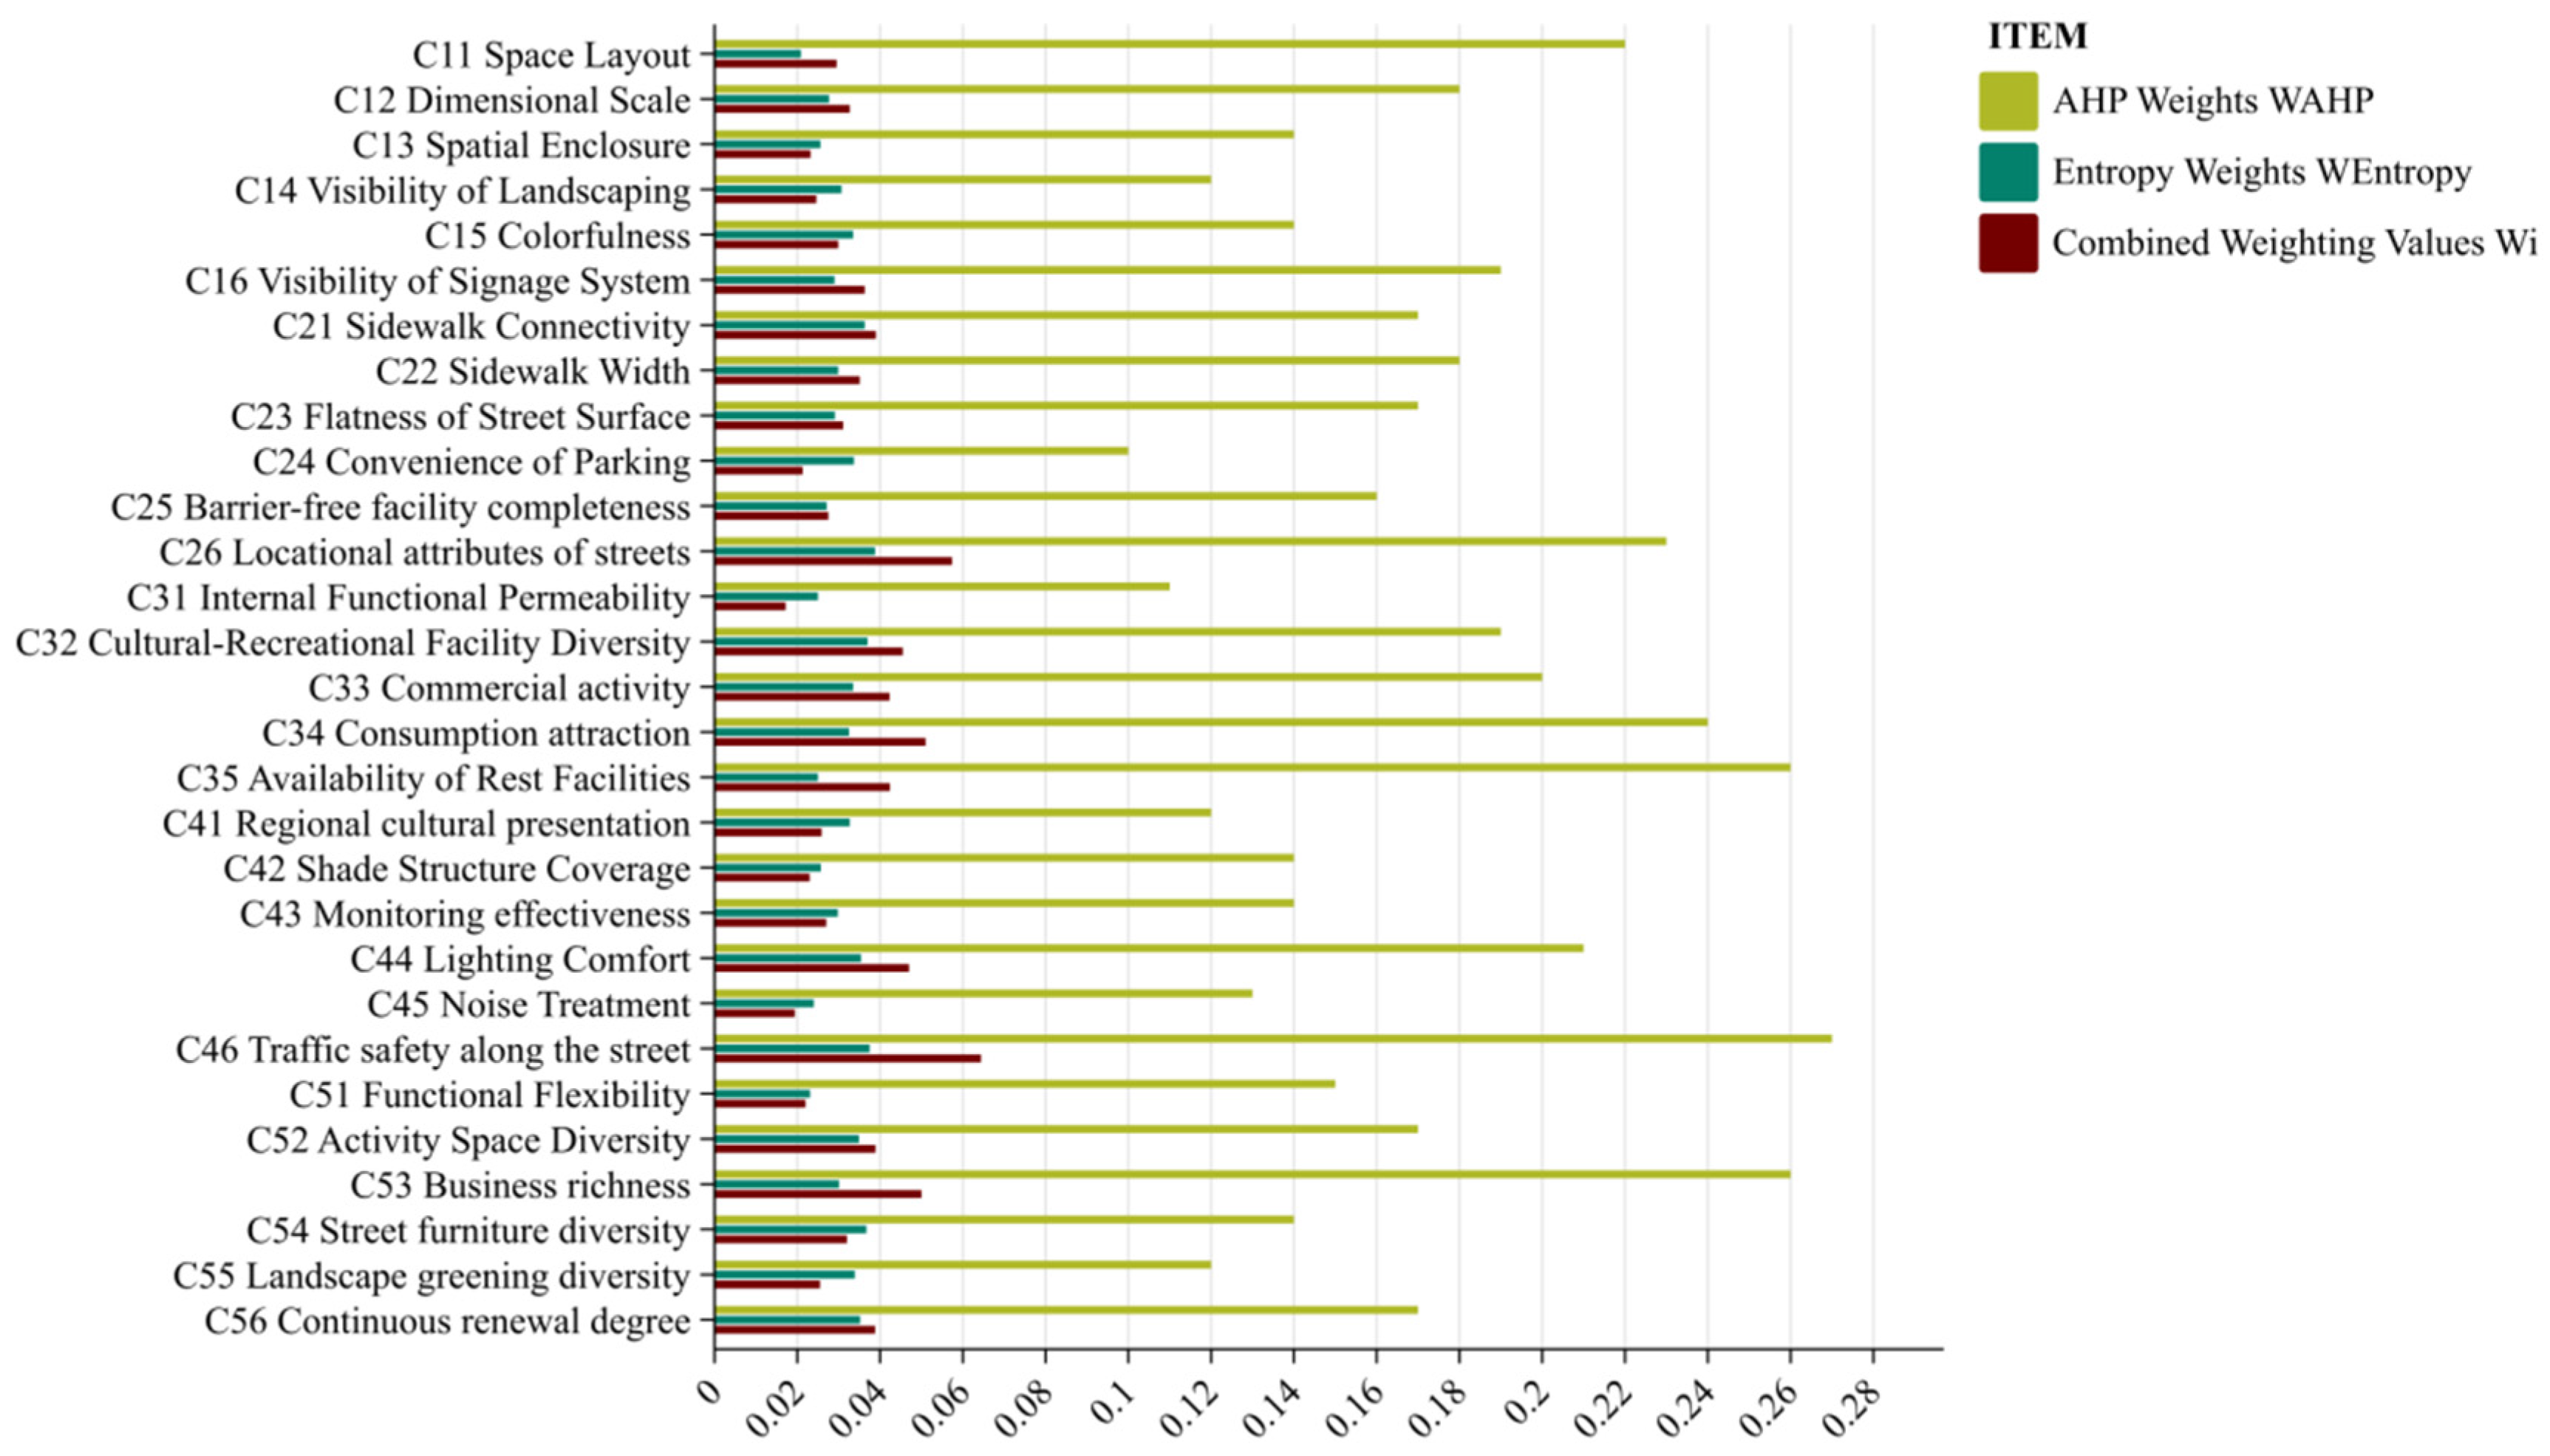
By synthesizing these two weighting schemes, the method achieves a more scientifically grounded, comprehensive, and robust evaluation of indicator importance. The combined weights for each indicator are listed in the following Table 13, as shown in Figure 15.

Table 13.
Combined weighting values for indicator descriptions.
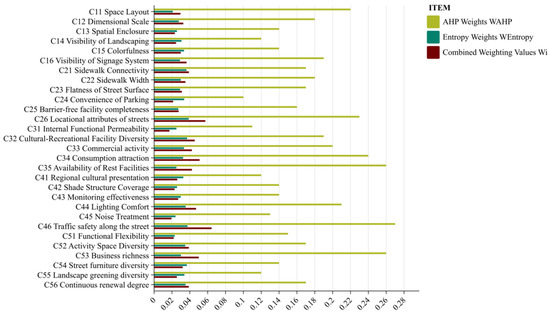
Figure 15.
Weight visualization.
5. Discussion
5.1. Interpretation of Weighting Results and Indicator Priorities
From a broader perspective, traffic safety was identified as the users’ primary concern. This finding aligns with international street design principles, such as those outlined in the Complete Streets Chicago initiative, and resonates with the scholarship of Eric Dumbaugh and Robert Rae, who address safety by balancing the trade-off between mobility and accessibility in arterial street design. Their recommendations include concentrating commercial activities within low-speed corridors and applying systematic measures such as speed control, land-use coordination, and access regulation [26]. Although absolute safety cannot be assured, policy interventions—such as time-restricted vehicle access—can provide practical and effective partial solutions.
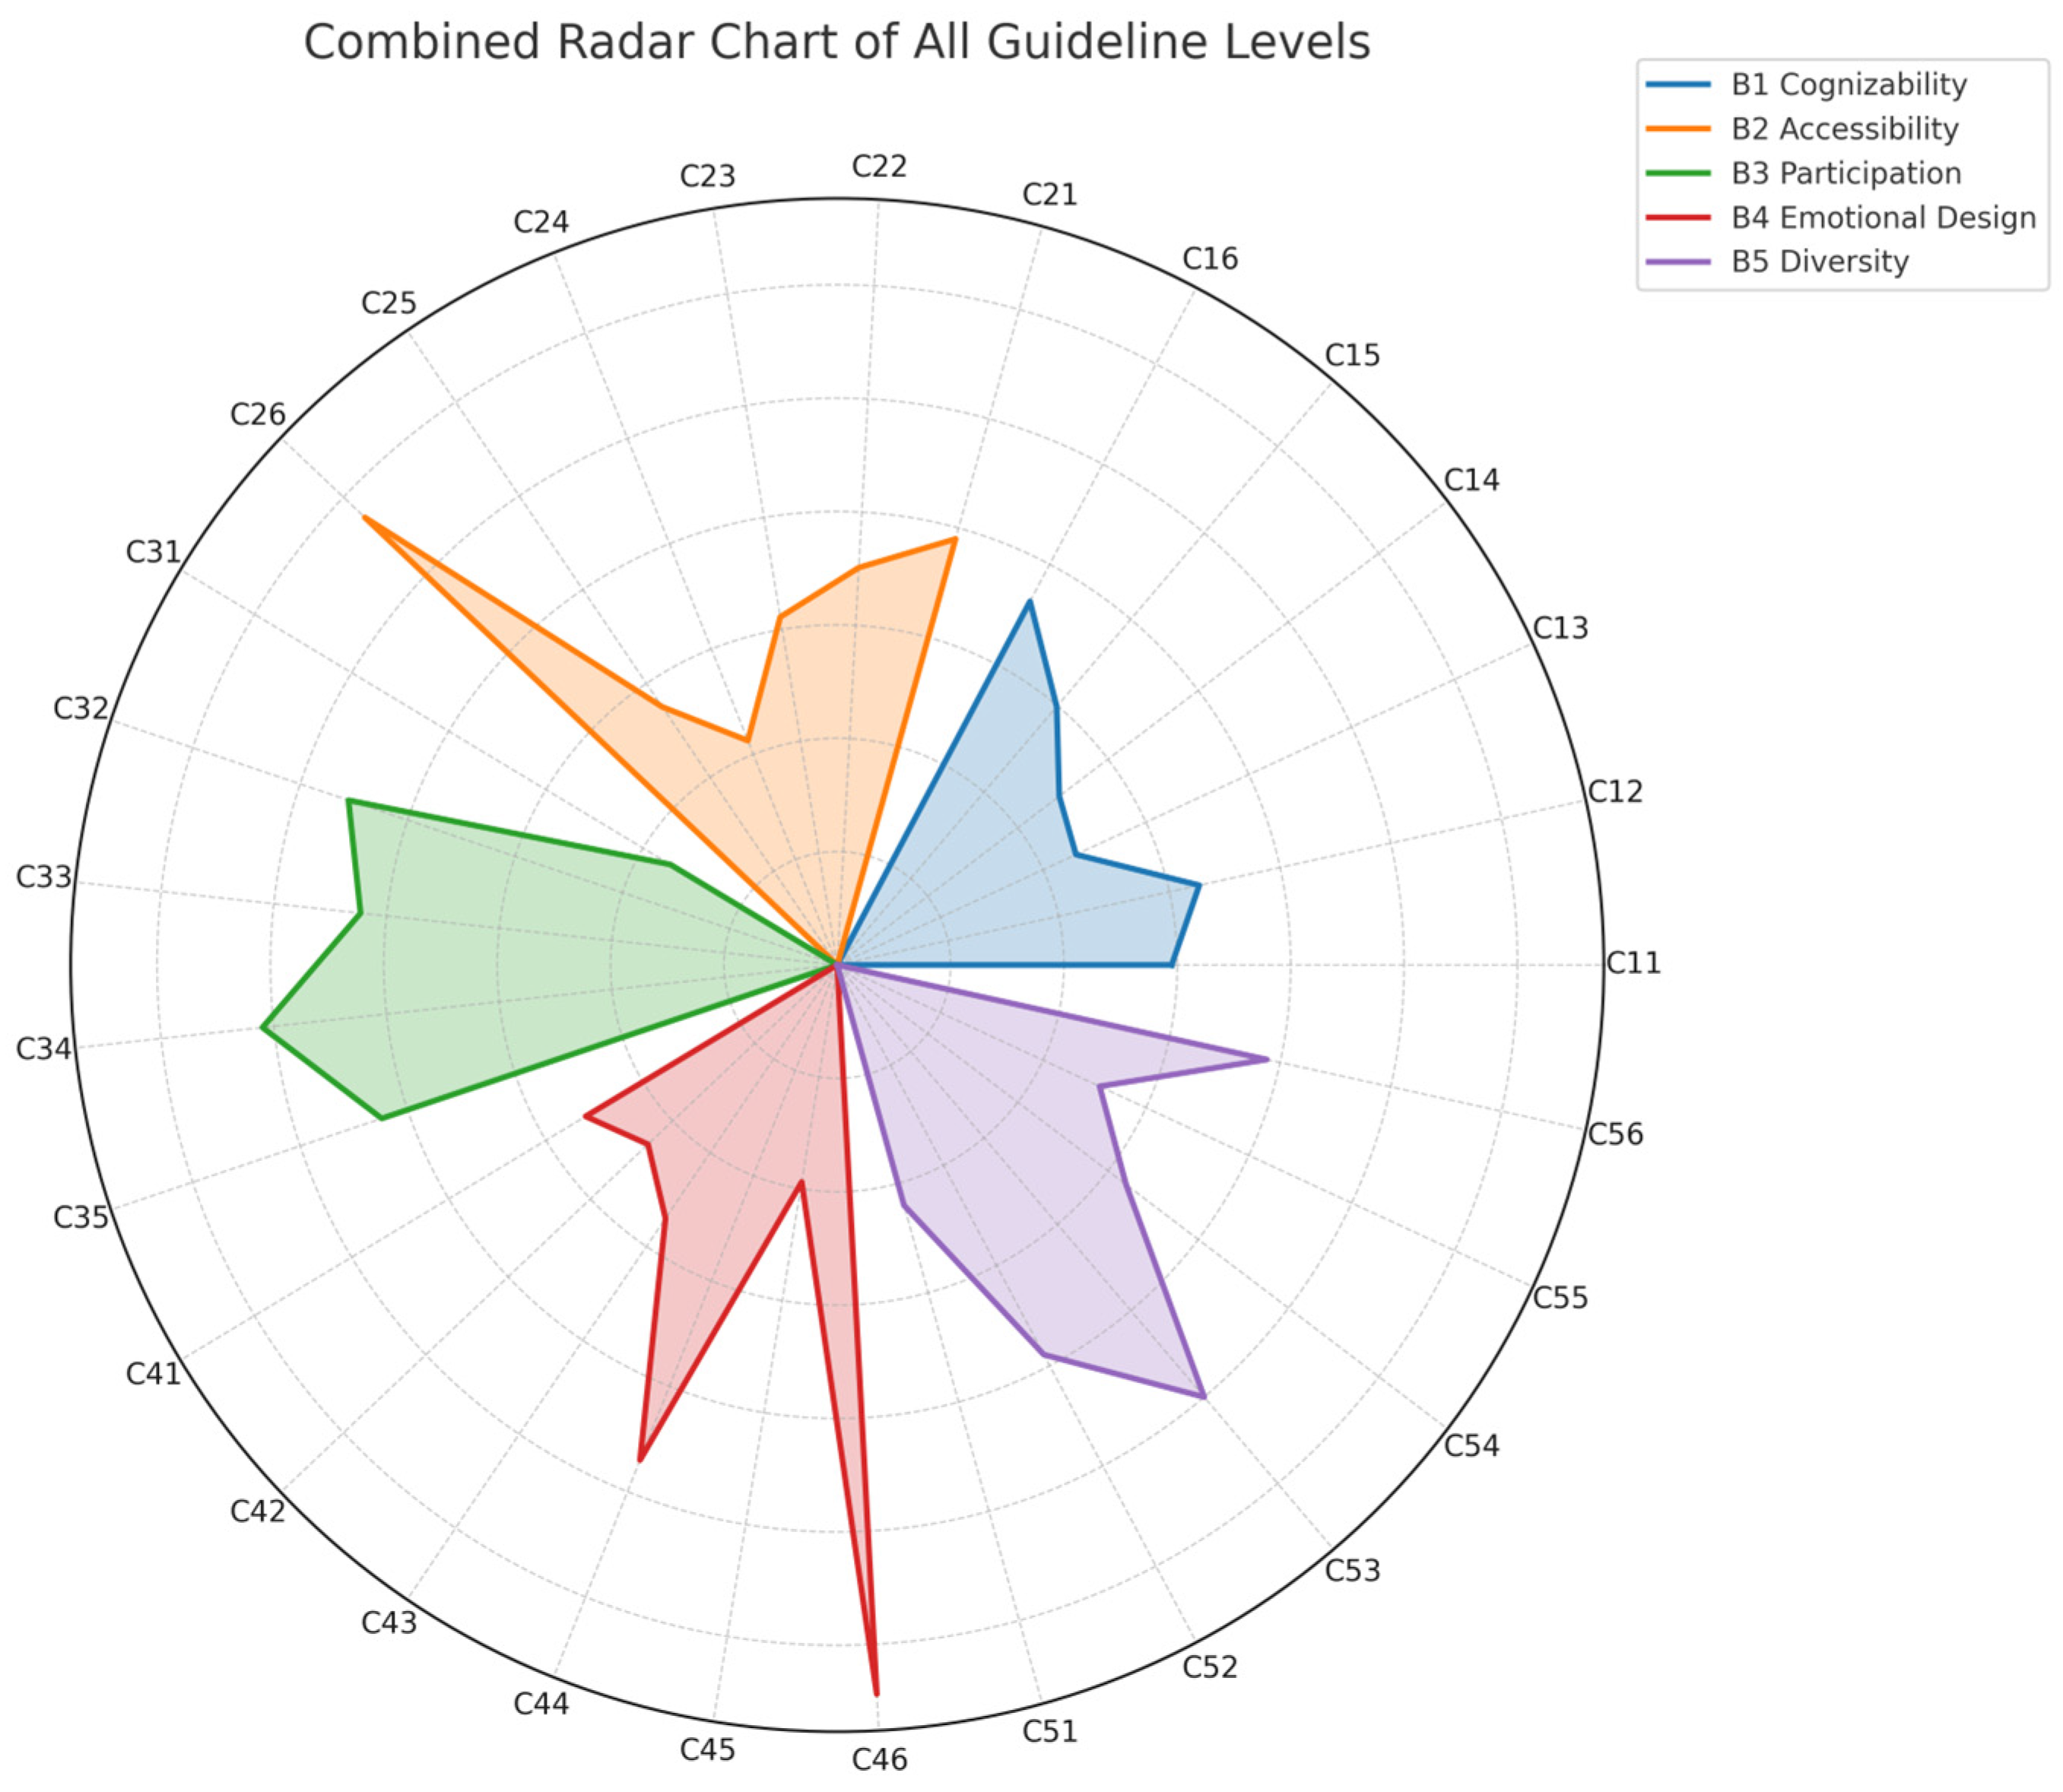
In other dimensions, the results also reflect users’ nuanced spatial perceptions, as shown in Figure 15 and Figure 16. For instance, in the Cognizability group (B1), signage visibility scored slightly higher than other indicators, demonstrating that clear and well-placed signs—especially with good lighting and size—improve space legibility and reduce cognitive load, particularly for first-time users.
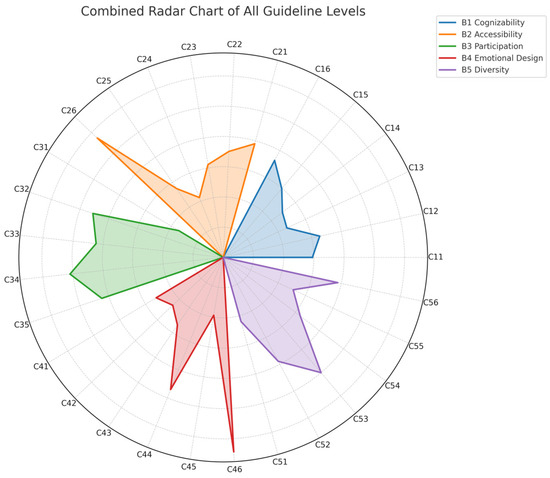
Figure 16.
Grouped visualization of combined weights for alfresco space evaluation indicators.
In the Accessibility group (B2), the locational attribute of street corners gained the highest weight, which supports Jan Gehl’s theory that open views and pedestrian flow attract more users. In contrast, middle-block locations were less appealing due to limited views and higher spatial competition.
In the Participation group (B3), internal functional permeability received relatively low weight, possibly due to limited interaction between indoor and outdoor functions in existing designs. Enhancing this linkage—e.g., integrating indoor cafés with outdoor terraces—can significantly increase spatial efficiency and vibrancy.
In the Emotional Design group (B4), lighting comfort emerged as the second-highest indicator after traffic safety, emphasizing the growing concern for nighttime usability.
Lastly, in the Diversity Design group (B5), business richness was slightly dominant. This partly explains why Shanghai’s Daxue Road, with its clustering of food, culture, and retail, is favored by young people—it not only extends stay duration and promotes social interaction but also stimulates the regional economy.
The AHP results reveal that users now place greater importance on emotional comfort and direct usability rather than symbolic or monumental spatial elements. High ratings for lighting comfort and seating facilities indicate that urban street design should pay closer attention to everyday user behavior, particularly in high-density, mixed-use neighborhoods. This aligns with Jan Gehl’s theory of people-first urbanism and reflects current public expectations for spaces that balance livability and sociability.
5.2. Design and Policy Recommendations for Alfresco Space Improvement
Based on the findings, this study proposes the following design recommendations: (1) utilize street corners and nodes to enhance visibility and attract pedestrian flow; (2) improve signage systems with clear, unified, and night-readable standards; (3) reinforce the interface between alfresco spaces and indoor programs to enhance permeability; and (4) implement buffer designs (e.g., planters and railings) to ensure street-side safety. From a policy perspective, the evaluation framework can be integrated into local alfresco management tools to guide fine-grained regulation.
5.3. Research Insufficiency and Prospect
Although the AHP–entropy combined evaluation system proposed in this study offers a replicable and structured framework for assessing alfresco street spaces, several limitations remain.
First, the evaluation is grounded primarily in static data, such as questionnaire responses and expert scoring, which restricts its capacity to reflect real-time variations in user behavior, environmental conditions, and street dynamics. The absence of dynamic data sources—such as pedestrian and vehicle flow patterns—limits the objectivity and responsiveness of the resulting weight values.
Second, methodological biases remain. The AHP method relies on expert judgment, which inevitably introduces subjectivity, while the entropy method, though quantitative, cannot fully eliminate human input. This dual limitation affects the neutrality of the composite weighting.
Third, the system does not adequately consider the dynamic evolution of commercial uses in alfresco spaces. Factors such as pop-up retail, short-term leases, or seasonal business variations are not yet integrated into the evaluation, despite their significant impact on spatial vitality and user engagement.
Fourth, certain negative externalities—particularly traffic hazards and noise pollution—are underrepresented in the current model. Their insufficient quantification undermines the comprehensiveness of the assessment and the accuracy of spatial recommendations.
To address these limitations, future research should focus on four strategic areas:
- Real-Time Data Integration: Establish a sensor-driven platform using AI-powered video analytics, Wi-Fi/Bluetooth signal tracking, and IoT environmental sensors to capture pedestrian flow, vehicular patterns, lighting levels, noise, and temperature. These data streams will support dynamic weight calibration and improve model responsiveness.
- Commercial Activity Monitoring: Incorporate web-scraped data from location-based service platforms (e.g., Meituan and Dianping, Ele.me) to track shifts in business types, user reviews, and operating hours. This will better reflect the temporal and spatial volatility of urban commercial life.
- Intelligent Evaluation Platform: Develop a digital dashboard capable of real-time visualization, cross-variable correlation (e.g., between noise and pedestrian flow), and adaptive weighting using machine learning techniques such as clustering or neural networks.
- Simulation and Scenario Testing: Construct a policy simulation module to explore the sensitivity of alfresco space performance to various factors—such as traffic regulation, lighting design, and operating hours. Comparative pilot studies in different urban typologies (e.g., TOD nodes, historic districts, and waterfront zones) will further validate the system’s scalability.
By addressing these issues, the proposed framework can evolve into a more intelligent, adaptive, and context-sensitive tool for urban street governance.
6. Conclusions
This study introduces a dual-weighted evaluation framework for urban alfresco street spaces that integrates the Analytic Hierarchy Process (AHP) with the Entropy Weight Method. The framework bridges subjective expert judgment with objective data insights, advancing the development of replicable, evidence-based tools for spatial assessment. It also contributes conceptually by systematizing the evaluation of semi-open commercial–public interfaces—an increasingly significant typology in post-pandemic, people-centered urbanism.
The results reveal several critical patterns in user preferences, particularly the heightened importance of traffic safety, spatial comfort, and functional permeability. These insights not only validate emerging design values in contemporary street planning but also provide direction for refining alfresco space design at the neighborhood scale.
This framework opens new possibilities for cross-city benchmarking and performance tracking. By applying consistent evaluation logic across different urban contexts, local governments can transition from static, rule-based spatial governance to dynamic, outcome-driven models. Such systems allow planners to better manage informal, temporary, or evolving uses of space while aligning urban design more closely with lived experience.
Additionally, this study highlights opportunities for adaptive street design strategies, including time-based vehicular control, flexible spatial boundaries, and smart signage systems. These approaches—combined with data-informed decision-making—form a scalable toolkit for responsive public space management.
Most importantly, this study calls for rethinking urban alfresco spaces as dynamic relational infrastructures that link social, economic, and environmental functions. Future research should integrate behavioral science, computational modeling, and environmental sensing to build predictive, self-adjusting systems that can respond in real time to changing urban conditions.
In conclusion, this work provides both a theoretical foundation and a practical roadmap for developing high-performing, user-centered, and data-enabled alfresco street environments. It invites broader collaboration across disciplines and cities to advance the governance and design of shared urban spaces.
Author Contributions
Conceptualization, C.L. and J.Z.; Data curation, C.L.; Investigation, C.L.; Methodology, C.L.; Software, C.L.; Validation, C.L.; Visualization, C.L.; Writing—original draft, C.L.; Writing—review and editing, C.L. All authors have read and agreed to the published version of the manuscript.
Funding
This research received no external funding.
Data Availability Statement
The original contributions presented in this study are included in this article; further inquiries can be directed to the corresponding author.
Conflicts of Interest
The authors declare no conflicts of interest.
References
- Gerike, R.; Koszowski, C.; Schröter, B.; Buehler, R.; Schepers, P.; Weber, J.; Wittwer, R.; Jones, P. Built Environment Determinants of Pedestrian Activities and Their Consideration in Urban Street Design. Sustainability 2021, 13, 9362. [Google Scholar] [CrossRef]
- Jalaladdini, S.; Oktay, D. Urban Public Spaces and Vitality: A Socio-Spatial Analysis in the Streets of Cypriot Towns. Procedia Soc. Behav. Sci. 2012, 35, 664–674. [Google Scholar] [CrossRef]
- Zhang, L.; Xu, X.; Guo, Y. Comprehensive Evaluation of the Implementation Effect of Commercial Street Quality Improvement Based on AHP-Entropy Weight Method—Taking Hefei Shuanggang Old Street as an Example. Land 2022, 11, 2091. [Google Scholar] [CrossRef]
- Row, A.T. Review of The Death and Life of Great American Cities. Yale Law J. 1962, 71, 1597–1602. [Google Scholar] [CrossRef]
- Rossi, A. The Architecture of the City; MIT Press: Cambridge, MA, USA, 1984; ISBN 978-0-262-68043-1. [Google Scholar]
- Gehl, J. Life Between Buildings: Using Public Space, 1st ed.; Island Press: Washington, DC, USA, 2011; ISBN 978-1-59726-827-1. [Google Scholar]
- Whyte, W.H. The Social Life of Small Urban Spaces; Project for Public Spaces: New York, NY, USA, 1980. [Google Scholar]
- Long, Y.; Tang, J. Advances in Large-Scale Quantitative Measurement of Urban Street Spatial Quality. Urban Plan. 2019, 43, 107–114. [Google Scholar]
- Mehta, V. Lively Streets. J. Plan. Educ. Res. 2007, 27, 165–187. [Google Scholar] [CrossRef]
- Xiao, Y.; Fang, Y.; Wang, H.; Zhu, Y. A Study on Street Evaluation Based on Sociability: A Case Study of Julu Road in Shanghai. Shanghai Urban Plan. Rev. 2022, 2022, 125–134. [Google Scholar]
- Qian, C. Insights from the Ten-Year Transformation of Daxue Road for Street Revitalization. Time + Archit. 2017, 2017, 55–61. [Google Scholar] [CrossRef]
- Shanghai Municipal Greening and City Appearance Administration. Notice on Issuing the “Guiding Opinions on Further Regulating Stall Operation Activities (Trial)”. Shanghai Munic. Gov. Gaz. 2023, 18–20. [Google Scholar]
- Hartman, L.M.; Prytherch, D. Streets to Live In: Justice, Space, and Sharing the Road. Environ. Ethics 2015, 37, 21–44. [Google Scholar] [CrossRef]
- Zheng, T.; Xu, L. Reconstruction of the Publicness of Urban Public Space from the Perspective of Spatial Justice Theory. Archit. J. 2020, 2020, 96–100. [Google Scholar] [CrossRef]
- Moughtin, J.C.; Oc, T.; Tiesdell, S. Urban Design: Ornament and Decoration, 2nd ed.; Architectural Press: Oxford, UK, 1999; ISBN 978-0-7506-4273-6. [Google Scholar]
- Commuting Mode Choice in a High-Density City: Do Land-Use Density and Diversity Matter in Hong Kong? Available online: https://www.mdpi.com/1660-4601/15/5/920 (accessed on 12 June 2025).
- Yang, J.; Wu, H.; Zheng, Y. Study on Spatial Characteristics and Optimization Strategies of Walkability of Urban Streets Based on Multi-Source Big Data: A Case Study of Nanjing Central City. Urban Plan. Int. 2019, 34, 39–41. Available online: https://kns.cnki.net/kcms/detail/detail.aspx?dbcode=CJFD&dbname=CJFDLAST2019&filename=GWCG201905005 (accessed on 5 July 2025).
- Carr, S. Public Space; Cambridge University Press: Cambridge, UK, 1992; ISBN 978-0-521-35960-3. [Google Scholar]
- Au-Yong, C.P.; Gan, X.N.; Azmi, N.F.; Zainol, R.; Mat Radzuan, I.S. Maintenance Priority towards the Features and Facilities in Malaysian Public Parks: Visitors’ Perspective versus Actual Experience. Ain Shams Eng. J. 2023, 14, 102133. [Google Scholar] [CrossRef]
- Zarghami, E.; AzhdehFar, S.; Toodeh Fallah, S. The Relationship between Urban Sidewalks Design and Psychological Sense of Security. J. Civil Eng. Urban. 2015, 5, 134–143. [Google Scholar]
- Goličnik, B.; Ward Thompson, C. Emerging Relationships between Design and Use of Urban Park Spaces. Landsc. Urban Plan. 2010, 94, 38–53. [Google Scholar] [CrossRef]
- Sun, Y.; Lu, W.; Sun, P. Optimization of Walk Score Based on Street Greening—A Case Study of Zhongshan Road in Qingdao. Int. J. Environ. Res. Public Health 2021, 18, 1277. [Google Scholar] [CrossRef] [PubMed]
- Liu, C. AHP and Entropy Method Data Supporting the Evaluation of Urban Street Alfresco Space on Daxue Road, Shanghai 2025. Available online: https://zenodo.org/records/15819422 (accessed on 7 August 2025).
- Saaty, R.W. The Analytic Hierarchy Process—What It Is and How It Is Used. Math. Model. 1987, 9, 161–176. [Google Scholar] [CrossRef]
- Yin, P.; Cheng, J.; Peng, M. Analyzing the Passenger Flow of Urban Rail Transit Stations by Using Entropy Weight-Grey Correlation Model: A Case Study of Shanghai in China. Mathematics 2022, 10, 3506. [Google Scholar] [CrossRef]
- Dumbaugh, E.; Rae, R. Safe Urban Form: Revisiting the Relationship Between Community Design and Traffic Safety. J. Am. Plan. Assoc. 2009, 75, 309–329. [Google Scholar] [CrossRef]
Disclaimer/Publisher’s Note: The statements, opinions and data contained in all publications are solely those of the individual author(s) and contributor(s) and not of MDPI and/or the editor(s). MDPI and/or the editor(s) disclaim responsibility for any injury to people or property resulting from any ideas, methods, instructions or products referred to in the content. |
© 2025 by the authors. Licensee MDPI, Basel, Switzerland. This article is an open access article distributed under the terms and conditions of the Creative Commons Attribution (CC BY) license (https://creativecommons.org/licenses/by/4.0/).

