Article

The Economics of Adaptive Reuse—Comparative Cost Analysis of Revitalization vs. Demolition and Reconstruction at Radex Park Marywilska

1
Department of Building Engineering, Warsaw University of Technology, 00-637 Warsaw, Poland
2
Institute of Robotics, Information Technologies and Communication Research (IRTIC), University of Valencia, 46980 Valencia, Spain
3
SEJ-609 “AMIKO” Research Group, University of Granada, 18071 Granada, Spain
*
Author to whom correspondence should be addressed.
Buildings 2025, 15(16), 2828; https://doi.org/10.3390/buildings15162828
Submission received: 8 July 2025 / Revised: 1 August 2025 / Accepted: 6 August 2025 / Published: 8 August 2025
(This article belongs to the Section Architectural Design, Urban Science, and Real Estate)

Abstract

The revitalization of post-industrial areas has emerged as a critical strategy for sustainable urban development, achieving a balance between economic, social, and environmental priorities. This study assesses the transformative capacity of revitalization strategies by conducting a comprehensive case analysis of “Radex Park Marywilska” in Warsaw, Poland. The analysis quantifies the benefits of revitalization in comparison to demolition and new construction methodologies. An examination of the revitalization initiative demonstrates that it yielded a total of PLN 41.15 million in benefits, with PLN 28.13 million attributed to direct cost savings and another PLN 13.02 million resulting from environmental improvements. In practical terms, this equates to a return of PLN 1.93 for every PLN 1 invested—a notably efficient outcome. The project transformed four industrial buildings, significantly increasing usable space in some (e.g., Building L1 by 345% and K1 by 21.6%) while slightly reducing it in others (B1 by 4.7% and I1 by 10.5%). From an environmental impact perspective, the success was staggering: 48,217 tons of carbon dioxide emissions were prevented, and 72,315 tons of building waste were diverted from landfills. To these figures, the study further adds a return in economic activity, the generation of new jobs, and improvement in local infrastructure. The retrofitting of historical buildings to contemporary standards has encountered numerous challenges; nonetheless, the implementation of circular economy principles has succeeded in negating such challenges. Generally, the results show economic, environmental, and social benefits of revitalization projects compared to new, greenfield projects. The case study provides valuable lessons to policymakers and urban planners, rendering adaptive reuse a fundamental approach in achieving sustainable urban development.

1. Introduction

The revitalization of post-industrial areas has emerged as a critical strategy for sustainable urban development, particularly in Central and Eastern Europe (CEE), where industrial heritage frequently exists alongside economic stagnation and environmental degradation [1,2]. Although the theoretical benefits of adaptive reuse are widely recognized [3,4,5,6,7], gaps remain in systematically quantifying its advantages over demolition and new construction approaches. This study addresses these dual challenges—both contextual, such as economic–environmental tensions in CEE, and methodological, such as the lack of quantification frameworks—through an in-depth case study of Radex Park Marywilska in Warsaw, Poland. It can be seen that revitalization is a strategic necessity for sustainable urban change, not just an option, through cost comparisons and life-cycle assessments (LCAs). Analytical tools offer key measures, like the Savings Ratio, which allow policymakers to find a middle ground between protecting heritage and making money. The redevelopment of Warsaw’s Białołęka area shows how tough it is to balance keeping historical value and pushing urban growth. While existing studies, including the work of Rząsa and Ogryzek [8], document successful revitalization projects, the literature still lacks robust frameworks explaining the comparative advantages of adaptive reuse over demolition. To address these dual challenges—both contextual (economic–environmental tensions in CEE) and methodological (missing quantification frameworks)—this study introduces the “revitalization advantage” (ΔC + ΔEnv, i.e., the sum of direct cost savings and environmental benefits), a core metric combining direct cost savings (ΔC) and environmental benefits (ΔEnv). We pursue three specific aims: (1) develop a standardized Savings Ratio (revitalization advantage/revitalization costs) to compare adaptive reuse and demolition, (2) quantify region-specific environmental gains (CO2 and waste reduction), and (3) validate the model through the Radex Park Marywilska case study. These aims address two research questions, namely:
RQ1: How do the financial and environmental costs of adaptive reuse compare to new construction in post-industrial CEE contexts?
RQ2: What key principles enable successful revitalization projects to balance structural and functional integrity with adaptive flexibility and phased risk management while maximizing measurable revitalization benefits?
The practical implications of these questions are addressed in the present study, which provides concrete evidence that the revitalization of four key buildings (L1, K1, B1, and I1) resulted in 56.95% direct cost savings (PLN 28.13 million) compared to new construction, with a Savings Ratio of 1.93—indicating a 93% return on investment through combined financial and environmental benefits. The environmental advantages proved equally compelling, with preservation avoiding 48,217 tons of CO2 emissions and 72,315 tons of waste, while incorporating region-specific emission factors (see Section 3 and Section 4).
Methodologically, this study advances existing knowledge by presenting the detailed theoretical and mathematical foundations for calculating key indicators, such as the revitalization advantage and the Savings Ratio (in Section 3.2, “Mathematical Modeling of Revitalization vs. New Construction Costs”). For the project, the revitalization advantage amounted to PLN 41.15 million, and the Savings Ratio was 1.93. These figures serve as practical benchmarks for policymakers, indicating the consistent cost-effectiveness of revitalization across different functional adaptations. The study enriches the analysis by comparing revitalization outcomes with market data, such as actual rental rates and capital enhancement figures, offering a practical perspective. The mathematical model employed in this study is predicated on Polish market data from 2005 to 2010, which were sourced from reliable entities such as the Central Statistical Office (Główny Urząd Statystyczny, GUS), the National Bank of Poland (Narodowy Bank Polski, NBP), and the Ministry of Infrastructure (Ministerstwo Infrastruktury, MI). The report also includes environmental cost calculations based on Environmental Product Declarations (EPDs). These declarations are standards made by the Polish Committee for Standardization (Polski Komitet Normalizacyny, PKN) and the European Committee for Standardization (Comité Européen de Normalisation, CEN). The report also includes emission inventories from the National Centre for Emissions Management (Krajowy Ośrodek Bilansowania i Zarządzania Emisjami, KOBIZE) to ensure data accuracy over time and across locations.
The Radex Park Marywilska case study highlights three key principles with broader relevance. First, it showcases functional flexibility—for instance, Building L1 gained 345% more space, while K1 increased by 21.6%, demonstrating that adaptive reuse can achieve significant gains. Meanwhile, Buildings B1 and I1 optimized their layouts despite slight reductions (4.7% and 10.5%, respectively), proving that adaptability often outweighs the benefits of demolition [9,10]. Second, the project aligns with circular economy principles, with modernized Heating, Ventilation, and Air Conditioning (HVAC) systems reducing operational emissions by 40%. Third, it achieved significant community impact by creating many new jobs while preserving historical identity, supporting existing theories about social capital preservation [11].
The article is structured to systematically present these findings. Section 2 reviews theoretical advantages of adaptive reuse, with particular emphasis on cost–environment tradeoffs. Section 3 details the methodological approach, including the case study context and cost modeling equations. Section 4 presents direct cost comparisons for the four focus buildings (i.e., L1, K1, B1, and I1), selected for their complete datasets and consistent revitalization timelines. Section 5 (Discussion) provides critical analysis of key tradeoffs, while Appendix A enhances methodological transparency by including photographic documentation (Figure A1, Figure A2, Figure A3, Figure A4, Figure A5, Figure A6, Figure A7, Figure A8 and Figure A9) of pre- and post-revitalization states, alongside two tables (Table A1 and Table A2) presenting a comparative analysis of estimated versus actual post-intervention values, such as rental income and value uplift (ΔP), based on data from Radex Park Marywilska.
The study shows that although renovation projects do not always work because building styles and purposes differ, they still help revive old industrial zones. The research gives specific advice to leaders: focus on saving old materials to meet EU circular economy targets and use regular measures like the Savings Ratio to judge how well projects do. It suggests a flexible urban renewal plan that fits different places, mixing clear numbers with local awareness. This complete method helps make choices that balance money, nature, and society, pushing for fairer, lasting city growth.

2. Literature Review

Revitalization of post-industrial areas is a critical strategy in contemporary urban planning, aligning with principles of sustainable development [12] and adaptive reuse [3,4,13]. This approach transforms derelict industrial sites into functional spaces that deliver economic, social, and environmental benefits [14], while preserving historical structures and integrating modern functionalities [15]. Compared to demolition and new construction, revitalization minimizes waste [16], reduces carbon emissions [12,16], and maintains cultural heritage [4]. For example, Hu and Świerzawski’s [6] life-cycle assessment of adaptive reuse projects in Zabrze, Poland, demonstrated an 82% reduction in global warming potential. These advantages are further reinforced by circular economy principles [17,18], positioning revitalization as a tool to combat urban sprawl and optimize land use. Real-world examples like Lyon’s Confluence district [19,20] and Amsterdam’s Buiksloterham [21] demonstrate these benefits in action, showcasing how industrial zones can be repurposed into sustainable mixed-use spaces. Similarly, projects in Łódź [22] and St. Petersburg [23] highlight the cultural and economic potential of adaptive reuse, while Germany’s Landschaftspark Duisburg-Nord [24,25] exemplifies the transformation of industrial sites into green public spaces.
The environmental case for revitalization is robust. Studies show that building retrofits can reduce greenhouse gas emissions by up to 24% over a structure’s life cycle [26], with renovation projects exhibiting lower global warming potential than new construction, even when accounting for material recycling [27,28]. Adaptive reuse avoids the energy-intensive processes of demolition and new construction, achieving dramatic carbon reductions [29] and cutting construction waste by about 40–60% [12,30]. Innovative construction waste utilization further reduces landfill dependence [31], while extending building lifespans minimizes waste generation [32]. Caroon [33] emphasizes that building reuse offers immediate environmental benefits, whereas new “green” buildings require 10–20 years to offset their construction footprint.
Economically, revitalization stimulates local economies through investment attraction, property value increases, and job creation [2,14]. Projects like London’s Kings Cross and Hamburg’s HafenCity illustrate how industrial zones can evolve into thriving mixed-use developments while preserving historical character [34,35]. In post-socialist contexts like Poland, abandoned factories and mines present unique challenges, including contamination and unclear ownership [36,37,38,39,40], yet EU funding [41] and policies like Poland’s Urban Regeneration Law (2015) provide frameworks for remediation [41,42]. Adaptive reuse often proves more cost-effective than new construction by eliminating demolition expenses and leveraging existing infrastructure [12,43]. It is also important to note that targeted policies have greatly improved the economics of revitalization. For instance, the U.S. Historic Tax Credit (HTC) program generates USD 1.25 in tax revenue for every USD 1 invested [44], demonstrating how policy incentives can enhance financial viability. Fealy [43] and Fournier and Zimnicki [45] underscore the financial efficiency of reusing structures, while Browne [46] demonstrates through examples how “adaptive reuse of landmark buildings… draws a bigger market for their use”.
Revitalization fosters social integration and community identity by preserving tangible connections to heritage [47]. Successful projects, such as Germany’s Ruhr Valley [48,49], transform polluted sites into vibrant public spaces while creating jobs. Mixed-use developments enhance walkability and social connectivity [50], as seen in Battersea Power Station’s renewal [51,52], which balances modernity with historical essence. However, challenges like gentrification must be addressed through inclusive policies to prevent displacement of longtime residents [53,54]. These challenges mirror contemporary debates in cities like Madrid, where rapid revitalization of post-industrial areas has sometimes led to displacement pressures, underscoring the need for inclusive policies that protect existing communities while enabling sustainable regeneration [55,56]. Community-centric design processes are essential to balance modernization with authenticity, avoiding superficial “facadism” [57]. The preservation of “genius loci” in projects like Łódź’s factory conversions [22] or the Sevkabel Factory in St. Petersburg [23] reinforces neighborhood identity, while Rodopoulou’s [57] critique of commodification reminds planners to prioritize community needs.
Despite its advantages, revitalization faces obstacles, especially in post-socialist regions such as Poland, where bureaucratic complexities and reliance on EU funding slow progress [41,58]. Wojnarowska [59] highlights how EU-inspired brownfield policies combat urban sprawl, while Gorgoń [60] and Gorblyuk [61] stress that these policies aim for long-term resilience and sustainability. Site contamination and unclear ownership further complicate redevelopment [62]. EU policies, such as the Brownfield Redevelopment Guidelines, promote adaptive reuse to reduce landfill waste by 40% and retain 60–80% of a building’s original structure, dramatically reducing the carbon-intensive production of new materials [30]. Similarly, Poland’s Urban Regeneration Law (2015) emphasizes community input and integrated renewal [42]. In cases where contamination renders reuse impractical, selective deconstruction [63] or a complete demolition [64] may be necessary, though material recovery can still mitigate environmental harm [65]. It is important to note that the careful dismantling of old buildings is essential for their reuse and revitalization, which are crucial for environmental conservation. This approach entails the meticulous salvaging and repurposing of valuable materials, such as steel and brick, with the objective of reducing landfill waste by 45% to 70% [65].
The adaptSTAR model [66] confirms that adaptive reuse reduces life-cycle costs by 30–40% compared to retrofitting or rebuilding. Conejos and Langston [67] further validate its long-term cost efficiency, while Kohler and Yang [68] and Bullen and Love [69] note its time and resource savings. Langston’s research [70,71] highlights an 80% reduction in CO2 emissions, supported by Itard and Klunder’s [72] findings on avoided material extraction impacts. Andreucci and Karagözler [73] note a 25–40% increase in community engagement, and Grecchi [74] documents how 78% of projects integrate historical elements into contemporary functions. Even when structural damage or contamination necessitates demolition, selective deconstruction can recover 45–70% of materials, reducing landfill dependence [65] and supporting circular economies [75]. This approach also boosts employment in salvage industries by 20–30% [76], aligning with broader sustainability goals.

3. Materials and Methods

3.1. Location and Historical Context. Rehabilitation Site at St. Marywilska in Warsaw, Poland

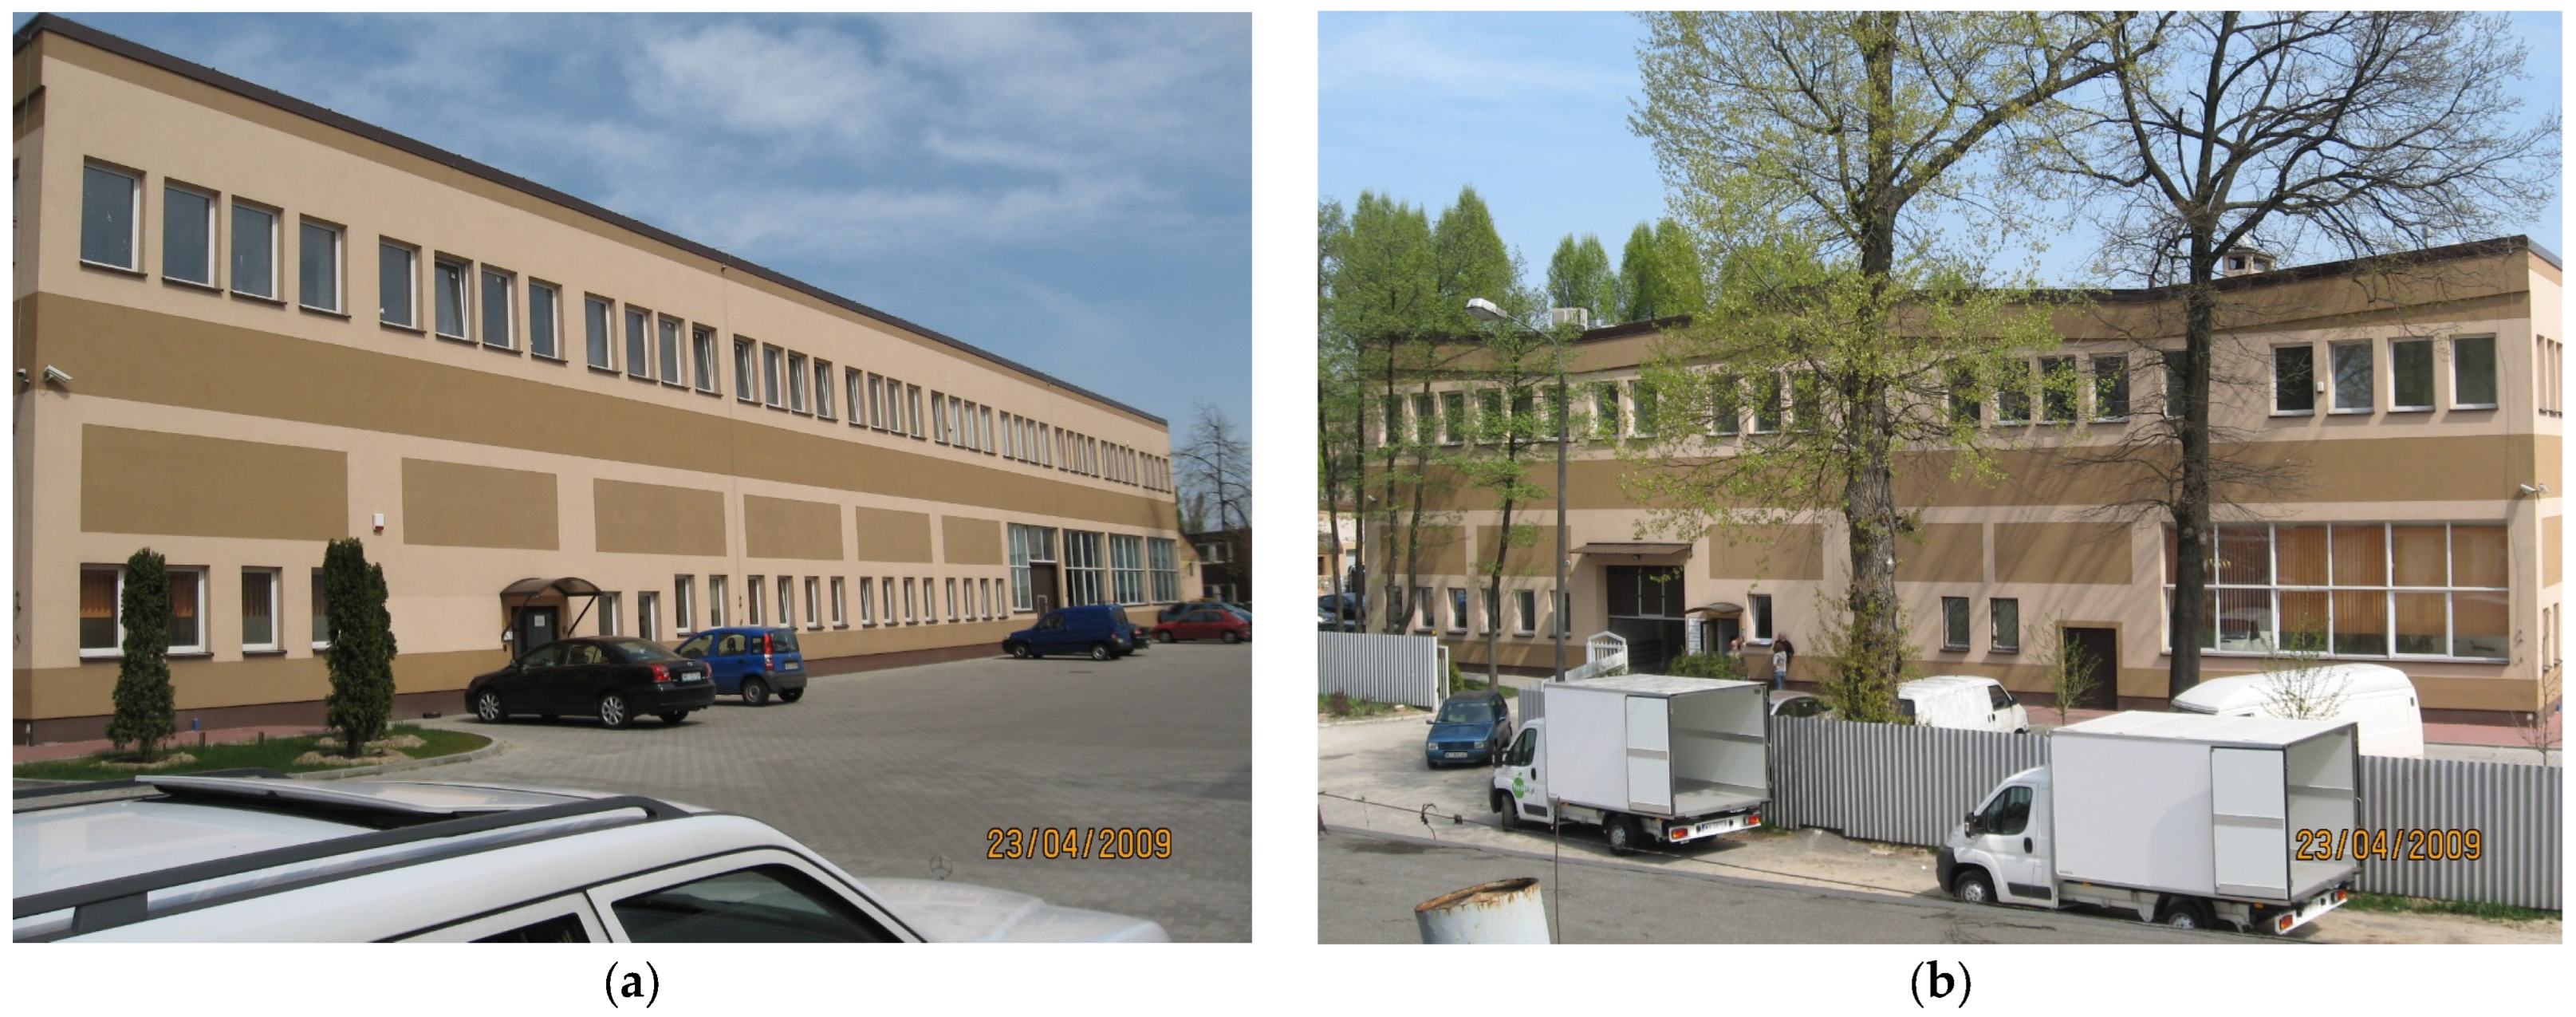
The adaptive reuse transformation of a post-industrial site into a mixed-use office and logistics complex was implemented in Warsaw’s Białołęka District at Marywilska Street between 2005 and 2010. The subject area, previously characterized by intensive industrial operations, comprised structures originally constructed in the 1960s (Figure 1).
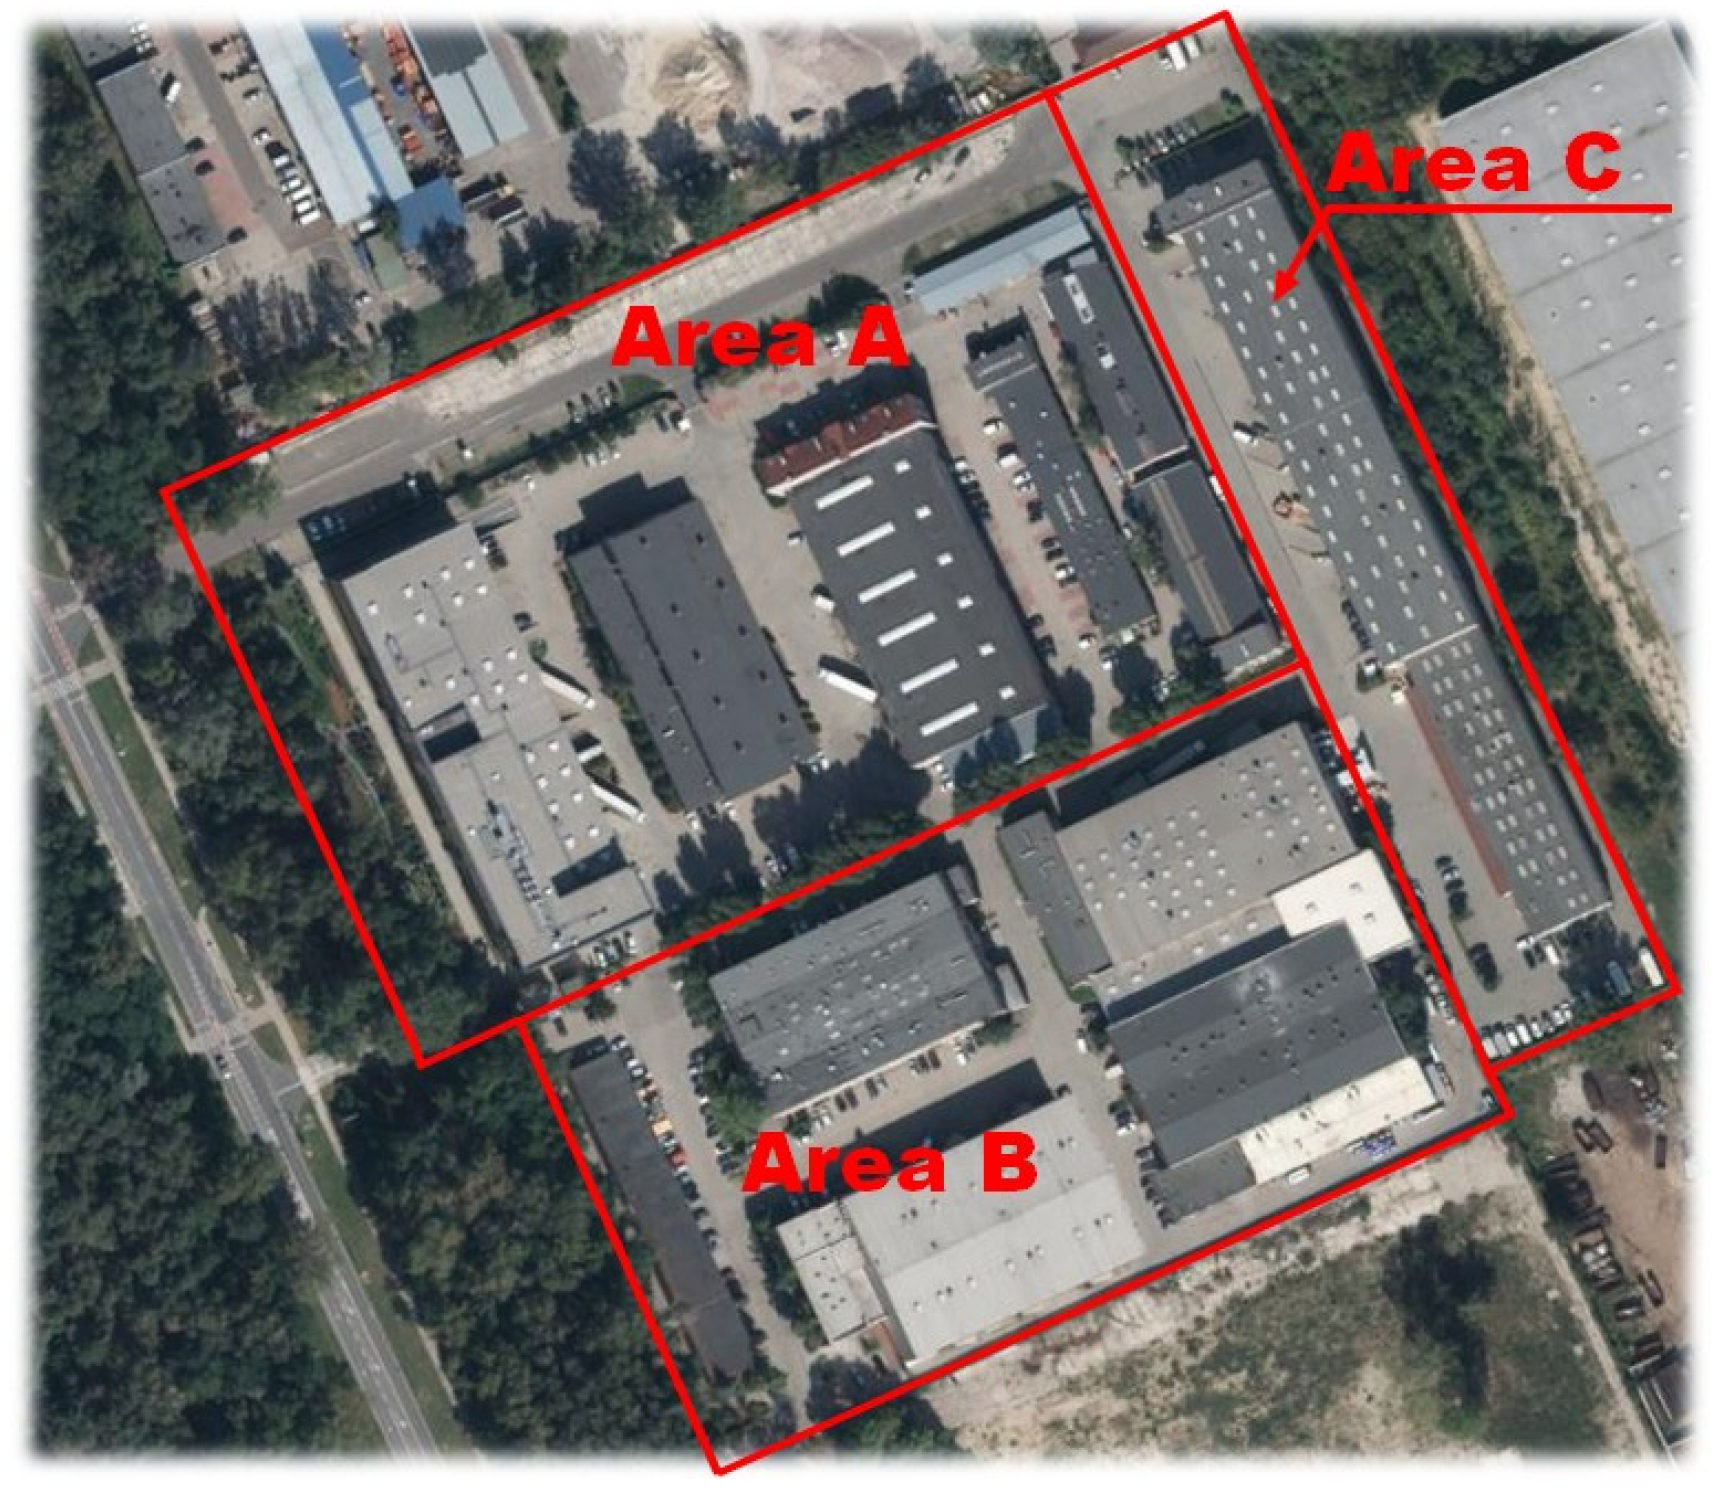
Historically, the site included the following (see Figure 2):
  • Area A: A former concrete batching plant, a deteriorated fuel station, and underground storage tanks, purchased in 1994 from Transcembet (Warsaw, Poland).
  • Area B: The site of the Warsaw Pump Factory (Wafapomp, Warsaw, Poland), operational since 1962, acquired in 2004. The buildings were heavily degraded, lacking proper insulation and featuring outdated infrastructure.
  • Area C: Acquired in 2001 from the Białołęka Municipality, designated for new production and warehouse facilities.
Figure 3 presents a schematic map of Radex Park Marywilska in Warsaw’s Białołęka District, precisely locating the four revitalized industrial buildings included in this study, i.e., L1, K1, B1, and I1. The spatial distribution reflects their original functional relationships within the historic industrial complex, with Buildings K1 (3343.1 m2) and I1 (3986.5 m2) dominating the northern sector, while the smaller L1 (2695 m2) and B1 (2124 m2) occupy the southern area.
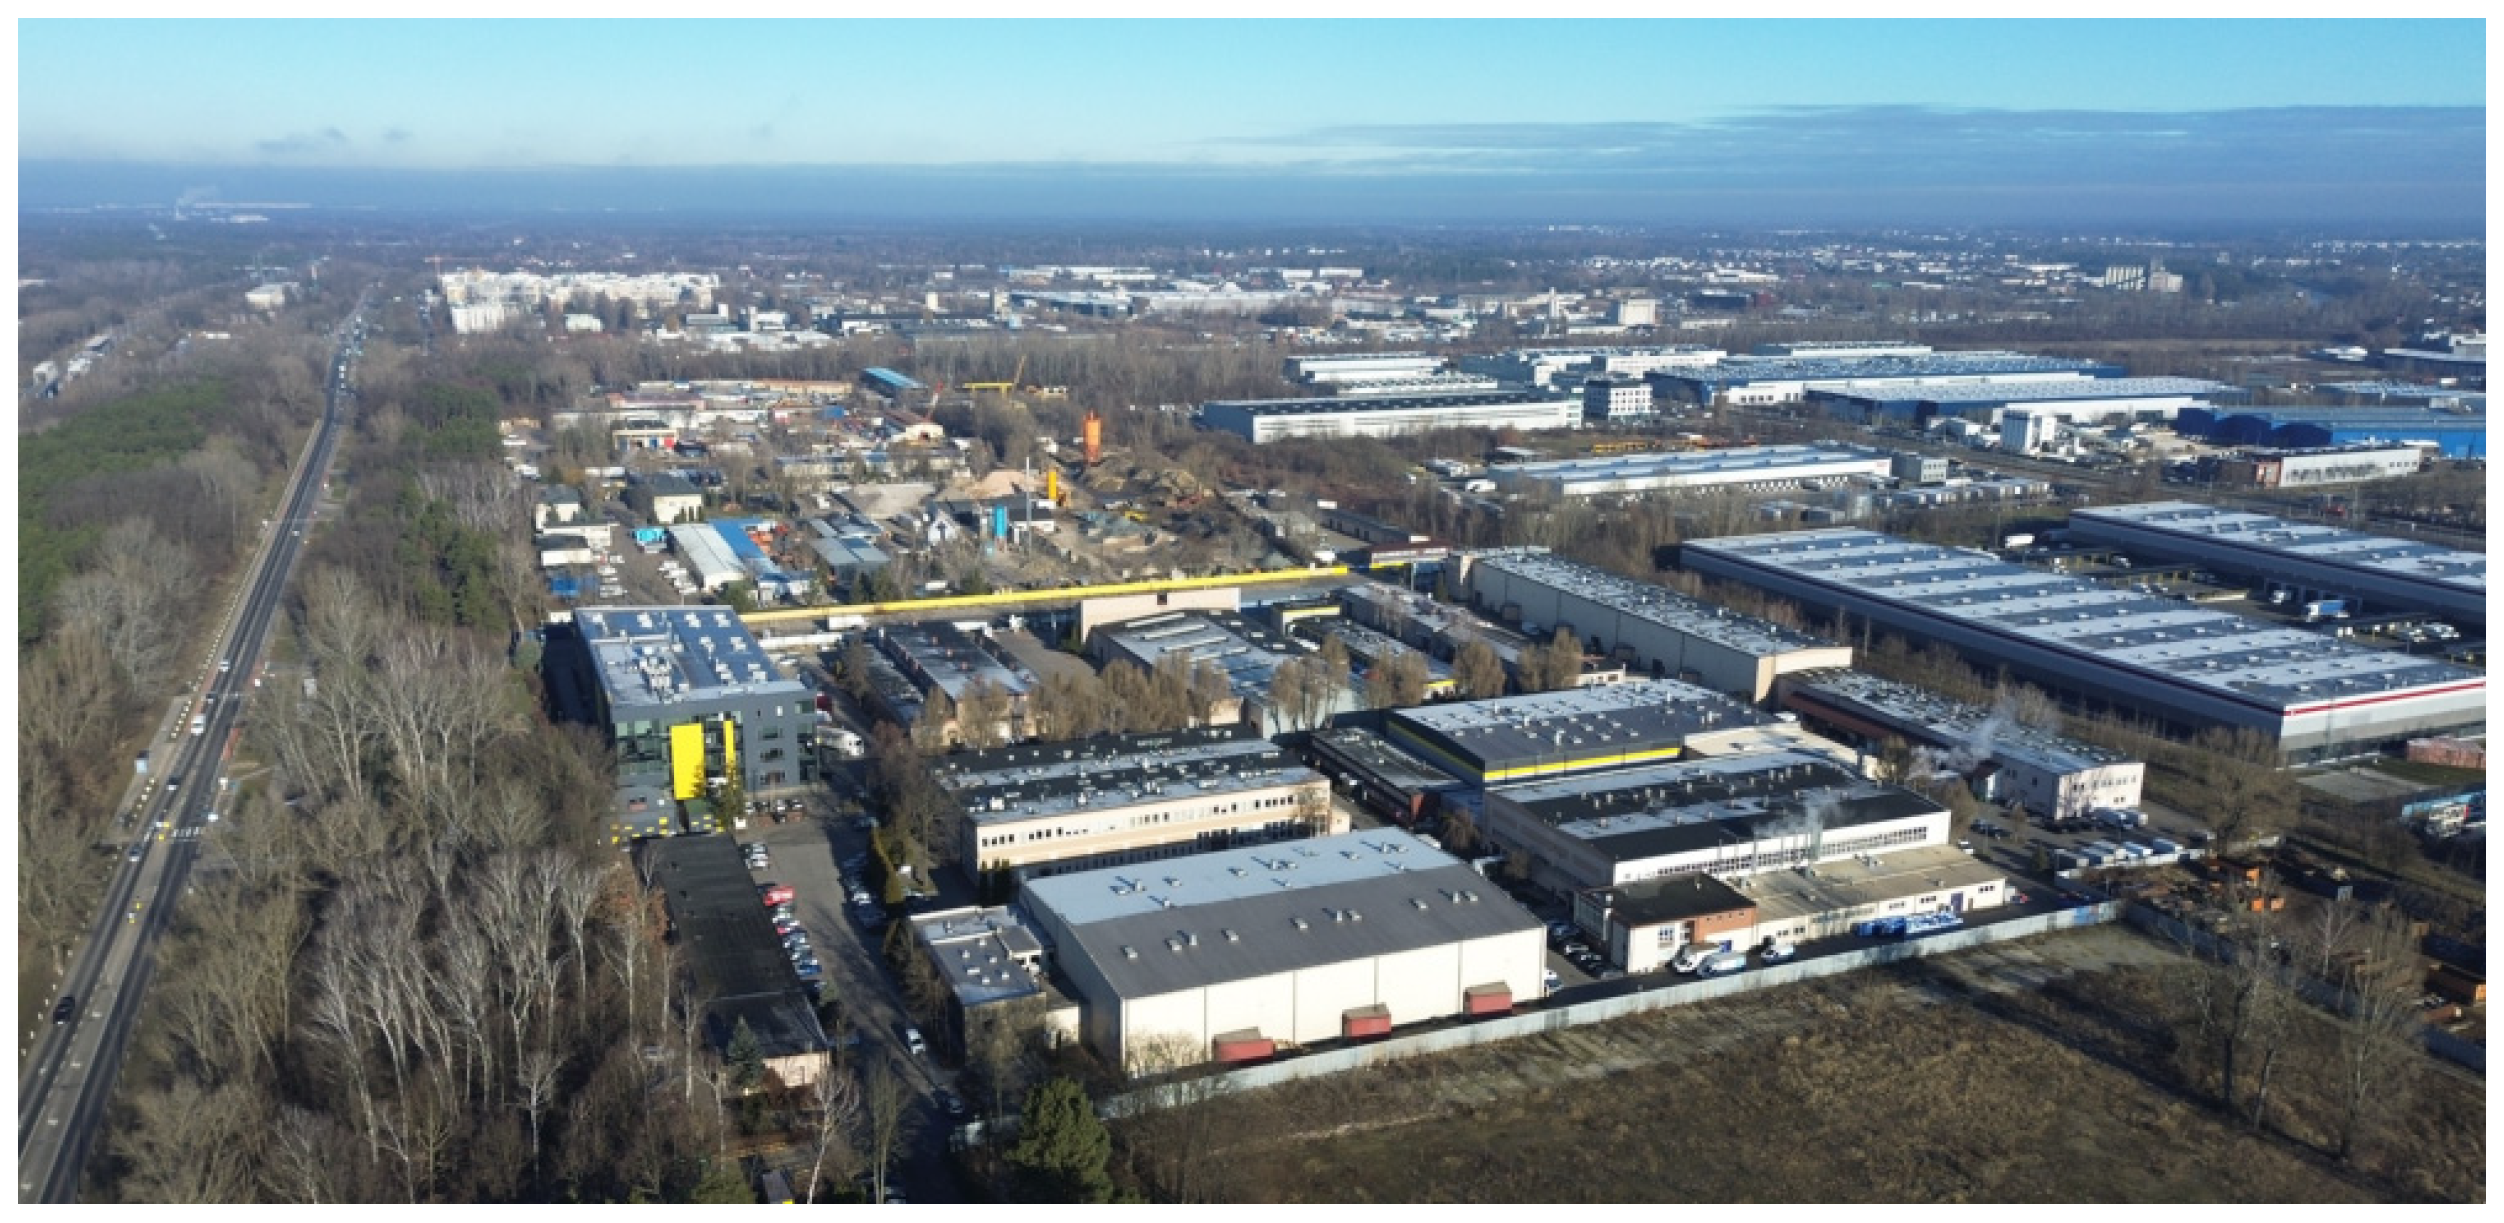
Figure 4 provides aerial photographic documentation of the site’s post-revitalization state. It captures how adaptive reuse interventions preserved the industrial character of the site while introducing contemporary functional adaptations.
The revitalization process encompassed a complex of post-industrial buildings (L1, K1, B1, and I1) that were thoroughly modernized and adapted for new functions. Detailed data on the revitalized structures are presented in Table 1.
A closer look at Table 1 reveals a diverse set of four industrial buildings, each with its own characteristics and scope of revitalization. Usable floor areas span a considerable range—from 605.2 m2 in Building L1 up to 4452 m2 for Building I1—while volumes vary from 1865 m3 to as much as 27,076 m3. These quantitative details set the stage for understanding the scale and complexity of the renovation efforts required. Before any renovation work began, these structures were in noticeably poor shape: structural wear, obsolete utilities, and inadequate thermal insulation were recurring issues (not an uncommon scenario in similar projects). Given these significant deficiencies, comprehensive renovations were imperative. The renovated structures were reinforced with structural supports, updated electrical and plumbing systems, and new roofs and windows. A variety of work requirements were observed at each location. Building I1, due to its size, needed more comprehensive upgrades to ensure safety and usability. Building K1 combined modernization with expansion, with insulation and new technical systems added.
To accurately assess the extent and impact of these renovations, it is important to emphasize that this study relied exclusively on quantitative engineering and economic data (e.g., material volumes, cost benchmarks, and CO2 emission factors). No subjective surveys—whether social or technical—were conducted. The Warsaw University of Technology and court-appointed experts conducted standardized measurements of building volumes, material quantities, and structural parameters using laser scanning (for key dimensions) and archival documentation (for original specifications). All quantitative data were cross-verified against construction blueprints and Polish industry norms (e.g., PN-ISO 9836 for volume calculations [77]). This rigorous approach ensured objective, reproducible data devoid of subjective bias.
Building upon the quantitative foundation, the main goal was to preserve the structural elements of the buildings that met modern standards and adapt them to align with prevailing regulations. Energy expenditure was reduced by implementing insulation and installing new windows. The work extended beyond the interiors. Outdated infrastructure was replaced, and accessibility was improved, particularly for people with disabilities. The surrounding area was developed with new public spaces, roads, and parking lots with space for 500 cars and 30 trucks, as well as a fire protection pool. Plans for the site included converting an office warehouse into a primary school and creating a mixed-use complex in line with the “productive city” model. Green areas were designed to connect the site to the Żerański Canal and enhance environmental quality.
This integrated approach—combining preservation, modernization, and site redevelopment—illustrates how this project shows that old industrial sites can be maintained while meeting modern functional and environmental requirements. When managed effectively, such areas can evolve into vibrant, multiuse spaces that catalyze enduring urban expansion.

3.2. Mathematical Modeling of Revitalization vs. New Construction Costs

A mathematical generalization of costs and benefits provides a structured framework for evaluating the economic viability of revitalizing industrial buildings compared to new construction. The analysis begins by decomposing the costs of revitalization (CR) into three primary components: modernization (CM), space adaptation (CA), and technical system upgrades (CS). These can be expressed as follows:
C R = C M Core   modernization ( structural   repairs , functional   upgrades ) + C A Space   expansion ( layout   reconfiguration ) + C S Technical   systems ( c i : MEP   installations c t : building   envelope C s = c t + c i )
Building upon Equation (1) and letting A p r e and A p o s t denote the pre- and post-revitalization floor areas, respectively, the operational cost model becomes
C R = A pre × c m C M + max ( A post A pre , 0 ) × c a C A + A post × ( c i + c t ) C S
Complementarily, the costs of construction, CC, from scratch include demolition, waste removal, and the construction of new buildings, and can be expressed as
C C = C D Demolition + C W Waste   removal + C B New   construction
Building upon Equation (3) and introducing the pre-demolition building volume, V p r e [m3], with its associated unit demolition costs, c d [PLN/m3], for structural dismantling and waste removal, c w [PLN/m3], for material disposal, as well as the post-construction floor area, A p o s t [m2], and unit construction costs, c b [PLN/m2], for core building systems, the operational model formalizes each cost component as follows:
C C = V pre × c d C D + V pre × c w C W + A post × c b C B
For comparative purposes, the model assumes identical finishing elements (interior partitions and surface treatments) in both revitalization and new construction scenarios. This simplification narrows the focus of the analysis to the differential costs of structural adaptation versus complete rebuilding, enabling methodological practicality for initial feasibility estimations—an approach particularly valuable during early project evaluations.
To directly compare the costs of adaptive reuse with those of construction from scratch, the cost difference index ( Δ C ) is introduced:
Δ C = C C C R
A positive value for Δ C indicates that construction from scratch is more expensive than revitalization, justifying the latter from an economic standpoint.
Beyond costs, the economic benefits of revitalization, B E , can be expressed as the difference between the added value generated by revitalization and the revitalization costs; that is, the net economic benefit, B E , of revitalization is expressed as
B E = V R Added   value ( property   appreciation , rental   income ) C R Revitalization   cost ( Equation (2) )
The total added value, VR, from revitalization decomposes into two theoretically grounded components:
  • Capital appreciation ( Δ P × A post ), where Δ P denotes the unit price increase per square meter [PLN/m2] post-revitalization and A p o s t is the revitalized floor area [m2];
  • Discounted future income ( t = 1 T R t ( 1 + r ) t ), comprising
    R t : Net rental income in year ( t ) [PLN/year];
    r : Discount rate reflecting time value of money [decimal, 0 < r < 1];
    T : Project lifetime [years].
This yields
V R = Δ P × A post Property   appreciation ( hedonic   pricing ) + t = 1 T R t ( 1 + r ) t Discounted   rental   income ( DCF   model )
More specifically, ΔP quantifies post-revitalization price premiums in Central Europe. For example, Marcinkowska et al. [78] documented a 27.5-fold nominal price increase for tenement houses in Wrocław (1991–2009), a surge driven by post-communist market liberalization and scarcity-induced speculation. By 2009, revitalized tenements achieved 67% of new-build valuations, a remarkable recovery given their dilapidated pre-intervention state, while proving 86% more cost-effective than demolition due to avoided reconstruction costs. This near-parity with new construction values, achieved at lower capital expenditure, validates Kruijt’s economic model [79,80], which posits revitalization’s superior cost–benefit ratio. The residual 33% valuation gap (100–67%) reflects three key factors: (1) lower capital inputs, as revitalization bypasses 30–50% of new construction costs (e.g., demolition and foundations) [78]; (2) cultural capital premiums, meaning that heritage value generates unique appreciation that is irreplicable in new builds; and (3) risk mitigation, since adaptive reuse reduces planning uncertainties and construction delays [78]. Marcinkowska et al.’s technical–economic analysis [78] further corroborates this, demonstrating revitalization’s higher net present value (NPV) through
56% slower physical deterioration of load-bearing structures post-intervention;
25+ years of extended service life;
Captured land value appreciation via reuse.
Thus, while absolute prices of revitalized properties may remain slightly below those of new builds (the observed 86% ratio), their total economic return, accounting for lower investment costs and preserved heritage value, consistently outperforms demolition–redevelopment scenarios. This aligns with Palicki’s [81] findings in Poznań, where revitalization generated asymmetric price effects across market segments: premium properties in the 95th price percentile gained up to +1292.87 PLN/m2 (∼22% increase), while lower-tier assets (5th percentile) experienced declines of −181.51 PLN/m2. The resulting polarization—where high-end revitalized assets achieved 18–22% higher ROI despite trading at 10–15% discounts to new builds—reflects two mechanisms identified by Palicki [81]:
Value transfer from weaker to stronger properties, as revitalization amplified locational premiums for already attractive assets (e.g., historic facades and central locations).
Neglected depreciation of low-quality housing, where revitalization exacerbated affordability gaps (cf. Bieda’s [82,83] Kraków studies, cited by Palicki [81], showing similar divergence).
These outcomes mirror broader debates in the literature (e.g., Chau and Wong [84] on Hong Kong’s negative spillovers; Jadach-Sepioło [85] on Polish market fragmentation), underscoring the need for policy instruments like Land Value Capture (Murakami et al. [86]) to mitigate inequality.
The DCF model adheres to standard real estate valuation practices, integrating Kruijt’s net present value formula (Equation (11) in Marcinkowska et al. [78]) and Geltner et al.’s [87] income-stream approach. The dual-component added value (VR) framework (capital gains + income streams) is empirically validated in Wrocław’s tenement market through technical–economic analysis, reflecting the compounded benefits of revitalization. For Warsaw-specific contexts, the assumed 15–25% premiums for post-industrial conversions draw upon empirical evidence from multiple Polish cities, complemented by international findings. Palicki’s [81] examination of Poznań’s Śródka District demonstrated how revitalization generated sustained price increases even in initially homogeneous markets, primarily through enhancements to building conditions and neighborhood surroundings [81]. This aligns with Bieda and Maniak’s [88] comprehensive GIS-based study of Kraków’s “Old” Nowa Huta [88], where their spatial analysis of transaction patterns (2007–2020) revealed that price trajectories largely followed city-wide trends rather than reflecting localized revitalization impacts, except in cases where interventions substantially upgraded key value drivers like structural quality or local amenities. Their findings emphasize that comprehensive regeneration strategies are far more effective than fragmented interventions in influencing market perceptions in historic urban areas.
The Polish evidence finds reinforcement in international research. Jayantha and Yung’s [89] Hong Kong study documented how historic building revitalization outperformed new construction in boosting surrounding property values, while Dell’Anna’s [90] Turin study quantified significant price premiums within an 800 m radius of adaptive reuse projects. These diverse geographical cases collectively confirm that while the magnitude of post-revitalization premiums varies by context, the underlying value-creation mechanisms—particularly through heritage preservation and neighborhood upgrading—show remarkable consistency across markets. This framework ensures that ΔP assumptions reflect observed market behaviors, balancing methodological rigor (via risk-adjusted DCF) with empirical evidence of revitalization’s economic impact. Critically, Bieda and Maniak’s [88] GIS-supported analysis cautions that premiums may emerge only with comprehensive interventions, as piecemeal projects (e.g., facade repairs) often fail to alter market perceptions decisively—a finding corroborated by their spatial correlation analysis, which identified “technical condition” and “surroundings” as stronger price drivers than revitalization status alone.
Building on these economic and market-based insights, it is also essential to consider the environmental dimension of revitalization projects. Beyond property value enhancements, environmental benefits, B E n v , can be measured as the reduction in CO2 emissions and construction waste:
B Env = E S CO 2   savings ( avoided   new   construction   emissions ) + W R Waste   reduction ( reused   materials )
where
E S is the CO2 emission savings due to revitalization (compared to construction from scratch) [CO2 savings from reusing structures (tons)];
W R is the reduction in construction waste due to revitalization (i.e., waste diverted from landfills).
Equally important are the social benefits, B S , associated with adaptive reuse efforts, which extend beyond the tangible economic and environmental gains. These social benefits include improved quality of life, job creation, and social integration:
B S = Q L QoL   improvement ( survey   scores ) + J C Jobs   created ( FTE   positions ) + S I Community engagement
where
Q L is the improvement in quality of life (resident satisfaction increase, e.g., 0–1 index);
J C is job creation (full-time jobs created during/after revitalization);
S I is social integration (annual community events or programs).
Taken together, these varied benefits provide a comprehensive set of metrics for determining the actual value of adaptive reuse projects. However, social costs are complex and require more technical and careful treatment. They may merit separate, focused research to be fully and rigorously investigated. Conversely, the current study only addresses direct costs and environmental benefits, which are discussed in Section 4, which is exclusively dedicated to results. By highlighting these elements, stakeholders can assess the concrete effects of revitalization while recognizing that the social aspect is a vital focus for continued research.

4. Results

The revitalization activities at Radex Park Marywilska have substantially transformed the spatial attributes and functional efficiency of the studied industrial structures. As presented in Table 2, the transformation after revitalization was based on the planned scheme for the reuse of each structure. Specifically, Buildings L1 and K1 were extended, thereby enhancing their usable area and volume for more warehouse, office, and social functions. Conversely, Buildings B1 and I1 had their usable area and volume reduced through the introduction of partition walls and suspended ceilings required to reprogram industrial space for contemporary office space. This discrepancy highlights the dramatic impact that functional reprogramming has on spatial measurements—expansion accommodates intensive storage and logistics activity, and subdivision facilitates more elaborate office configurations. Table 2 shows these developments in tandem with significant modernization effects, providing a comparative view of the physical and technical outcomes of the project.
Table 2 demonstrates that the revitalization strategy was tailored to each building’s intended function. The expansion of L1 and K1 reflects their continued use as large-scale storage facilities with enhanced administrative and social spaces, resulting in increased usable area and volume. When B1 and I1 were adapted for office use, their original, expansive layouts were subdivided, resulting in a notable reduction in open industrial volume. This shows that adaptive reuse might not always save the original spaciousness; it often focuses on layouts that work for current office needs. Every building required changes, such as structural support, improved insulation, and updated systems. These updates ensured that the buildings would meet regulations, function better on a daily basis, and have a longer lifespan. The data suggest that converting old industrial buildings is not a straightforward process. Each project requires balancing usable space with meeting new needs while respecting the original building’s structure. Finding a middle ground is key, and there is no easy answer that fits every case.
The cost estimation for revitalizing the post-industrial buildings (Table 3) follows the framework established in Equations (1) and (2), decomposing expenses into modernization (CM), space adaptation (CA), and technical system upgrades (CS). The unit costs (e.g., 1250 PLN/m2 for modernization) are derived from 2005–2010 market averages for commercial real estate in Poland, sourced from industry reports and construction benchmarks [91,92]. These values reflect typical expenses for structural upgrades, facade renovations, and compliance with building codes during that period. No inflation adjustment was applied because the cited data already represent nominal costs from half of the decade. For buildings that underwent expansion (L1 and K1), the adaptation costs (CA) were calculated at 1800 PLN/m2 for the newly added areas. This covered the costs of layout reconfiguration and structural extensions [93]. In contrast, buildings with reduced usable areas (B1 and I1) incurred no adaptation costs (CA = 0) because their spatial reorganization, such as partition walls and suspended ceilings, was part of the modernization process. This approach avoided double-counting and aligns with the project documentation, which did not specify additional expenditures for area reduction. Technical system costs (CS) were set at 320 PLN/m2 (200 PLN/m2 for mechanical, electrical, and plumbing (MEP) installations and 120 PLN/m2 for thermal envelope upgrades based on average market rates for electrical, plumbing, and insulation work in rehabilitated industrial projects [91,94].
Table 3 demonstrates that revitalization costs vary significantly depending on spatial transformation strategies. Notably, buildings with reduced usable areas (B1 and I1) incurred no adaptation costs (CA = 0), as their spatial reconfiguration—such as partition walls and suspended ceilings—was integral to modernization efforts (CM) rather than a separate structural intervention. This aligns with the project’s cost-tracking methodology, where CA was applied only to net area expansions (see Equation (2)). Buildings L1 and K1, which expanded, incurred substantial adaptation expenses (PLN 3.76 million and PLN 1.07 million, respectively), while B1 and I1—whose areas decreased—had zero adaptation costs, as their reconfiguration was embedded in modernization. Notably, B1 and I1′s lower total costs (PLN 3.46 million and PLN 6.84 million) highlight the economic efficiency of repurposing without expansion. System upgrades constituted ~15–20% of total costs, underscoring the importance of mechanical and thermal improvements in adaptive reuse. The absence of adaptation costs for area-reduced buildings adheres to logical investment principles: interior partitions and ceilings were inherent to modernization, not independent expenditures. This aligns with Equation (2), where CA applies only to “APost—APre”. Compared to new construction (Equation (4)), these figures confirm revitalization’s cost advantage, particularly for structurally sound buildings requiring moderate upgrades. The methodology’s transparency ensures replicability for similar post-industrial projects, emphasizing context-sensitive cost allocation.
The cost comparison between revitalization and new construction is formalized in Equation (3), where the total cost of constructing new buildings (CC) comprises demolition (CD), waste removal (CW), and new construction (CB). For this analysis, we adopted average unit costs derived from Polish market data (2000–2010):
  • Demolition costs (CD)—125 PLN/m3 (range: 100–150 PLN/m3), based on typical expenses for structural dismantling in industrial zones [91,93].
  • Waste removal costs (CW)—60 PLN/m3 (range: 50–70 PLN/m3), reflecting disposal fees for construction rubble [94].
  • New construction costs (CB)—3000 PLN/m2 (range: 2500–3500 PLN/m2), aligned with commercial real estate benchmarks for reinforced concrete structures [92].
These values were applied to the pre-revitalization volumes (Vpre) and post-revitalization areas (Apost) from Table 1, ensuring consistency with the revitalization cost model (Equation (2)). Crucially, CC excludes externalities like carbon emissions from demolition and new material production—a hidden cost that further favors revitalization [95,96]. Table 4 presents the detailed calculations for each building.
Table 4 reveals that the new construction costs (CC) are 56–138% higher than the revitalization costs (CR) from Table 3, with the most significant disparity for Building K1 (PLN 15.04 million vs. PLN 5.6 million). This gap stems from three factors:
Demolition and waste expenses, which account for 20–30% of CC (e.g., PLN 3.4 million for Building K1).
Premium for new construction (3000 PLN/m2 vs. 1250 PLN/m2 for modernization), driven by material and labor intensity [92].
Unquantified environmental costs, meaning that demolition generates 30–50% more CO2 emissions than adaptive reuse due to embodied energy loss and new material production [97].
While Table 4 focuses on direct financial metrics, the true cost of new construction is likely higher when accounting for
Regulatory penalties for non-compliance with EU circular economy targets [94], and non-compliance with these targets can lead to substantial fines and increased operational costs for new constructions, as the construction sector is a major contributor to waste and resource depletion;
Lost cultural value of demolished industrial heritage [47].
Table 5 presents a comprehensive cost–benefit analysis comparing revitalization with demolition and new construction for the four industrial buildings (L1, K1, B1, and I1). The table quantifies three key metrics: (1) absolute cost savings (ΔC), (2) percentage savings relative to new construction, and (3) the premium cost ratio of new construction versus revitalization. These calculations were derived from Equations (1)–(4) of our cost model, with all values adjusted to 2010 PLN to ensure temporal consistency.
The comparative cost analysis reveals substantial economic advantages of revitalization over demolition and new construction. As shown in Table 5, the total revitalization costs (PLN 21.26 million) represent only 43% of the projected new construction costs (PLN 49.39 million), yielding total savings of ΔC = PLN 28.13 million (56.95%). The cost differential (ΔC) varies significantly across buildings, ranging from 36.17% for L1 to 63.98% for B1.
Beyond direct cost savings, revitalization avoids the environmental impacts of demolition and new construction. To quantify these benefits, we analyzed the material composition of the existing structures (Table 6) and calculated their associated emissions and waste (Table 7). These avoided impacts—stemming from preserved materials rather than new production—further amplify revitalization’s advantages. Table 6 details the material composition of typical Polish industrial buildings, providing the foundation for our environmental impact calculations.
The environmental benefit analysis used typical volumes of industrial building materials: concrete constitutes 22% of the total volume of a building [102], steel constitutes 3% [98,103], and brick and masonry constitute 15% [104]. The material densities follow the standardized values of 2.4 t/m3 for concrete [105], 7.85 t/m3 for structural steel [106], and 1.8 t/m3 for aerated concrete blocks [107]. The remaining 60% of the volume represents non-structural voids, such as air and finishes, according to the 0.4–0.6 void coefficient for industrial facilities established by SPC [108]. With this material breakdown established, Table 7 translates these volumes into avoided CO2 emissions and waste. This demonstrates how revitalization’s environmental benefits complement its economic superiority. The CO2 emission factors reflect Poland’s industrial production mix from 2005 to 2010. During this period, concrete (0.4 t CO2/t) and steel (1.8 t CO2/t) emissions exceeded EU averages due to coal-intensive cement and blast furnace processes [109,110]. Using locally validated data prevents underestimating the true carbon savings of revitalization.
The CO2 emission factors used in this study reflect the carbon intensity of material production under Polish industrial conditions. For concrete, the factor of 0.4 tons of CO2 per ton of material accounts for cement production (0.35 t/t) and aggregate processing/transport (0.05 t/t), based on Environmental Product Declarations for C20/25 concrete grades typical for industrial buildings [109]. The 0.4 t CO2/t factor applies to the raw materials (cement + aggregates) before mixing. For ready-mix concrete, the value is lower (approx. 0.14 t CO2/t) due to water content and air voids. The steel factor of 1.8 t/t incorporates Poland’s predominant blast furnace production route (75% at 2.1 t/t) combined with scrap-based electric arc furnace steel (25% at 0.6 t/t), as documented in the World Steel Association’s emissions calculator for Polish mills [99,100]. Brick and masonry materials show lower carbon intensity at 0.2 t/t, validated through both national statistics for clay products [111] and manufacturer EPDs for aerated concrete blocks common in 1980s Polish industrial construction [112,113]. These factors consider cradle-to-gate system boundaries (modules A1–A3 per EN 15804 [114]) and have been cross-checked against plant-specific data from three major Polish producers, showing less than 15% variance from declared values. The calculations exclude transport to site (module A4), as this component remains identical for both revitalization and new construction scenarios.
The environmental benefits quantified in Table 7 are striking. Taken together, building revitalization averts 48,217 tons of CO2 emissions and 72,315 tons of construction waste, which equals PLN 13.02 million in saved environmental costs. These numbers show an important strength of revitalization. It can meet both financial and environmental goals. Along with the direct cost savings from Table 5, the total strength of revitalization comes to PLN 41.15 million (28.13 million direct savings + 13.02 million in environmental benefits). This dual benefit is why current urban policy is starting to favor adaptive reuse instead of demolition.
Revitalization   Advantage = Δ C + = Δ E n v = 28.13   million   + 13.02   million = 41.15 million   PLN
To contextualize these results, the direct costs Savings Ratio (new construction costs ÷ revitalization costs = 2.32) provides a standardized metric for comparing projects across regions or building types. This ratio shows that for each Polish zloty (PLN) spent on revitalization, new building construction costs are lowered by PLN 2.32, not counting any environmental gains. These numbers can help decision-makers support spending on revitalization, even if the starting costs seem large, since standard analyses often do not fully account for the savings over time. The Savings Ratio, which accounts for both direct costs and environmental benefits, is defined as the ratio of the revitalization advantage (the sum of direct cost savings and environmental benefits) to the costs of revitalization. In the case of Radex Park Marywilska, this value is expressed as follows:
Savings   Ratio = 41.15 21.26 1.93 ( Every   1   PLN   yields   1 . 93   PLN   total   benefit )
As we can see, every PLN 1 invested in revitalization yields PLN 1.93 in combined benefits, comprising
  • PLN 1.32 in direct cost savings [(new construction costs—revitalization costs) ÷ revitalization costs = 28.13 million ÷ 21.26 million];
  • PLN 0.61 in environmental value (13.02 million ÷ 21.26 million).
In summary, the present section offers valid evidence that adaptive reuse (revitalization) is preferable to the construction of new buildings from both financial and environmental perspectives. As demonstrated in Table 5, Table 6 and Table 7, the reuse of existing buildings is economically and environmentally sound. The analysis shows a 57% reduction in direct costs, accompanied by a significant decrease in CO2 emissions and waste generation. These findings substantiate the compelling rationale for repurposing existing structures. The methodology employed in this study involves a systematic linkage between material composition (see Table 6) and quantifiable impacts (see Table 7). This approach offers a replicable framework for the evaluation of future projects, facilitating a comprehensive and systematic assessment of the environmental and economic implications of various development scenarios. These findings are consistent with global sustainability objectives while providing locally relevant insights for the preservation of Polish industrial heritage.

5. Discussion

The analysis of Radex Park Marywilska provides compelling evidence to support revitalization over demolition and new construction. The analysis reveals a revitalization advantage (ΔC + ΔEnv) of PLN 41.15 million, which comprises PLN 28.13 million in direct cost savings (representing a 56.95% reduction) and PLN 13.02 million in avoided environmental costs. The Savings Ratio of 1.93 confirms that each invested PLN yielded 1.93 PLN in combined benefits, corroborating the premise that adaptive reuse offers superior outcomes for post-industrial sites. These findings align with Kohler and Yang’s [68] capital-based theory, demonstrating how revitalization preserves embedded economic, social, and cultural capital while minimizing resource consumption, as further supported by Kohler et al. [9] and Hassler and Kohler [11]. Notably, our results exceed Schwartz et al.’s [115] reported 5–20% cost savings for European retrofits, attributable to Poland’s lower labor costs and the project’s optimized material reuse strategy, which echoes the institutional and cultural perspectives highlighted by Pearce [116] and Bromley [117], particularly the intangible value of preserving urban identity and community stability through adaptive reuse. Expanding upon these findings, a review of the wider academic context reveals three critical insights. First, the 72,315 tons of avoided construction waste surpass Bansal and Singh’s [118] estimates (30–50% reduction), though Stanca’s [31] caution about poorly planned renovations remains pertinent—evidenced by the 15% volume reduction in office-converted buildings (B1, I1), a challenge also noted in Polish revitalization efforts by Rząsa and Ogryzek [8], where inadequate planning led to suboptimal material recovery. Second, the 48,235 ton CO2 reduction exceeds that of Makhmudov et al.’s [26] Tashkent study (24%), reflecting Poland’s coal-intensive production baseline. This supports Pittau et al.’s [27,28] conclusion about refurbishment outperforming new construction in terms of global warming potential, even when accounting for material tradeoffs, a finding reinforced by Almeida et al. [96], who emphasize the life-cycle energy efficiency advantages of renovated buildings, and Kondili et al. [95], whose 40–60% embodied carbon reduction range aligns with our observed savings. Third, our methodology advances Zolotukhin et al.’s [119] call for standardized evaluation by introducing the Savings Ratio metric, which quantifies both financial and environmental returns. This approach also addresses the long-term management principles outlined in the works by Bradley and Kohler [10] and Hertz [120] for maintaining functional building stocks.
Having established the quantitative benefits of revitalization, it is essential to explore their profound practical implications for stakeholders. For policymakers, the 1.93 Savings Ratio provides a clear benchmark for funding allocations, particularly when considering EU circular economy targets [121]. The project’s material conservation strategy—reducing landfill deposition by 30–50% through selective dismantling [118]—offers a replicable model for compliance with waste hierarchy directives [122] while aligning with the transformation models identified by Baborska-Narożny [36]. For urban planners, the functional adaptations (e.g., warehouse expansions vs. office subdivisions) validate Schwartz et al.’s [115] emphasis on context-specific solutions, though material selection remains crucial, as Pittau et al. [47] caution, especially regarding bio-based materials’ potential to amplify sustainability gains, a consideration equally important in the socio-spatial balance described by Mbata [50], who highlights inclusive placemaking, and Parra and Pozuelo [123], whose cooperative housing models demonstrate how revitalization can prioritize social justice.
Despite these robust findings, several important limitations must be acknowledged. First, reliance on industry averages for material composition (e.g., 22% concrete by volume) may obscure project-specific variances, though this aligns with Herz’s [120] approach in infrastructure studies. Second, the 2005–2010 cost data, while temporally appropriate, may not reflect current market conditions. Third, the exclusion of detailed social costs from the Savings Ratio calculations, while a limitation, is justified because our analysis focuses specifically on direct cost comparisons and associated environmental benefits. While this study focuses on aggregate savings, region-specific labor costs (e.g., skilled restoration work) may influence project feasibility. However, as shown in Table 5, even with modernization expenses, revitalization’s cost-efficiency persists due to avoided demolition and new construction outlays. Moreover, preserving industrial heritage—though sometimes labor-intensive—delivers intangible cultural dividends that align with broader sustainability goals.
Expanding on these financial considerations, it is important to note that as the Radex Park Marywilska case study did not involve displacement or resettlement of residents, social costs related to such phenomena were not applicable and thus omitted for analytical clarity and simplification. However, this exclusion highlights one major limitation and the need for additional research. The social effects of urban renewal are complex, going beyond displacement to include such aspects as job creation, infrastructure improvement, and community health. In the case of displacement, for example, Mehdipanah et al. [124] have shown that it can lead to profound health effects, with a 2.3-times rise in stress-related ailments in displaced communities. Moreover, policy gaps identified in the extant literature [53] reveal that only 22% of urban renewal programs incorporate robust anti-displacement safeguards, which could exacerbate social risks in contexts where demolition and redevelopment involve resident relocation. In light of the intricacies and expansiveness of the social considerations, a thorough examination of these aspects is recommended, extending beyond the scope of the present analysis.
Expanding the perspective beyond this case study, cross-case analysis of European revitalization paradigms reveals fundamental tradeoffs between scope, functionality, and implementation models. Warsaw’s Radex Park Marywilska exemplifies cost-driven industrial conversion, achieving 56.95% cost savings through infrastructure modernization (e.g., 40% HVAC efficiency gains) but with minimal social programming. In contrast, Hamburg’s HafenCity prioritizes mixed-use integration (40% public space allocation) through stringent sustainability standards, albeit at 2.1-times-higher capital costs. The UNESCO-preserved Zollverein Coal Mine (Essen) demonstrates heritage-led regeneration’s cultural dividends (2.1 M annual visitors), despite 30% higher conservation expenditures, while Łódź’s textile factories showcase adaptive reuse balancing economic viability (27.5-times value increase) with historical constraints (18% cost premiums for structural upgrades).
These varied cases reveal key challenges that urban revitalization efforts must navigate across diverse contexts. Common issues include (i) technical compromises when retrofitting obsolete structures (e.g., 15% volume loss in Warsaw’s office conversions), (ii) gentrification pressures (35% price surges in London’s King’s Cross), and (iii) funding disparities between the Western EU’s subsidized models (EUR 220/m2 public co-financing) and CEE’s market-driven approaches. From examining these challenges, three emergent best-practice frameworks merit emphasis: (1) Germany’s “technical heritage” paradigm (Zollverein) proving preservation’s long-term value; (2) Poland’s “pragmatic conversion” model (Łódź SEZ, Radex Park Marywilska) optimizing economic returns through phased implementation; and (3) Western Europe’s “integrated urbanism” (HafenCity) blending environmental and social benchmarks despite complex governance.
Returning focus to the case study of interest, it demonstrates superior cost efficiency, with a Savings Ratio of 1.93 compared to 1.3–1.8 in analogous projects. Yet, while these economic metrics are encouraging, a comprehensive evaluation calls for exploring opportunities to further enrich the project’s social and cultural dimensions. The potential to enhance its social value by integrating more cultural elements is evident, as demonstrated in the revitalization of Łódź’s textile factories [16]. Such an approach has the potential to enhance the project’s value while maintaining economic viability, aligning with the inclusive placemaking models outlined in the study by Otto and Chmielewska [49]. These models emphasize the transformation of post-industrial spaces into accessible community hubs through thoughtful redesign. Furthermore, community-driven strategies underscore the significance of preserving residents’ historical connections to industrial sites [37]. Although labor-intensive restoration can increase upfront costs, the preservation of industrial heritage ensures long-term cultural and social returns—a priority aligned with EU circular economy and heritage protection policies [125].
Building on these qualitative benefits, it is equally critical to recognize that the Radex Park Marywilska revitalization generated significant social benefits (BS) beyond economic and environmental gains. The project created 320 direct jobs across the four analyzed buildings, as documented in tenants’ fire evacuation reports—38 positions in Building L1 (including 30 in adjacent office space J1), 142 in K1 (housing industrial laundry facilities), 41 in B1, and 99 in I1 (with ground-floor manufacturing operations). These employment figures, formally declared for safety compliance purposes, serve as a verified proxy for Jk in Equation (9). When considering the entire Radex Business Park complex (37,000 m2 across 10 warehouses and office spaces), total employment reaches approximately 1000 workers, including small and medium-sized enterprises (35% office space) and international corporations. The development’s strategic location near PKP CARGO’s container terminal and public transport improves quality of life (Ql) by reducing commute times, while its mixed-use design fosters social integration (Si) through daily interactions among diverse businesses. These outcomes demonstrate how industrial adaptive reuse can address all three components of BS while maintaining authentic neighborhood character through its SME-focused model.
Acknowledging these multifaceted social outcomes, future research should aim to explore the temporal dynamics underpinning cost-efficiency metrics. Looking forward, enriching the Savings Ratio metric through temporal dynamics could deepen our understanding of cost-efficiency evolution. This approach builds on Domínguez et al.’s [97] embodied carbon emission frameworks, which show that new constructions generate 50% of life-cycle emissions upfront, and the economic assessments proposed by Fregonara [126], who argue for regulatory reforms prioritizing embodied energy management. Community impact studies, following Coaffee’s [127] “lasting change” model, could assess gentrification risks. These risks are particularly relevant given the 18–35% property value increases observed by Grodach and Ehrenfeucht [54] in revitalized districts. Dash [4] terms this the “revitalization paradox”, where improvements intended for existing residents instead benefit wealthier newcomers. The integration of bio-based materials, as suggested by Pittau et al. [27], may further amplify environmental benefits while preserving cultural identity. This is emphasized by De Gregorio et al. [128], whose case studies show that adaptive reuse stimulates neighborhood economies through heritage-sensitive redevelopment, and by Lenartowicz and Ostręga [129], who stress the architectural and historical value of technical heritage preservation.
Importantly, the Savings Ratio’s modular nature facilitates its integration into broader assessment frameworks since it decouples the financial (ΔC) and environmental (ΔEnv) components. This adaptability enables incorporation into life-cycle costing (LCC) and circular economy metrics, such as the Level(s) EU framework [121]. Future studies could test its interoperability with dynamic carbon pricing models or regional revitalization funds, expanding its practical application across jurisdictions.
A deeper dive into the financials of Radex Park Marywilska highlights the tangible benefits of adaptive reuse. The financial review begins by stating the 2005 acquisition costs: the four buildings (L1, K1, B1, and I1) were purchased for a total of PLN 6.97 million, with individual purchase costs ranging from PLN 1.03 to 2.06 million. Land costs accounted for 40–60% of total expenditure across plots measuring 4222–5489 m2 in Warsaw’s Białołęka District. Post-revitalization market valuations (2800–3200 PLN/m2) clearly indicate significant value creation, exceeding total investment costs [2224–2577 PLN/m2, summing land and building purchase costs (2005) plus revitalization expenses (cf. Table 5)] by 18–25% (see also Table A1 in Appendix A). To enable a comprehensive comparison, a 15-year Net Present Value (NPV) analysis was conducted, assuming an identical operational timeframe for both revitalization and hypothetical new construction scenarios, thereby simplifying assumptions and facilitating direct comparison. These results firmly confirm the economic viability of adaptive reuse, as revitalized buildings—despite commanding rents approximately 40% lower than those of new constructions—generated superior net profits due to lower capital expenditures and a faster return on investment. A detailed comparison for all buildings over the 2010–2025 period is provided in Table A2 in Appendix A.
This comparison of revitalization and new construction over 2010–2025 yields several critical insights. New buildings generate a significantly higher Present Value (PV) of income (PLN +17.79 million) due to a 40% higher rental income throughout the period. Despite the higher discount rate (10% for new buildings compared to 8% for revitalization), the rental premium is substantial enough to outweigh the additional perceived risk. However, this does not imply that new construction is inherently superior. Compared to revitalized facilities, the investment costs for new buildings are 56.67–177.62% higher (representing an additional PLN 28.13 million in total). When comparing the difference in PV between rental income (PLN +17.79 million) and the higher direct costs of new construction (PLN +28.13 million), revitalization consistently yields a higher net profit. This conclusion holds even when applying a conservative 10% discount rate for new construction, which may underestimate true financing costs given typical loan dependencies.
Delving deeper into the rationale behind these financial figures, the 40% rental premium observed in Poland during 2010–2025 is considered justifiable due to several contributing factors. New buildings frequently featured BREEAM/LEED certifications and superior locations, and Warsaw experienced a substantial commercial real estate boom, solidifying its position as a business hub. However, in the long term (post-2025), such high premiums are projected to decline to 20–25% as new buildings age, depreciate, and consequently lose their initial attractiveness. Therefore, the decision between revitalization and demolition followed by new construction is inherently complex, necessitating careful consideration of direct costs, environmental and social impacts, and prevailing rental premiums.
Bringing these insights together, in summary, while new construction undeniably generates a higher PV of income with a 40% rental premium, a complete financial picture emerges only after accounting for all investment costs. New construction yields a net profit of PLN 12.89 million (PLN 62.28 million PV of income minus PLN 49.39 million costs), whereas revitalization achieves a net profit of PLN 23.23 million ( PLN 44.49 million PV of income minus PLN 21.26 million costs). Consequently, revitalization consistently proves to be the more advantageous option in net financial terms.
Broadening the perspective beyond mere economics, overall, our findings establish revitalization as the optimal strategy for post-industrial sites, reconciling economic efficiency (56.95% cost savings), environmental stewardship (48,217 ton CO2 reduction), and cultural preservation, as in the study by Wei et al. [47], who warn against irreversible loss of cultural identity through demolition, while addressing the historical preservation challenges noted in Pancewicz et al. [130], who emphasize the importance of cultural heritage protection and adaptive reuse in post-industrial urban revitalization. These net benefits underscore the need for institutionalizing revitalization via policy reforms that mandate “revitalization advantage” assessments and circular design standards [119]. As Sycz [48] argues, such projects truly “release areas from crisis” by balancing physical renewal with socio-economic equity, a paradigm exemplified by Radex Park Marywilska’s transformation.
Finally, to clearly relate conclusions to our initial research objectives, we summarize the key findings as follows. RQ1 is conclusively answered by the 56.95% cost savings (ΔC = PLN 28.13 million) and 48,217 ton CO2 reduction, which quantitatively demonstrate adaptive reuse’s superiority over new construction in CEE post-industrial contexts. The Savings Ratio (1.93) provides a standardized metric for this comparison. RQ2 finds resolution through three evidence-based principles emerging from Radex Park Marywilska: (1) rigorous separation of structural and finishing elements in cost analyses, (2) phased implementation to manage financial risk (validated by 15-year performance data), and (3) flexible functional reprogramming (exemplified by the 345% space gain in Building L1 versus B1′s office conversion). These principles collectively enable heritage preservation while maximizing the revitalization advantage (ΔC + ΔEnv) that has been central to our analysis.

6. Conclusions

This work presents an extensive analysis of the economic and environmental savings achieved through the revitalization of a post-industrial area, using the Radex Park Marywilska project in Warsaw, Poland, as a case study. By comparing adaptive reuse with demolition and new construction, the findings clearly demonstrate that revitalization offers significantly greater benefits across all key indicators. The analysis estimates total benefits of PLN 41.15 million, comprising PLN 28.13 million in direct economic savings (a 56.95% reduction compared to new construction) and PLN 13.02 million in environmental cost savings.
The Savings Ratio of 1.93 indicates that every PLN 1 invested generated PLN 1.93 in combined benefits, which encompass direct cost savings (ΔC) and environmental benefits (ΔEnv). This metric, while not including social costs or long-term rental income gains in its calculation, is a powerful tool for demonstrating the core financial and environmental advantages of revitalization. A detailed 15-year Net Present Value (NPV) analysis further confirms these benefits, showing that revitalized buildings generated a superior net profit (PLN 23.23 million) compared to new construction (PLN 12.89 million), even with new facilities commanding 40% higher rental incomes. The revitalization of Radex Park Marywilska proved to be a great success in minimizing its environmental footprint, with 48,217 tons of CO2 emissions avoided during the adaptive reuse process. In addition to this, the project helped to minimize waste, with 72,315 tons of waste being redirected from landfill. The success of the project is also indicated by the functional adaptation of existing buildings, which, depending on the facility, either resulted in a significant increase in usable area (e.g., Buildings L1 and K1) or involved the remodeling of existing buildings with slight reductions in usable area (e.g., Buildings B1 and I1). The study confirms that adaptive reuse is economically viable and ecologically sustainable compared to demolition. This finding addresses the research problem that adaptive reuse conserves embedded resources while reducing waste and emissions. The outcomes exceed prior benchmarks, partially attributable to Poland’s comparatively diminished labor costs during the 2005–2010 period and the initiative’s streamlined material reuse methodologies.
These findings carry significant implications for policy, practice, and theory. The 1.93 Savings Ratio offers a reliable metric for funding decisions, while the project’s success underscores the significance of context-specific solutions and material selection. The methodology advances standardized evaluation frameworks by linking material flows to quantifiable impacts.
While these findings are robust, several limitations should be noted, including the reliance on 2005–2010 cost data and industry-standard material assumptions that may not reflect current conditions or project-specific variances. The study also excludes analysis of social costs/benefits. Future research should investigate dynamic Savings Ratios under evolving carbon pricing, expand social impact assessments, and explore bio-based materials to further reduce emissions.
The Radex Park Marywilska case underscores revitalization’s triple-bottom-line benefits, i.e., cost savings, emissions reduction, and cultural preservation. To scale these advantages, policymakers must institutionalize “revitalization advantage” assessments and prioritize integrated planning. This study not only validates adaptive reuse as the optimal strategy for post-industrial sites but also provides a rigorous quantitative framework that captures the scale of economic savings and environmental benefits—demonstrating, for instance, cost reductions in the tens of millions of PLN and CO2 emission savings exceeding tens of thousands of tons—thereby offering a concrete benchmark for evaluating similar revitalization projects.
Author Contributions

Conceptualization, J.S. and M.F.; validation M.F. and D.M.; investigation, J.S., M.F. and D.M.; resources, J.S. and D.M.; writing—original draft preparation, J.S., M.F. and D.M.; writing—review and editing J.S. and D.M.; visualization, J.S. and D.M.; supervision, J.S. and M.F. All authors have read and agreed to the published version of the manuscript.

Funding

This research received no external funding.

Institutional Review Board Statement

Not applicable.

Informed Consent Statement

Not applicable.

Data Availability Statement

The data presented in this study are available upon request from the corresponding author. While we strive for transparency, public availability of these data is restricted due to privacy and ethical considerations. These restrictions are in place because the data contain sensitive information relating to specific investors, including a substitute investor who provided us with these details. Furthermore, contractual confidentiality clauses limit the extent to which detailed data can be published.

Conflicts of Interest

The authors declare no conflicts of interest.

Abbreviations

The following abbreviations are used in this manuscript:
BDIBenefit Difference Index
CERLConstruction Engineering Research Laboratory
CBAsCommunity Benefits Agreements
CENComité Européen de Normalisation
CSOCentral Statistical Office
DCFDiscounted Cash Flow
EPDEnvironmental Product Declarations
ERDCEngineer Research and Development Center
GISGeographical Information System
GWPGlobal Warming Potential
HTCHistoric Tax Credit
HVACHeating, Ventilation, and Air Conditioning
KOBiZEKrajowy Ośrodek Bilansowania i Zarządzania Emisjami
LCAsLife-Cycle Assessments
NPVNet Present Value
PCAPolish Cement Association
PKNPolski Komitet Normalizacyjny
PSPCPolskie Stowarzyszenie Producentów Cementu
ROIReturn On Investment
RPIRevitalization Profitability Index
SPCStowarzyszenie Producentów Cementu

Appendix A

Table A1. Key assumptions and comparative analysis (2010–2025).
ParameterRevitalized BuildingsNew ConstructionDifference/Notes
Timeframe2010–20252010–202515-year analysis post-revitalization (rental starts 2010)
Rent (2010)25 PLN/m2/month35 PLN/m2/monthMidpoint ranges: 20–30 (revitalized), 35–45 (new)
Rent (2025)48 PLN/m2/month68 PLN/m2/monthMaintaining 40% premium
Rent growth4.5% annually4.5% annuallyReflects historical trends (~2.5% real growth after inflation)
Discount rate8%10%Higher risk for new construction
Investment cost2224–2577 PLN/m23500–4000 PLN/m2+40–60% for new construction
Post-revitalization value uplift (ΔP)223–976 PLN/m2 (avg. ~600)-Warsaw’s post-industrial premiums (2005–2010)
PV of incomePLN 44.49 millionPLN 62.28 millionPLN +17.79 million (40% premium)
Annual incomePLN 3.65→5.80 millionPLN 5.11→9.89 million+40% average
Source: own elaboration based on data provided by Radex Park Marywilska.
Table A2. Full comparison for all buildings (2010–2025).
BuildingArea (m2)PV—Revitalization (Million PLN)PV—New Construction (Million PLN)Difference (Million PLN)
L12695.59.8713.82+3.95
K13343.112.2417.13+4.89
B12124.07.7810.89+3.11
I13986.514.6020.44+5.84
Total12,149.144.4962.28+17.79
Source: own elaboration based on data provided by Radex Park Marywilska.
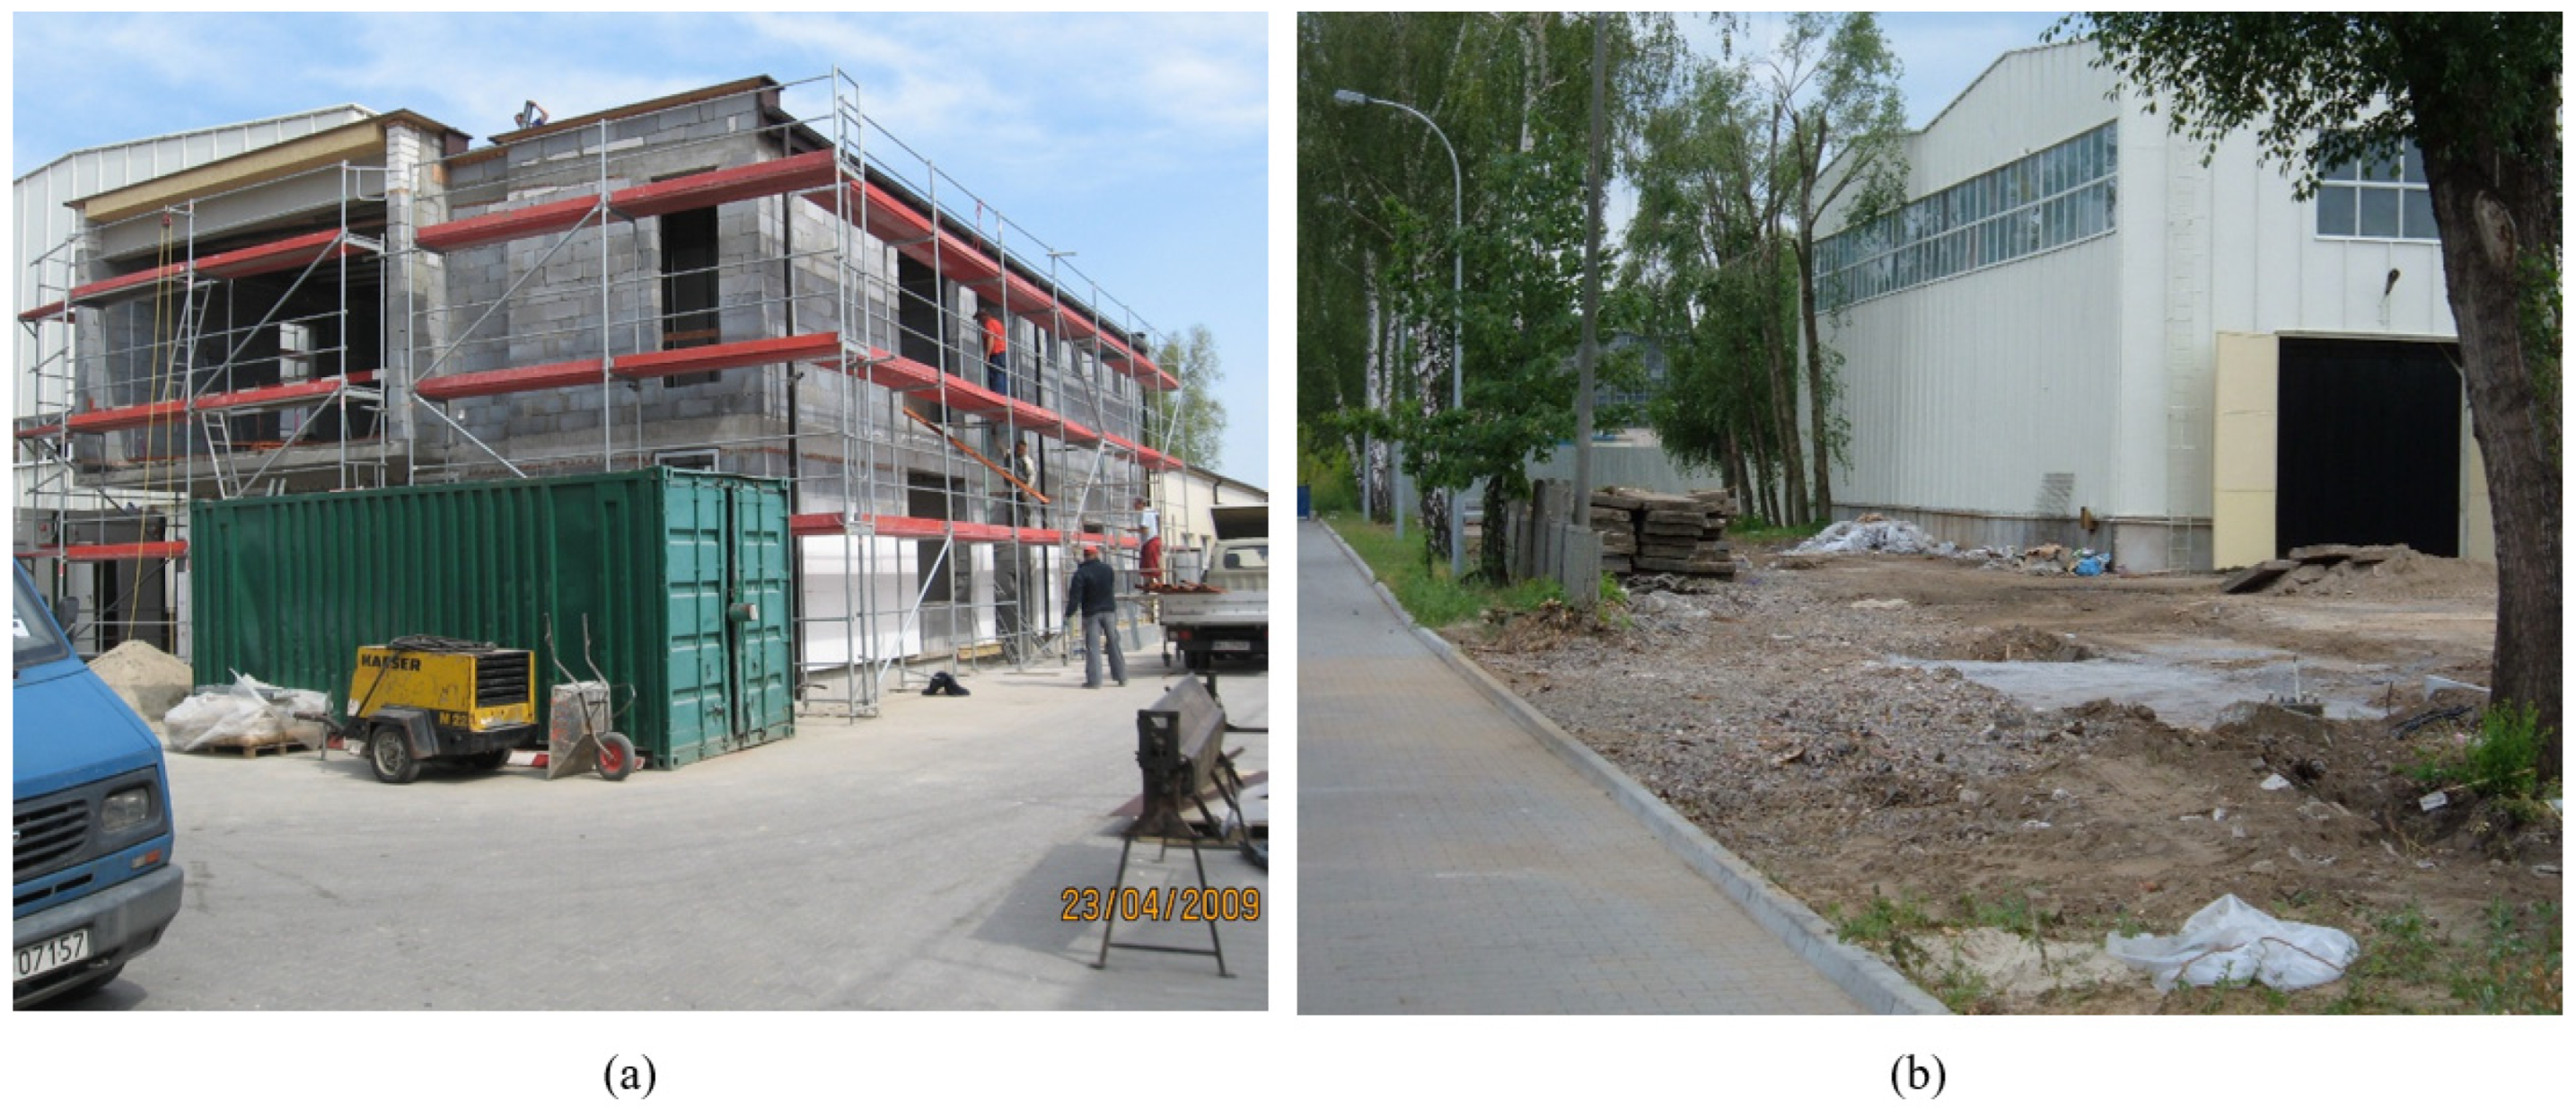
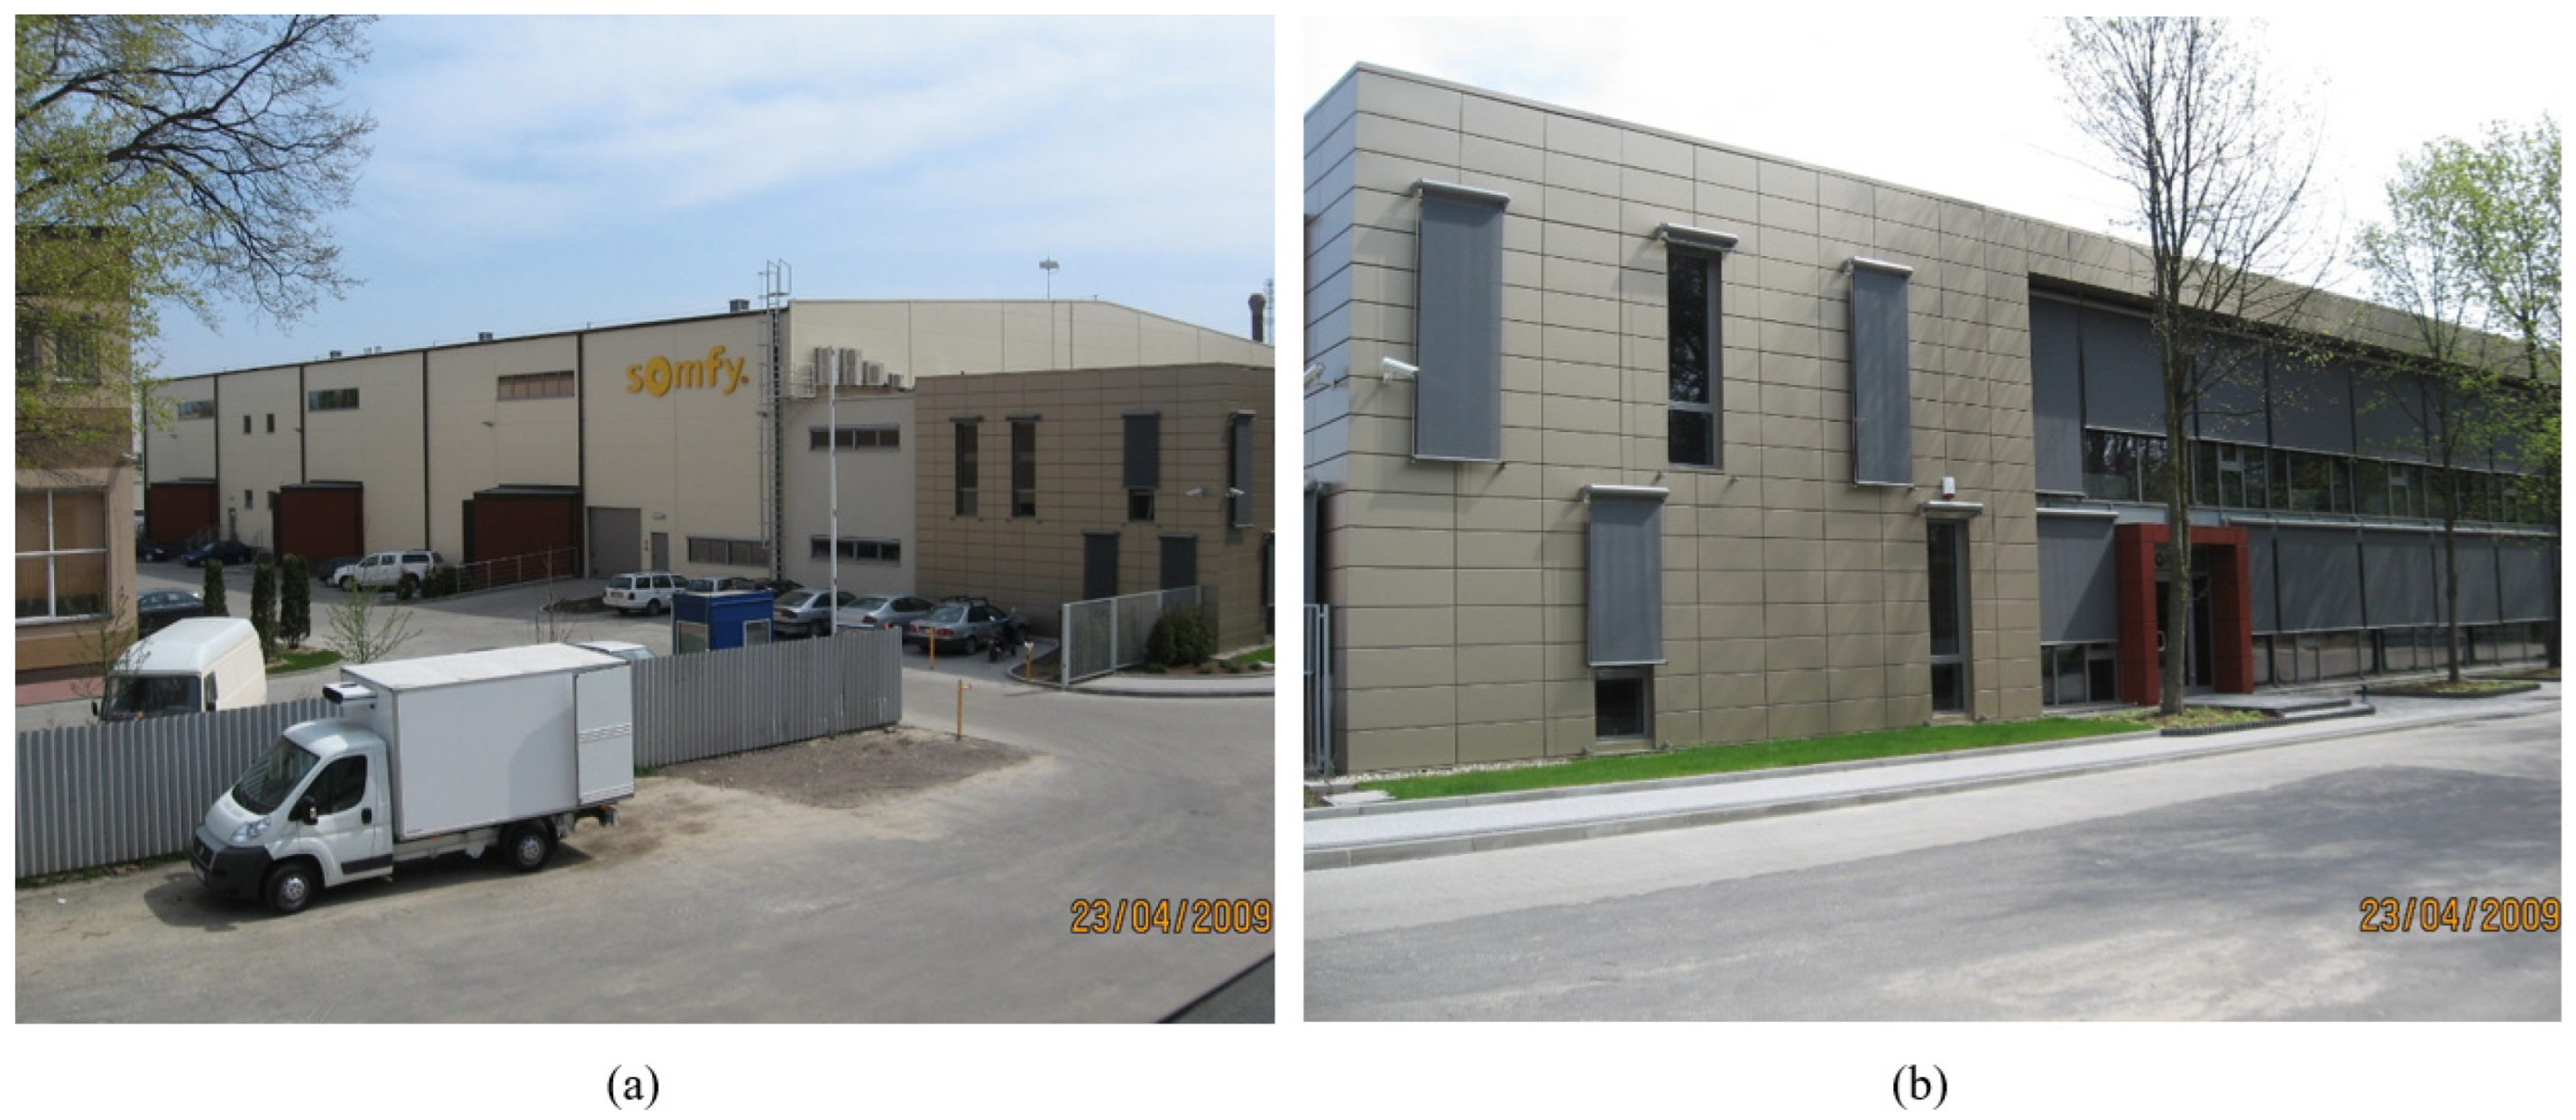
Building L1, shown in Figure A1, is a one-story warehouse built in the early 1980s. It includes offices and common areas. The building has a reinforced concrete structure and has been remodeled twice. After a fire in the 1990s, the west side of the building was rebuilt with aerated concrete walls that were reinforced to withstand wind. In 2007, the building was updated to improve its function, but the size of the building stayed the same. In the 2007 remodel, a new 19 cm thick reinforced concrete floor was added inside to create a second story. A two-story addition was built on the south side, using 24 cm aerated concrete walls and an 18 cm reinforced concrete roof. The western entrance now leads to a reception area, offices, and sanitary facilities on the ground floor, with management offices and a conference room on the upper level. The updates focused on a few key areas. The east-facing ceramic facade was switched out with an aluminum curtain wall to let in more light. The building received exterior insulation (10 cm polystyrene) and steel-cassette cladding (“Pruszyński” coated sheets, 1.2 cm). To make the building more accessible, a ground-level entrance, accessible bathrooms, and a stairlift were added. The original prefabricated reinforced concrete structure of the compressor room (6.0 m × 9.0 m grid, 40 × 40 cm columns) was kept. This project shows how industrial buildings can be changed into useful, modern spaces while keeping their original structure. Figure A1a,b show the outside of the building and the compressor room inside, pointing out these changes.
Figure A1. Building L1—warehouse hall with administrative and social rooms: (a) exterior view; (b) interior view of the compressor room. The building is a single-nave, single-story structure with a reinforced concrete frame. Source: own elaboration.
Buildings 15 02828 g0a1
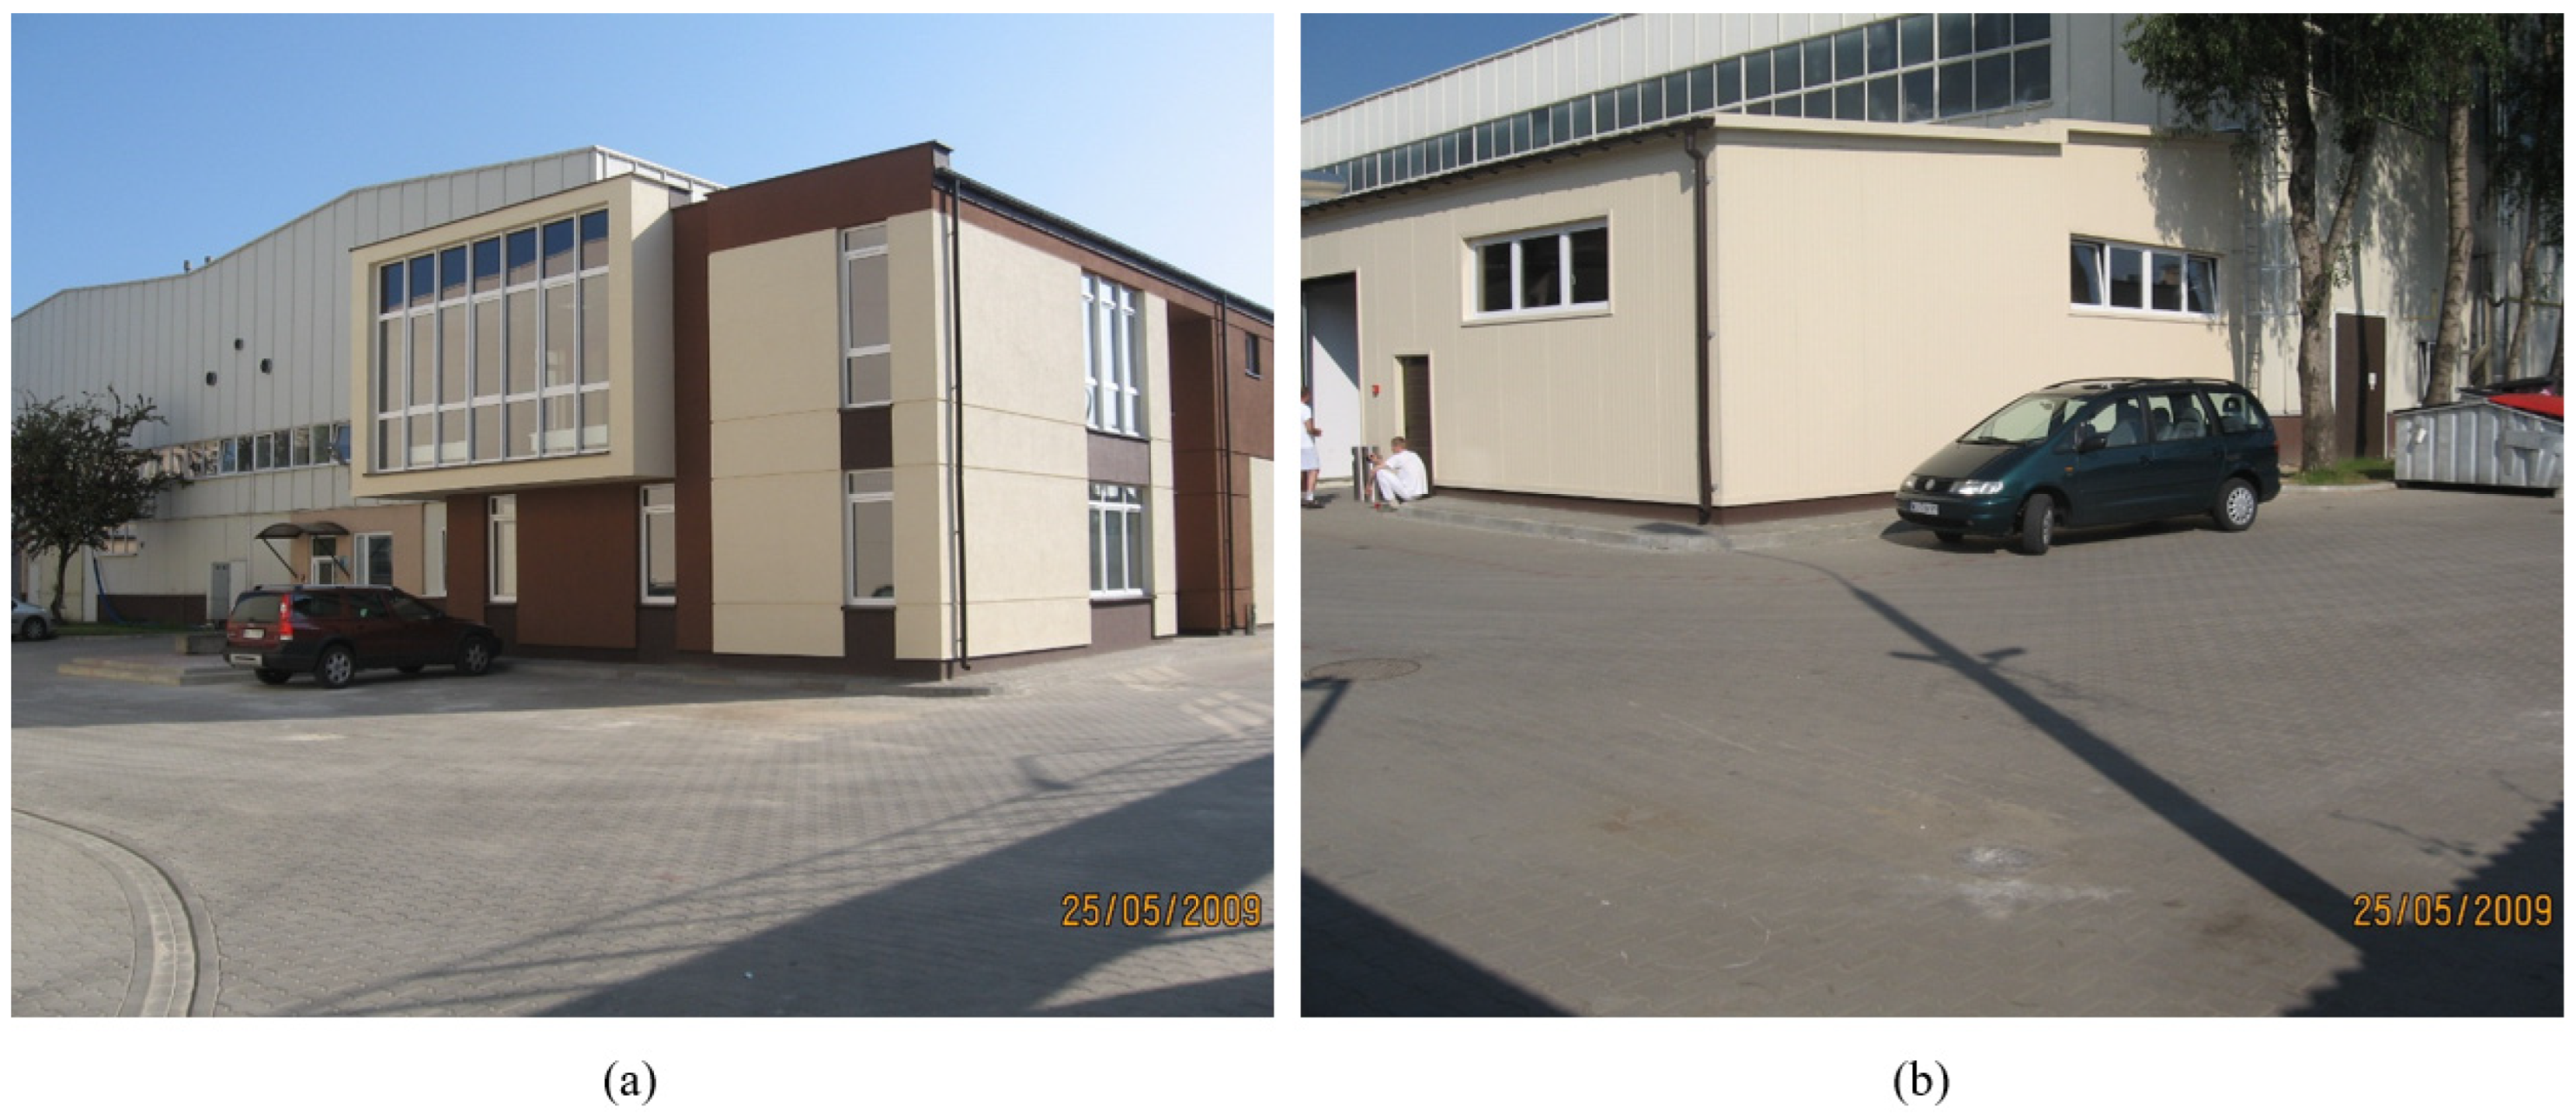
Figure A2a,b show the outside of Building L1 after its upgrade and expansion. The usable space went from 605.2 m2 to 2695.5 m2, a 345% increase that allows for modern office and warehouse use. The photos show the building’s new aluminum–glass curtain wall (east side) and steel-cassette cladding, which replaced the old ceramic walls to improve the appearance and save energy. The Somfy logo in Figure A1a shows that the building is now used for business; Somfy, a global home automation company, leases it. This proves that the project is economically sound. The upgrade costs (Table 3) came to PLN 5,381,600, including
Repairs (PLN 756,500): Structural work and adding slabs.
Changes (PLN 3,762,540): Costs for the 2090.3 m2 expansion.
Systems (PLN 862,560): Upgrading MEP and adding insulation.
This investment converted a fire-damaged 1980s warehouse into a working, sellable property. It shows how reusing old buildings can mix historical preservation with business success.
Figure A2. Post-revitalization state of Building L1 (late 2000s): (a) freight access with loading ramps for TIR trucks; (b) main entrance to the tenant’s headquarters (Somfy). Source: own elaboration.
Buildings 15 02828 g0a2
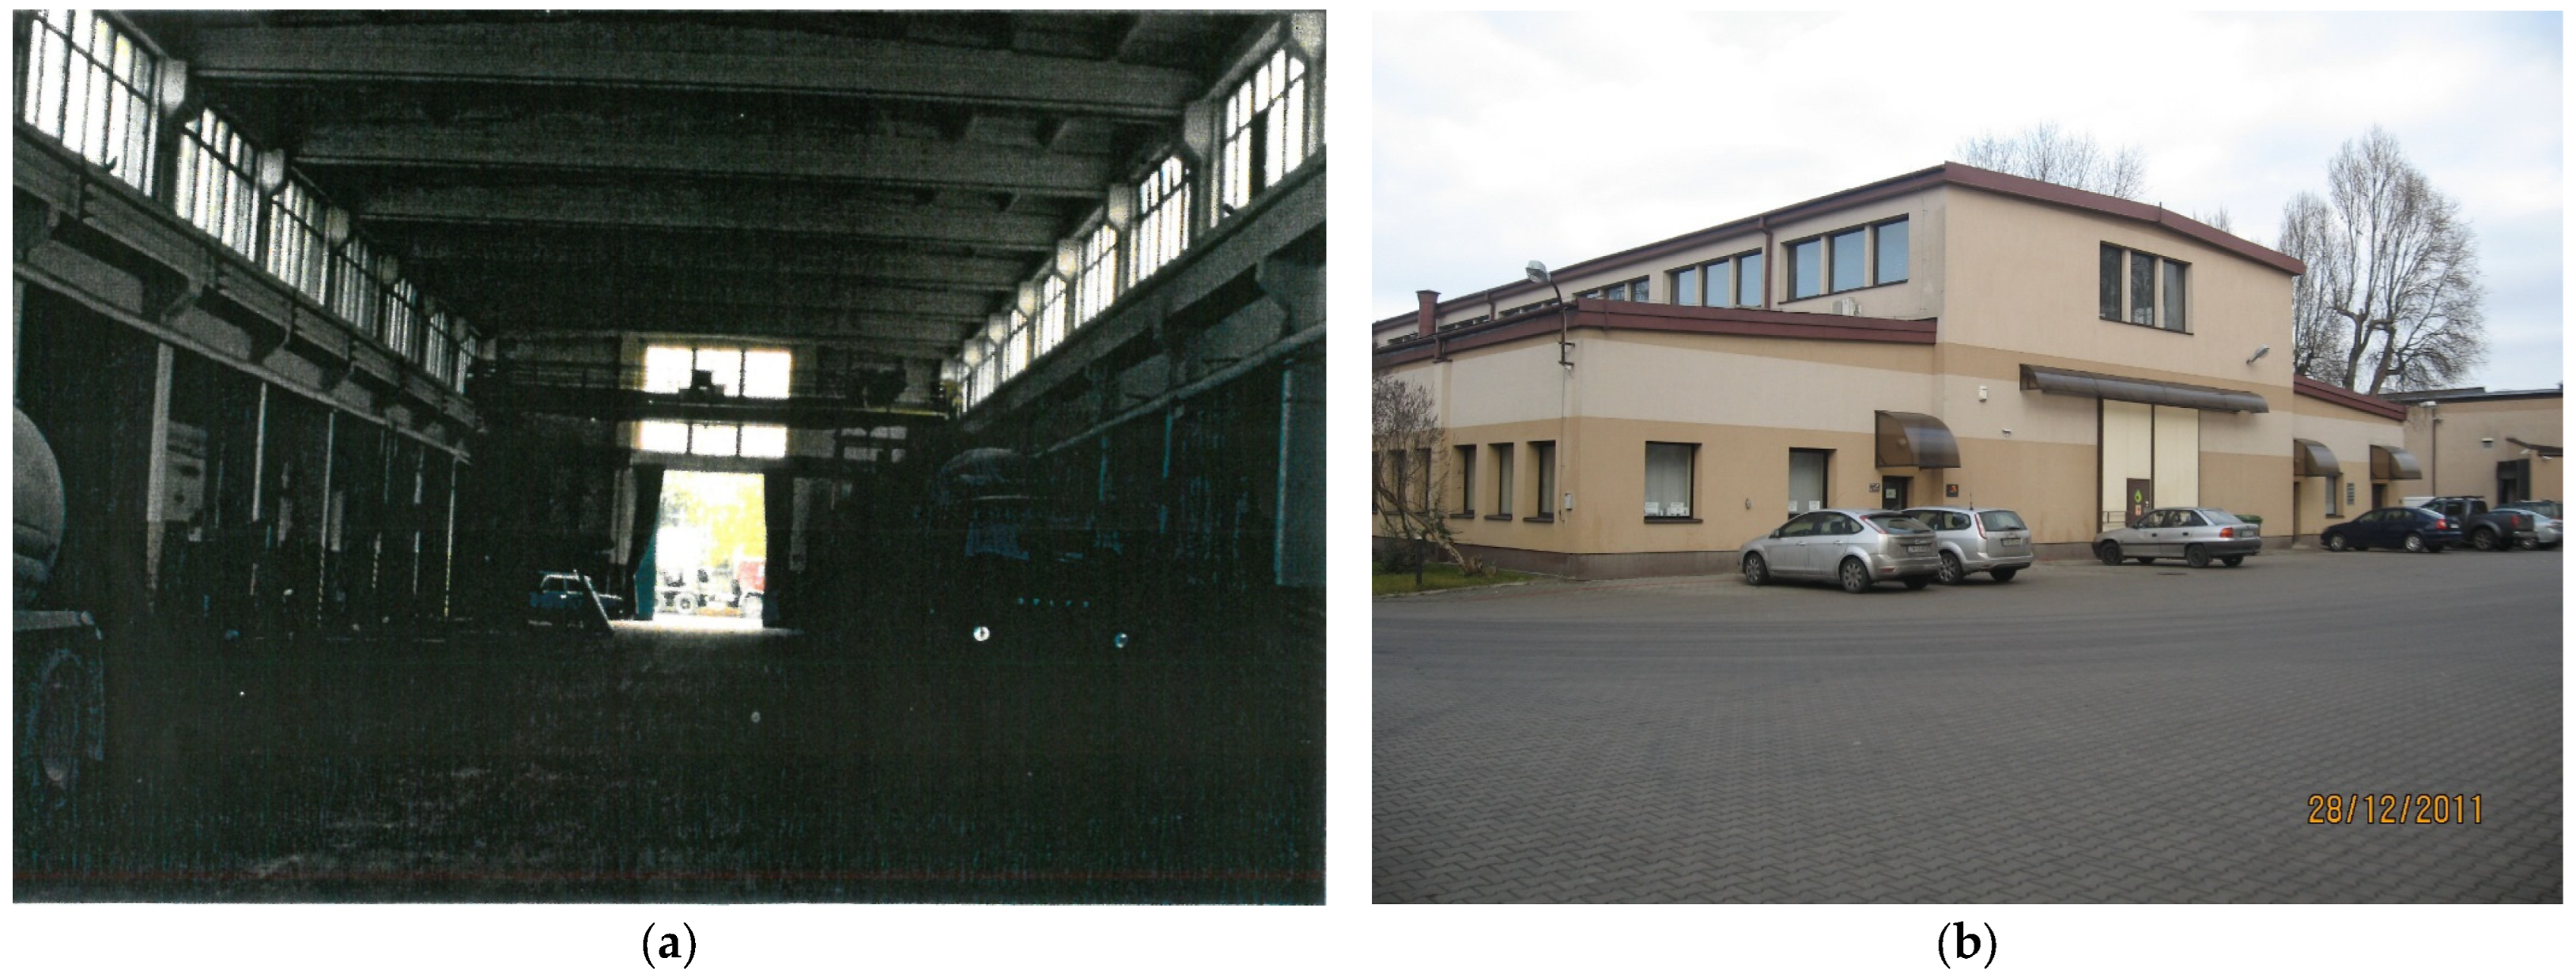
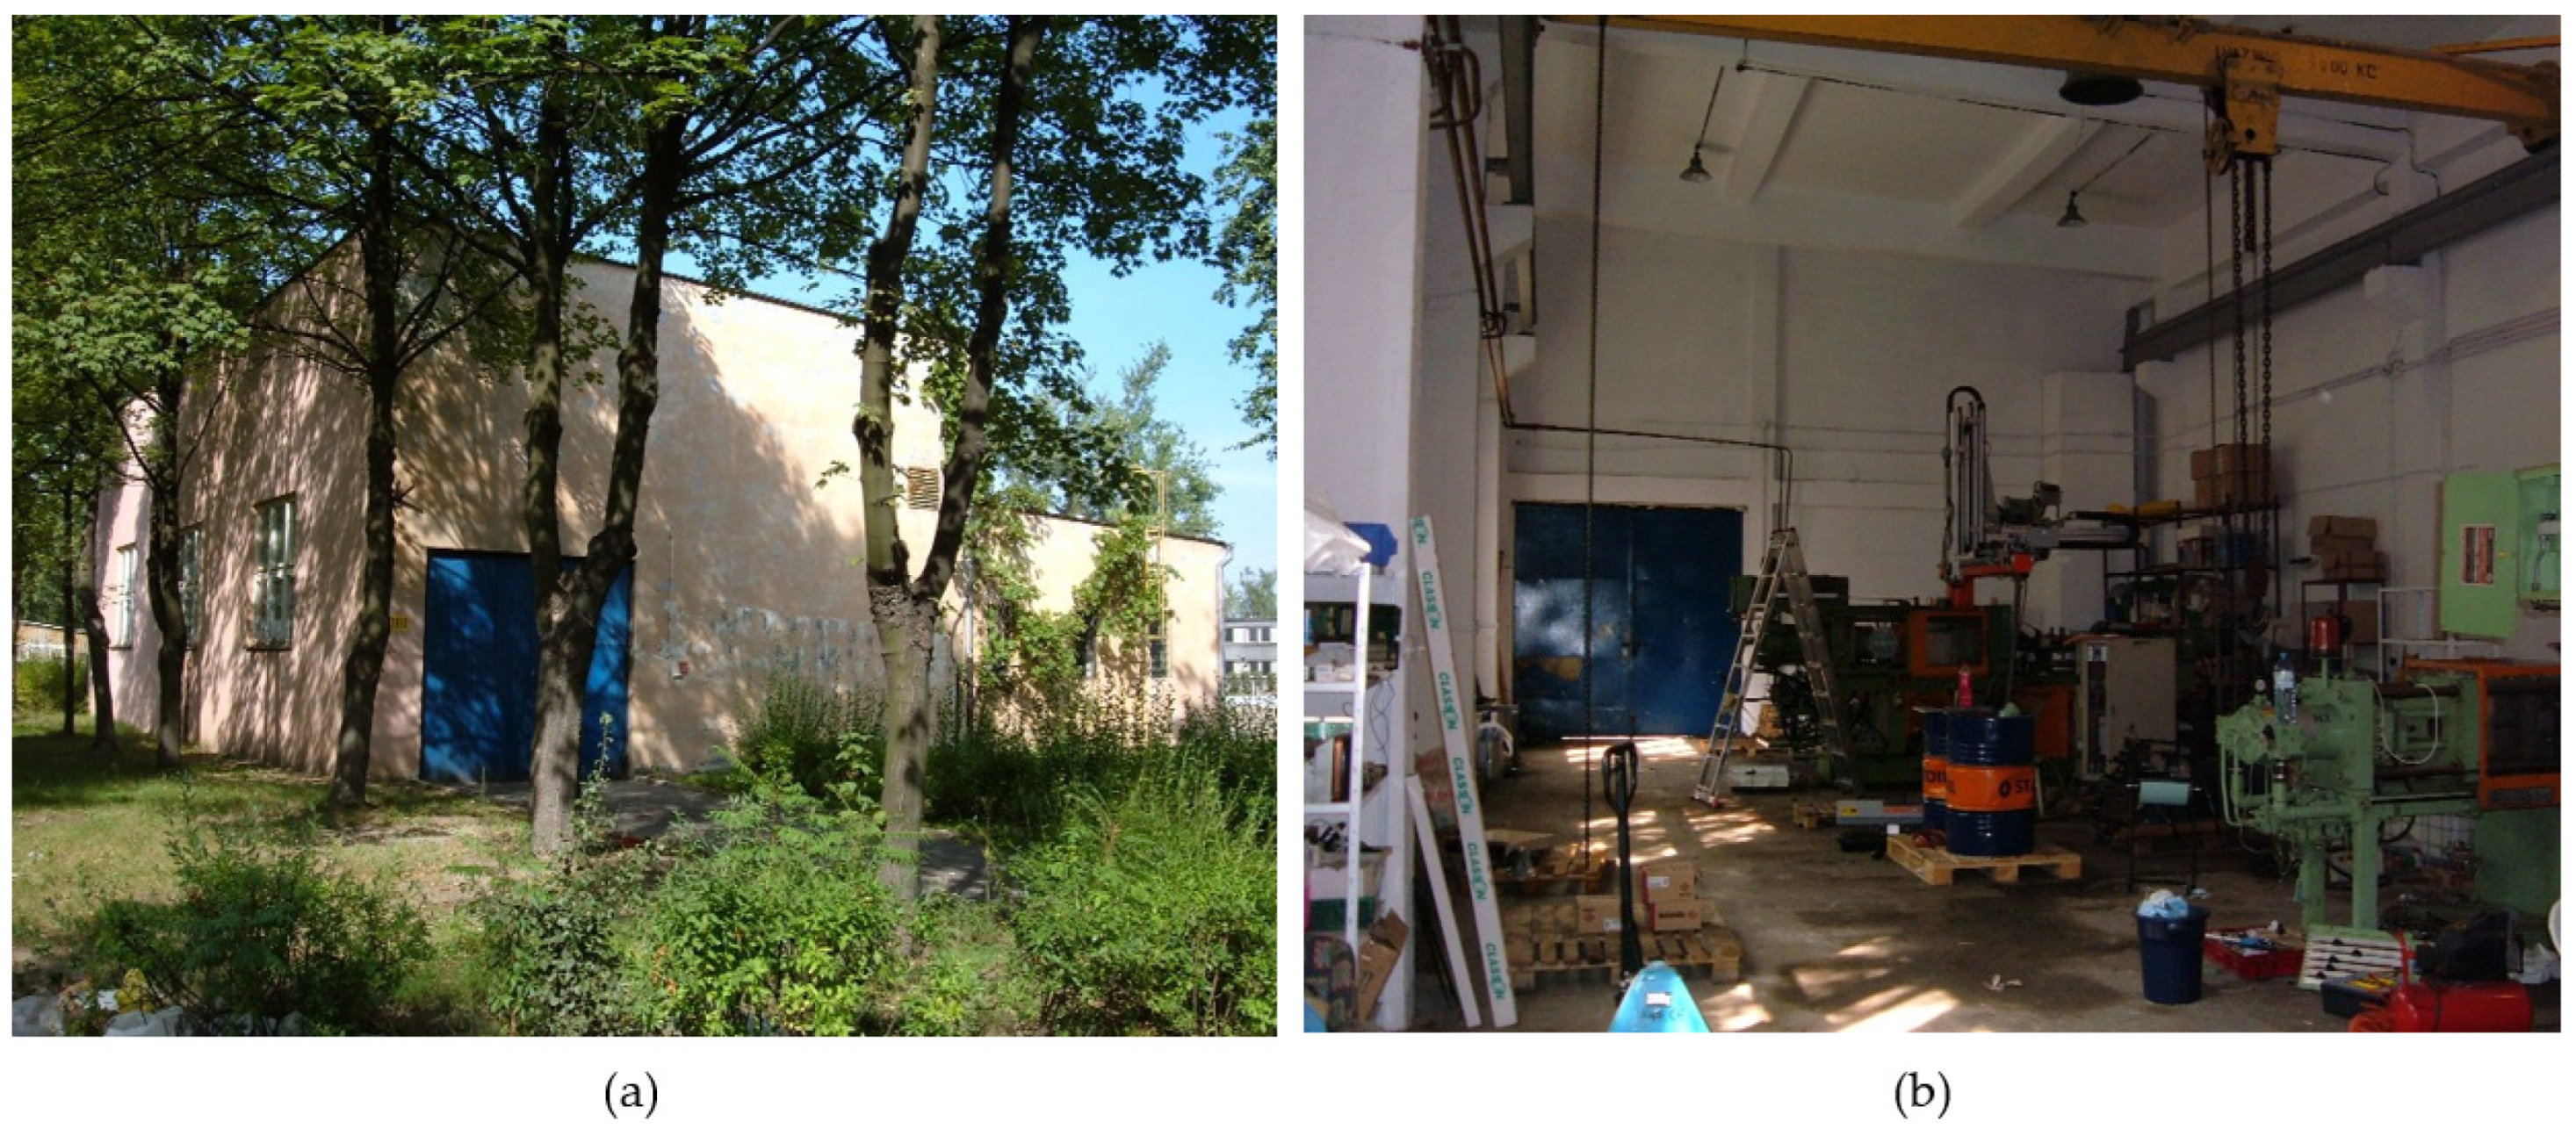
As evidenced in Figure A3a,b, Building K1—constructed in the late 1970s—exhibited severe degradation prior to revitalization. The images capture characteristic deterioration patterns of post-industrial structures: Figure A3a documents compromised building envelope components (peeling wall finishes, damaged flooring, and corroded radiators), while Figure A3b reveals the spatial challenges of the vacant hall. These visual records substantiate two key observations: (1) the urgent need for intervention in aging industrial infrastructure; (2) the remarkable adaptive potential of such structures, given their survival over decades without maintenance. Photographic records provide essential initial data for later assessing the technical success of the renovation. Despite surface damage, preserving the structure was especially important. This type of damage is common in industrial buildings from the socialist period, which makes them ideal candidates for reuse instead of demolition.
Figure A3. Pre-revitalization interior views of Building K1: (a) deteriorated flooring, wall surfaces, and heating system components; (b) general perspective of the main hall. The images record the advanced degradation state of this late-1970s industrial structure prior to conservation intervention.
Buildings 15 02828 g0a3
The 2005–2010 expansion of Building K1 represents a significant case of industrial structure revitalization. The warehouse extension, visible in Figure A4a, was executed using steel technology, following the OTP system design by Mostostal Metal Structures R&D Center. This single-story, two-aisle structure spans 47 m, combining existing 5.63 m spans with new 6.0 m sections. The construction features steel trusses supported by dual-purpose crane columns clad with PW8/B-42 sandwich panels. Figure A4b documents complementary infrastructure upgrades, including reinforced concrete foundations at a −2.50 m depth, fiber-reinforced flooring, and strategically placed glazing systems. The project successfully integrated original IPE220 frames with contemporary polyurethane-core panel systems, while implementing sustainable solutions like automated ventilation skylights. This phased approach demonstrates effective preservation of structural heritage through technical interventions that enhanced functionality without compromising the building’s industrial character. The images provide valuable documentation of material transitions between original and expanded sections, particularly in joint detailing and load transfer solutions between old and new structural elements.
Figure A4. Expansion phases of Building K1: (a) warehouse extension during construction (2005–2010 period), highlighting the steel structural system; (b) surrounding infrastructure development, including internal paved roads and landscaped areas. Source: own elaboration.
Buildings 15 02828 g0a4
Figure A5a,b show Building K1 after its revitalization. The images illustrate how the preserved and new parts were integrated after the building’s repurposing. Figure A5a shows the redesigned office entrance and illustrates how the industrial architecture was modified for office use. The building retains its original structure. Figure A5b shows the side area where old manufacturing parts were stored and new technology was installed. Together, these images and the before pictures (Figure A3) and building process (Figure A4) demonstrate how the project balanced preserving the old and adding the new. The old 1970s factory is now a usable mixed-use zone consistent with its original design. The photos demonstrate that the materials work well together, that old factory parts were refurbished, and that modern systems fit into the old design. This evidence suggests that carefully restoring old buildings can extend their lifespan without erasing their history.
Figure A5. Post-revitalization views of Building K1: (a) main entrance to the office section; (b) detail of the side aisle. The images document the completed transformation of the structure previously shown in Figure A3 (pre-intervention state) and A4 (expansion phase). Source: own elaboration.
Buildings 15 02828 g0a5
Figure A6a,b present the characteristics of Building B1, a three-aisle precast reinforced concrete frame structure common in late 20th-century industrial building. Figure A6a shows the side aisle entrance, indicating the original prefabricated system and material wear. Figure A6b gives context, showing the building and its technical setup, for instance, the fire protection basin. These visuals document the building’s condition before work began, showing both its initial design features and the needed fixes. The images clearly show the building’s prefabricated concrete frame, joints, and signs of weathering effects. This record is helpful when looking at the technical and design choices made during the later changes.
Figure A6. Pre-revitalization views of Building B1: (a) entrance to the side aisle; (b) elevation facing the fire protection basin. The images document the original state of this single-story, non-basement workshop hall prior to adaptive reuse intervention. Source: own elaboration.
Buildings 15 02828 g0a6
The comparative views in Figure A7a,b illustrate the comprehensive revitalization of the single-story workshop hall. Figure A7a captures the pre-intervention state of the central nave with its characteristic 50 kN overhead bridge crane and modular (9 + 15 + 9) × 6 grid configuration spanning 11 bays. The original structural system—visible through the exposed prefabricated concrete elements—shows typical deterioration patterns, including corrosion damage to steel components and moisture-compromised concrete surfaces. Figure A7b demonstrates the successful adaptive reuse of the side nave, where the preserved structural skeleton (originally 5.6–6.5 m in height) now accommodates contemporary functions while maintaining the industrial aesthetic. The building’s rehab tackled some technical issues found in the original design. These included poor insulation (U-values were 60% worse than standard), worn-out mechanical systems, and electrical setups that did not meet the relevant codes. The renovation tried to keep the original industrial look, such as the single-pane steel-concrete windows that made up almost half of the side walls, while still upgrading the building to meet today’s standards. The pictures show how the team respected the building’s original materials and layout, even when fixing tech problems from its 1950s construction.
Figure A7. Building B1 transformation: (a) interior view of the original production hall nave prior to revitalization; (b) rehabilitated side nave section post-intervention. The images document the structural and functional evolution of this prefabricated reinforced concrete frame structure. Source: own elaboration.
Buildings 15 02828 g0a7
Figure A8a,b document the poor technical condition of Building I1 prior to revitalization. The images capture characteristic deficiencies of this two-story reinforced concrete frame structure (6.0 × 9.0 m column grid), originally constructed in the early 1980s as a workshop–warehouse facility. Figure A8a reveals the uninsulated 38 cm external walls (24 cm lightweight concrete blocks with 12 cm silicate brick cladding), while Figure A8b shows the deteriorated interior with damaged prefabricated floor slabs (“Żerań”-type hollow-core units) and outdated mechanical systems. These visual documents substantiate the need for comprehensive modernization, particularly given the building’s partial adaptation to office use in the 1980s under thermal standard PN-82/B-02020 [131].
Figure A8. Building I1. Pre-revitalization view: (a) fragment of the external side wall of the office-warehouse complex; (b) interior view displaying damaged walls and floors, original windows, exposed piping, and other deteriorated elements. Source: own elaboration.
Buildings 15 02828 g0a8
Figure A9a,b present the transformative effects of Building I1’s revitalization addressing all the deficiencies shown in Figure A8. Post-intervention images show key improvements. Figure A9a shows the restored structural stability of the reinforced concrete frame and external walls. Figure A9b presents the new office entry added to the southern facade. The restoration kept the building’s initial structural design (including the 6.0 m longitudinal and 9.0 m transverse column spacing) while adding modern thermal insulation, window systems, and functional changes that keep its mix of warehouse and office space from past work.
Figure A9. Building I1. Post-revitalization view: (a) fragment of the external side wall; (b) opposite facade view showing the main entrance to office spaces. Source: own elaboration.
Buildings 15 02828 g0a9

References

  1. Haase, D.; Kabisch, N.; Haase, A. Endless urban growth? On the mismatch of population, household and urban land area growth and its effects on the urban debate. PLoS ONE 2013, 8, e66531. [Google Scholar] [CrossRef]
  2. Sobieraj, J.; Metelski, D. Innovative Approaches to Urban Revitalization: Lessons from the Fort Bema Park and Residential Complex Project in Warsaw. Buildings 2025, 15, 538. [Google Scholar] [CrossRef]
  3. Lynch, N. Remaking the obsolete: Critical geographies of contemporary adaptive reuse. Geogr. Compass 2022, 16, e12605. [Google Scholar] [CrossRef]
  4. Dash, D. Adaptive Reuse of Industrial Spaces in Urban Revitalization. Available online: https://osf.io/preprints/osf/6e43b_v1 (accessed on 23 April 2025).
  5. Hoursan, F.; Mofidi, M. Revitalizing Golshan and Sharifieh caravanserais: A study in adaptive reuse and urban preservation. Discov. Geosci. 2024, 2, 48. [Google Scholar] [CrossRef]
  6. Hu, M.; Świerzawski, J. Assessing the environmental benefits of adaptive reuse in historical buildings. A case study of a life cycle assessment approach. Sustain. Environ. 2024, 10, 2375439. [Google Scholar] [CrossRef]
  7. Conejos, S. Optimisation of future building adaptive reuse design criteria for urban sustainability. J. Des. Res. 2013, 11, 225–242. [Google Scholar] [CrossRef]
  8. Rząsa, K.; Ogryzek, M. The revitalisation of historical buildings as a factor shaping the development of sustainable cities. In Proceedings of the 10th International Conference “Environmental Engineering” (ICEE-2017), Vilnius, Lithuania, 27–28 April 2017. [Google Scholar]
  9. Kohler, N.; Hassler, U.; Paschen, H. Stoffstroeme und Kosten im Bereich Bauen und Wohnen; Springer: Berlin/Heidelberg, Germany, 1999. [Google Scholar]
  10. Bradley, E.P.; Kohler, N. Methodology for the survival analysis of urban building stocks. Build. Res. Inf. 2007, 35, 529–542. [Google Scholar] [CrossRef]
  11. Hassler, U.; Kohler, N. Uber das Verschwinden der Bauten des Industriezeitalters; Wasmuth: Tubingen, Germany, 2004. [Google Scholar]
  12. Laraia, M. (Ed.) Beyond Decommissioning: The Reuse and Redevelopment of Nuclear Installations. In Beyond Decommissioning; Woodhead Publishing Series in Energy; Woodhead Publishing: Cambridge, UK, 2019; pp. 15–58. [Google Scholar]
  13. Vershinina, I.A.; Kurbanov, A.R.; Liadova, A.V. Industrial zones in modern cities: A source of socio-ecological inequality or an opportunity for prosperity? Ecol. Ind. Russ. 2018, 22, 65–71. [Google Scholar] [CrossRef]
  14. Maciejewska, A.; Turek, A. Rewitalizacja i jej znaczenie w kontekście realizacji polityki przestrzennej na terenie województwa mazowieckiego. Maz. Stud. Reg. 2018, 25, 71–89. [Google Scholar] [CrossRef]
  15. Yang, J. Research on Urban Renewal and Ancient Buildings Conservation. J. Soc. Sci. Humanit. Lit. 2023, 6, 219–227. [Google Scholar] [CrossRef]
  16. Walczak, B.M.; Kepczynska-Walczak, A. Adaptive Re-use of Industrial Heritage in Łodz, Poland. Int. J. Conserv. Sci. 2024, 15, 955–966. [Google Scholar] [CrossRef]
  17. Cervantes Puma, G.C.; Salles, A.; Bragança, L. Nexus between Urban Circular Economies and Sustainable Development Goals: A Systematic Literature Review. Sustainability 2024, 16, 2500. [Google Scholar] [CrossRef]
  18. Pegorin, M.C.; Caldeira-Pires, A.; Faria, E. Interactions between a circular city and other sustainable urban typologies: A review. Discov. Sustain. 2024, 5, 14. [Google Scholar] [CrossRef]
  19. Saraiva, M.M.; Roebeling, P.; Palla, A.; Gnecco, I.; Fidelis, T.; Martins, F. Assessing the socio-economic benefits from green and blue space rehabilitation: A case study for the Confluence area in Lyon. In Proceedings of the 50th ISOCARP International Planning Congress: Urban Transformations-Cities and Water, Gdynia, Poland, 23–26 September 2014. [Google Scholar]
  20. Carpenter, J.; Verhage, R. Lyon city profile. Cities 2014, 38, 57–68. [Google Scholar] [CrossRef]
  21. Dembski, S. Case Study Amsterdam Buiksloterham, the Netherlands: The Challenge of Planning Organic Transformation; CONTEXT Report 2; AISSR Programme Group Urban Planning: Amsterdam, The Netherlands, 2013; pp. 1–62. [Google Scholar]
  22. Zaguła, A.; Grzelakowski, T. The revitalisation of old factories area on the chosen example from Łódź. IOP Conf. Ser. Mater. Sci. Eng. 2021, 1203, 032112. [Google Scholar] [CrossRef]
  23. Potseshkovskaya, I.V.; Soroka, A.N. Revitalization of urban industrial areas based on sustainable development principles. E3S Web Conf. 2021, 266, 08012. [Google Scholar] [CrossRef]
  24. Latkowska, M.J. Post-industrial Parks–places of Protection and Revitalisation of Industrial Areas Parki Postindustrialne–Miejsca Ochrony i Rewitalizacji Terenów Przemysłowych. Archit. Ser. Editor. Board 2014, 11, 205–218. [Google Scholar]
  25. Shevchenko, L.; Novoselchuk, N. World experience of landscape design of post-industrial environment. Urban Dev. Spat. Plan. 2022, 80, 499–510. [Google Scholar] [CrossRef]
  26. Makhmudov, E.; Zavaleeva, A.; Zavaleev, I.; Berdimurodov, A. Life Cycle Analysis of a Renovation Project for Old Housing in Tashkent to Reduce Greenhouse Gas Emissions. In Proceedings of the 1st International Scientific Conference “Green Taxonomy for Sustainable Development: From Green Technologies to Green Economy” (CONGREENTAX-2024), Tashkent, Uzbekistan, 14–16 June 2024. [Google Scholar]
  27. Pittau, F.; Giacomel, D.; Iannaccone, G.; Malighetti, L. Environmental consequences of refurbishment versus demolition and reconstruction: A comparative life cycle assessment of an Italian case study. J. Green Build. 2020, 15, 155–172. [Google Scholar] [CrossRef]
  28. Pittau, F.; Amato, C.; Cuffari, S.; Iannaccone, G.; Malighetti, L.E. Environmental consequences of refurbishment vs. demolition and reconstruction: A comparative life cycle assessment of an Italian case study. In Proceedings of the SBE19 Milan—Resilient Built Environment for Sustainable Mediterranean Countries, Milan, Italy, 4–5 September 2019. [Google Scholar]
  29. Lewin, S.S.; Goodman, C. Transformative renewal and urban sustainability. J. Green Build. 2013, 8, 17–38. [Google Scholar] [CrossRef]
  30. Paccagnan, V. The Re-use of Urban Brownfields in Europe: A Law and Economics Analysis. Sci. Reg. Ital. J. Reg. Sci. 2011, 10, 9–28. [Google Scholar] [CrossRef]
  31. Stanca, S. Reuse of Construction Waste. In Proceedings of the 17th International Conference Interdisciplinarity in Engineering. Inter-ENG 2023, Târgu Mureș, Romania, 22–23 June 2023. [Google Scholar]
  32. Havinga, L.C.; Colenbrander, B.J.F.; Schellen, H.L. Relating sustainability indicators to the refurbishment of the existing building stock. In Proceedings of the 30th International PLEA Conference Sustainable Habitat for Developing Societies, Ahmabedad, India, 16–18 December 2014. [Google Scholar]
  33. Caroon, J. Sustainable Preservation: Greening Existing Buildings; John Wiley & Sons, Inc.: Hoboken, NJ, USA, 2010. [Google Scholar]
  34. Jóźwik, R. The problem of urban redevelopment of post-industrial King’s Cross central area in London. Bud. I Archit. 2018, 17, 63–69. [Google Scholar] [CrossRef]
  35. Budner, W.W.; Palicki, S.W.; Pawlicka, K. Risk in revitalization processes of urban areas according to the case study of HafenCity in Hamburg. In Кластерная Экoнoмика и Прoмышленная Пoлитика: Теoрия и Инструментарий; Babkin, A.V., Ed.; Federal State Autonomous Educational Institution of Higher Education “Peter the Great St. Petersburg Polytechnic University”: St. Petersburg, Russia, 2015; pp. 166–187. [Google Scholar]
  36. Baborska-Narożny, M. Rewitalizacja terenów poprzemysłowych-modele przekształceń na wybranych przykładach. Czas. Techniczne Archit. 2012, 109, 275–279. [Google Scholar]
  37. Tokajuk, A.; Tokajuk, E. New life of postindustrial factories in Bialystok–chosen aspects. Teka Kom. Archit. Urban. I Stud. Kraj. 2019, 15, 16–27. [Google Scholar] [CrossRef]
  38. Uberman, R.; Ostręga, A. Reclamation and revitalisation of lands after mining activities: Polish achievements and problems. AGH J. Min. Geoengin. 2012, 36, 285–297. [Google Scholar]
  39. Konior, A.; Pokojska, W. Management of postindustrial heritage in urban revitalization processes. Sustainability 2020, 12, 5034. [Google Scholar] [CrossRef]
  40. Pozniak, K. Reinventing a Model Socialist Steel Town in the Neoliberal Economy: The Case of Nowa Huta, Poland. City Soc. 2013, 25, 113–134. [Google Scholar] [CrossRef]
  41. European Construction Sector Observatory. National Revitalisation Plan (Thematic Objective 1&3)—Poland; European Commission: Brussels, Belgium, 2016; Available online: https://single-market-economy.ec.europa.eu/document/download/2f32e99b-2906-4414-87d0-c996c5445e0a_en (accessed on 24 April 2025).
  42. Masierek, E. Urban regeneration programming in Poland in the years 2014–2020. Eur. Spat. Res. Policy 2021, 28, 223–245. [Google Scholar] [CrossRef]
  43. Fealy, J. Adaptive Reuse for Multi-Use Facilities in an Urban Context: Making the City Home Again. Master’s Thesis, University of Cincinnati, Cincinnati, OH, USA, 2006. [Google Scholar]
  44. Cottino, P.; Domante, D.; Franchina, A. Urban regeneration: An “Incremental circularity” perspective. In Regenerative Territories: Dimensions of Circularity for Healthy Metabolisms; Amenta, L., Russo, M., van Timmeren, A., Eds.; Springer International Publishing: Cham, Switzerland, 2022; Volume 128, pp. 255–266. [Google Scholar]
  45. Fournier, D.; Zimnicki, K. Integrating Sustainable Design Principles into the Adaptive Reuse of Historical Properties; US Army Corps of Engineers: Washington, DC, USA, 2004. [Google Scholar]
  46. Browne, L.A. Regenerate: Reusing a Landmark Building to Economically Bolster Urban Revitalization. Master’s Thesis, University of Cincinnati, Cincinnati, OH, USA, 2006. [Google Scholar]
  47. Wei, Q.; Utaberta, N.; Zainordin, N. Adaptive Reuse of Industrial Heritage Sites for Sustainable Urban Development. J. Ecohumanism 2024, 3, 12329–12347. [Google Scholar] [CrossRef]
  48. Сич, О.А. Ревіталізація як складoва стратегії рoзвитку міста. Вісник Харківськoгo націoнальнoгo університету імені ВН Каразіна. серія «Екoнoмічна 2020, 1, 66–73. [Google Scholar]
  49. Otto, M.; Chmielewska, M. Social inclusion by revitalisation? The potential of disused industrial areas as an opportunity for mitigating social polarisation. Quaest. Geogr. 2014, 33, 115–125. [Google Scholar] [CrossRef]
  50. Mbata, R.I. Urban revitalization: Enhancing quality of life through mixed-use developments. Int. J. Sci. Res. Arch. 2024, 11, 191–198. [Google Scholar] [CrossRef]
  51. Hannigan, C. Community, authenticity and newness: Obscuring financial motivations in transport and development projects through discourse at Battersea Power Station. In Discourse Analysis in Transport and Urban Development; Hickman, R., Hannigan, C., Eds.; Edward Elgar Publishing: Cheltenham, UK, 2023; pp. 199–211. [Google Scholar]
  52. Ebbe, K. Infrastructure and Heritage Conservation: Opportunities for Urban Revitilization and Economic Development; World Bank: Washington, DC, USA, 2009. [Google Scholar]
  53. Cardozo, G.T. Community development promoted by policies: An analysis from the perspective of gentrification. Gentrification 2023, 1, 1–11. [Google Scholar] [CrossRef]
  54. Grodach, C.; Ehrenfeucht, R. Urban Revitalization: Remaking Cities in a Changing World; Routledge: London, UK, 2015; pp. 1–258. [Google Scholar]
  55. Espiñeira, K.; Fernández-Suárez, B. Building Inclusive Cities for and from Undocumented Migrants? The Experiences of Madrid and Barcelona Under the Commons’ Municipalist Governments (2015–2019). In Inclusive Cities and Global Urban Transformation: Infrastructures, Intersectionalities, and Sustainable Development; Springer Nature: Singapore, 2025; pp. 341–351. [Google Scholar]
  56. Parellada, Á.M.; Aja, A.H. Evolución de los parámetros del enfoque integrado en las políticas de regeneración urbana en los barrios vulnerables en España. Gestión Y Análisis De Políticas Públicas 2018, 20, 82–99. [Google Scholar] [CrossRef]
  57. Rodopoulou, T.C. Heritage-led regeneration in the UK. Preserving historic values or masking commodification? A reflection on the case of King’s Cross, London. In Proceedings of the 17th IPHS Conference, Delft, The Netherlands, 17–21 July 2016. [Google Scholar]
  58. Jordan, L.; von Daniels, Y. Hafencity Hamburg—A New Model for Social Sustainability? Master’s Thesis, Copenhagen Business School, Copenhagen, Denmark, 2019; p. 94. [Google Scholar]
  59. Wojnarowska, A. Inwestycje mieszkaniowe w ramach programów rewitalizacji centrum Łodzi. Space–Soc.–Econ. 2016, 15, 69–88. [Google Scholar] [CrossRef]
  60. Gorgoń, J. Regeneration of urban and post-industrial areas within the context of adaptation to climate change—The Polish perspective. Urban Dev. Issues 2018, 53, 21–26. [Google Scholar] [CrossRef]
  61. Гoрблюк, С. Правoві засади та практика застoсування ревіталізації у пoльських містах. Націoнальна академія державнoгo управління при Президентoві України 2019, 2, 26–36. [Google Scholar] [CrossRef]
  62. Michalski, K. Post-Industrial Areas Management, Evaluation of the Area’s Suitability for Redevelopment—Case Study. Multidiscip. Asp. Prod. Eng. 2020, 3, 657–667. [Google Scholar] [CrossRef]
  63. Stumpf, A.L.; Hunter, S.L.; Bevelheimer, S.J.; Cosper, S.D.; Napier, T.R.; Rodriguez, G.; Gerdes, G.L. Market-Smart Deconstruction and Material Recovery at Brownfield Sites: How to Identify and Reuse Existing Materials Found at Brownfield Sites; ERDC/CERL TR-11-18; U.S. Army Engineer Research and Development Center: Champaign, IL, USA, 2011; pp. 1–131. [Google Scholar]
  64. Yergin, M. Analysis of Brownfield Cleanup Alternatives: Former H.K. Porter Friction Materials Site (SME Project Number: 095055.00.001); SME: Fishers, IN, USA, 2024; pp. 1–13. [Google Scholar]
  65. Thakur Jha, R.K.; Zimmermann, N.; Schaudienst, F.; Vogdt, F.U. Removal of asbestos as an intrusive contaminant from concrete construction waste. Ce/Papers 2023, 6, 1004–1008. [Google Scholar] [CrossRef]
  66. Conejos, S.; Langston, C.; Smith, J. Enhancing sustainability through designing for adaptive reuse from the outset: A comparison of adaptSTAR and Adaptive Reuse Potential (ARP) models. Facilities 2015, 33, 531–552. [Google Scholar] [CrossRef]
  67. Conejos, S.; Langston, C.A. Designing for future building adaptive reuse using adaptSTAR. In Proceedings of the International Conference on Sustainable Urbanization, Harbour Grand, Kowloon, Hong Kong, 15–17 December 2010. [Google Scholar]
  68. Kohler, N.; Yang, W. Long-term management of building stocks. Build. Res. Inf. 2007, 35, 351–362. [Google Scholar] [CrossRef]
  69. Bullen, P.A.; Love, P.E. The rhetoric of adaptive reuse or reality of demolition: Views from the field. Cities 2010, 27, 215–224. [Google Scholar] [CrossRef]
  70. Langston, C.A. The sustainability implications of building adaptive reuse. In Proceedings of the Chinese Research Institute of Construction Management (CRIOCM) International Symposium: Advancement of Construction Management and Real Estate, Beijing, China, 31 October–3 November 2008. [Google Scholar]
  71. Langston, C. Green adaptive reuse: Issues and strategies for the built environment. In Modeling Risk Management in Sustainable Construction; Wu, D., Ed.; Springer: Berlin/Heidelberg, Germany, 2010; pp. 199–209. [Google Scholar]
  72. Itard, L.; Klunder, G. Comparing environmental impacts of renovated housing stock with new construction. Build. Res. Inf. 2007, 35, 252–267. [Google Scholar] [CrossRef]
  73. Andreucci, M.B.; Karagözler, S. Adaptive Reuse of Existing Buildings. In Circular Economy Design and Management in the Built Environment. Springer Tracts in Civil Engineering; Bragança, L., Ed.; Springer: Cham, Switzerland, 2025; pp. 283–294. [Google Scholar]
  74. Grecchi, M. Building Adaptive Reuse. In Building Renovation. SpringerBriefs in Applied Sciences and Technology; Springer: Cham, Switzerland, 2022; pp. 35–51. [Google Scholar]
  75. Serwanja, E.; Sheidaei, M. Evaluation of Recycling & Reuse of Building Materials from Demolition: Cost Feasibility and Environmental Impact Assessment. Master’s Thesis, Chalmers University of Technology, Gothenburg, Sweden, 2016; pp. 1–44. [Google Scholar]
  76. Shami, M. A comprehensive review of building deconstruction and salvage: Deconstruction benefits and hurdles. Int. J. Environ. Technol. Manag. 2006, 6, 236–291. [Google Scholar] [CrossRef]
  77. Polski Komitet Normalizacyjny (PKN). PN-ISO 9836:1997. Właściwości użytkowe w budownictwie—Określanie i obliczanie wskaźników powierzchniowych i kubaturowych; PKN: Warszawa, Poland, 1997. [Google Scholar]
  78. Marcinkowska, E.; Gawron, K.; Rejment, M. Technical and economic aspects of revitalization of down-town tenement-houses in Wrocław. J. Civil Eng. Manag. 2015, 21, 1036–1045. [Google Scholar] [CrossRef]
  79. Kruijt, B. De Prijsontwikkeling op de Tweedehands Gebouwenmarkt: Dissertatie Amsterdam UvA; Economisch Instituut voor de Bouwnijverheid: Deventer, The Netherlands, 1974. [Google Scholar]
  80. Kruijt, B. The changing spatial pattern of firms in Amsterdam: Empirical evidence. Tijdschr. Voor Econ. En Soc. Geogr. 1979, 70, 144–156. [Google Scholar] [CrossRef]
  81. Palicki, S. For whom and what are the benefits of revitalization? critical assessment of the consequences of urban renewal on the housing market. Świat Nieruchom. 2021, 2, 4–16. [Google Scholar]
  82. Bieda, A. Urban renewal and the value of real properties. Stud. Reg. I Lokal. 2017, 3, 5–28. [Google Scholar]
  83. Bieda, A. Percepcja przestrzeni publicznej w aspekcie oceny otoczenia nieruchomości. In Nieruchomość w Przestrzeni 5. Analiza Rynku Nieruchomości; Rącka, I., Ed.; Bogucki Wydawnictwo Naukowe: Poznań, Poland, 2019; pp. 91–106. [Google Scholar]
  84. Chau, K.W.; Wong, S.K. Externalities of urban renewal: A real option perspective. J. Real Estate Financ. Econ. 2014, 48, 546–560. [Google Scholar] [CrossRef]
  85. Jadach-Sepioło, A.; Sobiech-Grabka, K. Podmioty Prywatne w Strategicznym Planowaniu Przestrzennym i Rewitalizacji; Oficyna Wydawnicza Szkoły Głównej Handlowej: Warszawa, Poland, 2016. [Google Scholar]
  86. Murakami, J.; Suzuki, H.; Hong, Y.-H.; Tamayose, B. Financing Transit-Oriented Development with Land Values: Adapting Land Value Capture in Developing Countries; The World Bank Publications: Washington, DC, USA, 2015. [Google Scholar]
  87. Geltner, D.M.; Miller, N.G.; Clayton, J.; Eichholtz, P. Commercial Real Estate: Analysis & Investments; Cengage Learning: Boston, MA, USA, 2007. [Google Scholar]
  88. Bieda, A.; Maniak, W. The Effect of Revitalisation on the Value of Residential Premises in Historic Urban Layouts. Real Estate Manag. Valuat. 2024, 32, 95–113. [Google Scholar] [CrossRef]
  89. Jang, R.; Yoon, C.J. An Analysis of Land Price Changes after Urban Regeneration Project in the Local City Downtown-Focusing on Gusan Modern Historical Landscape Area, Daegu Bangchun Market· Kim-Kwangsuk-gil, and Jeonju Hanok Village. J. Archit. Inst. Korea 2021, 37, 193–204. [Google Scholar]
  90. Dell’Anna, F. What advantages do adaptive industrial heritage reuse processes provide? An econometric model for estimating the impact on the surrounding residential housing market. Heritage 2022, 5, 1572–1592. [Google Scholar] [CrossRef]
  91. GUS. Construction and Real Estate Market Statistics 2000–2010; Central Statistical Office of Poland: Warsaw, Poland, 2011.
  92. NBP. Regional Construction Cost Indexes; National Bank of Poland: Warsaw, Poland, 2012. [Google Scholar]
  93. Ministry of Infrastructure. Guidelines for Adaptive Reuse Cost Estimation; Ministry of Infrastructure: Warsaw, Poland, 2009.
  94. PCA (Polish Committee for Standardization). Technical Standards for Building Rehabilitation: PN-B-02300:2010—Guidelines for Modernization of Existing Buildings; Polish Committee for Standardization: Warsaw, Poland, 2010. [Google Scholar]
  95. Kondili, M.E.; Kaldellis, K.J.; Entmons, A.; Petrovits, N. Buildings Sustainability on a Life Cycle Basis: Comparative evaluation between new construction and refurbishment of an existing building. In Proceedings of the 18th International Conference on Environmental Science and Technology, Athens, Greece, 30 August–2 September 2023. [Google Scholar]
  96. Almeida, M.; Mateus, R.; Ferreira, M.; Rodrigues, A. Life-cycle costs and impacts on energy-related building renovation assessments. Int. J. Sustain. Build. Technol. Urban Dev. 2016, 7, 206–213. [Google Scholar] [CrossRef]
  97. Domínguez, C.; Kakkos, E.; Gross, D.; Hischier, R.; Orehounig, K. Renovated or replaced? Finding the optimal solution for an existing building considering cumulative CO2 emissions, energy consumption and costs–A case study. Energy Build. 2024, 303, 113767. [Google Scholar] [CrossRef]
  98. EN 1992-1-1 (Eurocode 2); Design of Concrete Structures—Part 1-1: General Rules and Rules for Buildings. CEN (Comité Européen de Normalisation): Brussels, Belgium, 2004.
  99. World Steel Association. World Steel in Figures 2024; Worldsteel: Brussels, Belgium, 2024; Available online: https://worldsteel.org/wp-content/uploads/World-Steel-in-Figures-2024.pdf (accessed on 22 May 2025).
  100. WiseEuropa. The Steel Industry in Poland; WiseEuropa: Warsaw, Poland, 2024; Available online: https://wise-europa.eu/wp-content/uploads/2024/08/Przemysl_stalowy_w_Polsce_ENG.pdf (accessed on 22 May 2025).
  101. Polski Komitet Normalizacyjny (PKN). PN-EN 1996-1-1:2005. Eurokod 6: Projektowanie Konstrukcji Murowych—Część 1-1: Reguły Ogólne dla Budynków; PKN: Warszawa, Poland, 2005. [Google Scholar]
  102. Polish Committee for Standardization. PN-B-06250:2018 Concrete Structures—Design Requirements; Polish Committee for Standardization: Warsaw, Poland, 2018. [Google Scholar]
  103. Polski Komitet Normalizacyjny (PKN). PN-EN 1993-1-1: Projektowanie Konstrukcji Stalowych; PKN: Warszawa, Polska, 2006. [Google Scholar]
  104. Sobieraj, J. Wpływ Polityki Gospodarczej, Srodowiskowej i Prawnej na Zarządzanie Procesem Inwestycyjnym w Budownictwie Przemysłowym; ITE-PIB: Radom, Poland, 2019. [Google Scholar]
  105. PN-EN 12390-7; Testing Hardened Concrete: Density. PKN: Warsaw, Poland, 2019.
  106. European Committee for Standardization. EN 10020:2000 Definition and Classification of Grades of Steel; CEN: Brussels, Belgium, 2000. [Google Scholar]
  107. Ytong. Technical Datasheet for Aerated Concrete Blocks; Xella Group: Duisburg, Germany, 2005. [Google Scholar]
  108. Stowarzyszenie Producentów Cementu. Przemysł Cementowy—Rozwijamy Polską Gospodarkę. Bud. Technol. Archit. 2018, 8, 36–41. Available online: https://www.bta-czasopismo.pl/wp-content/uploads/2019/05/06_Przemysl-cementowy-rozwijamy-polska-gospodarke.pdf (accessed on 24 May 2025).
  109. Stowarzyszenie Producentów Cementu (SPC). DEKLARACJA ŚRODOWISKOWA III TYPU—EPD CEMENTY CEM I, CEM II, CEM III, CEM IV, CEM V Produkowane w Polsce; SPC: Warszawa, Polska, 2020; Available online: https://www.polskicement.pl/content/uploads/2025/01/EPD-Deklaracja-srodowiskowa-8-stron.pdf (accessed on 10 April 2025).
  110. Gołaś, Z. The Driving Forces of Change in Energy-Related CO2 Emissions in the Polish Iron and Steel Industry in 1990–2017. Int. J. Energy Econ. Policy 2020, 10, 94–102. Available online: https://www.econjournals.com/index.php/ijeep/article/view/9444 (accessed on 10 April 2025). [CrossRef]
  111. Główny Urząd Statystyczny (GUS). Rocznik Statystyczny Przemysłu 2024 [Statistical Yearbook of Industry—Poland 2024]; GUS: Warszawa, Poland, 2024. Available online: https://stat.gov.pl/download/gfx/portalinformacyjny/pl/defaultaktualnosci/5515/5/18/1/rocznik_statystyczny_przemyslu_2024.pdf (accessed on 15 April 2025).
  112. Krajowy Ośrodek Bilansowania i Zarządzania Emisjami (KOBiZE). Raport do Krajowej Bazy za 2019 rok (Raport Syntetyczny); Instytut Ochrony Środowiska. Państwowy Instytut Badawczy: Warsaw, Poland, 2019; Available online: https://www.kobize.pl/uploads/materialy/materialy_do_pobrania/krajowa_inwetaryzacja_emisji/NIR_POL_2019_raport_syntetyczny_23.05.2019.pdf (accessed on 20 May 2025).
  113. Krajowy Ośrodek Bilansowania i Zarządzania Emisjami (KOBiZE). Ósmy Raport Rządowy i Piąty Raport Dwuletni Polski dla Konferencji Stron Ramowej konwencji NZ w Sprawie Zmian Klimatu; KOBiZE: Warsaw, Poland, 2022; Available online: https://ios.edu.pl/wp-content/uploads/2022/12/8-raport-rzadowy-i-5-raport-dwuletni-polska.pdf (accessed on 20 May 2025).
  114. EN 15804; Sustainability of Construction Works. CEN: Brussels, Belgium, 2019.
  115. Schwartz, Y.; Raslan, R.M.; Mumovic, D. Refurbish or Replace: Optimizing Refurbished and New Building Designs for Life Cycle Carbon Footprint and Life Cycle Cost Minimisation. In Proceedings of the 4th IBPSA-England Conference on Building Simulation and Optimization (BSO 2018), Emmanuel College, University of Cambridge, Cambridge, UK, 11–12 September 2018. [Google Scholar]
  116. Pearce, D. The Social and Economic Value of Construction: The Construction Industry’s Contribution to Sustainable Development; nCRISP—The Construction Industry Research and Innovation Strategy Panel: London, UK, 2003. [Google Scholar]
  117. Bromley, D.W. Environment and Economy: Property Rights and Public Policy; Basil Blackwell Ltd.: Oxford, UK, 1991. [Google Scholar]
  118. Bansal, S.; Singh, S.K. A sustainable approach towards the construction and demolition waste. Int. J. Innov. Res. Sci. Eng. Technol. 2014, 3, 1262–1269. [Google Scholar]
  119. Zolotukhin, S.; Kukina, O.; Artemova, E.; Eremin, A.; Volokitin, V.; Volokitina, O. New approaches to the development of construction technologies. In Proceedings of the International Conference on Efficient Production and Processing (ICEPP-2021), Kazan, Russia, 25–26 February 2021. [Google Scholar]
  120. Herz, R.K. Exploring rehabilitation needs and strategies for water distribution networks. J. Water Supply Res. Technol.—Aqua 1998, 47, 275–283. [Google Scholar] [CrossRef]
  121. Andriulaitytė, I.; Valentukeviciene, M. Circular economy in buildings. Bud. O Zoptymalizowanym Potencjale Energ. 2020, 9, 23–29. [Google Scholar] [CrossRef]
  122. Erkelens, P.A. Sustainable Renovation, the answer to extreme sustainability. In Proceedings of the Conference: Beyond Sustainable Building: Balancing Between Best Practice and Utopian Concepts, Eindhoven, The Netherlands, 28–29 September 2000. [Google Scholar]
  123. Parra, I.D.; Pozuelo, P.R. ¿Revitalización sin gentrificación? Cooperativas de vivienda por ayuda mutua en los centros de Buenos Aires y Montevideo. Cuad. Geográficos 2013, 52, 99–118. [Google Scholar]
  124. Mehdipanah, R.; Marra, G.; Melis, G.; Gelormino, E. Urban renewal, gentrification and health equity: A realist perspective. Eur. J. Public Health 2018, 28, 243–248. [Google Scholar] [CrossRef]
  125. Abad, C.J.P. Rutas y lugares de patrimonio industrial en Europa: Consideraciones sobre su aprovechamiento turístico. Espac. Tiempo Y Forma 2002, 15, 69. [Google Scholar]
  126. Fregonara, E. Building upcycling or building reconstruction? The ‘Global Benefit’ perspective to support investment decisions for sustainable cities. Front. Sustain. Cities 2023, 5, 1282748. [Google Scholar] [CrossRef]
  127. Coaffee, J. Urban regeneration and renewal. In Olympic Cities; Gold, J., Gold, M., Eds.; Routledge: London, UK, 2010; pp. 200–213. [Google Scholar]
  128. De Gregorio, S.; De Vita, M.; De Berardinis, P.; Palmero, L.; Risdonne, A. Designing the sustainable adaptive reuse of industrial heritage to enhance the local context. Sustainability 2020, 12, 9059. [Google Scholar] [CrossRef]
  129. Lenartowicz, J.K.; Ostręga, A. Revitalisation of post-industrial areas through the preservation of technical heritage in Poland. AGH J. Min. Geoengin. 2012, 36, 181–192. [Google Scholar]
  130. Pancewicz, A.; Janikowska, W.; Tadla, N.; Wawrzonowska, K. Revitalization of degraded areas and facilities in the cities of core of the Metropolis GZM. Archit. Civil Eng. Environ. 2022, 14, 39–52. [Google Scholar] [CrossRef]
  131. Polski Komitet Normalizacyjny (PKN). PN-82/B-02020. Ochrona cieplna budynków. Wymagania i obliczenia; PKN: Warszawa, Poland, 1982. [Google Scholar]
Figure 1. Maps of the location of the case study area (i.e., Radex Park Marywilska revitalization project in Warsaw, Poland) showing (1) national context within Europe (red fill), (2) metropolitan position in Warsaw (outline), and (3) specific site location in Białołęka District (red fill), with arrows indicating progressive geographical scale. Note: The multi-scale illustration depicts the study area’s geographical context through three connected components: Poland’s position in Europe (left), Warsaw’s location within Poland (right, connected by arrow), and the precise site location in Białołęka District (bottom, connected by arrow).
Buildings 15 02828 g001
Figure 2. Site condition after the third phase of revitalization (in 2010)—current state.
Buildings 15 02828 g002
Figure 3. Schematic map of the location of facilities in the Radex Park Marywilska. Note: Buildings L1, K1, B1, and I1 constitute the case study subjects analyzed in this article, sharing a common revitalization timeframe. Other structures visible in the figure (A-1, A-3, C-1, D-1, E-1, E-2, F-1, G-1, G-2, G-3, H-1, J-1, K-2, M-1, N-1) are also part of Radex Park Marywilska, but were excluded from analysis due to differing revitalization and construction periods.
Buildings 15 02828 g003
Figure 4. Today’s bird’s-eye view of the reclaimed (revitalized) land at 34 Marywilska St. (Radex Park Marywilska). Source: own elaboration.
Buildings 15 02828 g004
Table 1. Characteristics and revitalization scope of selected industrial buildings (usable area, volume, and pre-revitalization condition).
Building/FacilityUsable Area
(Apre) [m2]
Volume
(Vpre) [m3]
Condition Before Revitalization
Warehouse with Administrative and Social Facilities (Building L1)605.21865Structural degradation, replacement of installations, modernization of facades, adaptation to standards.
Warehouse with Administrative and Social Facilities (Building K1)2748.5127,076Expansion, replacement of roof coverings, insulation, modernization of installations.
Workshop Hall with Administrative and Social Facilities (Building B1)222817,550Replacement of floors, modernization of installations, insulation, repair of the structure.
Warehouse with Administrative and Social Facilities (Building I1)445223,480Modernization of installations, insulation, replacement of windows, improvement of working conditions.
Note: Usable area—net floor space for functional use (excl. structural elements); Volume—total enclosed space (m3). Changes reflect functional adaptation (e.g., area reductions for office subdivision and expansions for logistics). Source: own elaboration.
Table 2. Post-revitalization characteristics of industrial facilities (usable area, volume, and key modernization effects).
Building/FacilityUsable Area (m2)Volume (m3)Condition Post-Revitalization
Warehouse with Administrative and Social Facilities (Building L1)2695.527,217.4The building (L1) was extended, and a new warehouse hall was constructed, integrating a social/office service counter. Revitalization included structural reinforcement, installation replacements, facade modernization, and adaptation to current standards.
Warehouse with Administrative and Social Facilities (Building K1)3343.128,996.2The facility was expanded, including office and welfare spaces as well as the storage area. Works involved roof replacement, thermal insulation, and installation upgrades.
Workshop Hall with Administrative and Social Facilities (Building B1)2124.013,083.8Renovation included floor replacement, installation modernization, thermal insulation, and structural repairs. The usable area and volume were reduced due to newly added partition walls and drop ceilings for office-space adaptation.
Warehouse with Administrative and Social Facilities (Building I1)3986.515,883.0Modernization covered installation upgrades, thermal insulation, window replacement, and improvement of working conditions. The usable area and volume decreased due to the installation of partition walls and drop ceilings for office purposes.
Note: Usable area refers to net occupiable space excluding structural elements; volume represents total enclosed building space (m3). Area reductions occur when adding partitions for offices, while expansions accommodate large-scale storage needs. Source: own elaboration.
Table 3. Breakdown of revitalization costs (PLN) for the four case study buildings (L1, K1, B1, and I1).
BuildingArea Before (m2)Area After (m2)Modernization (PLN)Adaptation (PLN)Systems (PLN)Total Cost (PLN)
L1605.22695.5605.2 × 1250 = 756,500(2695.5 − 605.2) × 1800 = 3,762,5402695.5 × 320 = 862,5605,381,600
K12748.513343.12748.51 × 1250 = 3,435,638(3343.1 − 2748.51) × 1800 = 1,070,2623343.1 × 320 = 1,069,7925,575,692
B1222821242228 × 1250 = 2,785,0000 (area reduced)2124 × 320 = 679,6803,464,680
I144523986.54452 × 1250 = 5,565,0000 (area reduced)3986.5 × 320 = 1,275,6806,840,680
Note: Modernization costs apply to original area, adaptation costs to added area only. Buildings with reduced areas (B1 and I1) show CA = 0, as spatial reconfiguration was integral to modernization (CM), rather than separate structural changes. Source: own elaboration.
Table 4. Total costs (PLN) of demolition and new construction for case study buildings L1, K1, B1, and I1.
BuildingVolume Pre-Revit. (m3)Demolition (PLN)Waste Removal (PLN)Construction (PLN)Total Cost (PLN)
L11865233,125111,9002695.5 × 3000 = 8,086,5008,431,525
K127,0763,384,5001,624,5603343.1 × 3000 = 10,029,30015,038,360
B117,5502,193,7501,053,0002124 × 3000 = 6,372,0009,618,750
I123,4802,935,0001,408,8003986.5 × 3000 = 11,959,50016,303,300
Note: Construction costs based on post-revitalization areas for functional equivalence. Source: own elaboration.
Table 5. Comparison of revitalization costs vs. demolition and construction from scratch.
BuildingRevitalization Cost (PLN)New Construction Cost (PLN) Savings (PLN) ΔC = CC − CRSavings (%)New Constr. vs. Revitalization
L15,381,6008,431,5253,049,92536.17%56.67%
K15,575,69215,038,3609,462,66862.92%169.71%
B13,464,6809,618,7506,154,07063.98%177.62%
I16,840,68016,303,3009,462,62058.04%138.33%
TOTAL21,262,65249,391,93528,129,28356.95%132.29%
Table 6. Typical material composition by volume in Polish industrial buildings [91,94]. The percentages reflect structural requirements for reinforced concrete frame buildings with masonry infill, common in 1980s construction.
Component% of VolumeDensityCalculation
Concrete22%2.4 t/m30.22 × Vpre × 2.4
Steel3%7.85 t/m30.03 × Vpre × 7.85
Brick/Masonry15%1.8 t/m30.15 × Vpre × 1.8
Source: own elaboration.
Table 7. Environmental benefits of revitalization by building, showing avoided CO2 emissions, construction waste, and monetary equivalent savings (env. benefits in PLN).
BuildingVolume (m3)CO2 Saved (tons)Waste Avoided (tons)Env. Benefit (PLN) *
L1186512851927346,910
K127,07618,65827,9835,037,340
B117,55012,09418,1383,265,140
I123,48016,18024,2674,368,360
Total69,97148,21772,31513,017,750
Note: Calculations assume material composition by volume: 22% concrete (2.4 t/m3 0.4 t CO2/t), 3% steel (7.85 t/m3, 1.8 t CO2/t), and 15% brick (1.8 t/m3, 0.2 t CO2/t). Waste mass equals 100% of demolished materials. Monetary benefits combine CO2 (150 PLN/ton) and waste disposal costs (80 PLN/ton). Sources: CEN for concrete [98], World Steel Association [99], WiseEuropa [100] for steel, and PKN for brick emissions [101]. Source: own elaboration.
Disclaimer/Publisher’s Note: The statements, opinions and data contained in all publications are solely those of the individual author(s) and contributor(s) and not of MDPI and/or the editor(s). MDPI and/or the editor(s) disclaim responsibility for any injury to people or property resulting from any ideas, methods, instructions or products referred to in the content.