Article

Three-Dimensional Intelligent Understanding and Preventive Conservation Prediction for Linear Cultural Heritage

1
School of Geomatics and Urban Spatial Informatics, Beijing University of Civil Engineering and Architecture, Beijing 102616, China
2
Beijing Key Laboratory for Architectural Heritage Fine Reconstruction & Health Monitoring, Beijing 100044, China
3
Engineering Research Center for Representative and Ancient Building Database, Ministry of Education, Beijing 102616, China
4
International Joint Laboratory of Safety and Energy Conservation for Ancient Buildings, Ministry of Education, Beijing 100044, China
*
Author to whom correspondence should be addressed.
Buildings 2025, 15(16), 2827; https://doi.org/10.3390/buildings15162827
Submission received: 1 July 2025 / Revised: 25 July 2025 / Accepted: 30 July 2025 / Published: 8 August 2025

Abstract

This study proposes an innovative method that integrates multi-source remote sensing technologies and artificial intelligence to meet the urgent needs of deformation monitoring and ecohydrological environment analysis in Great Wall heritage protection. By integrating synthetic aperture radar (InSAR) technology, low-altitude oblique photogrammetry models, and the three-dimensional Gaussian splatting model, an integrated air–space–ground system for monitoring and understanding the Great Wall is constructed. Low-altitude tilt photogrammetry combined with the Gaussian splatting model, through drone images and intelligent generation algorithms (e.g., generative adversarial networks), quickly constructs high-precision 3D models, significantly improving texture details and reconstruction efficiency. Based on the 3D Gaussian splatting model of the AHLLM-3D network, the integration of point cloud data and the large language model achieves multimodal semantic understanding and spatial analysis of the Great Wall’s architectural structure. The results show that the multi-source data fusion method can effectively identify high-risk deformation zones (with annual subsidence reaching −25 mm) and optimize modeling accuracy through intelligent algorithms (reducing detail error by 30%), providing accurate deformation warnings and repair bases for Great Wall protection. Future studies will further combine the concept of ecological water wisdom to explore heritage protection strategies under multi-hazard coupling, promoting the digital transformation of cultural heritage preservation.

1. Introduction

The conservation of linear cultural heritage faces a triple theoretical–technical disconnect: first, existing digital preservation frameworks often focus on local geometric reconstruction (such as SFM-MVS) but overlook the “cross-regional continuity” characteristic of linear heritage (according to the ICOMOS Cultural Routes Charter, cultural routes are land, water, or other types of communication routes formed by human migration and the multi-dimensional continuous exchange of goods, ideas, and knowledge between peoples, reflected through tangible/intangible heritage, and integrating related historical connections into a unified dynamic system) and dynamic risk transmission mechanisms [1,2,3,4]. Second, automation technologies (such as InSAR deformation monitoring and AI semantic analysis) lack cultural heritage ethical constraints, leading to historical information misinterpretation (the Charter for the Interpretation and Presentation of Cultural Heritage stipulates that “interpretation must be based on multidisciplinary research, and visual reconstruction must accurately record the sources of information”; otherwise, it violates the Nara Document’s definition of authenticity) and data security risks (The concept of “cultural heritage rights,” emphasizing that technological applications must balance public rights (public interest) with private rights (community heritage rights) [5,6,7,8], and the leakage of high-precision coordinates infringes upon this right). Third, the representation of the Great Wall [9,10], as a typical example of linear heritage (classified as a “military cultural landscape heritage” with both defensive and national symbolic functions), has not been adequately explained; its longest global spatial span (21,196 km), extreme vulnerability due to earthen materials (annual weathering rate of 1–3 cm), and the >70% monitoring blind spots urgently require the development of a collaborative framework that integrates macro-level early warning with micro-level diagnostics.
In recent years, low-altitude oblique photogrammetry has become a crucial technique for acquiring high-precision spatial data in the field of 3D digital modeling of cultural heritage. Multi-perspective and multi-angle image acquisition enables comprehensive reconstruction of the geometric morphology of heritage sites. However, traditional reconstruction methods based on the Structure-from-Motion (SfM) and Multi-View Stereo (MVS) pipeline—typically involving feature extraction, sparse point cloud registration, dense point cloud generation, mesh reconstruction, and texture mapping—often face technical bottlenecks in large-scale complex scenarios [11,12,13], including high computational costs, insufficient detail recovery, and texture mapping distortion. This is particularly challenging in large-scale environments like the Great Wall, characterized by intricate wall structures, brick joint textures, high-frequency variations, and vegetation occlusion, where existing methods struggle to balance reconstruction accuracy with rendering efficiency.
Emerging techniques like Neural Radiance Fields (NeRFs) have improved detail recovery capabilities but still exhibit limitations in real-time rendering, editing operations, and cross-platform compatibility [14,15,16,17]. To address these issues, 3D Gaussian splatting (3DGS), an emerging 3D modeling technology, has been applied to cultural heritage [18]. For instance, the “Gaussian Heritage” method proposed by Mahtab Dahaghin et al. utilizes RGB images and Gaussian splatting to achieve 3D digitization of cultural heritage objects [19,20,21,22], enabling instance segmentation of each object. This method requires no manual annotation and can capture visual input via standard smartphones, offering the advantages of low cost and easy deployment. Nevertheless, since 3DGS relies on the distribution of Gaussian points, important areas (e.g., brick joints or complex structural details on the Great Wall) may suffer from inaccurate reconstruction due to sparse point clouds, resulting in insufficient detail representation.
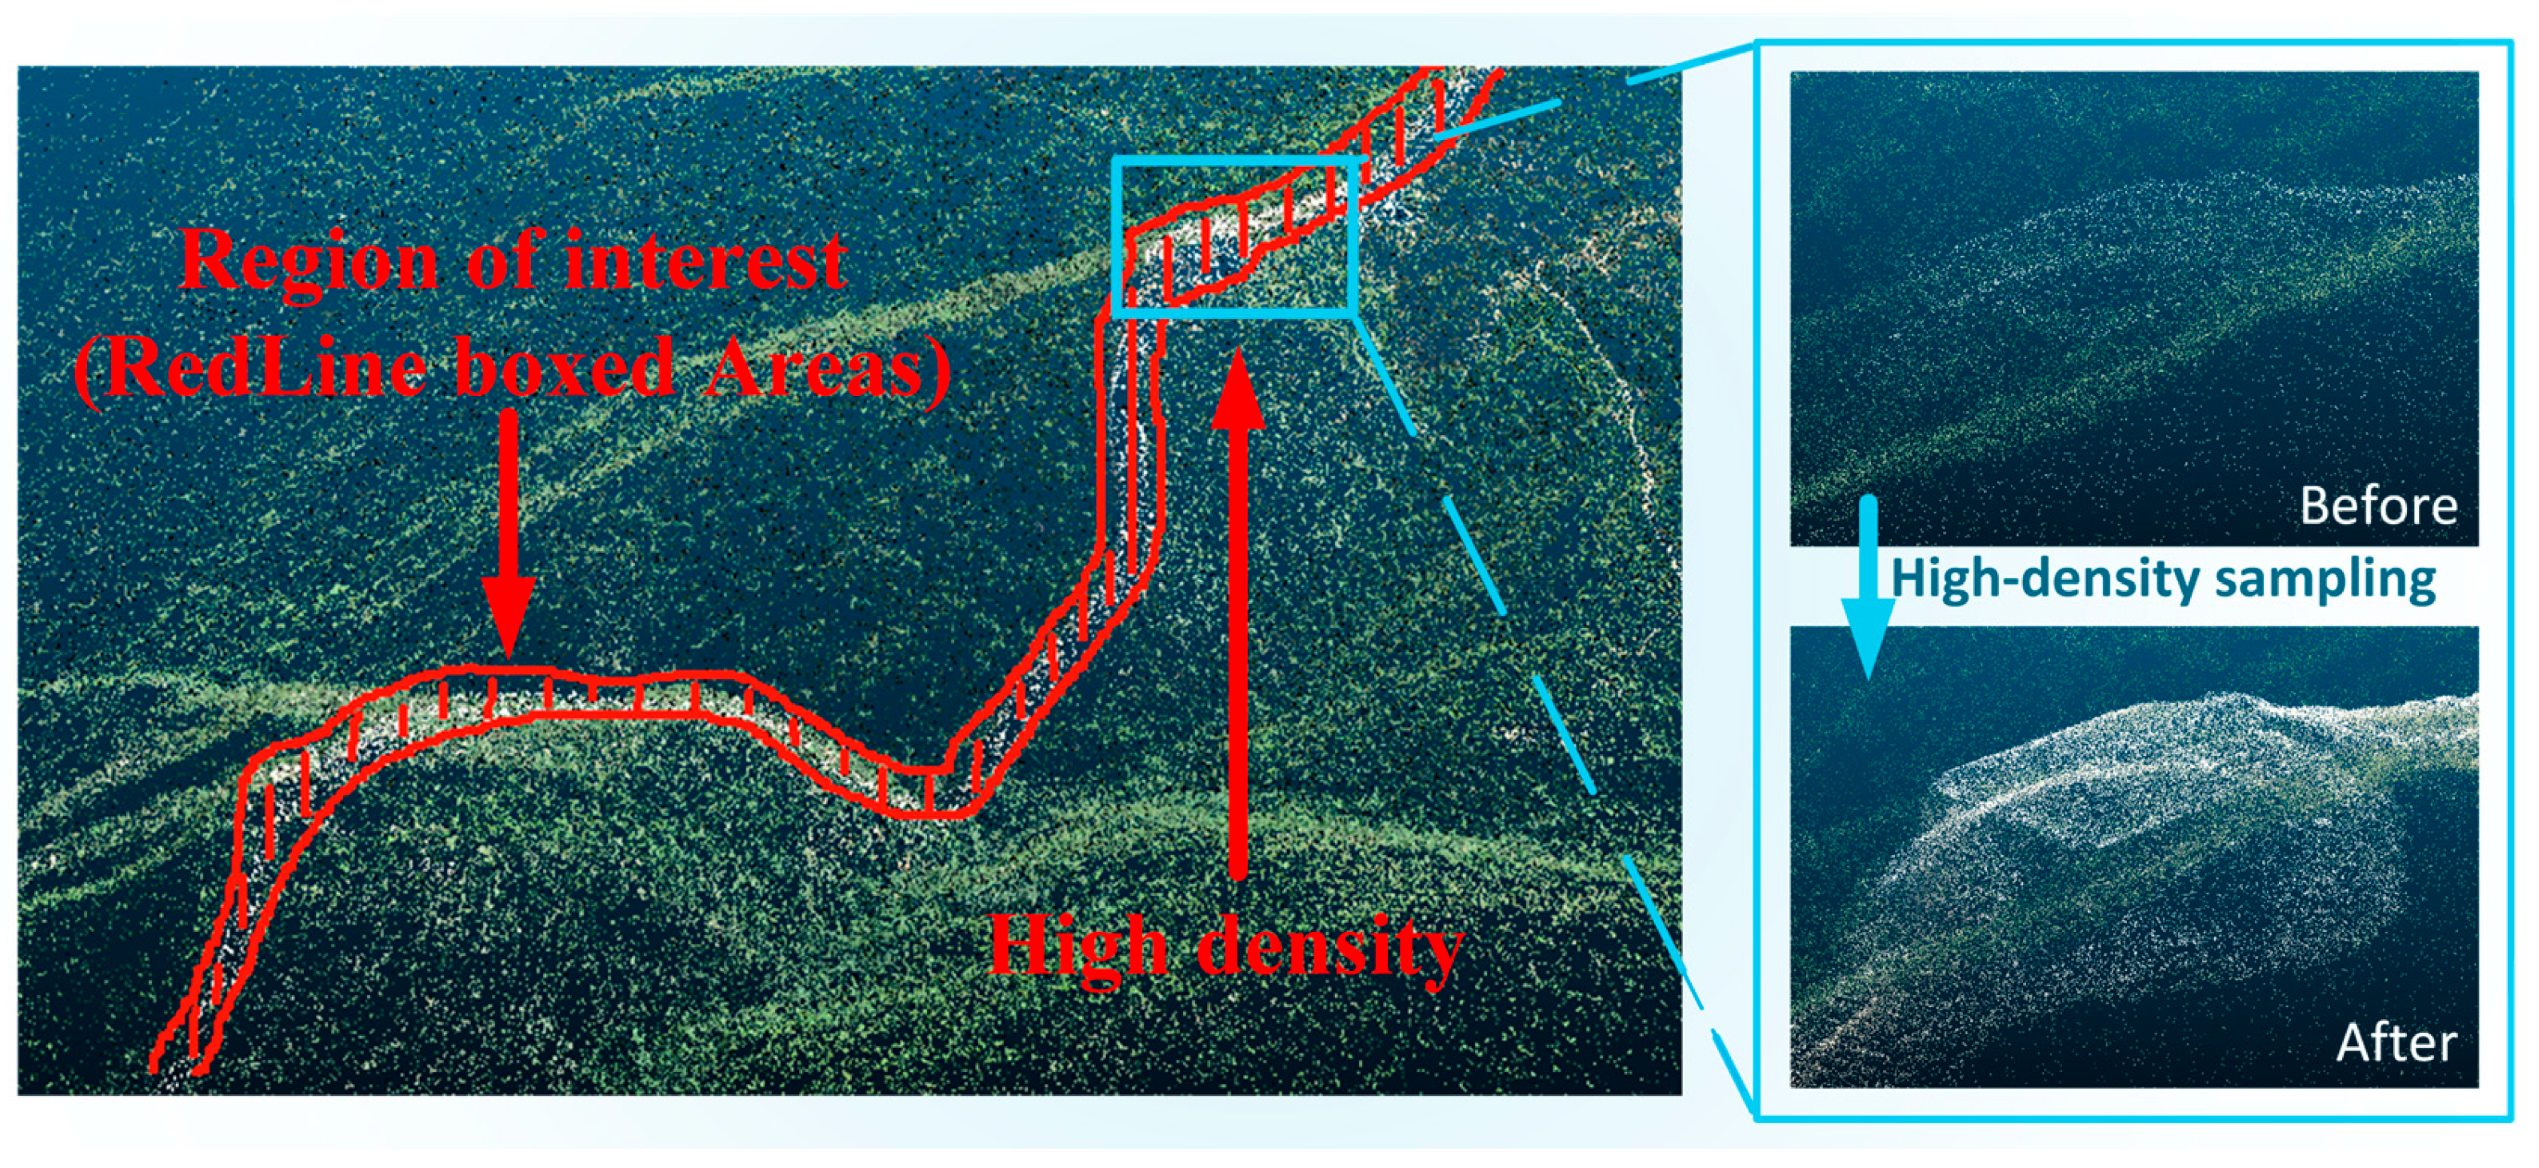
To address this limitation, this paper proposes a Region-of-Interest (ROI) densification strategy based on 3DGS, tailored to the detail-rich and morphologically complex nature of linear cultural heritage structures. Following SfM point cloud generation, we perform high-density sampling on the main structural ROI (e.g., the Great Wall body) to initialize a greater number of 3D Gaussian ellipsoids. This enhances the geometric and textural representation capability of this region during subsequent training. Concurrently, background areas (e.g., mountains, vegetation) retain the default density setting. This approach significantly improves the modeling accuracy and visualization quality of the ROI while maintaining overall modeling efficiency. The method supports real-time rendering and interactive editing while preserving geometric and textural details, demonstrating strong potential for visualization and intelligent understanding, thereby providing a solid technical foundation and data support for the 3D digital modeling of linear cultural heritage.
On the basis of the 3D modeling techniques, with the development of artificial intelligence and multimodal technology, existing research has begun to try to combine the big language model with 3D data on the basis of the original two-dimensional big language model research [23,24,25,26,27,28,29,30,31] in order to achieve a deeper semantic understanding of cultural heritage and intelligent interaction. The emergence of multimodal big language models makes it possible for big language models to understand multi-source data such as point clouds, images, and texts. Current mainstream methods, such as PointCLIP [32], ULIP [33], and OpenShape [34], train point cloud encoders by point cloud–image–text triples to make their semantic representations consistent with the CLIP space. Models such as Reason3D, SpatialVLM, and LiDAR-LLM [35,36,37,38,39] focus on enhancing the model’s reasoning ability for 3D spatial structures and semantic relationships through methods such as hierarchical decoding, spatial question-answering data generation, and deep information integration. In terms of model framework optimization and training strategies, models like PAVLM, GreenPLM, and Video-3D LLM [40,41,42,43,44] optimize model architecture and training strategies by minimizing data pairs, using dynamic video modeling, and using direct point cloud manipulation, thereby improving model performance and efficiency in 3D tasks. We construct a Gaussian splattering point cloud dataset on this basis and train a multimodal language model by employing a bi-hierarchical structure of text annotation to achieve semantic understanding of point clouds without intermediate transformations. The adopted AHLLM-3D architecture provides a new path for intelligent visualization, digital display, and immersive experience of linear cultural heritage based on end-to-end coupling of point cloud coding and language understanding, which can be directly based on Gaussian representation for 3D scene parsing and language interaction.
Interferometric Synthetic Aperture Radar (InSAR), as a non-contact, all-day, all-weather remote sensing tool, has received widespread attention due to its superior performance in surface deformation monitoring, urban settlement analysis, and cultural heritage protection [45,46,47,48,49,50]. By analyzing the phase difference between multi-temporal radar images, InSAR technology is able to achieve millimeter-level deformation extraction. With the continuous optimization of the satellite platform and the improvement of the remote sensing image resolution, the InSAR technique has gradually evolved from traditional differential interferometry (D-InSAR) to multi-temporal interferometry (MT-InSAR) and has developed two mainstream methods represented by Permanent Scatterer (PS-InSAR) and Small Baseline Set (SBAS-InSAR) [51,52,53,54,55,56,57]. Among them, the SBAS-InSAR technique can effectively suppress the atmospheric delay and noise interference in the time series dimension by constructing a low-temporal baseline interferometric pair network and still has good stability and adaptability in the low-coherence region, which has become the core program for current regional-scale deformation monitoring [58,59,60,61,62].
In the dynamic conservation scenario of cultural heritage, InSAR is especially suitable for the non-invasive monitoring of small deformations over a large scale and a long period of time [63]. However, the traditional InSAR data processing process still suffers from high computational complexity and unstable interferogram quality when facing large-scale data. In this paper, a systematic processing architecture is built around the SBAS-InSAR technology, which covers the core steps of image alignment, interferogram generation, phase disentanglement, DEM and atmospheric error correction, etc., and combines with the least squares method of inverting a deformation time series to finally generate a high-precision surface deformation atlas. Meanwhile, the deformation velocity constraint model and multi-scale noise filtering mechanism are introduced to improve the monitoring accuracy and robustness in complex terrain and strong noise environments [64,65,66,67,68,69,70,71,72]. In order to further break through the limitations of traditional methods in real time and with adaptability, the study also explores the integration strategy of deep learning methods and the InSAR process, and it improves the processing efficiency and recognition ability in nonlinear deformation modeling and anomaly detection by introducing neural network-assisted disentanglement and deformation reconstruction modules [73].
However, the current technological approach has two main limitations; regarding semantic understanding limitations, automated analysis may misinterpret historical information (e.g., identifying Ming dynasty construction features as Qing dynasty restoration traces) and thus requires validation with the knowledge of conservation experts; regarding ethical risks, the open sharing of high-precision coordinate data could lead to looting risks (as seen with the coordinate encryption strategy in the Dunhuang digitalization project) [74,75,76], and AI-generated “virtual restoration” proposals may violate the principle of authenticity.
This paper aims to address the key challenges in the conservation of linear cultural heritage (using the Great Wall as a case study): how to integrate multi-source remote sensing technologies and artificial intelligence models to achieve high-precision 3D monitoring, semantic understanding, and risk prediction of heritage structures. The specific research questions relate to the following: traditional methods (such as SfM-MVS) face efficiency and detail-loss problems in complex linear scenarios, while single technologies (such as InSAR or 3DGS) struggle to meet the simultaneous needs of deformation monitoring, fine modeling, and semantic understanding [77,78,79]. This paper defines this as the need to establish a heritage degradation risk, early warning model through dynamic analysis of multi-source data (deformation time series, environmental factors, and structural conditions) to provide decision-making support for proactive maintenance. This paper proposes an original “air-space-ground” collaborative framework (as shown in Figure 1), integrating SBAS-InSAR deformation monitoring, adaptive 3D Gaussian splatting modeling (ROI optimization), and multimodal language models (AHLLM-3D), with experimental validation showing promising results for each module.
In summary, this paper constructs a comprehensive digital conservation system for cultural heritage, integrating surface deformation monitoring, high-precision modeling, and semantic understanding. Centered on SBAS-InSAR technology, it synergizes 3D Gaussian splatting modeling and a multimodal language model framework. This system aims to achieve the holistic conservation of both natural and cultural elements of linear heritage [80]. At the macro level, the system enables spatiotemporal tracking of large-scale surface subsidence and heritage structural evolution trends. At the micro level, it supports the precise reconstruction of complex architectural geometric details and interactive cognition. This integrated system provides crucial technical support and methodological innovation, driving the evolution of cultural heritage conservation from visualization towards intelligentization.
We integrate multiple data sources to support the intelligent understanding and preventive conservation prediction of cultural heritage. To better illustrate the specific roles of each data source in different submodules, the Table 1 systematically summarizes the application scenarios and processing methods of each source. Specifically, InSAR technology is primarily used for large-scale surface deformation monitoring, providing reliable deformation data through precise time series analysis; low-altitude tilt images collected by UAVs offer high-resolution spatial data for 3D modeling, aiding in the accurate reconstruction of cultural heritage structures; point cloud data, combined with 3D Gaussian splatting (3DGS) technology, enables the 3D modeling and fine-detail restoration of cultural heritage, enhancing modeling accuracy and texture representation; the multimodal data fusion method combines point clouds with text information, promoting intelligent semantic understanding and spatial analysis of cultural heritage. The effective integration of these data sources and processing methods ensures the broad applicability and high accuracy of our proposed multi-source data fusion approach in cultural heritage protection. As shown in Table 1, the effective integration of multi-source data and processing methods ensures the broad applicability and high accuracy characteristics of the proposed fusion approach in cultural heritage protection.

2. Low-Altitude Oblique Image-Based Intelligent Gaussian Splatting Generation

2.1. Principles of Gaussian Splatting for Linear Cultural Heritage Scenes

Three-dimensional Gaussian splatting (3DGS) is an emerging technique for scene representation and differentiable rendering. The core idea is to model the spatial density and radiometric attributes of scene points using 3D Gaussian distributions, which are then rendered efficiently through a differentiable rasterization process. Unlike conventional volumetric grids or Multi-View Stereo (MVS) approaches based on image matching, 3DGS adopts 3D Gaussian ellipsoids as its fundamental units, eliminating the need for explicit mesh construction. Instead, it iteratively optimizes the spatial position, covariance (shape), color, and opacity of each Gaussian to approximate observed images, achieving high-quality view synthesis and model representation.
The splatting process simulates a stochastic expansion from a central source, generating spatially correlated continuous data. In the Gaussian splatting framework, this is implemented numerically via Gaussian processes to construct spatial data distributions. The splatting process comprises three main stages:
(1)
Source Point Generation and Influence Control
In the initialization stage, the system generates a series of “splatting source points” based on the SfM sparse point cloud. Each source point applies influence on the surrounding region in the form of a 3D Gaussian function. Specifically, the influence strength A decays exponentially with the distance | | x     x 0 | | from the central point, and the region farther from the source point experiences weaker influence; σ controls the diffusion range, ensuring smooth and continuous spatial distribution.
y x = A e x p x x 0 2 2 σ 2
(2)
Multi-source Influence Accumulation Modeling
In the entire space, each spatial point x i is influenced by multiple source points. The splatting process accumulates the influence from all source points, generating an influence field that covers the entire space. The final value at point x i is the sum of the influences from all source points:
f x i = j = 1 N y j x i
Here, y j ( x i ) is the influence of the j -th source point on point x i . By accumulating the influence from all source points, the splatting process forms a globally continuous spatial distribution, similar to how liquids or particles spread and accumulate from the source in the physical world.
(3)
Region-of-Interest (ROI) Density Control Strategy
To address the complex morphology and concentrated details of linear cultural heritage structures, this study introduces an ROI-based density control strategy after SfM point cloud generation (Figure 2). The red-marked region represents the extracted ROI—i.e., the Great Wall structure. High-density sampling is performed in this region, initializing more 3D Gaussians to enhance geometric and texture representation during training. Background areas such as terrain and vegetation retain default density settings, ensuring modeling efficiency while significantly improving accuracy and visual quality in the ROI.

2.2. Intelligent Generation of 3D Gaussian Splatting Models

The oblique images of the Great Wall offer rich multi-view coverage and high redundancy, providing strong constraints for 3D reconstruction. To enhance modeling accuracy and efficiency, we integrate the ROI-focused strategy, selecting key regions containing the main structure of the Great Wall for increased initialization density, thereby improving the detailed representation of walls and architectural elements.
The overall workflow includes two stages. (1) Image registration via SfM: Feature extraction, matching, and bundle adjustment are performed using COLMAP to generate sparse point clouds and camera poses. (2) Gaussian splatting-based modeling: The initialized data is used to generate Gaussian ellipsoids, followed by differentiable rendering and adaptive density adjustment, ultimately producing a real-time 3D model that can be rendered.
In the modeling pipeline (Figure 3), the initial camera poses and sparse point clouds provided by COLMAP are used to initialize and optimize Gaussian parameters. Since 3DGS does not inherently include an SfM module, the quality of reconstruction heavily depends on the accuracy and robustness of SfM outputs. Any registration errors, uneven feature distribution, or sparse point density can negatively affect initialization quality and convergence during training.
For linear cultural heritage structures like the Great Wall, which feature elongated and continuous spatial layouts, standard SfM keypoint detection may inadequately cover such directional and structurally extended areas. This leads to poor texture reconstruction and blurred geometry in Gaussian modeling. To address this, we densify the point cloud in the Great Wall region using ROI sampling, providing more valid seed points for Gaussian initialization and improving both geometric continuity and texture fidelity.
Once camera poses and sparse points are acquired, the 3DGS stage begins. Initial Gaussians are defined by trainable parameters: center coordinates, spatial covariance, color, and opacity. These Gaussians are projected onto the image plane through a differentiable renderer and compared with ground truth images to compute a loss function, which is minimized via backpropagation. An adaptive density mechanism further prunes or resamples Gaussians to optimize the distribution. This enhances model fidelity in heritage-specific areas while maintaining global efficiency.
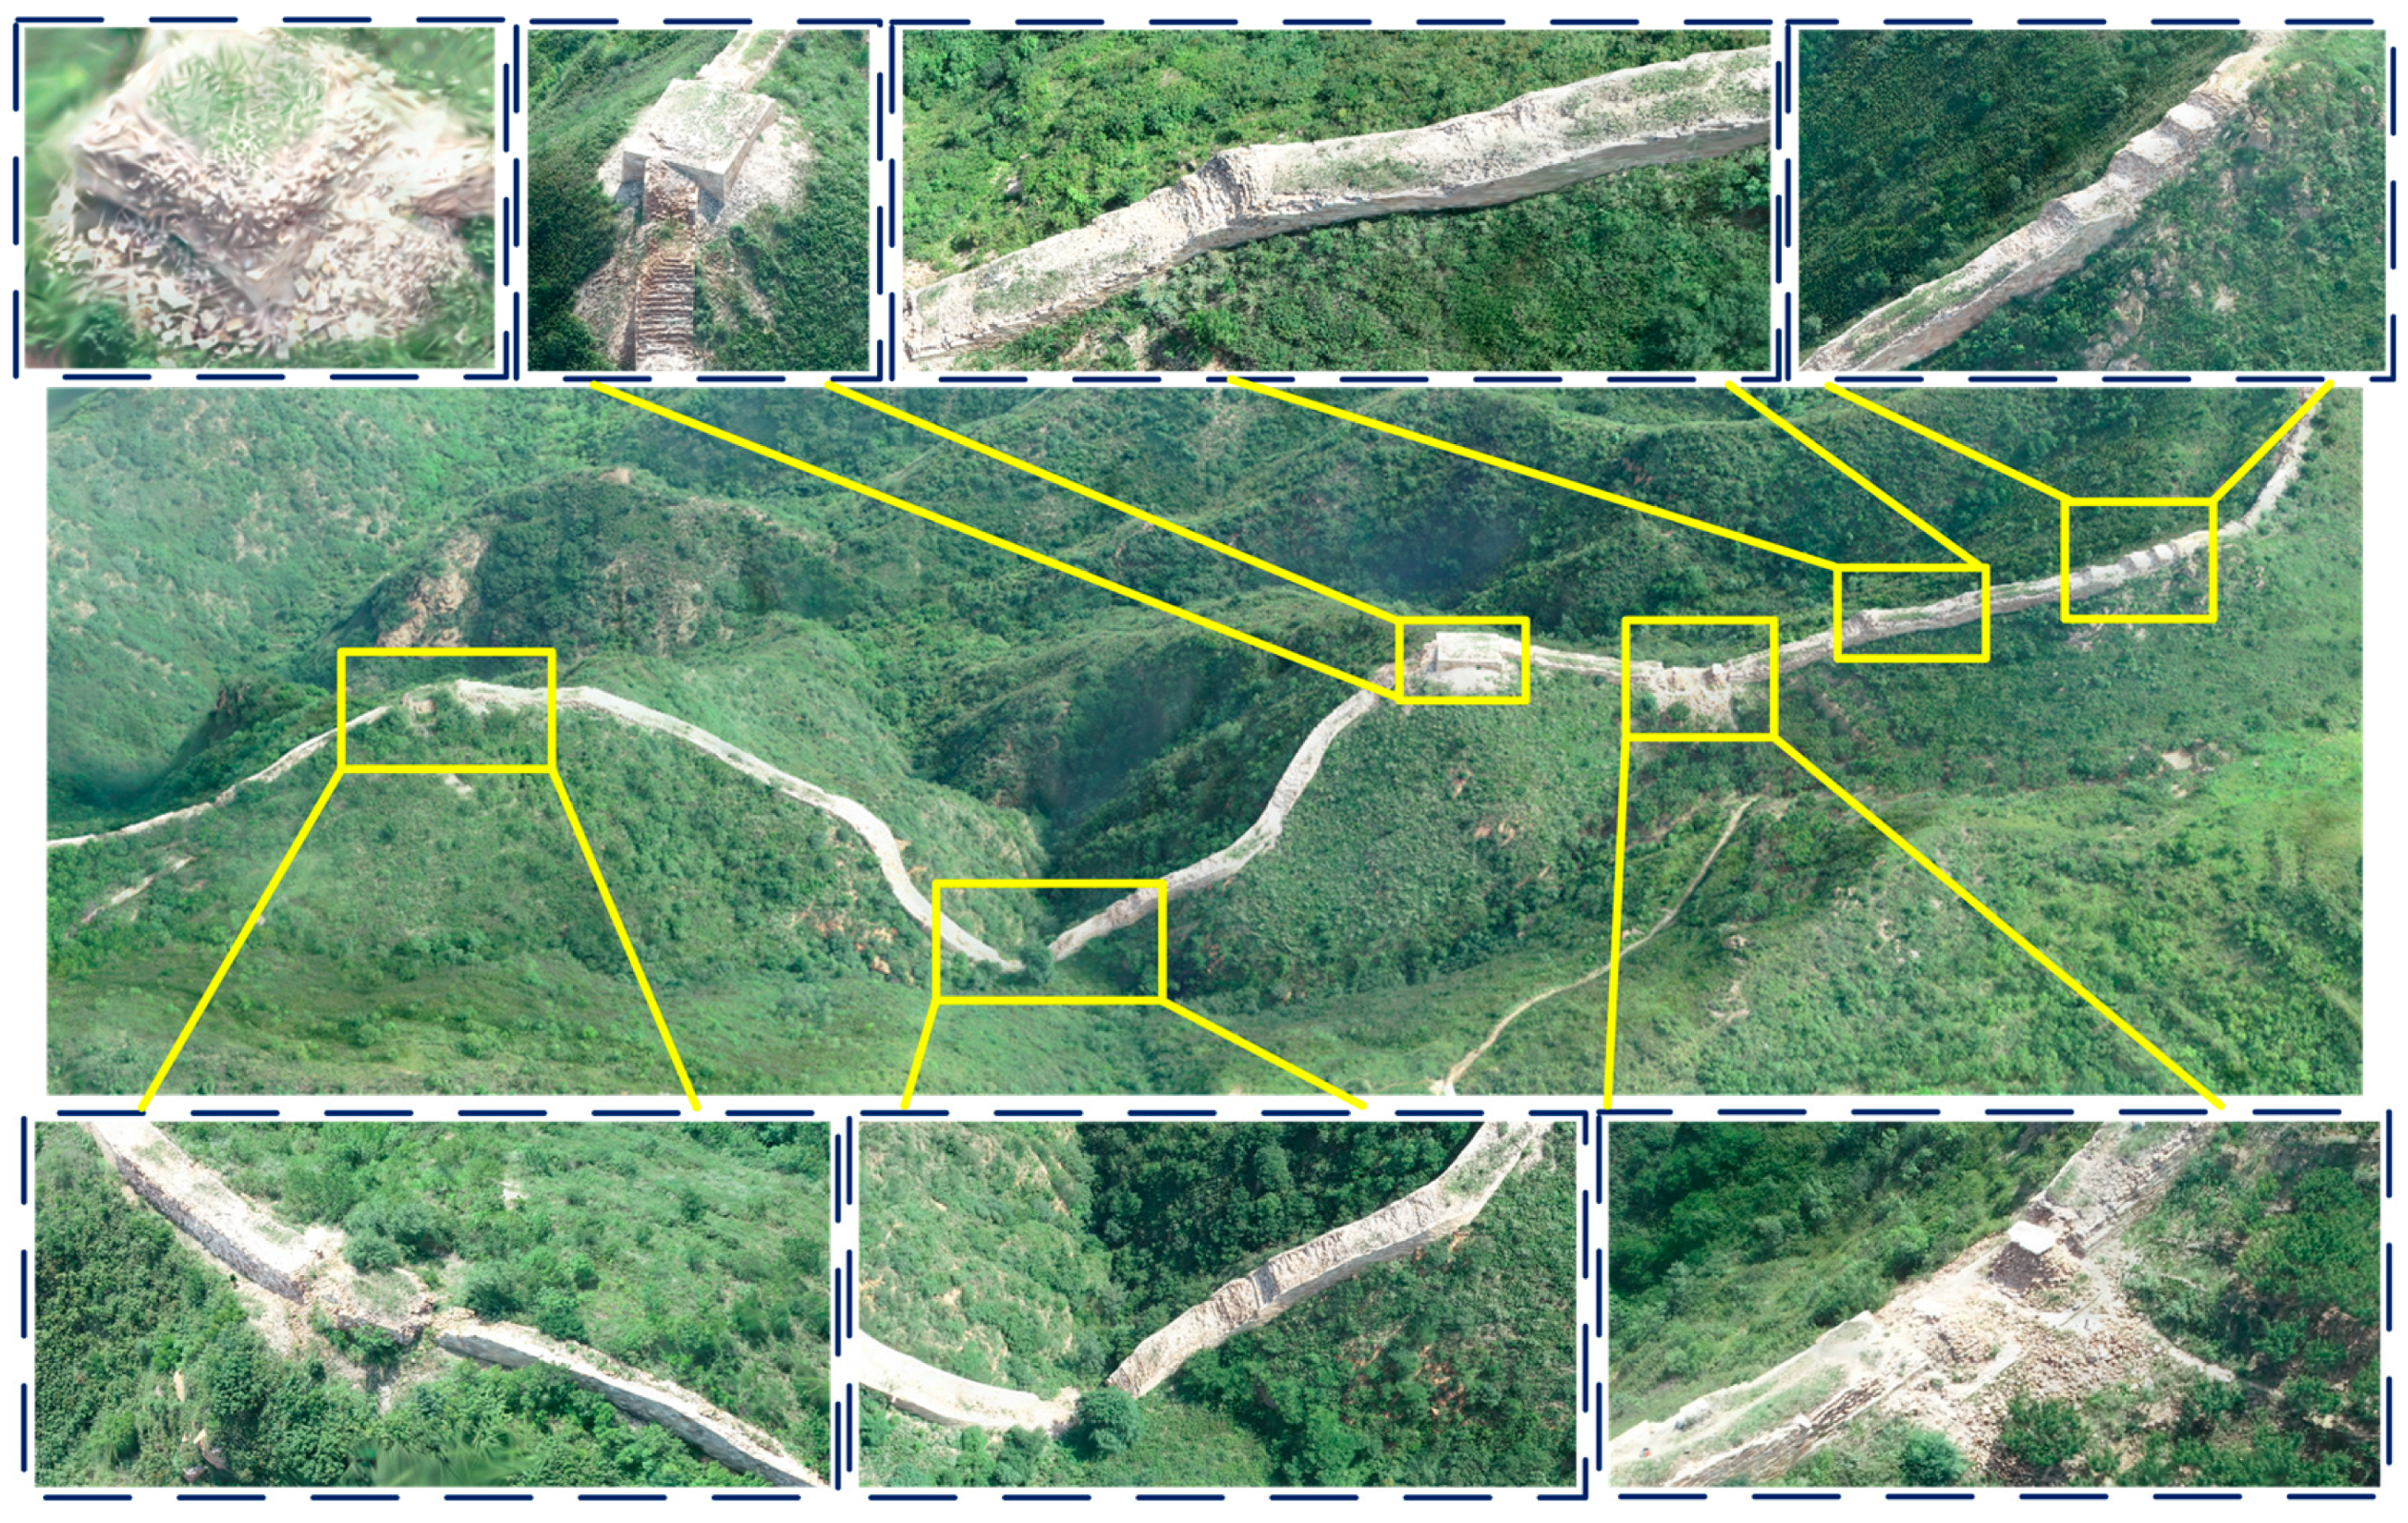
Key data processing steps include: (1) Feature extraction and multi-view matching: Detect and match keypoints across oblique images to construct the view graph and determine geometric relationships. (2) Camera registration and sparse reconstruction: Estimate camera parameters and generate a sparse point cloud using COLMAP. (3) Gaussian modeling and optimization: Initialize Gaussian ellipsoids based on the sparse point cloud, then optimize their parameters through differentiable rendering. (4) Output and visualization: Once convergence is achieved, output a high-fidelity 3D model ready for real-time rendering and visualization. This pipeline addresses the difficulty of capturing fine details in linear cultural heritage using traditional methods and produces models with rich geometry and texture, capturing the unique architectural charm of structures like the Great Wall. Partial results are shown below in Figure 4.

2.3. Model Evaluation, Comparison, and Applicability Analysis

2.3.1. Evaluation of Preservation Accuracy and Cultural Feature Fidelity

Evaluation of Preservation Accuracy
Preservation accuracy refers to the degree to which the digital or reconstructed model matches the original heritage structure, ensuring that key architectural details and cultural significance are preserved. The evaluation of preservation accuracy typically involves comparing the differences between the digitized or reconstructed cultural heritage model and the original heritage structure. To achieve this, we compared the point clouds generated by the Gaussian splatting method and those obtained from the Focus Premium 350-A scanner, with a focus on the geometric fidelity of the Great Wall after Gaussian splatting reconstruction.
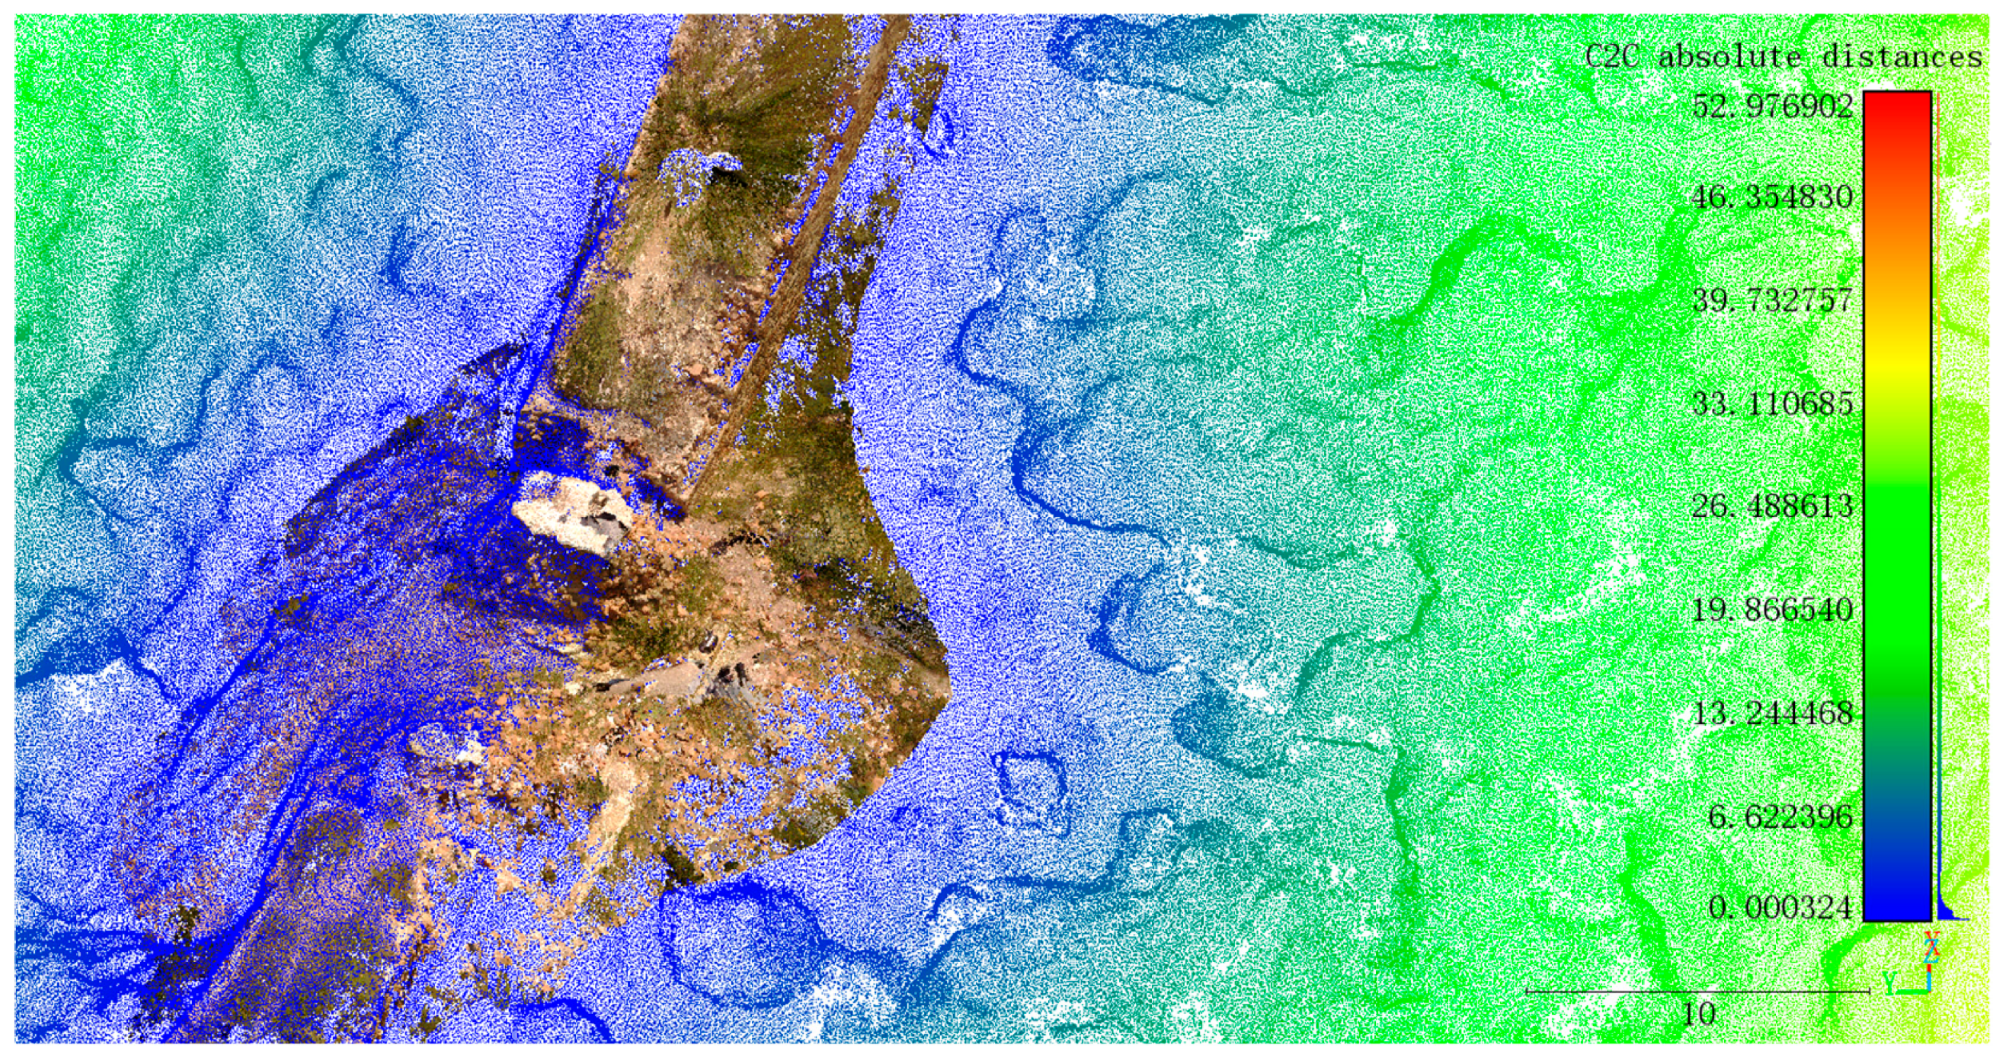
Visual comparison: Figure 5 shows the point cloud obtained by the Focus Premium 350-A scanner on the left side. The figure on the right side is a cloud-to-cloud (C2C) comparison of the Gaussian splattering point cloud and the scanner point cloud in Cloud Compare. Figure 6 is the superposition of the two.
The blue regions represent the Great Wall structure, while the green and yellow areas correspond to vegetation. This comparison demonstrates that the two point clouds align well, especially in the blue regions where the Great Wall is located. The small differences between the datasets suggest that the dimensions of the wall have been accurately reconstructed, effectively preserving the cultural heritage’s scale and architectural features. This is crucial for digitally preserving and protecting the cultural and historical value of the site.
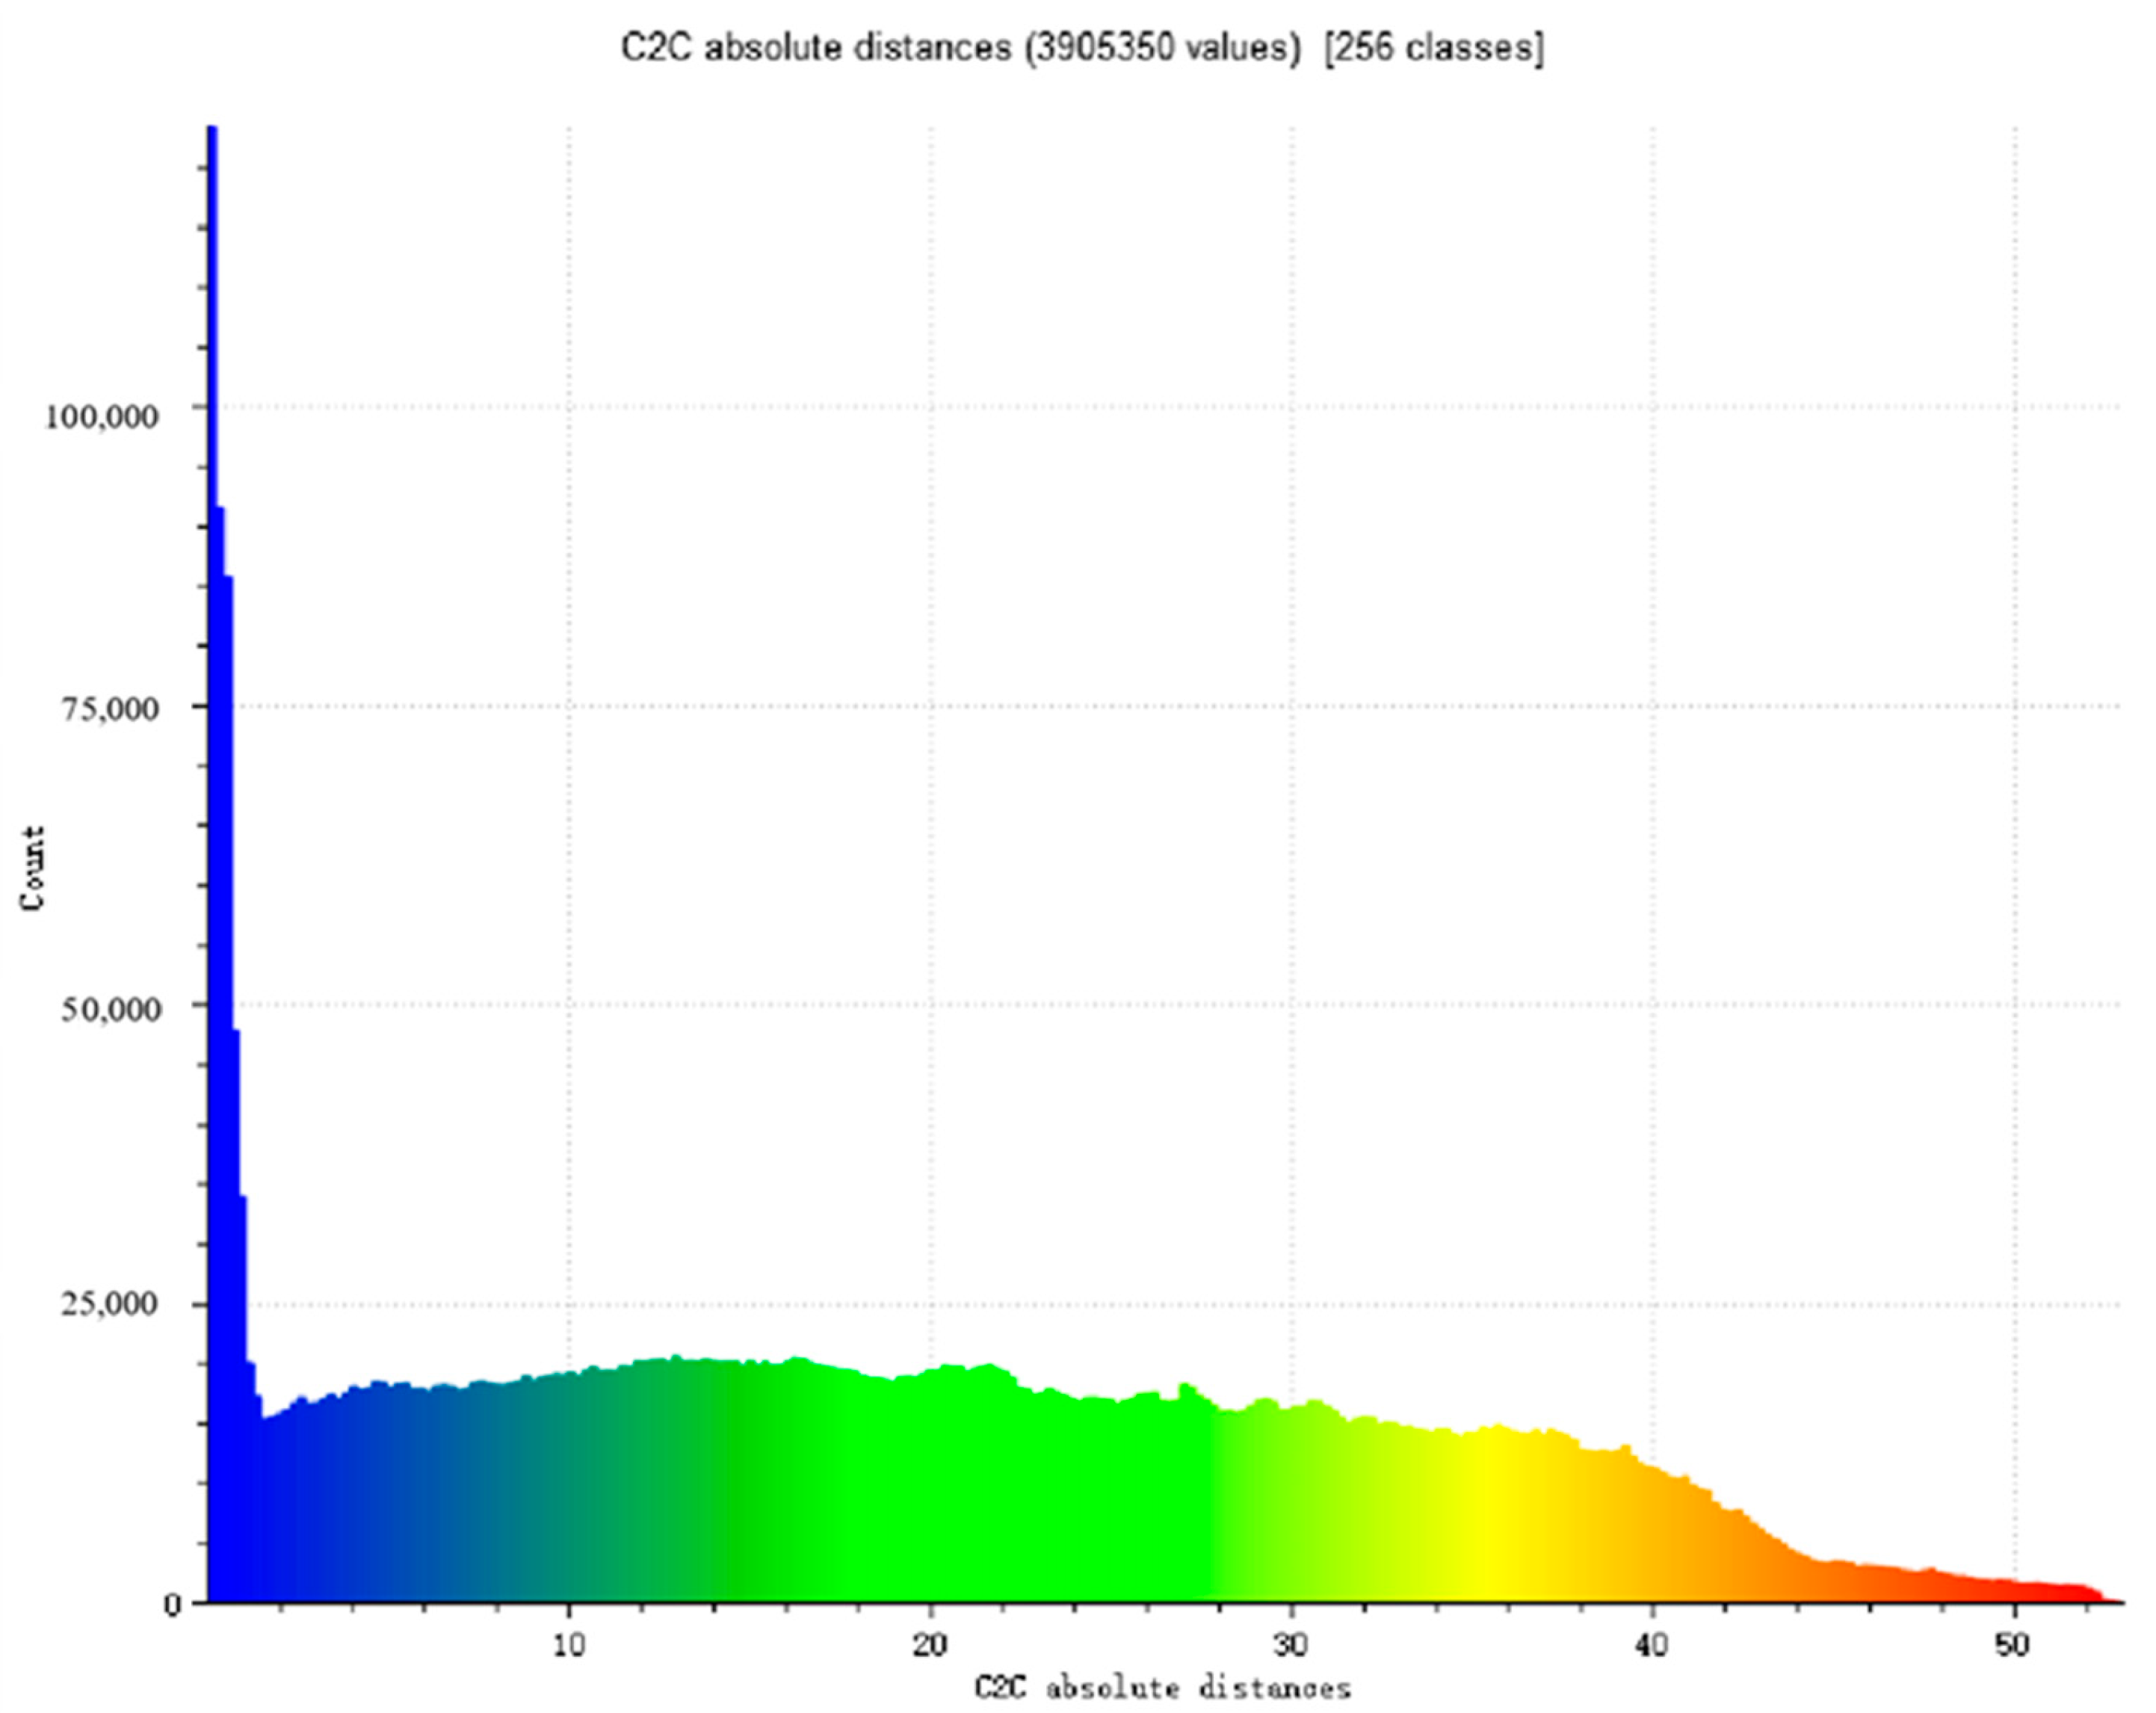
Quantitative analysis of preservation accuracy: To quantify the preservation accuracy, we performed a statistical analysis of the absolute distances between corresponding points in the two point clouds. Figure 7 presents the histogram of absolute distances between the two point clouds. Most of the points fall within a small distance range, indicated by the blue and green regions of the histogram, showing that the models are closely aligned in terms of geometry. The sharp peak near zero indicates minimal deformation in the wall structure, confirming high preservation accuracy.
Based on the visual inspection and statistical analysis, we conclude that the preservation accuracy of the Great Wall structure is high. The point clouds are well aligned, with minimal differences in the wall’s geometry, confirming that the preservation of both geometric and textural features has been successfully achieved. This analysis ensures that the digital model faithfully represents the original structure, preserving the cultural and historical significance of the heritage site.
Evaluation of Cultural Feature Fidelity
To assess cultural feature fidelity, we compared the reconstructions generated by PhotoScan and 3D Gaussian splatting (3DGS) based on the same region of the Great Wall (Figure 8). Focusing on the Great Wall’s structural integrity, 3DGS excels in preserving key heritage-specific visual elements, such as the curvature of the battlements, the erosion patterns of collapsed bricks, and the subtle color variations across the wall’s surface. These features are essential for conveying the authentic character and historical wear of the wall, particularly for linear cultural heritage sites like the Great Wall, where every physical imperfection tells a part of the heritage narrative.
In terms of color consistency and structural continuity, 3DGS demonstrates superior fidelity across the extended segments of the wall (Figure 9), achieving a seamless integration between texture and geometry. This is especially important for linear heritage structures, where the continuity of the visual experience is key to understanding their vast, uninterrupted stretch and historical significance. In contrast, while PhotoScan (Figure 10) achieves high mesh precision, it shows noticeable texture fragmentation and reduced clarity in fine architectural details, such as brick seams and edge outlines. This results in a loss of important cultural attributes, especially in long, continuous heritage structures like the Great Wall, where minute details play a critical role in conveying the site’s age, integrity, and craftsmanship.
Notably, in 3DGS, areas like vegetation and transitional zones might initially appear less distinct, but with further densification and training, these regions show considerable improvement. This ability to refine and enhance environmental context highlights the adaptability of 3DGS in capturing the complex interplay between heritage structure and its surrounding environment, a crucial aspect when dealing with linear cultural heritage, where the surroundings also hold cultural and historical value.
3DGS proves to be a more effective method for reconstructing not only geometric accuracy but also the nuanced cultural expressions embedded in the materiality of linear cultural heritage structures like the Great Wall. It captures both fine details, such as brick seams and erosion patterns, and broader heritage narratives, offering a more faithful representation of the site’s historical layers. This approach not only preserves the physical integrity of the structure but also ensures the cultural significance of the site is conveyed, enabling deeper insights into its preservation and historical context.
Regarding performance, 3DGS stands out for its rapid rendering and low resource usage, making it ideal for interactive applications. Unlike PhotoScan, which is designed primarily for offline modeling and lacks flexibility in visualization, 3DGS supports real-time display and AI-driven modeling, making it more suitable for dynamic, interactive environments.
Overall, by implementing region-specific multiresolution control, 3DGS adapts seamlessly to large-scale linear cultural heritage scenes, such as the Great Wall. Its ability to maintain texture continuity, enhance detail restoration, and provide a smooth interactive experience confirms its superiority in preserving both the structure and the surrounding context. This makes 3DGS an invaluable tool for creating detailed, semantic-rich representations that lay a solid foundation for both heritage preservation and historical analysis.

2.3.2. Performance Comparison and Resource Consumption

The system environment configuration based on this experiment is Ubuntu 20.04.6 LTS; Python 3.10.16; CUDA 11.8; PyTorch 2.0.1 + cu118; GPU: NVIDIA H800 PCIe * 2 (Nvidia Corp., Santa Clara, CA, USA); CPU: Intel Xeon Gold 6430 (16 threads) (Intel Corp., Santa Clara, CA, USA); Memory: 128 GB. The main libraries and tools are TensorBoard: 2.19.0 for monitoring and visualizing the training process; PyTorch 2.0.1 + cu118 (suitable for GPU accelerated training); TensorFlow is used for deep learning computing; OpenCV 4.11.0.86, image processing; Scikit-image advanced library for image processing; Matplotlib3.10.3 drawing graphics and visualization; Trimesh for 3D mesh processing (for the operation of 3D models); Protobuf for data exchange format support ( 6.31.1); Torchvision 0.15.2 + cu118 for image processing and computer vision tasks; Tqdm4.67.1 is used to display the progress bar of the training process; Imageio2.37.0 is used to read and write image data; Scikit-learn1.7.0 for machine learning and data mining;
By using GPU-based platforms (H800 and RTX 4090), we trained a 3DGS model with ~20.48 million Gaussians. The final model reached a PSNR of 22.94, L1 loss of 0.039, and occupied 3.6 GB. Training took 2 h and 32 min on H800, compared to 3 d and 15 h on RTX 4090, reflecting the high adaptability of the Gaussian splatting algorithm to the high-end graphics card architecture.
In contrast, PhotoScan‘s modeling process on the same dataset is more time-consuming. The dense point cloud contains about 145 million points, the depth map generation takes about 4 h and 32 min, and the dense point cloud construction takes 3 days and 16 h. The resulting 3D mesh model contains about 28.98 million faces and 14.5 million vertices, with a texture resolution of 20,480 × 20,480 (4 bands). The model reconstruction takes about 1 h and 37 min, and the texture mapping takes about 45 min. Although it has advantages in geometric reduction accuracy, the overall process is significantly dependent on CPU resources, the data processing link is long, the model file is larger, the loading efficiency is low, and it does not support the real-time modification of rendering or dynamic interaction. The detailed data comparison is presented in Table 2 below.
In the large-scale reconstruction of the Great Wall, 3DGS demonstrates exceptional visual fidelity and real-time performance. A reconstructed watchtower section contains approximately 20.48 million Gaussians. On consumer-grade GPUs (e.g., RTX 4090), the model achieves real-time rendering at 32 FPS (1080p) and maintains 20 FPS on an RTX 4070, ensuring smooth interaction. This validates the claims in the original 3DGS work about its scalability and real-time capability.
The above comparison results show that Gaussian splattering is closer to real-time operation and is more computationally efficient in large-scale cultural heritage modeling; it is especially suitable for high-fidelity visualization and subsequent AI-intelligent understanding scenarios. PhotoScan is still suitable for static document modeling and precision mapping tasks. The two technologies have different emphases and can be used in the whole process of cultural relics digitization.
In order to further evaluate the comprehensive performance advantages of the proposed algorithm in the three-dimensional reconstruction task of linear cultural heritage, this paper selects the current mainstream Gaussian splatting methods (including 3DGS, CityGaussian, and gsplat) for comparative experiments. The experiment is carried out under the same number of iterations (30k). In addition to the traditional image quality evaluation indicators (PSNR, SSIM, and LPIPS), model size, GPU use, and training time are also introduced as supplementary indicators to comprehensively measure the trade-off performance of each method between reconstruction quality and computational efficiency. The experimental results are shown in Table 3.
Table 3 presents the results of a comparative experiment of different Gaussian splatting models on the Great Wall dataset with 30k training iterations. From the perspective of reconstruction quality, our method (Ours) achieves the highest values in both PSNR (22.94 dB) and SSIM (0.655), indicating that it has a stronger ability to maintain image structure and pixel accuracy. Additionally, the LPIPS value of 0.357 matches that of 3DGS and is significantly better than that of gsplat (0.718), suggesting enhanced perceptual quality. Although the model size (3.57 GB) and GPU usage are slightly higher than those of the other models, the optimal reconstruction quality achieved within a reasonable training time of 2 h and 32 min demonstrates a well-balanced trade-off between accuracy and efficiency. In contrast, while gsplat is more compact and resource-efficient, its reconstruction quality is markedly lower—especially in SSIM and LPIPS—limiting its applicability in high-fidelity cultural heritage reconstruction scenarios.
Rendering results from each model at the same viewpoint in the Great Wall watchtower area are shown below in Figure 11.

3. Intelligent Understanding Based on 3D Gaussian Splatting Model

3.1. AHLLM-3D Network Design for Linear Cultural Heritage Understanding

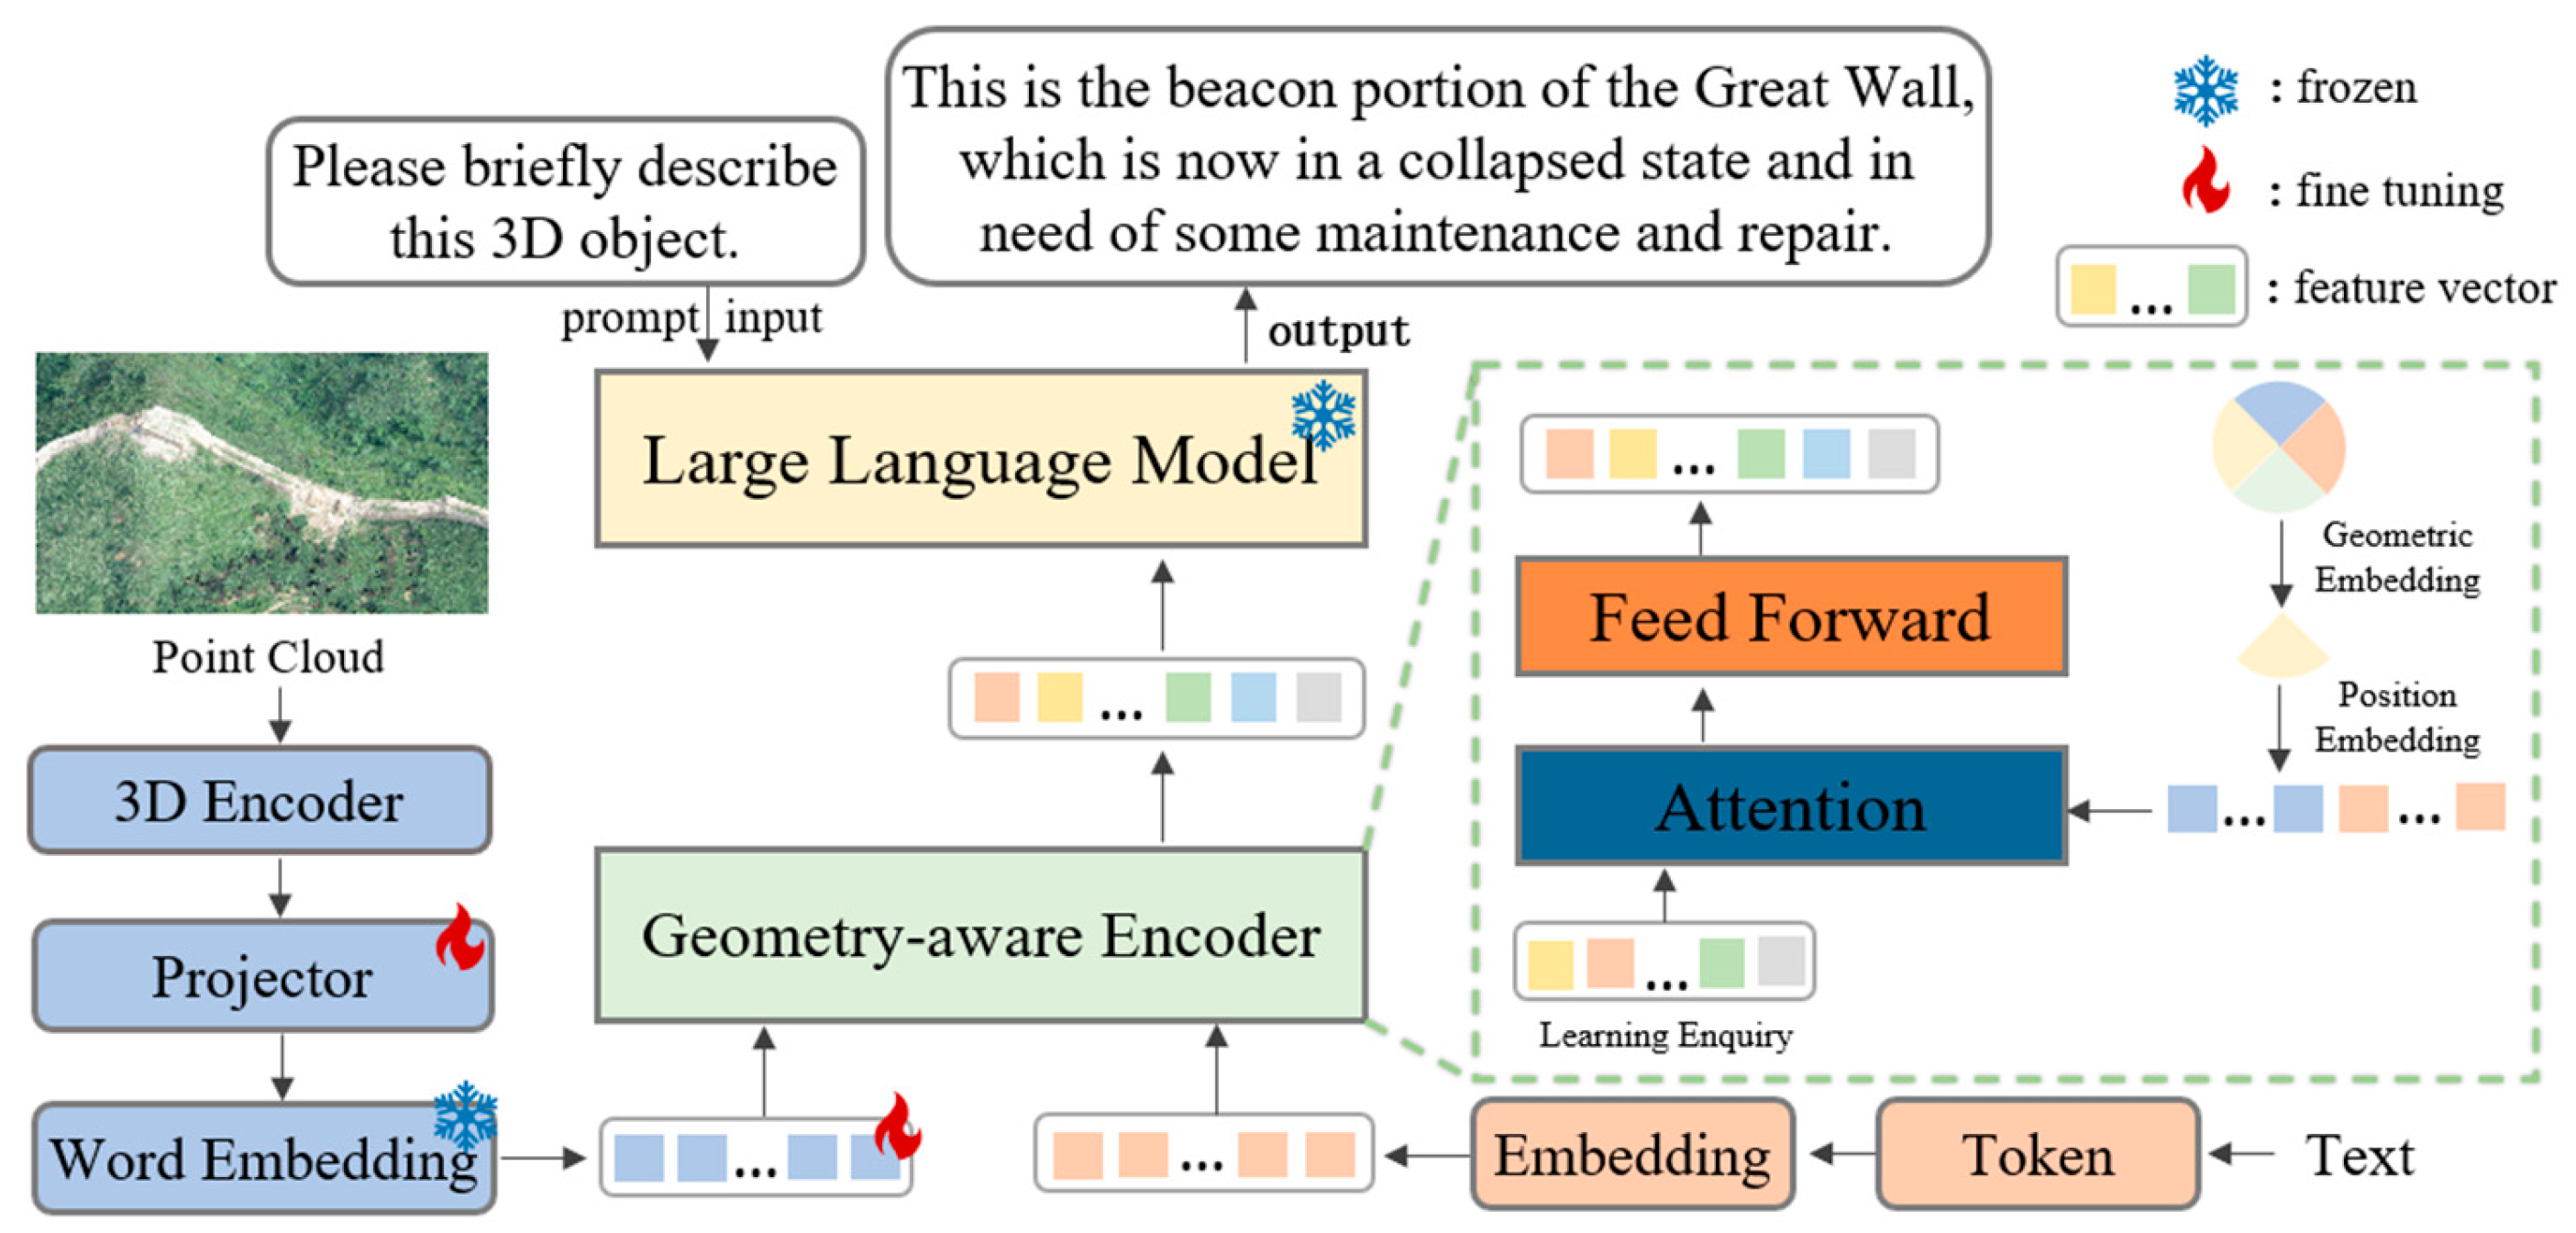
To effectively integrate large language models (LLMs) and 3D scene understanding technologies and enhance the semantic understanding and reasoning capabilities for elements within architectural heritage scenes, this study proposes the Architectural Heritage Large Language Model for 3D Understanding (AHLLM-3D) network architecture. This network architecture combines 3D point cloud data with large language models to create a complex multimodal system aimed at deepening the understanding and description of architectural heritage structures. Through this model, cross-disciplinary data fusion and intelligent reasoning are achieved, overcoming the limitations of traditional single-source analysis methods. Unlike traditional architectural heritage analysis methods, by incorporating large language models, AHLLM-3D is able to generate more semantically accurate descriptions that align with the historical, cultural, and functional characteristics of the heritage structures, thus providing more culturally enriched and precise recommendations and structural predictions for architectural heritage conservation. More importantly, the design of AHLLM-3D breaks through the bottleneck of traditional 3D modeling technologies. By integrating with large language models, it not only enhances the recognition of architectural details but also generates multi-level, multi-dimensional semantic outputs, driving further advancement of intelligent and automated approaches in the field of architectural heritage research. Figure 12 presents the network design diagram. The point cloud data P R n * d (where n is the number of points and d is the number of features) is preprocessed through segmentation, denoising, and normalization before being input into the network. The data is then processed by a point cloud encoder to generate the corresponding feature vector X = ( x 1 , x 2 , . , x m ) R m * c (where m is the number of point features and c is the feature dimension). The feature vector X is then transformed into point tokens Y = ( y 1 , y 2 , . , y m ) R m * c (where c is the dimension of the point token, which is the same as the dimension of the text tokens) using a multi-layer perceptron (MLP) projector. The point tokens are input together with the text tokens into the geometry-aware encoder module. Through operations such as geometric embedding, position embedding, and normalization, along with learnable queries, the module introduces geometric dimensions e i j = ( q i ) τ k j + λ g ( d i , d j , ρ i , ρ j ) . Here, q i and k j are the query and key vectors for points i and j , respectively; d represents the distance from the point to the center; ρ denotes the local density; λ is an adjustment factor, and g is a function based on the distance and density of points. This formula is used to adjust the self-attention mechanism weights, achieving alignment between point tokens and text tokens, and enabling an understanding of the spatial structure and geometric relationships of the point tokens. The backbone of the large language model is a decoder-only transformer, which receives a sequence of tokens generated by the geometry-aware encoder module. It uses the self-attention mechanism and feedforward neural networks to understand the contextual relationships.

3.2. Multimodal Understanding and Generation of the Great Wall Heritage Based on 3DGS

3.2.1. Dataset Construction

This study uses the Gaussian splatting model, which undergoes professional processes such as manual segmentation, denoising, and registration to ensure the integrity and geometric accuracy of the point cloud data. To optimize computational efficiency while retaining key features, the data is efficiently represented using 3DGS technology. Its dynamic rendering characteristics significantly reduce storage and computational requirements while ensuring high detail fidelity. The text annotation work adopts a dual-level structure, encompassing both a brief introduction and a complex description. The brief introduction, based on extensive historical literature and conservation reports, systematically describes the Great Wall’s construction era, structural features, and preservation status. To ensure the accuracy and reliability of the data, all text annotations are conducted according to pre-defined standardized annotation guidelines. These guidelines cover key elements such as the Great Wall’s historical background, architectural style, material usage, and geographical distribution, ensuring that each description accurately reflects the cultural and historical value of the Great Wall. Through in-depth analysis of historical literature, annotators accurately extract and present core information about the Great Wall, including records of repairs from different historical periods and descriptions of their impact on the structure. Additionally, the annotation guidelines require annotators to provide a detailed account of the current preservation status, including the degree of weathering, damage, and current conservation measures for each section of the Great Wall. The complex descriptions, on the other hand, utilize DeepSeek for in-depth annotation. Guided by professional prompting engineering, the model generates multi-angle analyses for each research object, covering in-depth topics such as natural environmental erosion, tourism development impact, and conservation technology applications. For the text generated by the general large language model, we conducted manual evaluation, with particular attention to potential errors or biases. In response to these issues, an expert team made necessary corrections and adjustments to the generated text, ensuring its accuracy and reliability. Through this combination of manual correction and text generation by the general large language model, we can ensure that the text maintains efficient generation while fully reflecting key issues in the field of cultural heritage conservation, thus guaranteeing the accuracy and scientific integrity of the data. Specifically, each point cloud sample is paired with three single-turn dialogues and one multi-turn dialogue containing two sets of questions and answers. All texts are verified to ensure factual accuracy and logical coherence.

3.2.2. AHLLM-3D Model Distributed Training

AHLLM-3D is a distributed training framework specifically designed for 3D point cloud-text multimodal tasks. This framework adopts a two-stage training strategy. The first stage is the feature alignment stage, which focuses on establishing the mapping relationship between the point cloud data and the text space. During this stage, the parameters of the point cloud encoder and the large language model (LLM) are kept fixed, and only the MLP projector is trained. This stage uses brief introductory text as supervision, emphasizing the optimization of the transformation from point cloud features to the text token space.
The second stage is the instruction tuning stage, which focuses on enhancing the model’s ability to understand and generate complex instructions. During this stage, the point cloud encoder is kept frozen, and both the MLP projector and the language model are trained jointly. This stage uses instruction data that includes multi-turn dialogues and complex question–answer pairs, allowing the model to gradually master the ability to perform deep reasoning and generation based on point cloud features. By simulating complex interactive scenarios, the model progressively improves its cognitive and reasoning abilities in tasks such as object recognition, geometric structure analysis, and scene semantic understanding. In the fine-tuning stage, AHLLM-3D further enhances the model’s adaptability through joint fine-tuning across multiple tasks and datasets.

3.3. Experimental Results and Analysis

3.3.1. Staged Training Metrics Analysis and Parameter Optimization Process

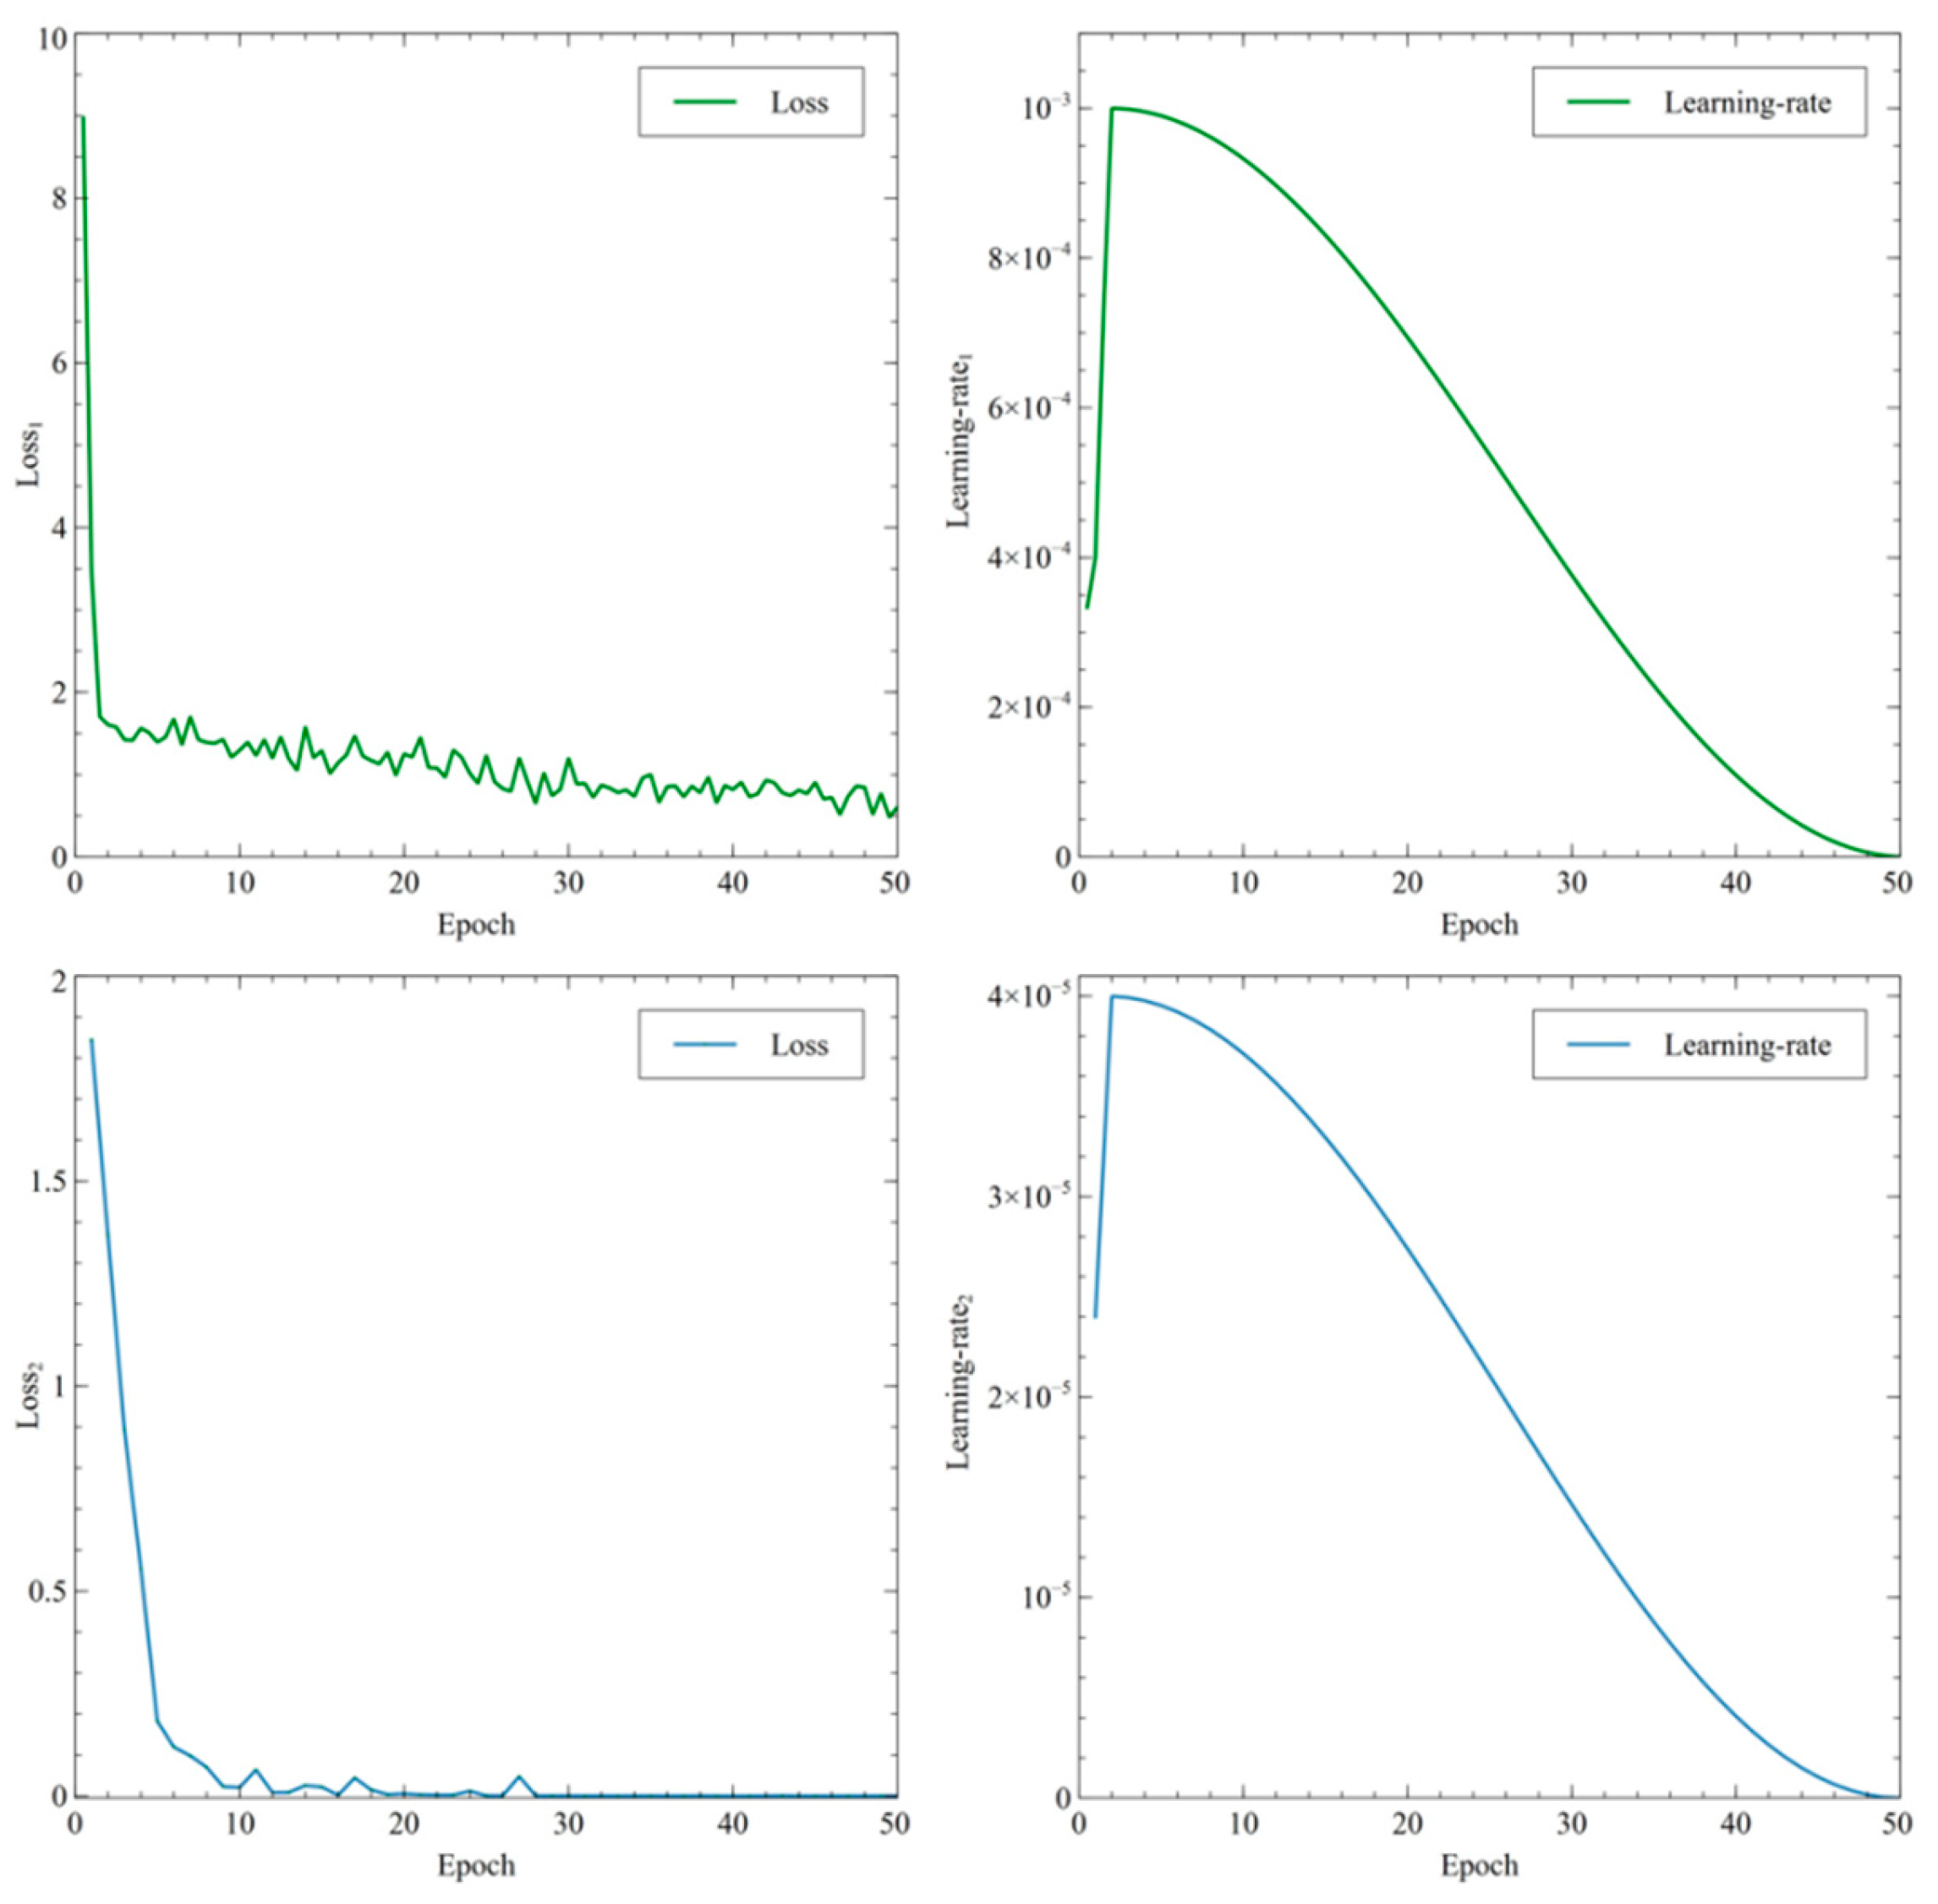
As shown in Figure 13, during the initial training phase, the learning rate curve drops rapidly in the early stages to quickly approach the optimal value, allowing the model parameters to converge to a potential optimal range. The loss function exhibits a rapid decline, and prediction performance continues to improve, indicating that the model effectively optimized its parameters during the feature alignment stage through an adaptive learning strategy. In the second-phase training, the model undergoes fine-tuning based on the training from the previous stage. The learning rate curve rises quickly before gradually declining, demonstrating that the optimal text-point cloud association is rapidly achieved on top of the aligned features. The loss function’s trajectory during this stage verifies the effectiveness of the learning process. The sharp drop in the initial loss value confirms that the model has successfully inherited the cross-modal association prior knowledge learned during the first stage.

3.3.2. Evaluation of Command Comprehension Effectiveness and Verification of Semantic Reasoning Ability

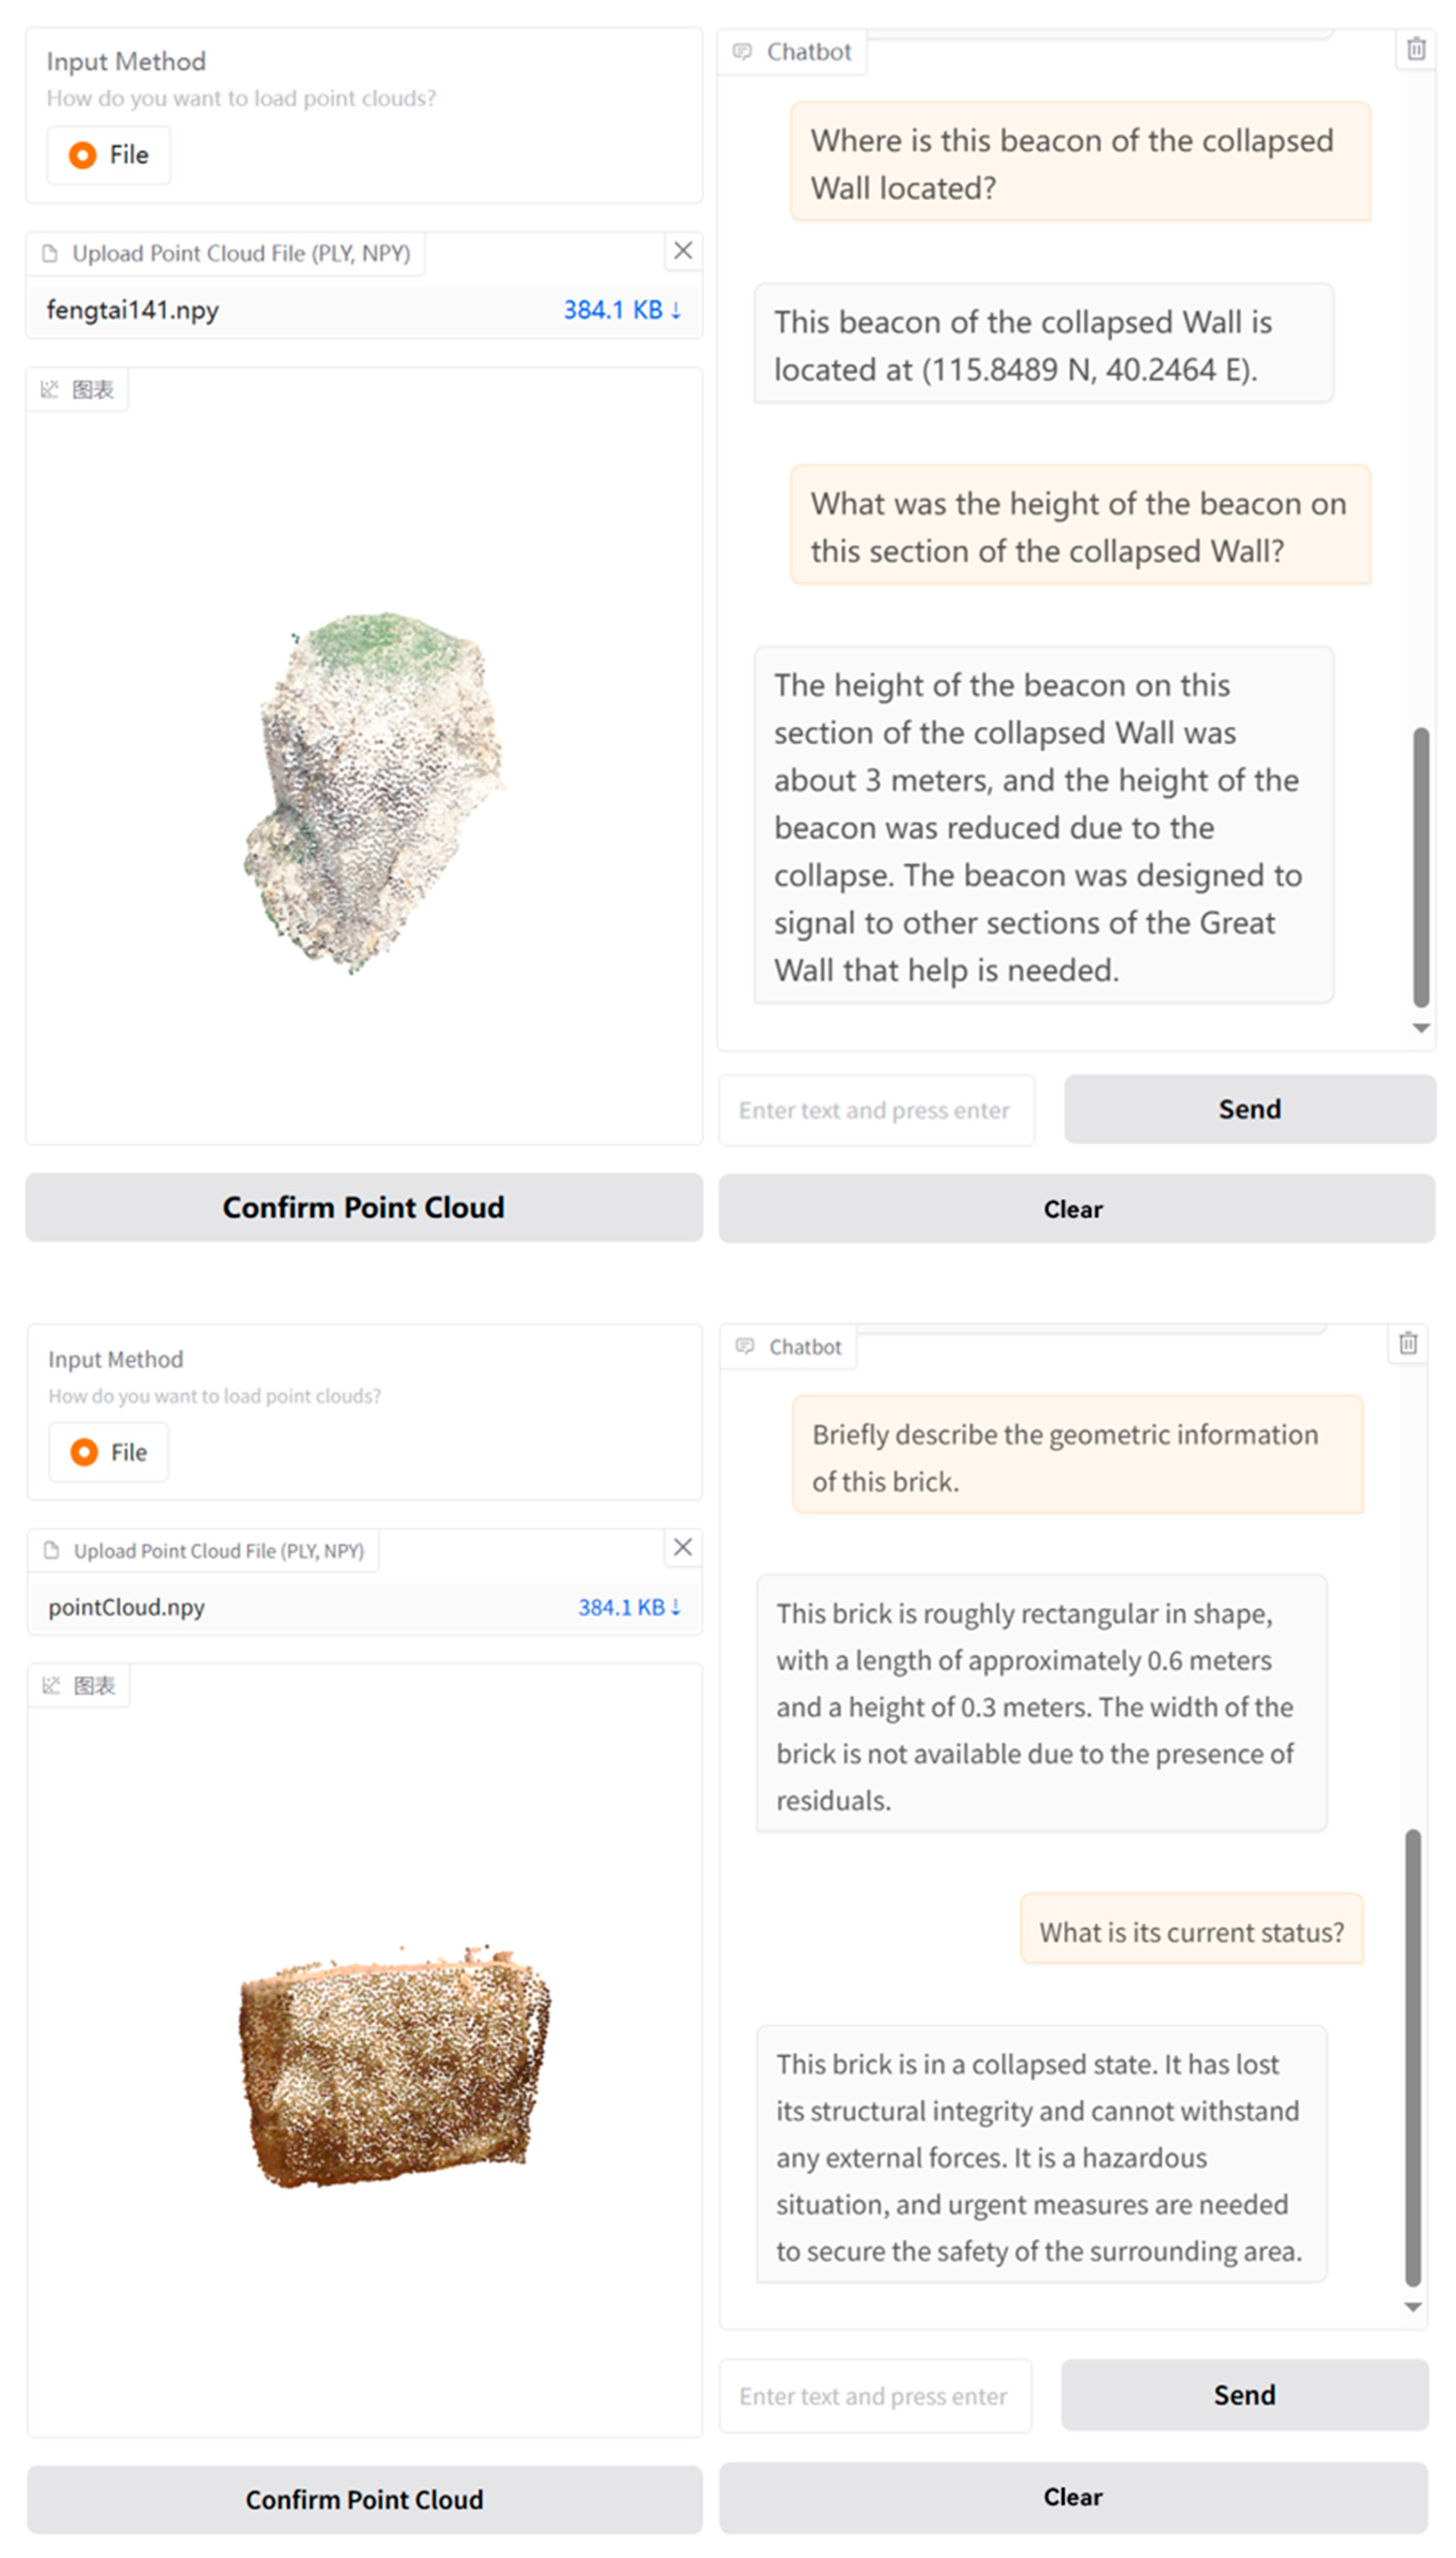
To validate the model’s ability to understand instructions and perform semantic reasoning in complex tasks, the experiment designed evaluation scenarios covering both spatial and non-spatial questions. Figure 14 illustrates the model’s ability to handle spatial problems. For the beacon tower point cloud data, the model accurately extracts its geographical coordinates, 115.8489 N, 40.2464 E, and analyzes and determines that its current height is approximately 3 m. The model also identifies the brick as being in a “completely collapsed and structurally compromised” physical state. Such tasks involve coordinate localization, geometric height measurement, and structural state assessment, demonstrating the model’s ability to analyze three-dimensional spatial attributes.
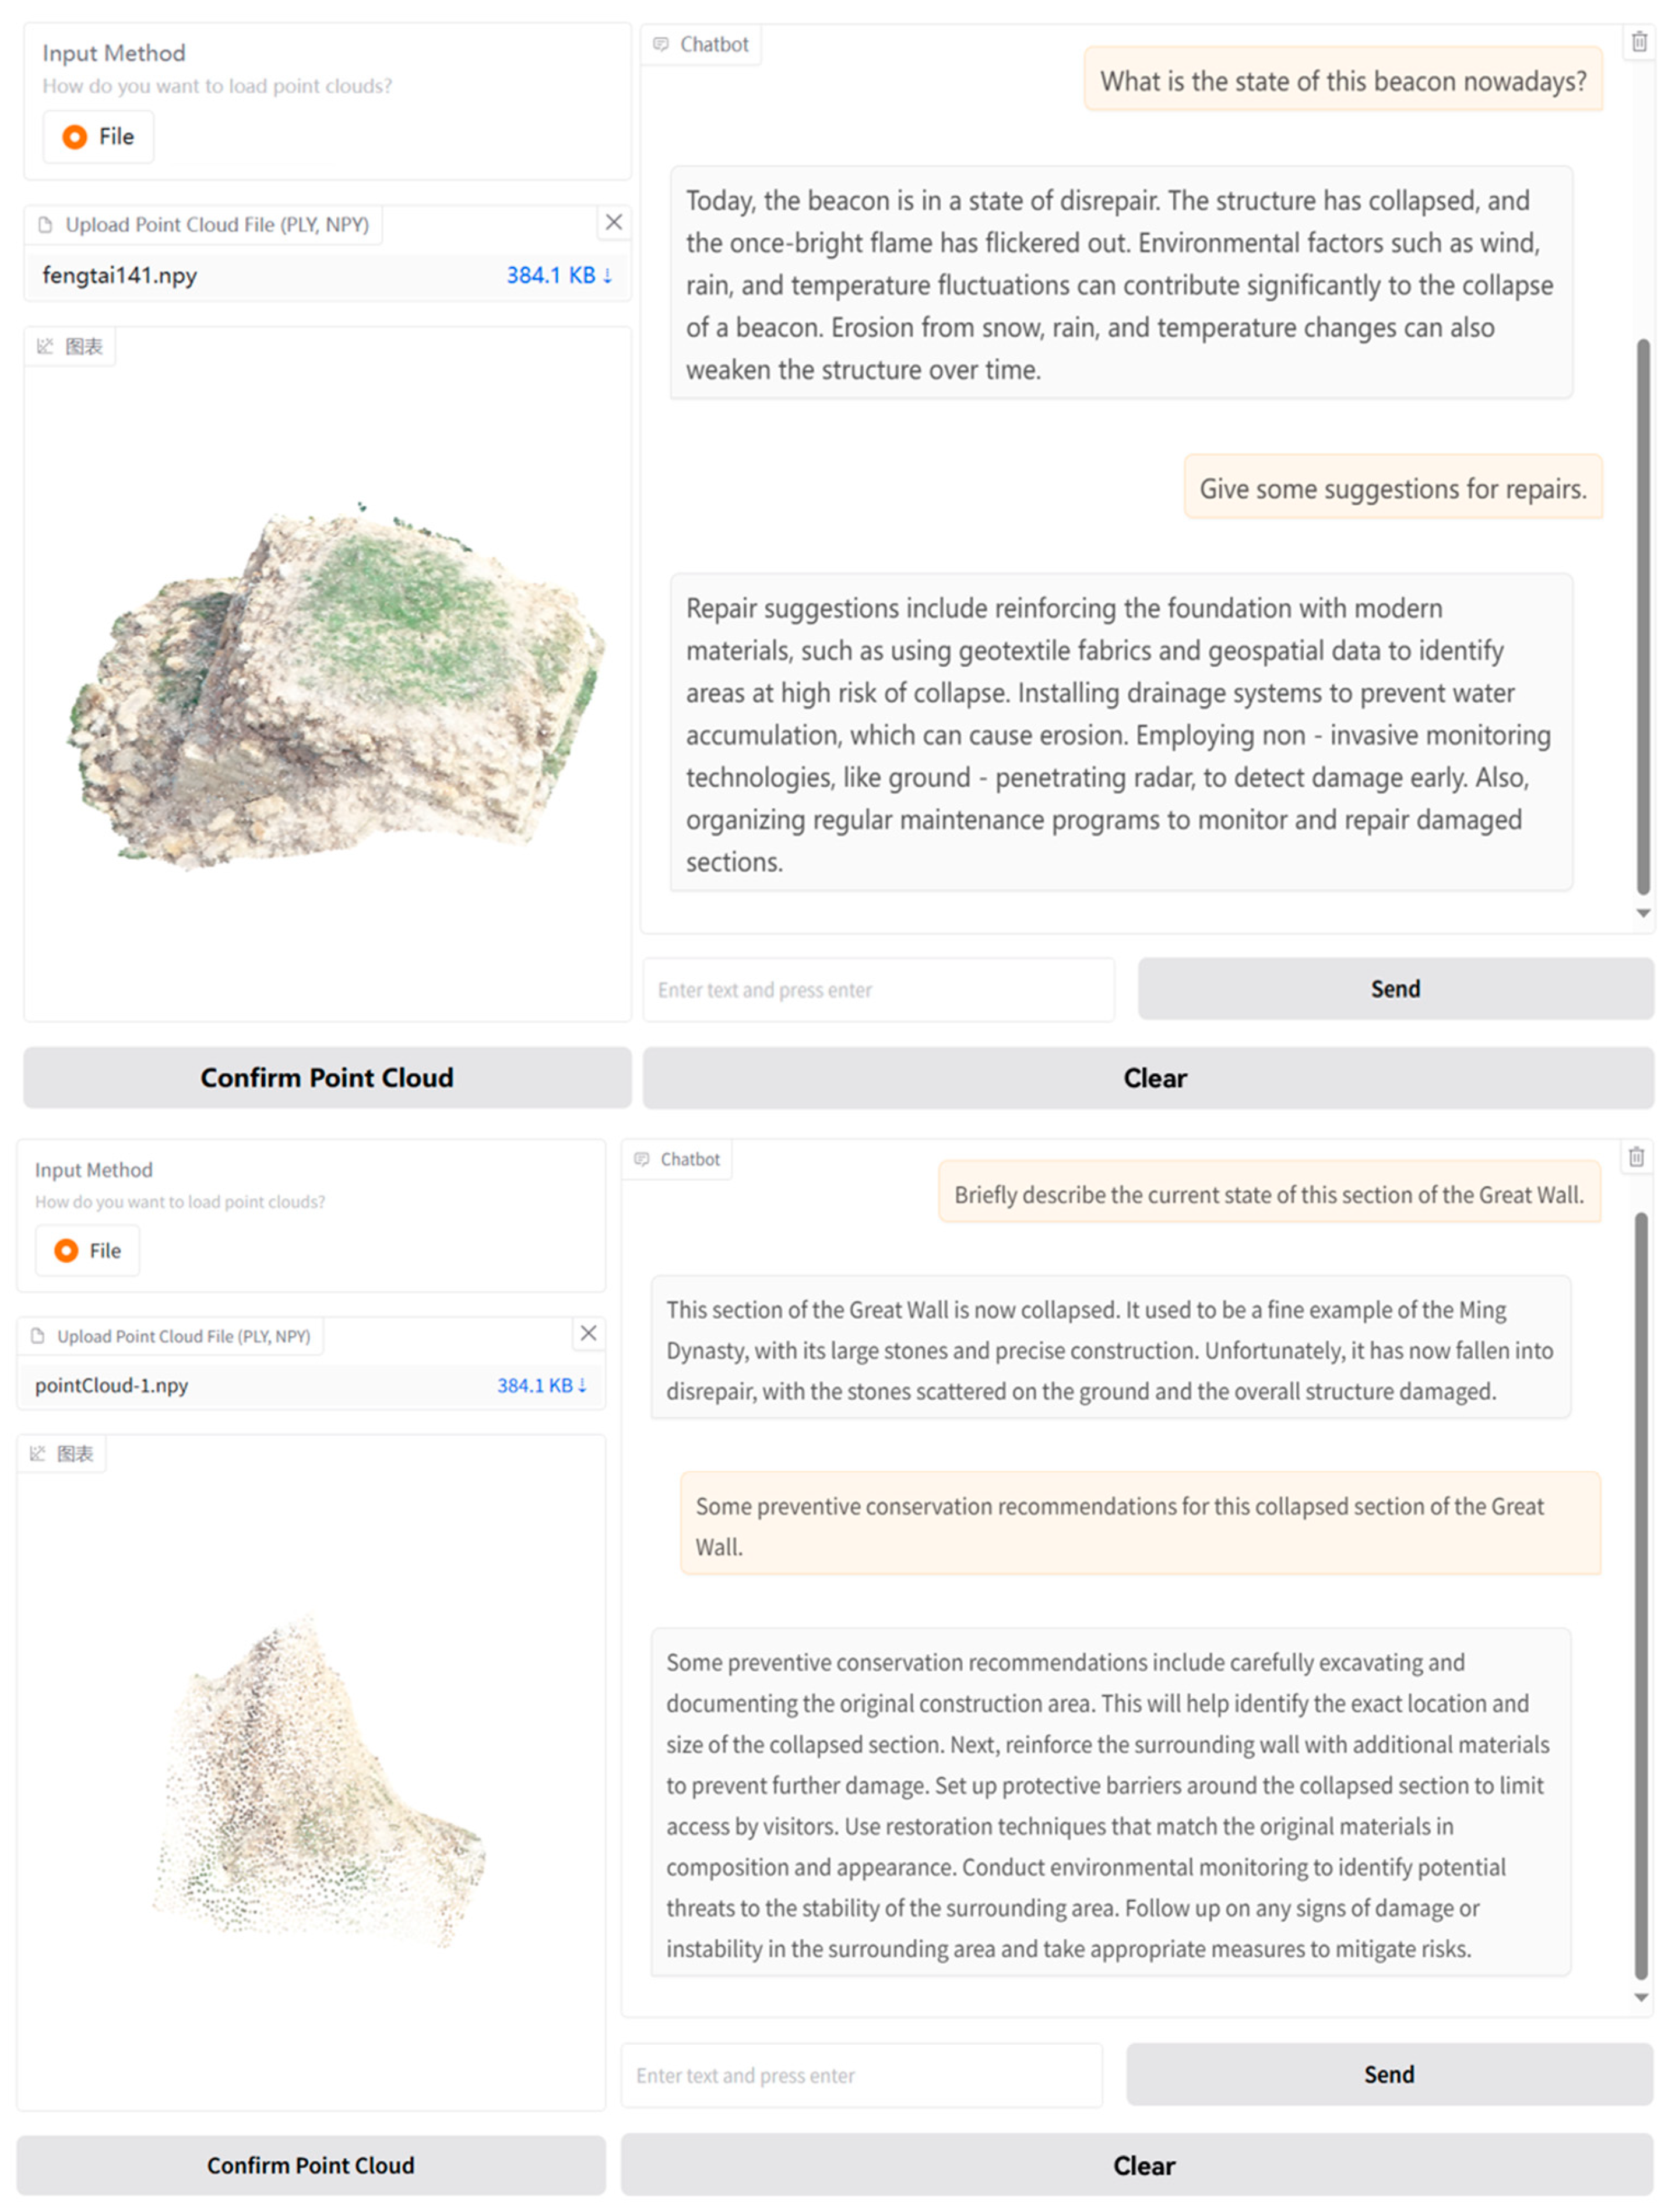
Figure 15 highlights the model’s non-spatial semantic reasoning capabilities. Concerning the current state of the beacon tower, the model combines environmental factors and identifies the cause of its collapse, attributing it to “wind and rain erosion and temperature fluctuations leading to structural weakening and collapse.” When addressing the need for restoration, the model proposes a systematic protection strategy. From an engineering perspective, it suggests reinforcing the foundation with geotextile and constructing a drainage system. From a technical perspective, it recommends using ground-penetrating radar for non-invasive damage monitoring. The strategy extends to preventive protection measures and culminates in the establishment of a management mechanism for regular maintenance and risk response. This demonstrates the model’s deep semantic generation ability in cross-modal knowledge transfer and the application of historical building conservation principles.
The experimental results demonstrate that the model possesses dual advantages in spatial physical feature analysis and non-spatial semantic reasoning. It is capable of interpreting spatial information such as coordinates, height, and structural state that is embedded in the point cloud data while also integrating environmental science and engineering knowledge to form a complete logical chain from damage attribution to protection decision-making. This provides multi-dimensional technical support for the intelligent cognition and preservation of cultural heritage.

4. Intelligent Understanding Based on 3D Gaussian Splatting Model

4.1. Research Methods and Technical Routes for Intelligent Forecasting

4.1.1. Data Acquisition for the Study Area

The data used in this paper includes the following: A total of 20 views of C-band Sentinel-1A up-orbiting data from 5 January 2021 to 10 June 2024 downloaded from the Alaska satellite facility (ASF), using interferometric wiSBASe (IW) single look complex (SLC) data. The single look complex (SLC) image data with a 250 km width, the polarization mode of vertical homopolarization (VV), a revisit period of 12 SBAS, and a spatial resolution of 5 m × 20 m (distance×azimuth) are used to obtain the time series deformation information of a county.
The auxiliary data include the following: Precision orbital data (Orbit Precision SBASata, orb) used in satellite navigation, space measurements, and related precision orbital computation fields; digital elevation model (SBASigital elevation moSBASel, SBASEM) data used to eliminate the influence of topographic phases in the interferometric phases; and Google satellite images as auxiliary reference images.

4.1.2. Technical Lines of Research

The geology of the Great Wall and its surrounding area is monitored and deformation analyzed based on synthetic aperture radar (SAR) technology. The core methodology includes differential interferometric synthetic aperture radar (SBAS-InSAR) and permanent scatterer interferometric synthetic aperture radar (PS-InSAR) technology, which can analyze the ground surface changes through time series and provide reliable data support for cultural heritage protection and geologic disaster monitoring. SARscape not only relies on SAR data alone but is also capable of fusing with UAV image data and point cloud data to supplement the inadequacies of SAR data in small areas.
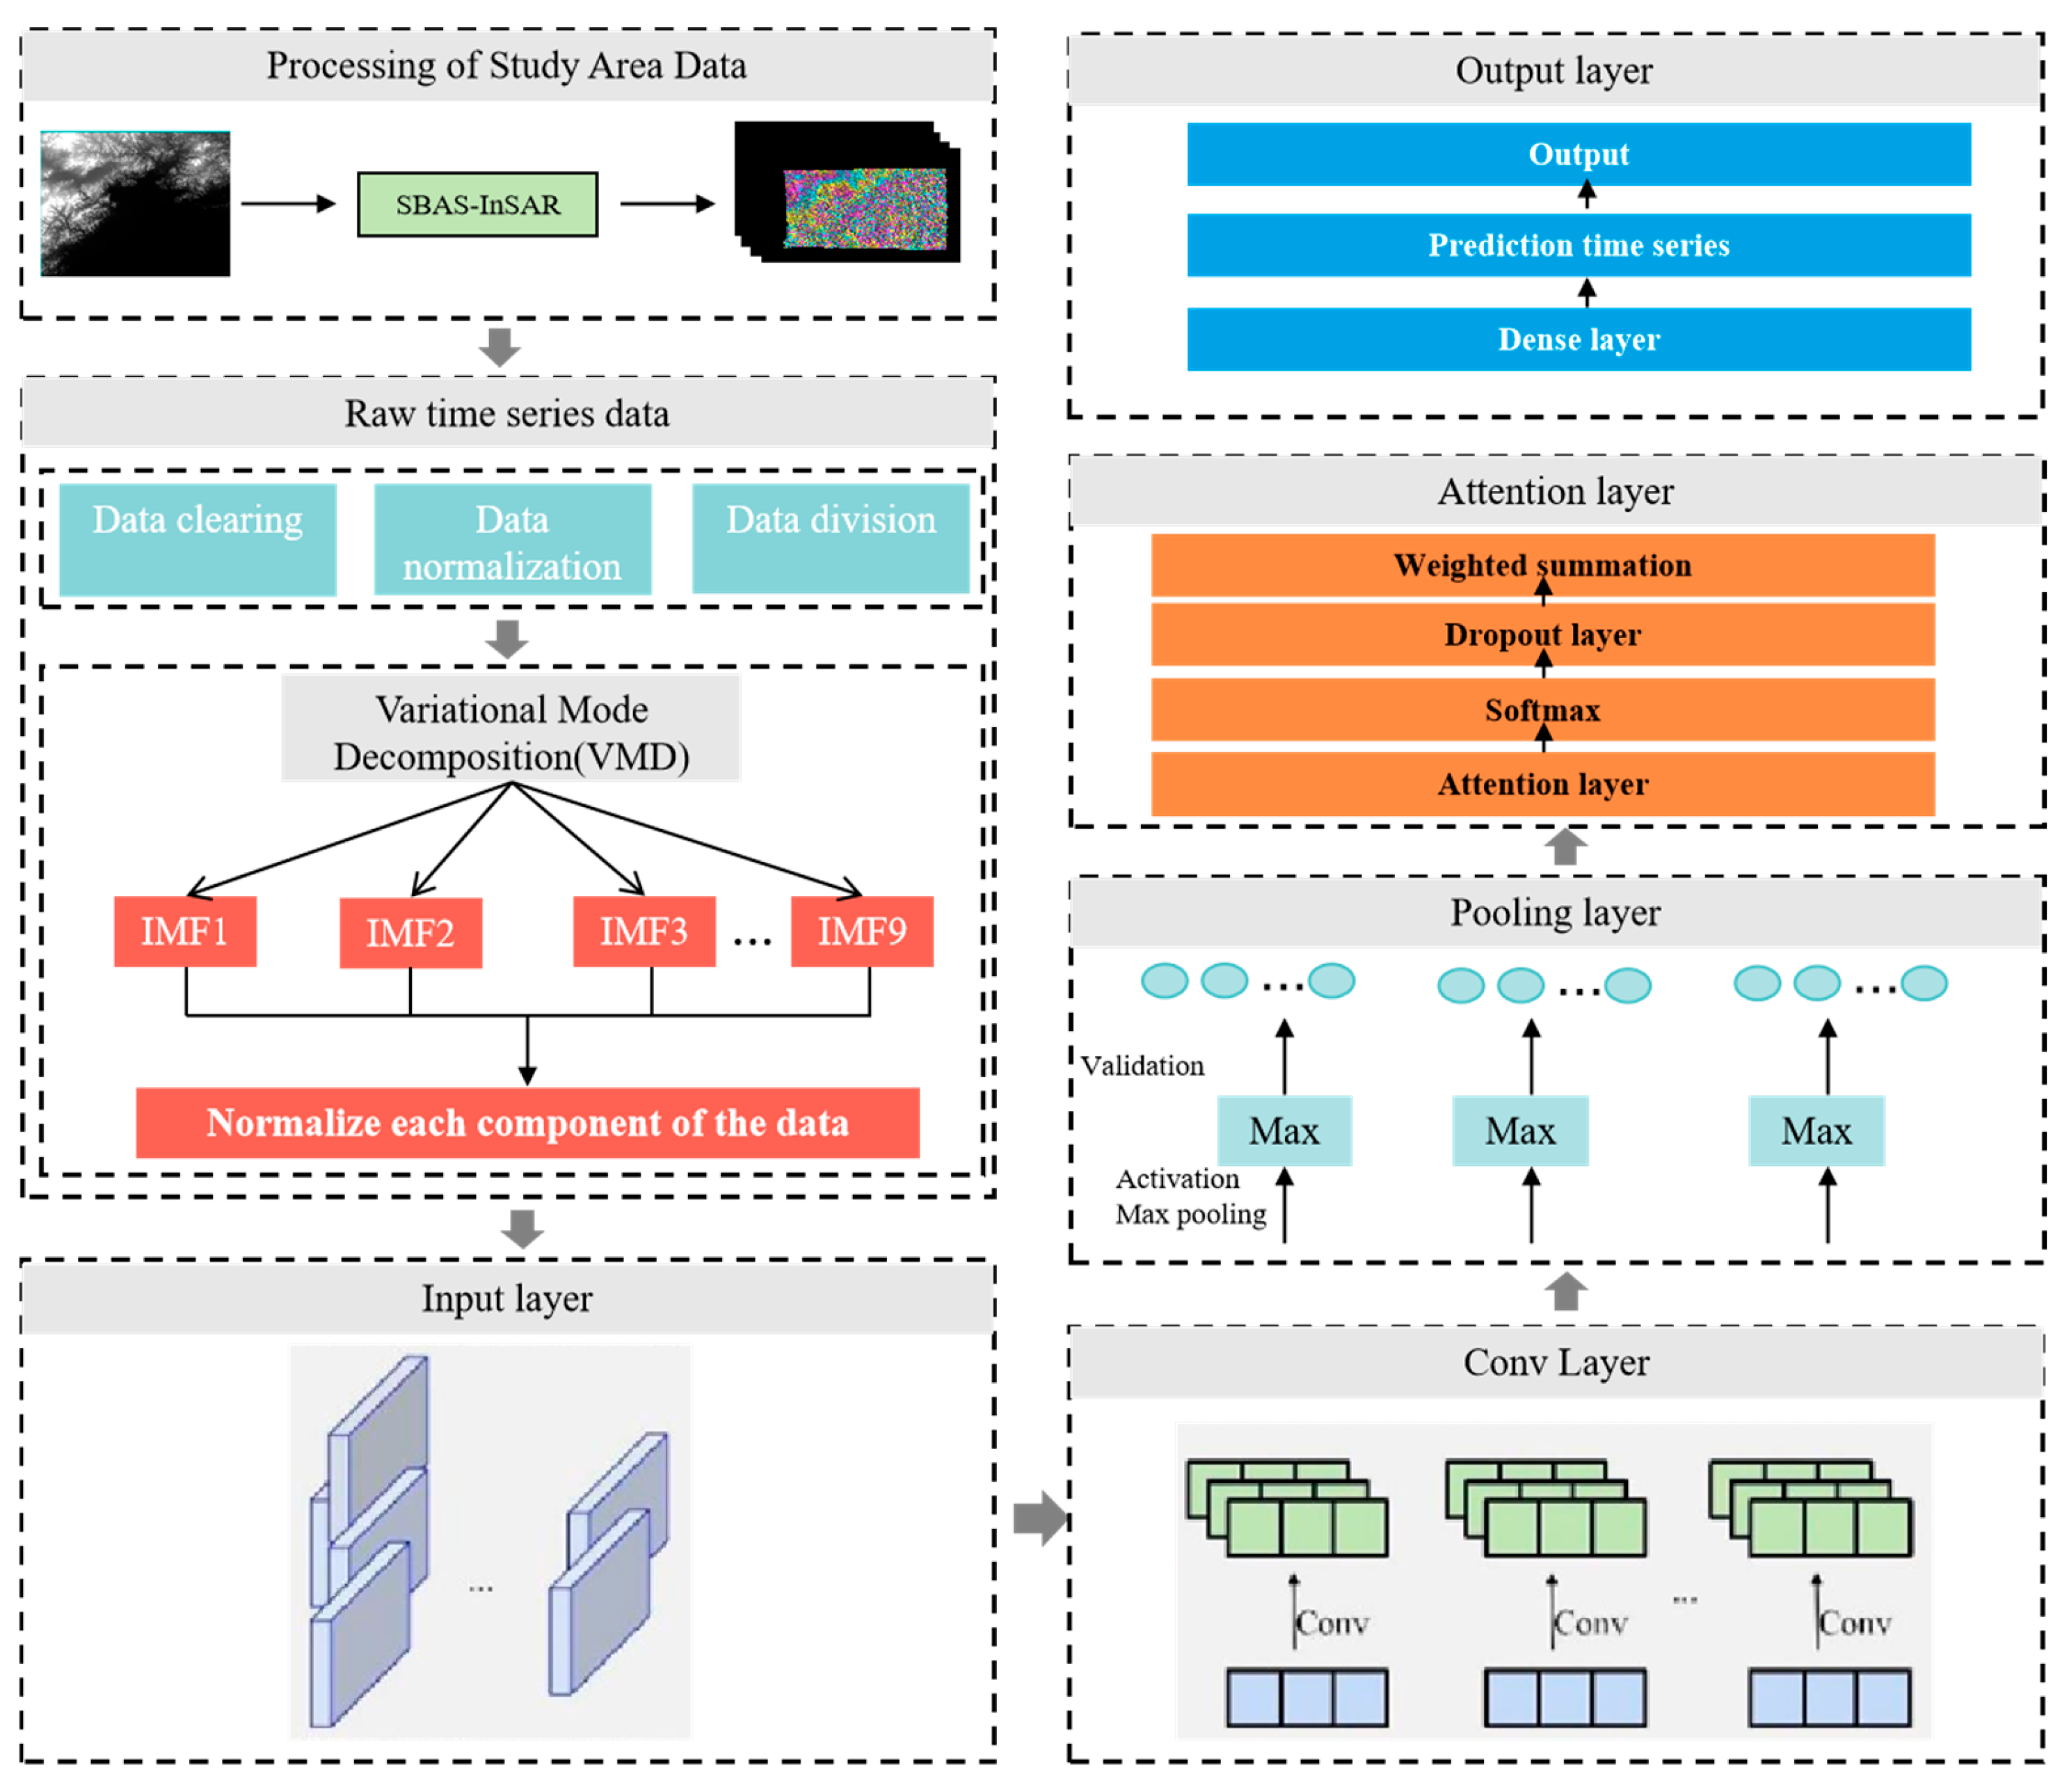
Aiming at the lack of accuracy and computational inefficiency of traditional methods in handling nonlinear and high-dimensional spatial-temporal coupling data in the SBAS-InSAR surface deformation prediction task of the Great Wall and its surrounding areas, this study proposes a network model that integrates CNN, LSTM, and a self-attention mechanism (AT, Self-Attention). This complements SARscape by automatically extracting spatial features through the CNN layer, capturing spatial features through the LSTM layer, and optimizing spatial features through the LSTM layer to capture time series dependence. By using the AT layer to focus on the influence of critical time steps, the model can comprehensively consider the complex spatiotemporal features of surface deposition data.
The technical roadmap (Figure 16) illustrates the model’s five core modules: input layer, hidden layer, attention module, model training, and output layer. The input layer is the model data preprocessing stage, which prepares the initial time series data to meet the network input specifications. The output layer then provides the final prediction results by iterating point by point.

4.1.3. Principles of Snake Optimization Network Prediction Model Based on Variational Modal Decomposition

This study selects the snake optimization (SO) algorithm to optimize the prediction model based on AT-CNN-LSTM. Compared to traditional optimization methods, such as Bayesian optimization and grid search, the snake optimization algorithm demonstrates unique advantages in several aspects. First, the snake optimization algorithm has the ability to automatically balance global search (exploration) and local search (exploitation). By dynamically adjusting the search strategy through the temperature parameter, SOA effectively avoids premature convergence to a local optimum, maintaining better search efficiency and a global perspective during the optimization process. Especially when handling multimodal optimization problems, SOA is capable of finding the global optimum between multiple local optima, thus avoiding the local optimum trap that traditional methods may encounter.
In comparison to Bayesian optimization, the snake optimization algorithm does not rely on prior assumptions or the local gradient information of the objective function, making it more suitable for high-dimensional and nonlinear problems. Bayesian optimization typically requires the construction of a surrogate model, which, although capable of modeling the objective function, often limits the exploration of the parameter space. Grid search, on the other hand, exhaustively explores each combination of hyperparameters, ensuring the optimal solution is found, but with significant computational cost, making it relatively inefficient. In this context, the snake optimization algorithm, with its simple parameter settings of population size and maximum iteration count, performs hyperparameter optimization in multivariate time series prediction tasks efficiently without the need for complex parameter tuning.
Therefore, this study chooses the snake optimization algorithm as the optimization method, aiming to enhance the model’s generalization ability and stability. By leveraging the advantages of SOA, we ensure that the optimization process avoids local optima and can achieve more accurate solutions for complex multimodal optimization problems. This optimization strategy choice makes the study more efficient and practical in real-world applications. The design of the snake optimization algorithm is inspired by the reproductive behavior and foraging strategy of snakes. A uniformly distributed random population is first generated, and each solution is classified and selected based on its fitness. New solutions are generated by simulating the mating behavior between males and females, and inefficient solutions are eliminated through competitive behavior.
The initial population can be obtained by using the following equation:
X i = X m i n + r × X m a x X m i n
In the SO algorithm, the population is divided into two groups, males and females, and the individuals (solutions) in each group interact according to their fitness (efficiency of problem solving). Mating behavior between males and females is used to generate new solutions, while competitive behavior is used to eliminate inefficient solutions.
If Q < 0.25, snakes search for food by choosing any random location, and they update their position. Male snake positions are updated as follows:
X i , m t + 1 = X r a n d , m ( t ) ± c 2 × A m × ( ( X m a x X m i n ) × r a n d ) + X m i n
Female snake location is updated as follows:
X i , f = X r a n d , f ( t + 1 ) ± c 2 × A f × ( ( X m a x X m i n ) × r a n d ) + X m i n ,
If Q > 0.25 and temperature > 0.6, the snake will only move toward the food:
X i , j t + 1 = X f o o d ± c 3 × T e m p × r a n d × X f o o d X i , j t ,
Depending on the stage and conditions, each snake updates its position in the search space. This updating may be influenced by interactions with other snakes, searching for food, or following mating rituals. The process is repeated for a set number of iterations or until a convergence condition is satisfied. The optimal solution (the most adapted snake) is considered the best solution to the problem. In this model, the SO algorithm is mainly optimized for four hyperparameters, which are the learning rate, the number of LSTM neurons, the key value of the attention mechanism, and the regularization parameter, and iteratively searches for the optimal parameter combinations by simulating the snake’s predatory behavior.
The original data of the data source is the ascending orbit data processed by SBAS-InSAR, and finally, after obtaining the overall LOS-oriented deformation rate of the Great Wall, the overall LOS deformation rate of the Great Wall is obtained. A total of 160 high-coherence points in the area around the Great Wall are selected as learning samples for surface settlement prediction, and the samples are sorted according to the latitude and longitude coordinates of the high-coherence points. The results are subjected to variational mode decomposition and then to multivariate time series prediction; first, the multivariate sequences that have been decomposed by variational modelling are received through the input layer, and the time step is converted into a pseudo-2D structure using a sequence folding layer to adapt to the spatial feature extraction requirements of CNN. The CNN layer has 3 × 1 cores and 16 filters to capture the inter-variable interaction patterns through local receptive fields, and its output is normalized by the batch normalization layer with ReLU activation; then, the feature dimensions are compressed by the maximum pooling layer to retain the significant spatial patterns, and the sequence unfolding layer recovers the temporal structure. The smoothing layer expands the features into vectors, and the inputs are fed to the LSTM layer for modeling the long-term dependencies, with its state updated following a gating mechanism. In order to strengthen the modeling ability of key timing nodes (e.g., sudden deformation events), the model introduces a self-attention layer, which computes the correlation weights between time steps in parallel through multiple heads:
A t t e n t i o n Q , K , V = s o f t m a x Q K T d k V ,
where Q, K, V are generated by the linear mapping of the input sequence, respectively. After the Dropout layer randomly masks the neurons to suppress overfitting, the fully connected layer maps the higher-order features to the output dimensions, and the mean-square error loss is computed by the regression layer. In this model, the Dropout ratio is set to 0.2, which implies that 20% of neuron outputs will be randomly discarded in each iteration.
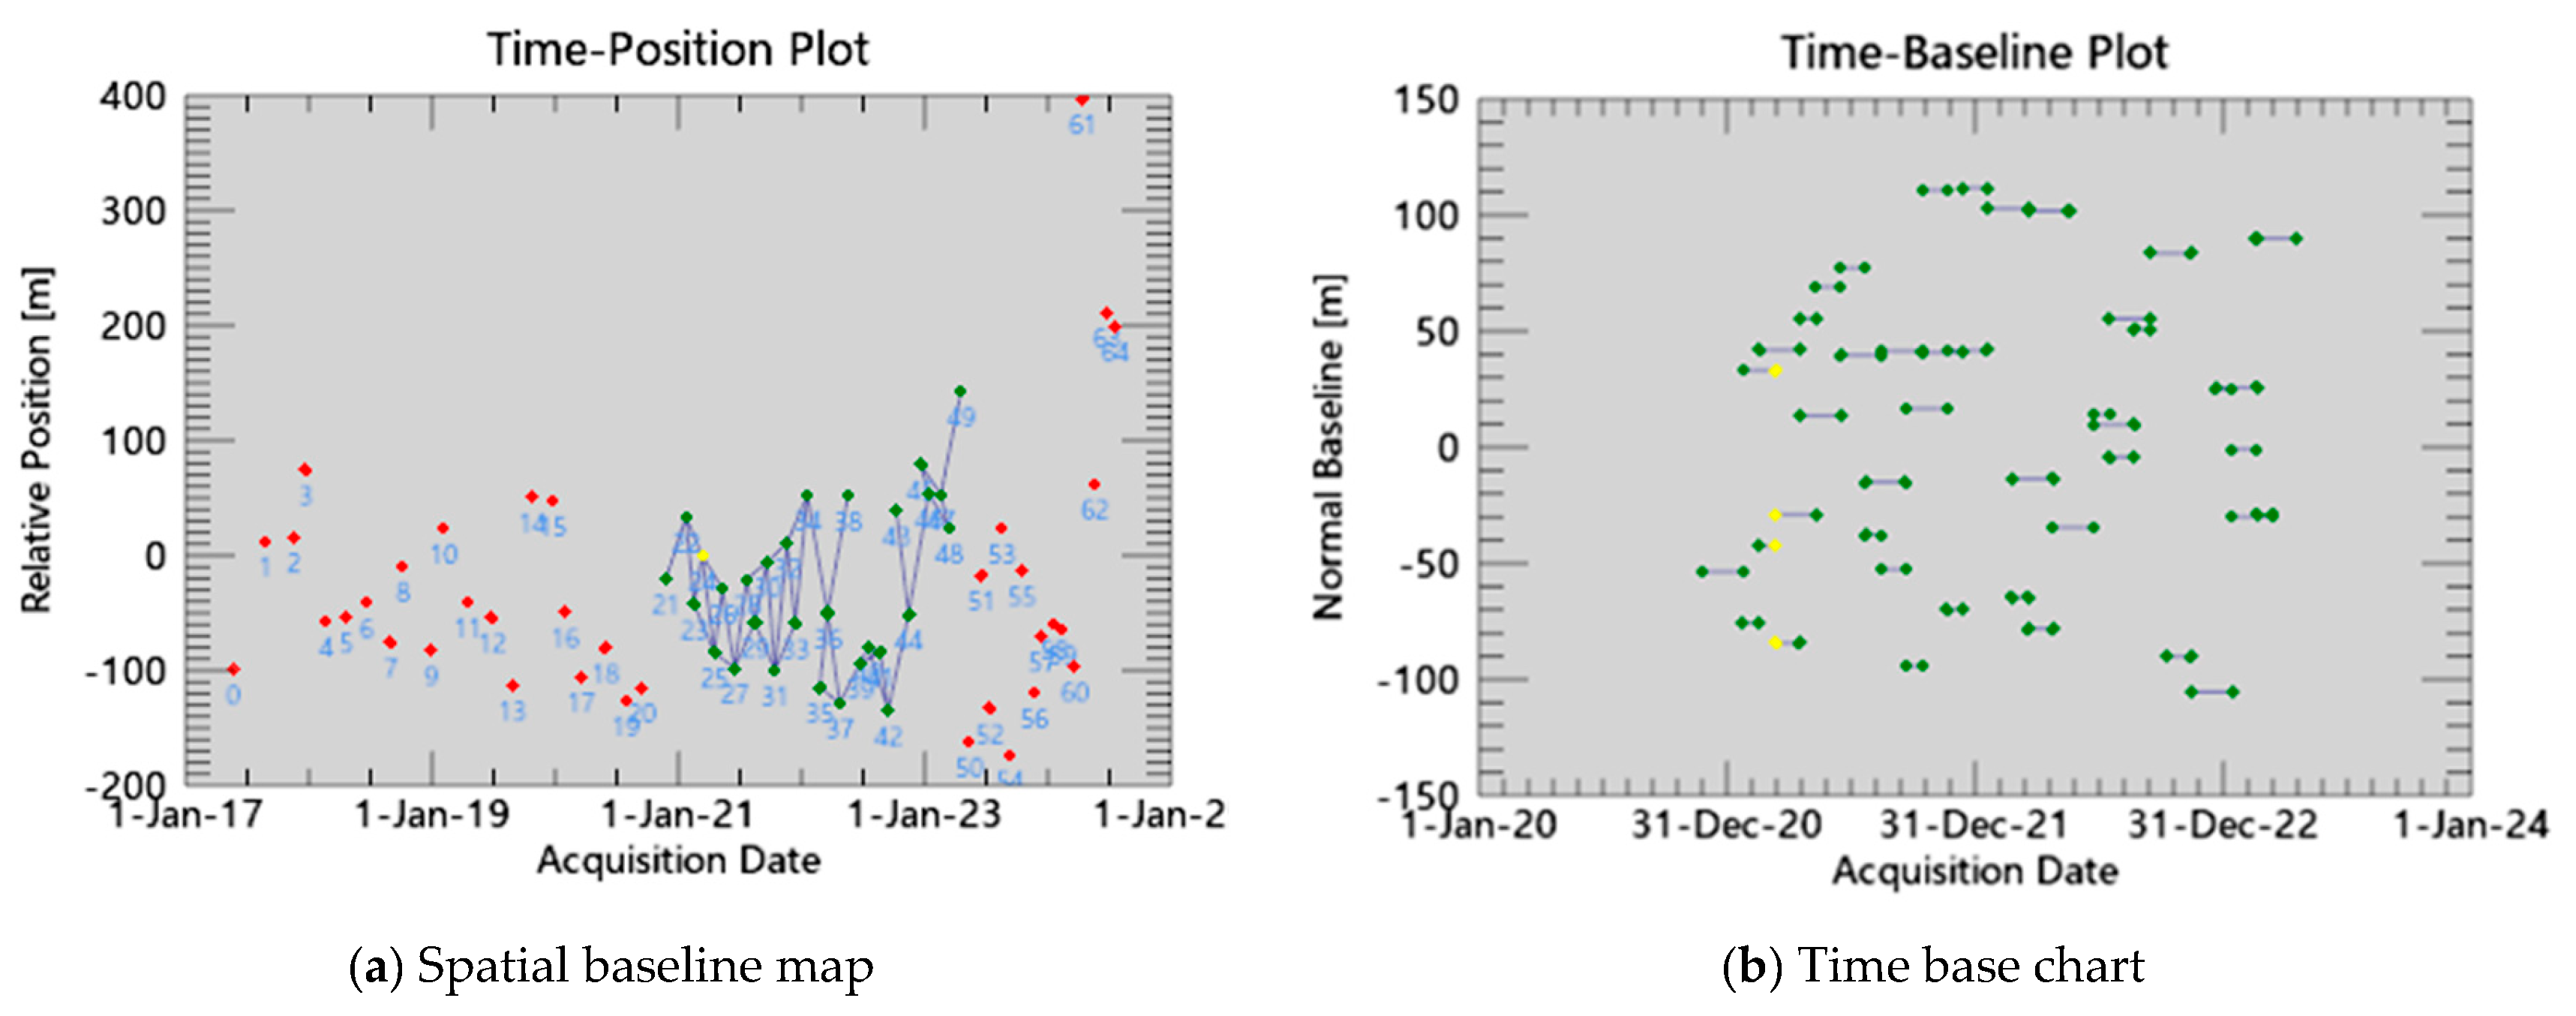
Taking the up-orbit dataset in this paper as the research object, 65 views of up-orbit SAR images acquired between May 2017 and July 2024 are selected to constitute the observation sequence. Figure 17 shows the temporal baseline map and spatial baseline map generated by the SBAS-InSAR method. In the data processing stage, the temporal baseline threshold is set to be no more than five times the critical baseline, and the spatial baseline constraint is set to be 500% of the maximum allowable value. The linear shape variables and digital elevation model residuals of the permanent scatterer target are solved by the least squares optimization algorithm, and the spatial and temporal baseline framework with the super-master image as the reference is established in the subsequent steps. The master-slave image alignment strategy is adopted to achieve the generation of the interferogram sequence, in which the phase difference between each auxiliary image and the master image constitutes the core observation of the interferometric measurements.

4.2. Synthetic Aperture Radar (SAR) Monitoring Time Series Analysis

The following time series graph is generated from the nine points excerpted from the study area in Figure 18 as a control. It can be seen from the deformation trend that the annual deformation rate usually fluctuates between −35 mm/year and 35 mm/year, and there is a clear downward trend in all three sets of comparison graphs. It can be seen that from June to October 2018, the point settlement is more obvious, and the maximum cumulative settlement is 10 mm. By checking the historical data, it can be seen that the study area suffered from extreme heavy rainfall and flooding in July, and the single-day precipitation amounted to more than 150 mm (exceeding the average value of the same period of time in history by 200%). Heavy precipitation may lead to a rapid increase in the soil water content of the mountain body, which will trigger foundation slippage or instability, and the deformation of the Great Wall and the surrounding mountains will be aggravated. The scouring effect of rainfall will weaken the stability of soil and rock layers around the Great Wall base. Soil moisture and groundwater infiltration may continue to affect the mountain for several months after precipitation, leading to a gradual increase in deformation in subsequent periods. Localized landslides occurred in the Great Wall section (e.g., the Chenjiabao section), and the wall was displaced from its base due to soil saturation. The deformation from May 2020 to March 2021 was small and stable; the trend of deformation from June 2021 to April 2022 tended to flatten out, and the amount of settlement was small. Figure 18a, Figure 18b, and Figure 18c, respectively, show nine points selected from left to right within the study area (with three adjacent points grouped together for comparison).
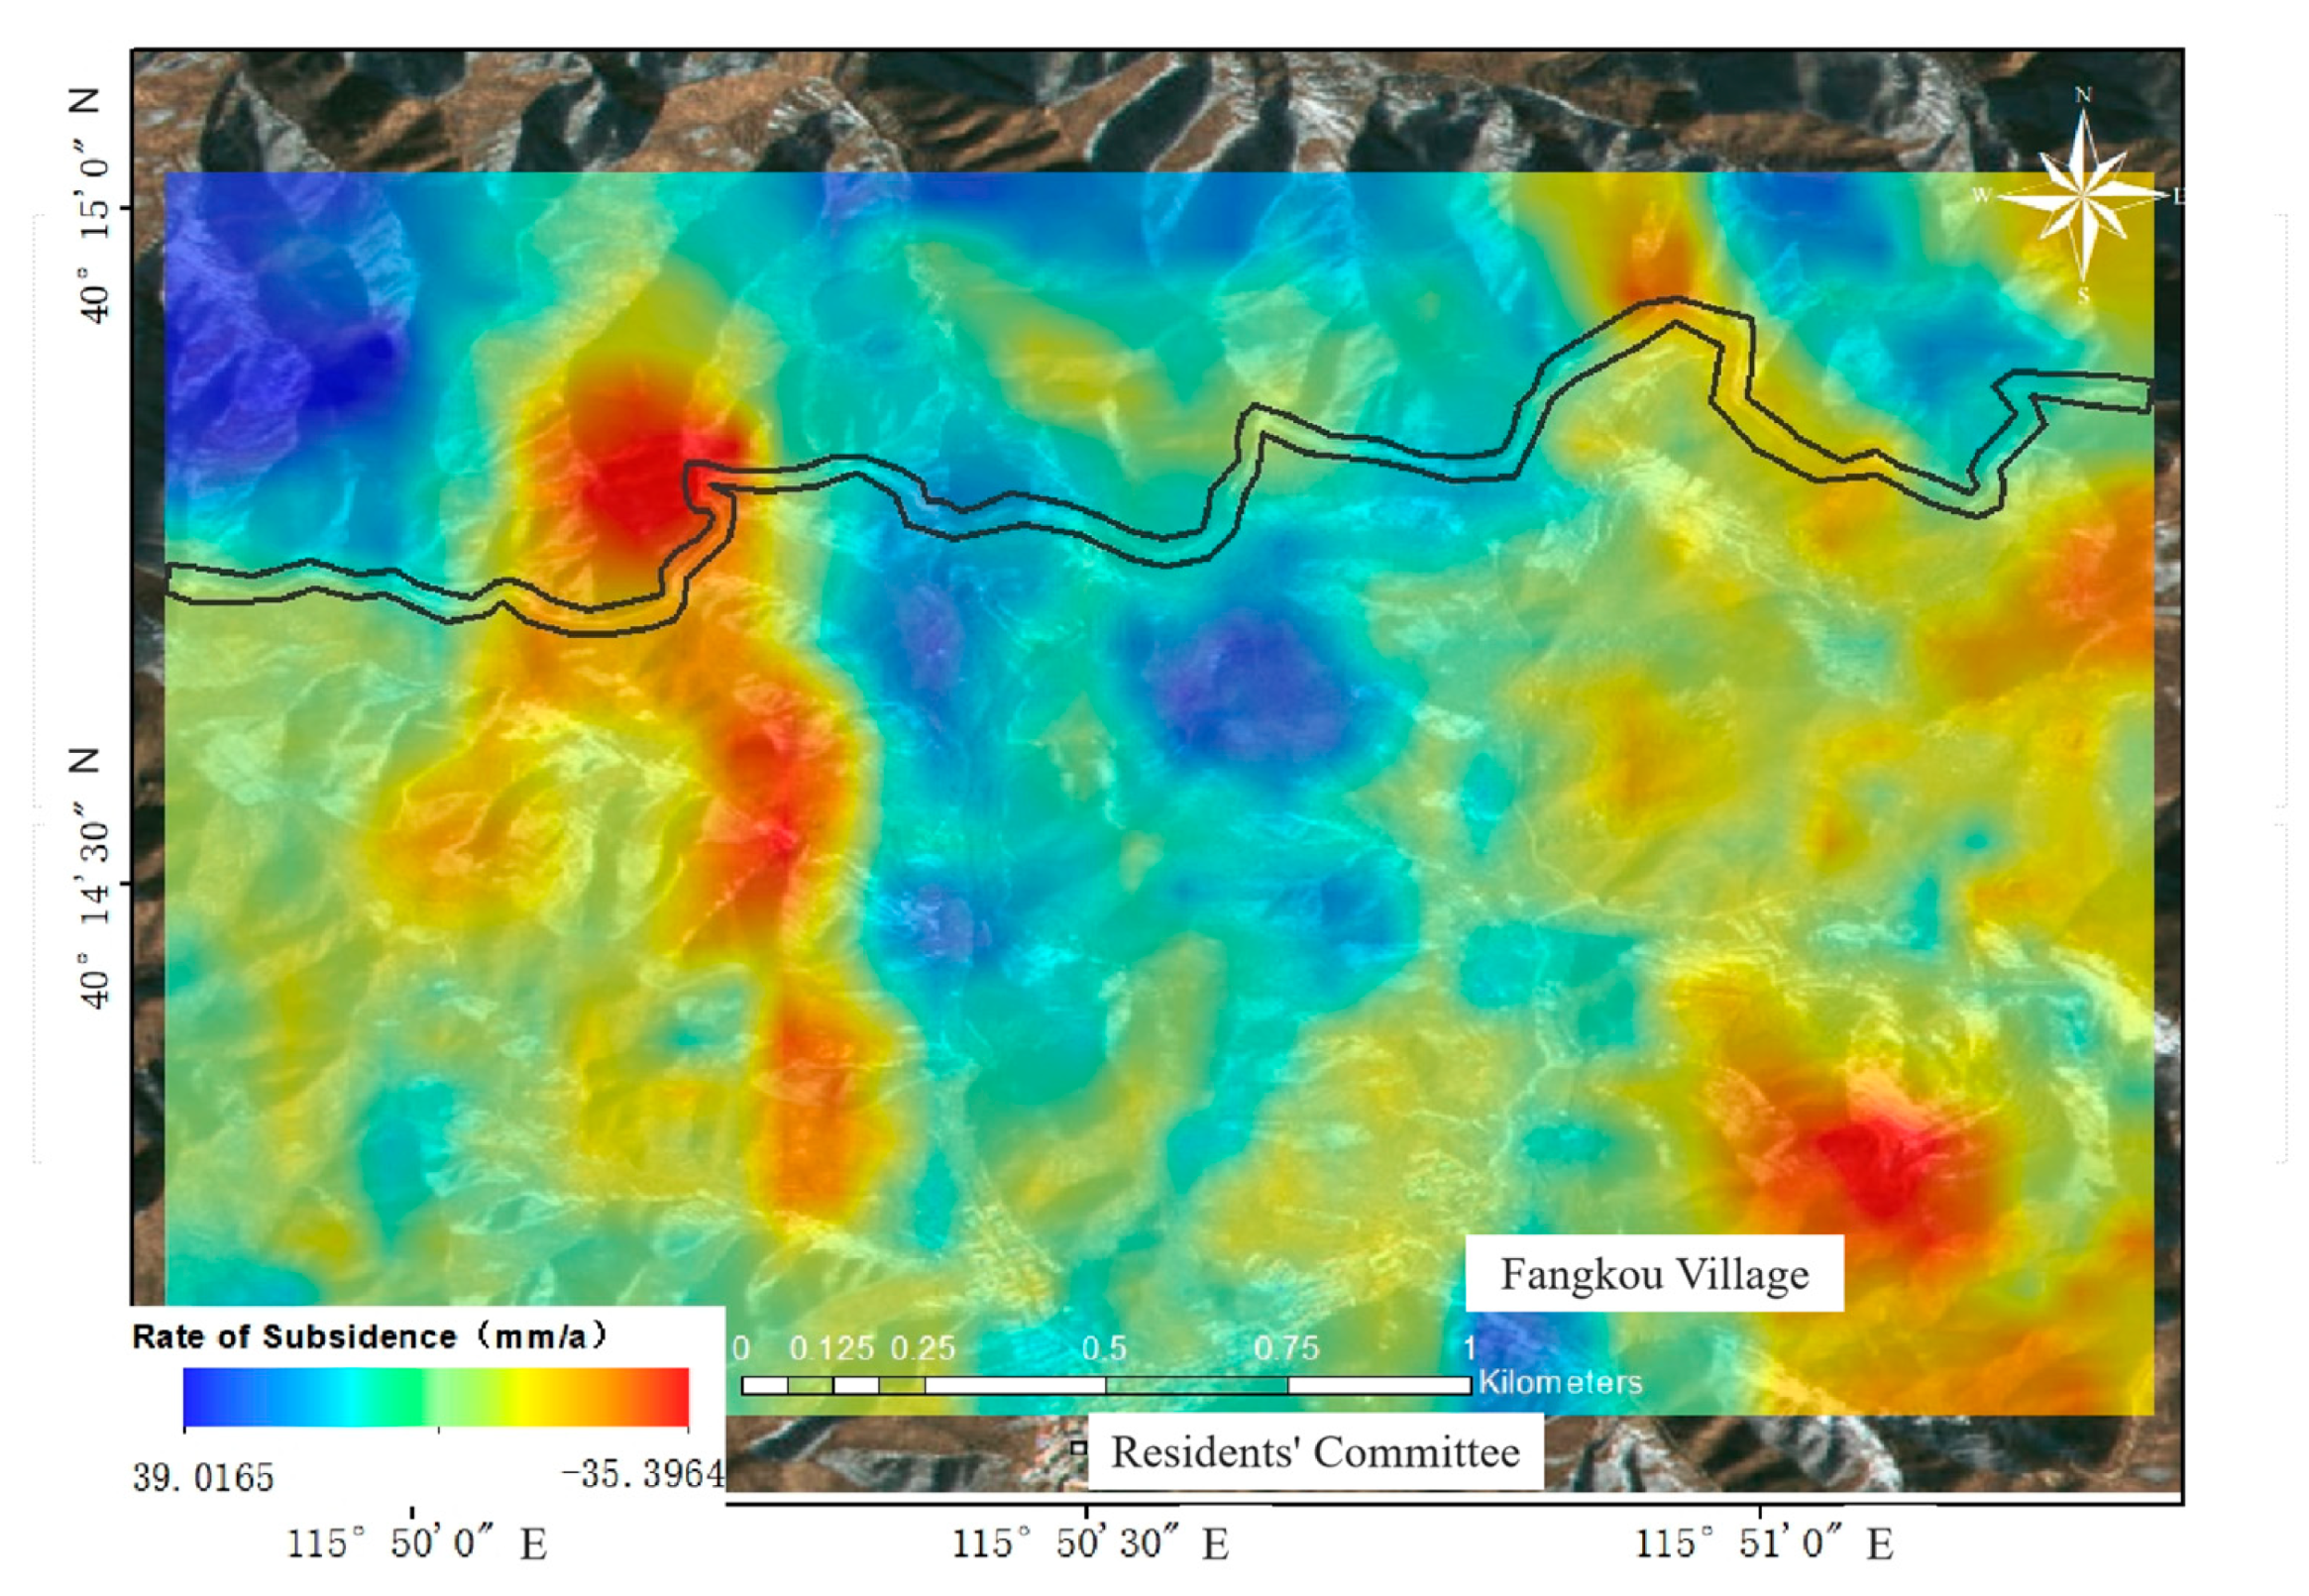
Figure 19 visually presents the spatial distribution characteristics of surface deformation in the study area. The subsidence rate ranges from −35.3964 mm/year (indicating uplift) to 39.0165 mm/year (indicating subsidence), effectively showcasing the dynamics of surface subsidence and uplift in the region. The Great Wall runs through this area in a northwest-southeast direction, marked by a dark linear belt in the figure. The main location of the study area is within the striped structure enclosed by the red box in the figure. In this region, the variation in subsidence rate is relatively low, and it is evident that the subsidence changes are small, with surface deformation remaining relatively stable. The factors contributing to the subsidence variation in this area may include differences in geological structure, the impact of groundwater extraction, land use changes, and human activities. The specific causes need to be further analyzed through geological surveys and environmental monitoring data.

4.3. Linear Cultural Heritage Deformation Displacement Prediction

4.3.1. Prediction Model Design for Variational Modal Decomposition Networks Incorporating Snake Optimization Algorithm

Based on the three-level framework of “data-mechanism-prediction”, this model constructs an intelligent prediction network for linear cultural heritage deformation displacement by integrating variational modal decomposition (VMD) and snake optimization algorithm (SOA). Its core design focuses on the multimodal feature decoupling of deformation signals and dynamic driver optimization modeling. Based on the 40-scene Sentinel-1A up-orbit data (C-band, IW mode, 2017–2024), SBAS-InSAR processing is performed by using the SARscape platform to generate millimeter-scale deformation rate fields in the study area. The deformation rate time series (with a 12-day temporal resolution) are extracted from discrete monitoring points by using the baseline estimation, phase untangling (based on the least-cost flow algorithm), atmospheric correction (using ERA5 meteorological reanalysis data), and phase compensation of the DEM terrain.

4.3.2. Forecast Results and Analysis

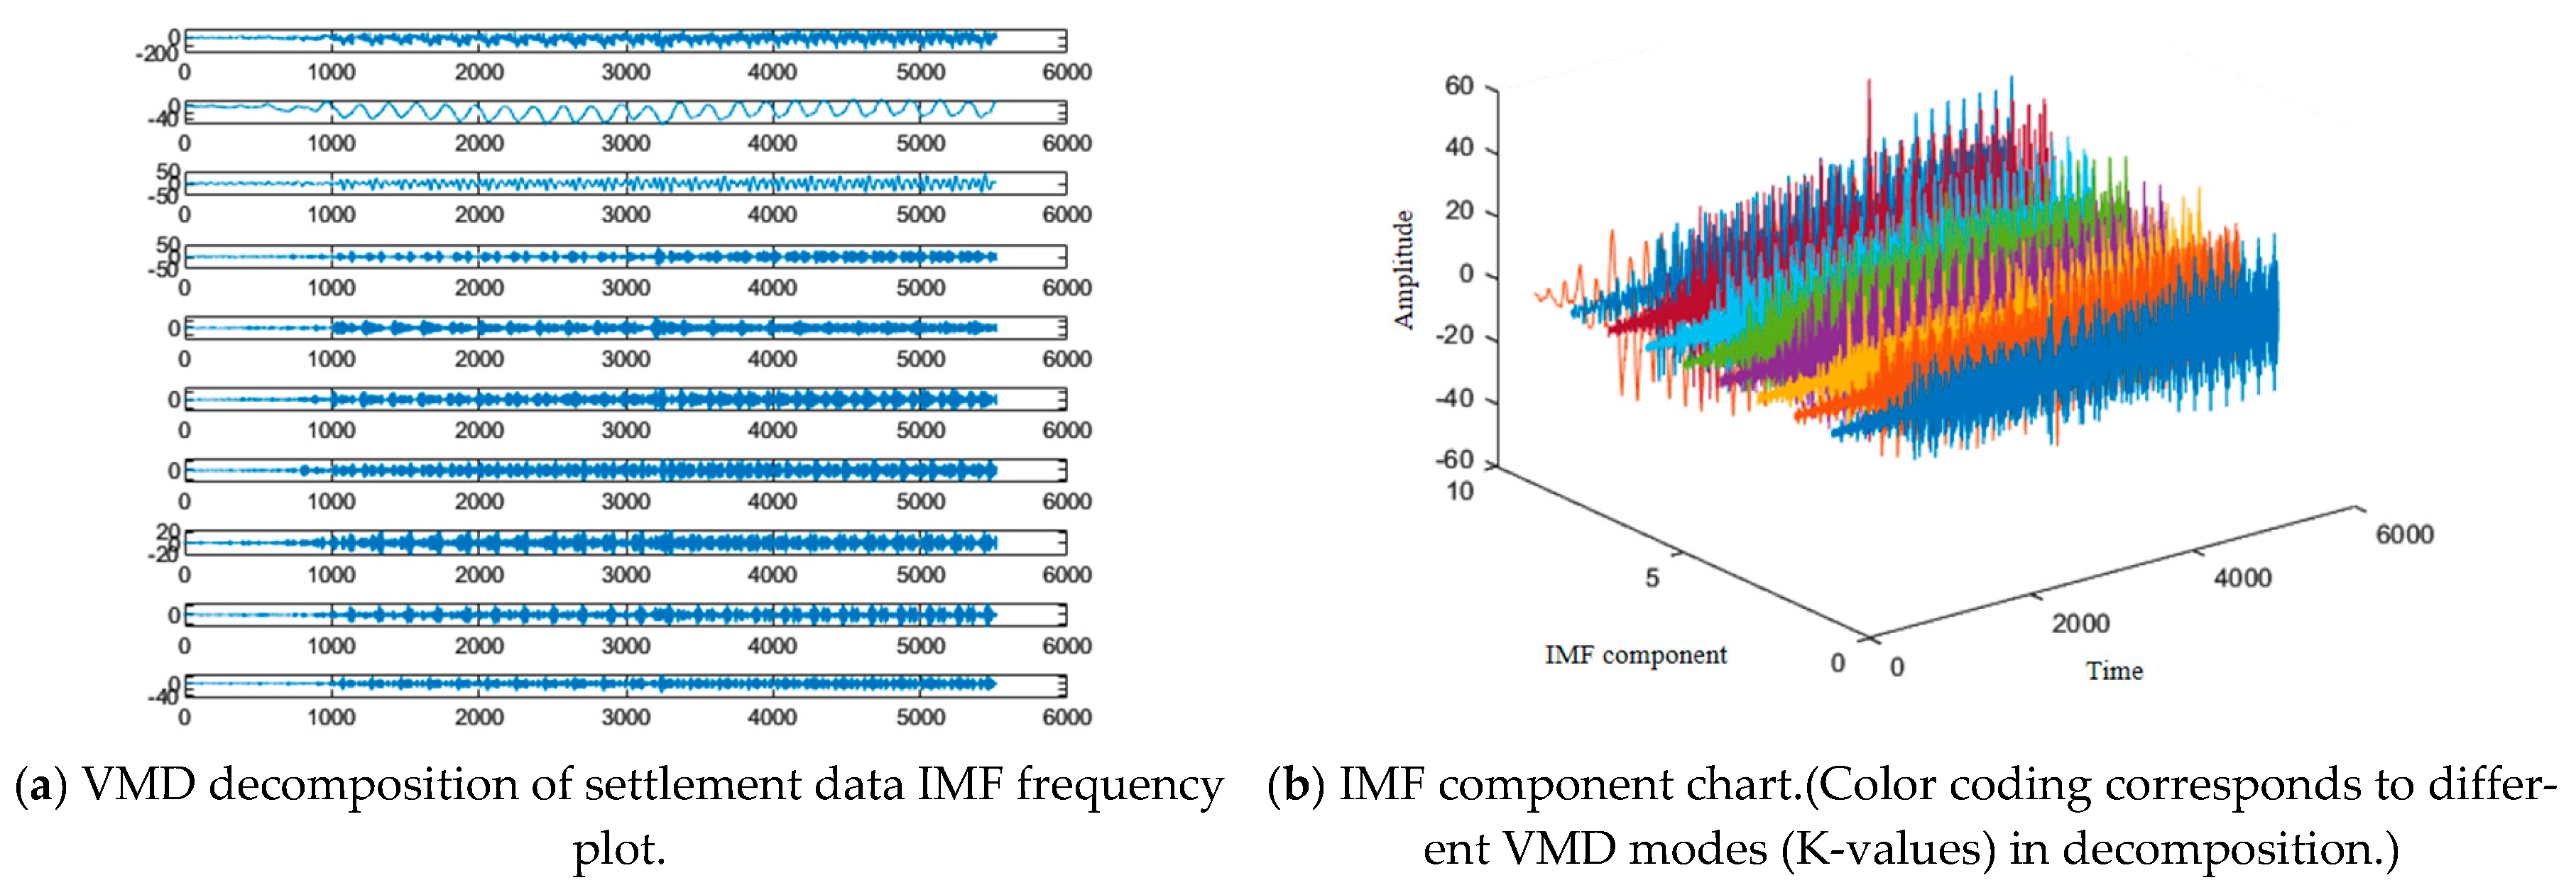
In the time series InSAR sedimentation prediction study, in order to reduce the non-stationarity of the original sedimentation data, the cumulative sedimentation sequence is adaptively decomposed into nine modal components (IMF, Intrinsic Mode Function) by using the VMD method, as shown in Figure 20. The selection of modal number k directly affects the completeness of the signal decomposition and the noise suppression effect, and the specific value of modal number k is decided by observing the center frequency, gradually increasing the number of modes from k=3, and dynamically monitoring the distribution pattern of the center frequency of each mode (Table 4). The experiments show that the center frequency of the final modal component (IMF9) converges stably at 3120 Hz when k>9. Continuing to increase the value of k leads to high-frequency noise aliasing, indicating that additional decomposition will introduce redundant noise instead of a valid signal. This determines the optimal modal number k = 9 for the VMD algorithm of this study.
To ensure the transparency and scientific rigor of model validation, this study employs RMSE and R2 as the primary evaluation metrics. RMSE is a commonly used metric for assessing model prediction error, which directly reflects the model’s accuracy, while R2 measures the goodness of fit of the model to the data. The combined use of both metrics provides a comprehensive evaluation of the model’s performance. The validation data is sourced from historical settlement monitoring data around the Great Wall, which has undergone preprocessing, including denoising, normalization, and outlier handling, to ensure its quality and reliability. Regarding data splitting, this study uses an 80/20% ratio to divide the data into training and testing sets, with 90% of the data used for model training and 10% for model testing and validation. Additionally, to prevent overfitting during model training, a cross-validation strategy was employed. The data was divided into multiple subsets and validated repeatedly under different training/validation splits to enhance the model’s generalization ability and stability. In this way, we ensure the transparency and scientific rigor of model validation, avoid the potential randomness in data splitting, and ensure the model’s robustness and reliability in practical applications.
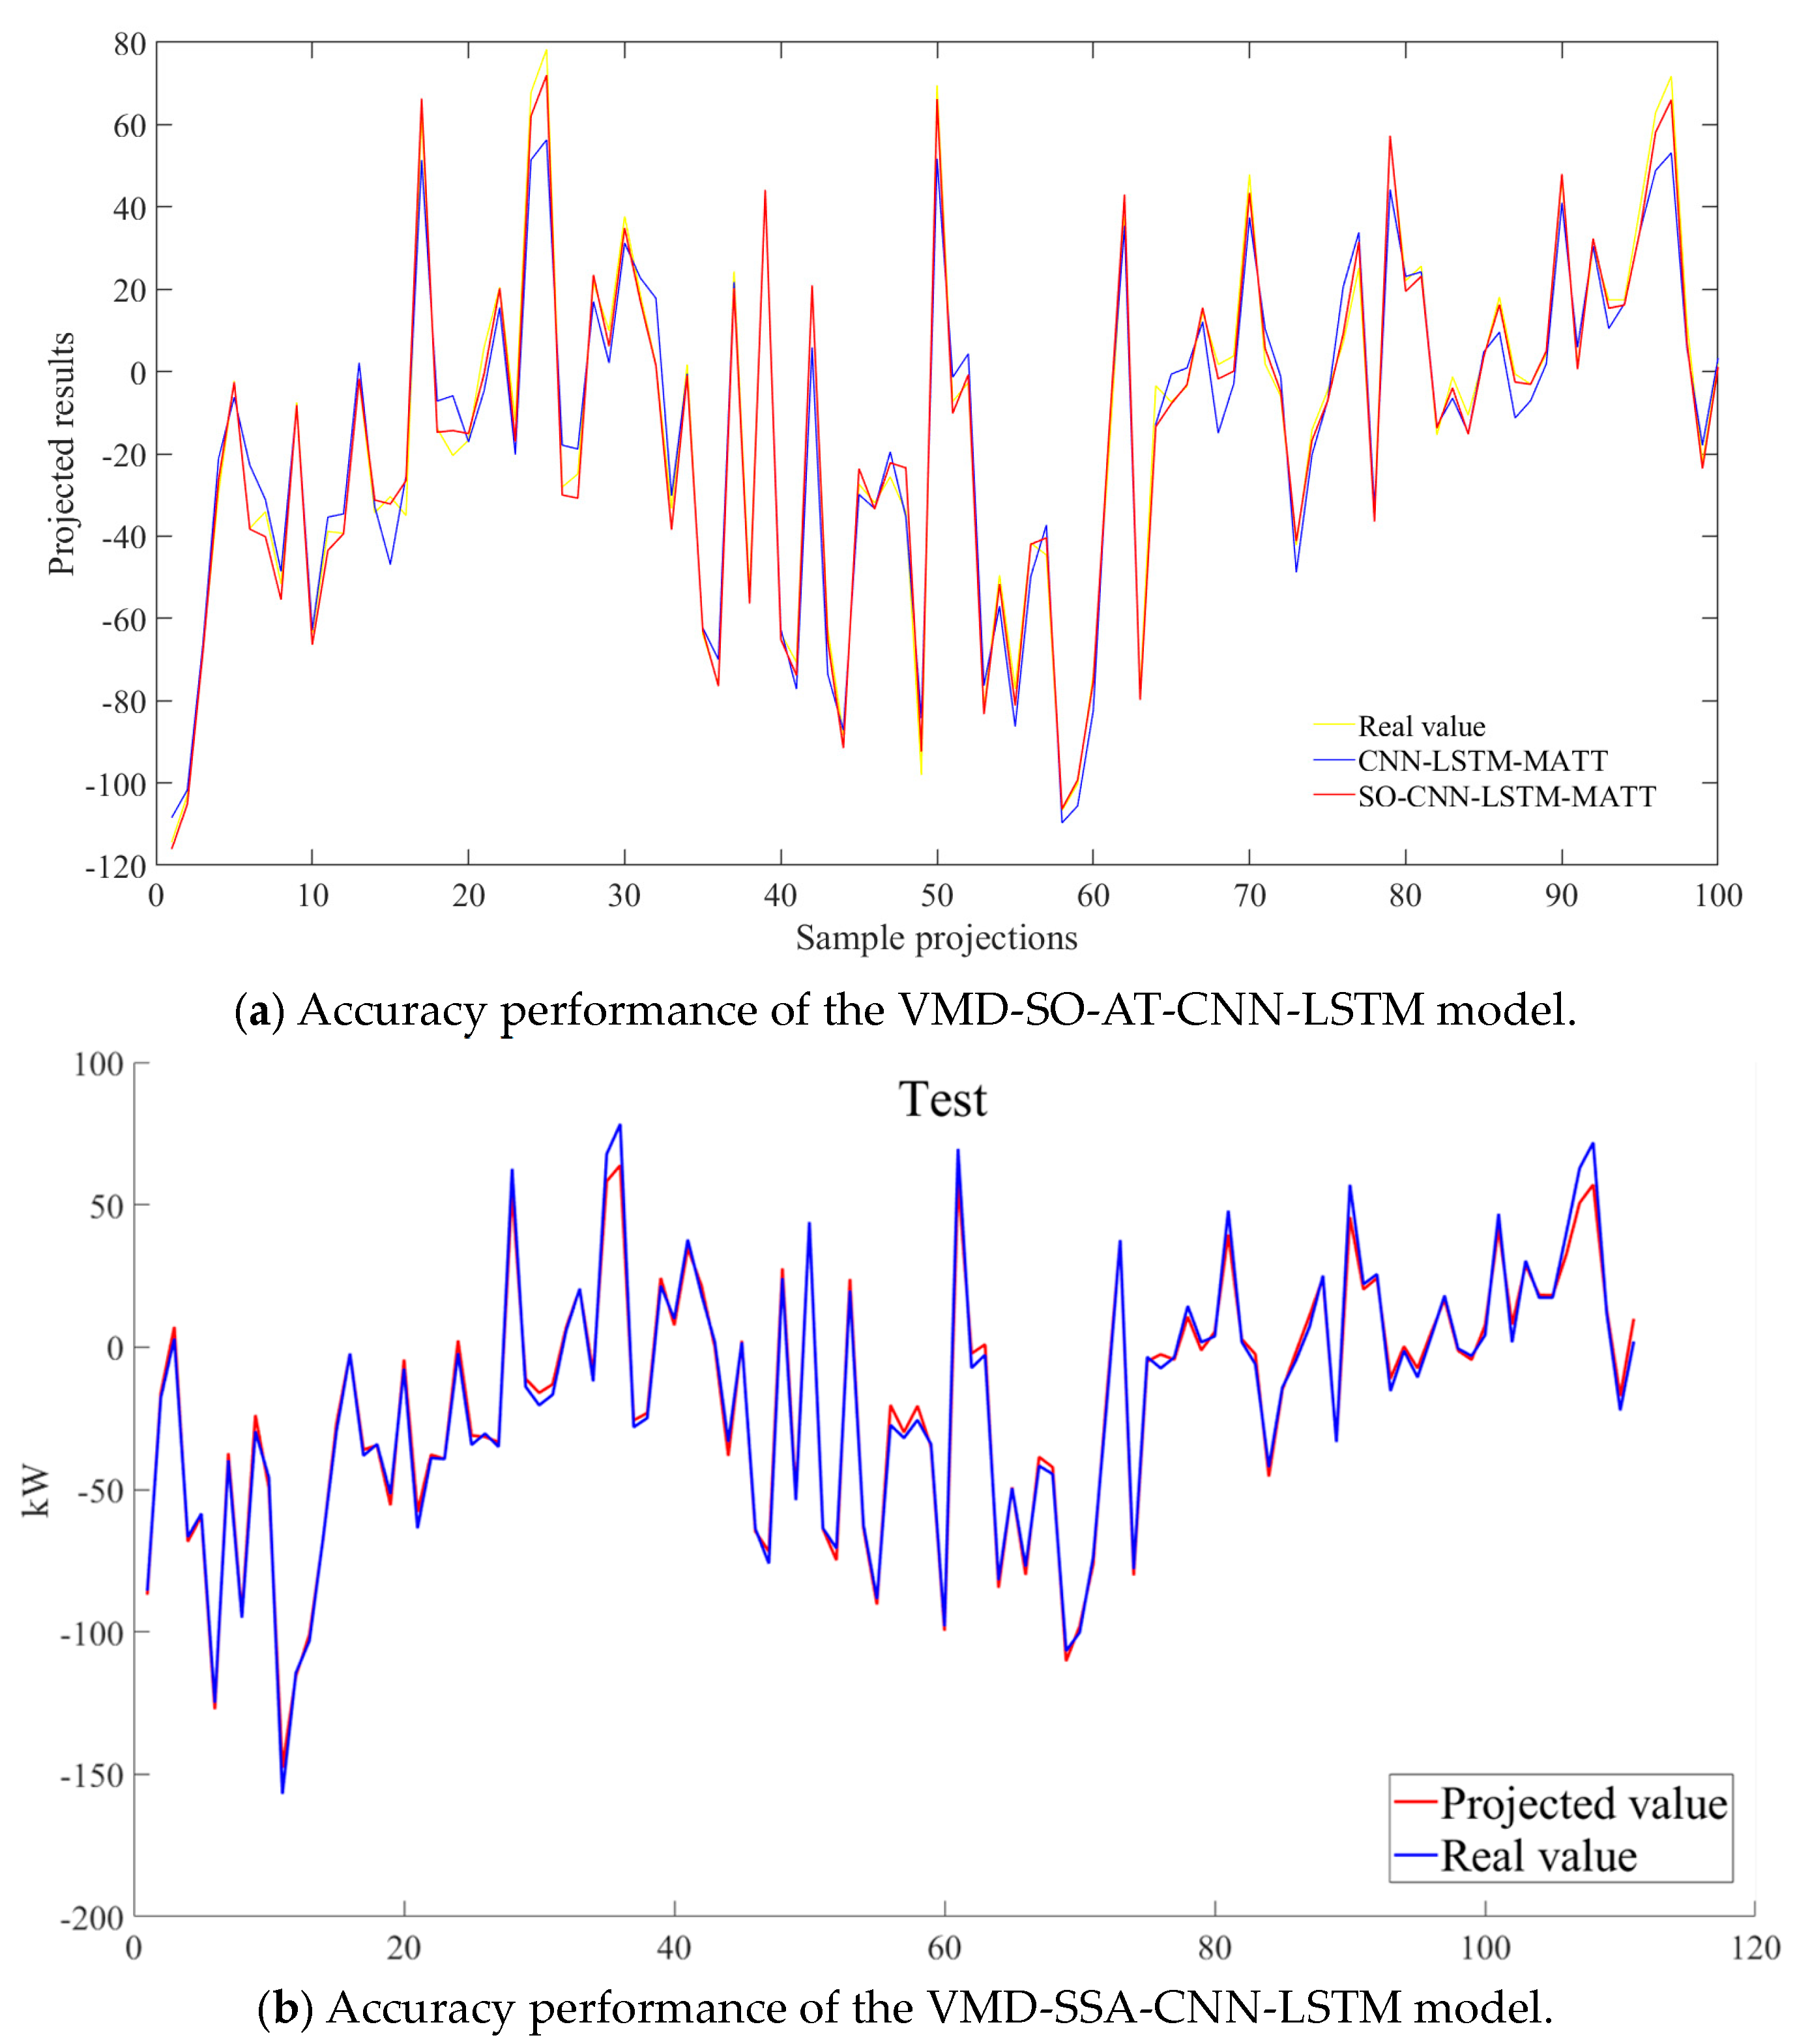
The comparative performance of the prediction results of the three models is demonstrated in Figure 21a, where the yellow folds are the true values and the blue and red colors represent the prediction results of the SSA-CNN-LSTM and SO-CNN-LSTM models, respectively. Figure 21b further compares the performance of the SO optimization model on the test set. It can be seen that both models based on the optimization algorithm fit the original data trend better, especially the prediction curves of the SO-CNN-LSTM model, which are closer to the real values in multiple high-frequency oscillatory bands, showing stronger fitting ability and stability.
After introducing the optimization algorithm into the model structure, the SO-CNN-LSTM model’s prediction ability on complex linear sequences was significantly improved, as shown in Figure 21. Specifically, the SSA algorithm improves the network’s ability to extract temporal features, while the SO algorithm achieves effective tuning of the model hyperparameters through global search, which further enhances the model’s generalization ability. Overall, compared with the unoptimized model, SO-CNN-LSTM performs better in terms of error control, prediction accuracy, and sequence fitting ability, verifying the effective integration of the structural design and optimization strategy. These advantages are quantitatively validated in Table 5 (Test set evaluation metrics for prediction points). The model has good potential for application in coping with time series prediction tasks with high volatility and complex morphology.

5. Conclusions

This study achieves, for the first time, millimeter-level continuous deformation monitoring of the Great Wall as a linear cultural heritage site through the innovative integration of multi-source remote sensing technologies (InSAR and low-altitude oblique photogrammetry) and artificial intelligence methods. By coupling three-dimensional Gaussian splatting (3DGS) with a multimodal large language model (AHLLM-3D), an integrated air–space–ground monitoring and interpretation framework is established, significantly enhancing 3D reconstruction efficiency (with a 30% reduction in detail error) and improving semantic recognition accuracy. The application of SBAS-InSAR enables the identification of multiple high-risk deformation zones (with annual subsidence exceeding −25 mm) and reveals their strong correlation with geologically fragile zones, providing critical data support for structural stability assessment and early-warning strategies in heritage conservation.
The acquisition of cultural heritage data often faces challenges such as data imbalance, scarcity, or bias, which may lead to inaccurate results during the training of large language models. This is particularly true in the digitalization of cultural heritage, which involves extensive data collection and processing, especially data related to sensitive information from specific regions. The use of such data may raise ethical concerns regarding privacy protection and data security. Therefore, ensuring the lawful use of this data, particularly respecting and safeguarding the privacy rights of relevant communities during the digitalization process, has become a critical ethical challenge. In this context, it is essential to ensure that the application of large language model technologies adheres to ethical standards by establishing strict data collection and processing protocols in order to prevent potential misuse of technology and preserve the authenticity of cultural heritage.
In terms of deformation prediction, the proposed VMD-SO-AT-CNN-LSTM model demonstrates strong performance in metrics such as RMSE and R2. However, its practical applicability in engineering scenarios remains limited. Future work will incorporate uncertainty quantification methods for predicted deformation results, conduct comparative validation using in situ monitoring data, and investigate acceptable deformation thresholds for heritage conservation decision-making, thereby enhancing the interpretability and applicability of the model in real-world settings.
Moreover, although this study achieves automatic point cloud semantic parsing and intelligent recognition of structural features, the automated framework still faces challenges such as limited generalization of multimodal understanding and risks of semantic misinterpretation in complex heritage contexts. Particularly in the domain of cultural heritage, automatically generated outputs may raise ethical concerns related to historical misrepresentation and misinterpretation of culturally sensitive content. Therefore, future research will focus on developing robust evaluation mechanisms for multi-source semantic fusion and introducing human-in-the-loop verification workflows and controllable model output strategies in order to mitigate potential ethical risks and advance the intelligent and standardized development of heritage conservation.

Author Contributions

R.W.: Conceived the methodology, performed the experiments, and drafted the manuscript. M.G.: Supervised the research and provided critical revision of the manuscript. J.C. and Y.Z.: Participated in data processing, figure generation, and field validation. Y.W.: Directed InSAR prediction modeling framework. L.Z.: Provided technical guidance for three large language models. All authors have read and agreed to the published version of the manuscript.

Funding

This research was funded by the National Natural Science Foundation of China, grant number 42171416.

Data Availability Statement

The data that support the findings of this study are available from the author, Ming Guo, upon reasonable request.

Acknowledgments

The authors have reviewed and edited the final manuscript and take full responsibility for the content of this publication. The authors would like to express sincere thanks to Y.W. for her valuable guidance on the construction of the InSAR-based prediction model and to L.Z. for her insightful support in the development of the 3D language model framework.

Conflicts of Interest

The authors declare no conflict of interest.

References

  1. Kioussi, A.; Karoglou, M.; Bakolas, A.; Labropouloset, K.; Moropoulou, A. Documentation protocols to generate risk indicators regarding degradation processes for cultural heritage risk evaluation. Int. Arch. Photogramm. Remote Sens. Spat. Inf. Sci. 2013, 40, 379–384. [Google Scholar] [CrossRef]
  2. Tang, P.; Chen, F.; Zhu, X.; Zhou, W. Monitoring Cultural Heritage Sites with Advanced Multi-Temporal InSAR Technique: The Case Study of the Summer Palace. Remote Sens. 2016, 8, 432. [Google Scholar] [CrossRef]
  3. Vileikis, O.; Cesaro, G.; Santana Quintero, M.; Van Balen, K.; Paolini, A.; Vafadari, A. Documentation in world heritage conservation: Towards managing and mitigating change—The case studies of Petra and the Silk Roads. J. Cult. Herit. Manag. Sustain. Dev. 2012, 2, 130–152. [Google Scholar] [CrossRef]
  4. Xu, H.; Chen, F.; Zhou, W. A comparative case study of MTInSAR approaches for deformation monitoring of the cultural landscape of the Shanhaiguan section of the Great Wall. Herit. Sci. 2021, 9, 71. [Google Scholar] [CrossRef]
  5. Agapiou, A.; Lysandrou, V.; Hadjimitsis, D.G. Earth observation contribution to cultural heritage disaster risk management: Case study of Eastern Mediterranean open air archaeological monuments and sites. Remote Sens. 2020, 12, 1330. [Google Scholar] [CrossRef]
  6. Vafadari, A.; Philip, G.; Jennings, R. Damage assessment and monitoring of cultural heritage places in a disaster and post-disaster event–a case study of Syria. Int. Arch. Photogramm. Remote Sens. Spat. Inf. Sci. 2017, 42, 695–701. [Google Scholar] [CrossRef]
  7. Noszczyk, T.; Gawronek, P. Remote sensing and GIS for environmental analysis and cultural heritage. Remote Sens. 2020, 12, 3960. [Google Scholar] [CrossRef]
  8. Ilies, D.C.; Caciora, T.; Herman, G.V.; Llies, A.; Ropa, M.; Baias, S. Geohazards affecting cultural heritage monuments. A complex case study from Romania. Geoj. Tour. Geosites 2020, 31, 1103–1112. [Google Scholar]
  9. Van Balen, K. Challenges that preventive conservation poses to the cultural heritage documentation field. Int. Arch. Photogramm. Remote Sens. Spat. Inf. Sci. 2017, 42, 713–717. [Google Scholar] [CrossRef]
  10. Gasparoli, P. Prevenzione e manutenzione nelle aree archeologiche. LANX. Riv. Sc. Spec. Beni Archeol. Univ. Studi Milano 2014, 19, 168–188. [Google Scholar]
  11. Schonberger, J.L.; Frahm, J.M. Structure-from-Motion Revisited. In Proceedings of the IEEE Conference on Computer Vision and Pattern Recognition, Las Vegas, NV, USA, 27–30 June 2016; pp. 4104–4113. [Google Scholar]
  12. Guo, M.; Wu, X.; Qi, H.; Zhang, Y.; Chen, J.; Wei, Y.; Zhang, X.; Shang, X. A methodology for Sky-Space-Ground Integrated Remote Sensing monitoring: A Digital Twin Framework for Multi-Source Data-BIM Integration in Residential Quality Monitoring. J. Build. Eng. 2025, 102, 111976. [Google Scholar] [CrossRef]
  13. Li, W.; Zhang, Y.; Fang, Y.; Zhu, Q.; Zhu, X. Review of Deep Learning-Based 3D Reconstruction. Laser Optoelectron. Prog. 2025, 62, 1000003. [Google Scholar] [CrossRef]
  14. Mildenhall, B.; Srinivasan, P.P.; Tancik, M.; Ramamoorthi, R.; Ng, R. Nerf: Representing scenes as neural radiance fields for view synthesis. Commun. ACM 2021, 65, 99–106. [Google Scholar] [CrossRef]
  15. Liu, Y.; Wu, X. Survey of texture optimization algorithms for 3D reconstructed scenes. J. Image Graph. 2024, 29, 2303–2318. [Google Scholar] [CrossRef]
  16. Tancik, M.; Casser, V.; Yan, X.; Pradhan, S.; Mildenhall, B.; Srinivasan, P.P.; Barron, J.T.; Kretzschmar, H. Block-Nerf: Scalable Large Scene Neural View Synthesis. In Proceedings of the IEEE/CVF Conference on Computer Vision and Pattern Recognition, New Orleans, LA, USA, 18–24 June 2022; pp. 8248–8258. [Google Scholar]
  17. Wang, W.; Tang, B.; Gu, Z.; Wang, S. Overview of Multi-View 3D Reconstruction Techniques in Deep Learning. Comput. Eng. Appl. 2025, 61, 22–35. [Google Scholar]
  18. Kerbl, B.; Kopanas, G.; Leimkühler, T.; Drettakis, G. 3d gaussian splatting for real-time radiance field rendering. ACM Trans. Graph. 2023, 42, 139–141. [Google Scholar] [CrossRef]
  19. Stuart, L.A.; Pound, M.P. 3DGS-to-PC: Convert a 3D Gaussian Splatting Scene into a Dense Point Cloud or Mesh. arXiv 2025, arXiv:2501.07478. [Google Scholar]
  20. Wan, D.; Lu, R.; Zeng, G. Superpoint gaussian splatting for real-time high-fidelity dynamic scene reconstruction. arXiv 2024, arXiv:2406.03697. [Google Scholar]
  21. Kotovenko, D.; Grebenkova, O.; Ommer, B. EDGS: Eliminating Densification for Efficient Convergence of 3DGS. arXiv 2025, arXiv:2504.13204. [Google Scholar]
  22. Cui, J.; Cao, J.; Zhao, F.; He, Z.; Chen, Y.; Zhong, Y.; Xu, L.; Shi, Y.; Zhang, Y.; Yu, J. Letsgo: Large-scale garage modeling and rendering via lidar-assisted gaussian primitives. ACM Trans. Graph. (TOG) 2024, 43, 1–18. [Google Scholar] [CrossRef]
  23. Gao, P.; Geng, S.; Zhang, R.; Ma, T.; Fang, R.; Zhang, Y.; Li, H.; Qiao, Y. Clip-adapter: Better vision-language models with feature adapters. Int. J. Comput. Vis. 2024, 132, 581–595. [Google Scholar] [CrossRef]
  24. Alayrac, J.B.; Donahue, J.; Luc, P.; Miech, A.; Barr, I.; Hasson, Y.; Lenc, K.; Mensch, A.; Millican, K.; Reynolds, M.; et al. Flamingo: A visual language model for few-shot learning. Adv. Neural Inf. Process. Syst. 2022, 35, 23716–23736. [Google Scholar]
  25. Li, J.; Li, D.; Savarese, S.; Hoi, S. Blip-2: Bootstrapping Language-Image Pre-Training with Frozen Image Encoders and Large Language Models. In Proceedings of the International Conference on Machine Learning, Honolulu, HI, USA, 23–29 July 2023; pp. 19730–19742. [Google Scholar]
  26. Wen, S.; Fang, G.; Zhang, R.; Gao, P.; Dong, H.; Metaxas, D. Improving compositional text-to-image generation with large vision-language models. arXiv 2023, arXiv:2310.06311. [Google Scholar]
  27. Choudhary, T.; Dewangan, V.; Chandhok, S.; Priyadarshan, S.; Jain, A.; Singh, A.; Srivastava, S.; Jatavallabhula, K.; Krishna, K. Talk2bev: Language-Enhanced Bird’s-Eye View Maps for Autonomous Driving. In Proceedings of the 2024 IEEE International Conference on Robotics and Automation (ICRA), Yokohama, Japan, 13–17 May 2024; pp. 16345–16352. [Google Scholar]
  28. Huang, W.; Wang, C.; Zhang, R.; Li, Y.; Wu, J.; Fei-Fei, L. Voxposer: Composable 3d value maps for robotic manipulation with language models. arXiv 2023, arXiv:2307.05973. [Google Scholar]
  29. Wang, M.; Cheng, X.; Pan, J.; Pi, Y.; Xiao, J. Large models enabling intelligent photogrammetry: Status, challenges and prospects. Acta Geod. Cartogr. Sin. 2024, 53, 1955–1966. [Google Scholar]
  30. Qian, Q.; Sun, L.P.; Liu, J.L.; Du, H.; Ling, C. Medical imaging report generation via multi-modal large language models with discrimination-enhanced fine-tuning. Appl. Res. Comput. 2025, 42, 762–769. [Google Scholar] [CrossRef]
  31. Zhang, Y.J.; Li, Y.S.; Dang, B.; Wu, K.; Guo, X.; Wang, J.; Chen, J.; Yang, M. Multi-modal remote sensing large foundation models: Current research status and future prospect. Acta Geod. Cartogr. Sin. 2024, 53, 1942–1954. [Google Scholar]
  32. Zhang, R.; Guo, Z.; Zhang, W.; Li, K.; Miao, X.; Cui, B.; Qiao, Y.; Gao, P.; Li, H. Pointclip: Point Cloud Understanding by Clip. In Proceedings of the IEEE/CVF Conference on Computer Vision and Pattern Recognition, New Orleans, LA, USA, 18–24 June 2022; pp. 8552–8562. [Google Scholar]
  33. Xue, L.; Gao, M.; Xing, C.; Martín-Martín, R.; Wu, J.; Xiong, C.; Xu, R.; Niebles, J.; Savarese, S. Ulip: Learning a Unified Representation of Language, Images, and Point Clouds for 3d Understanding. In Proceedings of the IEEE/CVF Conference on Computer Vision and Pattern Recognition, Nashville, TN, USA, 11–15 June 2023; pp. 1179–1189. [Google Scholar]
  34. Liu, M.; Shi, R.; Kuang, K.; Zhu, Y.; Li, X.; Han, S.; Cai, H.; Porikli, F.; Su, H. Openshape: Scaling up 3d shape representation towards open-world understanding. Adv. Neural Inf. Process. Syst. 2023, 36, 44860–44879. [Google Scholar]
  35. Huang, K.C.; Li, X.; Qi, L.; Yan, S.; Yang, M. Reason3d: Searching and Reasoning 3d Segmentation via Large Language Model. In Proceedings of the International Conference on 3D Vision 2025, Singapore, 25–28 March 2025. [Google Scholar]
  36. Chen, B.; Xu, Z.; Kirmani, S.; Ichter, B.; Sadigh, D.; Guibas, L.; Xia, F. Spatialvlm: Endowing Vision-Language Models with Spatial Reasoning Capabilities. In Proceedings of the IEEE/CVF Conference on Computer Vision and Pattern Recognition, Seattle, WA, USA, 17–18 June 2024; pp. 14455–14465. [Google Scholar]
  37. Ma, C.; Lu, K.; Cheng, T.Y.; Trigoni, N.; Markham, A. Spatialpin: Enhancing Spatial Reasoning Capabilities of Vision-Language Models Through Prompting and Interacting 3d Priors. In Proceedings of the Thirty-Eighth Annual Conference on Neural Information Processing Systems, Vancouver, BC, Canada, 10–15 December 2024. [Google Scholar]
  38. Cheng, A.C.; Yin, H.; Fu, Y.; Guo, Q.; Yang, R.; Kautz, J.; Wang, X.; Liu, S. Spatialrgpt: Grounded spatial reasoning in vision language model. arXiv 2024, arXiv:2406.01584. [Google Scholar]
  39. Yang, S.; Liu, J.; Zhang, R.; Pan, M.; Guo, Z.; Li, X.; Chen, Z.; Gao, P.; Li, H.; Guo, Y.; et al. Lidar-Llm: Exploring the Potential of Large Language Models for 3d Lidar Understanding. In Proceedings of the AAAI Conference on Artificial Intelligence, Philadelphia, PA, USA, 25 February–4 March 2025; Volume 39, pp. 9247–9255. [Google Scholar]
  40. Tang, Y.; Han, X.; Li, X.; Yu, Q.; Xu, J.; Hao, Y.; Hu, L.; Chen, M. More Text, Less Point: Towards 3d Data-Efficient Point-Language Understanding. In Proceedings of the AAAI Conference on Artificial Intelligence, Philadelphia, PA, USA, 25 February–4 March 2025; Volume 39, pp. 7284–7292. [Google Scholar]
  41. Zheng, D.; Huang, S.; Wang, L. Video-3d Llm: Learning Position-Aware Video Representation for 3d Scene Understanding. arXiv 2024, arXiv:2412.00493. [Google Scholar]
  42. Li, X.; Ding, J.; Chen, Z.; Elhoseiny, M. Uni3dl: Unified model for 3d and language understanding. arXiv 2023, arXiv:2312.03026. [Google Scholar]
  43. Liu, S.C.; Tran, V.N.; Chen, W.; Cheng, W.; Huang, Y.; Liao, I.; Li, Y.; Zhang, J. Pavlm: Advancing point cloud based affordance understanding via vision-Language model. arXiv 2024, arXiv:2410.11564. [Google Scholar]
  44. Zhou, J.; Wang, J.; Ma, B.; Liu, Y.; Huang, T.; Wang, X. Uni3d: Exploring unified 3d representation at scale. arXiv 2023, arXiv:2310.06773. [Google Scholar]
  45. Guo, M.; Sun, M.; Pan, D.; Wang, G.; Zhou, Y.; Yan, B.; Fu, Z. High-precision deformation analysis of yingxian wooden pagoda based on UAV image and terrestrial LiDAR point cloud. Herit. Sci. 2023, 11, 1. [Google Scholar] [CrossRef]
  46. Carnec, C.; Massonnet, D.; King, C. Two examples of the use of SAR interferometry on displacement fields of small spatial extent. Geophys. Res. Lett. 1996, 23, 3579–3582. [Google Scholar] [CrossRef]
  47. Guo, M.; Tang, X.; Liu, Y.; Wang, C.; Wei, Y. Ground deformation analysis along the island subway line by integrating time-series InSAR and LiDAR techniques. Opt. Precis. Eng. 2023, 31, 1988–1999. [Google Scholar] [CrossRef]
  48. Ferretti, A.; Prati, C.; Rocca, F. Analysis of Permanent Scatterers in SAR interferometry. In Proceedings of the IGARSS 2000: IEEE 2000 International Geoscience and Remote Sensing Symposium. Taking the Pulse of the Planet: The Role of Remote Sensing in Managing the Environment, Honolulu, HI, USA, 24–28 July 2000; pp. 761–763. [Google Scholar]
  49. Du, Q.; Li, G.; Zhou, Y.; Chai, M.; Chen, D.; Qi, S.; Wu, G. Deformation Monitoring in an Alpine Mining Area in the Tianshan Mountains Based on SBAS-InSAR Technology. Adv. Mater. Sci. Eng. 2021, 2021, 9988017. [Google Scholar] [CrossRef]
  50. Wang, R.; Feng, Y.; Tong, X.; Li, P.; Wang, J.; Tang, P.; Tang, X.; Xi, M.; Zhou, Y. Large-scale surface deformation monitoring using SBAS-InSAR and intelligent prediction in typical cities of Yangtze River Delta. Remote Sens. 2023, 15, 4942. [Google Scholar] [CrossRef]
  51. Hashim, F.A.; Hussien, A.G. Snake Optimizer: A novel meta-heuristic optimization algorithm. Knowl. Based Syst. 2022, 242, 108320. [Google Scholar] [CrossRef]
  52. Jiang, H.; Balz, T.; Cigna, F.; Tapete, D.; Li, J.; Han, Y. Multi-sensor InSAR time series fusion for long-term land subsidence monitoring. Geo-Spat. Inf. Sci. 2023, 27, 1424–1440. [Google Scholar] [CrossRef]
  53. Dong, J.; Niu, R.; Li, B.; Xu, H.; Wang, S. Potential landslides identification based on temporal and spatial filtering of SBAS-InSAR results. Geomat. Nat. Hazards Risk 2023, 14, 52–75. [Google Scholar] [CrossRef]
  54. Liu, Y.; Zhang, J. Integrating SBAS-InSAR and AT-LSTM for Time-Series Analysis and Prediction Method of Ground Subsidence in Mining Areas. Remote Sens. 2023, 15, 3409. [Google Scholar] [CrossRef]
  55. Wang, T.; Zhang, Q.; Wu, Z. A Deep-Learning-Facilitated, Detection-First Strategy for Operationally Monitoring Localized Deformation with Large-Scale InSAR. Remote Sens. 2023, 15, 2310. [Google Scholar] [CrossRef]
  56. Raspini, F.; Caleca, F.; Del Soldato, M.; Festa, D.; Confuorto, P.; Bianchini, S. Review of satellite radar interferometry for subsidence analysis. Earth-Sci. Rev. 2022, 235, 104239. [Google Scholar] [CrossRef]
  57. Li, Z.; He, W.; Cheng, M.; Hu, J.; Yang, G.; Zhang, H. SinoLC-1: The first 1 m resolution national-scale land-cover map of China created with a deep learning framework and open-access data. Earth Syst. Sci. Data 2023, 15, 4749–4780. [Google Scholar] [CrossRef]
  58. Ullah, K.; Ahsan, M.; Hasanat, S.M.; Haris, M.; Yousaf, H.; Raza S, F. Short-Term Load Forecasting: A Comprehensive Review and Simulation Study With CNN-LSTM Hybrids Approach. IEEE Access 2024, 12, 111858–111881. [Google Scholar] [CrossRef]
  59. Shi, H.; Wei, A.; Xu, X.; Zhu, Y.; Hu, H.; Tang, S. A CNN-LSTM based deep learning model with high accuracy and robustness for carbon price forecasting: A case of Shenzhen’s carbon market in China. J. Environ. Manag. 2024, 352, 120131. [Google Scholar] [CrossRef]
  60. Liu, L.; Wu, W. Application of GPS and GIS integration technology in mine subsidence monitoring. Surv. Mapp. Sci. 2009, 34, 101–102. [Google Scholar]
  61. Guo, M.; Zhang, X.; Cheng, P.; Huang, M.; Liao, L. Multi-region Group Sampling Radius Semantic Segmentation Network Guided by Spatial Information for Highway. J. Nondestruct. Eval. 2025, 44, 52. [Google Scholar] [CrossRef]
  62. Shang, X.; Guo, M.; Wang, G.; Zhao, J.; Pan, D. Behavioral model construction of architectural heritage for digital twin. npj Herit. Sci. 2025, 13, 129. [Google Scholar] [CrossRef]
  63. Shi, Y.; Guo, M.; Zhao, J.; Liang, X.; Shang, X.; Huang, M.; Guo, S.; Zhao, Y. Optimization of structural reinforcement assessment for architectural heritage digital twins based on LiDAR and multi-source remote sensing. Herit. Sci. 2024, 12, 310. [Google Scholar] [CrossRef]
  64. Guo, M.; Qi, H.; Zhao, Y.; Liu, Y.; Zhao, J.; Zhang, Y. Design and Management of a Spatial Database for Monitoring Building Comfort and Safety. Buildings 2023, 13, 2982. [Google Scholar] [CrossRef]
  65. Guo, M.; Shang, X.; Zhao, J.; Huang, M.; Zhang, Y.; Lv, S. Synergy of LIDAR and hyperspectral remote sensing: Health status assessment of architectural heritage based on normal cloud theory and variable weight theory. Herit. Sci. 2024, 12, 217. [Google Scholar] [CrossRef]
  66. Tapete, D.; Cigna, F. Rapid Mapping and Deformation Analysis over Cultural Heritage and Rural Sites Based on Persistent Scatterer Interferometry. Int. J. Geophys. 2012, 19, 618609. [Google Scholar] [CrossRef]
  67. Guo, M.; Zhao, J.; Pan, D.; Sun, M.; Zhou, Y.; Yan, B. Normal cloud model theory-based comprehensive fuzzy assessment of wooden pagoda safety. J. Cult. Herit. 2022, 55, 1–10. [Google Scholar] [CrossRef]
  68. Zhang, Z.; Hu, C.; Wu, Z.; Zhang, Z.; Yang, S.; Yang, W. Monitoring and analysis of ground subsidence in Shanghai based on PS-InSAR and SBAS-InSAR technologies. Sci. Rep. 2023, 13, 8031. [Google Scholar] [CrossRef] [PubMed]
  69. Guo, M.; Sun, M.; Pan, D.; Huang, M.; Yan, B.; Zhou, Y.; Nie, P.; Zhou, T.; Zhao, Y. High-precision detection method for large and complex steel structures based on global registration algorithm and automatic point cloud generation. Measurement 2021, 172, 108765. [Google Scholar] [CrossRef]
  70. Guo, M.; Yan, B.; Zhou, T.; Chen, Z.; Zhang, C.; Liu, Y. Application of LiDAR technology in the deformation analysis of Yingxian wooden tower. J. Build. Sci. Eng. 2020, 37, 109–117. [Google Scholar]
  71. Maghsoudi, Y.; Amani, R.; Ahmadi, H. A study of land subsidence in west of Tehran using Sentinel-1 data and permanent scatterer interferometric technique. Arab J Geosci. 2021, 14, 30. [Google Scholar] [CrossRef]
  72. Khorrami, M.; Abrishami, S.; Maghsoudi, Y.; Alizadeh, B.; Perissin, D. Extreme subsidence in a populated city (Mashhad) detected by PSInSAR considering groundwater withdrawal and geotechnical properties. Sci. Rep. 2020, 10, 11357. [Google Scholar] [CrossRef]
  73. Zhao, X.; He, L.; Li, H.; He, L.; Liu, S. Multi-Scale Debris Flow Warning Technology Combining GNSS and InSAR Technology. Water 2025, 17, 577. [Google Scholar] [CrossRef]
  74. Berardino, P.; Fornaro, G.; Lanari, R.; Sansosti, E. A new algorithm for surface deformation monitoring based on small baseline differential SAR interferograms. IEEE TGRS 2002, 40, 2375–2383. [Google Scholar] [CrossRef]
  75. Cuca, B.; Zaina, F.; Tapete, D. Monitoring of damages to cultural heritage across Europe using remote sensing and earth observation: Assessment of scientific and grey literature. Remote Sens. 2023, 15, 3748. [Google Scholar] [CrossRef]
  76. Rinaudo, F.; Chiabrando, F.; Lingua, A.; Spanò, A. Archaeological site monitoring: UAV photogrammetry can be an answer. The International archives of the photogrammetry. Remote Sens. Spat. Inf. Sci. 2012, 39, 583–588. [Google Scholar]
  77. Carlucci, R.; Di Iorio, A. MONITORAGGIO DI SITI ARCHEOLOGICI DA SATELLITE UN METODO IBRIDO TRAMITE REMOTE SENSING, TECNICHE GIS E UN ALGORITMO DI RILEVAMENTO DELLA FORMA UTILIZZABILE SU IMMAGINI SAR. Archeomatica 2010, 1, 22–27. [Google Scholar]
  78. Chen, F.; Lasaponara, R.; Masini, N. An overview of satellite synthetic aperture radar remote sensing in archaeology: From site detection to monitoring. J. Cult. Herit. 2017, 23, 5–11. [Google Scholar] [CrossRef]
  79. Zhang, Z.; Chen, X.; Wu, Y. Research on Protection and Utilization of Linear Cultural Heritage—Taking the Planning and Design of the Shandong Section of the Grand Canal National Cultural Park as an Example. Design 2024, 9, 772–782. [Google Scholar] [CrossRef]
  80. Wang, M.; Liu, H.; Zhao, D.; Hu, Y. Construction of Tianjin Cultural Heritage Spatial Protection System in the Context of Territorial Spatial Planning. Landsc. Archit. 2023, 30, 46–50. [Google Scholar]
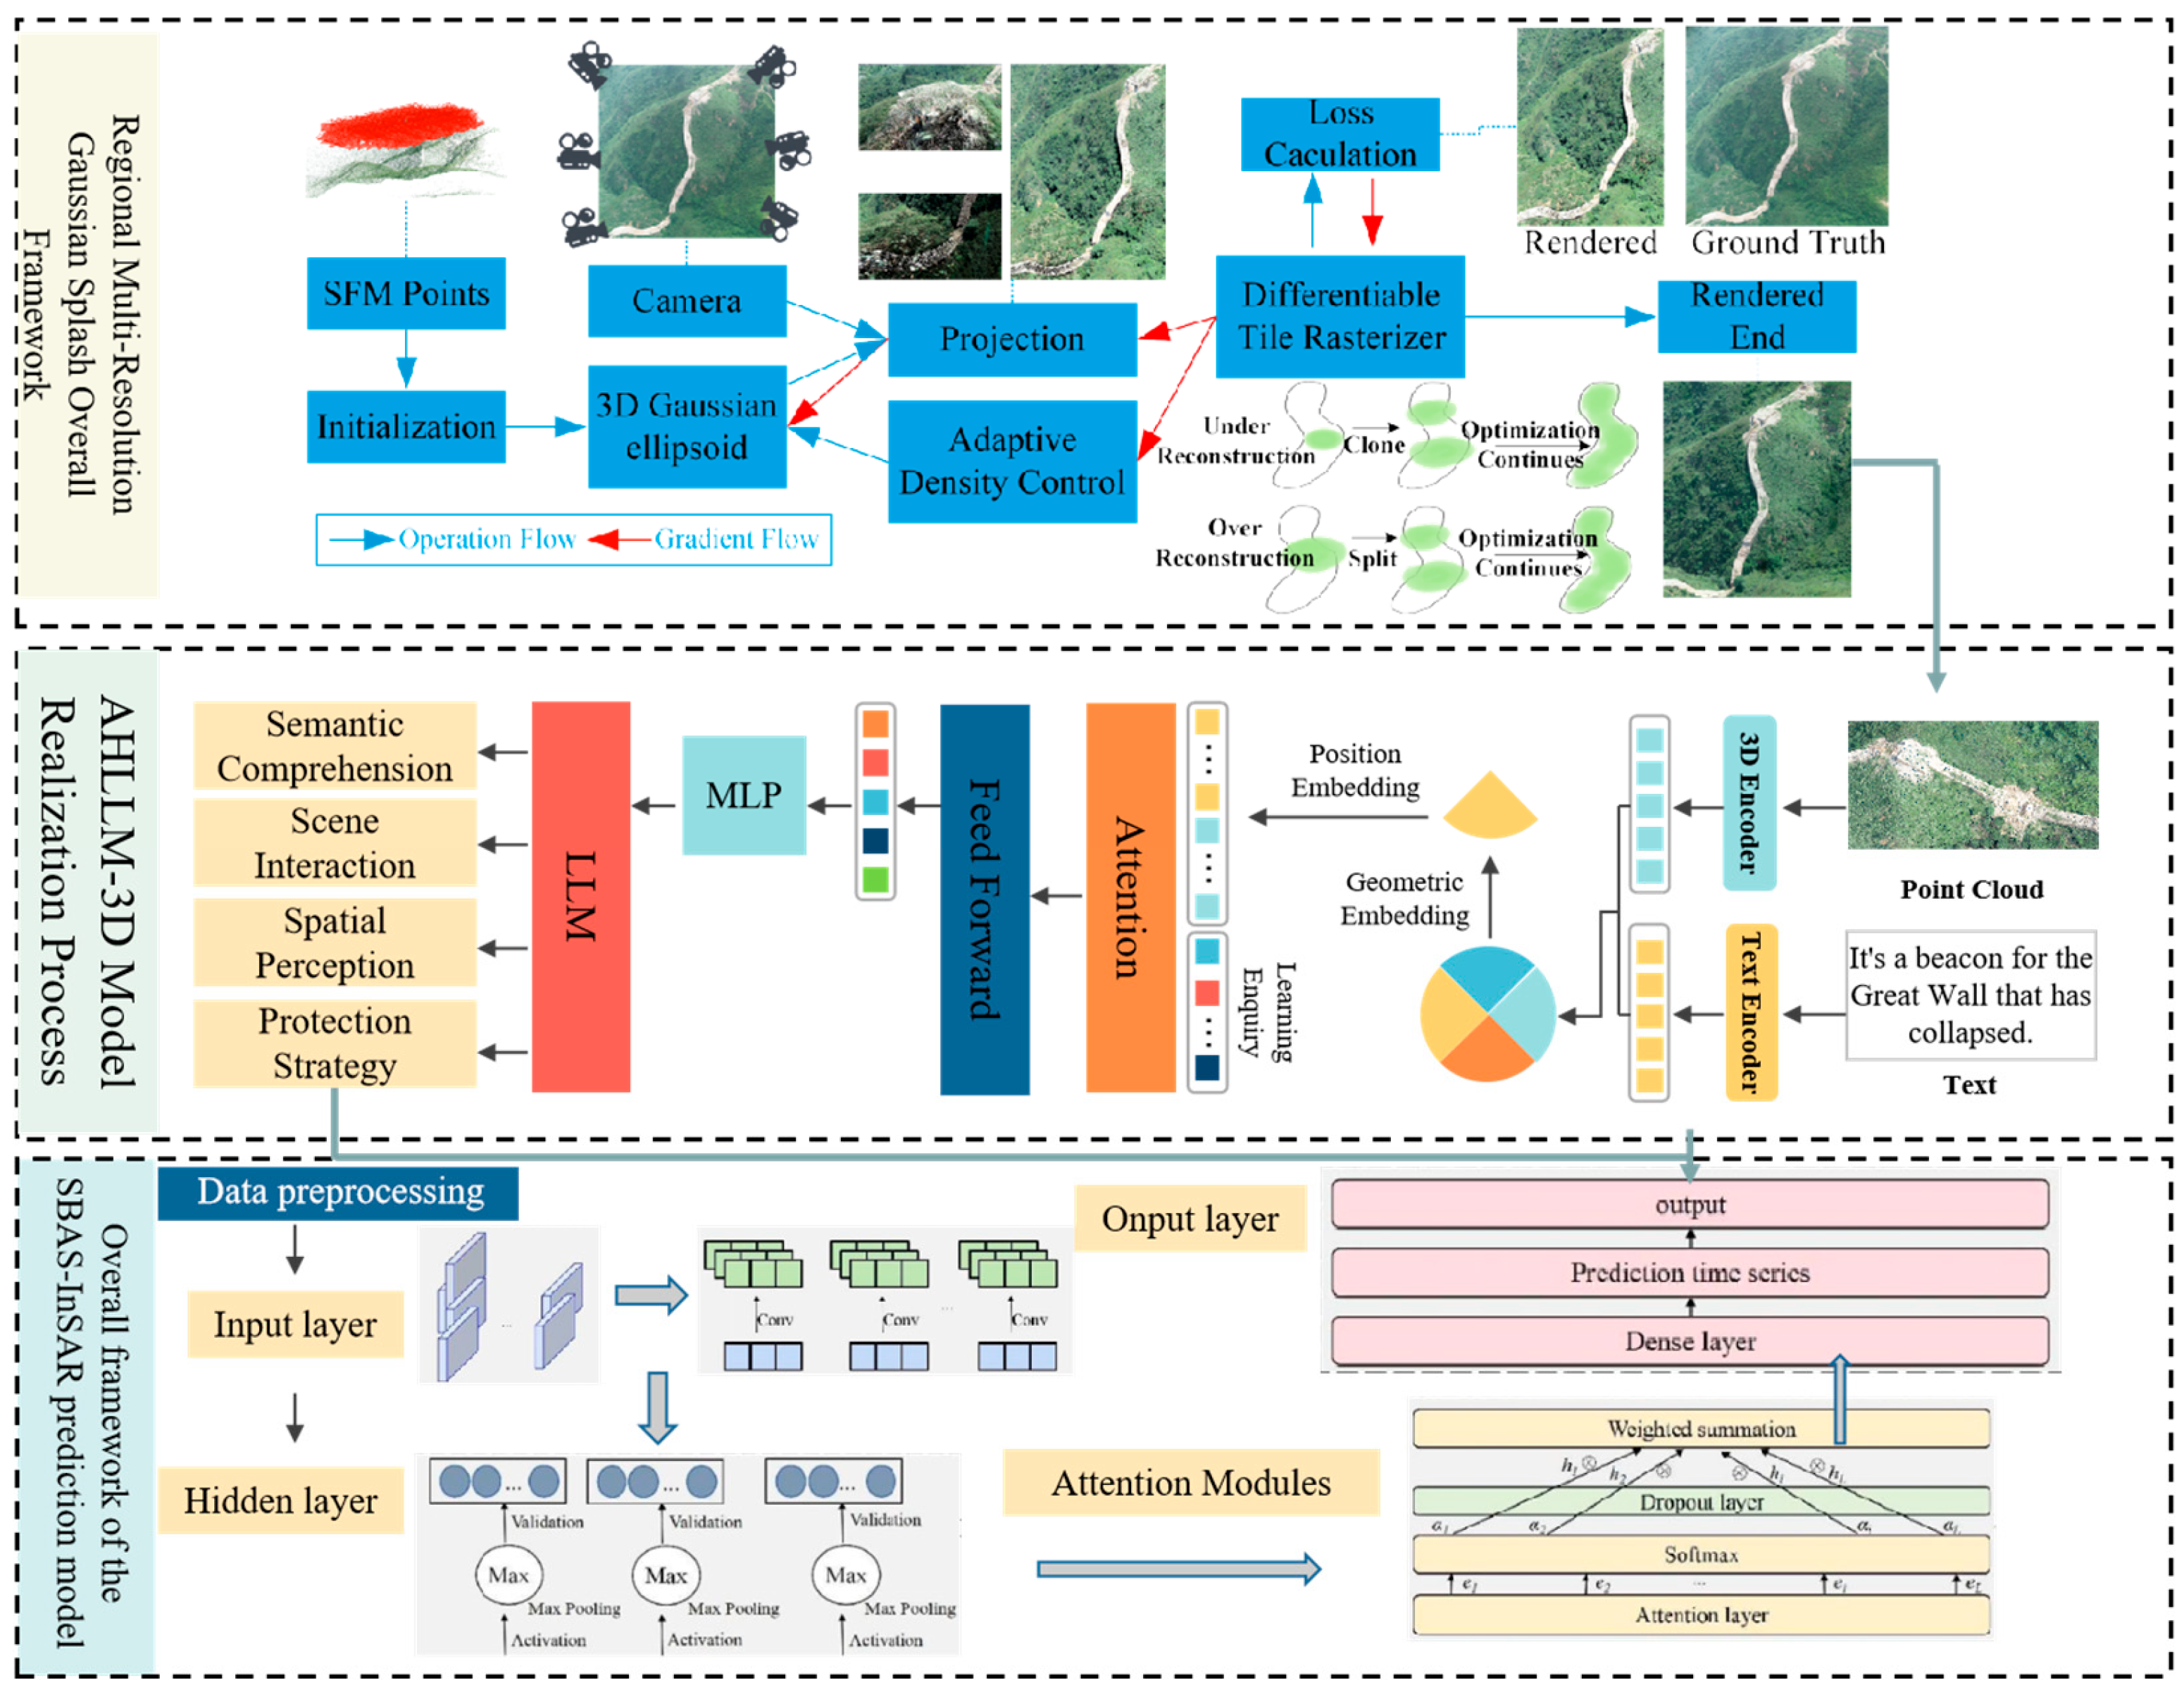
Figure 1. Integration methodology map.
Buildings 15 02827 g001
Figure 2. Schematic diagram of ROI-based regional density control strategy.
Buildings 15 02827 g002
Figure 3. Workflow of Gaussian splatting 3D reconstruction.
Buildings 15 02827 g003
Figure 4. Reconstruction model effect of Gaussian splatting 3D model.
Buildings 15 02827 g004
Figure 5. Focus Premium 350-A point cloud; statistical analysis of point cloud distances. (Right legend ≡ Figure 6).
Buildings 15 02827 g005
Figure 6. Superimposed graph.
Buildings 15 02827 g006
Figure 7. Statistical analysis of point cloud distances—A histogram of the absolute distances.
Buildings 15 02827 g007
Figure 8. Ground truth; Gaussian splatting; PhotoScan comparison.
Buildings 15 02827 g008
Figure 9. 3DGS modeling results.
Buildings 15 02827 g009
Figure 10. PhotoScan modeling results.
Buildings 15 02827 g010
Figure 11. Rendering results at the same viewpoint for each model. (a) 3DGS; (b) CityGaussian; (c) gsplat; (d) ours.
Buildings 15 02827 g011aBuildings 15 02827 g011b
Figure 12. The network design diagram of AHLLM-3D. (The blue module is used for 3D information processing, the orange module is used for text information processing, and the other different colors represent different functional modules.).
Buildings 15 02827 g012
Figure 13. Distributed training metrics graph.
Buildings 15 02827 g013
Figure 14. Model spatial attribute resolution capability review.
Buildings 15 02827 g014
Figure 15. A semantic reasoning competency assessment incorporating environmental attribution and protection strategies.
Buildings 15 02827 g015
Figure 16. Technology roadmap.
Buildings 15 02827 g016
Figure 17. Up-orbit SBAS-InSAR temporal and spatial baseline map.
Buildings 15 02827 g017
Figure 18. Time series analysis chart.
Buildings 15 02827 g018
Figure 19. Interpolation of settlement rates.
Buildings 15 02827 g019
Figure 20. IMF components after VMD decomposition.
Buildings 15 02827 g020
Figure 21. Effects of different models.
Buildings 15 02827 g021
Table 1. Overview of the application and processing methods of different data sources in submodules.
Data SourceSubmoduleSpecific UseProcessing Method
InSARDeformation Monitoring and PredictionProvides large-scale surface deformation dataGenerates time series deformation information using SBAS-InSAR technology for large-scale region monitoring.
UAVLow-altitude Tilt Photogrammetry and ModelingProvides high-resolution 3D reconstruction modelsUses SfM and MVS technologies for feature extraction, sparse point cloud generation, and texture mapping.
Point Cloud3D Modeling and Semantic AnalysisProvides 3D geometric information of cultural heritageCombines high-density sampling and 3DGS technology, integrates point cloud data with large language models for semantic understanding and spatial analysis.
Multimodal DataIntelligent Understanding and GenerationConducts semantic understanding and multimodal data fusion for cultural heritageCombines 3DGS with the AHLLM-3D model; integrates point cloud data and text for dual-level annotation and semantic analysis.
SBAS-InSARDeformation Monitoring and Trend AnalysisMonitors ground subsidence of linear cultural heritageUses SBAS-InSAR technology for high-precision surface subsidence prediction and analysis.
Table 2. Comparison between 3DGS and PhotoScan.
Metric3DGSPhotoScan
Points/Faces20.48 M Gaussians145 M dense points, 28.98 M faces
Model Size2.6 GB3.2 G
Rendering Speed32 FPS (4090)No real-time rendering
Total Modeling Time3 d 15 h (4090)/
2 h 32 m (H800)
>5 days
Rendering TypeReal time; interactiveStatic, non-interactive
Best Use CaseVisualization + AIStatic documentation and measurement
Table 3. Experimental comparison of Gaussian splatting models.
ModelIterations PSNR   ( dB ) SSIM LPIPS Model Size (GB)GPU UseTime
3DGS30k22.910.6500.3573.4874.342 h 19 min
CityGaussian30k22.880.6470.3603.5876.892 h 39 min
gsplat30k21.100.4760.7181.9255.352 h 17 min
Ours30k22.940.6550.3573.5778.862 h 32 min
Note:   : higher is better;   : lower is better.
Table 4. Central frequency observation method.
k1234567891011
k = 30.00440.07160.1691
k = 40.00230.02720.08200.1959
k = 50.00210.02470.07740.14700.2164
k = 60.00200.02380.07580.13560.19290.3144
k = 70.00290.02260.07280.11410.15580.21970.3755
k = 80.00190.02250.07060.10250.15090.20440.26760.3802
k = 90.00190.02260.07030.10130.14990.20060.25380.32410.3877
k = 100.00190.02250.07000.09980.14850.19350.22500.26750.33950.3913
k = 110.00190.02250.06970.09820.14700.18550.20620.23450.27200.39220.3471
Table 5. Test set evaluation metrics for prediction points.
Predictive ModelRMSE (mm)MAE (mm)R2
VMD-SO-AT-CNN-LSTM (ours)3.52092.75840.9932
VMD-SSA-CNN-LSTM9.50364.38270.9670
CNN-LSTM-MATT8.44876.83810.9610
Disclaimer/Publisher’s Note: The statements, opinions and data contained in all publications are solely those of the individual author(s) and contributor(s) and not of MDPI and/or the editor(s). MDPI and/or the editor(s) disclaim responsibility for any injury to people or property resulting from any ideas, methods, instructions or products referred to in the content.