Article

Shaping Built Environments for Health-Oriented Physical Activity: Evidence from Outdoor Exercise in Dongguan, China

1
The First Dongguan Affiliated Hospital, Guangdong Medical University, Dongguan 523808, China
2
Urban Planning Department, College of Architecture and Urban Planning, Tongji University, Shanghai 200092, China
*
Author to whom correspondence should be addressed.
Buildings 2025, 15(16), 2812; https://doi.org/10.3390/buildings15162812
Submission received: 9 July 2025 / Revised: 5 August 2025 / Accepted: 6 August 2025 / Published: 8 August 2025

Abstract

Physical activity plays a vital role in promoting public health. Among its various forms, outdoor exercise offers combined physical and mental health benefits. However, the spatial patterns and underlying drivers of outdoor exercise remain underexplored in rapidly urbanizing areas. Based on 15,880 app-tracked trajectories from 723 individuals, this study investigates running, walking, and cycling patterns across 130 communities in Southern Dongguan. Results reveal three key findings. First, different types of outdoor exercise show distinct spatial patterns: running is common in urban centers, walking is concentrated around natural landscapes, and cycling follows cross-regional networks. Second, natural and built environmental features shape outdoor exercise behavior. Waterfront continuity promotes participation, while residential areas support walking. In contrast, manufacturing zones inhibit participation due to environmental degradation. Socioeconomic factors also influence participation by enhancing the grassroots governance capacity. Third, spatial spillover effects significantly shape cycling patterns, and traditional models that ignore spatial dependence underestimate environmental impacts. These findings provide new insights into how the combined influence of artificial and natural environments shapes outdoor exercise in rapidly urbanizing cities. They also reveal the distinctive role of grassroots governance with state support in China, offering valuable lessons for other fast-growing urban regions worldwide.

1. Introduction and Literature Review

With the rapid acceleration of urbanization, shifts in residents’ lifestyles have significantly exacerbated the burden of chronic diseases. In modern urban life, high levels of stress, sedentary behavior, and irregular dietary habits have contributed to the rising prevalence of non-communicable diseases (NCDs) such as cardiovascular diseases, diabetes, and obesity, which have emerged as major global public health challenges [1]. According to the World Health Organization, NCDs account for 71% of global deaths [2], and their incidence is strongly associated with sedentary lifestyles, high-stress environments, and unhealthy dietary patterns [3].
Outdoor exercise (OE) has emerged as a cost-effective public health intervention, offering dual benefits through physical activity (PA) and exposure to natural environments [4]. Substantial evidence indicates that regular PA can reduce the risk of cardiovascular diseases and type II diabetes by 20–30% [5], while natural settings further enhance health outcomes via mechanisms such as ultraviolet-induced vitamin D synthesis [6] and psychological restoration [7].
The spatial distribution of different OE types exhibits distinct patterns across urban environments. Running is significantly associated with urban green spaces, especially large, well-equipped parks, which are often preferred by runners [8]. In contrast, walking tends to concentrate in high-density, mixed-use areas, particularly where commercial and residential functions are integrated [9]. This pattern is driven by walking’s reliance on short-distance accessibility and the availability of diverse destinations, making multifunctional urban centers key hotspots for pedestrians. Meanwhile, cycling is linked to urban transportation networks, with hotspots typically found along major roads and dedicated bike lanes [10]. However, most existing studies focus on the spatial characteristics of a single type of OE without systematically comparing spatial preferences across different activities. For instance, while parks have been confirmed as attractive for running, their impact on other forms of OE remains unclear.
Natural and built environments are crucial spatial carriers of OE. Recent reports by the World Health Organization (2023) emphasize that access to blue and green spaces plays a vital role in improving both physical and mental health by reducing stress, encouraging PA, and enhancing social interaction [11]. In Europe, projects such as the INTERREG Italy–Croatia cooperation initiative have promoted the sustainable use of coastal and riverine environments for outdoor recreation and health promotion, highlighting the importance of inclusive spatial planning and ecological protection [12]. Blue spaces, such as waterfront greenways and lake parks, have been shown to significantly increase walking and cycling frequency due to their aesthetic value and ecosystem services [13]. Green spaces, including urban parks and community green areas, enhance the exercise microenvironment by providing shade, reducing noise, and improving air quality [14]. Existing studies have predominantly relied on macroscale indicators such as the water body area [15], straight-line distance to water bodies [16], and green coverage ratio [17] to assess the impact of the natural environment on OE. However, the role of accessible waterfront continuity, such as community-level riverbank trails and small artificial lakefronts, as a frequent venue for OE remains insufficiently explored. In addition, research on the influence of the built environment on OE has predominantly used integrative metrics. These include street connectivity [18], public facility density [19], and land use heterogeneity [20], which capture broad spatial characteristics. For example, studies have demonstrated that a high density of fitness facilities significantly increases resident exercise frequency [21]. In contrast, several studies have noted that poorly maintained or disconnected pedestrian and bicycle infrastructure, particularly in suburban areas, can significantly limit walking and cycling by reducing safety, accessibility, and user comfort [22]. However, this holistic approach often overlooks the differential effects of functional zoning—such as industrial, residential, and commercial areas—on OE behavior.
Recent scholarships in urban health have increasingly highlighted the concepts of place and place-making as important dimensions in understanding OE behavior. Rather than being a simple physical location, place is understood as a socially constructed space shaped by human emotions, interactions, and meaning [23]. Place-making refers to the ongoing process of designing, managing, and activating public spaces through community engagement, spatial governance, and everyday use [24]. Integrating this perspective into OE research helps explain why physically similar greenways or open spaces may exhibit divergent patterns of use across neighborhoods.
Socioeconomic factors indirectly influence OE behavior. In developed countries, individuals with higher incomes [25] and education levels [26] in developed countries typically have better access to quality exercise facilities and recreational spaces [27]. In the United States, high-income individuals are 1.9 times more likely to meet PA guidelines within a day and 2.7 times more likely within six days than those with lower incomes [28]. Moreover, socioeconomic status plays an important role in supporting effective policy implementation and local spatial planning [29]. European “Healthy City” initiatives have significantly improved the provision of OE facilities in low-revenue areas through financial subsidies and community participation [30]. In rapidly urbanizing Global South countries, unique socioeconomic conditions—such as collective land ownership—may similarly influence OE behavior by strengthening the capabilities of grassroots governance units, although research in this area remains in its infancy.
Traditional statistical methods are widely used to examine the influence of socioeconomic, natural, and built environment factors on OE. Approaches such as logistic regression [31], linear models [32], and structural equation modeling [33] rely on the assumption of sample independence, using linear or non-linear regression frameworks to quantify the impacts of explanatory variables on OE participation. For instance, some studies employ logistic regression to estimate the probability of engaging in OE [34], while others apply Poisson regression to analyze exercise frequency [35]. While these methods effectively capture the direct impact of local environmental factors, they overlook the inherent spatial dependence of OE behavior. Key spatial characteristics, such as behavioral similarity between neighboring areas, the spatial continuity of OE trajectories, and the cross-regional spillover effects of environmental factors, are often ignored. This omission introduces fundamental biases into the models, limiting their accuracy in assessing the true drivers of OE participation.
There are several gaps in the existing literature. First, there is a lack of systematic studies on the spatial preference differences among different types of OE in rapidly urbanizing areas. Second, the differentiated roles of socioeconomic, natural, and built environments in shaping various types of OE have not been fully explored. Third, the neglect of spatial autocorrelation effects has led to biased understandings of the spatial distribution patterns of OE behavior. Therefore, this empirical study uses trajectory and environmental data to (1) characterize the unique spatial distribution patterns of running, walking, and cycling; (2) disentangle the differentiated associations by which socioeconomic, natural, and built environments influence each OE type; and (3) quantify how spatial spillover effects alter estimates of environmental associations, thereby revealing the bias introduced by traditional non-spatial models.

2. Materials and Methods

2.1. Overall Research Framework

This study focuses on 130 communities/administrative villages in the southern section of Dongguan City, China, analyzing a total of 15,880 outdoor exercise (OE) trajectories generated by 723 individuals. The aim of this study is to explore the spatial patterns of OE at the community level and identify its driving factors. The methodology follows a five-step procedure (Figure 1):
First, the study scope was defined by selecting seven townships in the southern zone of Dongguan City as the spatial boundary, then delineating communities/administrative villages within these townships. This region was chosen due to its rapid urbanization and complex urban–rural interface, which provides a typical setting for exploring spatial disparities in OE behavior.
Second, OE trajectory data were collected from a mobile health application and processed. Similar trajectories were clustered onto the same road segments to identify high-frequency and high-individual OE routes. These clusters were then aggregated at the community level to calculate the total lengths of high-frequency and high-individual OE trajectories. Socioeconomic, built, and natural environmental data were also collected from official statistical and geospatial sources and aggregated to the community scale.
Third, descriptive statistical analyses were conducted. The spatial and distributional characteristics of total OE trajectory lengths were summarized at the community level. Furthermore, a Kruskal–Wallis test was used to assess whether OE levels of the 130 communities significantly differed across the seven townships.
Fourth, a spatial overlay analysis was conducted to compare the community-level spatial distributions of high-individual and high-frequency OE trajectories. This step provided insights into the spatial differentiation of OE behavior across communities, revealing whether the intensity and frequency of exercise behaviors were spatially aligned or exhibited divergent spatial patterns.
Finally, statistical modeling was performed to identify the factors influencing OE. A generalized linear model was applied to assess the effects of socioeconomic, built, and natural environment variables. To enhance model accuracy and account for spatial dependence, spatial regression models were also introduced for comparison.

2.2. Study Scope

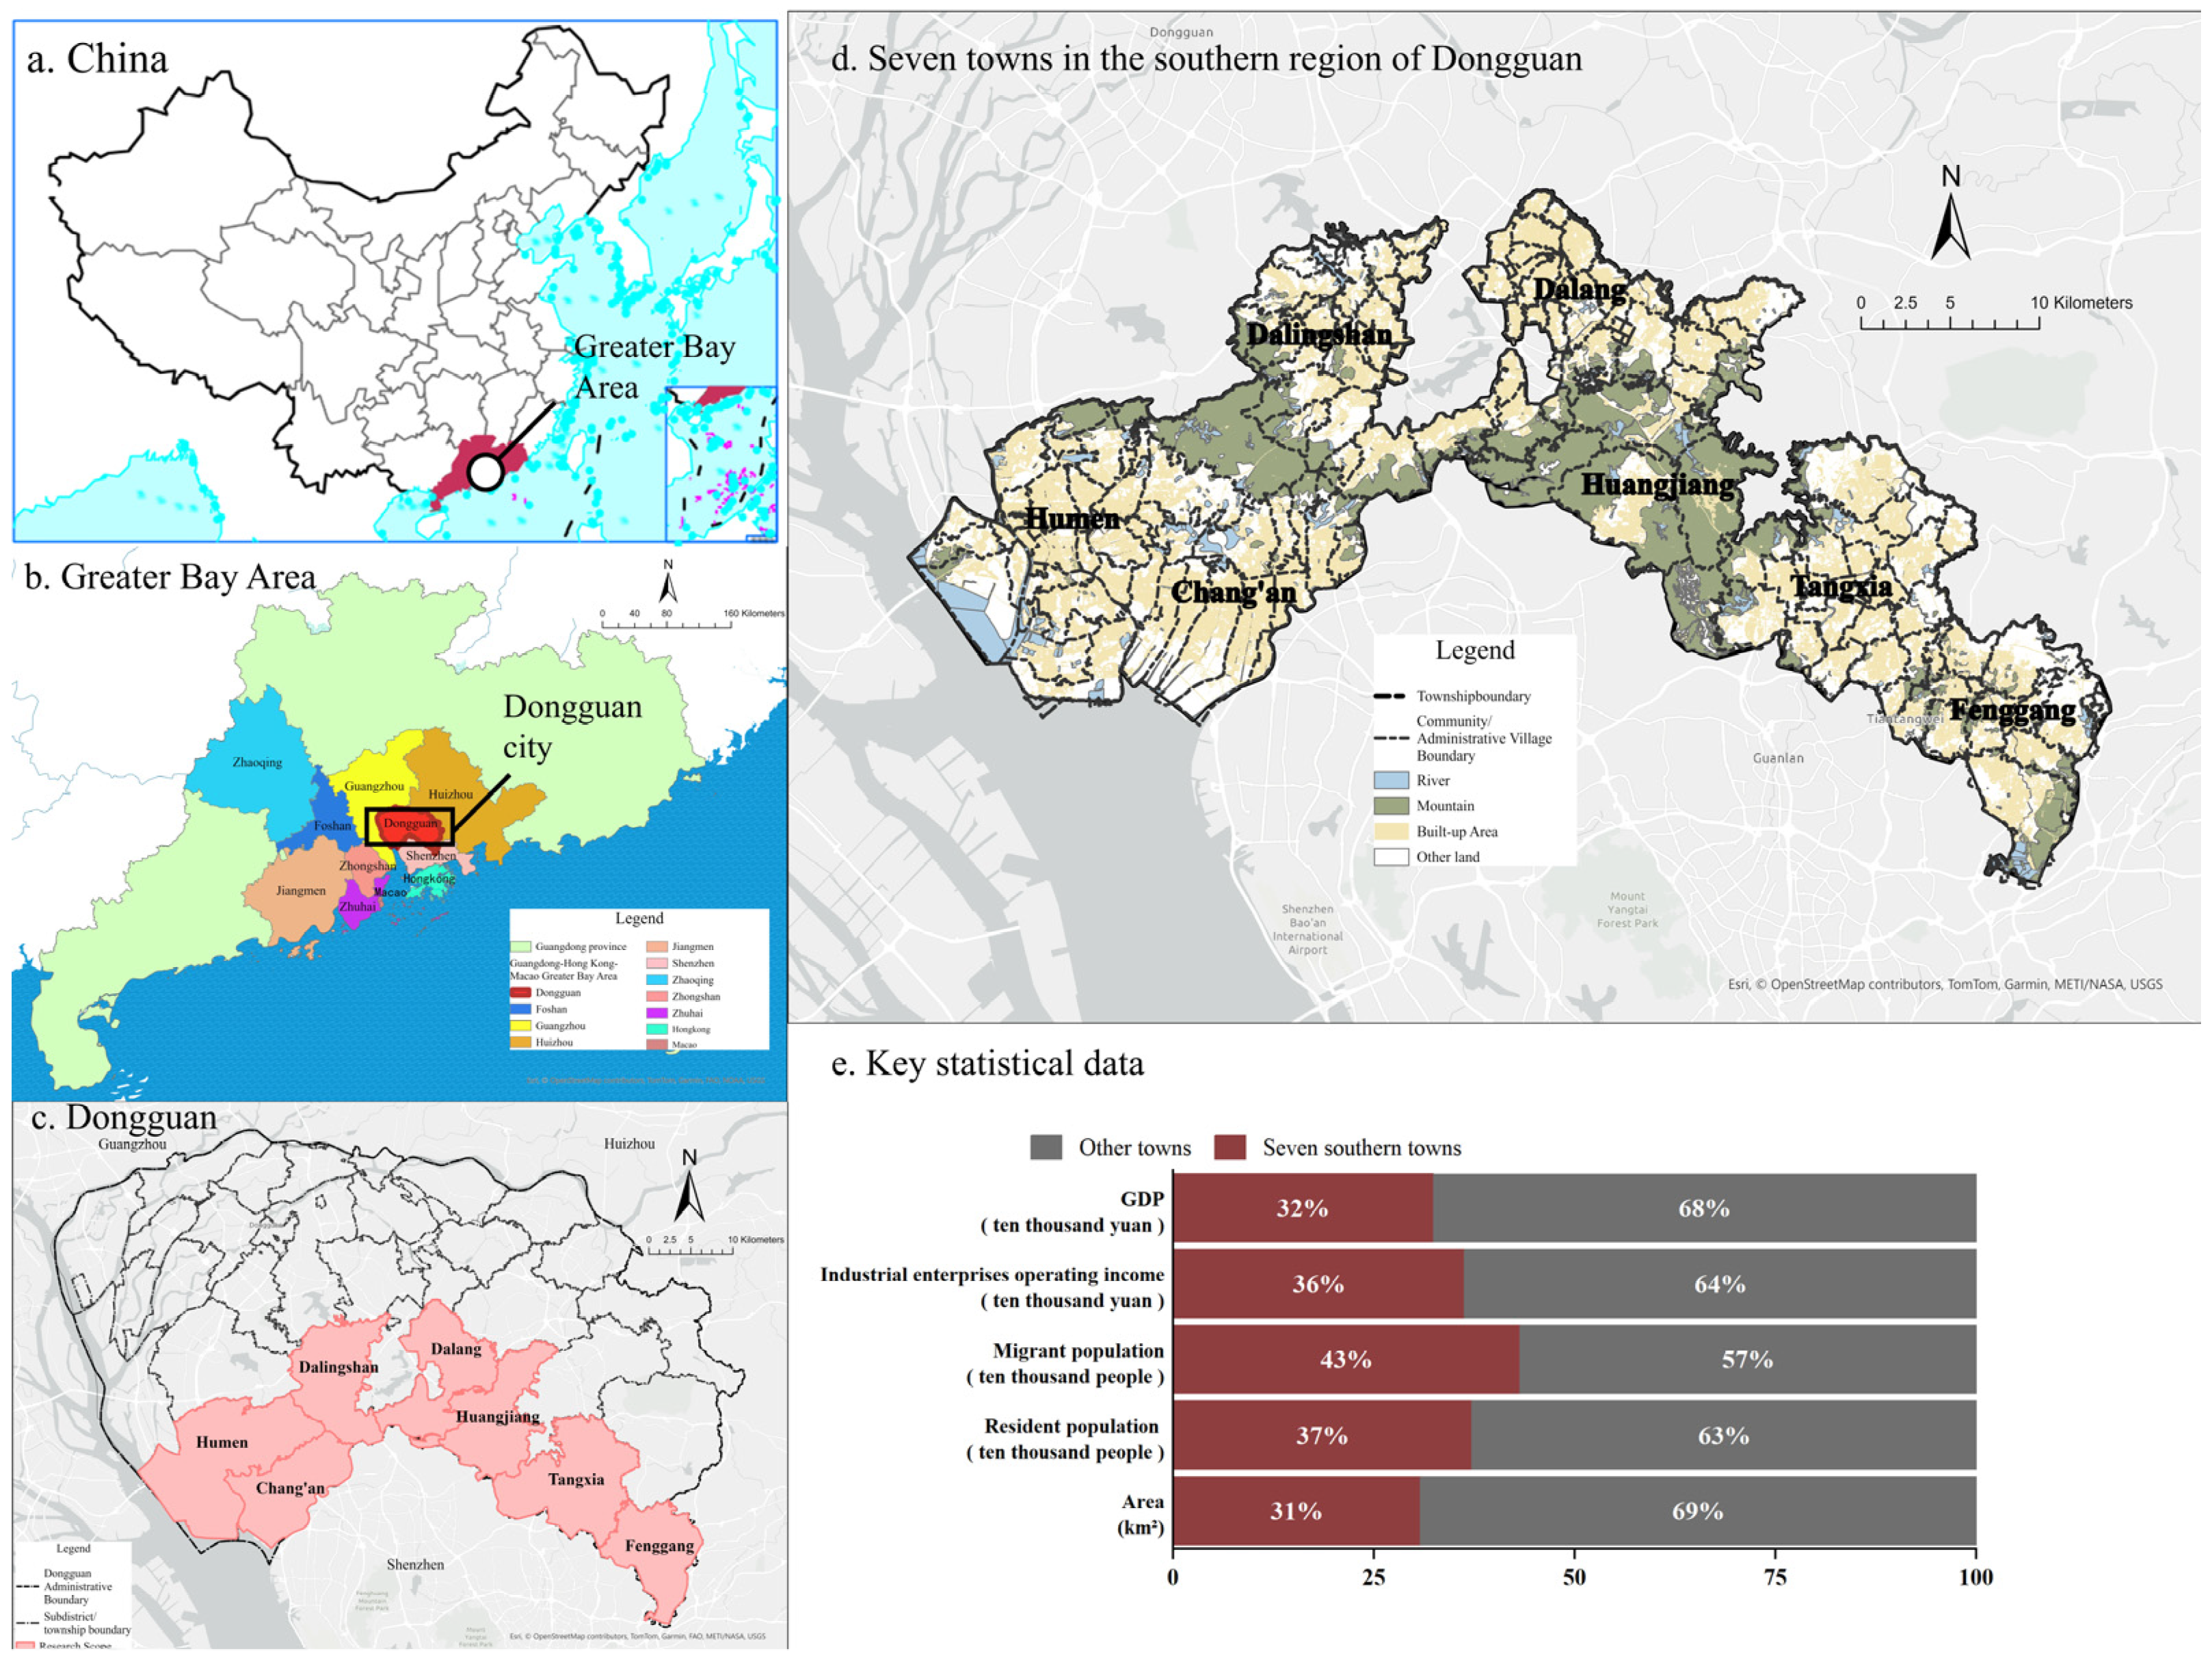
This study selected Dongguan, a city in the hinterland of the Guangdong–Hong Kong–Macao Greater Bay Area, as the empirical research site. Specifically, seven townships in the southern region of Dongguan were examined: Humen, Chang’an, Dalingshan, Dalang, Huangjiang, Tangxia, and Fenggang. As one of China’s four prefecture-level cities without district or county divisions, Dongguan operates under a unique four-tier administrative structure (“city–town–village–group”). This flat governance model positions townships as key units for grassroots governance and spatial planning, providing an institutional foundation for a refined community- and village-level analysis [36].
The seven selected townships located at the Dongguan–Shenzhen border played a crucial role in absorbing industrial transfers from Hong Kong and Shenzhen. They exhibit distinct characteristics typical of a Greater Bay Area hinterland, including “small-scale industrialization, high diversity, and high mobility [37].” This region accounts for 43% of Dongguan’s migrant population (Figure 2) and represents the city’s highest population density and the most dynamic economic activity. Their coexistence of a production-oriented economy and dense, transient communities makes OE especially critical. In such environments, long working hours, limited recreational space, and high population turnover constrain access to diverse or organized fitness activities. Understanding where and how residents engage in OE, as well as which environmental attributes they prefer, carries both theoretical significance for spatial behavior research and practical implications for designing health-promoting urban spaces.
Within these 7 townships, we further identified 130 communities and administrative villages representing industrial clusters, urban–rural transition zones, and ecological conservation areas. This micro-scale sampling ensures that our findings reflect the complex “industry–population–space” interactions characteristic of rapidly urbanizing Chinese cities and support the development of targeted, place-specific strategies for OE environments (Figure 2).

2.3. Data Collection and Processing

2.3.1. Acquisition and Processing of Outdoor Exercise Trajectory Data

The OE trajectory data were obtained from the client information collection system of the mobile application KEEP (https://www.gotokeep.com/ accessed on 12 March 2024). This application is specifically designed to record various types of OE activities, such as running and cycling, while providing tracking and analysis services. Using Python 3.11.0 tools, this study extracted raw trajectory datasets of all individuals within the study scope from 1 June 2023, to 1 June 2024, covering three OE types: outdoor running (OR), outdoor walking (OW), and outdoor cycling (OC). All data were anonymized, and individual socioeconomic information was excluded.
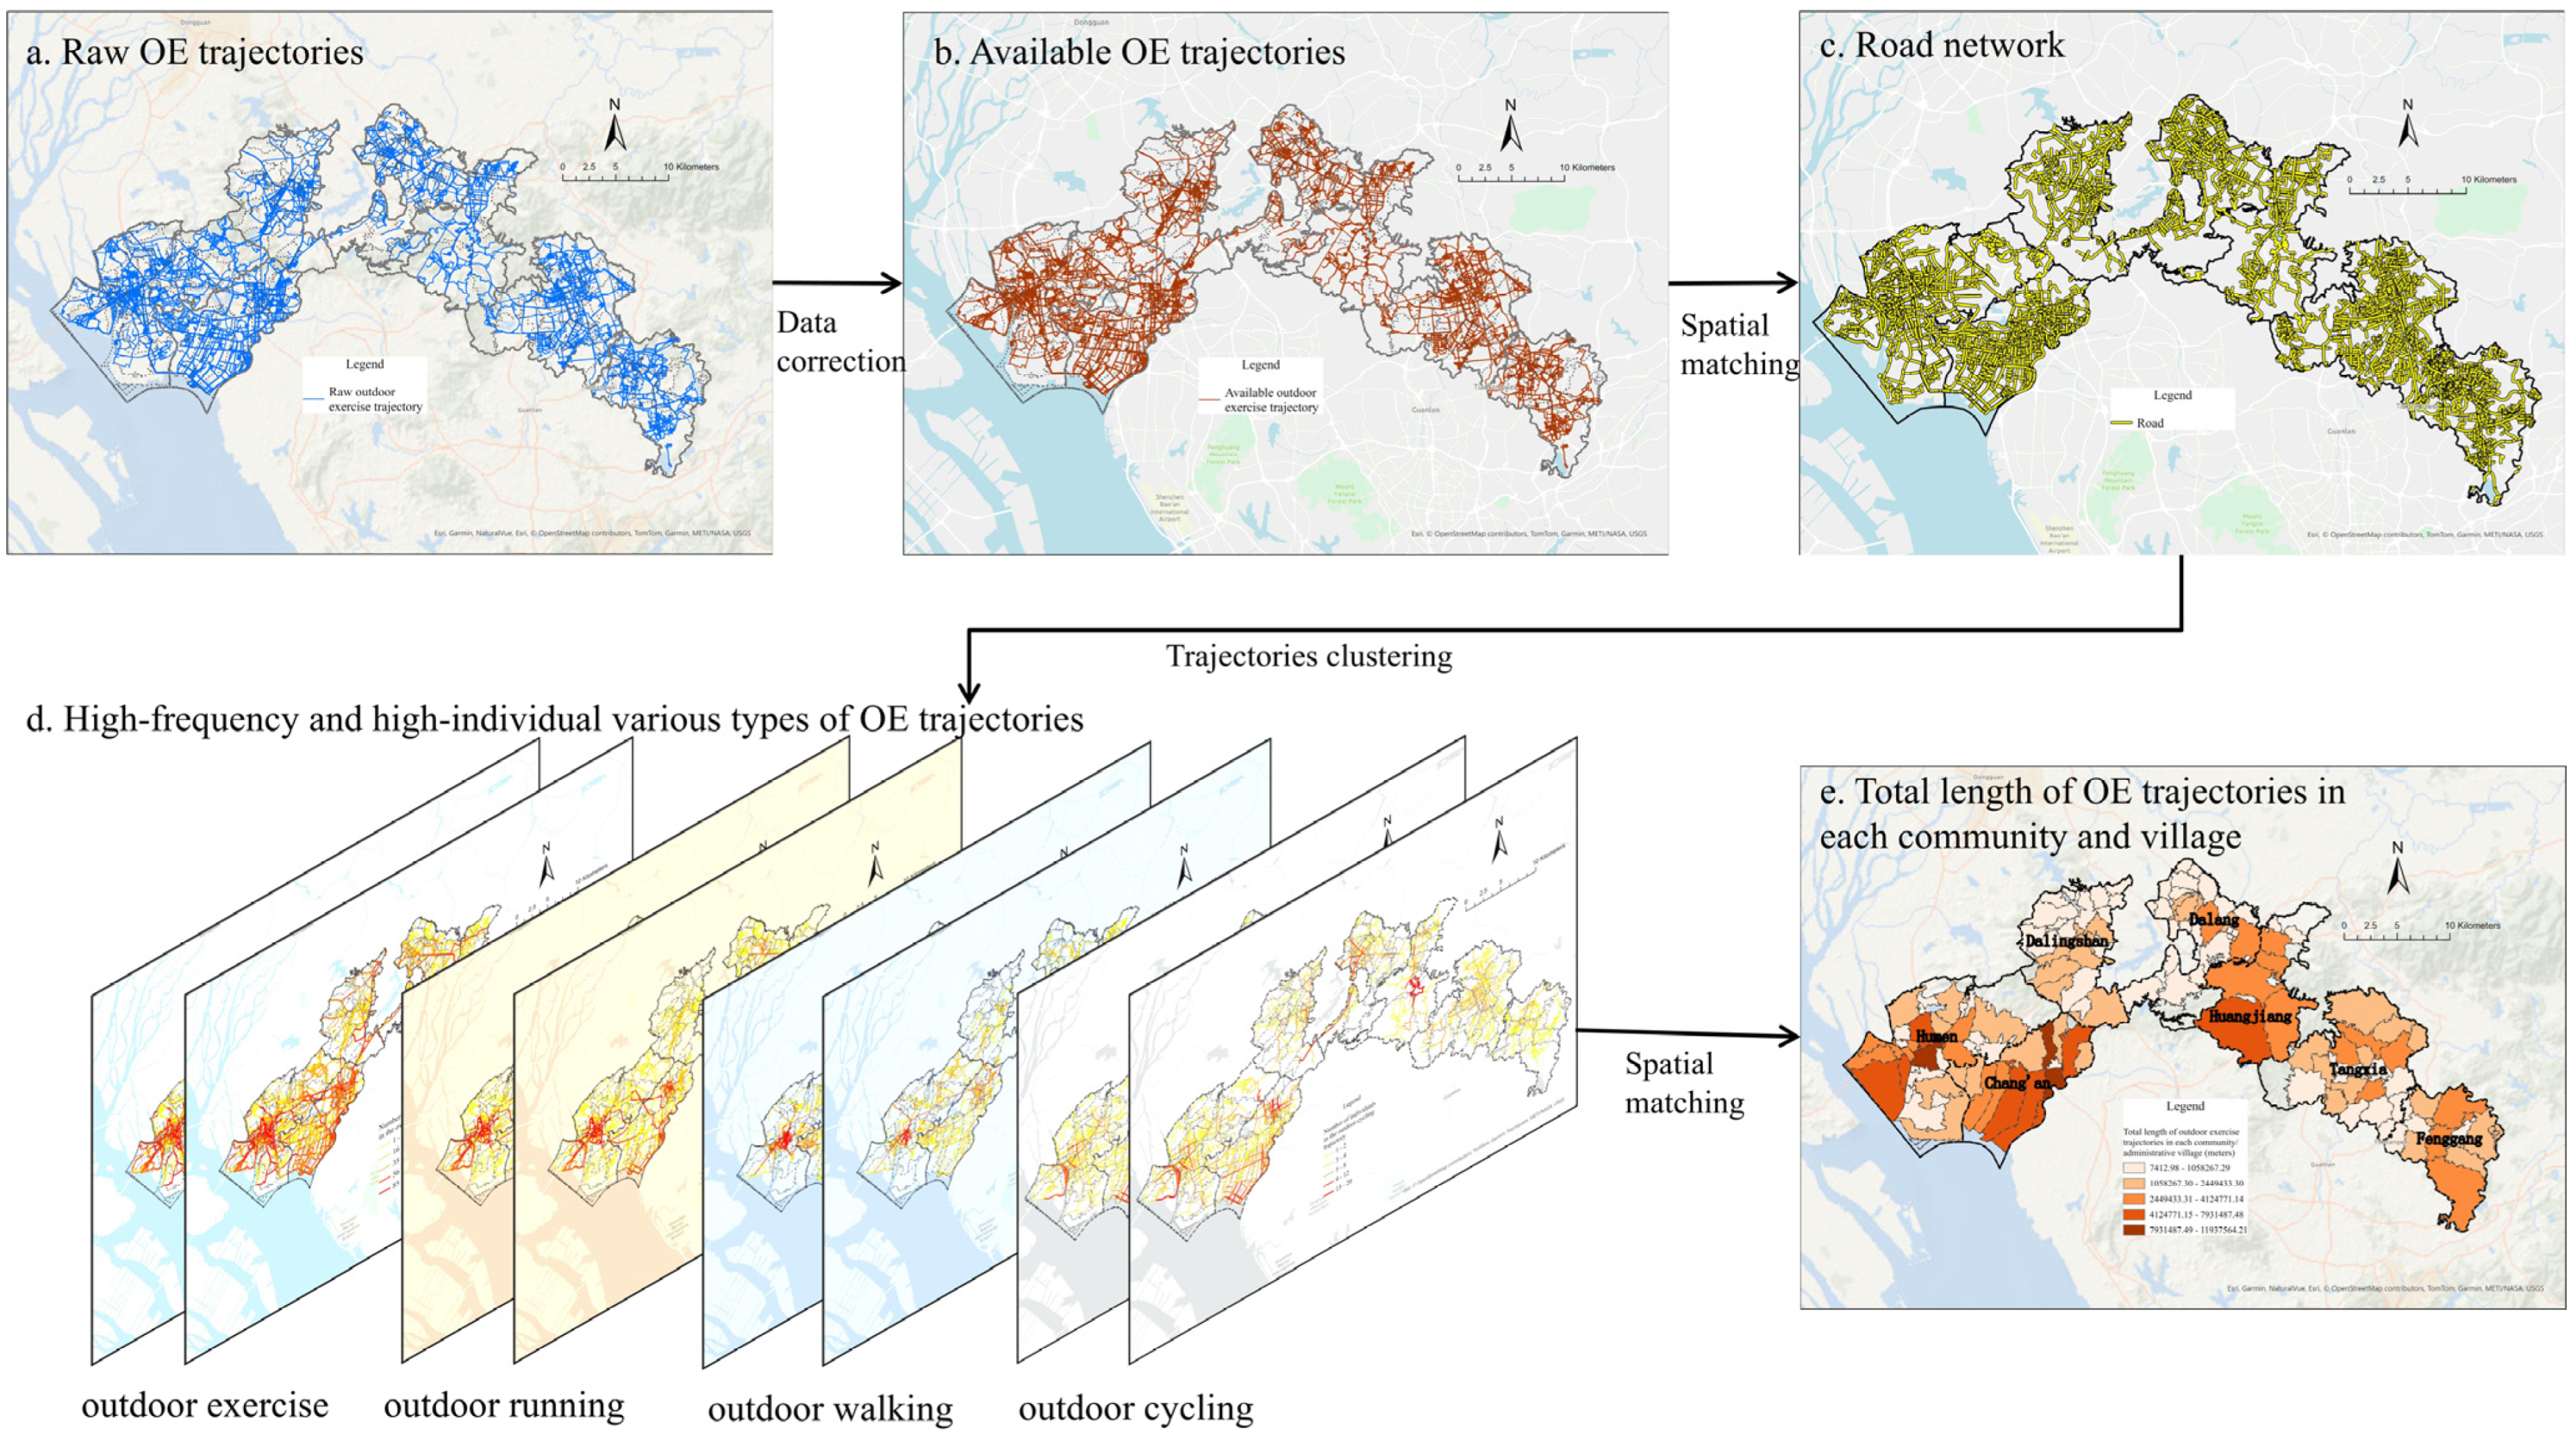
The OE trajectory data processing involves four key steps. Data correction was performed in Step 1. Initially, the raw location data were converted into a universal WGS84 coordinate system to filter biased coordinates. Drift points were removed, duplicate individual OE records were eliminated, and data from individuals with fewer than six check-ins within the study scope were excluded to ensure that only those likely to reside or work in the area were retained. Detailed error detection and correction were then applied (e.g., identifying and correcting unreasonable duration entries), resulting in a foundational dataset comprising 723 individuals and 15,880 OE trajectories, of which 643 individuals generated 12,284 OR trajectories, 249 individuals produced 2540 OW trajectories, and 110 individuals contributed 1056 OC trajectories, with 279 individuals participating in two or more OE types.
In Step 2, the corrected OE trajectory lines are mapped onto the road network using ArcGIS Pro to facilitate clustering across the three OE types. The trajectories were spatially matched and assigned to corresponding road segments based on their geometric proximity and similar directional paths. The likelihood of a trajectory being associated with a specific road was determined by calculating the spatial overlap between the trajectory lines and the road network, thereby completing the clustering process.
In Step 3, the trajectory characteristics were quantified using two statistical approaches. First, the frequency metric was computed as the total number of clustered trajectories on each road, reflecting the trajectory density. Second, the participation metric was derived by aggregating all trajectories generated by the same individual (using a dissolve function) to obtain the total number of individuals engaged in OE on each road. These metrics were classified into five categories using the natural break method, allowing the corresponding road segments to be sorted accordingly.
Finally, the two highest categories based on total frequency and participant count were selected as high-value thresholds (Figure 3). High-frequency and high-individual trajectories were identified and aggregated at the levels of 130 community and administrative village governance units. This aggregation enabled the calculation of the total trajectory lengths for overall OE trajectories, as well as for high-frequency OE (HFOE-TL) and high-individual OE (HIOE-TL), each categorized into OR (HFOR-TL), OW (HFOW-TL), and OC (HFOC-TL) within each unit (Table 1).
In this study, the total length of high-frequency and high-individual trajectories within the “community/administrative village” was used as the representation of the OE phenomenon that the research aims to explain. The frequency and individual count of the OE trajectories reflect the activity level and breadth of participation in a specific type of OE, respectively, revealing the distribution characteristics of individual participation in OE from two perspectives. Therefore, these were selected as dependent variables in this study.

2.3.2. Explanatory Variable Data and Measurement

This study categorizes the independent variables into two main groups: socioeconomic factors and natural and built environment factors. People in regions with better social services and greater economic development have more time and energy to engage in OE [38]. Additionally, a favorable natural and built environment is one of the key incentives for people to engage in leisure and OE activities [39]. To this end, ten explanatory variables were selected, and multicollinearity tests were conducted using R4.3.0. Variables with a variance inflation factor (VIF) below 5.0, indicating no severe multicollinearity issues, were chosen as independent variables for model construction, and normalization was applied. The following factors were finalized for further analysis (Table 2):
(1) Socioeconomic data of grassroots governance units
Official socioeconomic statistics at the “community/administrative village” level were obtained from official sources within the study scope. These include the total number of enterprises, migrant populations, total assets, and net operating revenue. Data on the migrant population were sourced from the official websites of Dongguan’s subdistricts and towns and the “Digital Local Chronicles” platform (http://www.dg.gov.cn/dgdfz/html/dgsjk/pc/index.html#/ as of 16 January 2024). Data on the total number of enterprises, total assets, and net operating revenue were obtained from the Dongguan Statistical Yearbook [37]. These factors were categorized as “socio-economic variables.”
(2) Natural and built environmental data
This study focuses on “green leisure spaces, residential buildings, commercial facilities, industrial production, waterfront continuity, and topographical changes,” which are treated as independent variables representing the natural and built environment. AOI data for different land uses were obtained from the “AOI Area Boundary Query” module of Baidu Maps Open Platform (https://lbsyun.baidu.com/faq/api?title=webapi/region-search/ as of 25 March 2024). Using ArcGIS Pro, the AOI data were mapped to the boundaries of each “community/administrative village”, and the areas were calculated. “Green leisure spaces” include a combined area of leisure squares and parks. Additionally, topographical elevational changes caused by terrain fluctuations were obtained from a geographic spatial data cloud (https://www.gscloud.cn/home as of 23 January 2024) using ASTER GDEM V3 (Advanced Spaceborne Thermal Emission and Reflection Radiometer Global Digital Elevation Model). This model provides global digital elevation data with a spatial resolution of 30 m and high precision (a vertical accuracy of approximately 20 m and a horizontal accuracy of approximately 30 m). The difference between the maximum and minimum elevation values within each “community/administrative village” was computed to represent the elevation change.

2.4. One-Way Non-Parametric Analysis of Variance (Kruskal–Wallis Test)

The Kruskal–Wallis test, a non-parametric statistical method, was used to compare the total length of OE trajectories across different communities/administrative villages in various townships. As the normality test indicated that the trajectory data did not follow a normal distribution, the Kruskal–Wallis test was chosen to avoid the limitations of normality and homogeneity of variance assumptions, ensuring the reliability of the results [40]. Group differences were assessed based on rank-sum statistics, and box plots were generated. Significant results were further analyzed using post hoc multiple comparisons to identify specific group differences. The significance level was set at p < 0.05.

2.5. Spatial Overlay Analysis

To explore the spatial differentiation of OE behavior, a spatial overlay analysis was conducted at the community level. Based on the clustering results of OE trajectories, two types of communities were identified: those with high-individual OE and those with high-frequency OE. These community clusters were spatially overlaid to examine the degree of overlap and divergence between the two patterns. This step aimed to reveal whether areas with high participation rates also exhibited high exercise intensity, thereby offering insights into spatial mismatches or alignments in OE behavior.

2.6. Statistical Modeling

2.6.1. Generalized Linear Model

A generalized linear model (GLM) with a gamma distribution was used to analyze the factors influencing OE. Because the dependent variable data are non-negative and the normality test shows a skewed distribution, gamma distribution analysis provides an appropriate modeling method for this type of data [41]. To present the relationship between the independent and dependent variables more clearly, a log-link function was employed to transform the non-linear relationship into a linear one, thus improving the model’s explanatory power [42].
In the GLM, the dependent variables Y were HFOE-TL and HIOE-TL. It is assumed that the expected value μ has a linear relationship with the independent variables X, and the model is formulated as
l o g ( μ ) = X β
where X represents the independent variable matrix, and β is the vector of regression coefficients indicating the influence of each independent variable on the dependent variable. Maximum likelihood estimation was used to obtain the optimal estimates by maximizing the log-likelihood function.
During the model optimization phase, residual analysis and goodness-of-fit tests were conducted to verify the applicability and accuracy of the model, focusing on the independent effects of each independent variable. Interactions between the independent variables were not considered in the analysis.

2.6.2. Spatial Regression Model

Building on the GLM, a spatial regression model was introduced to account for the spatial dependence and autocorrelation in the data. First, the Global Moran’s I index was used to assess the spatial autocorrelation of HFOE-TL and HIOE-TL, verifying whether the distribution exhibited spatial clustering. The formula for Global Moran’s I is as follows:
I = n i = 1 n j = 1 n w i j ( x i x ¯ ) ( x j x ¯ ) i = 1 n ( x i x ¯ ) 2 i = 1 n j = 1 n w i j
where I is the Global Moran’s index; n is the total number of observation samples; x i and x j are the observed values for areas i and j, respectively; x ¯ is the mean of all observations; and w i j represents the spatial weight matrix elements that measure the spatial relationship between areas i and j. If the Global Moran’s I is significantly greater than 0, this indicates a positive spatial correlation among the observation samples, supporting further spatial regression analysis [43].
Spatial regression models, including the Spatial Lag Model (SLM) and the Spatial Error Model (SEM), were used to analyze the factors influencing HFOE-TL and HIOE-TL. The basic form of the SLM is as follows:
y = ρ W y + X β + ε
where y is the dependent variable vector, W y is the lag term representing the weighted average of the dependent variable in neighboring areas, ρ is the spatial lag coefficient, X is the independent variable matrix, β is the vector of regression coefficients, and ε is the random error term.
The basic form of the SEM is
y = X β + u , u = λ W u + ε
where λ is the spatial error coefficient, W u represents the spatial diffusion effect of the error term, and ε is the random error term.
Model parameters were estimated using maximum likelihood estimation, and model performance was evaluated using the Likelihood Ratio Test (LR Test), the Akaike Information Criterion (AIC), and the Bayesian Information Criterion (BIC) [44].

3. Results

3.1. Distribution of Community-Level Outdoor Exercise Trajectories Across Towns

The results of the Kruskal–Wallis test showed that the total length of the overall outdoor exercise (OE) trajectories of the community/administrative village was significantly different among the six towns (p < 0.05). The OR trajectories were significantly different among the three towns (Dalingshan, Dalang, and Chang’an) (p < 0.0001). The OW trajectories were significantly different between the four towns (Chang’an Town, Dalingshan Town, Dalang Town, and Tangxia Town) (p < 0.05). OC trajectories were significantly different among the six towns (Humen Town, Chang’an Town, Dalingshan Town, Dalang Town, Huangjiang Town, and Fenggang Town) (p < 0.05) (Figure 4a). Figure 4b–h shows the distribution of the trajectory lines of the seven towns under different natural conditions (Figure 4b–h).
Specifically, the median total length of the overall OE trajectories in Huangjiang Town was 3411.15 km, ranking first among all the towns. The mean total length of Chang’an Town was 4187.3 km, the highest value in the study range, indicating that the amount of OE in the area was significant. It is worth noting that the median total length of Humen Town is only 1230.5 km, but there are outliers in the upper limit, indicating that it is related to the extreme OE behavior of individuals. In contrast, the median total length of Dalingshan Town was only 401.2 km, which was significantly lower than that of other towns and villages, reflecting the relatively low OE participation of individuals in the region.
The distribution of the total length of the community/administrative village trajectories of the three OE types in towns and villages was analyzed further. Among them, the median and mean total length of the OR trajectory in Chang’an Town were 1776.11 km and 2462.18 km, respectively, indicating that the individual participation was the most active, and the box range was the largest, with obvious differences between individuals. The mean total length of Humen Town was relatively high (1315.72 km), but the median was relatively low (677.58 km). The median and mean total lengths in Dalingshan Town and Dalang Town were the lowest, and OR activity was relatively low.
Second, the median, mean, and box range of the total length of the OW trajectory in Chang’an Town were the largest, and the OW activity was significantly higher than that in other towns. In contrast, the total length box range of Dalingshan Town was larger, indicating significant individual differences. The total length distribution of Tangxia Town was relatively concentrated, with a few high-value outliers. The total length of the lower edge of Huangjiang Town coincided with the lower edge of the box, indicating a compact total length distribution and a low minimum. The total length of the upper edge of Fenggang Town was longer, indicating that individual walking tracks were longer.
The median (2267.99 km) and mean (2016.47 km) total lengths of the OC tracks in Huangjiang Town were the highest, and cycling was active. The total box length range and whiskers in Chang’an Town were the longest, with significant individual differences. In contrast, the median and mean total lengths in Dalingshan Town were the smallest. The median total length in Dalang Town and Fenggang Town was low; Humen Town and Tangxia Town showed moderate individual activity.

3.2. Spatial Patterns of Community-Level Outdoor Exercise Trajectories

3.2.1. Spatial Distribution of HFOE-TL and HIOE-TL Exhibits a “Core-Periphery” Structure

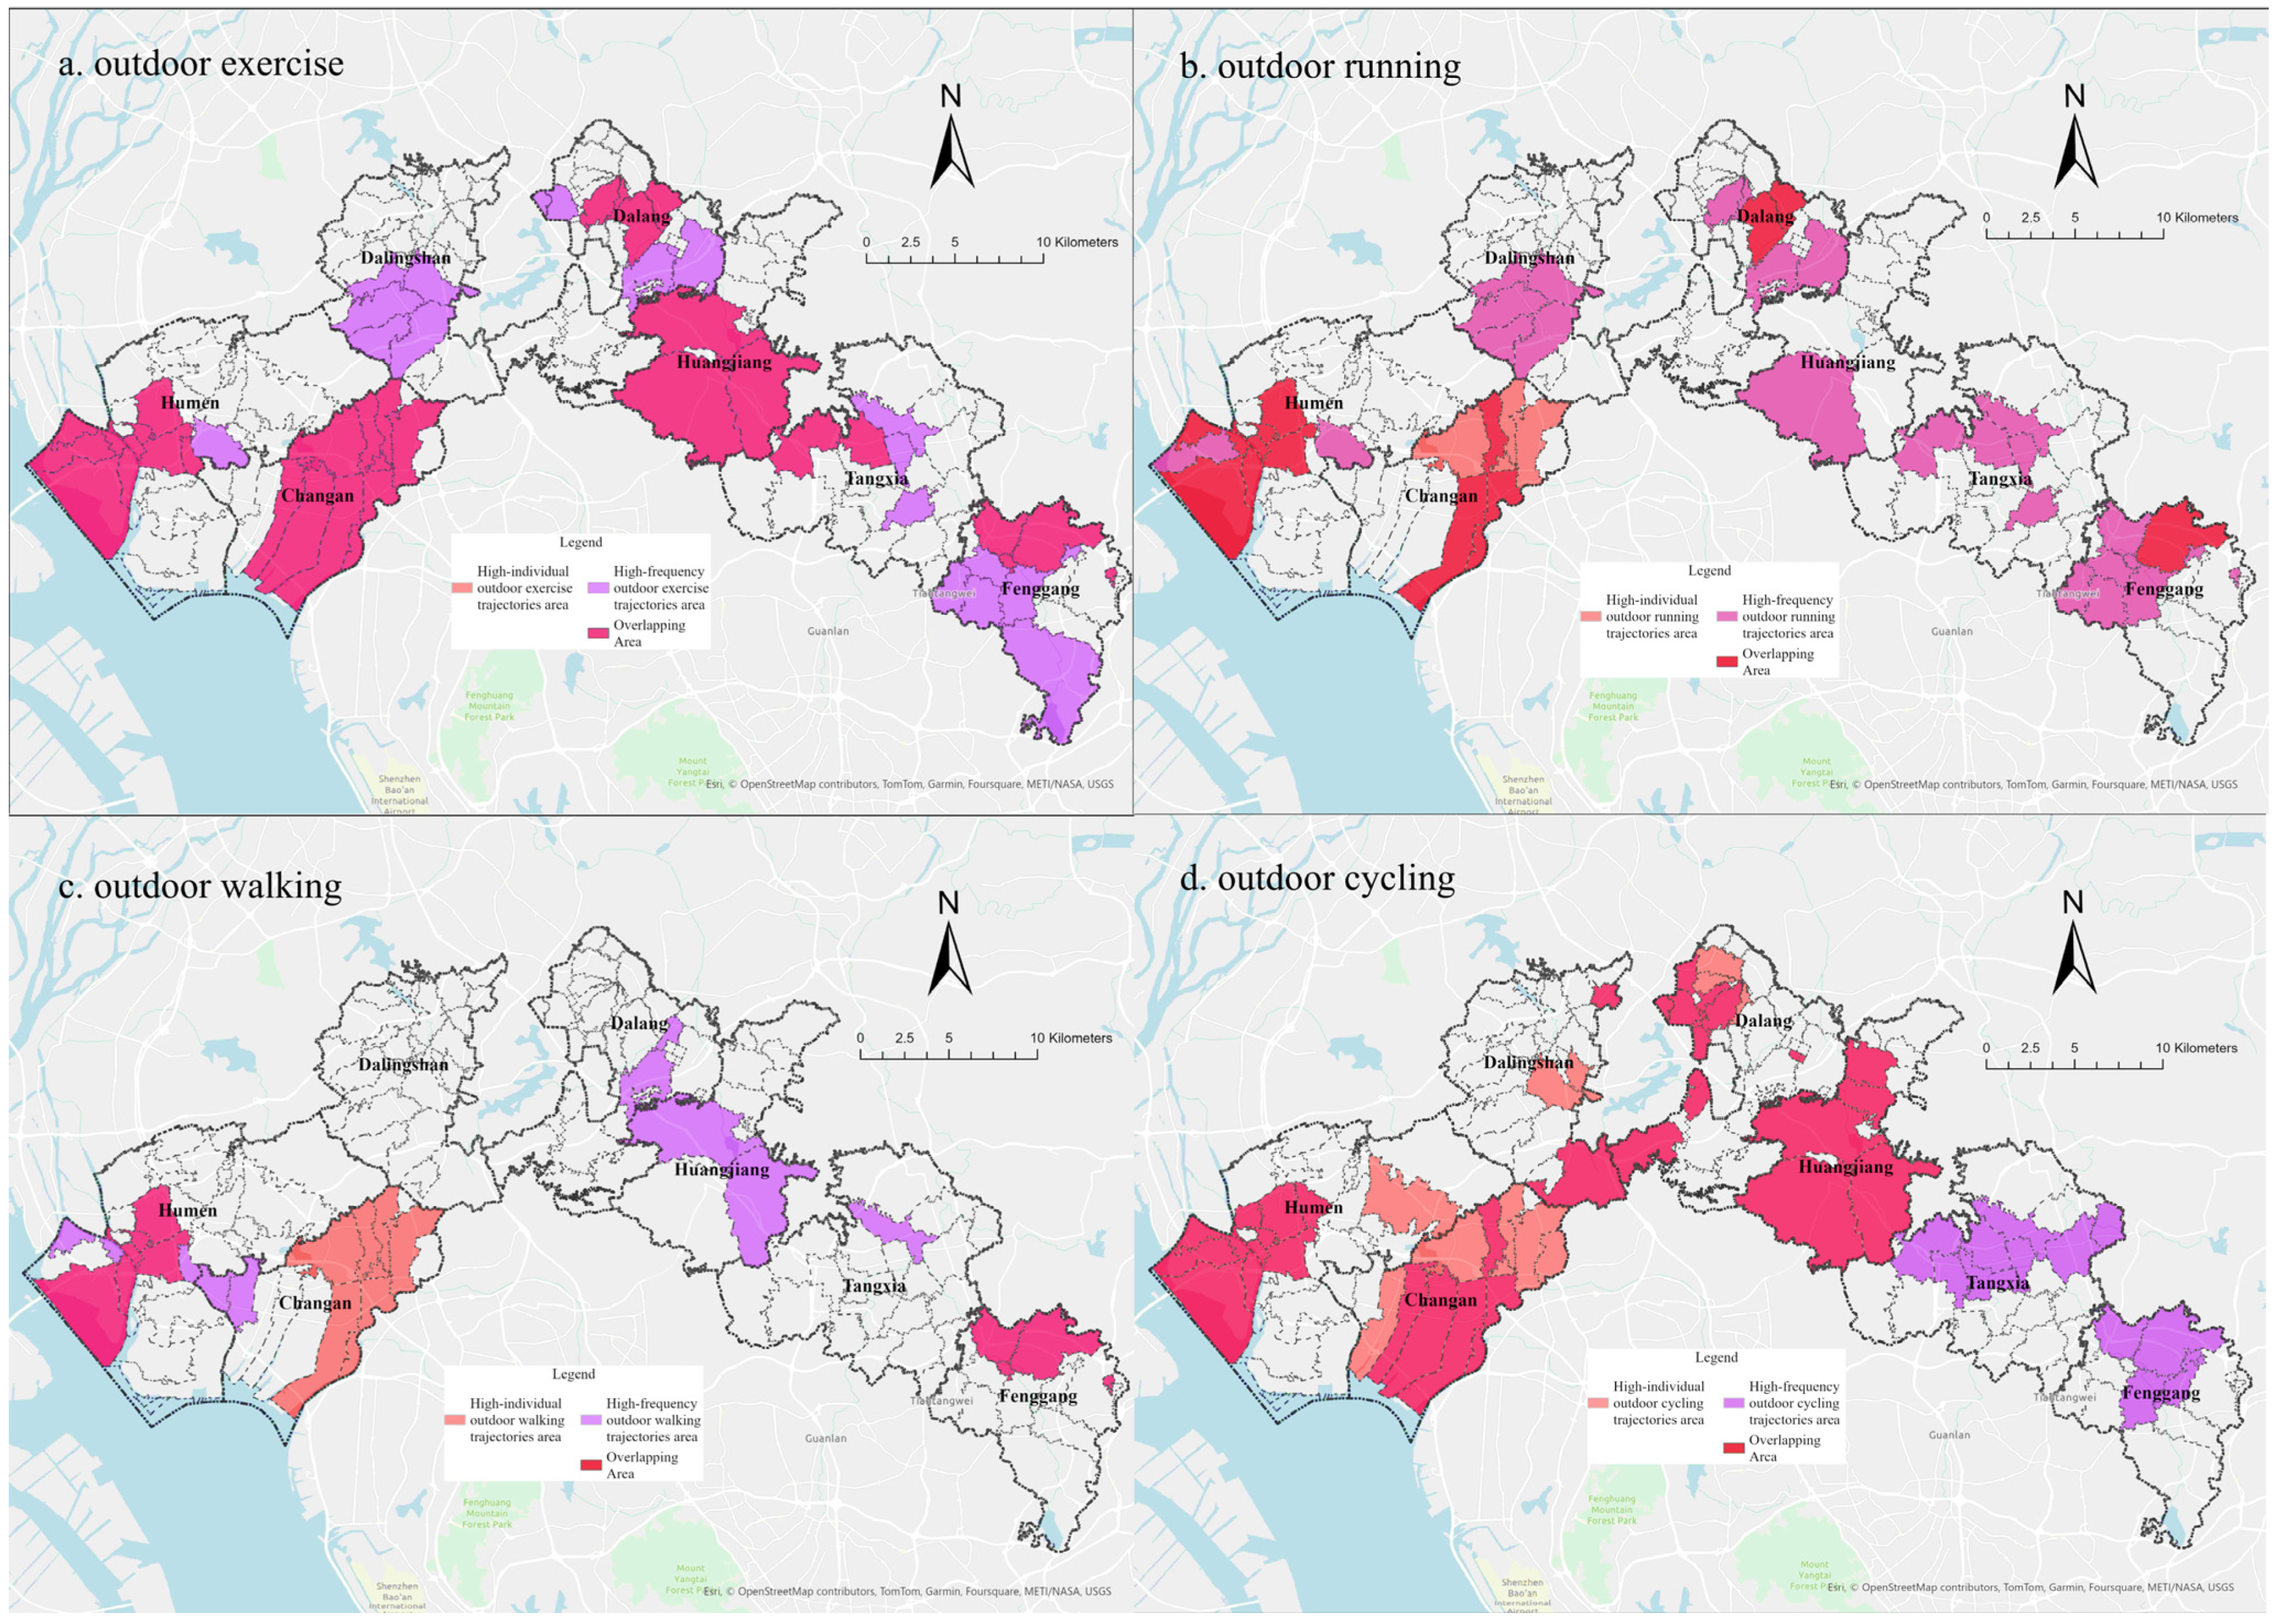
The distribution area of HIOE-TL is entirely contained within the range of HFOE-TL, showing a “core–periphery” spatial structure. HIOE-TL is concentrated in densely populated areas in the town centers of Chang’an, Humen, Dalang, and other towns, reflecting the strong attractions these areas feature for individuals, such as the completeness of public space facilities or the high accessibility of the region.
It is notable that HFOE-TL spread outward, covering southern communities/administrative villages in Dalingshan, Dalang, and Fenggang Towns, as well as the suburban areas of Tangxia Town. This reflects the diffusion and diversity of individual OE behaviors. This may be related to the industrial structure of these townships. Functional linkages between industrial clusters and the surrounding residential areas provide abundant OE opportunities for individuals. Additionally, the layout features of industrial zones and associated activities may have facilitated the diffusion of OE trajectories to some extent (Figure 5a).

3.2.2. HIOR-TL Is Concentrated in Township Centers, While HFOR-TL Has a Broader Distribution

There was significant spatial overlap between HFOR-TL and HIOR-TL. Overlapping areas were primarily concentrated in the central regions of the townships, including most communities in the towns of Humen, Chang’an, and Dalang. It is worth noting that while HIOR-TL appeared in the center of Chang’an Town, HFOR-TL did not. This suggests that despite the higher population density in this area, the frequency of OE is lower, which is possibly related to the density of activities or the layout of facilities in the region. Meanwhile, HFOR-TL showed a more extensive distribution, extending to communities and administrative villages farther from the town center, which similarly reflects the spatial expansion of OR behaviors (Figure 5b).

3.2.3. HIOW-TL and HFOW-TL Are Concentrated in Areas Rich in Natural Landscapes

There was a significant difference in the spatial distributions of HFOW-TL and HIOW-TL, with limited overlap between the two. The overlap was mainly concentrated in communities/administrative villages with dense water systems in Humen Town and areas near Forest Park in Fenggang Town. Further analysis revealed that HIOW-TL also appeared in communities near Shenzhen in Chang’an Town, which are densely populated by migrants, but do not exhibit HFOW-TL. This phenomenon may be related to the distribution of the OE environment in these areas, as well as differences in OW habits and activity frequencies. In contrast, HFOW-TL is primarily distributed along the boundary areas of towns, especially in regions with rich mountainous terrain. These areas may attract individuals to engage in more frequent OW activities due to the natural environment and good accessibility of the OE environment (Figure 5c).

3.2.4. HIOC-TL and HFOC-TL Show Cross-Regional Distribution Characteristics

There was significant overlap between HIOC-TL and HFOC-TL, which exhibited distinct cross-regional distribution characteristics. The overlap was mainly concentrated in the densely populated central areas of Humen, Chang’an, and Dalang Towns, and it appeared in the peripheral mountainous areas of Dalingshan, Dalang, and Huangjiang Towns. The mountainous terrain and road networks in these regions may provide suitable conditions for OC activity.
It is important to note that HIOC-TL is primarily distributed in the central areas of Humen, Chang’an, Dalingshan, and Dalang. Despite the significant flow of people in these areas, HFOC-TL did not appear, indicating that individuals have varying OC frequencies and habits. Additionally, in the town centers of Tangxia and Fenggang, while HFOC-TL is present, HIOC-TL is relatively scarce. This indicated that the OC in these areas was characterized by frequent repetitions by individuals, with a relatively limited number of participants (Figure 5d).

3.3. The Impact of Socioeconomic, Natural, and Built Environment Factors on Outdoor Exercise

3.3.1. Number of Migrant Populations and Waterfront Continuity Promote OE Participation

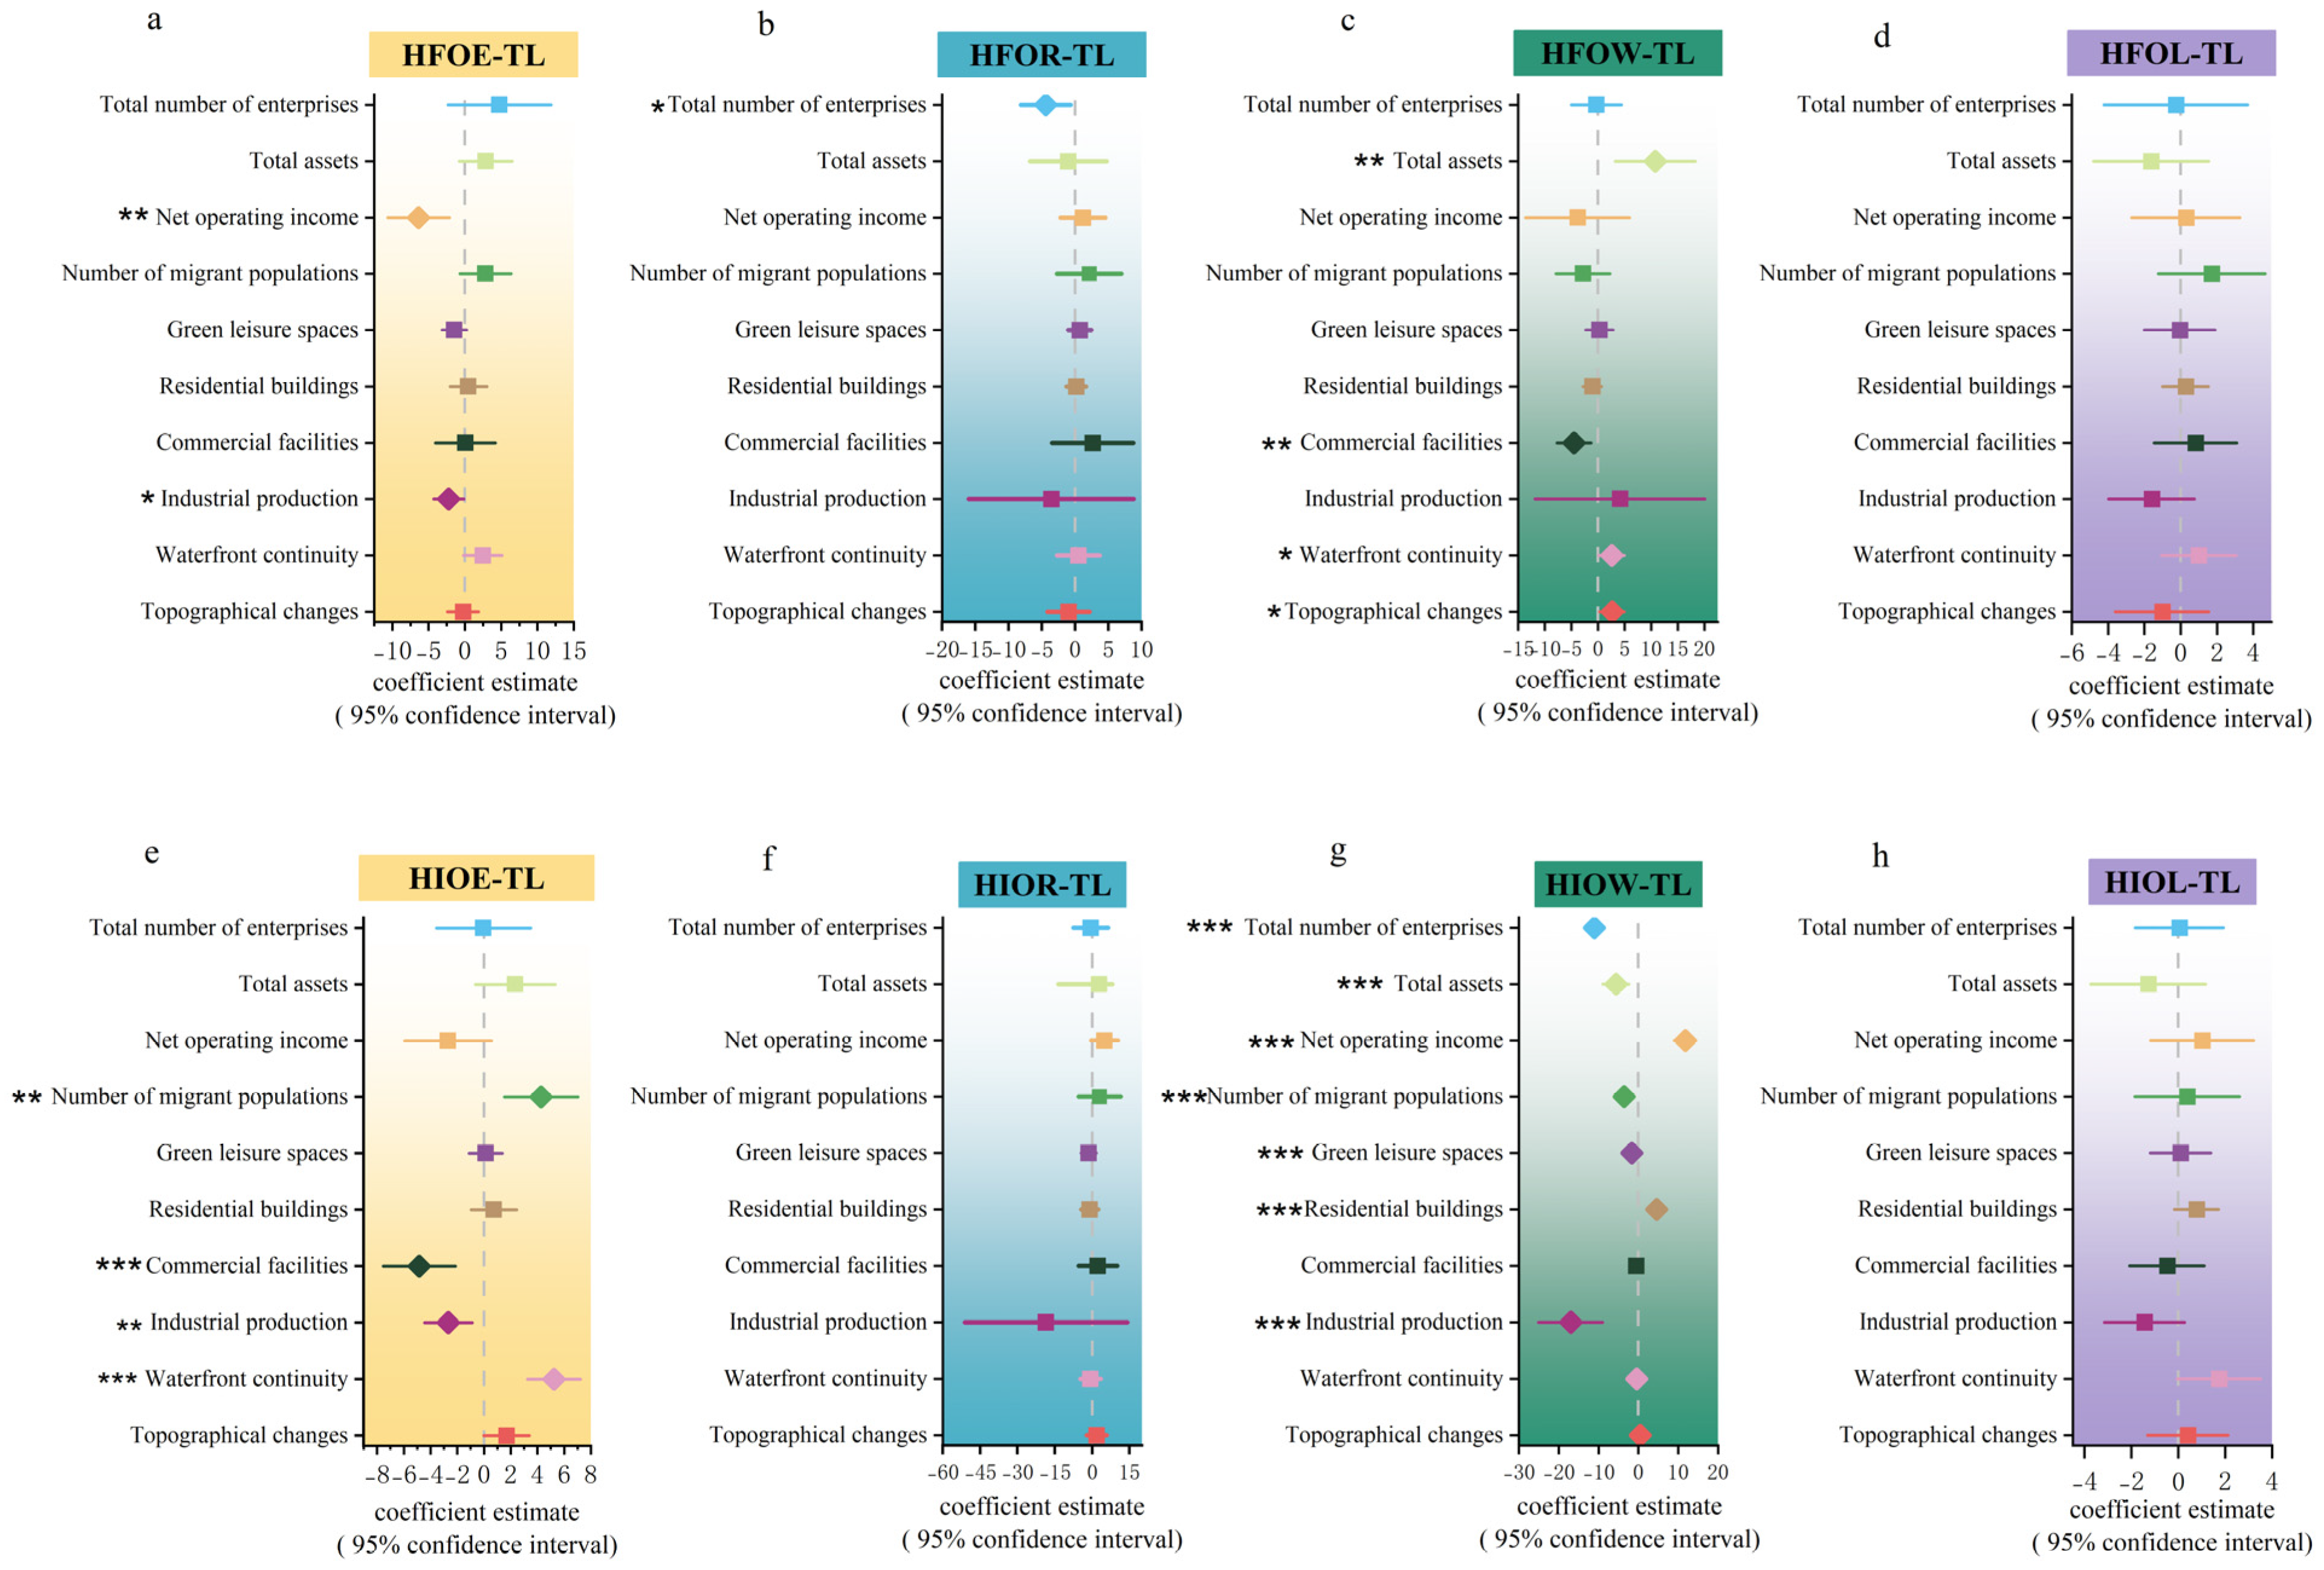
When comparing the models, the HIOE-TL model performed significantly better than the HFOE-TL model (HIOE-TL AIC = −377.804, BIC = −350.822, HFOE-TL AIC = −191.651, BIC = −172.000). Based on the HIOE-TL model, the results show that the number of migrant populations (β = 4.285, p = 0.002) and waterfront continuity (β = 5.239, p = 0.001) have a significant positive effect on OE participation. On the contrary, commercial facilities (β = −4.827, p < 0.001) and industrial production (β = −2.655, p = 0.004) show a negative effect on OE participation (Figure 6a,b).

3.3.2. Enterprise Density Has a Suppressive Impact on OR

The comparison reveals that the HFOR-TL model fits significantly better than the HIOR-TL model (HIOR-TL AIC = 19.399, BIC = 28.670, HFOR-TL AIC = −6.789, BIC = 11.875). Based on the HFOR-TL model, the results indicate that the total number of enterprises (β = −4.419, p = 0.02) has a significant negative effect on OR participation (Figure 6c,d).

3.3.3. Economic Vitality and Residential Buildings Development Promote OW Participation

Comparing the models, the HIOW-TL model performs significantly better than the HFOW-TL model (HIOW-TL AIC = −23.318, BIC = −15.649, HFOW-TL AIC = −4.454, BIC = 5.545). Therefore, based on the HIOW-TL model, the results indicate that several variables significantly affect OW participation. Among them, operating net revenue (β = 11.710, p < 0.001) and residential buildings (β = 4.560, p < 0.001) show a positive effect on OW participation. In contrast, the total number of enterprises (β = −11.108, p < 0.001), total assets (β = −5.663, p = 0.001), migrant population (β = −3.667, p < 0.001), green leisure spaces (β = −1.748, p < 0.001), and industrial production (β = −17.029, p < 0.001) all show a significant negative effect on OW participation (Figure 6e,f).

3.3.4. No Factors Show a Significant Impact on OC

The comparison shows that the HIOC-TL model fits significantly better than the HFOC-TL model (HIOC-TL AIC = −31.354, BIC = −10.791; HFOC-TL AIC = −27.045, BIC = −6.482). Therefore, based on the HIOC-TL model, the regression coefficients of all independent variables did not pass the significance test (p > 0.05), indicating that these factors did not have a statistically significant explanatory effect on OC (Figure 6g,h).

3.4. The Spatial Impact of Socioeconomic, Natural, and Built Environmental Factors on Outdoor Exercise

3.4.1. HIOC-TL and HFOC-TL Exhibited Significant Spatial Clustering

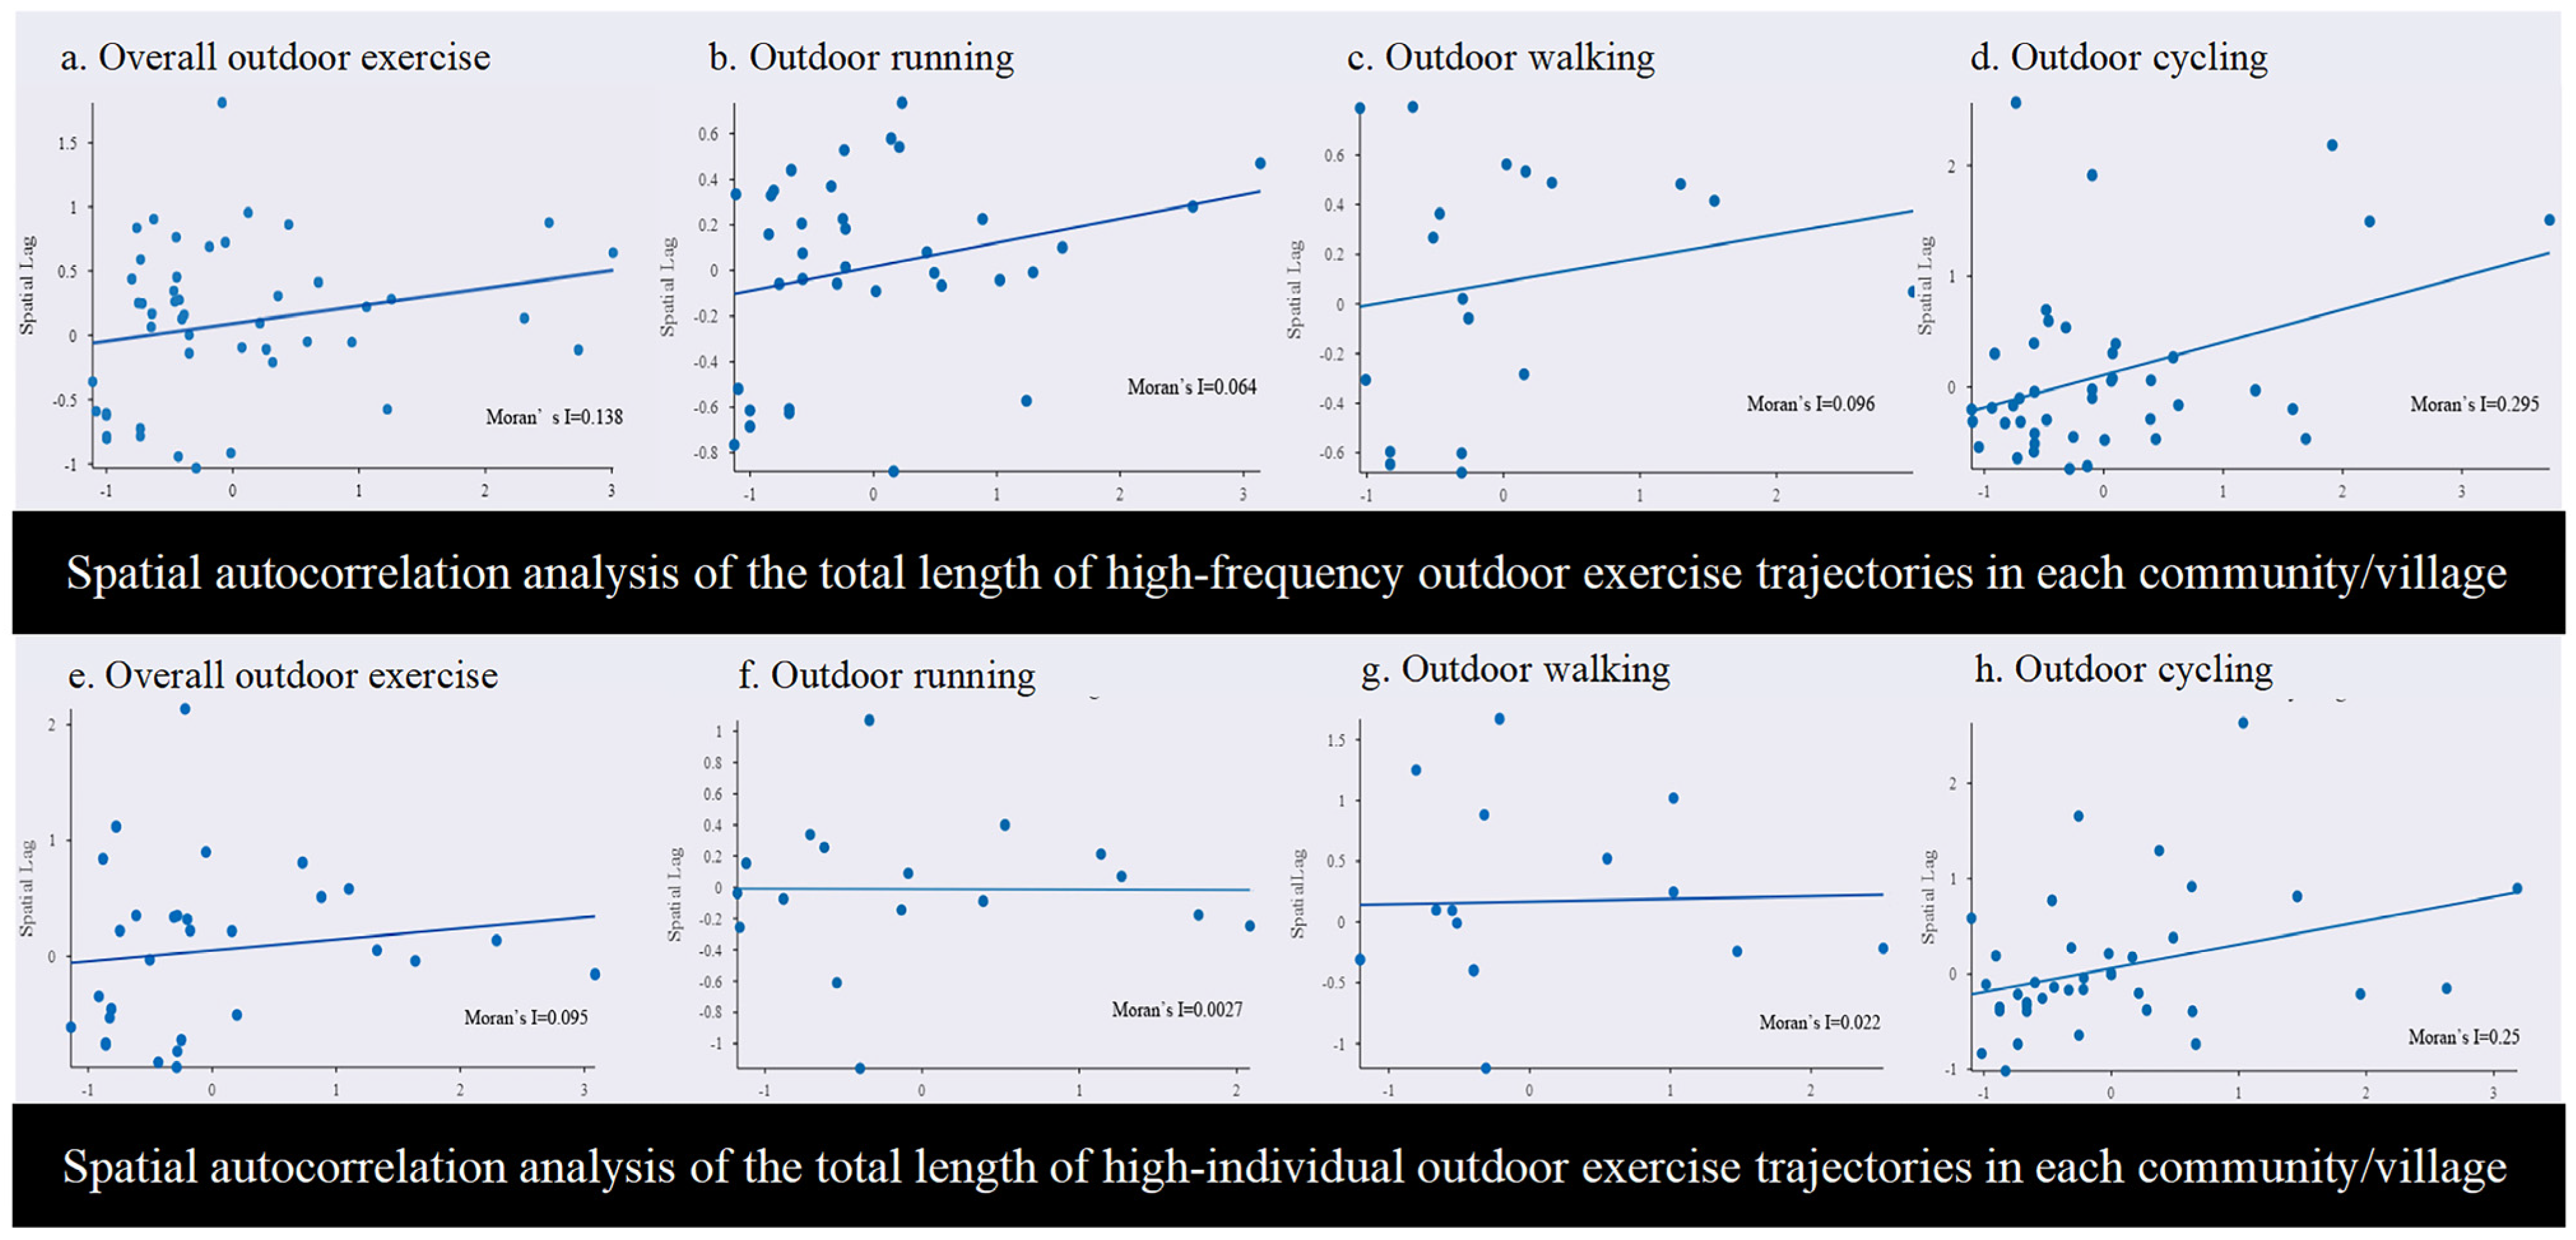
Global Moran’s I analysis was first conducted to explore the potential spatial autocorrelation between HIOE-TL and HFOE-TL. The results showed that only HIOC-TL and HFOC-TL exhibited significant spatial clustering (HFOC-TL: Moran’s I = 0.497, p < 0.001; HIOC-TL: Moran’s I = 0.288, p = 0.015) (Figure 7).

3.4.2. Operating Net Revenue and Waterfront Continuity Enhance OC Participation

SLM and SEM were compared to examine the impact of spatial autocorrelation on the regression results. The results indicated that the HIOC-TL model had a significantly better goodness of fit than the HFOC-TL model, suggesting that the HIOC-TL was more significantly influenced by spatial environmental factors.
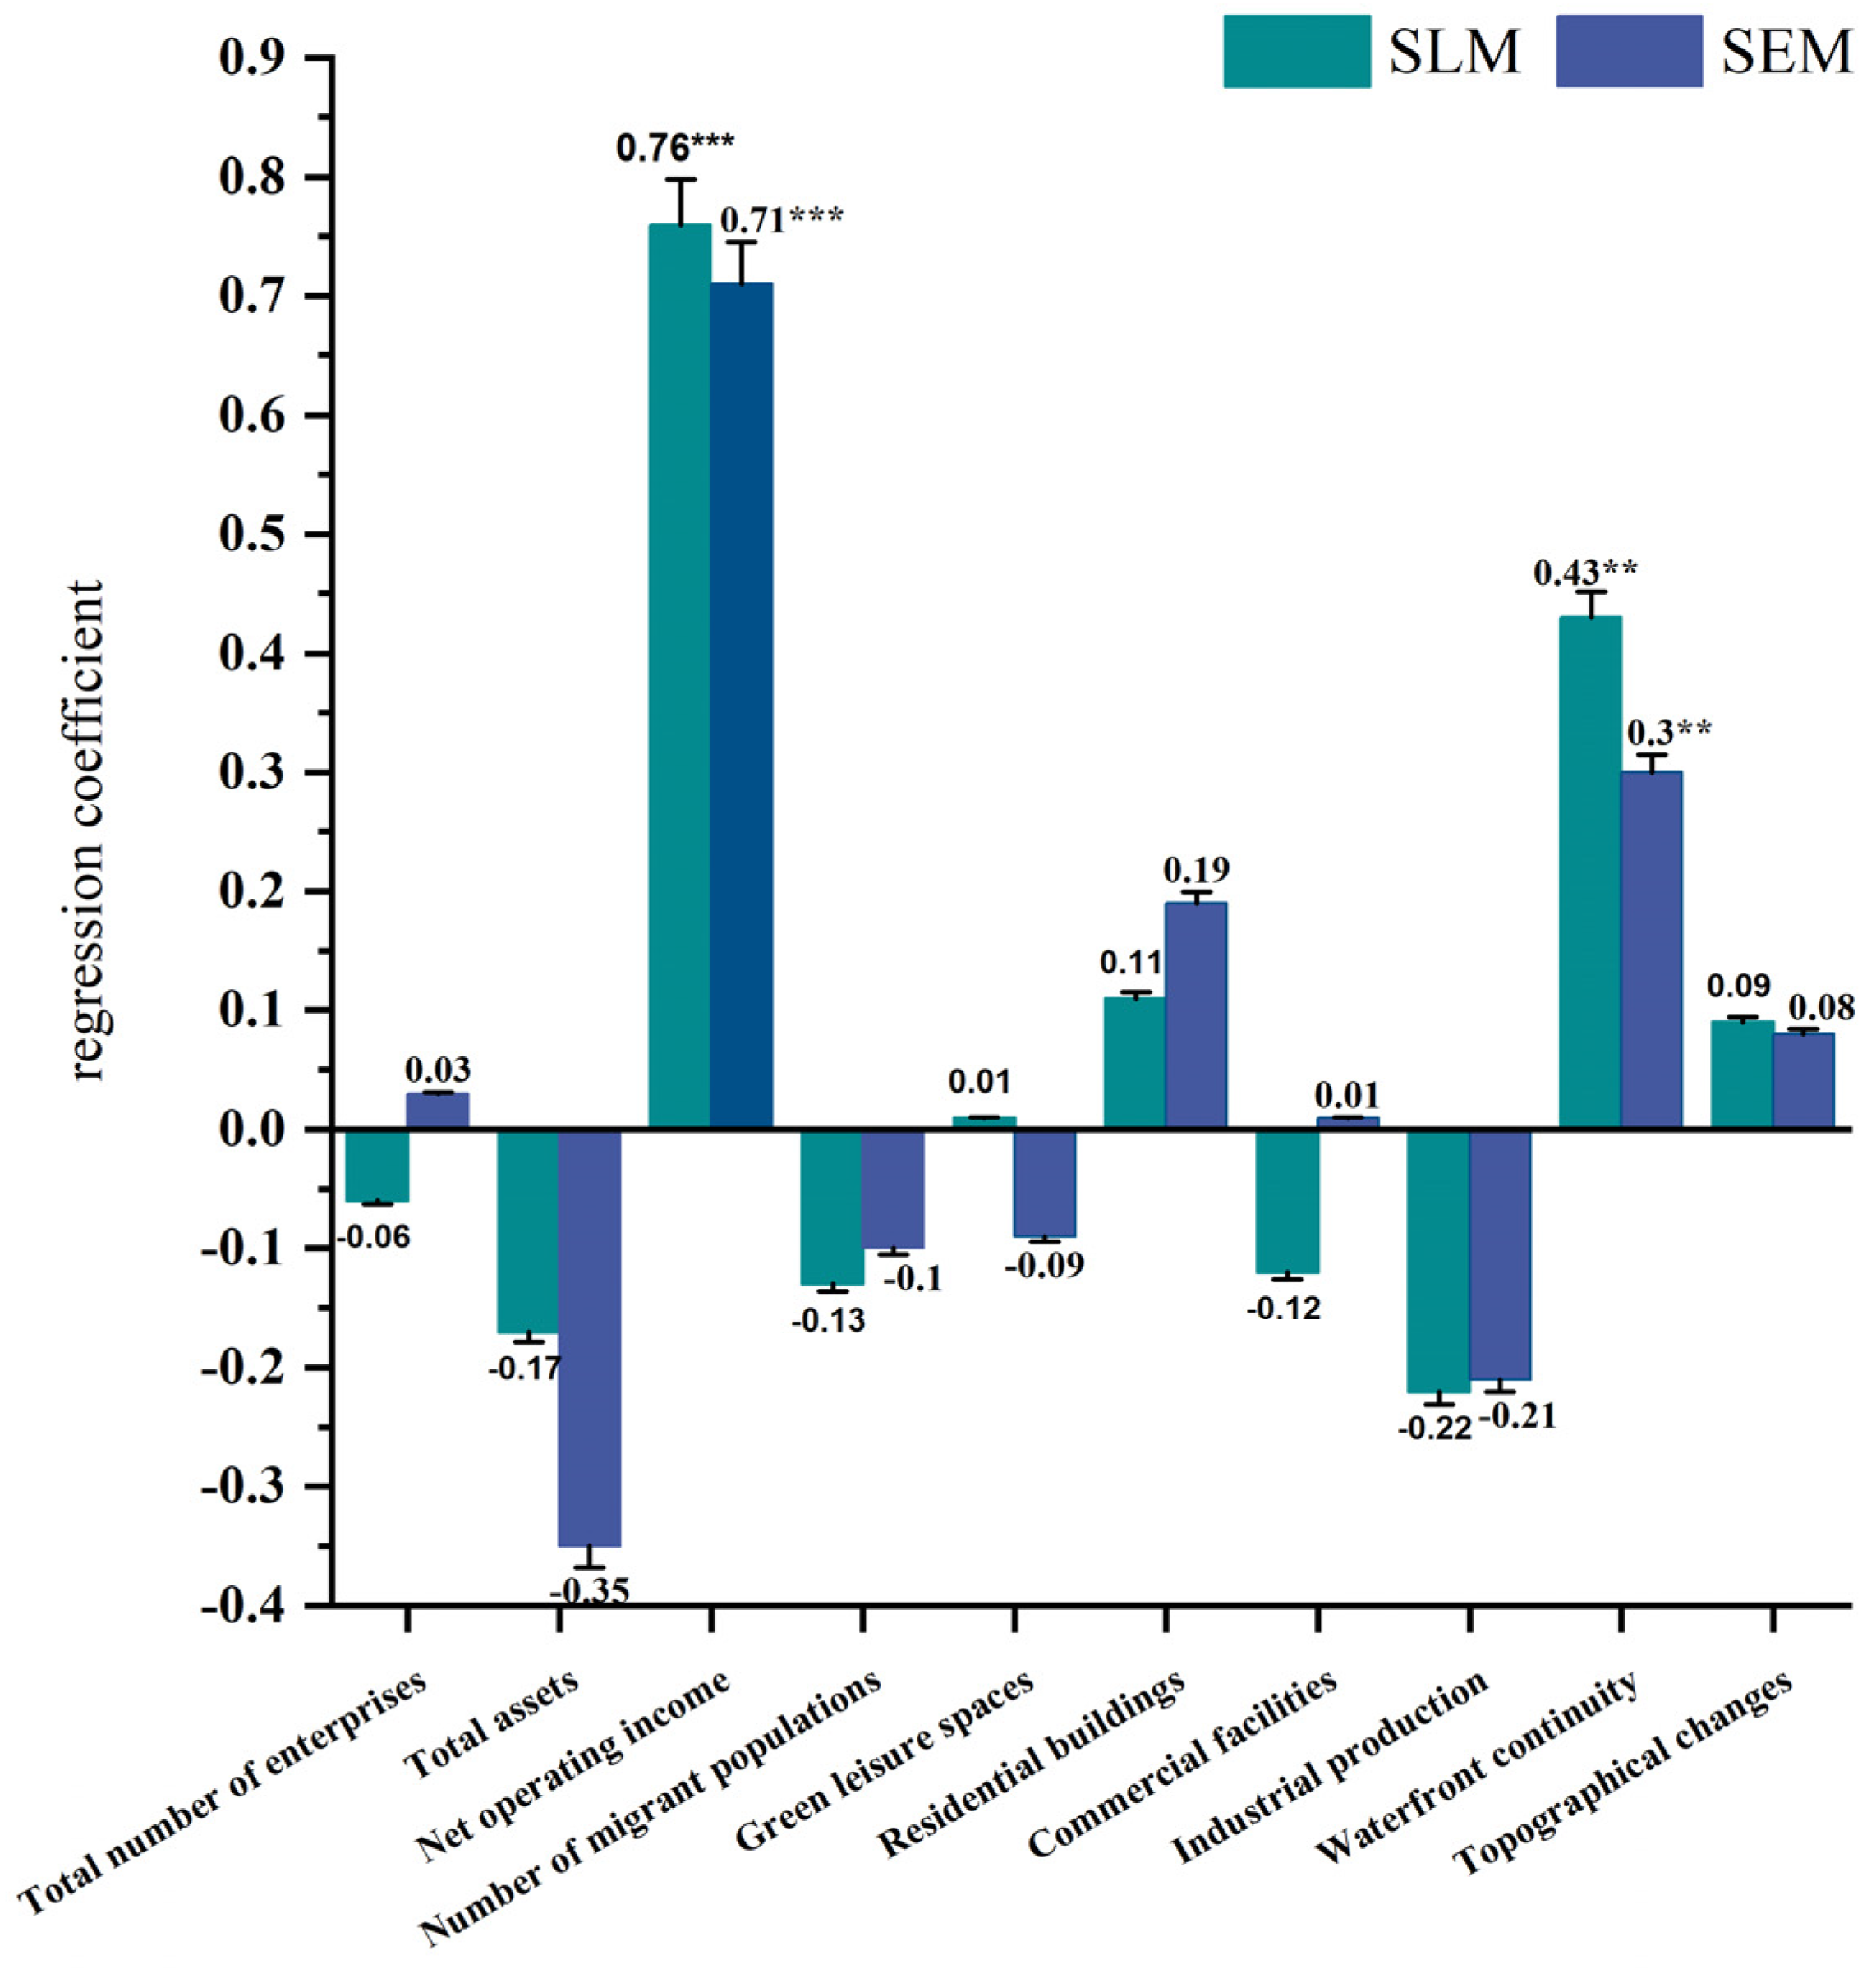
Additionally, the SLM failed to show significant spatial effects (LR = 1.4804, p > 0.05; Wald = 1.9822, p > 0.05; AIC = −19.642), whereas the SEM demonstrated significantly better fit (LR = 7.2484, p < 0.01; Wald = 15.51, p < 0.0001; AIC = −25.41). Furthermore, Moran’s I test of the SEM residuals showed no significant spatial autocorrelation (Moran’s I = −0.043, p = 0.6902), indicating that SEM effectively controlled for spatial autoregressive expansion and provided more accurate estimates.
Based on these findings, SEM was selected as the final model for further analysis of the HIOC-TL. The results indicated that operating net revenue (β = 0.762, p < 0.001) and waterfront continuity (β = 0.434, p = 0.012) have a significant positive effect on OC participation (Figure 8).

4. Discussion

4.1. Spatial Attributes and Typological Characteristics of Outdoor Exercise Behavior

The spatial distribution of outdoor exercise (OE) reflects exercisers’ active choices based on diverse needs. Unlike daily PA, which is primarily driven by utilitarian demands such as commuting or household chores, OE is guided by recreational and environmental preferences. The key difference is that OE participants view environmental quality as an essential part of their exercise experience rather than just a functional backdrop. Exercisers systematically evaluate dimensions such as safety, aesthetic value, and functional continuity to select optimal activity spaces [45]. Similar findings have been reported internationally—for example, studies in the Netherlands show that green and safe environments significantly influence OE behavior [46]. This multidimensional self-selection mechanism results in a pronounced environmental self-selection effect in OE, leading to a spatial differentiation intensity far exceeding that of other PA types. Our study extends this understanding to a high-density Chinese city, offering new insight into how the urban context shapes global health behaviors.
The spatial heterogeneity of OE arises from distinct environmental demands associated with different activity types. Centrally clustered activities (e.g., running) rely on high accessibility and well-equipped facilities, landscape-oriented activities (e.g., walking) depend on sensory stimulation from natural ecosystems, and network-dependent activities (e.g., cycling) require topological continuity in spatial connectivity. This adaptive relationship is bidirectional, reflecting both exercisers’ active selection of environments and the implicit filtering effect of environmental features on specific OE types. These results challenge the “OE spatial equalization” hypothesis [47] and complement international calls for tailored environmental design for different PA forms.

4.2. Natural and Built Environments Shape Outdoor Exercise Locations

The spatial distribution of OE is fundamentally shaped by both natural and built environments. As a typical blue space, waterfront continuity promotes health through multidimensional nature-interaction effects [48]. In many high-income countries, particularly in Europe [49] and North America [50], blue spaces often refer to naturally occurring rivers, lakes, or coastlines that provide restorative environments and support active living. In contrast, in rapidly urbanizing regions such as Dongguan, China, waterfronts are primarily artificial, shaped by land reclamation, river channelization, and infrastructure-driven development. These constructed water landscapes, though lacking the ecological richness of natural blue spaces, are integrated into the urban grid through greenways, hard embankments, and engineered water corridors. This creates a distinct model of blue space planning that combines hydrological engineering with public health objectives. The continuous waterfront space not only enhances local OE engagement but also stimulates regional cycling activity by establishing an interconnected waterway network. These findings underscore the broader role of blue infrastructure in fostering active mobility, highlighting the need for strategic planning in rapidly urbanizing areas. Waterfront development should be coordinated across administrative boundaries and adopt a watershed-scale approach that integrates ecological conservation with health services rather than being confined to localized aesthetic improvements.
Despite their artificial nature, Dongguan’s waterfronts have been actively repurposed as recreational corridors that support daily exercise activities such as running, walking, and cycling. Their linear layout and continuity along densely populated districts provide accessible and safe spaces for OE, especially in environments where open green space is limited. This finding demonstrates that even highly modified urban environments can be transformed into effective health-supportive infrastructure through intentional spatial design. It also expands the global discourse on blue spaces by illustrating how non-natural, engineered water environments can fulfill similar psychosocial and behavioral functions when properly integrated with the built environment.
This study also highlights the complex influence of built environment zoning on OE behavior. Research has shown that physical activity is positively associated with mixed land use, walkable environments, and visually appealing settings. This suggests that neighborhoods integrating residential, industrial, and waterfront elements can encourage greater engagement in walking and cycling. Moreover, even in the absence of physical activity, well-designed natural environments offer significant health benefits [51]. According to the biophilia hypothesis and attention restoration theory, humans have an inherent affinity for nature, which can help restore cognitive capacity and alleviate stress [52]. As urbanization in China transitions from quantitative expansion to qualitative improvement, establishing a synergy between economic growth and health promotion becomes imperative [53]. Integrating “health performance” criteria into land use regulations can ensure that urbanization prioritizes human well-being from the outset [54].

4.3. Socioeconomic Mediation and Governance Transformation

Socioeconomic development significantly enhances OE participation by strengthening the capacity of grassroots governance units. This mediation occurs through two interconnected pathways. The first pathway is the allocation of economic resources to localized infrastructure development; the second pathway is the adaptive responsiveness of these organizations to community-specific needs. Unlike traditional top-down administrative models, empowered grassroots governance units leverage socioeconomic assets—such as land revenues and community funds—to implement spatially targeted interventions. For instance, in Dongguan, these organizations prioritize investments in adaptive greenway networks and multifunctional recreational spaces, directly addressing demographic shifts induced by migrant populations.
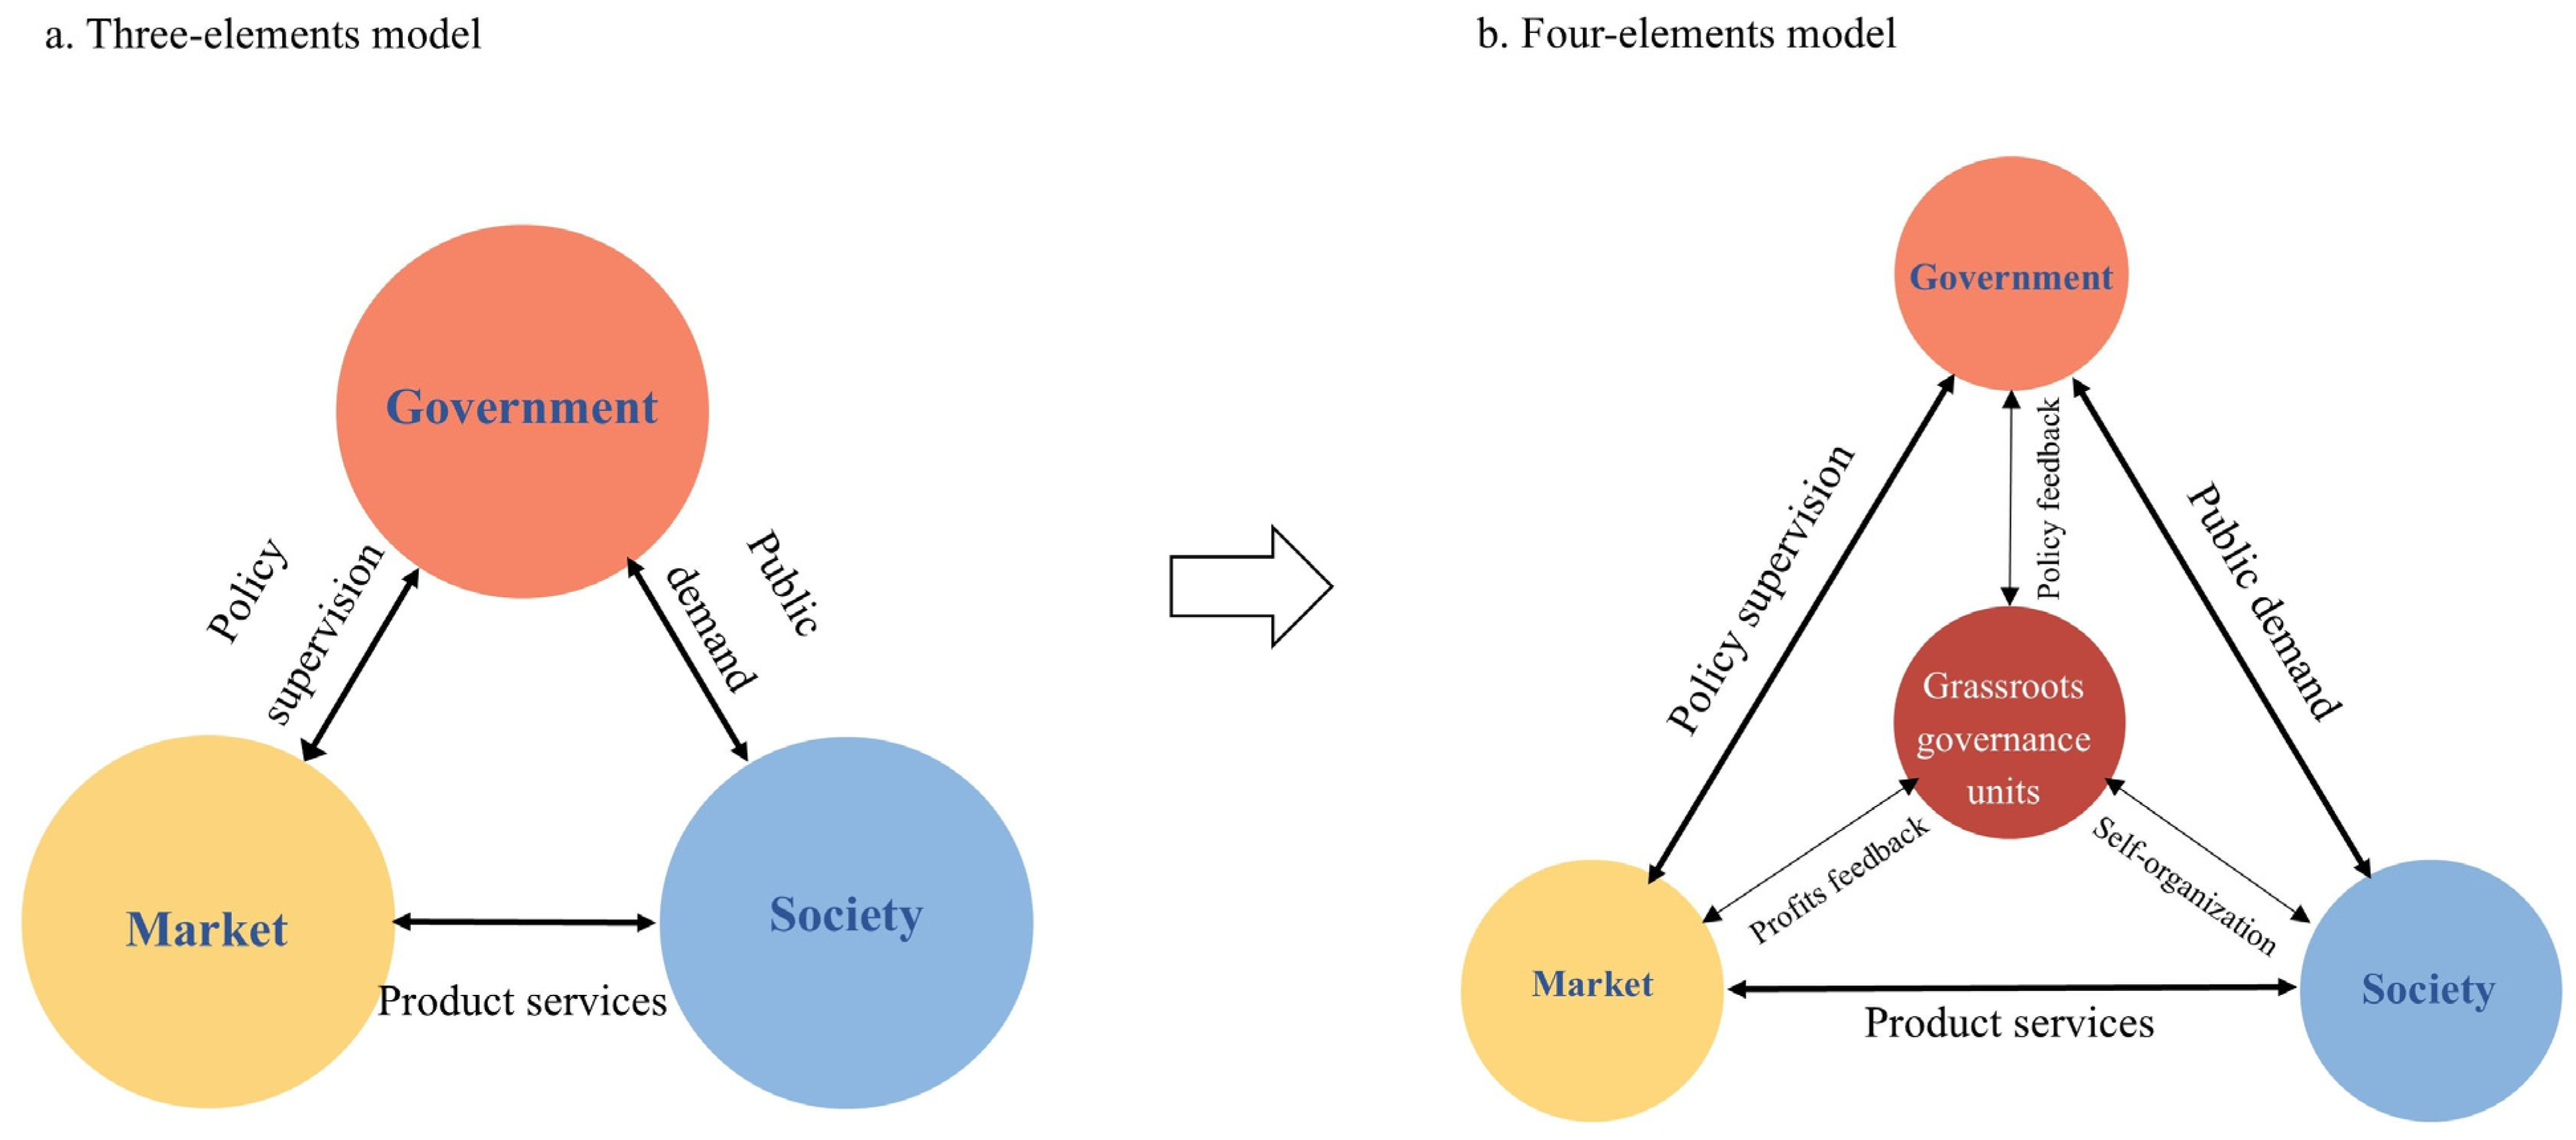
China’s urban governance has traditionally relied on a tripartite framework of government, market, and society (Figure 9a). However, its linear policy supervision mechanisms struggle to address the complex demands of rapid urbanization [55]. The innovative practice in Dongguan demonstrates that incorporating grassroots governance units as a fourth governance entity fosters a more adaptive and collaborative governance model. In this four-element governance framework (Figure 9b), the government shifts from a top-down regulator to a policy facilitator, the market provides specialized services while responding to community needs, and society channels diverse public demands. Meanwhile, compared to many high-income countries that primarily depend on market-based public service provision [56], China’s model emphasizes the coordinated intervention of the state and grassroots forces. Grassroots governance units, embedded in local contexts, act as key intermediaries that integrate fragmented governance demands into unified implementation frameworks, thereby offering more rapid and inclusive service delivery in transitional neighborhoods.
The grassroots governance units also play the role of a collective economic organization in China. This ensures a balance between economic growth and public health, not only implementing government policies but also conveying community needs to the market while translating social demands into concrete service initiatives. This shift from hierarchical control to networked coordination represents a fundamental institutional innovation, offering a practical model for resolving the longstanding trade-off between economic expansion and health promotion [57].

4.4. Spatial Spillovers Effects of Socioeconomic, Natural, and Built Environment Factors on Outdoor Exercise

Traditional statistical models that ignore spatial dependence often underestimate the spatial spillover effects of socioeconomic, natural, and built environment factors on OE. Our analysis reveals that the spatial spillover effects of environmental factors are particularly significant for certain types of OE, especially OC. For instance, variables such as waterfront continuity and net operating revenue show no statistical significance under conventional generalized linear models, yet they become significant when spatial regression models are applied.
These findings have important implications for both health geography research and public policy. In rapidly urbanizing regions, researchers must conduct spatial autocorrelation tests (e.g., Moran’s I) to avoid model misspecification, and analytical approaches should be tailored to the unique characteristics of different OE. For example, spatial regression models are crucial for capturing the networked nature of OC, whereas conventional models may suffice for more localized activities like OW.
From a policy perspective, our results suggest that traditional evaluation methods may undervalue the benefits of cross-regional investments, such as greenway networks or public leisure infrastructure. To improve planning and decision making, regional strategies should explicitly incorporate the spatial spillover effects of environmental factors on OE. This includes defining a spillover radius for coordinated planning, integrating spatial interaction terms into health impact assessments, and establishing cross-regional data-sharing protocols to support spatial econometric analyses.

4.5. Limitations and Prospects

This study has several limitations that suggest directions for future research. First, the app-based data mainly represent younger, digitally engaged individuals, while elderly and disabled populations are likely underrepresented due to physical, cognitive, or technological barriers [58]. This selective sample may restrict the generalizability of the findings. Future research should adopt targeted sampling or collaborate with community health organizations worldwide to better reflect the activity patterns of underrepresented groups.
Second, although this study focuses on OE, other important lifestyle factors related to health, including sleep quality, nutrition, access to green spaces, and social interaction, were not addressed. These factors often interact with PA and contribute significantly to overall well-being. International research, such as studies from Europe and North America, has increasingly emphasized the integration of multi-dimensional health indicators through wearable devices, which could provide real-time monitoring and a more comprehensive understanding of environment–health behavior relationships [59].
Third, psychological and social influences, such as perceptions of safety, personal motivation, cultural norms, and social support, were not examined. These aspects can greatly affect participation in outdoor activities, especially among vulnerable populations. Future studies could use interviews, surveys, or behavioral assessments to explore these dimensions more deeply.
Finally, the analysis identified spatial associations between OE and environmental characteristics but did not investigate the underlying behavioral mechanisms. The environmental framework proposed here is based on Dongguan’s specific institutional context, which is characterized by collective land ownership and local governance. Its applicability in other cities with different governance systems, such as centralized or participatory models, remains unclear. Future research should also apply advanced analytical methods, including non-linear modeling and controlled experimental designs, to capture complex relationships and strengthen causal inference in urban health research [60].

5. Conclusions

This study contributes to understanding how the built environment supports health-oriented physical activity in rapidly urbanizing regions. Drawing on app-based trajectory data, environmental indicators, and spatial modeling, it examines the spatial distribution and driving mechanisms of outdoor exercise, focusing on running, walking, and cycling.
The results reveal distinct spatial patterns: running clusters in urban centers, walking is concentrated in natural landscape zones, and cycling exhibits cross-regional, network-based movements. Built, natural, and socioeconomic factors show differentiated effects. Waterfront continuity and a high proportion of migrant populations promote overall outdoor exercise participation, while enterprise density discourages running. Walking is positively associated with residential land use and grassroots governance income. Notably, spatial regression shows that the effects of governance income and waterfront connectivity on cycling only emerge when spatial dependence is considered.
In contrast to studies in high-income countries, where natural blue spaces are prevalent, Dongguan’s urban environment combines artificial and natural features. China’s governance model relies on grassroots organizations that coordinate spatial interventions with state support, differing from the decentralized, market-led approaches common in Europe and North America. This provides valuable insights for other rapidly developing cities facing similar challenges.

Author Contributions

Conceptualization, C.G. and F.Y.; methodology, C.G. and F.Y.; software, C.G.; validation, C.G. and F.Y.; formal analysis, C.G. and F.Y.; investigation, C.G. and H.W.; resources, C.G.; data curation, C.G.; writing—original draft preparation, C.G. and F.Y.; writing—review and editing, F.Y. and L.X.; visualization, H.W. and L.X.; supervision, F.Y.; project administration, C.G. and F.Y.; funding acquisition, F.Y. and C.G. All authors have read and agreed to the published version of the manuscript.

Funding

This research was funded by the National Natural Science Foundation of China, grant number 51778436, as well as Guangdong Province Philosophy and Social Sciences Planning Project, grant number GD22YTY01.

Data Availability Statement

The datasets generated and/or analyzed during the current study are available in the figshare repository: https://doi.org/10.6084/m9.figshare.29108897.

Acknowledgments

The authors acknowledge the valuable feedback provided by the anonymous reviewers.

Conflicts of Interest

The authors declare no conflicts of interest.

Abbreviations

The following abbreviations are used in this manuscript:
PAphysical activity
OEoutdoor exercise
ORoutdoor running
OWoutdoor walking
OCoutdoor cycling
HFOE-TLthe total trajectory lengths of high- frequency outdoor exercise
HIOE-TLthe total trajectory lengths of high- individual outdoor exercise
HFOR-TLthe total trajectory lengths of high- frequency outdoor running
HIOR-TLthe total trajectory lengths of high-individual outdoor running
HFOW-TLthe total trajectory lengths of high- frequency outdoor walking
HIOW-TLthe total trajectory lengths of high- individual outdoor walking
HFOC-TLthe total trajectory lengths of high-frequency outdoor cycling
HIOC-TLthe total trajectory lengths of high-individual outdoor cycling
GLMgeneralized linear model
SLMspatial lag model
SEMspatial error model

References

  1. Beaglehole, R.; Horton, R. Chronic diseases: Global action must match global evidence. Lancet 2010, 376, 1619–1621. [Google Scholar] [CrossRef] [PubMed]
  2. Nick Banatvala, P.B. Noncommunicable Diseases: A Compendium; Routledge: London, UK, 2023; pp. 11–12. [Google Scholar]
  3. Wang, Y.; Wang, J. Modelling and prediction of global non-communicable diseases. BMC Public Health 2020, 20, 822. [Google Scholar] [CrossRef] [PubMed]
  4. Wongsingha, N.; Widyastari, D.A.; Chokthananukoon, B.; Rasri, N.; Katewongsa, P. Assessing physical activity promotion in different settings and how its associated with public participation during COVID-19 epidemic: Evidence from national policy evaluation. BMC Public Health 2023, 23, 1775. [Google Scholar] [CrossRef] [PubMed]
  5. Isath, A.; Koziol, K.J.; Martinez, M.W.; Garber, C.E.; Martinez, M.N.; Emery, M.S.; Baggish, A.L.; Naidu, S.S.; Lavie, C.J.; Arena, R.; et al. Exercise and cardiovascular health: A state-of-the-art review. Prog. Cardiovasc. Dis. 2023, 79, 44–52. [Google Scholar] [CrossRef]
  6. Neale, R.E.; Lucas, R.M.; Byrne, S.N.; Hollestein, L.; Rhodes, L.E.; Yazar, S.; Young, A.R.; Berwick, M.; Ireland, R.A.; Olsen, C.M. The effects of exposure to solar radiation on human health. Photochem. Photobiol. Sci. 2023, 22, 1011–1047. [Google Scholar] [CrossRef]
  7. Wicks, C.; Barton, J.; Orbell, S.; Andrews, L. Psychological benefits of outdoor physical activity in natural versus urban environments: A systematic review and meta-analysis of experimental studies. Appl. Psychol. Health Well Being 2022, 14, 1037–1061. [Google Scholar] [CrossRef]
  8. Niazi, Z.; Khan, M.A. Greening South Asian cities for health: A study of urban green space usage and physical well-being. Environ. Dev. Sustain. 2024. [Google Scholar] [CrossRef]
  9. Gong, F. Modeling walking accessibility to urban parks using Google Maps crowdsourcing database in the high-density urban environments of Hong Kong. Sci. Rep. 2023, 13, 20798. [Google Scholar] [CrossRef]
  10. Steinacker, C.; Storch, D.M.; Timme, M.; Schröder, M. Demand-driven design of bicycle infrastructure networks for improved urban bikeability. Nat. Comput. Sci. 2022, 2, 655–664. [Google Scholar] [CrossRef]
  11. Organization, W.H. Assessing the Value of Urban Green and Blue Spaces for Health and Well-Being; WHO Regional Office for Europe: Copenhagen, Denmark, 2023; pp. 32–69. [Google Scholar]
  12. Brownlee, T.D.; Camaioni, C.; Magaudda, S.; Mugnoz, S.; Pellegrino, P. The INTERREG Italy-Croatia Joint_SECAP Project: A Collaborative Approach for Adaptation Planning. Sustainability 2022, 14, 404. [Google Scholar] [CrossRef]
  13. Olive, R.; Wheaton, B. Understanding Blue Spaces: Sport, Bodies, Wellbeing, and the Sea. J. Sport. Soc. Issues 2020, 45, 3–19. [Google Scholar] [CrossRef]
  14. Nieuwenhuijsen, M.J. New urban models for more sustainable, liveable and healthier cities post covid19; reducing air pollution, noise and heat island effects and increasing green space and physical activity. Environ. Int. 2021, 157, 106850. [Google Scholar] [CrossRef]
  15. Mavoa, S.; Davern, M.; Breed, M.; Hahs, A. Higher levels of greenness and biodiversity associate with greater subjective wellbeing in adults living in Melbourne, Australia. Health Place 2019, 57, 321–329. [Google Scholar] [CrossRef] [PubMed]
  16. Zijlema, W.L.; Stasinska, A.; Blake, D.; Dirgawati, M.; Flicker, L.; Yeap, B.B.; Golledge, J.; Hankey, G.J.; Nieuwenhuijsen, M.; Heyworth, J. The longitudinal association between natural outdoor environments and mortality in 9218 older men from Perth, Western Australia. Environ. Int. 2019, 125, 430–436. [Google Scholar] [CrossRef] [PubMed]
  17. Venter, Z.S.; Barton, D.N.; Gundersen, V.; Figari, H.; Nowell, M.S. Back to nature: Norwegians sustain increased recreational use of urban green space months after the COVID-19 outbreak. Landsc. Urban. Plan. 2021, 214, 104175. [Google Scholar] [CrossRef]
  18. Ding, D.; Nguyen, B.; Learnihan, V.; Bauman, A.E.; Davey, R.; Jalaludin, B.; Gebel, K. Moving to an active lifestyle? A systematic review of the effects of residential relocation on walking, physical activity and travel behaviour. Br. J. Sports Med. 2018, 52, 789–799. [Google Scholar] [CrossRef]
  19. Smith, M.; Hosking, J.; Woodward, A.; Witten, K.; MacMillan, A.; Field, A.; Baas, P.; Mackie, H. Systematic literature review of built environment effects on physical activity and active transport–an update and new findings on health equity. Int. J. Behav. Nutr. Phys. Act. 2017, 14, 158. [Google Scholar] [CrossRef]
  20. Kärmeniemi, M.; Lankila, T.; Ikäheimo, T.; Koivumaa-Honkanen, H.; Korpelainen, R. The Built Environment as a Determinant of Physical Activity: A Systematic Review of Longitudinal Studies and Natural Experiments. Ann. Behav. Med. 2018, 52, 239–251. [Google Scholar] [CrossRef]
  21. Eriksson, U.; Arvidsson, D.; Sundquist, K. Availability of exercise facilities and physical activity in 2,037 adults: Cross-sectional results from the Swedish neighborhood and physical activity (SNAP) study. BMC Public Health 2012, 12, 607. [Google Scholar] [CrossRef]
  22. Aryan, Y.; Dikshit, A.K.; Shinde, A.M. A critical review of the life cycle assessment studies on road pavements and road infrastructures. J. Environ. Manage. 2023, 336, 117697. [Google Scholar] [CrossRef]
  23. Diener, A.C.; Hagen, J. Geographies of place attachment: A place-based model of materiality, performance, and narration. Geogr. Rev. 2022, 112, 171–186. [Google Scholar] [CrossRef]
  24. Shin, H.; Sharma, A.; Nicolau, J.L.; Lee, J. Transformative Outcomes of Workcation: Satisfaction, Place Attachment, and Behavioral Intentions. J. Travel. Res. 2025, 00472875251318317. [Google Scholar] [CrossRef]
  25. Armstrong, S.; Wong, C.A.; Perrin, E.; Page, S.; Sibley, L.; Skinner, A. Association of Physical Activity With Income, Race/Ethnicity, and Sex Among Adolescents and Young Adults in the United States: Findings From the National Health and Nutrition Examination Survey, 2007–2016. JAMA Pediatr. 2018, 172, 732–740. [Google Scholar] [CrossRef]
  26. Kari, J.T.; Viinikainen, J.; Böckerman, P.; Tammelin, T.H.; Pitkänen, N.; Lehtimäki, T.; Pahkala, K.; Hirvensalo, M.; Raitakari, O.T.; Pehkonen, J. Education leads to a more physically active lifestyle: Evidence based on Mendelian randomization. Scand. J. Med. Sci. Sports 2020, 30, 1194–1204. [Google Scholar] [CrossRef] [PubMed]
  27. Katzmarzyk, P.T.; Friedenreich, C.; Shiroma, E.J.; Lee, I.-M. Physical inactivity and non-communicable disease burden in low-income, middle-income and high-income countries. Br. J. Sports Med. 2022, 56, 101–106. [Google Scholar] [CrossRef]
  28. Shuval, K.; Li, Q.; Gabriel, K.P.; Tchernis, R. Income, physical activity, sedentary behavior, and the ‘weekend warrior’ among U.S. adults. Prev. Med. 2017, 103, 91–97. [Google Scholar] [CrossRef] [PubMed]
  29. Yang, F.; Ge, C.; Wang, J. Progress, limitations, and prospects for improvement in understanding the impact of urban built environment on residents’ leisure-time physical activity in China: A systematic review. J. Chin. Arch. Urban. 2024, 6, 2427. [Google Scholar] [CrossRef]
  30. Heritage, Z.; Green, G. European national healthy city networks: The impact of an elite epistemic community. J. Urban. Health 2013, 90 (Suppl. S1), 154–166. [Google Scholar] [CrossRef]
  31. Kloss, R.F.; Lorca, J.C.; Rivera, A.R.; Saldaña, B.F.; de Victo, E.R.; Ferrari, G. Perceived neighborhood built environment and physical activity in urban population in Chile. BMC Public Health 2025, 25, 969. [Google Scholar] [CrossRef]
  32. Müller, C.; Paulsen, L.; Bucksch, J.; Wallmann-Sperlich, B. Built and natural environment correlates of physical activity of adults living in rural areas: A systematic review. Int. J. Behav. Nutr. Phys. Act. 2024, 21, 52. [Google Scholar] [CrossRef]
  33. Mepparambath, R.M.; Le, D.T.T.; Oon, J.; Song, J.; Huynh, H.N. Influence of the built environment on social capital and physical activity in Singapore: A structural equation modelling analysis. Sustain. Cities Soc. 2024, 103, 105259. [Google Scholar] [CrossRef]
  34. Liu, Z.; Kemperman, A.; Timmermans, H. Correlates of frequency of outdoor activities of older adults: Empirical evidence from Dalian, China. Travel. Behav. Soc. 2021, 22, 108–116. [Google Scholar] [CrossRef]
  35. García de Jalón, S.; Chiabai, A.; Quiroga, S.; Suárez, C.; Ščasný, M.; Máca, V.; Zvěřinová, I.; Marques, S.; Craveiro, D.; Taylor, T. The influence of urban greenspaces on people’s physical activity: A population-based study in Spain. Landsc. Urban. Plan. 2021, 215, 104229. [Google Scholar] [CrossRef]
  36. Ge, C.; Yang, F. Patterns of spatial concentration and drivers of China’s migrant population: Evidence from the Greater Bay Area hinterland. Humanit. Soc. Sci. Commun. 2025, 12, 381. [Google Scholar] [CrossRef]
  37. Statistics, D.B.o. Dongguan Statistical Yearbook 2023; China Statistic Press: Beijing, China, 2023; pp. 15–37. [Google Scholar]
  38. Strain, T.; Wijndaele, K.; Garcia, L.; Cowan, M.; Guthold, R.; Brage, S.; Bull, F.C. Levels of domain-specific physical activity at work, in the household, for travel and for leisure among 327 789 adults from 104 countries. Br. J. Sports Med. 2020, 54, 1488–1497. [Google Scholar] [CrossRef] [PubMed]
  39. Sallis, J.F.; Cerin, E.; Kerr, J.; Adams, M.A.; Sugiyama, T.; Christiansen, L.B.; Schipperijn, J.; Davey, R.; Salvo, D.; Frank, L.D. Built environment, physical activity, and obesity: Findings from the international physical activity and environment network (IPEN) adult study. Annu. Rev. Public Health 2020, 41, 119–139. [Google Scholar] [CrossRef] [PubMed]
  40. Jamil, M.A.; Khanam, S. Influence of One-Way ANOVA and Kruskal–Wallis Based Feature Ranking on the Performance of ML Classifiers for Bearing Fault Diagnosis. J. Vib. Eng. Technol. 2024, 12, 3101–3132. [Google Scholar] [CrossRef]
  41. Vila, R.; Ferreira, L.; Saulo, H.; Prataviera, F.; Ortega, E. A bimodal gamma distribution: Properties, regression model and applications. Statistics 2020, 54, 469–493. [Google Scholar] [CrossRef]
  42. Hamasha, M.M.; Obeidat, M.S.; Alzoubi, K.; Shawaheen, G.; Mayyas, A.; Almomani, H.A.; Al-Sukkar, A.; Mukkatash, A. Symmetry of gamma distribution data about the mean after processing with EWMA function. Sci. Rep. 2023, 13, 15096. [Google Scholar] [CrossRef]
  43. Wang, Y.; Lv, W.; Wang, M.; Chen, X.; Li, Y. Application of improved Moran’s I in the evaluation of urban spatial development. Spat. Stat. 2023, 54, 100736. [Google Scholar] [CrossRef]
  44. Gao, C.; Feng, Y.; Tong, X.; Lei, Z.; Chen, S.; Zhai, S. Modeling urban growth using spatially heterogeneous cellular automata models: Comparison of spatial lag, spatial error and GWR. Comput. Environ. Urban. Syst. 2020, 81, 101459. [Google Scholar] [CrossRef]
  45. Li, J.; Trivic, Z. Impact of “blue-green diet” on human health and wellbeing: A systematic review of potential determinants in shaping the effectiveness of blue-green infrastructure (BGI) in urban settings. Sci. Total Environ. 2024, 926, 171397. [Google Scholar] [CrossRef] [PubMed]
  46. De Haas, W.; Hassink, J.; Stuiver, M. The Role of Urban Green Space in Promoting Inclusion: Experiences From the Netherlands. Front. Environ. Sci. 2021, 9, 618198. [Google Scholar] [CrossRef]
  47. Salvo, D.; Garcia, L.; Reis, R.S.; Stankov, I.; Goel, R.; Schipperijn, J.; Hallal, P.C.; Ding, D.; Pratt, M. Physical Activity Promotion and the United Nations Sustainable Development Goals: Building Synergies to Maximize Impact. J. Phys. Act. Health 2021, 18, 1163–1180. [Google Scholar] [CrossRef] [PubMed]
  48. Ghosh, S.; Pal, S. Anthropogenic impacts on urban blue space and its reciprocal effect on human and socio-ecological health. J. Environ. Manag. 2024, 351, 119727. [Google Scholar] [CrossRef]
  49. Pasanen, T.P.; White, M.P.; Wheeler, B.W.; Garrett, J.K.; Elliott, L.R. Neighbourhood blue space, health and wellbeing: The mediating role of different types of physical activity. Environ. Int. 2019, 131, 105016. [Google Scholar] [CrossRef] [PubMed]
  50. Poulsen, M.N.; Nordberg, C.M.; Fiedler, A.; DeWalle, J.; Mercer, D.; Schwartz, B.S. Factors associated with visiting freshwater blue space: The role of restoration and relations with mental health and well-being. Landsc. Urban. Plan. 2022, 217, 104282. [Google Scholar] [CrossRef]
  51. Rhee, J.H.; Schermer, B.; Han, G.; Park, S.Y.; Lee, K.H. Effects of nature on restorative and cognitive benefits in indoor environment. Sci. Rep. 2023, 13, 13199. [Google Scholar] [CrossRef]
  52. Kaplan, S. The restorative benefits of nature: Toward an integrative framework. J. Environ. Psychol. 1995, 15, 169–182. [Google Scholar] [CrossRef]
  53. Chen, M.; Chen, L.; Cheng, J.; Yu, J. Identifying interlinkages between urbanization and Sustainable Development Goals. Geogr. Sustain. 2022, 3, 339–346. [Google Scholar] [CrossRef]
  54. Onuoha, I.J.; Aliagha, G.U.; Rahman, M.S.A. Modelling the effects of green building incentives and green building skills on supply factors affecting green commercial property investment. Renew. Sustain. Energy Rev. 2018, 90, 814–823. [Google Scholar] [CrossRef]
  55. He, J.; Tan, Y. Evolution logic of urban spatial growth governance and its enlightenment in China: From a perspective of spatial governance. J. Environ. Manag. 2025, 14, 590–606. [Google Scholar] [CrossRef]
  56. Guo, B.; Feng, W.; Lin, J. Does Market-Based Environmental Regulation Improve the Residents’ Health: Quasi-Natural Experiment Based on DID. Inq. J. Health Care Organ. Provis. Financ. 2024, 61, 469580241237095. [Google Scholar] [CrossRef] [PubMed]
  57. Zheng, Z.; Chen, L.; Wang, Y.; Sun, N. Group disparities in the impact of green spaces and air pollution on the physical and mental health of rural older adults: Evidence from a nationwide longitudinal study. Landsc. Urban. Plan. 2025, 259, 105358. [Google Scholar] [CrossRef]
  58. Zhou, P. Affordable and enjoyable health shopping: Commodified therapeutic landscapes for older people in China’s urban open spaces. Health Place 2021, 70, 102621. [Google Scholar] [CrossRef] [PubMed]
  59. Yi, L.; Hart, J.E.; Wilt, G.; Hu, C.R.; Jimenez, M.P.; Lin, P.-I.D.; Suel, E.; Hystad, P.; Hankey, S.; Zhang, W.; et al. GPS-based street-view greenspace exposure and wearable assessed physical activity in a prospective cohort of US women. Int. J. Behav. Nutr. Phys. Act. 2025, 22, 92. [Google Scholar] [CrossRef]
  60. Huang, L.; Oki, T.; Muto, S.; Ogawa, Y. Unveiling the Non-Linear Influence of Eye-Level Streetscape Factors on Walking Preference: Evidence from Tokyo. ISPRS Int. J. Geoinf. 2024, 13, 131. [Google Scholar] [CrossRef]
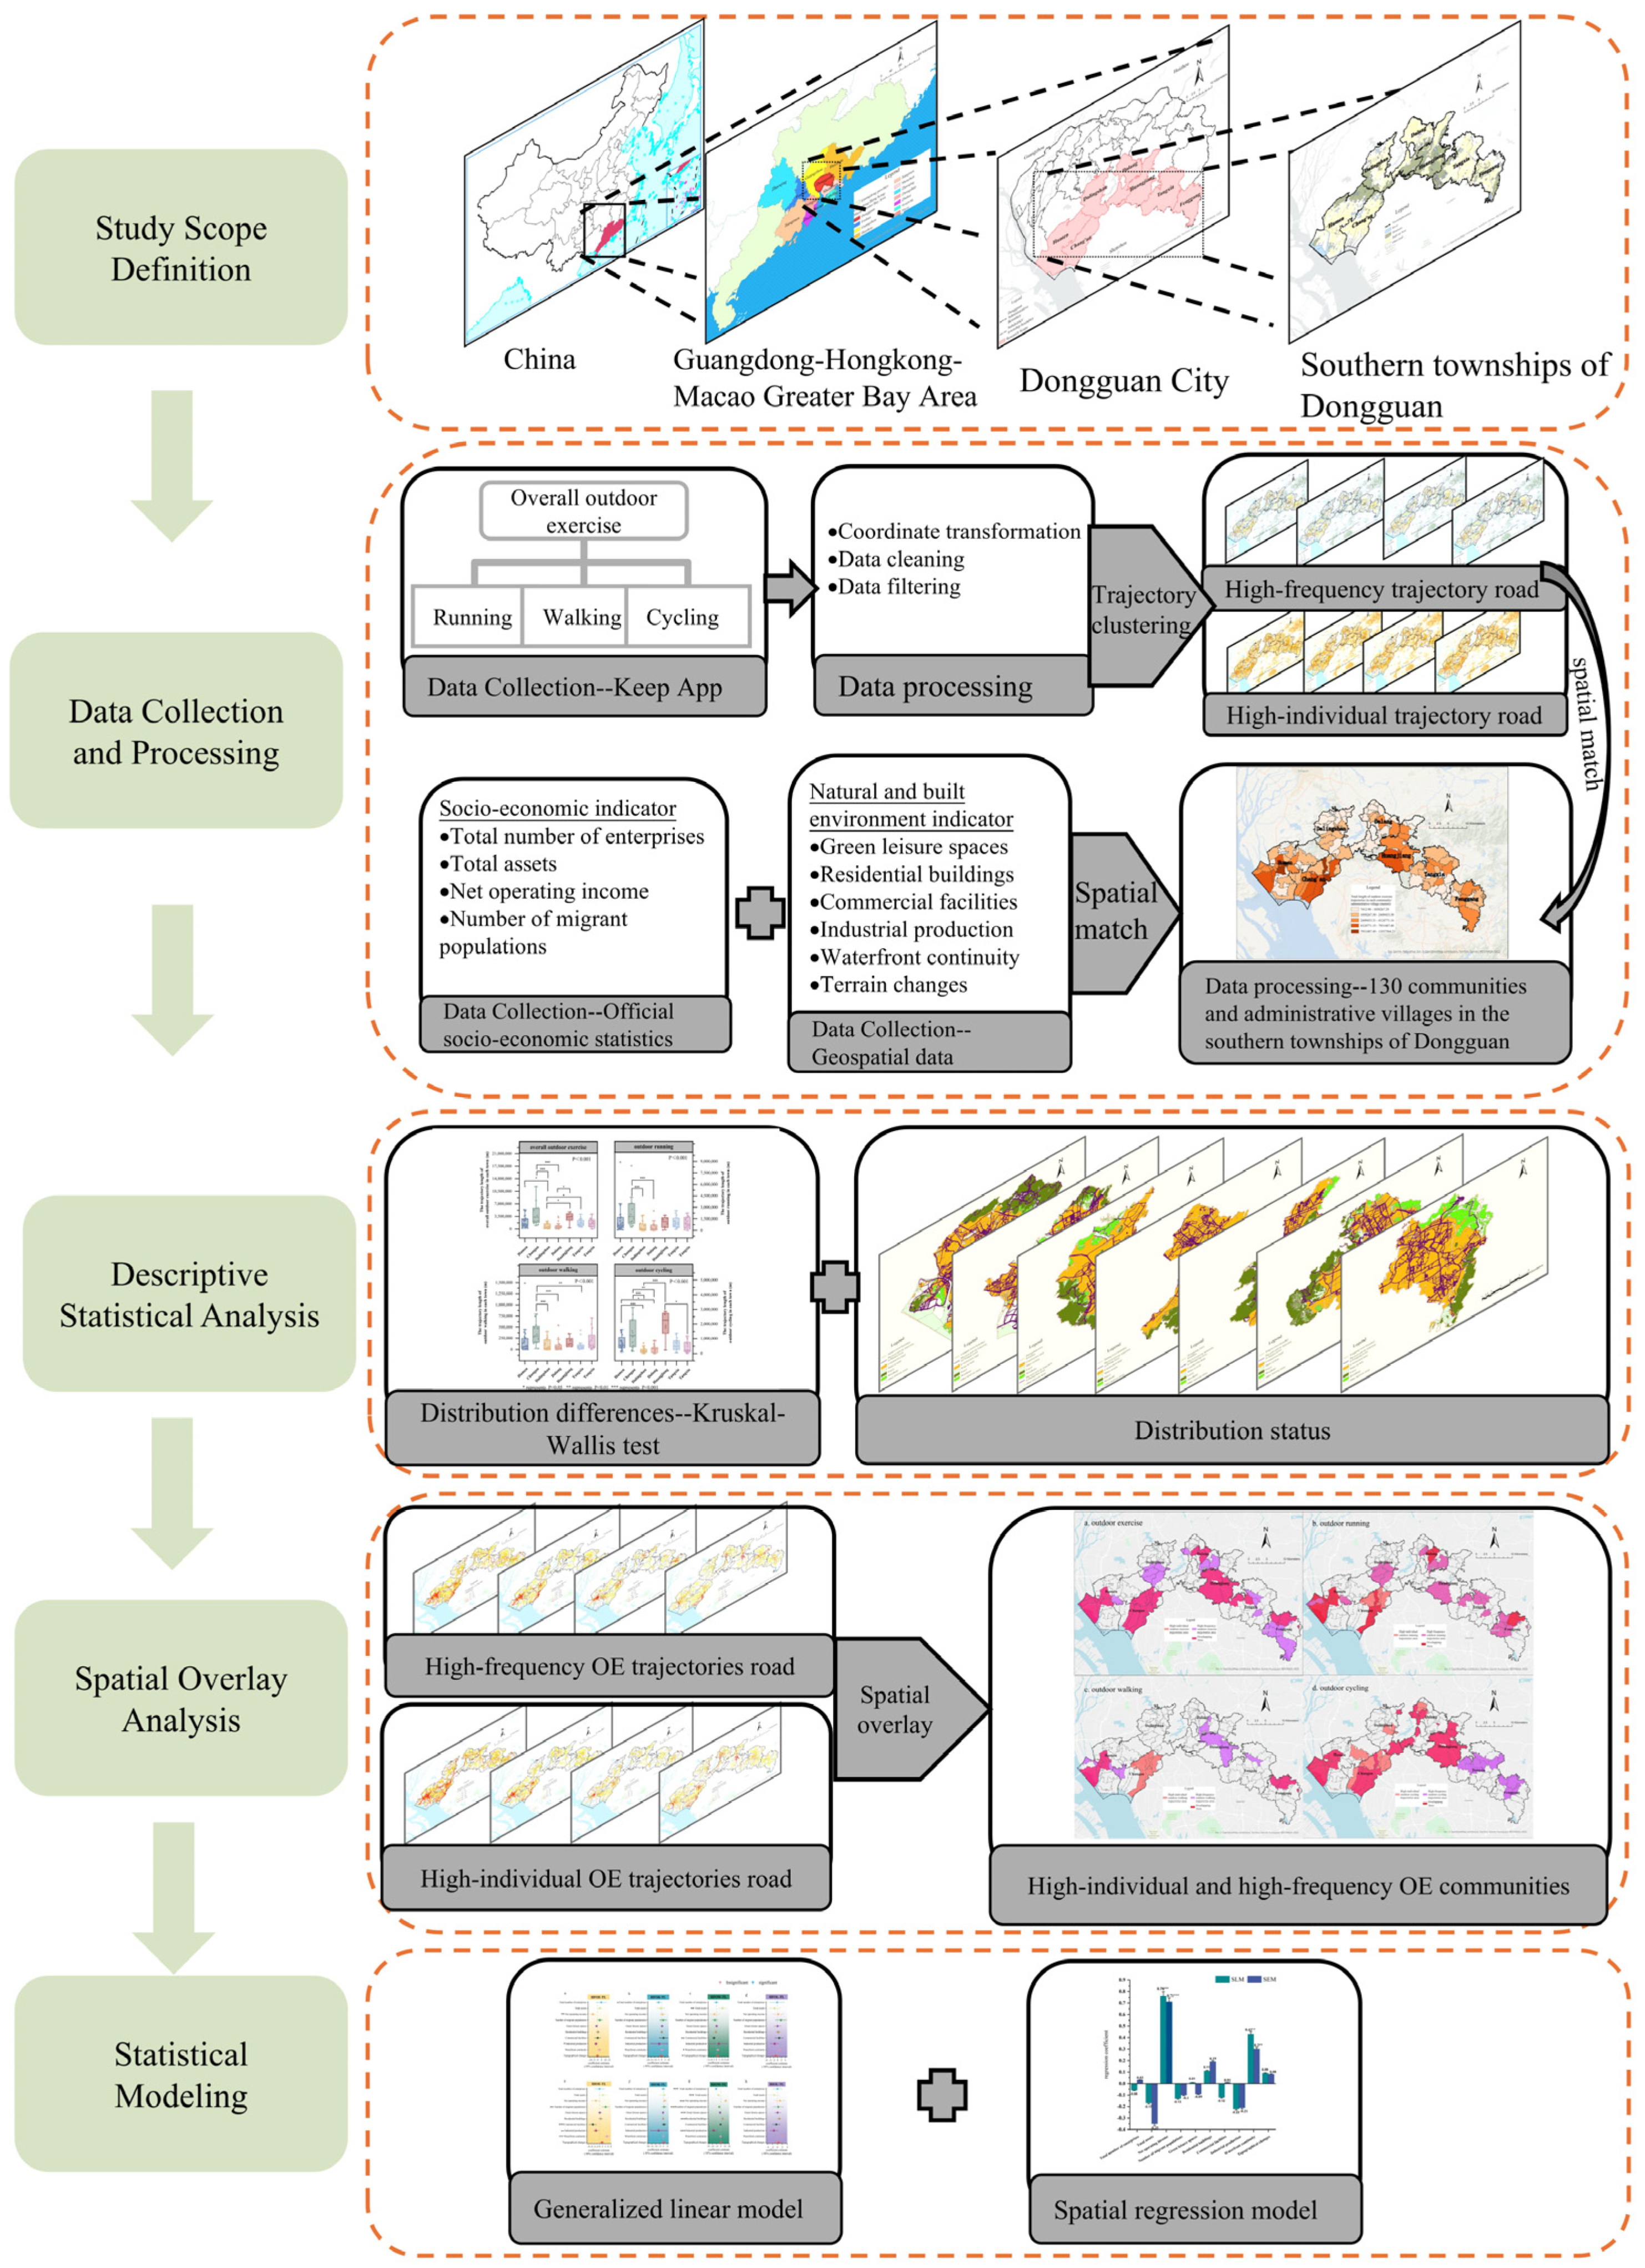
Figure 1. The research framework. Based on 15,880 OE trajectories from 723 individuals in 130 communities across 7 townships in Southern Dongguan, this study follows five steps: (1) defining the study scope, (2) collecting and processing multi-source data, (3) conducting descriptive and Kruskal–Wallis tests, (4) performing spatial overlay analysis, and (5) applying regression models to identify influencing factors.
Buildings 15 02812 g001
Figure 2. The study scope and basic information: (a) location of Guangdong province, Hong Kong, and Macao Special Administrative Regions; (b) location of Guangdong–Hong Kong–Macao Greater Bay Area; (c) location of the research scope; (d) distribution of the community/administrative village in the research scope; (e) key statistical data within the research scope.
Buildings 15 02812 g002
Figure 3. The processing workflow of OE trajectories. (a) Raw OE trajectories are collected and undergo data correction to generate (b) available OE trajectories. These are then spatially matched with (c) the road network. Next, trajectory clustering is applied to identify (d) high-frequency and high-individual various types of OE trajectories. Finally, spatial matching is performed to obtain (e) the total length of OE trajectories within each community and village.
Buildings 15 02812 g003
Figure 4. Regional differences in the total length of OE trajectories. This figure illustrates (a) the characteristics of OE trajectory length across towns and (bh) the spatial distribution of OE trajectories in Humen, Chang’an, Dalingshan, Dalang, Huangjiang, Tangxia, and Fenggang Towns.
Buildings 15 02812 g004
Figure 5. Area with high-individual and high-frequency of OE trajectories. Spatial distribution patterns of high-frequency and high-individual OE trajectories are shown for (a) overall OE, (b) OR, (c) OW, and (d) OC across communities/villages.
Buildings 15 02812 g005
Figure 6. The analysis and comparison results of HFOE-TL and HIOE-TL models. (ad) High-frequency OE trajectory lengths, including (a) overall OE (HFOE-TL), (b) OR (HFOR-TL), (c) OW (HFOW-TL), and (d) OC (HFOC-TL)). (eh) High-individual OE trajectory lengths, including (e) overall OE (HIOE-TL), (f) OR (HIOR-TL), (g) OW (HIOW-TL), and (h) OC (HIOC-TL). The asterisk indicates statistically significant differences: * p < 0.05, ** p < 0.01, *** p < 0.001.
Buildings 15 02812 g006
Figure 7. Global Moran index results. The results show the spatial autocorrelation of high-frequency (ad) and high-individual (eh) OE trajectory lengths across communities/villages, including overall OE (a,e), OR (b,f), OW (c,g), and OC (d,h). Each point in the figures represents a community/village.
Buildings 15 02812 g007
Figure 8. Spatial regression model results for HIOC-TL. The results of the Spatial Lag Model (SLM) and Spatial Error Model (SEM) for HIOC-TL are presented, with green indicating SLM results and blue representing SEM results. The asterisk indicates statistically significant differences: ** p < 0.01, *** p < 0.001.
Buildings 15 02812 g008
Figure 9. A comparison of the three-element and four-element interaction models. (a) The traditional “government–market–society” model conceptualizes spatial governance as an interaction among state policies, market forces, and societal practices. (b) The proposed “government–market–society–collective” model introduces the grassroots governance units as an independent dimension, emphasizing its multi-pathway role in spatial governance.
Buildings 15 02812 g009
Table 1. Total length of high-frequency and high-individual OE trajectories in communities/administrative villages (km).
Dependent VariableInterpretation and Definition
Methods
MinimumMaximumAverage ValueStandard Deviation
Total length of high-frequency overall OE trajectoriesTotal length of overall OE trajectories with a frequency of more than 118 iterations on the same road section48.729189.78485.951460.21
Total length of high-individual overall OE trajectoriesTotal length of the trajectories of more than 22 individuals’ overall OE on the same road section24.669852.48414.871195.70
Total length of high-frequency trajectories for outdoor runningTotal length of OR trajectories with a frequency of more than 109 iterations on the same road section0.4124.636.825.76
Total length of high-individual trajectories for outdoor runningTotal length of the trajectories of more than 21 individual OR on the same road section0.4922.728.507.03
Total length of high-frequency trajectories for outdoor walkingTotal length of OW trajectories with a frequency of more than 40 iterations on the same road section0.3825.246.836.32
Total length of high-individual trajectories for outdoor walkingTotal length of the trajectories of more than 8 individual OW on the same road section1.2223.888.566.30
Total length of high-frequency trajectories for outdoor cyclingTotal length of OC trajectories with a frequency of more than 39 iterations on the same road section0.9439.669.798.10
Total length of high-individual trajectories for outdoor cyclingTotal length of the trajectories of more than 9 individual OC on the same road section0.5340.2310.228.85
Note: the spatial unit of aggregation in this table is “community/administrative village”.
Table 2. Variable factor selection and quantitative measurement.
DimensionsVariable NameData TimeExplanation and UnitMinimumMaximumAverage ValueStandard Deviation
Socioeconomic status of grassroots governance unitsTotal number of enterprises2022Total number of registered enterprises and individual businesses (units)3916,0871921.332224.30
Total assets2022Total assets (CNY 10,000)232457,53755,256.3767,955.14
Net operating revenue2022Net operating revenue (CNY 10,000)6.2250,830.006647.988226.99
Number of migrant populations2022Number of migrant populations (persons)367183,00031,857.7230,543.34
Natural and built environmentGreen leisure spaces2023Area of recreational squares and parks (square meters)128.0035,542,375.934,423,520.3710,761,423.56
Residential buildings2023Total area of residential buildings (square meters)235.001,633,831.11350,386.39418,574.10
Commercial facilities2023Total shopping mall area (square meters)220,809.2828,370,859.395,182,036.744,625,947.88
Industrial production2023Total factory area (square meters)2320.009,162,114.66756,651.321,284,498.01
Waterfront continuity2023Total length of natural waterfront continuity (meters)0104,106.2817,827.3119,319.56
Topographical changes2023The difference between the maximum and minimum elevation (meters)20490115.4299.51
Disclaimer/Publisher’s Note: The statements, opinions and data contained in all publications are solely those of the individual author(s) and contributor(s) and not of MDPI and/or the editor(s). MDPI and/or the editor(s) disclaim responsibility for any injury to people or property resulting from any ideas, methods, instructions or products referred to in the content.