Article

Economic Performance Analysis of Jointly Acting Renewable Self-Consumption: A Case Study on 109 Condominiums in an Italian Urban Area

1
Department of Management, Economics, and Industrial Engineering, Politecnico di Milano, Piazza Leonardo da Vinci, 32, 20133 Milan, Italy
2
Department of Energy, Politecnico di Milano, Via Lambruschini 4, 20156 Milano, Italy
*
Author to whom correspondence should be addressed.
Buildings 2025, 15(16), 2808; https://doi.org/10.3390/buildings15162808
Submission received: 1 July 2025 / Revised: 30 July 2025 / Accepted: 5 August 2025 / Published: 8 August 2025

Abstract

Remote self-consumption supports the energy transition, especially through Jointly Acting Renewable Self-consumption (JARS) and Renewable Energy Communities (RECs). While RECs typically operate at the city/district level, JARS is focused on condominium buildings where apartment owners jointly invest in renewable energy systems, sharing both costs and benefits. The energy produced is consumed on-site, reducing bills and benefiting from financial incentives, when available, as under the Italian law. This research aims to assess the economic feasibility of JARS in Italy and the average financial benefit for a family living in a condominium. It also evaluates the impact of integrating JARS into larger RECs. The study uses photovoltaic electricity production simulations via OpenSolar and building energy modeling through Rose Community Designer. Results are analyzed using energy, environmental, and financial indicators such as Net Present Value (NPV) and Discounted Payback Time (DPBT) over a 20-year period. The findings show that JARS yields average incentive gains of EUR 94.34 per person per year, rising to EUR 340 when including tax bonuses, energy savings, and energy sales. The average investment payback time is 8.8 years. When integrated into RECs, JARS shows improved energy sharing (from 78% to 93%) and higher economic returns, highlighting its potential in accelerating the energy transition.

1. Introduction

With the intent of decarbonising energy systems, the European Union (EU) has promoted a package of eight different directives, known as the Clean Energy Package [1,2]. Among them, Directive 2018/2001/EU, commonly known as RED II [3], put forward a new legal framework to develop renewable energy sources (RESs) with the aim of encouraging energy users such as citizens and Small- and Medium-sized Enterprises (SMEs) to actively participate to the energy transition [4].
Users, indeed, can become members of Jointly Acting Renewable Self-consumption (JARS) groups, commonly known as collective self-consumption (CSC) (also known as remote collective self-consumption or as a collective self-consumption group (CSG) or renewable energy self-consumption communities that act collectively) groups, and Renewable Energy Communities (RECs) [5]. JARS groups are legally limited to participants within the same building or multi-apartment complex [6], making condominiums a natural setting for their implementation. This is especially relevant in countries like Italy, where a substantial portion of the population—estimated at around 60% [7]—lives in such multi-unit residential buildings. Condominiums thus offer a concrete and widespread setting for applying the JARS model, making them a strategic focal point for self-consumption initiatives.
RECs can include members across a wider geographical area, such as a neighbourhood or municipality, connected to the same distribution grid [8]. Both configurations provide an effective context within European legislation based on the concept of energy sharing, introduced ten years ago in the UK [9], which outlined a number of main objectives such as “provide environmental, economic and social community benefits for its shareholders, members and for the local areas where it operates, rather than financial profits”.
Among EU member states, Italy has strongly supported the growth of RECs and JARS through the transposition of RED II as well as the introduction of related provisions [10]. In particular, the Italian government initially introduced collective self-consumption on a national level as a temporary measure [11] and then as a permanent measure [12], making collective self-consumption one of the common self-consumption configurations [13].
A self-consumption group consists of at least two distinct subjects who are both members of the configuration as end customers and/or producers of electricity [14]. Additionally, the self-consumption group includes at least two distinct connection points to which a power utility and a production plant are connected, respectively, provided that the connection points of the end customers are located in the area pertaining to the building or condominium [1,15]. Systems can be located within the building, the condominium, or even elsewhere, provided that the location is fully available to one or more of the group’s end customers. However, the location must be in an area served by the same primary station [16], i.e., an HV/MV substation.
Because of EU directives, each country has already implemented or is in the process of implementing various collective self-consumption incentives [17]. With the introduction of a new ministerial decree [13], the Italian government aims to boost self-consumption within RECs and JARS groups by issuing a financial contribution called an “incentive tariff”. The specific rate of this tariff varies based on the capacity of the renewable energy installation, its location, and the market price of energy. This incentive is issued by the national authority to the representative of the self-consumption group over a period of 20 years.
Although the supporting European and Italian legislations specify that RECs and JARS groups provide environmental, social, and economic benefits, the economic feasibility of the related investments is typically the driving force behind the choice to actively take part in energy self-consumption [18], sometimes even more than the environmental benefits [19].
It is also important to underline that, in compliance with the Italian legislation [20], future energy communities will be able to maximize the earnings from the investment in the systems owned by the community. In fact, to guarantee a fair economic return and to avoid distortions where only a few may benefit at the expense of many, the Italian legislation has imposed a “protective” measure. The so-called “55% threshold”, indeed, guarantees that at least 45% of the incentive is redistributed to the residential domestic user or toward social purposes [21]. This 55% redistribution threshold is not explicitly considered within a JARS group, since the economic return from incentivization is automatically redistributed among the condominium members (the earnings from shared components like solar panels, even if not directly redistributed, are reported by each co-owner based on their ownership share (in thousandths) and their individual tax situation) participating in the JARS group, so the investors are the direct owners of the systems.
In general, JARS (current legislation does not mandate a specific self-consumption model for condominiums, but the collective shared self-consumption model used in this study focuses on typical condominium setups, as most multi-unit buildings in Italy are effectively condominiums) uses a renewable system able to immediately lower common energy consumptions as well as to generate financial remuneration through the state incentive, limited to the building where the self-consumption takes place. Therefore, within the same condominium, physical self-consumption and shared self-consumption can co-exist with the relative and complementary benefits [22]. On the other hand, RECs can exploit larger networks and therefore try to optimize energy production and consumption within a broader range of users [23]. Furthermore, the “critical mass” of REC members also makes it possible to implement ancillary services whose aim is to make savings [24,25].
The economic return from RECs and JARS can diversify due to numerous parameters, such as the cost of energy and the percentage of incentive returned to the end user [26]. However, it can also be affected by the size of the self-consumption configuration and, therefore, by the number and the type of actors involved in the “community” [27]. The economic return can oscillate between 360 EUR/year and 160 EUR/year for the residential users in an REC, and it can amount to 97 EUR/year for the residential users in a JARS group [28]. Another study [21] showed that the incentive can provide even lower net revenues, which oscillate between 29.20 EUR/year and 52.30 EUR/year, depending on the effort made to coordinate and optimize self-consumption among community members.
However, these studies are based on hypotheses and on a limited amount of real data, since there are few self-consumption configurations currently working and able to share the data they produce [8]. Therefore, the models and results in these studies will need to be verified based on the real data produced over the next few years by the effectively activated RECs and JARS [29].
From an economic standpoint, the scientific community has started to analyze the relative advantages of RECs [24], as listed in Table 1, even within the context of Italy [30].
On the other hand, the literature has neglected JARS. Its economic evaluation has not been deepened, with the exception of a technical study from Spain [31], an analysis of economic performance in Italy [32], and an analysis of predictive systems [33]. Focusing on Italy, there are not many active JARS configurations in the country [34]. Moreover, many of these are experimental configurations [35] for technical analysis [36] rather than economic ones [37].
Moreover, validating such systems is essential to assess their effectiveness and real-world applicability. However, the current scarcity of large-scale, fully operational JARS implementations limits the possibility of empirical evaluation at this stage [38]. As more energy communities become active and richer empirical datasets emerge, the potential for robust validation and comparative benchmarking of the JARS framework will significantly increase [39].
Table 1. Research present in the literature on Renewable Energy Communities.
TopicReference
Analysis of savings on costs[40]
Increased energy security[41]
Energy independence[42]
Creation of jobs[19]
Fighting against energy poverty[43]
Theorizing of more complex and
innovative economic models
[25]
Implementation of ancillary services[44]
Comparison with previous historical models of energy cooperatives[39]
The present study aims to provide a detailed economic evaluation of JARS in real-world urban settings, with a particular focus on condominium-based photovoltaic systems.
Moreover, while the existing literature tends to analyze RECs and JARS separately, this study is among the first to explore the incremental economic and energy benefits of transitioning from JARS-only setups to configurations that participate in RECs using high-resolution spatial and consumption data. To assess their competitiveness, the analysis compares self-consumption and economic performance in these two configurations.
Specifically, the economic return due to the implementation of JARS configurations in condominiums is examined in the city of Prato, as detailed hereafter.
The novelty of this work lies in its dual-layered analysis: evaluating JARS in isolation and then assessing its performance within RECs. This is developed using an empirically grounded, spatially detailed methodology that has not yet been applied in the Italian context. This contributes new insights to the literature on JARS by addressing the underexplored area of condominium-level energy sharing models and their economic scalability.
The remainder of the paper is structured as follows: after the Introduction, Section 2 includes a description of the case study area and an overview of the simulation tools employed; then, Section 3 presents the evaluation of JARS from an energy and economic point of view, along with an analysis of the inclusion of JARS within RECs. Finally, Section 4 summarizes the main contributions of the present study, in addition to providing limitations and avenues for future research.

2. Materials and Methods

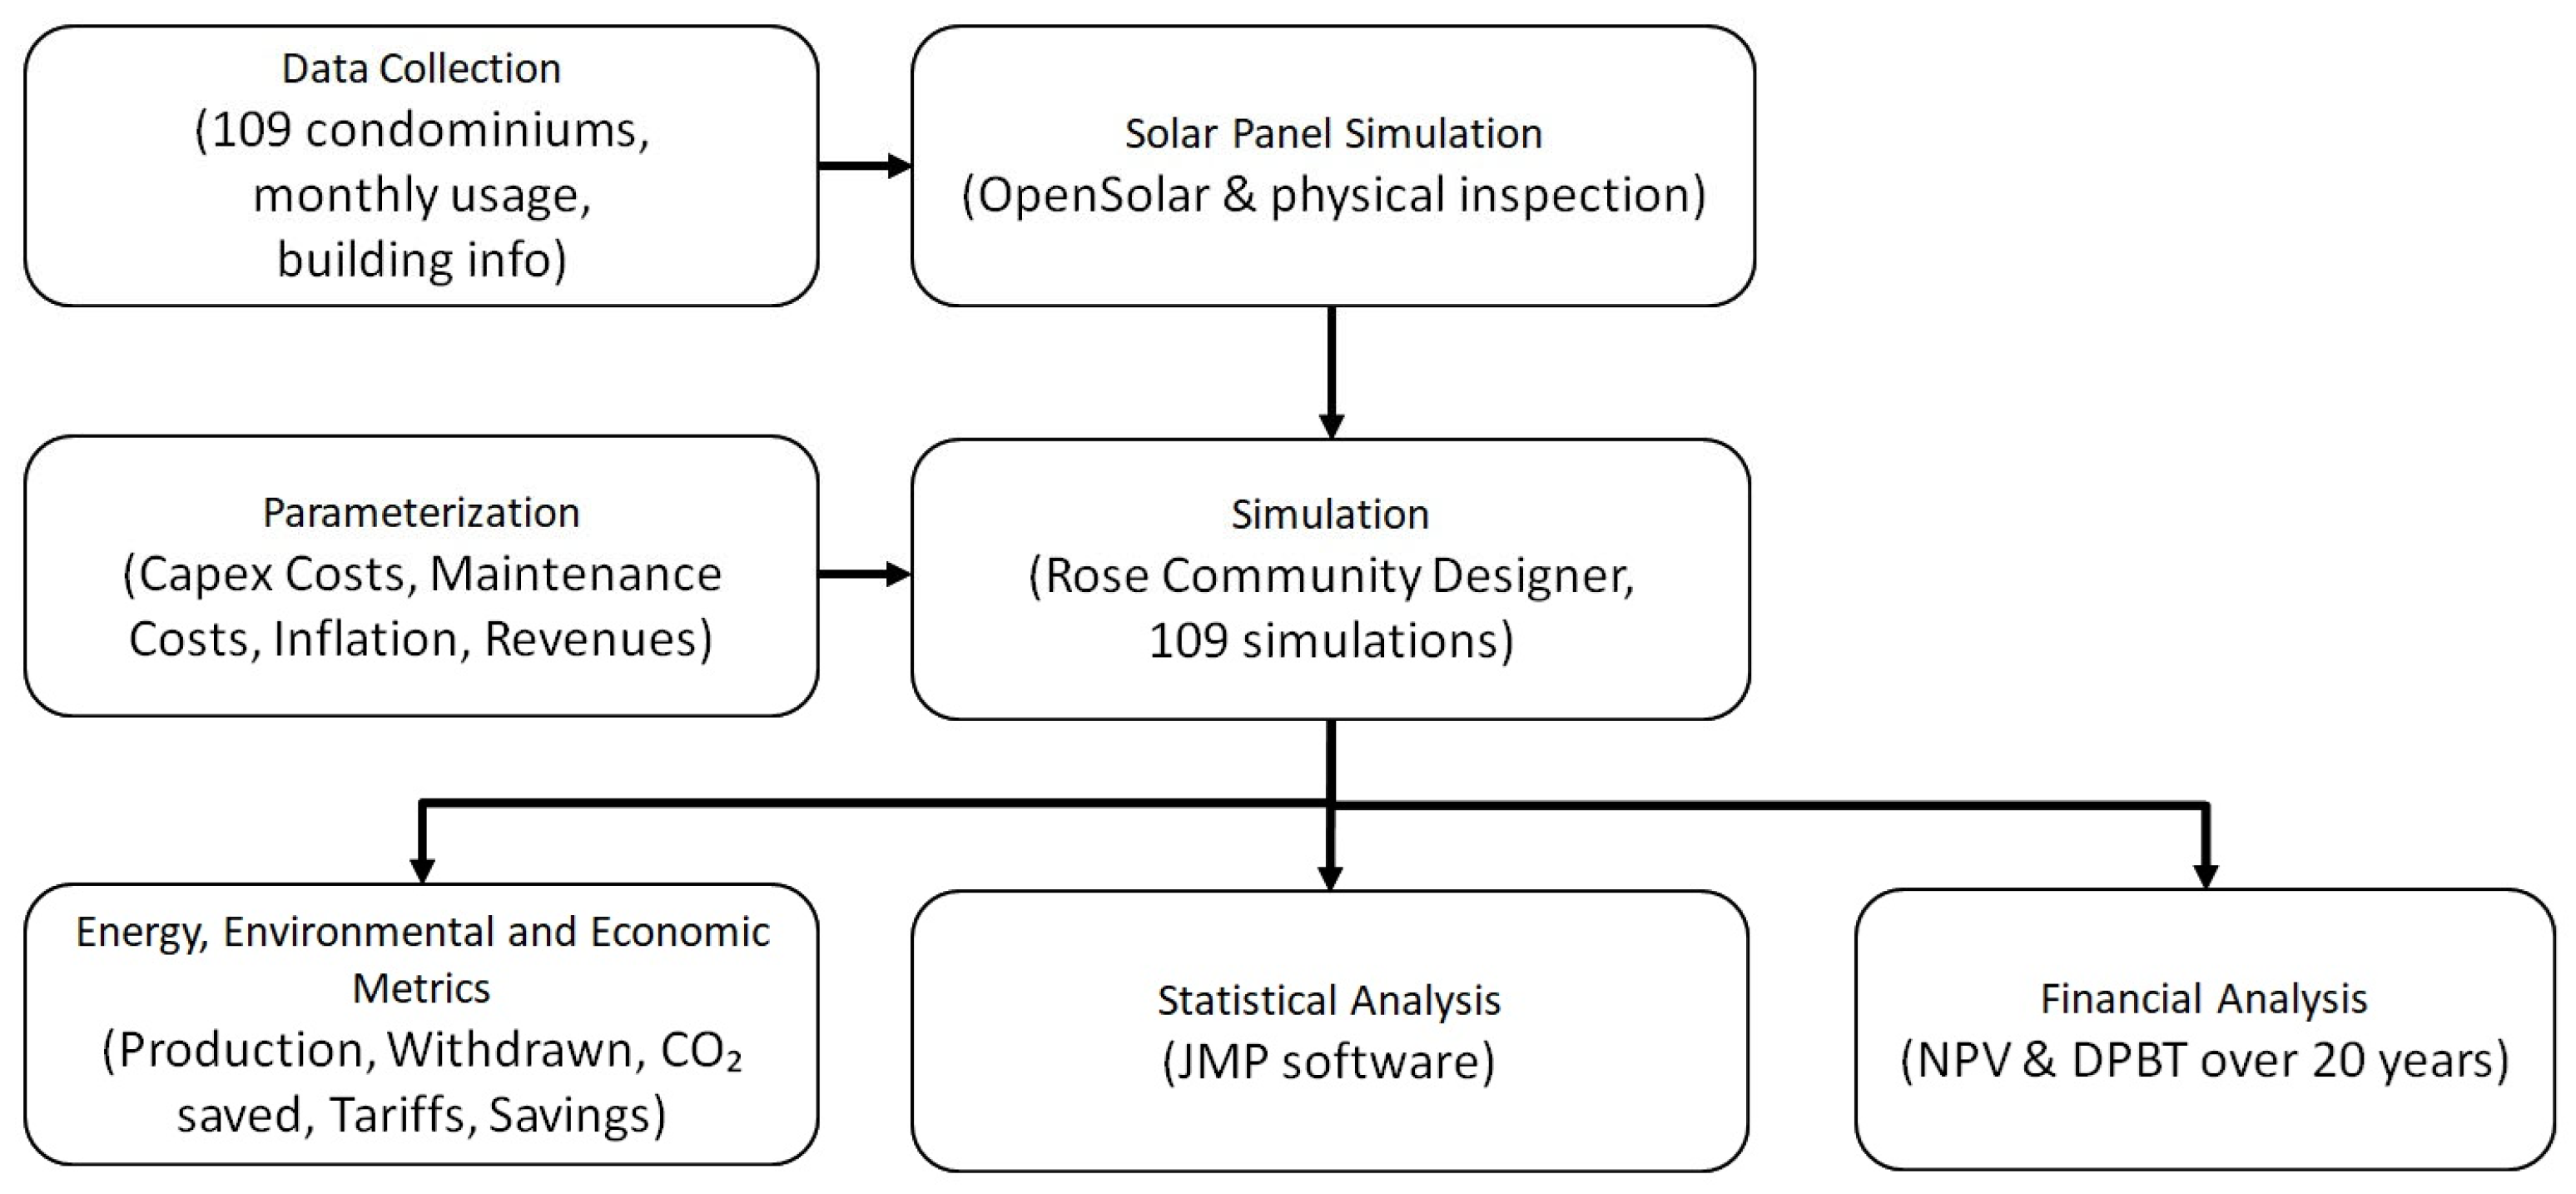
This research follows a structured methodology to evaluate the financial feasibility of implementing JARS configurations in 109 residential buildings (i.e., condominiums), as illustrated in Figure 1.
The methodological framework starts with a comprehensive data collection on monthly electricity consumption and structural characteristics of the buildings. This is followed by a photovoltaic (PV) panels energy production simulation, carried out using the OpenSolar 2.0 software (v2025) and supplemented by physical inspections to ensure accurate modeling and optimal sizing of the photovoltaic production system.
The resulting data is then parametrized considering capital expenditure (CAPEX), maintenance costs, inflation rates, and projected revenues. These parameters are used in a comprehensive simulation process utilizing the Rose Community Designer 2.0.6 tool (v2025), running 109 individual simulations to model each building scenario.
The outputs are analyzed across three domains: energy, environmental, and economic. Adopted metrics include energy production, grid energy withdrawals, self-consumption percentage, CO2 savings, tariff impacts, and monetary savings. Moreover, a statistical analysis through the JMP 18.2.0 software (student edition v2025) was developed together with an economic analysis assessing Net Present Value (NPV) and Discounted Payback Time (DPBT) over a 20-year period.

2.1. The Case Study Area

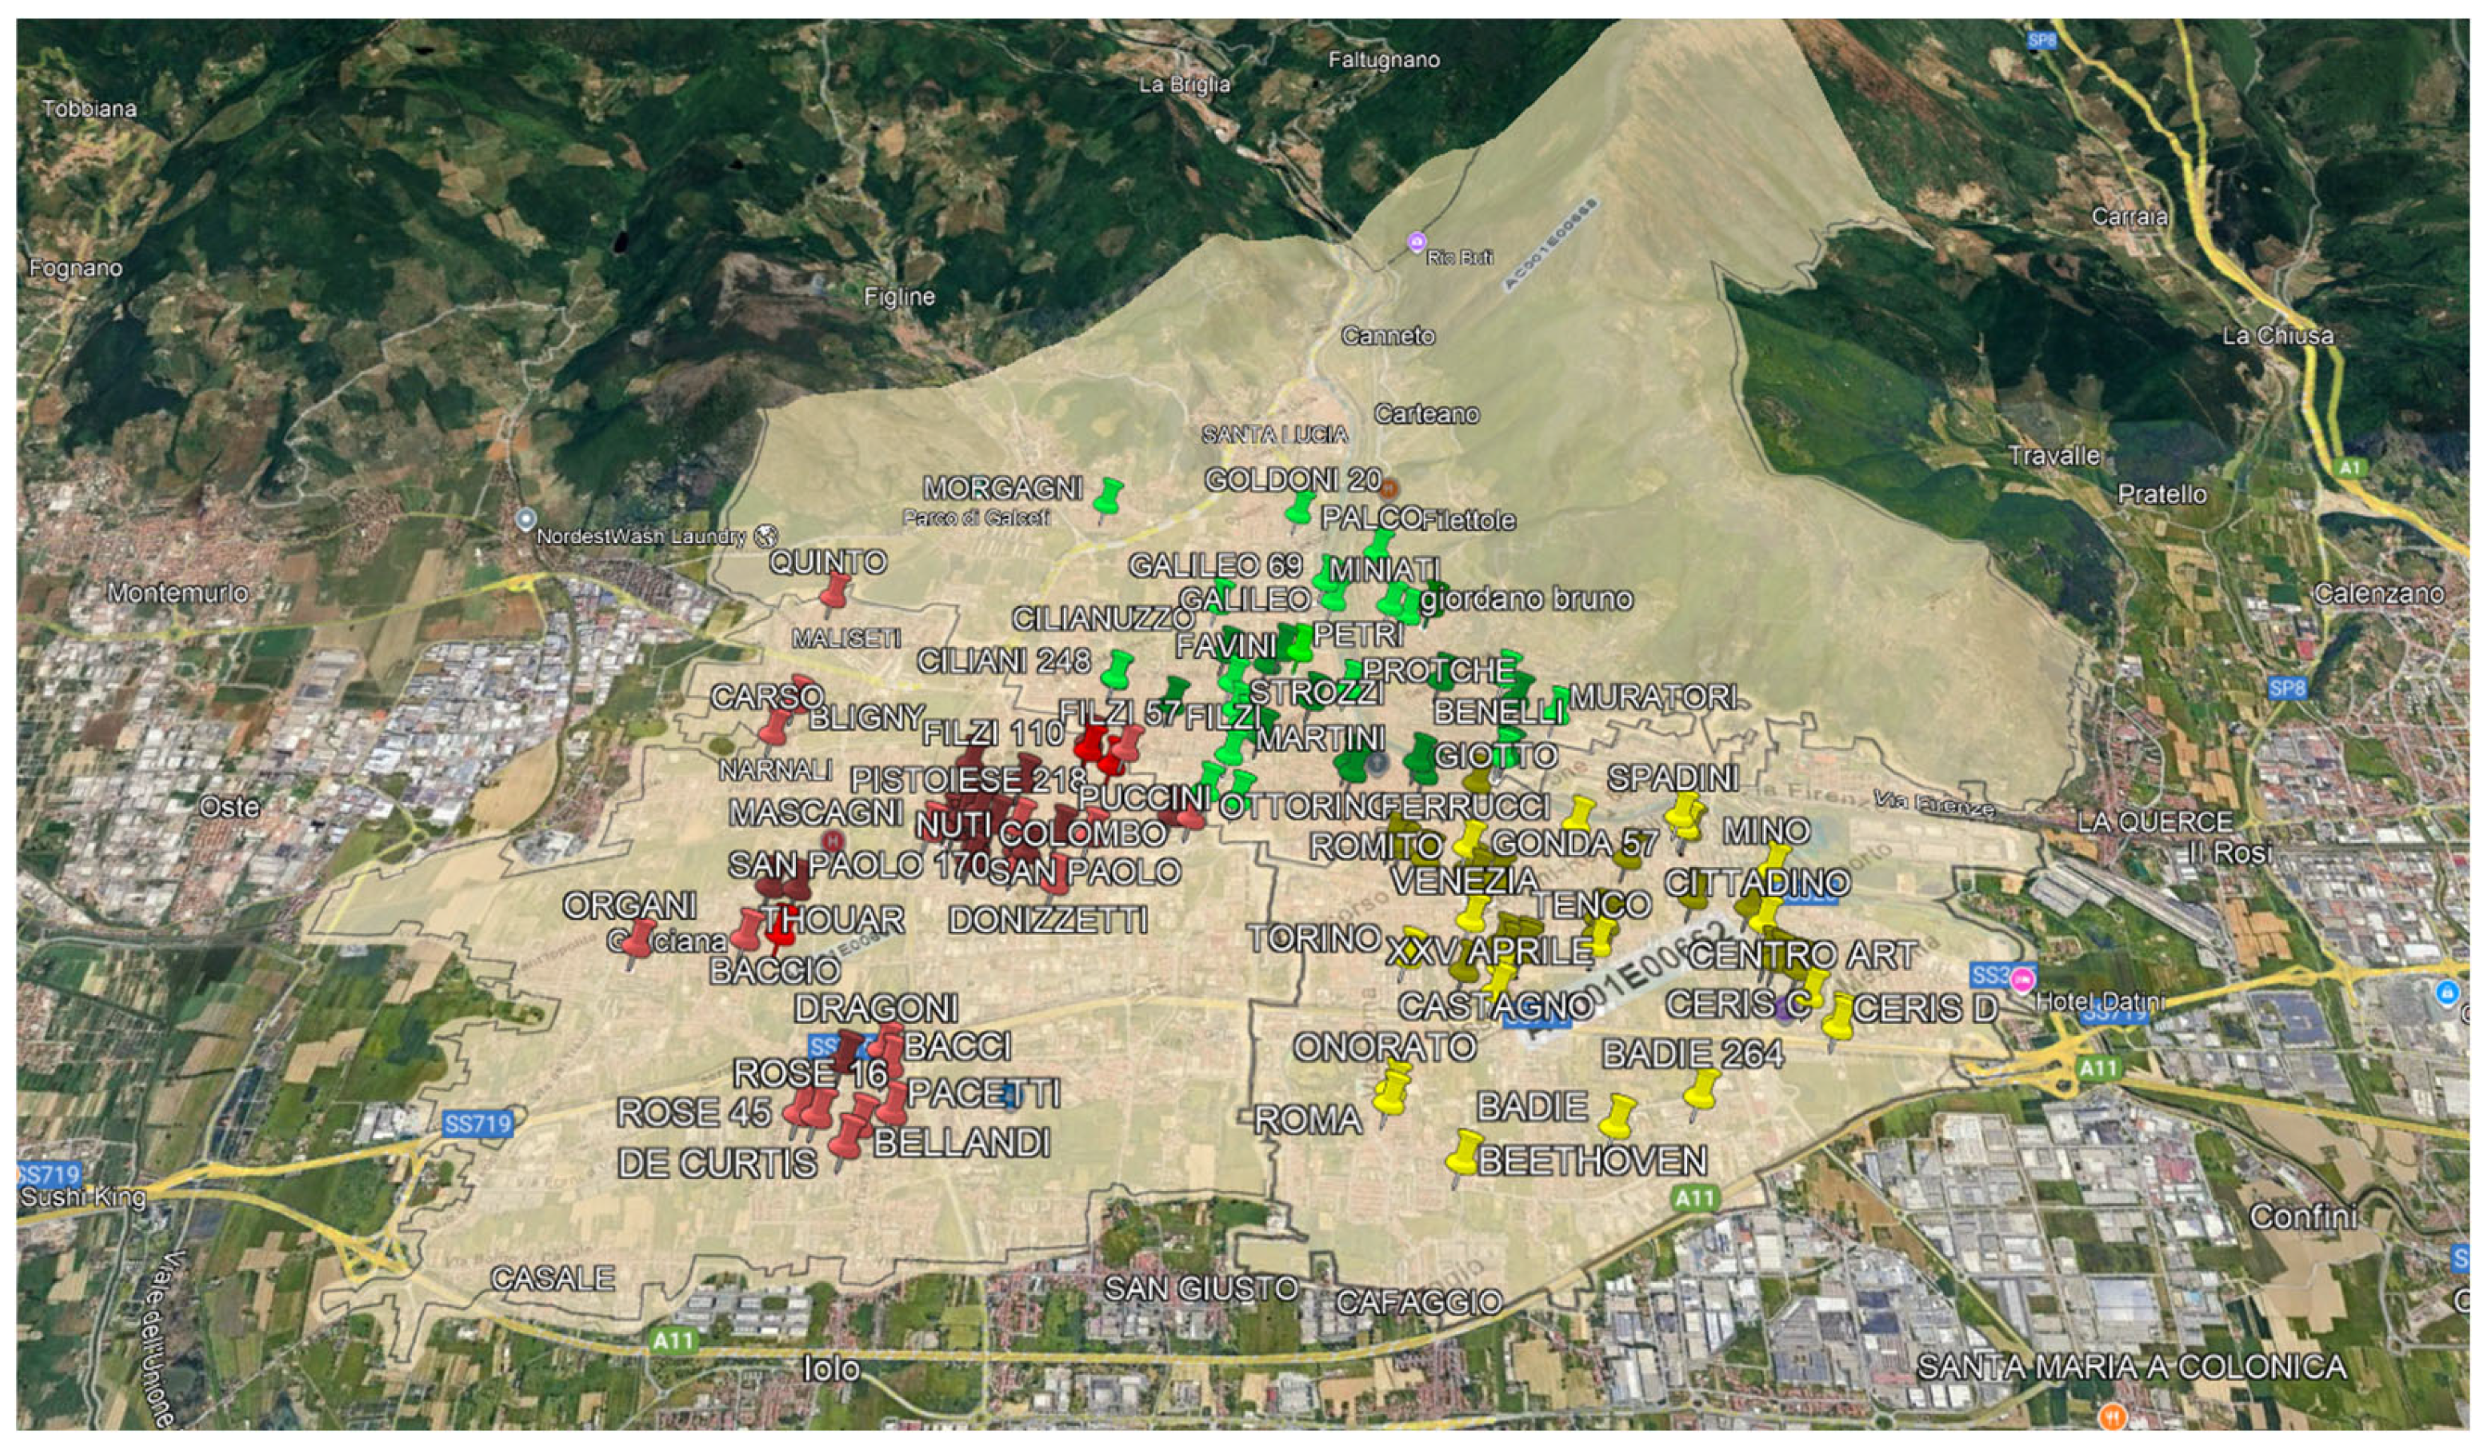
The analysis was conducted on 109 condominiums located in the same metropolitan area, i.e., Prato, Italy. The electricity distribution uses a total of 6 HV/MV [45] substations to cover the entire urban area of Prato. Two substations cover specifically industrial areas and therefore were not included in the analyses of this study due to the almost total absence of condominiums and residential housing units in their areas. Data was collected and analyzed over the remaining 4 HV/MV substations listed in Table 2 and shown in Figure 2. Moreover, Prato represents a privileged statistical sample due to the possibility of collecting data through the voluntary participation of many condominium administrators in the study. However, the building profile by number of floors is compatible with the profile of buildings on a national scale. Two- and three-story buildings represent 75% of the buildings analyzed, while on a national scale, they represent a similar and compatible 73% of the buildings in the area. Prato can be also considered representative of the 50 most populous cities in Italy, with a population density of 1867.69 inh./km2, which closely approximates the sample mean of 1877.5 [46].
The 109 condominiums (The term “condominium” refers to a particular association within a building consisting in a number of units, where private and communal properties coexist, as specified in Article 1117 following the Italian Civil Code. The exclusive ownership of individual apartments is accompanied by shared ownership of other components, such as the roof, stairwell, entrance, caretaker’s lodge, supporting walls, and laundry areas, which require communal management regulated by the condominium rules. As per Italian legislation, a collective photovoltaic system can be added to this list of communal areas) analyzed include 2674 private users, 139 offices, and 129 business activities.
Thanks to the collaboration with numerous condominium administrators, consumption data from communal areas and private flats were collected according to the monthly range for the years 2023 and partially 2024. They also provided details about the composition of the buildings, indicating the number of apartments and the type of family living in each apartment as well as the presence of businesses. Due to the unavailability of specific electricity consumption profiles for individual households, the study relied on values from the literature [47] and assigned average annual consumption figures to each residential unit as per Table 3. The study [47] presents a detailed case study of a small/medium condominium in northern Italy, aligning directly with the regulatory setting of this research. For this reason, the consumption patterns and assumptions are highly applicable to this analysis. Moreover, the paper focuses on mixed-use residential and commercial condominiums—a configuration common in urban Italy [48] and relevant to the typical JARS context. The electricity demand profiles reflect realistic occupancy and usage types (e.g., elderly couples, young workers, and families), which mirror the type of end users analyzed here.
Finally, the paper in question uses a combination of demand data from the literature, typical day profiles, and realistic behavioral assumptions (e.g., load shifting, occupancy variation) to simulate electricity consumption. This provides a nuanced and credible set of profiles suitable for modeling purposes.
For these reasons, the study [47] was deemed a representative and technically robust source for household electricity profiles in this case study.
Conversely, actual electricity consumption data were available for commercial activities and were used directly in the analysis.
For every condominium, the same JARS configuration was modeled, where the PV system is directly connected to the shared condominium POD. The system is under the common ownership of every apartment owner in proportion to their percentage share ownership of common parts and in conformity with Article 1117 of the Italian Civil Code. A “driven by citizen” model, already seen for the Jointly Acting Renewable Self-consumption groups used for RECs [49], as well as the ecopreneur model [50], is therefore applied to apartment owners, making them an active part in the entire renewable energy self-consumption chain.

2.2. Simulation Tools

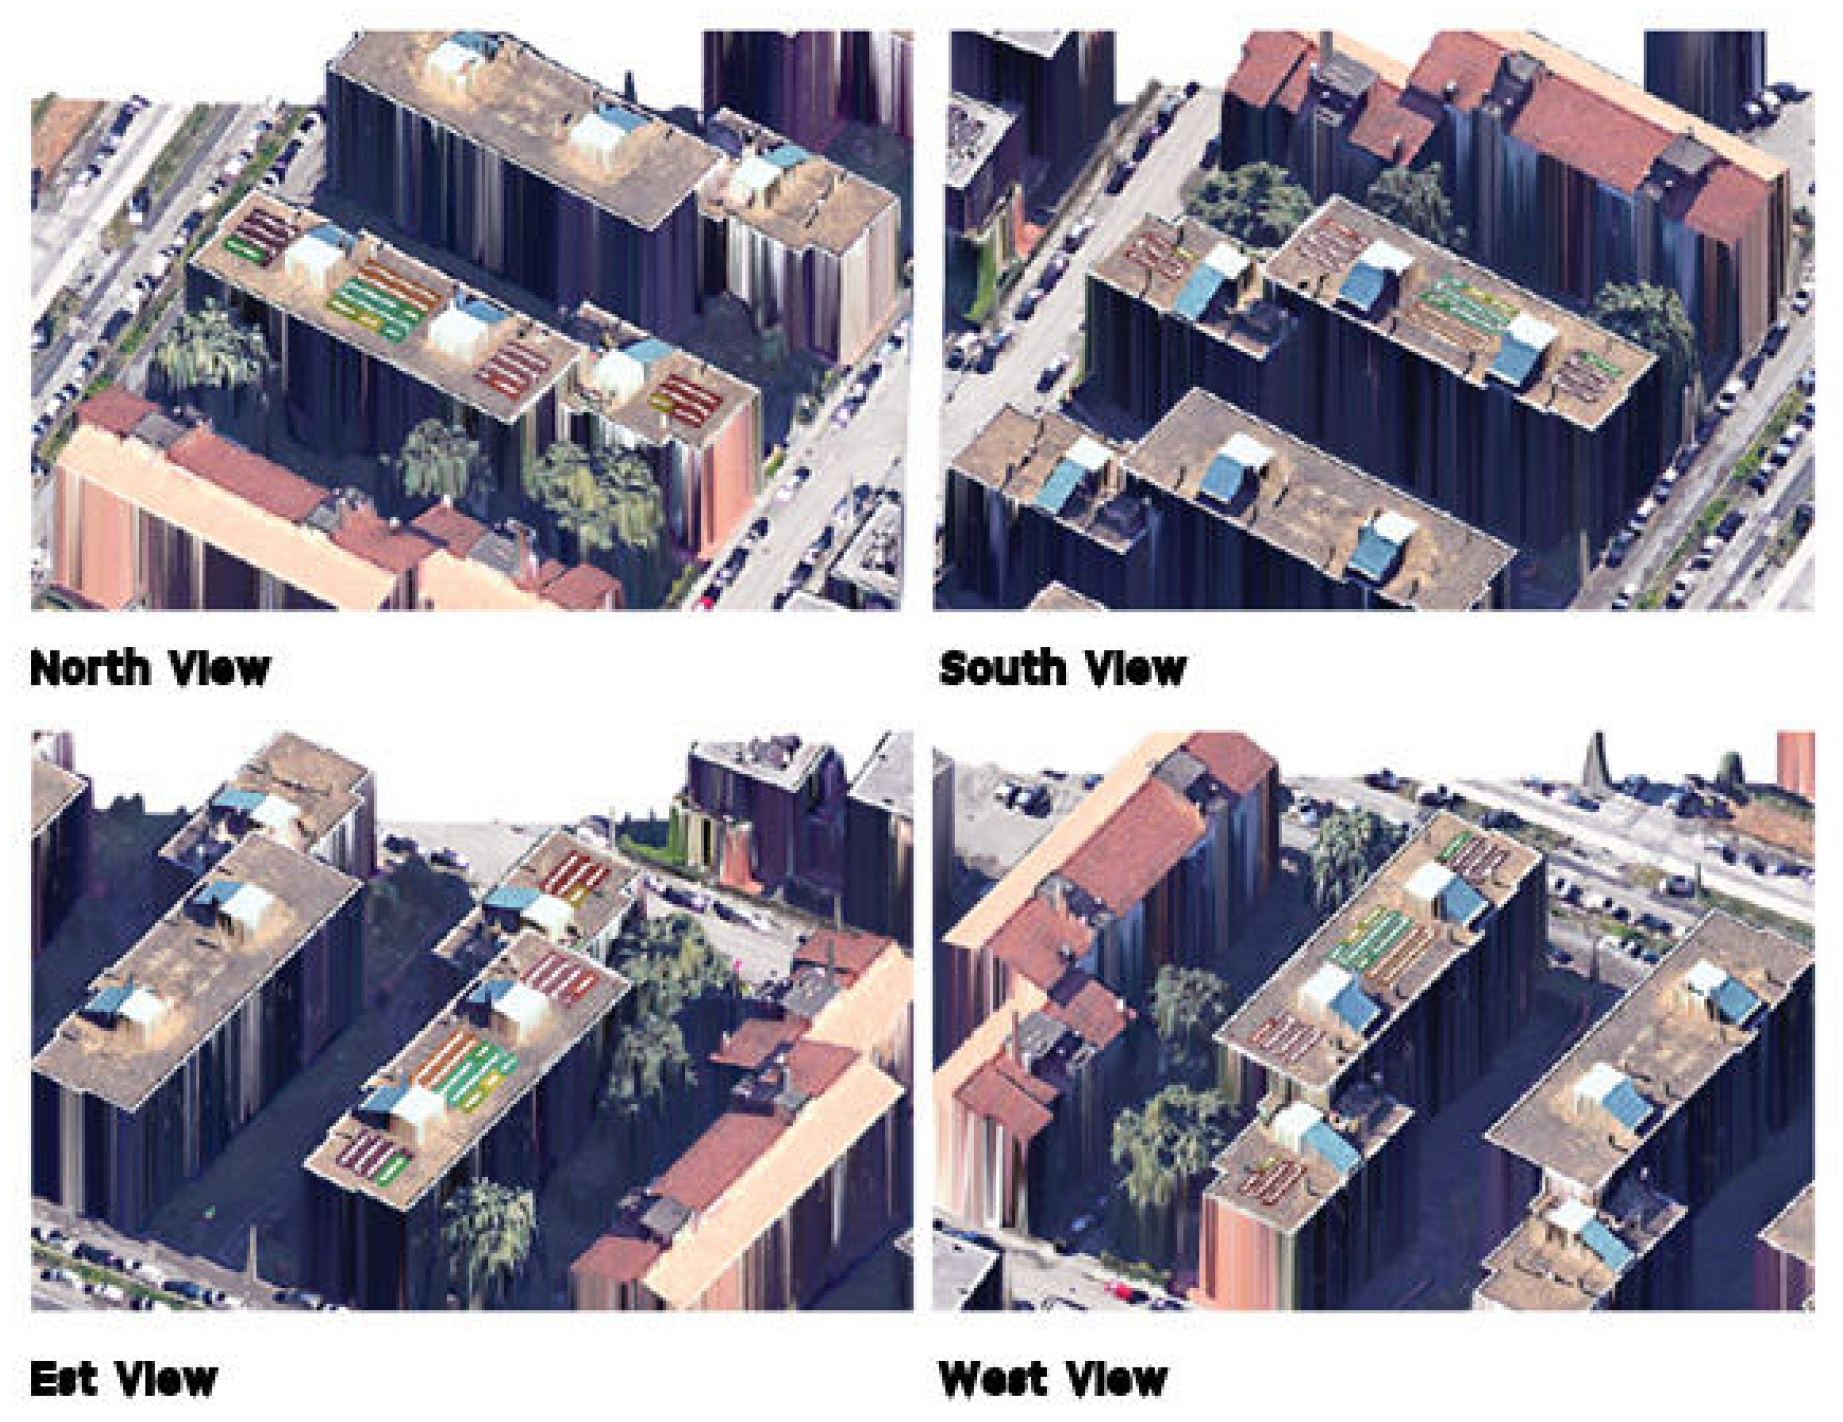
The rooftop PV panel simulations were carried out using the OpenSolar software ([51] https://www.opensolar.com/, accessed on 4 August 2025) geo-referenced to Google Earth, as shown in Figure 3. The software includes a 3D analysis of obstructions and shadow areas caused by other buildings with spatial and meteorological input data. More in detail, independent validations confirm OpenSolar’s precision. The National Renewable Energy Laboratory (NREL) measured Sun Access Values (SAVs) [52] and found that OpenSolar’s estimates were within ±3% of on-site SunEye measurements. PV Evolution Labs (PVEL) confirmed the roof scale within 11/3 ft (≈0.4 m) 100% of the time and the roof pitch within 4° in over 97% of cases. These studies, conducted in the US, validate core computational and modeling methods (roof geometry, solar irradiance, energy yield) if the local climate and irradiance inputs are accurate. The software used the average efficiency and loss values highlighted in Table 4.
Thanks to this and the automatic optimization functionalities of the software, it was possible to obtain the best layout and positioning for the panels to maximize energy production. Furthermore, 20% of roofs were re-checked through a physical inspection that guaranteed the removal of obstructions in the model since they were not always visible by using only satellite imagery. Therefore, the condominium photovoltaic systems were designed based on the available roof area, shadow net areas, and obstructions.
Systems just a little over 20 kWp were approximated to 20 kWp to avoid bureaucratic issues and costs linked to the requirement of setting up a mandatory electricity workshop [53]. This resulted in an overall installed power of 2274 MWp over a gross 50,502 m2 surface area, with an average installed power for each building equal to 20.87 kWp (Figure 4 and Table 5). Based on previous economic analysis [37], the installation of storage systems was not taken into consideration because the investment is too financially expensive for families. Considering the current legislation [13], it is possible to obtain the maximum state incentive with photovoltaic systems below 200 kWp. None of the analyzed condominiums here have the potential physical space to install photovoltaic systems above this value.
Later, the Rose Community Designer (https://energy.mapsgroup.it/en/energy-community-designer-en/, accessed on 4 August 2025) software was used to assess the financial feasibility of developing JARS, along with its energy, environmental, and economic metrics. The Rose software uses production data from the Photovoltaic Geographical Information System developed by the European Commission’s Joint Research Centre (JRC) [54]. This cloud-based tool enables preliminary simulations of JARS and other energy community configurations. While originally developed with a focus on the US market, its core modeling principles—such as load matching, PV production estimation, and financial projections [55]—are adaptable to the Italian context when localized inputs (e.g., tariffs, irradiance, incentives) are correctly applied. However, further real-world validation in Italy would strengthen confidence in its predictive accuracy, which remains a limitation to be addressed in future research [56].
The economic analysis was conducted under the assumption that participants in the self-consumption group maintained their standard, pre-existing consumption behavior without the implementation of adaptive or automated demand-side management strategies [15]. This assumption reflects the prevailing conditions in the study area, where over 90% of electricity delivery points are residential and do not employ home automation technologies [57]. Such systems imply high installation and maintenance costs [58,59], and these expenses are not eligible for tax deductions under current Italian legislation. Although smart meters can provide detailed consumption data, they do not inherently lead to sustained behavioral changes [60,61]. Moreover, incentives aimed at promoting self-consumption may trigger a rebound effect, as users may respond by increasing their energy use to maximize perceived benefits [62,63], further complicating demand modeling and potentially undermining energy savings.
We acknowledge that this assumption limits the generalizability of the results. Future studies can address scenarios involving behavioral adaptation or smart control strategies, which could significantly affect self-consumption patterns.
By inserting in the software the data of the designed photovoltaic systems, condominium consumption data, average load profiles of residential units, and power consumption of business activities, it was possible to create 109 distinct simulations of condominium JARS configurations. The following data for each condominium were calculated:
  • Annual energy production: E p v , c o n d Y ;
  • Annual energy fed (into the grid): E i m m , c o n d Y ;
  • Annual condominium energy withdrawn (from the grid): E p r e v , c o n d Y ;
  • Annual residential energy withdrawn (from the grid):   E p r e v , r e s Y ;
  • Physical self-consumption: Φ d i r , c o n d = E p v , c o n d Y E i m m . c o n d Y E p v . c o n d Y ;
  • Annual shared energy:   E s h r , c o n d Y ;
  • C O 2 saved: C O   c o n d Y ;
  • Zonal hourly price of electricity: P z ;
  • Incentive premium rate (tariffa incentivante premio): T I P = 80 + max 0 ; 180 P z ;
  • Incentive self-consumption tariff received: T i n c , c o n d Y = T I P   E s h r , c o n d Y ;
  • Condominium energy bill saving: R c o n d Y = d = 1 365 h = 1 24 P c o n d d , h ( E p v , c o n d d , h E i m m . c o n d d , h ) ;
  • Compensation for the sale of excess electricity: T s o l d , c o n d Y = d = 1 365 h = 1 24 T R I D d , h     E i m m , c o n d d , h ;
  • Earnings from the sale of energy—RID (RID is to Ritiro Dedicato, (Dedicated Off-take Regime) which is a mechanism established under the Italian energy framework, whereby the Gestore dei Servizi Energetici (GSE) acts as the single buyer for electricity generated by small-scale renewable and cogeneration plants. Under this scheme, producers are entitled to sell their electricity to the GSE at regulated conditions, thereby facilitating grid access and simplifying market participation for distributed generation facilities) (EUR/year) :   T R I D , c o n d Y = 1 ;
  • Annual fiscal bonus (EUR/year): B f i s c Y = C i n v , c o n d t = 0 N r e s ,   c o n d     β f i s c     0.1 .
The output was analyzed, seeking the average values and any correlations between the power self-consumption values, the relative economic incentive, and the various condominium parameters. The correlation ( ρ ) is derived from the coefficient of determination ( R 2 ) with the formula ρ = ± R 2 , where the sign is decided based on the slope of the curve.
Statistical analyses were carried out using the JMP 18.2.0 software (https://www.jmp.com/en_us/home.html, accessed on 4 August 2025) by SAS (Statistical Analysis System, Cary, NC, USA). The analysis was conducted on non-optimized self-consumption communities with an assumed energy behavior in line with historic statistics.
At the end of the analysis of each condominium, the Net Present Value ( N P V c o n d ) was calculated, which represents the actualization of cash inflows linked to future revenues received by the condominium net of cash outflows C F t o t , c o n d Y   over a 20-year period ( N = 20 ) .
The outflows mentioned are due to the initial investment in the system ( C i n v , c o n d t = 0 ) together with the cost of maintenance ( C m a n , c o n d Y ), the cost of running the system ( C g e s t , c o n d Y ), and the insurance cost ( C a s s , c o n d Y ). The NPV has already been used as a reference parameter to evaluate investments in other studies regarding the installation of photovoltaic systems for remote self-consumption [26,27,43,64]. Nevertheless, analyzing the value and size of an entire investment in energy communities cannot be adapted to condominium buildings because, in terms of configuration, size, and cost, the photovoltaic systems installed for RECs are different from those installed for JARS [13]. The NVP that corresponds to the state self-consumption incentivization period (N) is:
N P V c o n d = C i n v , c o n d t = 0   + t = 1 N = 20 C F t o t , c o n d Y = t 1 + i t
where:
  • C i n v , c o n d t = 0 is the total initial cost of photovoltaic panels equal to the installed power capacity multiplied by the photovoltaics cost ( C i n v , c o n d t = 0 = P P V i n s t     C P V );
  • C F t o t , c o n d Y is the condominium net of cash outflows equal to:
  • C F t o t , c o n d Y = T i n c , c o n d Y + T s o l d , c o n d Y + R c o n d Y C m a n , c o n d Y C g e s t , c o n d Y C a s s , c o n d Y ;
  • T i n c , c o n d Y is the annual self-consumption incentive;
  • T s o l d , c o n d Y is the compensation for the sale of input electricity;
  • R c o n d Y is the annual condominium energy bill saving;
  • C m a n , c o n d Y is the overall annual system maintenance cost equal to the annual maintenance cost multiplied by the photovoltaics cost ( C m a n , c o n d Y = M C P V Y     C p v );
  • C g e s t , c o n d Y is the overall annual running costs of the JARS system;
  • C a s s , c o n d Y is the overall annual insurance cost equal to the annual insurance cost multiplied by the photovoltaics cost ( C a s s , c o n d Y = A C P V Y     C p v );
In addition to the NPV, Discounted Payback Time (DPBT) was also estimated. DPBT is calculated by solving Equation (1) compared to the time t   by the predefined value of i . For NPV and DPBT calculation, the compensation for the sale of excess electricity to the grid, i.e., the fed-in tariff, increases over the twenty years of simulated life due to an inflation value of 2% per year, an inflation value present in the financial stability program report of the Ministry of Economy and Finance [65].
The parameters values summarized in Table 6 were assumed to evaluate the NPV and DPBT. All the symbols’ meanings and units of measure are summarized in the List of Symbols at the end of the paper.

3. Results

3.1. Energy Potential of Renewable Systems

In the 109 condominiums simulated with the OpenSolar software, it appears possible to install 2.283 MWp of photovoltaic systems on a total surface area of 49,560 m2 of Gross Solar Panel Area (GSPA). The installation of this quantity brings a total yearly production of about 2459 MWh ( E p v Y ) .
The average solar irradiation calculated (https://re.jrc.ec.europa.eu/pvg_tools/en/, accessed on 4 August 2025) in Prato (Lat 43.881 N, long 011.097 E) is 1788.31 kWh/m2 in optimum exposure conditions (Slope 35°, Azimuth 0°), with an estimated annual production of 1390.57 kWh. Our simulation in the Rose Community Designer foresees a significantly lower average production of 1077 kWh. This is partially due to structural issues with roofs, which make it impossible to position the solar panels in the best locations, as well as other losses applied by the software (reflections, dirt, cable and connection losses, inverter efficiency).
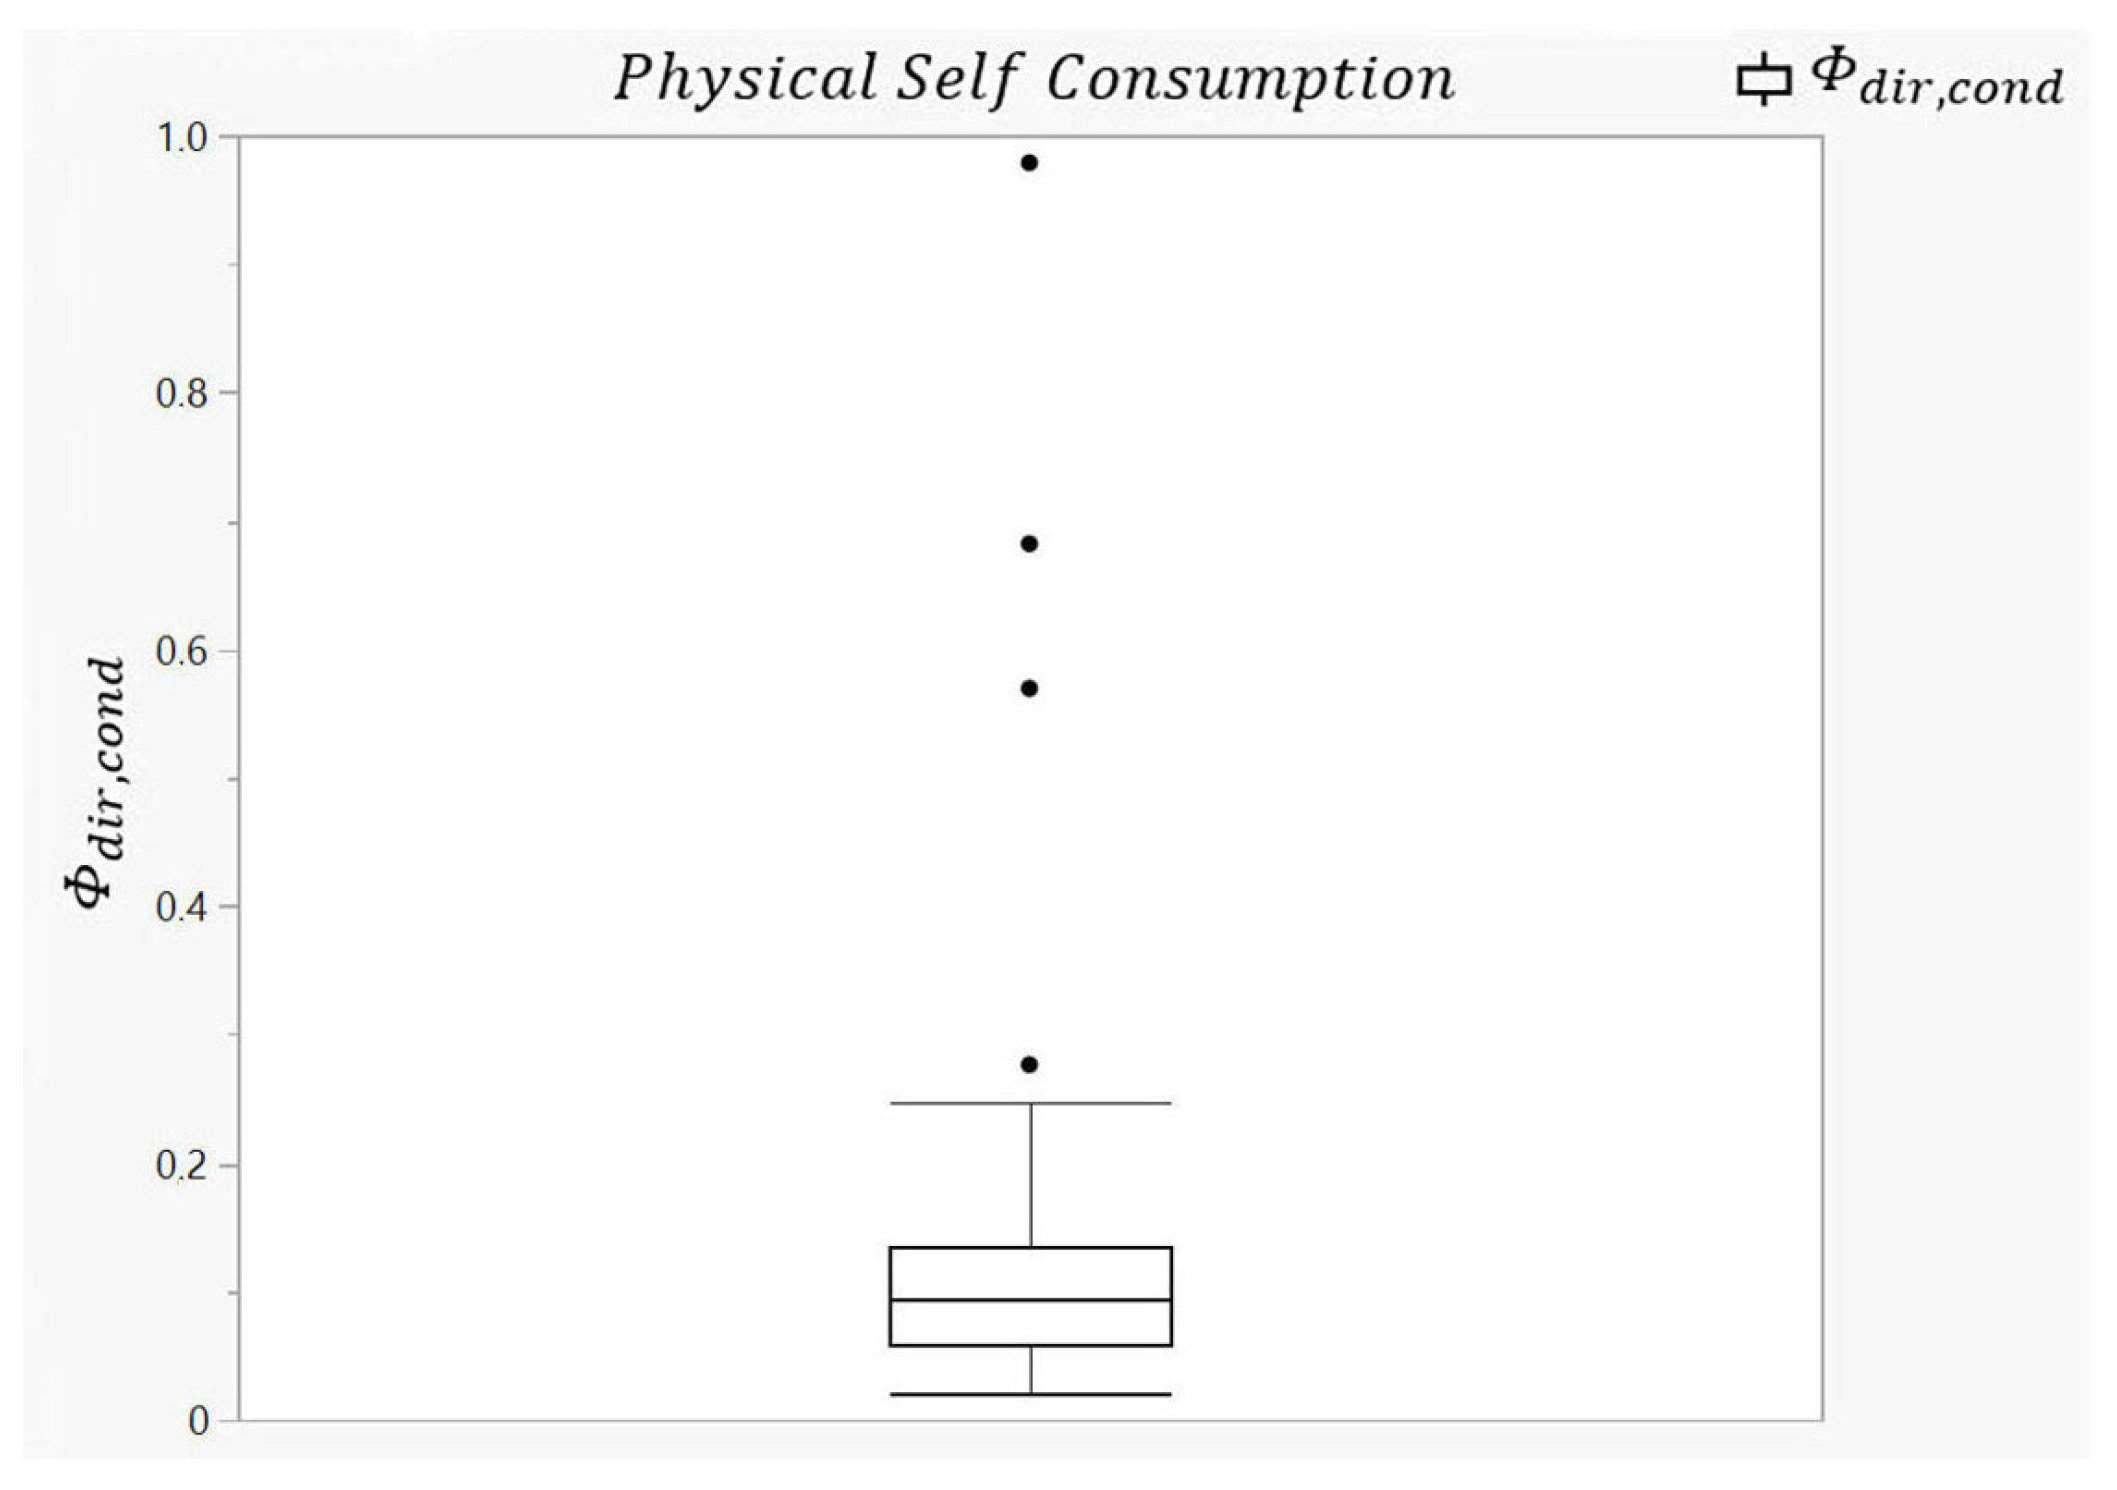
However, even in these conditions, an overall saving of 1305 GtCO2 is forecast, which would otherwise be produced by fossil fuels. On the basis of the real historic consumption data of common areas, the physical self-consumption ( Φ d i r , c o n d ) is therefore limited to an average of 11.32% of the overall energy produced by the systems ( E p v , c o n d Y ) . Figure 5 shows the statistical trend of physical self-consumption ( Φ d i r , c o n d ) . It is possible to observe three outliers, which correspond to three condominiums that highlight a considerable distance from the average. These condominiums have a centralized heat pump system, and therefore, their electricity consumption values are above the sample under examination. The use of condominium heat pumps indeed significantly increases physical self-consumption [74], essentially cancelling out the energy available for sharing in a larger community such as an REC or a JARS system. The real annual overall electricity consumption of the common components of the condominiums is 778.38 MWh ( E p r e v , c o n d Y ) , while the estimated private residential electricity consumption is 8025 MWh ( E p r e v , r e s Y ) .

3.2. Economic Potential

For each condominium, an economic performance analysis was developed using data from the previous system and the results of the production simulation.
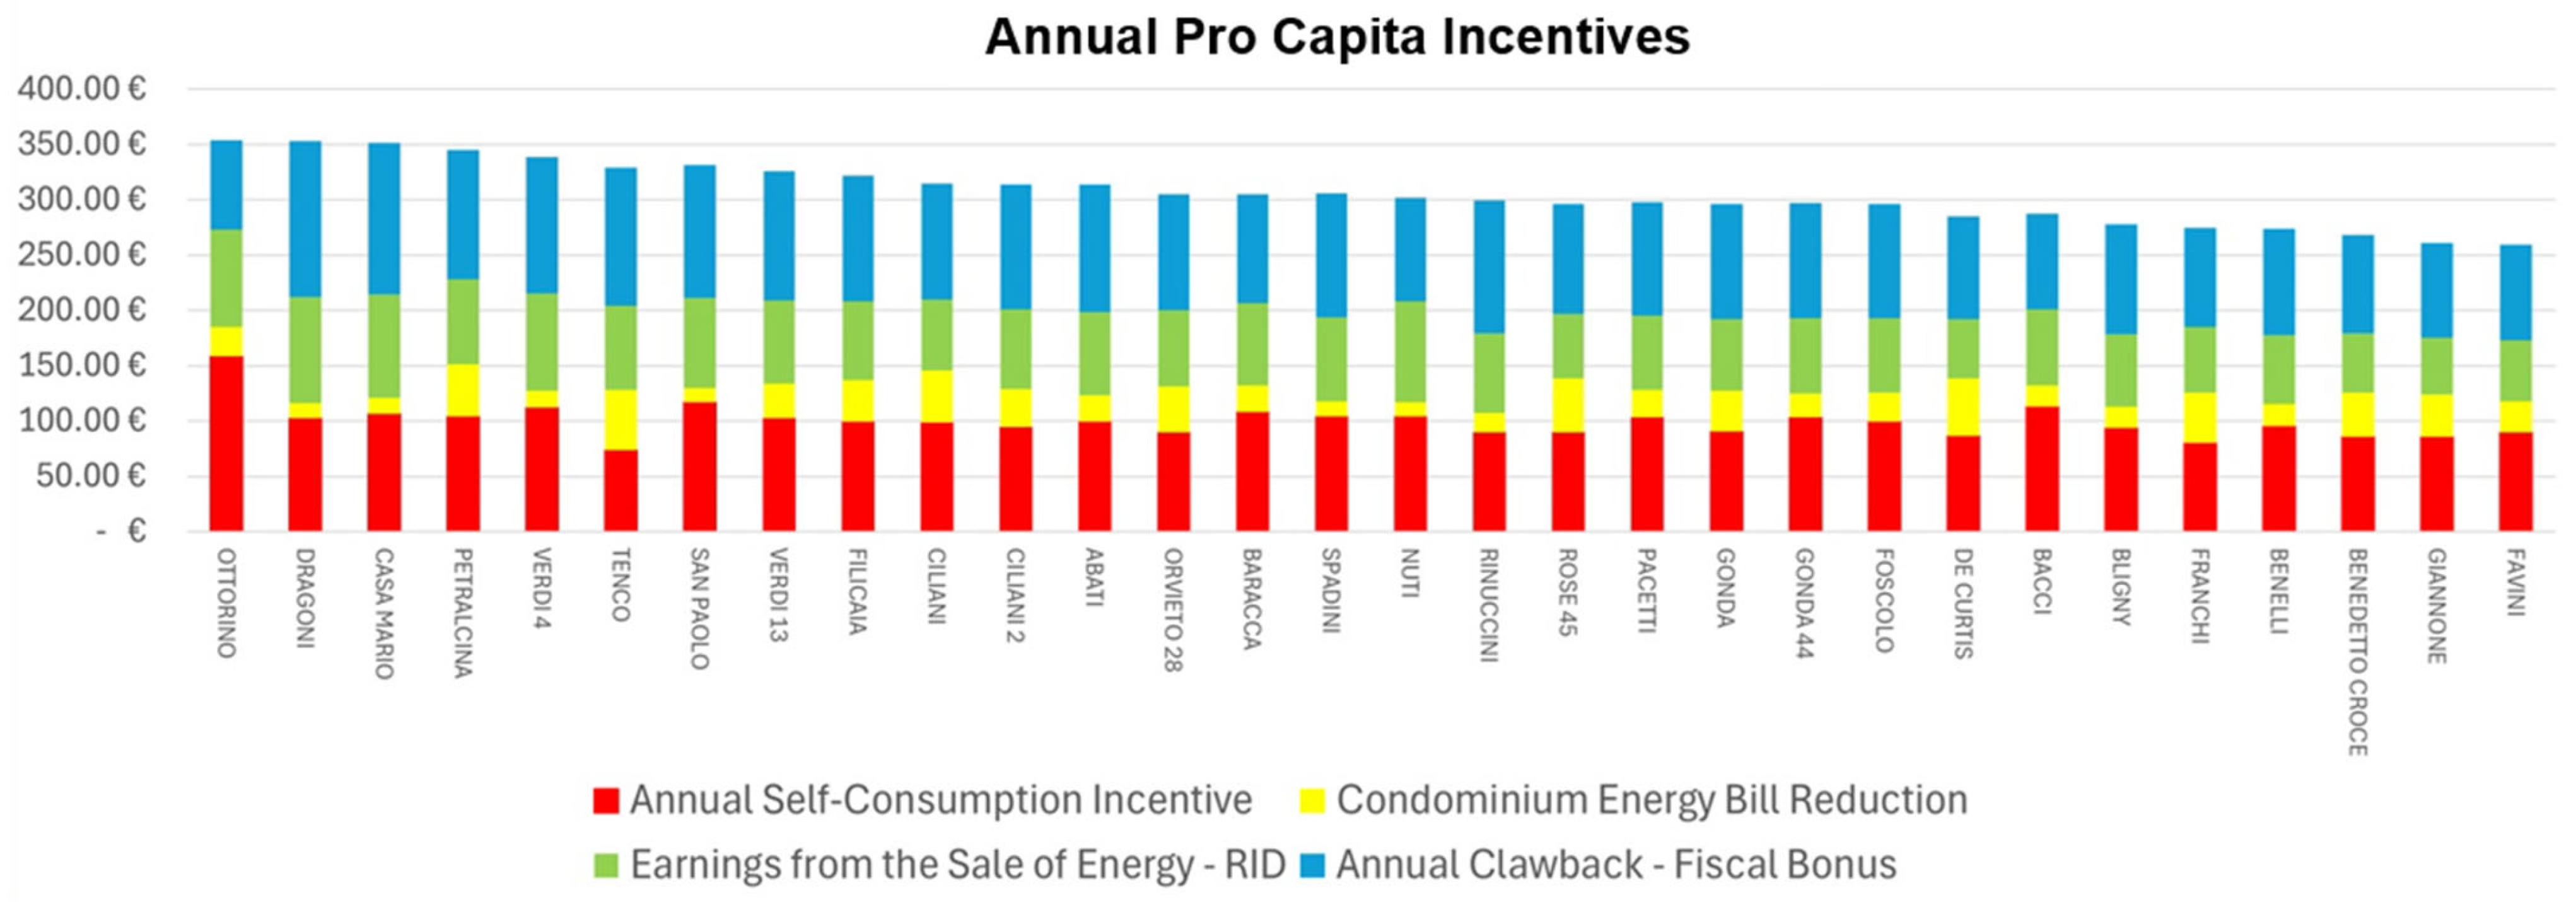
In Italy, the legislation foresees a value of 50% of the fiscal bonus ( β f i s c = 0.5 )   of the value of the installed system divided over 10 years [75]. This value decreased from January 2025 to 36% ( β f i s c = 0.36 ) for non-residential properties [76]. Figure 6 shows these economic parameters summed up for families (per capita) of 30 condominiums out of 109 for the sake of visibility. However, the overall values vary from a maximum of EUR 447.86 to a minimum of EUR 233.13.

3.3. Self-Consumption Incentive

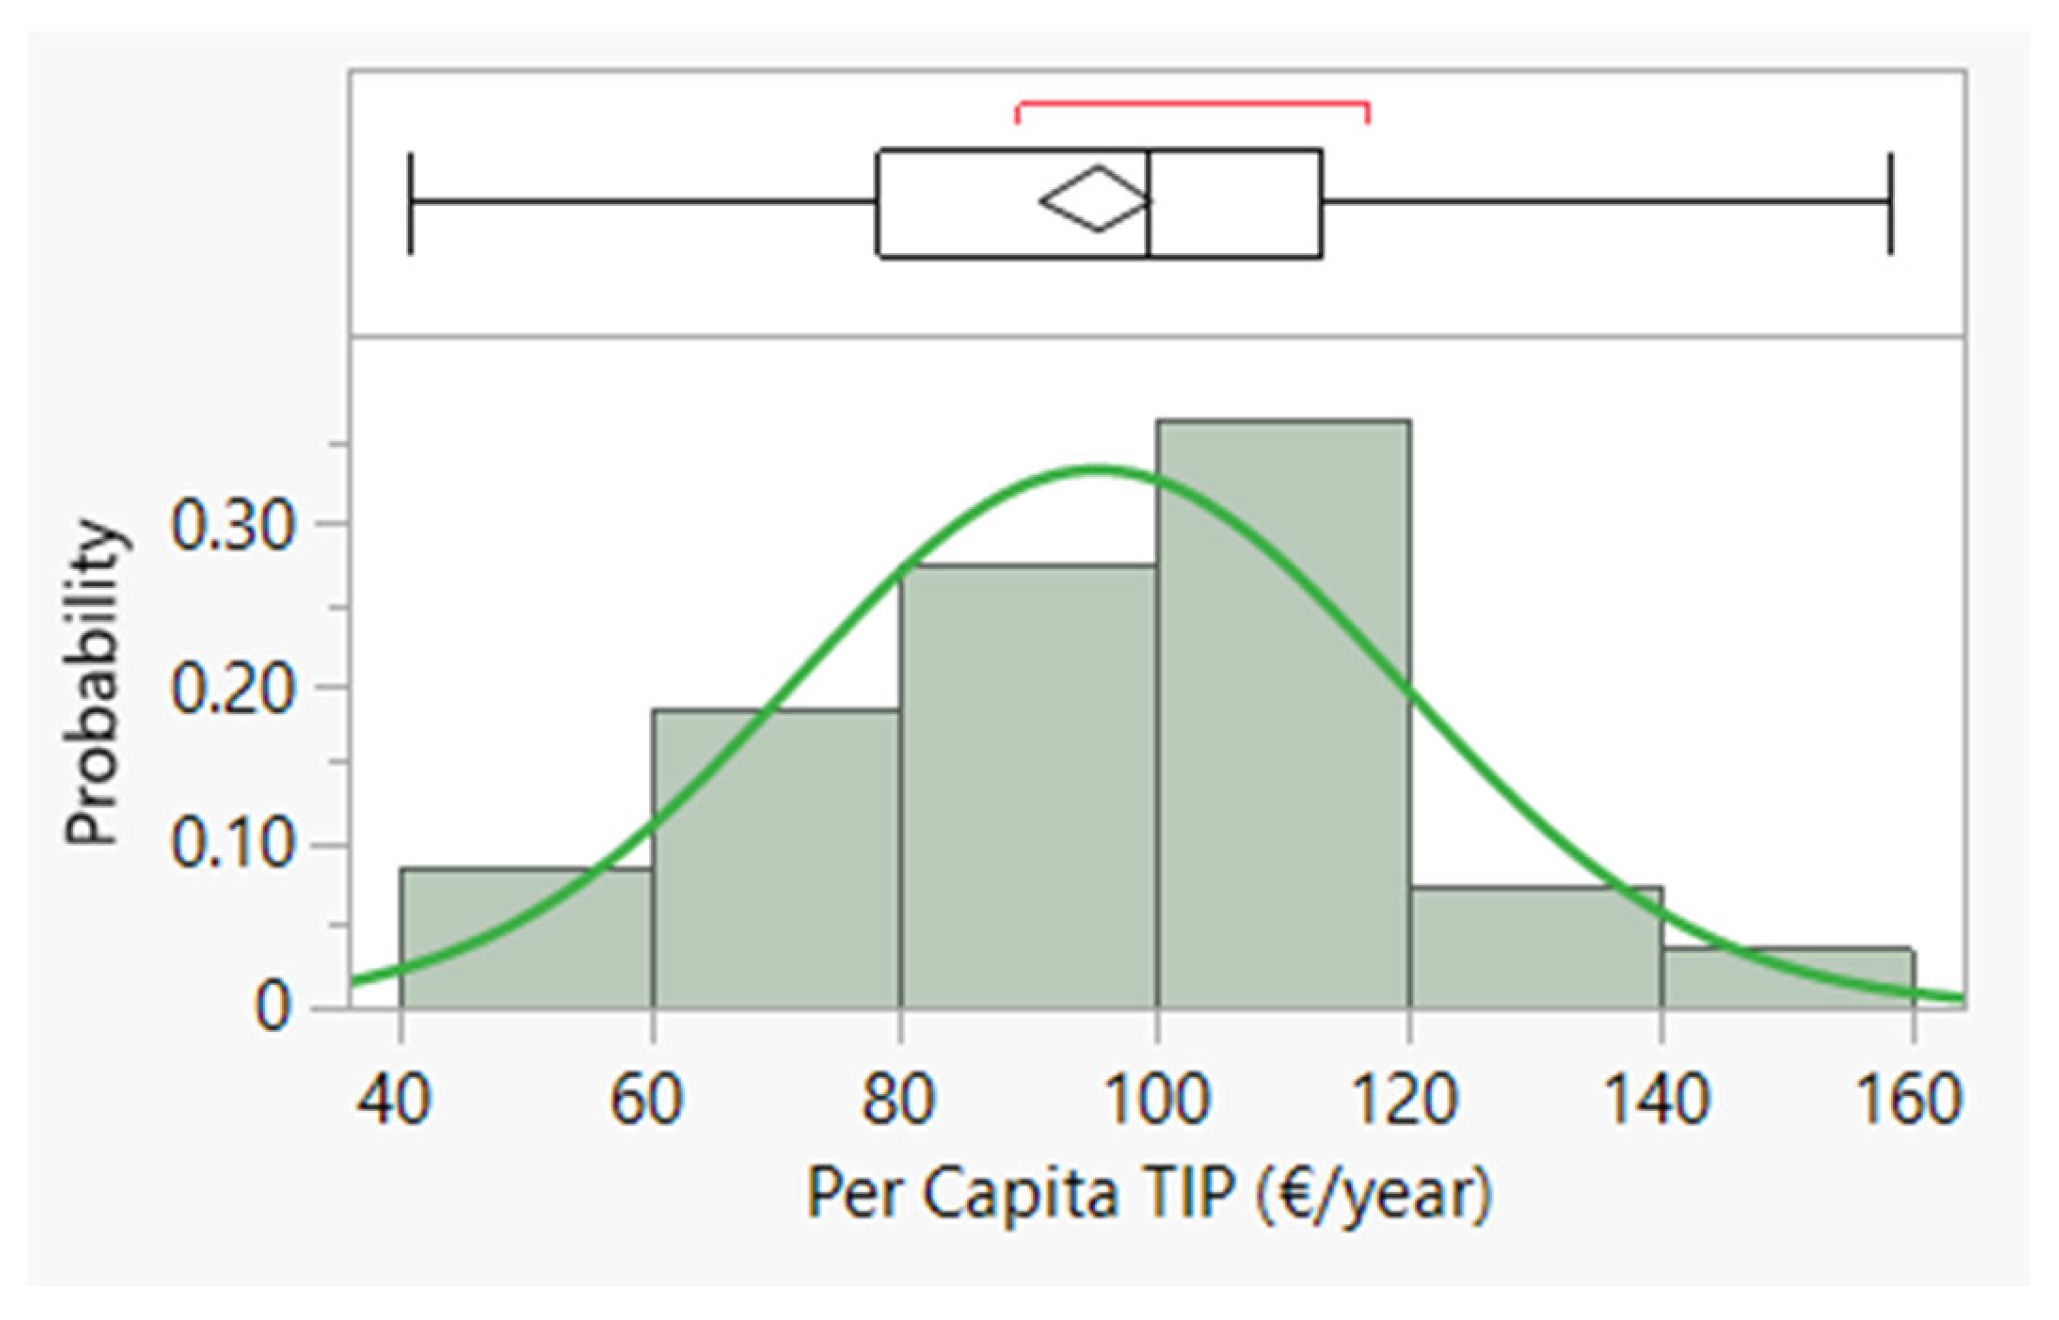
The simulation developed in the JMP software highlights that, thanks to the government incentive, the implementation of JARS would result in an average fiscal bonus of T i n c , c o n d =   92.53 EUR/year for each residential unit with a standard deviation of 27.40. This value is due to an average percentage of shared energy of 79.46%. As seen above, there are three condominiums with particularly high self-consumption ( Φ d i r , c o n d ) due to the presence of an energy-intensive centralized heat pump system. The exclusion of these three outliers from the economic analysis slightly increases the overall average value of the self-consumption incentive and leads to an average fiscal bonus of T i n c , c o n d =   94.39 EUR/year (Figure 7 and Table 7) per residential unit, in line with previous estimates [28].

3.4. Net Present Value (NVP) and Discounted Payback Time (DPBT) Analysis

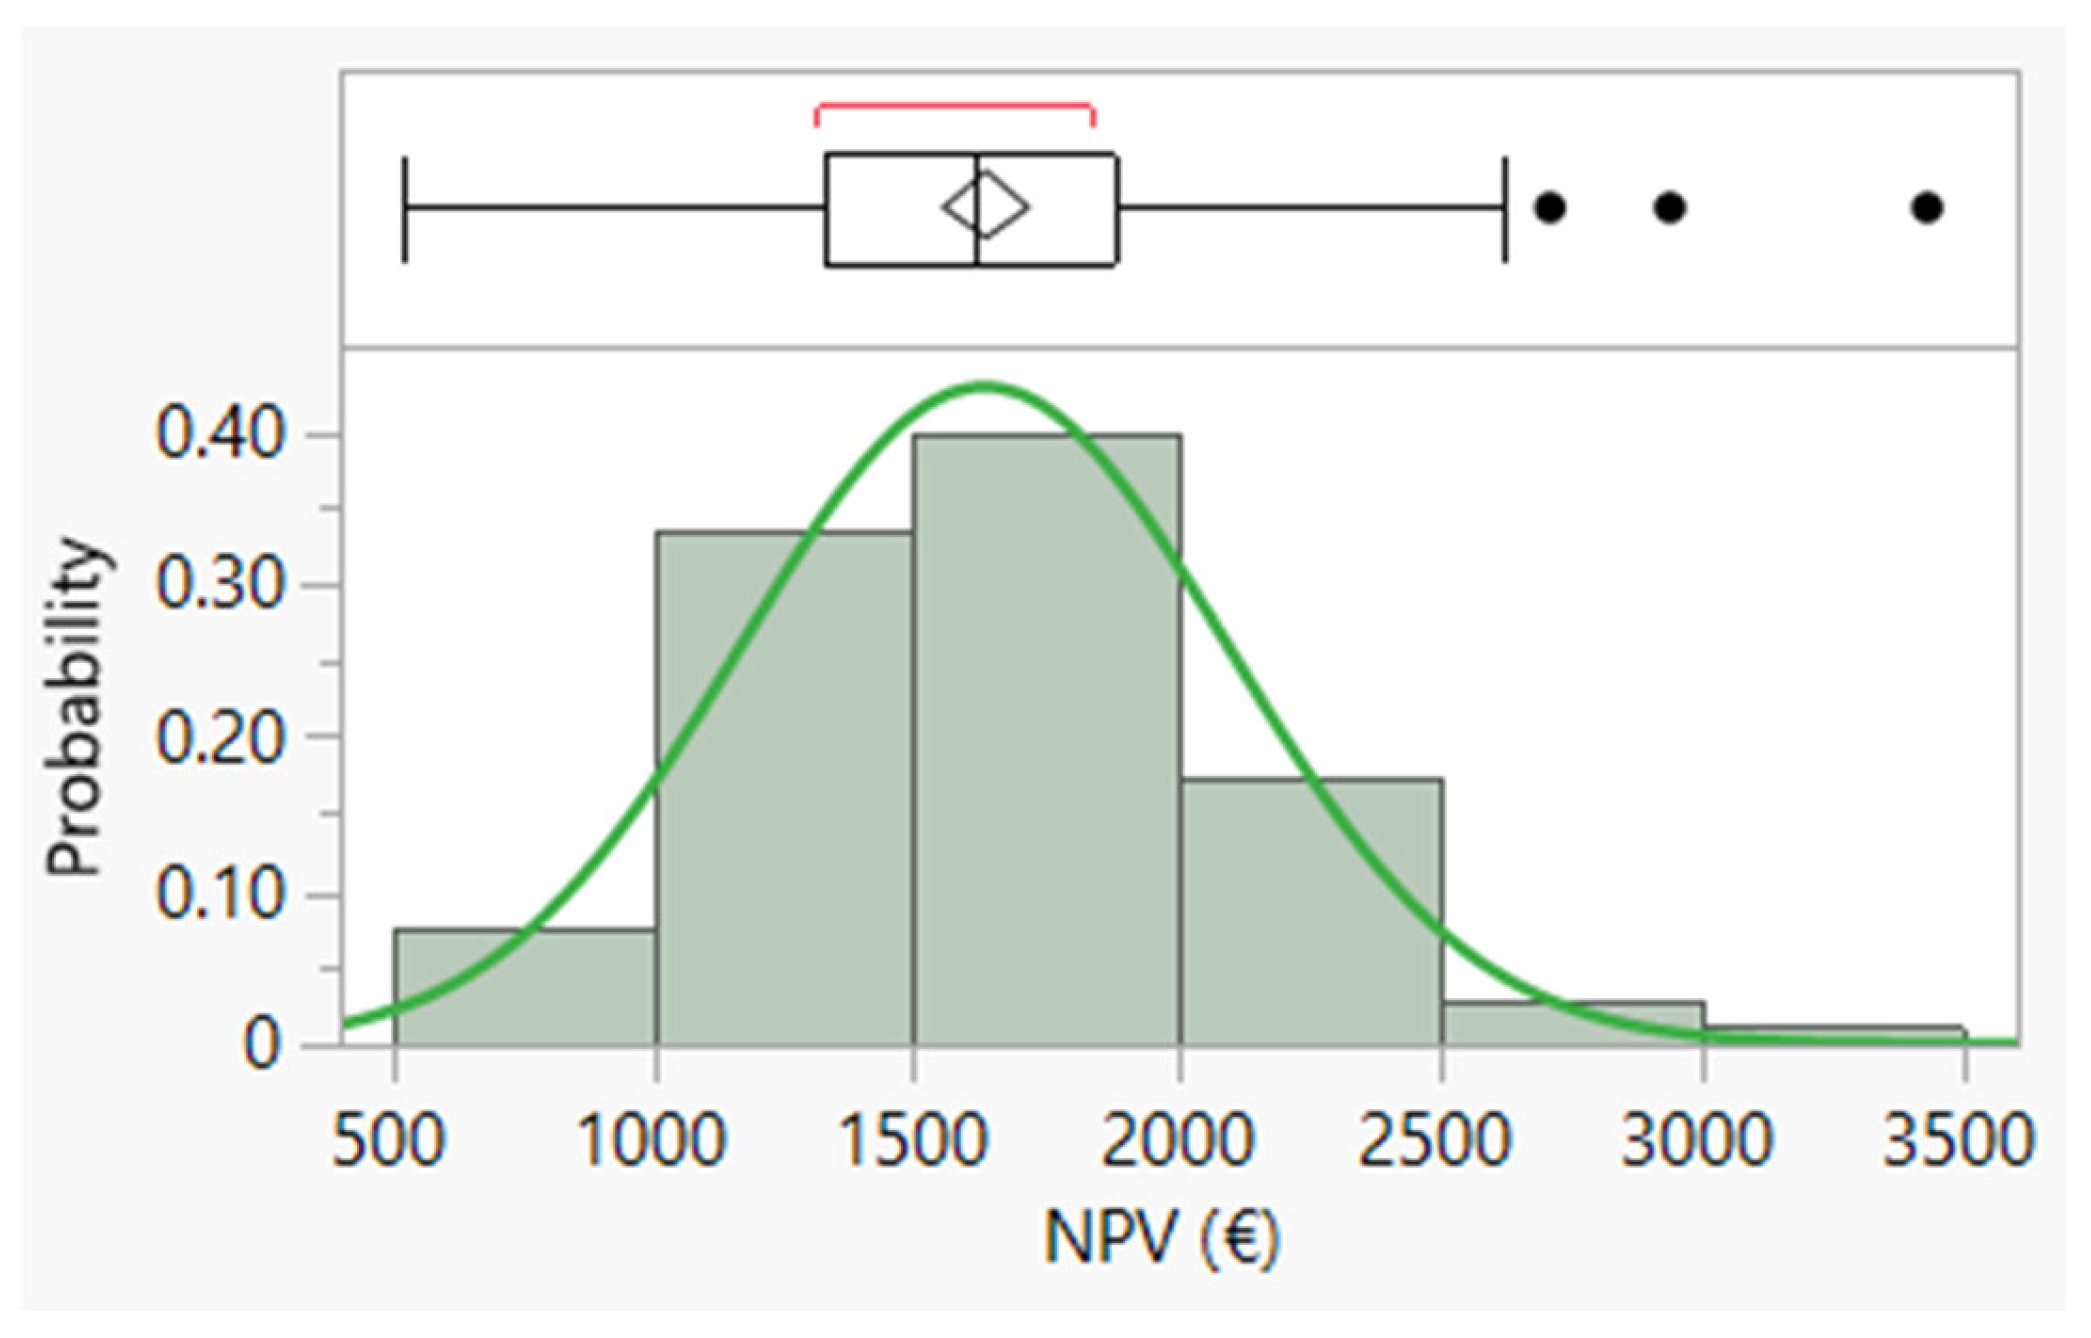
Since the aim of this research was to analyze the economic benefit of each individual family belonging to a JARS group, the cash flow was analyzed using the NVP. Our analysis highlighted an average NPV value of EUR 1683 (Figure 8 and Table 8), with a maximum of EUR 3490 and a minimum of EUR 620. The NPV is sensitive to the cost of energy and to inflation. In fact, changing the annual incremental increase in the price of energy from 0.5%/year to 3%/year brings the NPV from EUR 1683 to EUR 1952 Similarly, an increase in the target inflation annual rate, from 2% to 4%, brings the NPV value from EUR 1683 to EUR 1512
Moreover, the analysis of the DPBT highlights an average investment recovery time of 8.8 years (Figure 9 and Table 9), with a minimum of 5.7 years and a maximum of 12 years. These values are in accordance with former analyses specifically carried out on JARS that highlight ranges between 6.7–8.8 years [37], 5.4–18.9 years [77], and 8 years [78]. This data is robust to both an increase in the inflation and the price of energy. Indeed, a variation in the average annual inflation from 2% to 5% increases the DPBT from 8.8 to 9.06 years. An increase in the price of energy from 0.5% to 3% brings the DPTB from 8.8 to 8.7 years.

3.5. Total Earnings from a Self-Consumption Condominium Configuration

Considering the earnings from a JARS configuration, our simulation highlights an average annual saving of EUR 46.77 ( R c o n d Y ) per family due to the decrease in energy consumption. Additionally, the simulation indicates a potential average annual earning of EUR 77.85 T s o l d , c o n d Y per family from the sale of excess electricity.
In the analysis, the possibility of applying a tax allowance to the photovoltaic investment was hypothesized according to the current incentive parameters, a factor that must be taken into consideration as it is a motive for investing in PV panels [79]. On average, this would produce a further economic benefit of 120.63 EUR/year, which would increase the overall value of all the economic benefits to over 300 EUR/year per family.
The overall economic benefits can increase or decrease based on possible future tax allowance policies (There are two main tax benefit classes: 50% for primary residences and 36% for secondary homes. However, even the 50% rate decreases depending on the declarant’s income, with brackets that vary if the taxable income is above EUR 100K, between EUR 100K and EUR 75K, or below EUR 75K per year [80]—hence the “parameterization” across multiple percentage brackets) other than the purchase and sale price of electricity between a minimum of 233 EUR/year per capita ( β f i s c = 36%,   T R I D at 0.05 EUR/kWh) and a maximum of 447 EUR/year per capita ( β f i s c = 50%, T R I D at 0.19 EUR/kWh), as reported in Table 10.
Figure 10 shows a change in the slope of the growth curve, which is attributed to a discontinuity in the applicable legislation. Specifically, when the Zonal Hourly Price ( P z ) reaches 130 EUR/MWh, a reduction in the incentive is triggered due to the regulatory price threshold, resulting in a slower rate of growth.

3.6. Trend of the Self-Consumption Incentive in Relation to the Condominium Parameters

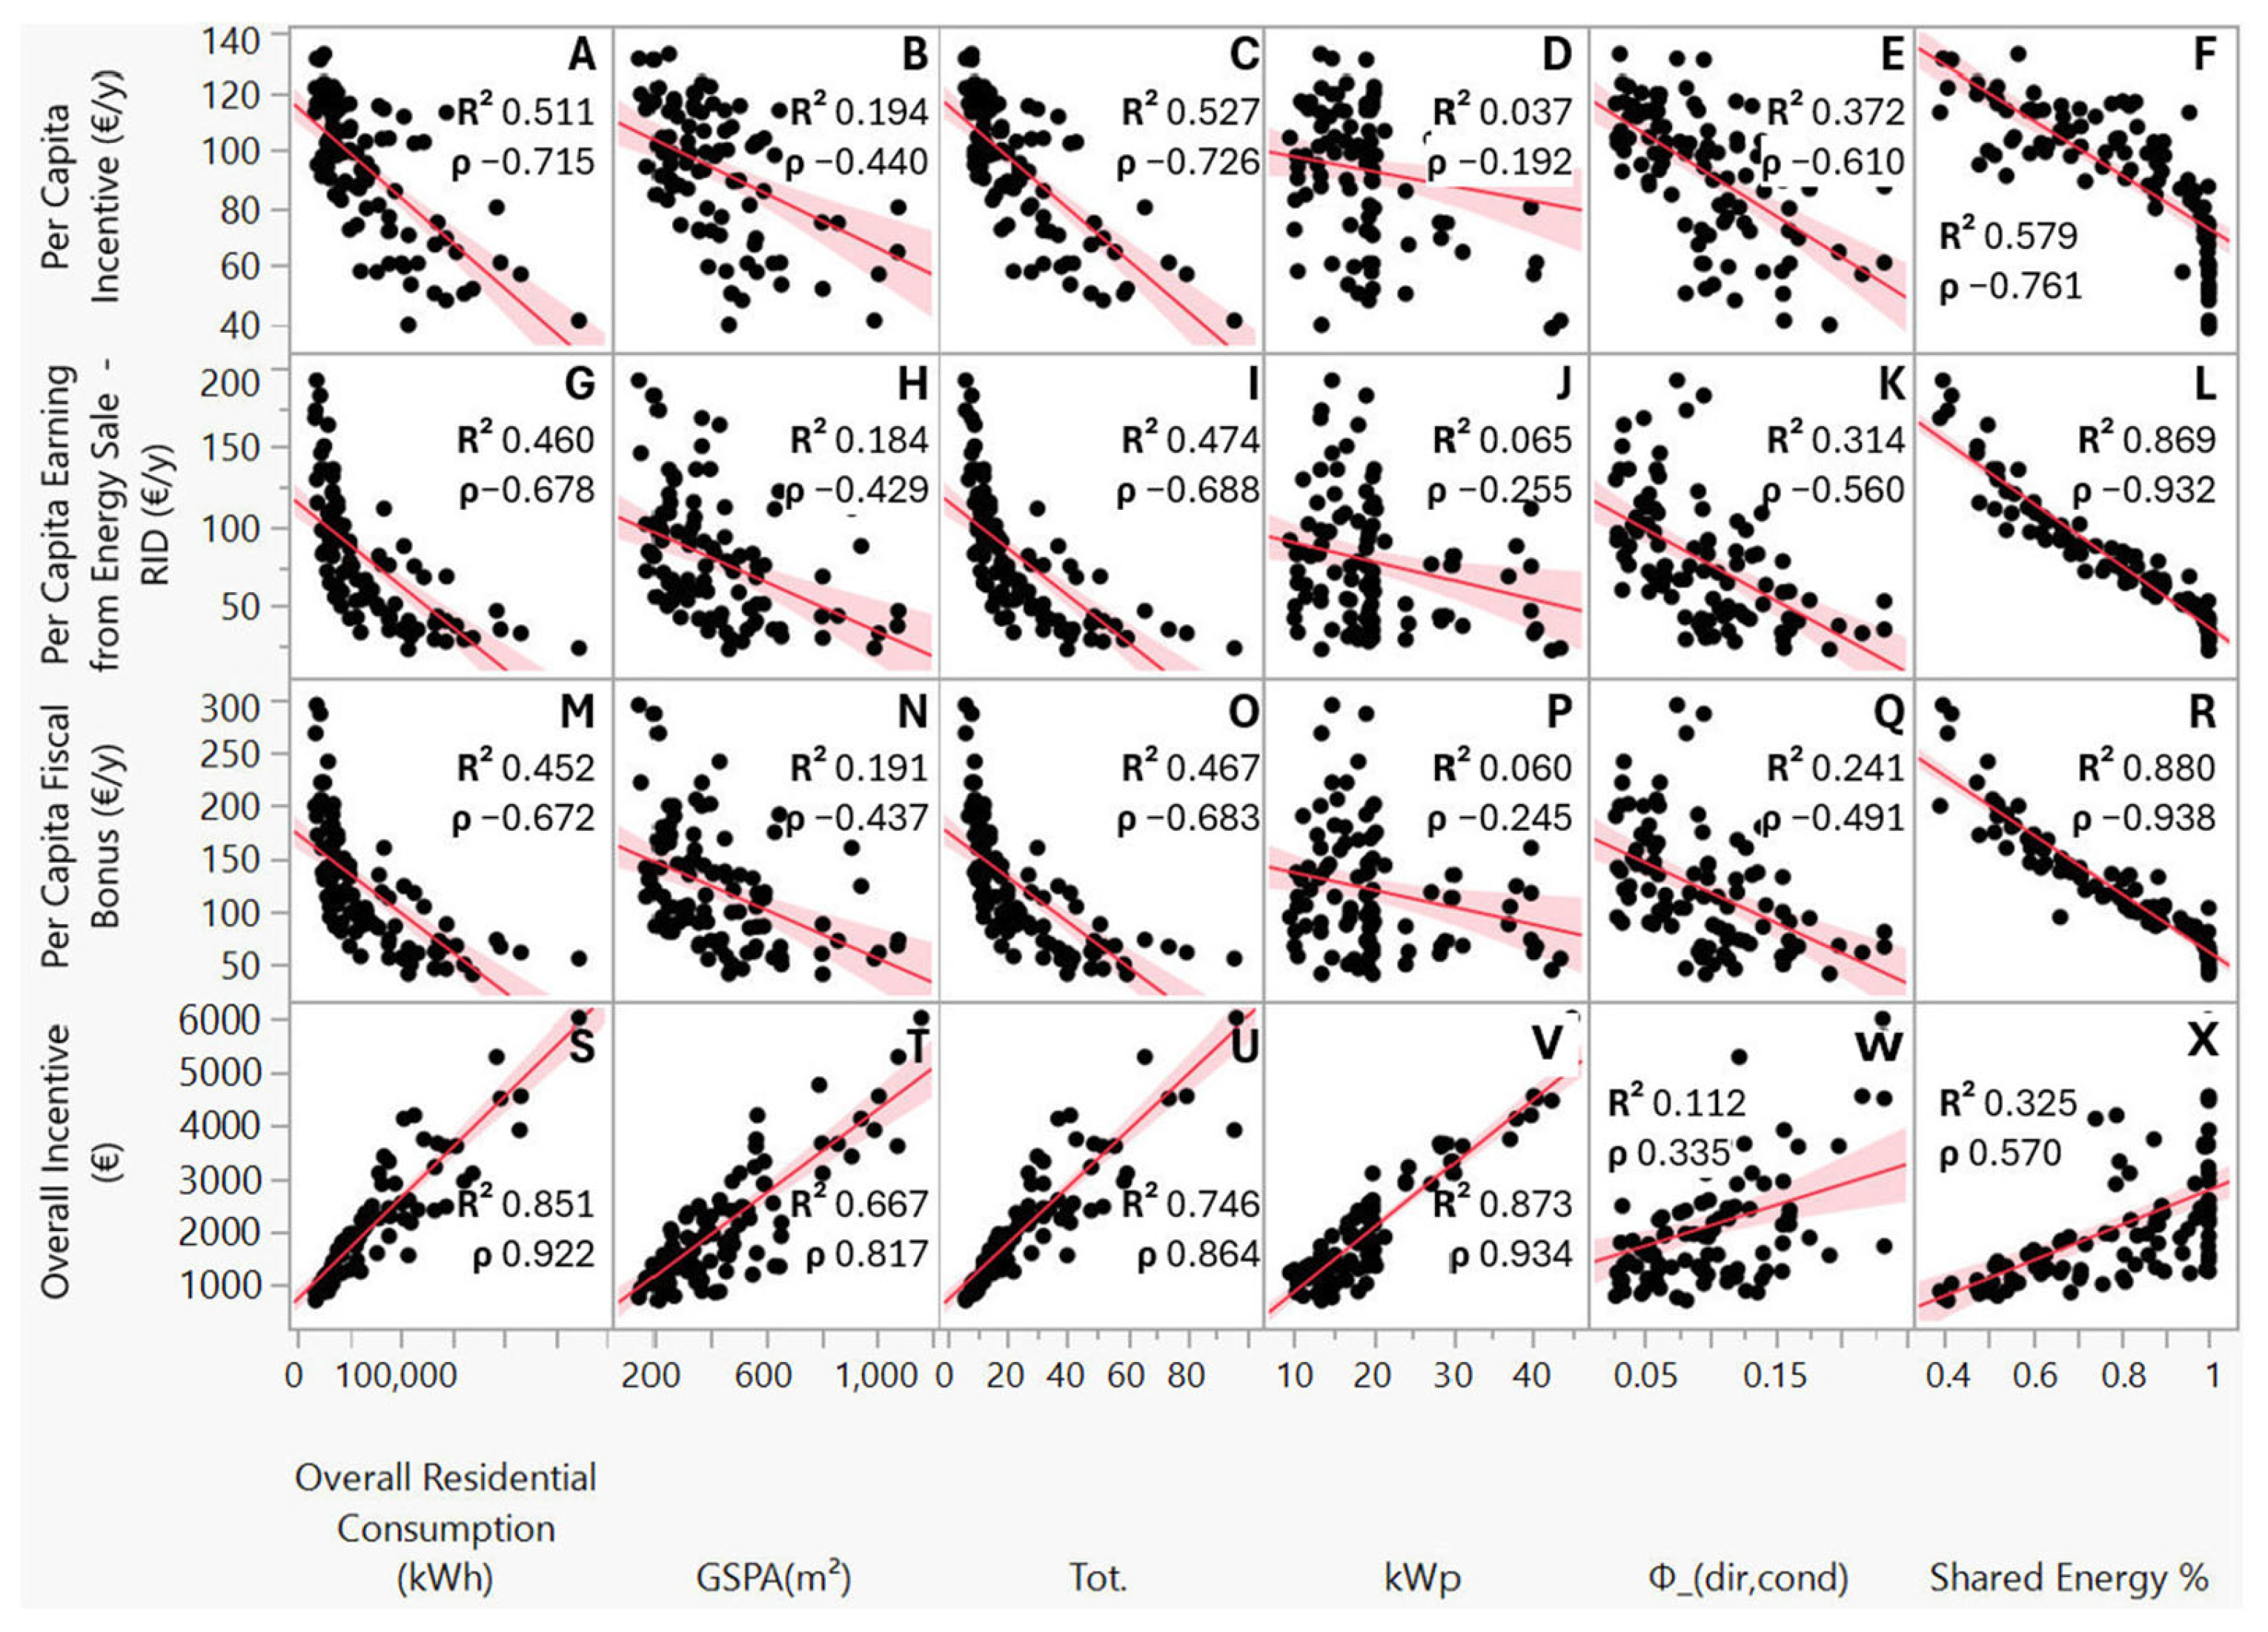
An analysis of possible correlations existing between the economic benefit values (per capita incentive, per capita earning from energy sale, per capita fiscal bonus, and overall incentive) and structural data of the simulated self-consumption configurations (overall residential consumption, gross solar panel area, total number of units (Tot.) belonging to the JARS group, physical self-consumption Φ_(dir,cond), and shared energy) was carried out using a scatterplot (Figure 11). For each set of variables, the coefficient of determination R2, the correlation value ρ, the linear regression, and the confidence interval are reported in Figure 11.
The analysis revealed some remarkable statistical correlations between the per capita incentive and the collected condominium variables.
An inverse correlation is highlighted between the per capita incentive and overall residential consumption ( ρ = 0.715 , Figure 11A). This indicates that as household electricity consumption increases, the absolute volume of physical consumption also rises, leading to greater shared self-consumption. As a result, the amount of incentivized energy consumption increases correspondingly.
There is, additionally, a strong inverse correlation ( ρ = 0.726 , Figure 11C) between the per capita incentive and the total number of units (Tot.) belonging to the JARS group. This indicates that when the number of participants in the JARS increases, considering the photovoltaic productive resources as limited and finite, the per capita incentive decreases, supporting the theory of public goods: sharing resources can generate positive externalities, improving overall societal welfare [81]; however, because these benefits are non-excludable and often shared among many, individual financial gains may be limited or diluted as the number of participants increases. This inverse relationship may be due to the dilution effect in shared incentive schemes. Indeed, as more participants are involved in a community energy project, the available incentive gets distributed among more individuals, thereby reducing the per capita amount. Moreover, while the fitted trend is linear, the spread of points may suggest a non-linear or threshold-based relationship. For example, communities under a certain size (e.g., <25 participants) appear to receive disproportionately higher incentives per capita. This could be due to fixed baseline costs or bonus structures favoring early or small-scale adopters. However, we can exclude the correlation between per capita incentive and the size of the solar panel (ρ = −0.192, Figure 11D).
A further inverse correlation ( ρ = 0.761 , Figure 11F) indicates that when the percentage of shared energy increases, the per capita incentive decreases. In fact, in our simulation, the JARS configurations are not optimized. The economic behavior of the system overall and the per capita consequences are analyzed without optimizing the behavior of individual users. This confirms previous theories [82] that analyzed how self-consumption increases as the number of participants increases, as shown by gradually less significant contributions. In the case of JARS, an increase in participants could lead to a larger subdivision of the incentive without a noticeable increase in already-saturated self-consumption.
Additionally, the statistical analysis of the overall undivided incentive with collected condominium variables results in strong correlations. The results reveal strong linear relationships between the overall incentive and three key variables: the overall residential consumption (Figure 11S), the gross surface area available for photovoltaic installation—GSPA (Figure 11T)—and the total installed capacity (Figure 11V). Among these, the strongest correlations were observed with installed power and residential consumption, indicating that the technical dimension of the system design and actual energy demand are the primary drivers of incentive magnitude.
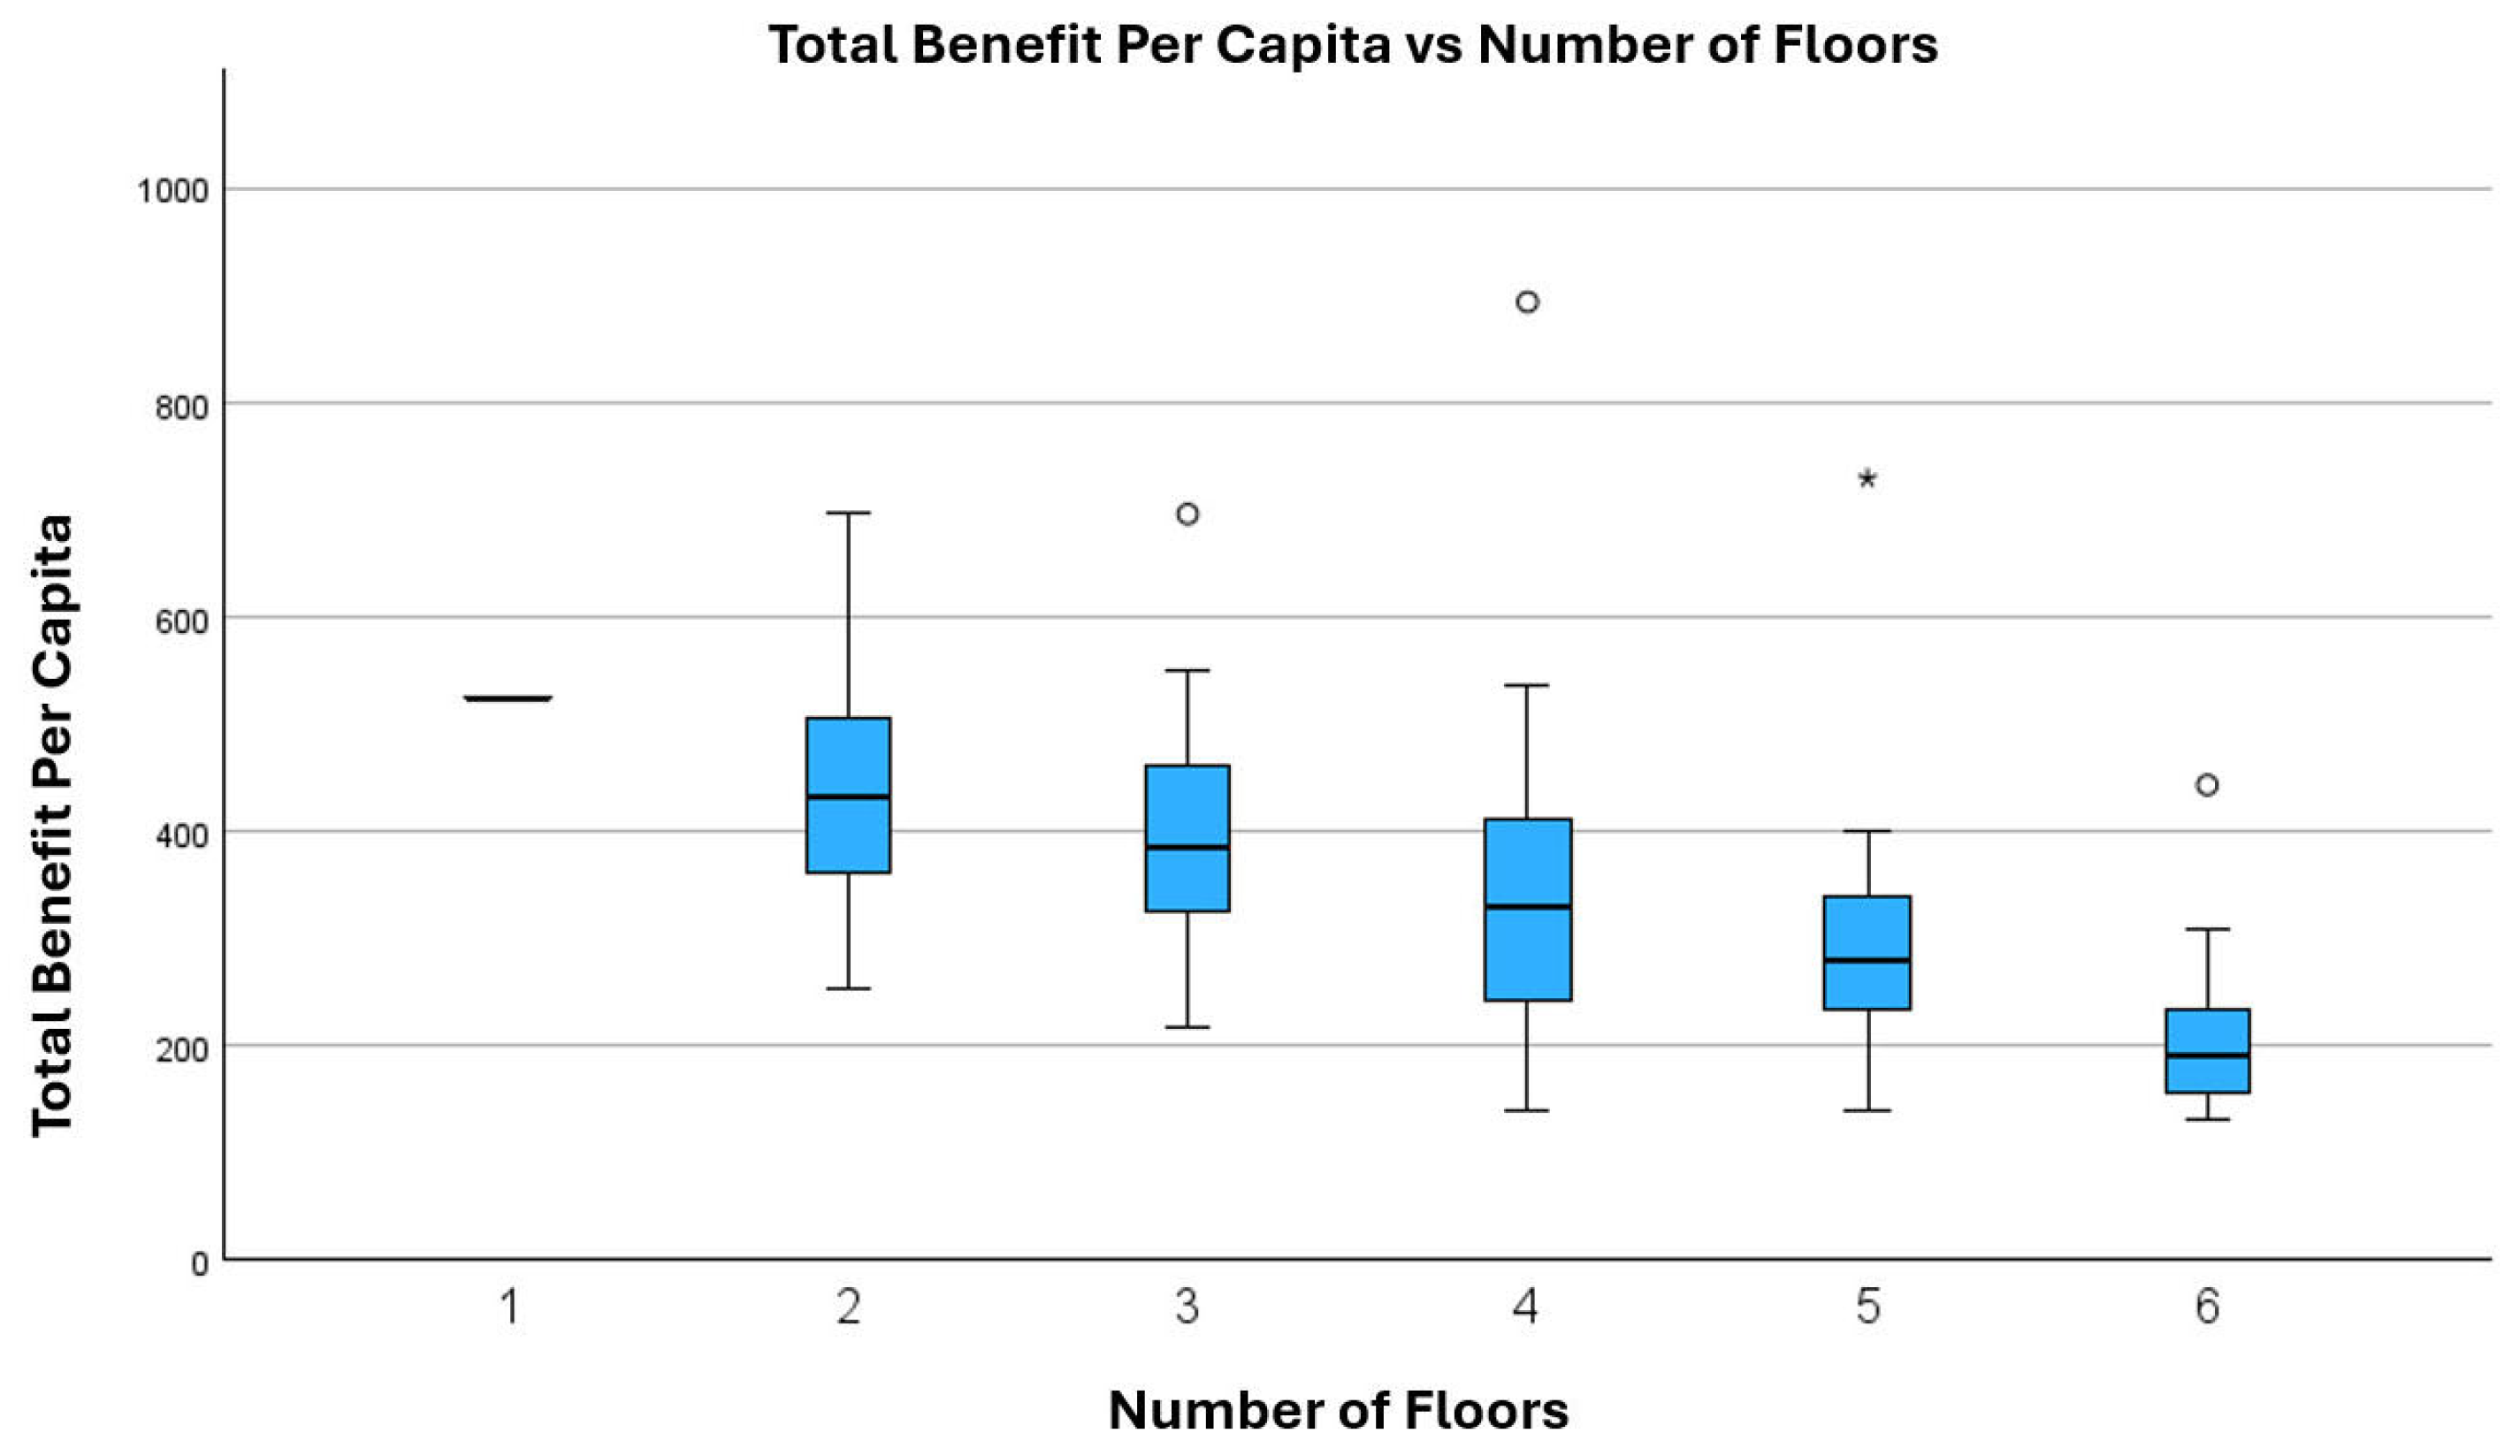
The correlation between the value of the total benefit per capita and the self-consumption incentive per capita, with the number of floors of the building using the JARS system, was also analyzed. Unlike the previous analysis, the variable regarding the number of floors was considered as an ordinal variable, and, for the analysis, Spearman’s non-parametric correlation coefficient (ρ) was used.
The analysis highlights that the values of the total per capita benefit are negatively correlated with the number of floors. Although this is a modest correlation, it is statistically significant (Table 11). In fact, from Figure 12, it is possible to observe the effects of this correlation, where as the number of floors increases, the total benefit per capita tends to decrease. An increase in the number of floors does not correspond directly to an increase in the roof area available for installing additional photovoltaic panels, so as the number of floors increases, the number of participants in the self-consumption configuration increases, diluting the generated incentive for each participant.

3.7. Other Economic Parameters in Relation to the Percentage of Shared Energy

Thanks to a scatterplot matrix, it was possible to highlight two other strong correlations. Both the first ( ρ = 0.938 , Figure 11R) and second ( ρ = 0.932 , Figure 11L) correlation highlight that the tax benefit ( B f i s c Y ) and the earnings from the sale of the energy produced ( T s o l d , c o n d Y ) decrease with an increase in the percentage of shared energy. These strong correlations highlight the direct dependence between the economic benefits resulting from the sale of energy produced and the fiscal bonus resulting from photovoltaic investment, values that are directly proportional to the investment made. However, these correlations, although strong, were analyzed last because their behavior represents a benefit, albeit significant, only complementary to the self-consumption of energy, which is the basis of this study.
It is possible to conclude that an increase in the percentage of energy sharing is not necessarily a positive factor for individual participants in the self-consumption group. This is visible especially in this case, where the benefits are equally redistributed between all the members without precise computations via specific technologies [83] such as smart meters.

3.8. Comparison Between JARS Groups and RECs

The simulation conducted on the 109 condominiums highlights a 11.32% average rate of physical self-consumption ( Φ d i r , c o n d ) of the energy produced and a 79.29% rate of shared, but not physically consumed, energy. This indicates that, on average, the flat owners in the buildings can self-consume, virtually and remotely, about 90% of the energy produced on their roofs without changing their energy consumption behavior. When these systems are shared not only within individual condominiums but among a broader group of users—such as other JARS groups located within the same primary substation—the share of jointly consumed energy increases substantially, as permitted under current Italian legislation. Table 12 illustrates this effect by comparing three primary substations (red, yellow, and green). In each case, integration into RECs results in higher energy sharing rates: from 78–80% in the JARS setting to 90–97% in the REC configuration. This corresponds to an increase of EUR 21.094 in total incentives. These figures indicate that scaling from individual JARS systems to collective REC configurations can lead to meaningful economic gains at the community level, despite the modest per-user benefit due to the number of participants involved.
Improved economic performance is possible due to the different consumption profiles present in a wider energy community. In residential condominiums, indeed, electricity consumption typically peaks in the morning and evening, while photovoltaic generation is concentrated during daytime hours [84]. By aggregating multiple buildings into Renewable Energy Communities (RECs), surplus energy can be redistributed to commercial and business consumers with daytime demand profiles [85], thereby increasing the overall share of locally shared consumption.
However, this comparison is currently limited to a small sample of primary substations. While the observed trend supports previous research showing that broader energy sharing through RECs can enhance economic performance [51], caution must be exercised when generalizing these findings. Future works will aim to expand the number of substations analyzed and apply statistical validation to reinforce the robustness of these results. Additionally, while RECs offer higher aggregate incentives, their implementation may involve greater setup and management complexity than JARS-only configurations—factors that should be weighed in future studies.

4. Conclusions

Jointly acting renewable self-consumption can be a helpful solution during the delicate phases of the future energy transition [86]. Our research aims to fill a gap in the literature on collective condominium self-consumption. This study analyzes the overall advantage for a family wishing to actively take part in the energy transition, not just as an active consumer but also as an ecopreneur [50]. This was evaluated through a broader statistical base compared to previous studies which focused on a few isolated condominiums [37].
The analysis has highlighted that, thanks to the government contribution to incentivize energy self-consumption, a family can receive an average of 94.34 EUR/year, with an average investment recovery time of 8.8 years. This value further increases when all the economic profits linked to this use of renewable energy sources are taken into consideration. In fact, a decrease in the energy costs of shared areas, the profit linked to the sale of excess energy, and tax benefits lead to a total average benefit up to 340 EUR/year, and this result can be taken into consideration as an estimated average value for those who, in Italy, want to implement shared self-consumption at the condominium level in the form of JARS.
However, this value can vary due to parameters that cannot be controlled by the consumer, such as the percentage of tax deduction, managed by state policies, and the energy sale and purchase price, established by difficulties in the energy market. The analysis highlights other variables that considerably modify the degree of incentive and the global benefit, coming from photovoltaic investment and from the formation of JARS groups. These are the overall number of participants in the self-consumption group and the number of floors in the building where the energy is shared. An increase in participants, indeed, decreases the absolute average of the individual economic return, even if the initial investment is proportionally less important. At the same time, although the statistical sample is limited to buildings with up to six floors, though in-line with the Italian rate of 90.3% of residential buildings [46], we can underline from our analysis that taller buildings produce lower incomes per capita. Therefore, large buildings with many apartment owners may not be the most attractive configuration for setting up a JARS group. It is also possible to notice that the sums seen may not be attractive enough to push individual apartment owners to invest in shared renewable energy sources, unless influenced at the same time by other non-economic reasons.
Statistical analysis shows that the per capita value of the incentive is inversely proportional to the number of families within the building and to the number of floors in the building. The per capita value of the incentive, instead, increases proportionally with the increase in overall consumption.
A comparison was also made between the jointly acting renewable shared energy and physical self-consumption rates generated by a condominium’s participation in JARS configurations and participation in an REC with all condominiums belonging to the same primary station. The REC configuration shows higher shared energy rates and economic benefits than the JARS configuration. Switching condominiums from a JARS system to an REC configuration led to an increase in the shared energy rate from 78% up to 93%. This increase in shared energy rates leads, also, to a proportional increase in economic benefits. This is in line with previous research indicating that larger JARS configurations offer greater benefits and should encourage condominiums’ participation in Renewable Energy Communities rather than individual self-consumption configurations.
This study presents the geographical limit of the Italian territory due to the specificities related to the incentives for energy self-consumption and tax bonuses that are granted according to national regulations and that can be substantially different from country to country. Our model provides a flexible base that can be recalibrated for geographical areas and legislative contexts. This adaptability enhances the model’s relevance for both comparative research and real-world deployment across diverse urban environments.
The applicability to other contexts, however, implies the presence of a supportive regulatory framework together with adjustments to model inputs such as prosumer rights, local incentives, user behavior, and technical conditions.
Indeed, in the event of changes to legislation or incentive schemes, the analysis must be re-evaluated to ensure alignment with the updated regulatory and economic framework. The effectiveness of JARS configurations is tightly linked to the incentive landscape, which shapes their financial attractiveness and feasibility. Our results show that economic viability is particularly sensitive to upfront investment costs and access to financing mechanisms—especially for condominium-based implementations, which currently make up the majority of potential participants. In this context, one policy change that could facilitate the adoption of self-consumption configurations is allowing households to receive tax credit benefits for PV systems upfront through a direct discount on the supplier’s invoice. This incentive was discontinued in Italy as of February 2023 due to widespread misuse, but developing similarly accessible financing schemes could lower entry barriers for residential users and accelerate participation.
Moreover, tailoring incentive structures to favor collective self-consumption configurations over individual ones or to support smaller-scale communities may help ensure a more equitable and widespread rollout. Such calibrated approaches could make the JARS model not only more effective but also more inclusive and aligned with the decentralized vision promoted by EU energy directives.
Future work will also explore the potential role of condominium and building managers as aggregators of Jointly Acting Renewable Self-consumption (JARS). To this end, it is necessary to conduct a study based on a statistical sample of building managers to assess whether allocating a portion of the incentive could serve as an effective mechanism to encourage them to promote the formation of self-consumption groups within the buildings they manage, expanding the sample for analysis by increasing the number of buildings, households, and primary substations involved.
Future work should explore how different incentive structures affect the adoption and performance of JARS configurations under varying regulatory and socio-technical conditions. Furthermore, the legislation for the establishment of these forms of energy sharing is decidedly recent and will make it necessary to compare simulated data with real data obtained from the actual establishment of configurations in a fully operational mode. While our analysis is based on static user behavior, future developments in automation technologies and supportive policy frameworks could significantly alter consumption patterns, underscoring the need for further research that incorporates dynamic demand-side participation and its potential rebound effects. The model was partially built on available data complemented by average statistical consumption figures, and the results may provide valuable insights for industry stakeholders and might help address an existing gap in the literature.
We believe that a more in-depth analysis of the increase in self-consumption due to energy sharing between multiple condominiums is necessary by analyzing economic models in RECs consisting of the aggregation of multiple condominiums.
Author Contributions

Conceptualization, C.M.; Methodology, C.M. and M.C.; Software, C.M.; Formal analysis, C.M.; Investigation, M.C.; Writing—review & editing, M.C.; Supervision, S.F. and F.C. All authors have read and agreed to the published version of the manuscript.

Funding

This research received no external funding.

Data Availability Statement

The datasets presented in this article are not readily available because of privacy policies.

Conflicts of Interest

The authors declare no conflicts of interest. The funders had no role in the design of the study; in the collection, analyses, or interpretation of data; in the writing of the manuscript; or in the decision to publish the results.

Nomenclature

List of abbreviations
JARSJointly Acting Renewable Self-consumption
RECRenewable Energy Community
RESRenewable Energy Sources
CSCCollective Self-Consumption
CECCitizens’ Energy Community
DERDistributed Energy Resources
IRRInternal Rate of Return
NPVNet Present Value
DPBTDiscounted Payback Time
GSPAGross Solar Panel Area
TIPIncentive Premium Rate (Tariffa Incentivante Premio)
List of symbols
A C P V Y Annual Running CostEUR/Wp
B f i s c Y Annual Fiscal BonusEUR/year
β f i s c Annual Percentage of Fiscal Bonus%
C a s s , c o n d Y Overall Annual insurance costEUR
C F t o t , c o n d Y Condominium Net of Cash OutflowsEUR
C g e s t , c o n d Y Overall Annual Running Costs of the JARSEUR
C i n v , c o n d t = 0 Total Initial Cost of Photovoltaic PanelsEUR
C m a n , c o n d Y Overall Annual system maintenance costEUR
C O c o n d Y C O 2 Savedkg CO2/year
C P V Photovoltaics CostEUR/Wp
DPBTDiscounted Payback Timeyear
E i m m , c o n d Y Annual Energy InputkWh/year
E p r e v , c o n d Y Annual Condominium Energy Withdrawn (from the grid)kWh/year
E p r e v , r e s Y Annual Residential Energy Withdrawn (from the grid)kWh/year
E p v , c o n d Y Annual Energy Production kWh/year
E s h r , c o n d Y Annual Shared Energy kWh/year
M C P V Y Annual Maintenance Cost EUR/Wp
NLifetime of Project year
N P V c o n d Condominium Net Present Value EUR
P c o n d Y Average Energy Purchase Price Including Excise Duties EUR/kWh
P P V i n s t Installed Power Capacity of PV System kWp
P z Zonal Hourly Price of Electricity EUR/kWh
ρ Correlation ( ± R 2 ) -
R 2 Coefficient of Determination -
R c o n d Y Annual Condominium Energy Bill Saving EUR/year
T i n c , c o n d Y Annual Self-Consumption Incentive EUR/year
T I P Incentive Premium Rate (Tariffa Incentivante Premio) EUR/MWh
T R I D d , h Compensation for Energy Input EUR/kWh
T R I D , c o n d Y = 1 Earnings from the Sale of Energy—RID EUR/year
T s o l d , c o n d Y Annual Compensation for the Sale of Excess Electricity EUR/year
Φ d i r , c o n d Physical Self-Consumption %

References

  1. Nouicer, A.; Meeus, L. The EU Clean Energy Package; Robert Schuman Centre for Advanced Studies, European University Institute: Fiesole, Italy, 2019. [Google Scholar]
  2. Roberts, J. What Are Energy Communities Under the EU’s Clean Energy Package? In Renewable Energy Communities and the Low Carbon Energy Transition in Europe; Coenen, F.H.J.M., Hoppe, T., Eds.; Palgrave Macmillan: Cham, Switzerland, 2021. [Google Scholar]
  3. European Union. Directive (EU) 2018/2001 of the European Parliament and of the Council of 11 December 2018 on the Promotion of the Use of Energy from Renewable Sources (Recast). Off. J. Eur. Union 2018, L 328/82, 82–209.
  4. Petrovich, B.; Kubli, M. Energy communities for companies: Executives’ preferences for local and renewable energy procurement. Renew. Sustain. Energy Rev. 2023, 184, 113506. [Google Scholar] [CrossRef]
  5. European Union. Directive (EU) 2019/944 of the European Parliament and of the Council of 5 June 2019 on Common Rules for the Internal Market for Electricity and Amending Directive 2012/27/EU (Recast). Off. J. Eur. Union 2019, L 158/125, 125–199.
  6. Frieden, D.; Tuerk, A.; Neumann, C.; d’Herbemont, S. Collective Self-Consumption and Energy Communities: Trends and Challenges in the Transposition of the EU Framework; REScoop.eu: Brussels, Belgium, 2020. [Google Scholar]
  7. European Union. Housing in Europe—2023 Edition. Available online: https://ec.europa.eu/eurostat/web/interactive-publications/housing-2023 (accessed on 4 August 2025).
  8. Ahmed, S.; Ali, A.; D’Angola, A. A Review of Renewable Energy Communities: Concepts, Scope, Progress, Challenges, and Recommendations. Sustainability 2024, 16, 1749. [Google Scholar] [CrossRef]
  9. Walker, G.; Devine-Wright, P. Community renewable energy: What should it mean? Energy Policy 2008, 36, 497–500. [Google Scholar] [CrossRef]
  10. Available online: https://www.rescoop.eu/ (accessed on 4 August 2025).
  11. MISE—Ministry of Economic Development. Decreto Ministeriale 16 Settembre 2020—Individuazione della Tariffa Incentivante per la Remunerazione degli Impianti a Fonti Rinnovabili Inseriti Nelle Configurazioni Sperimentali di Autoconsumo Collettivo e Comunità Energetiche Rinnovabili; MISE: Washington, DC, USA, 2020. [Google Scholar]
  12. ARERA. Definizione, ai sensi del Decreto Legislativo 199/21 e del Decreto Legislativo 210/21, della Regolazione Dell’autoconsumo Diffuso. Approvazione del Testo Integrato dell’Autoconsumo Diffuso; ARERA: Milano, Italy, 2022. [Google Scholar]
  13. MASE. Decreto Ministeriale n. 414, Decreto CACER; MASE: Merrylands, NSW, Australia, 2024. [Google Scholar]
  14. Di Silvestre, M.L.; Ippolito, M.G.; Sanseverino, E.R.; Sciumè, G.; Vasile, A. Energy self-consumers and renewable energy communities in Italy: New actors of the electric power systems. Renew. Sustain. Energy Rev. 2021, 151, 111565. [Google Scholar] [CrossRef]
  15. GSE Gestore Servizi Energetici. Autoconsumo e Comunità Energetiche: Comunità di Energia Rinnovabile e Gruppi di Autoconsumatori, Pubblicati i Profili Standard per Prelievo e Immissione. 2024. Available online: https://www.gse.it/servizi-per-te/news/comunita-di-energia-rinnovabile-e-gruppi-di-autoconsumatori-pubblicati-i-profili-standard-per-prelievo-e-immissione-2024 (accessed on 4 August 2025).
  16. Mappa Interattiva delle Cabine Primarie. Available online: https://www.gse.it/servizi-per-te/autoconsumo/ (accessed on 4 August 2025).
  17. Llera-Sastresa, E.; Gimeno, J.Á.; Osorio-Tejada, J.L.; Portillo-Taragona, P. Effect of Sharing Schemes on the Collective Energy Self-Consumption Feasibility. Energies 2023, 16, 6564. [Google Scholar] [CrossRef]
  18. Colasante, A.; D’Adamo, I.; Morone, P. What drives the solar energy transition? The effect of policies, incentives and behavior in a cross-country comparison. Energy Res. Soc. Sci. 2022, 85, 102405. [Google Scholar] [CrossRef]
  19. Soeiro, S.; Dias, M.F. Community renewable energy: Benefits and drivers. Energy Rep. 2020, 6, 134–140. [Google Scholar] [CrossRef]
  20. Gazzetta Ufficiale. Testo del Decreto-Legge 30 Dicembre 2019, n. 162, Coordinato con la Legge di Conversione 28 Febbraio 2020, n. 8, Recante: ‘Disposizioni Urgenti in Materia di Proroga di Termini Legislativi, di Organizzazione delle Pubbliche Amministrazioni. Gazzetta Ufficiale della Repubblica Italiana; Gazzetta Ufficiale: Rome, Italy, 2019. [Google Scholar]
  21. PoliMi, UniTrento, LEAP. Comunità Energetiche: Gli Strumenti Della Ricerca per Analisi Tecniche, Economiche e Sociali; Gruppo di Sistemi Elettrici per l’Energia, Dipartimento di Energia, Politecnico di Milano: Milan, Italy; Sustainable Energy Laboratory, Dipartimento di Ingegneria Civile, Ambientale e Meccanica, Università degli Studi di Trento: Trento, Italy, 2024. [Google Scholar]
  22. Giarmanà, E. Managing renewable electricity within collective self-consumption schemes: A systematic private law approach. Renew. Sustain. Energy Rev. 2023, 188, 113896. [Google Scholar] [CrossRef]
  23. Bertolini, M.; Morosinotto, G. Business Models for Energy Community in the Aggregator Perspective: State of the Art and Research Gaps. Energies 2023, 16, 4487. [Google Scholar] [CrossRef]
  24. Kubli, M.; Puranik, S. A typology of business models for energy communities: Current and emerging design options. Renew. Sustain. Energy Rev. 2023, 176, 113165. [Google Scholar] [CrossRef]
  25. Herbes, C.; Brummer, V.; Rognli, J.; Blazjewski, S.; Gericke, N. Responding to policy change: New business models for renewable energy cooperatives—Barriers perceived by cooperatives’ members. Energy Policy 2017, 109, 82–95. [Google Scholar] [CrossRef]
  26. Moretti, E.; Stamponi, E. The Renewable Energy Communities in Italy and the Role of Public Administrations: The Experience of the Municipality of Assisi between Challenges and Opportunities. Sustainability 2023, 15, 11869. [Google Scholar] [CrossRef]
  27. Cirone, D.; Bruno, R.; Bevilacqua, P.; Perrella, S.; Arcuri, N. Techno-Economic Analysis of an Energy Community Based on PV and Electric Storage Systems in a Small Mountain Locality of South Italy: A Case Study. Sustainability 2022, 14, 13877. [Google Scholar] [CrossRef]
  28. Franzò, S.; Chiaroni, D.; Chiesa, V.; Frattini, F. Aggiornamento del Modello di Valutazione Tecnico-Economica della Realizzazione di Energy Community e Configurazioni di Autoconsumo Collettivo ed Applicazione a Casi di Studio Reali. Analisi del Potenziale di Mercato delle Suddette Applicazioni; School of Management, Politecnico di Milano: Milan, Italy, 2021. [Google Scholar]
  29. Ghiani, E.; Trevisan, R.; Rossetti, G.L.; Olivero, S.; Barbero, L. Energetic and Economic Performances of the Energy Community of Magliano Alpi after One Year of Pivoting. Energies 2022, 15, 7439. [Google Scholar] [CrossRef]
  30. Cutore, E.; Fichera, A.; Volpe, R. A Roadmap for the Design, Operation and Monitoring of renewable Energy Communities in Italy. Sustainability 2023, 15, 8118. [Google Scholar] [CrossRef]
  31. Mena, A.J.G.; Medina, V.F.N.; Bouakkaz, A.; Haddad, S. Analysis and optimisation of collective self-consumption in residential buildings in Spain. Energy Build. 2023, 283, 112812. [Google Scholar] [CrossRef]
  32. Zatti, M.; Guermandi, F.; Bovera, F. Techno-economic impact of collective self-consumption on different energy-related investments for a condominium. E3S Web Conf. 2021, 238, 05006. [Google Scholar] [CrossRef]
  33. Amabile, L.; Bresch-Pietri, D.; El Hajje, G.; Labbé, S.; Petit, N. Optimizing the self-consumption of residential photovoltaic energy and quantification of the impact of production forecast uncertainties. Adv. Appl. Energy 2021, 2, 100020. [Google Scholar] [CrossRef]
  34. GSE. Legambiente. Rapporto 2024 Comunità Energetiche Rinnovabili, Il Punto della Situazione in Italia; GSE: Philadelphia, PA, USA, 2024. [Google Scholar]
  35. Fondazione Utilitatis. Ricerca sul Sistema Energetico—RSE, Orange Book 2022. Le Comunità Energetiche in Italia; Fondazione Utilitatis: Rome, Italy, 2022. [Google Scholar]
  36. Minuto, F.D.; Lazzeroni, P.; Borchielli, R.; Olivero, S.; Bottaccioli, L.; Lanzini, A. Modeling technology retrofit scenarios for the conversion of condominium into an energy community: An Italian case study. J. Clean. Prod. 2021, 282, 124536. [Google Scholar] [CrossRef]
  37. Ghiani, E. Techno-economic optimization of condominium self-consumption systems. In PhD Seminar Renewable Energy Communities: Italian Case Studies and EU Regulatory Framework; DESTEC: Pisa, Italy, 2023. [Google Scholar]
  38. Palma, A.L.; La Notte, L.; Nissim, R.; Di Pietra, B. S.A.P.I.EN.T.E. Hybrid System: An Experimental Test Facility Focused on Energy Generation and Hybrid Storage for Self-Consumption Strategies. In Proceedings of the 2024 IEEE 15th International Symposium on Power Electronics for Distributed Generation Systems (PEDG), Luxembourg, 23–26 June 2024. [Google Scholar]
  39. Candelise, C.; Ruggieri, G. Status and Evolution of the Community Energy Sector in Italy. Energies 2020, 13, 1888. [Google Scholar] [CrossRef]
  40. Fina, B.; Monsberger, C.; Auer, H. A framework to estimate the large-scale impacts of energy community roll-out. Helyon 2022, 8, e09905. [Google Scholar] [CrossRef] [PubMed]
  41. Mutani, G.; Todeschi, V.; Tartaglia, A.; Nuvoli, G. Energy Communities in Piedmont Region (IT). The case study in Pinerolo territory. In Proceedings of the 2018 IEEE International Telecommunications Energy Conference (INTELEC), Turino, Italy, 7–11 October 2018. [Google Scholar]
  42. Kyriakopoulos, G.L. Energy Communities Overview: Managerial Policies, Economic. J. Risk Financ. Manag. 2022, 15, 521. [Google Scholar] [CrossRef]
  43. Ruggieri, G.; Gambassi, R.; Zangheri, P.; Caldera, M.; Verde, S.F. Key Economic Drivers Enabling Municipal Renewable Energy Communities’ Benefits in the Italian Context. Buildings 2023, 13, 2940. [Google Scholar] [CrossRef]
  44. Botelho, D.F.; Dias, B.H.; De Oliveira, L.W.; Soares, T.A.; Rezende, I.; Sousa, T. Innovative business models as drivers for prosumers integration—Enablers and barriers. Renew. Sutain. Energy Rev. 2021, 144, 111057. [Google Scholar] [CrossRef]
  45. GSE—Gestore Servizi Energetici. HV/MV Substation Map. Available online: https://www.gse.it/servizi-per-te/autoconsumo/mappa-interattiva-delle-cabine-primarie (accessed on 21 July 2025).
  46. ISTAT. Censimento Popolazione Abitazioni. 2011. Available online: http://dati-censimentopopolazione.istat.it/Index.aspx?DataSetCode=DICA_EDIFICIRES# (accessed on 28 October 2024).
  47. Zatti, M.; Moncecchi, M.; Gabba, M.; Chiesa, A.; Bovera, F.; Merlo, M. Energy Communities Design Optimization in the Italian Framework. Appl. Sci. 2021, 11, 5218. [Google Scholar] [CrossRef]
  48. Bonura, J. Increasing Housing Supply in the Urban Core Through Mixed-Use Commercial and Residential; Texas Public Policy Foundation: Austin, TX, USA, 2024. [Google Scholar]
  49. Tatti, A.; Ferroni, S.; Ferrando, M.; Motta, M.; Causone, F. The Emerging Trends of Renewable Energy Communities. Sustainability 2023, 15, 6792. [Google Scholar] [CrossRef]
  50. Vittori, F. Quaderni del Dipartimento di Sociologia e Ricerca Sociale—Comunità Energetiche: Il Modello dell’Ecoopreneur; Università di Trento: Trento, Italy, 2023. [Google Scholar]
  51. Trevisan, R.; Ghiani, E.; Olivero, S.; Bailo, M.; Meneghetti, F. The CONCERTI Project: From Magliano Alpi’s Energy Community to an Innovative Integrated Inter-Municipal Energy Sharing Paradigm. In Proceedings of the SyNERGY MED 2024, Limassol, Cyprus, 21–23 October 2024. [Google Scholar]
  52. NREL Comparing the OpenSolar Remote Shading Analysis Tool to On-Site Shading Measurements; NREL: Golden, CO, USA, 2021.
  53. Decreto Legislativo 504, Gazzetta Ufficiale n. 279 del 29-11-1995; Gazzetta Ufficiale: Rome, Italy, 1995.
  54. European Commission. Photovoltaic Geographical Information System. Available online: https://re.jrc.ec.europa.eu/pvg_tools/en/ (accessed on 18 December 2024).
  55. Maps Energy Group. Energy Community Designer. Available online: https://energy.mapsgroup.it/energy-community-designer/ (accessed on 4 August 2025).
  56. Meloni, C.; Blaso, L.; Branchetti, S.; Caldera, M.; Maestosi, P.C.; D’Agosta, G.; Frascella, A.; Gozo, N.; Massa, G.; Moretti, F.; et al. Energy and Digital Transitions for Energy Communities: Tools and Methodologies to Promote Digitalization in Italy. Electronics 2025, 14, 2027. [Google Scholar] [CrossRef]
  57. Vacanti, A. How smart is the Italian domestic environment? A quantitative study. In Proceedings of the IASDR 2023 Life-Changing Design, Milan, Italy, 9–13 October 2023. [Google Scholar]
  58. Umer, M.; Sadiq, S.; Alhebshi, R.M.; Sabir, M.F.; Alsubai, S.; Al Hejaili, A.; Khayyat, M.M.; Eshmawi, A.A.; Mohamed, A. IoT based smart home automation using blockchain and deep learning models. PeerJ Comput. Sci. 2023, 9, e1332. [Google Scholar] [CrossRef]
  59. Jabbar, W.A.; Kian, T.K.; Ramli, R.M.; Zubir, S.N.; Zamrizaman, N.S.M.; Balfaqih, M.; Shepelev, V.; Alharbi, S. Design and fabrication of smart home with internet of things enabled automation system. IEEE Access 2019, 7, 144059–144074. [Google Scholar] [CrossRef]
  60. Kumar, S. Energy and water monitoring system for smart metering and consumer awareness. In Proceedings of the 2nd International Electronic Conference on Sensors and Applications, Online, 15–30 November 2015. [Google Scholar]
  61. Alahakoon, D.; Yu, X. Smart electricity meter data intelligence for future energy systems: A survey. IEEE Trans. Ind. Inform. 2016, 12, 425–436. [Google Scholar] [CrossRef]
  62. Banfi, A.; Ferrando, M.; Li, P.; Shi, X.; Causone, F. Integrating Occupant Behaviour into Urban-Building Energy Modelling: A Review of Current Practices and Challenges. Energies 2024, 17, 4400. [Google Scholar] [CrossRef]
  63. Banfi, A.; Ferrando, M.; Malik, J.; Hong, T.; Causone, F. An Analysis of Building Occupancy Patterns Based on Time Use Survey. In Multiphysics and Multiscale Building Physics; Springer: Singapore, 2024. [Google Scholar]
  64. D’Adamo, I.; Gastaldi, M.; Koh, L.S.; Vigiano, A. Lighting the future of sustainable cities with energy communities: An economic analysis for incentive policy. Cities 2024, 47, 104828. [Google Scholar] [CrossRef]
  65. Der Finanzen, M. Stability Program Section I; MEF: Rome, Italy, 2024. [Google Scholar]
  66. International Energy Agency. National Survey Report of PV Power Applications in Italy; Photovoltaic Power Systems Programme; IEA International Energy Agency: Paris, France, 2022. [Google Scholar]
  67. Olczak, P. Evaluation of degradation energy productivity of photovoltaic installations in long -term case study. Appl. Energy 2023, 343, 121109. [Google Scholar] [CrossRef]
  68. Vaisanen, J.; Kosonen, A.; Ahola, J.; Sallinen, T.; Hannula, T. Optimal sizing ratio of a solar PV inverter for minimizing the levelized cost of electricity in Finnish irradiation conditions. Sol. Energy 2019, 185, 350–362. [Google Scholar] [CrossRef]
  69. GSE. Prezzi Medi Mensili per Fascia Oraria e Zona di Mercato. Available online: https://www.gse.it/servizi-per-te/fotovoltaico/ritiro-dedicato/documenti (accessed on 22 October 2024).
  70. ARERA. Prezzi e Tariffe Energia e Gas. 2024. Available online: https://www.arera.it/area-operatori/prezzi-e-tariffe (accessed on 4 August 2025).
  71. Speer, B.; Mendelsohn, M.; Cory, K. Insuring Solar Photovoltaics: Challenges and Possible Solutions; no. NREL/TP-6A2-46932; NREL: Golden, CO, USA, 2010. [Google Scholar]
  72. Walker, A.; Lockhart, E.; Desai, J.; Ardani, K.; Klise, G.; Lavrova, O.; Tansy, T.; Deot, J.; Fox, B.; Pochiraju, A. Model of Operation-and-Maintenance Costs for Photovoltaic Systems; Vols. NREL/TP-5C00-74840; NREL: Golden, CO, USA, 2020. [Google Scholar]
  73. ECB. Banca Centrale Europea—Politica Monetaria. Available online: https://www.ecb.europa.eu/ecb/orga/tasks/monpol/html/index.it.html (accessed on 6 October 2024).
  74. Heinz, A.; Gaber, C. Combinations of heat pump and photovoltaics for renovated buildings. E3S Web Conf. 2019, 111, 01003. [Google Scholar] [CrossRef]
  75. Gazzetta Ufficiale. Decreto Legge 19 Maggio 2020, n. 34 Misure Urgenti in Materia di Salute, Sostegno al Lavoro e all’Economia, Nonche’ di Politiche Sociali Connesse all’Emergenza Epidemiologica da COVID-19. Gazzetta Ufficiale della Repubblica Italiana, 19 May 2020; Gazzetta Ufficiale: Rome, Italy, 2020. [Google Scholar]
  76. Gazzetta Ufficiale. Decreto-Legge 29 Marzo 2024 Misure Urgenti in Materia di Agevolazioni Fiscali di cui Agli Articoli 119 e 119-ter del Decreto-Legge 19 Maggio 2020, n. 34, Convertito, con Modificazioni, dalla Legge 17 Luglio 2020, n. 77. Gazzetta Ufficiale della Repubblica Italiana, 29 March 2024; Gazzetta Ufficiale: Rome, Italy, 2024. [Google Scholar]
  77. Trevisan, R.; Ladu, M.; Ghiani, E.; Balletto, G. Achieving Net Zero Condominiums through Energy Community Sharing. Sustainability 2024, 16, 2076. [Google Scholar] [CrossRef]
  78. Martirano, L.; Kermani, M. Power Sharing Model for Energy Communities of Buildings. IEEE Trans. Ind. Appl. 2021, 57, 170–178. [Google Scholar] [CrossRef]
  79. Gjorgievski, V.Z.; Velkovski, B.; Minuto, F.D.; Cundeva, S.; Markovska, N. Energy sharing in European renewable energy communities: Impact of regulated charges. Energy 2023, 281, 128333. [Google Scholar] [CrossRef]
  80. Available online: https://www.opensolar.com/ (accessed on 4 August 2025).
  81. Pickhardt, M. Fifty Years after Samuelson’s ‘The Pure Theory of Public Expenditure’: What are we Left With? J. Hist. Econ. Thought 2006, 28, 305–330. [Google Scholar] [CrossRef]
  82. Reis, V.; Almeida, R.H.; Silva, J.A.; Brito, M.C. Demand aggregation for photovoltaic self-consumption. Energy Rep. 2019, 5, 54–61. [Google Scholar] [CrossRef]
  83. Ghilardi, S. Comunità Energetiche e Smart Grid. In Persone, Energie, Futuro Infinityhub: La Guida Interstellare per Una Nuova Dimensione dell’Energia; Università Ca’ Foscari: Venezia, Italy, 2023. [Google Scholar]
  84. Tolas, R.; Portase, R.; Potolea, R. From Individual Device Usage to Household Energy Consumption Profiling. Electronics 2024, 13, 2325. [Google Scholar] [CrossRef]
  85. Ahmed, H.U.; Kumar, R.; Faisal, S.A. Analyzing Hourly Energy Consumption Profiles of Commercial Buildings Through Statistical Modeling. In Proceedings of the 2024 3rd International Conference on Emerging Trends in Electrical, Control, and Telecommunication Engineering (ETECTE), Lahore, Pakistan, 26–27 November 2024; pp. 1–7. [Google Scholar]
  86. Fabbri, K.; Rossi, A. Comunità e povertà energetica: Un contributo critico contro la narrativa dominante. In La Povertà Energetica in Italia—Rapporto 2023; dell’Osservatorio Sulla Povertà Energetica (OIPE): Padua, Italy, 2023; pp. 53–57. [Google Scholar]
Figure 1. Methodology flowchart.
Buildings 15 02808 g001
Figure 2. Distribution of JARS configurations on primary stations in Prato case study.
Buildings 15 02808 g002
Figure 3. Design and simulation of condominium in OpenSolar software.
Buildings 15 02808 g003
Figure 4. Statistical distribution of systems power (kWp).
Buildings 15 02808 g004
Figure 5. Physical self-consumption Φ d i r , c o n d statistical distribution.
Buildings 15 02808 g005
Figure 6. Economic performance of 30 out of 109 condominiums.
Buildings 15 02808 g006
Figure 7. Statistical distribution of per capita TIP (EUR/year).
Buildings 15 02808 g007
Figure 8. Statistical distribution of NPV (EUR) per residential unit.
Buildings 15 02808 g008
Figure 9. Statistical distribution of DPBT (years).
Buildings 15 02808 g009
Figure 10. Visualization of economic benefits as a function of tax allowance policies and sale price of electricity.
Buildings 15 02808 g010
Figure 11. Relationships between incentive-related indicators and solar or energy-related parameters. Each subfigure (AX) shows a scatter plot with a linear fit (red line), 95% confidence interval (shaded area), R2, and Spearman correlation (ρ). (A) Per capita incentive vs. Overall residential consumption (kWh); (B) Per capita incentive vs. GSPA (m2); (C) Per capita incentive vs. Total number of prosumers; (D) Per capita incentive vs. Installed power (kWp); (E) Per capita incentive vs. Solar potential (Φ_dir,cond); (F) Per capita incentive vs. Shared energy percentage (%); (G) Per capita earnings from energy sale (RID) vs. Overall residential consumption (kWh); (H) Per capita earnings from energy sale (RID) vs. GSPA (m2); (I) Per capita earnings from energy sale (RID) vs. Total number of prosumers; (J) Per capita earnings from energy sale (RID) vs. Installed power (kWp); (K) Per capita earnings from energy sale (RID) vs. Solar potential (Φ_dir,cond); (L) Per capita earnings from energy sale (RID) vs. Shared energy percentage (%); (M) Per capita fiscal bonus vs. Overall residential consumption (kWh); (N) Per capita fiscal bonus vs. GSPA (m2); (O) Per capita fiscal bonus vs. Total number of prosumers; (P) Per capita fiscal bonus vs. Installed power (kWp); (Q) Per capita fiscal bonus vs. Solar potential (Φ_dir,cond); (R) Per capita fiscal bonus vs. Shared energy percentage (%); (S) Overall incentive vs. Overall residential consumption (kWh); (T) Overall incentive vs. GSPA (m2); (U) Overall incentive vs. Total number of prosumers; (V) Overall incentive vs. Installed power (kWp); (W) Overall incentive vs. Solar potential (Φ_dir,cond); (X) Overall incentive vs. Shared energy percentage (%).
Buildings 15 02808 g011
Figure 12. Visual correlation between total benefit per capita (EUR) and number of floors.
Buildings 15 02808 g012
Table 2. Primary stations and number of JARS configurations in the case study area.
Station NumberIdentifier Color№ JARS Configurations
AC001E00662Yellow34
AC001E00666Red39
AC001E00668Green35
AC001E00658Blue2
Table 3. Average annual residential electricity consumption utilized in this case study.
UtilityElectricity Consumption (kWh/Year)
Elderly couple2700
Young couple2400
Family3200
Table 4. Average loss and efficiency values of the simulated photovoltaic system.
ModuleEfficiency/Loss Value
PV Module Mono-c-Si Efficiency 21.10%
DC Losses (Mismatch, Cables)−11.48%
CA Inverter Losses−2.75%
CA Other Losses−0.99%
Table 5. Summary of systems power mean value, standard deviation, standard error, upper 95% mean, and lower 95% mean.
Summary Statistics
Mean20.87 kWp
Standard Deviation9.50
Standard Error 0.91
Upper 95% Mean22.66 kWp
Lower 95% Mean19.05 kWp
Table 6. Summary of parameters utilized in the economic analysis with their values and units of measure.
ParameterValueUnitReferences
PV   Cos t   ( C P V )1.76EUR/Wp[66]
Annual decrease in system productivity0.90%/year[67]
Inverter Cost200EUR/kVA[68]
Compensation   for   energy   input   ( T R I D )
Dedicated withdrawal
0.08EUR/kWh[69]
Electricity Cost0.30EUR/kWh[70]
Annual insurance cost0.25% PV costEUR[71]
Annual system maintenance cost1% valueEUR[72]
Annual inflation2.0%/year[73]
Lifetime of project (N)20(Y) Years[13]
Table 7. Summary of fiscal bonus mean value, standard deviation, standard error, upper 95% mean, lower 95% mean, and number of condominiums considered.
Summary Statistics
Mean94.39 EUR/year
Standard Deviation25.31
Standard Error 2.45
Upper 95% Mean99.26 EUR/year
Lower 95% Mean89.51 EUR/year
Number of Condominiums106
Table 8. Summary of NVP mean value, standard deviation, standard error, upper 95% mean, lower 95% mean, and number of condominiums considered.
Summary Statistics
MeanEUR 1683.08
Standard Deviation459.83
Standard Error 44.87
Upper 95% MeanEUR 1772.07
Lower 95% MeanEUR 1594.09
Number of condominiums106
Table 9. Summary of DPBT mean value, standard deviation, standard error, upper 95% mean, lower 95% mean, and number of condominiums considered.
Summary Statistics
Mean8.80 years
Standard Deviation1.28
Standard Error 0.12
Upper 95% Mean9.05 years
Lower 95% Mean8.56 years
Number of Condominiums106
Table 10. Summary of the economic benefits as a function of tax allowance policies and sale price of electricity highlighting variations through color.
β f i s c 36%38%40%42%44%46%48%50%
T R I D
0.05 233.13 EUR236.57 EUR240.01 EUR243.46 EUR246.90 EUR250.34 EUR253.78 EUR257.22 EUR
0.06 248.74 EUR252.19 EUR255.63 EUR259.07 EUR262.51 EUR265.95 EUR269.39 EUR272.84 EUR
0.07 264.36 EUR267.80 EUR271.24 EUR274.68 EUR278.12 EUR281.56 EUR285.01 EUR288.45 EUR
0.08 279.97 EUR283.41 EUR286.85 EUR290.29 EUR293.74 EUR297.18 EUR300.62 EUR304.06 EUR
0.09 295.58 EUR299.02 EUR302.46 EUR305.91 EUR309.35 EUR312.79 EUR316.23 EUR319.67 EUR
0.1 311.19 EUR314.64 EUR318.08 EUR321.52 EUR324.96 EUR328.40 EUR331.84 EUR335.29 EUR
0.11 326.81 EUR330.25 EUR333.69 EUR337.13 EUR340.57 EUR344.01 EUR347.46 EUR350.90 EUR
0.12 342.42 EUR345.86 EUR349.30 EUR352.74 EUR356.19 EUR359.63 EUR363.07 EUR366.51 EUR
0.13 358.03 EUR361.47 EUR364.91 EUR368.36 EUR371.80 EUR375.24 EUR378.68 EUR382.12 EUR
0.14 373.64 EUR377.09 EUR380.53 EUR383.97 EUR387.41 EUR390.85 EUR394.29 EUR397.74 EUR
0.15 382.27 EUR385.71 EUR389.16 EUR392.60 EUR396.04 EUR399.48 EUR402.92 EUR406.36 EUR
0.16 390.90 EUR394.34 EUR397.78 EUR401.23 EUR404.67 EUR408.11 EUR411.55 EUR414.99 EUR
0.17 399.53 EUR402.97 EUR406.41 EUR409.85 EUR413.30 EUR416.74 EUR420.18 EUR423.62 EUR
0.18 408.16 EUR411.60 EUR415.04 EUR418.48 EUR421.92 EUR425.37 EUR428.81 EUR432.25 EUR
0.19 423.77 EUR427.21 EUR430.65 EUR434.10 EUR437.54 EUR440.98 EUR444.42 EUR447.86 EUR
Table 11. Numerical correlation between total benefit per capita (EUR) and number of floors.
Floors
Spearman’s coefficient (ρ)Total per capita benefitCorrelation coefficient−0.584 **
sig. (with two tails)<0.001
N109
** The correlation is significant at a level of 0.01 (with two tails).
Table 12. Comparison of self-consumption rates and economic benefits between RECs and JARS.
Rate of Jointly Acting Renewable Shared
Energy
Rate of Physical
Self-Consumption
Φ d i r , c o n d
Total Incentive
Red Station (REC)93%11%EUR 88.395
Red Station (JARS)78% EUR 83.534
EUR 4.861
Yellow Station (REC)97%13.35%EUR 87.415
Yellow Station (JARS)80% EUR 77.472
EUR 9.943
Green Station (REC)90%8%EUR 80.379
Green Station (JARS)79% EUR 74.089
EUR 6.290
Disclaimer/Publisher’s Note: The statements, opinions and data contained in all publications are solely those of the individual author(s) and contributor(s) and not of MDPI and/or the editor(s). MDPI and/or the editor(s) disclaim responsibility for any injury to people or property resulting from any ideas, methods, instructions or products referred to in the content.