Evaluating the Microclimatic Performance of Elevated Open Spaces for Outdoor Thermal Comfort in Cold Climate Zones
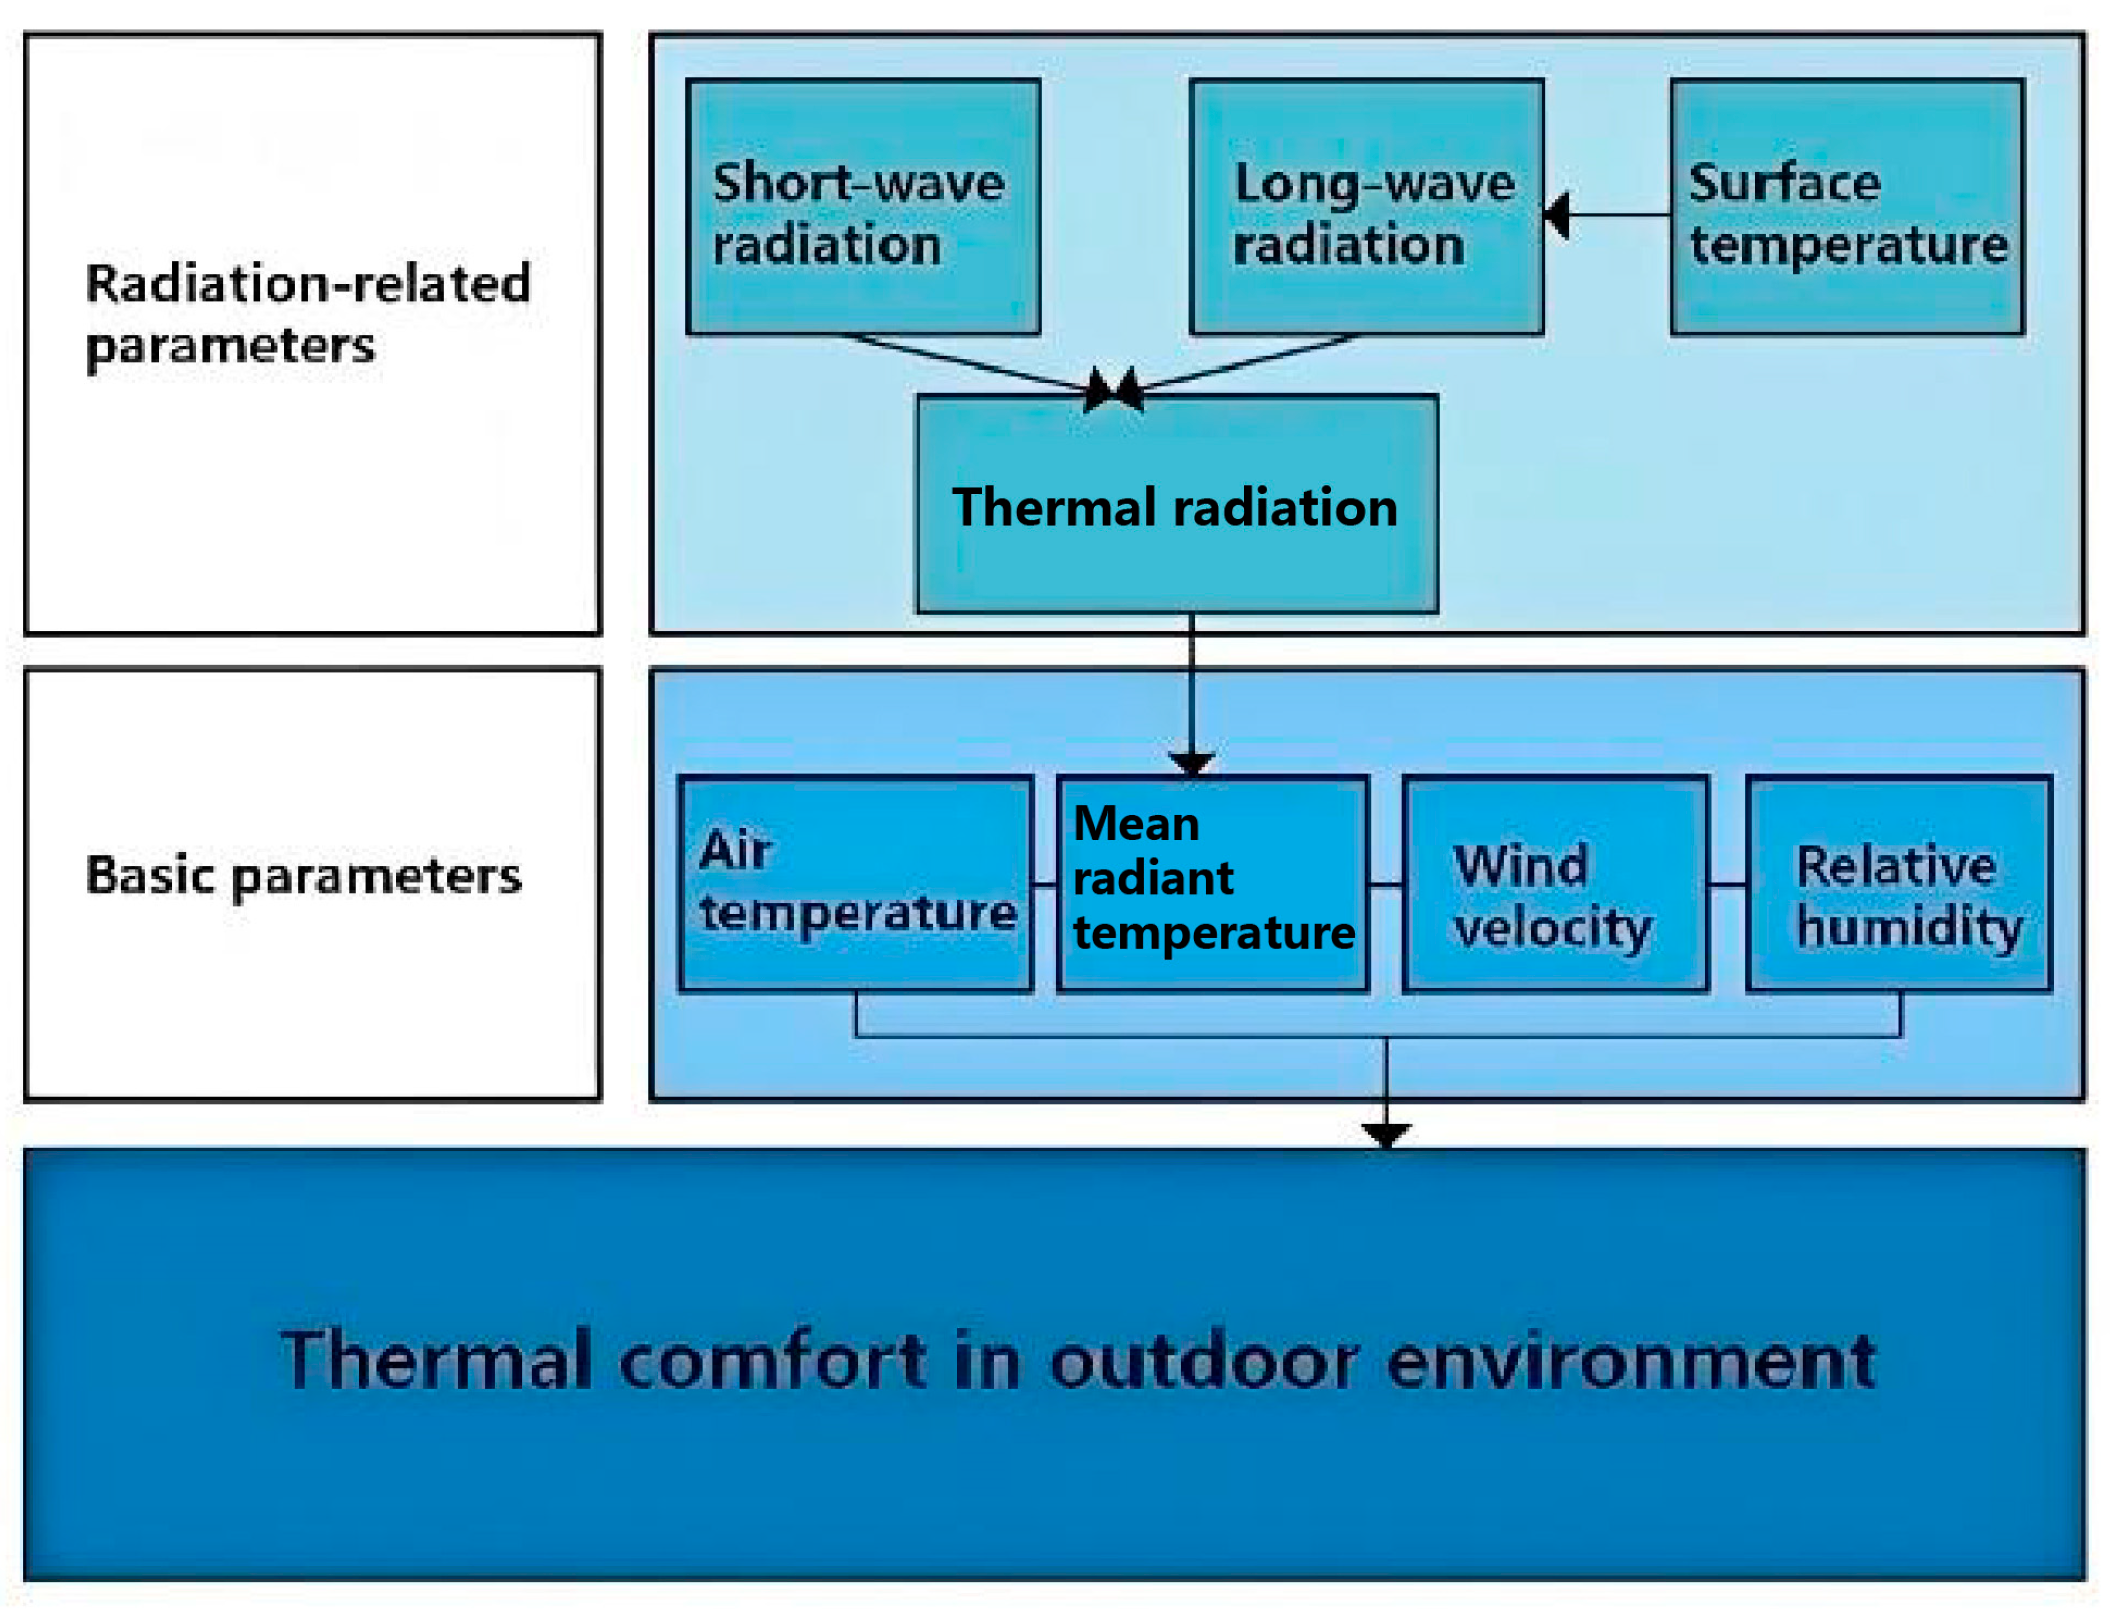
Abstract
1. Introduction
2. Materials and Methods
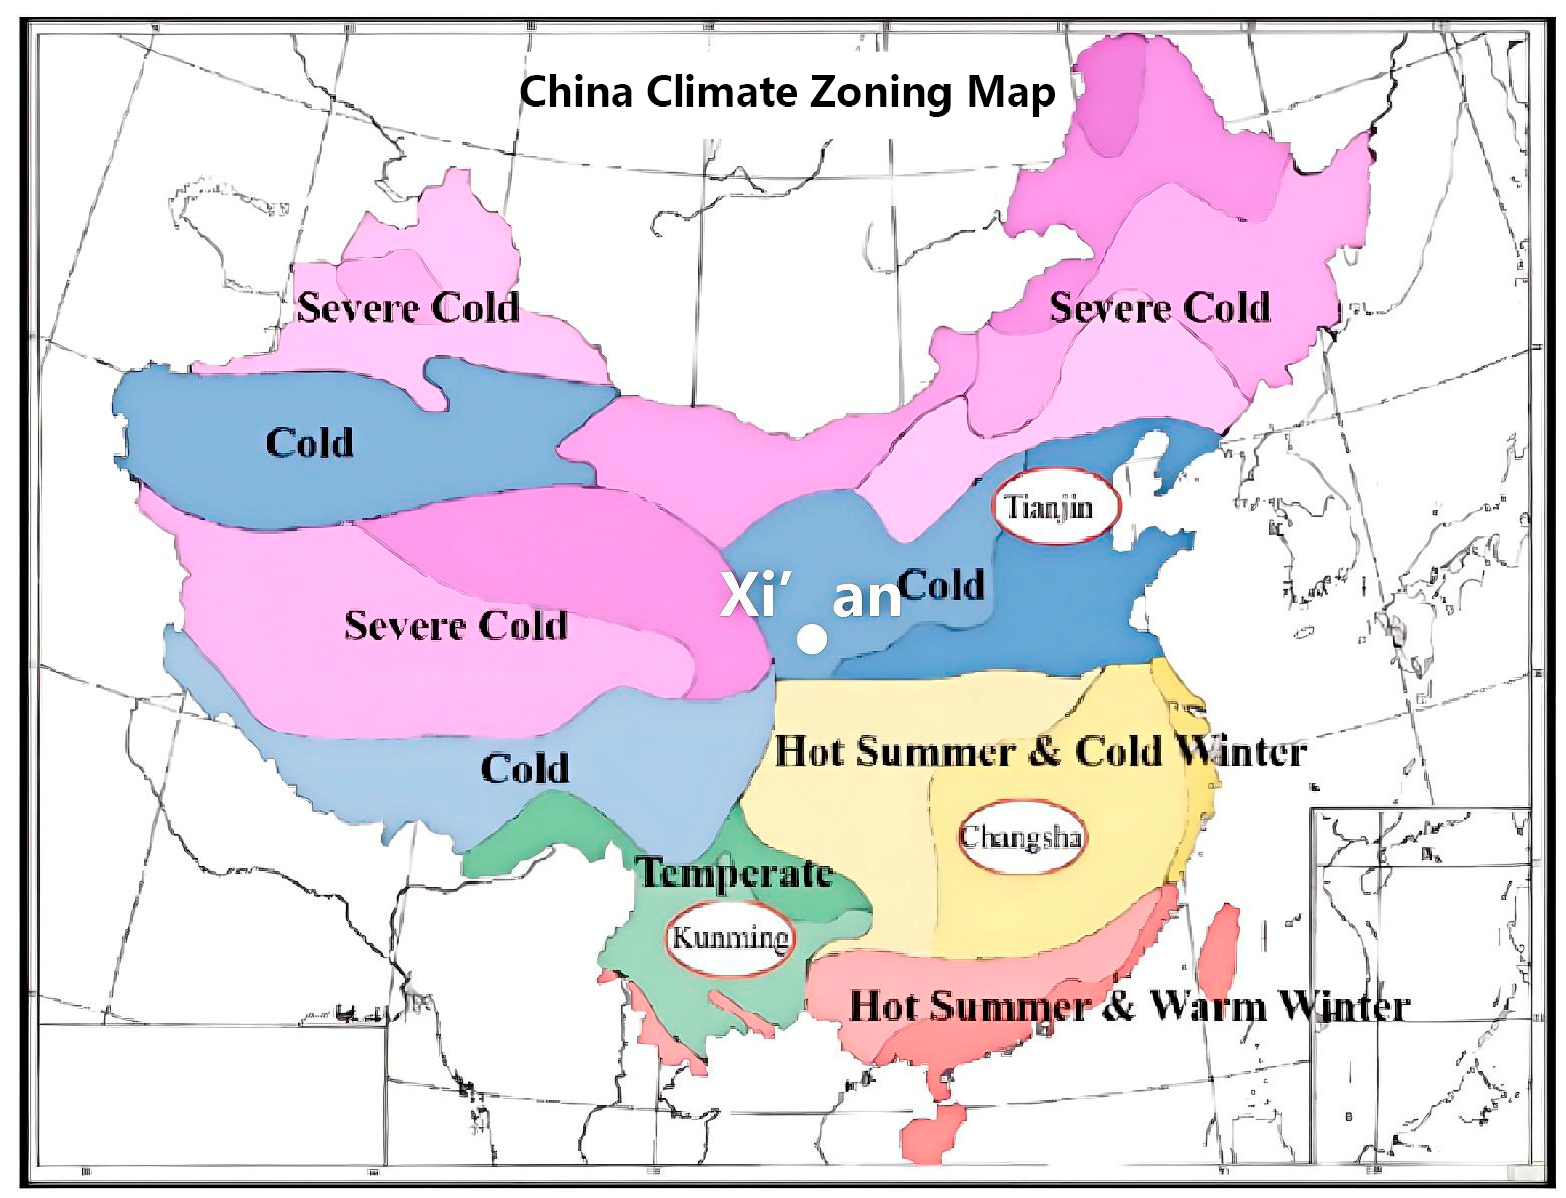
2.1. Climate Conditions of the Research City in China
2.2. The Analyzed Site
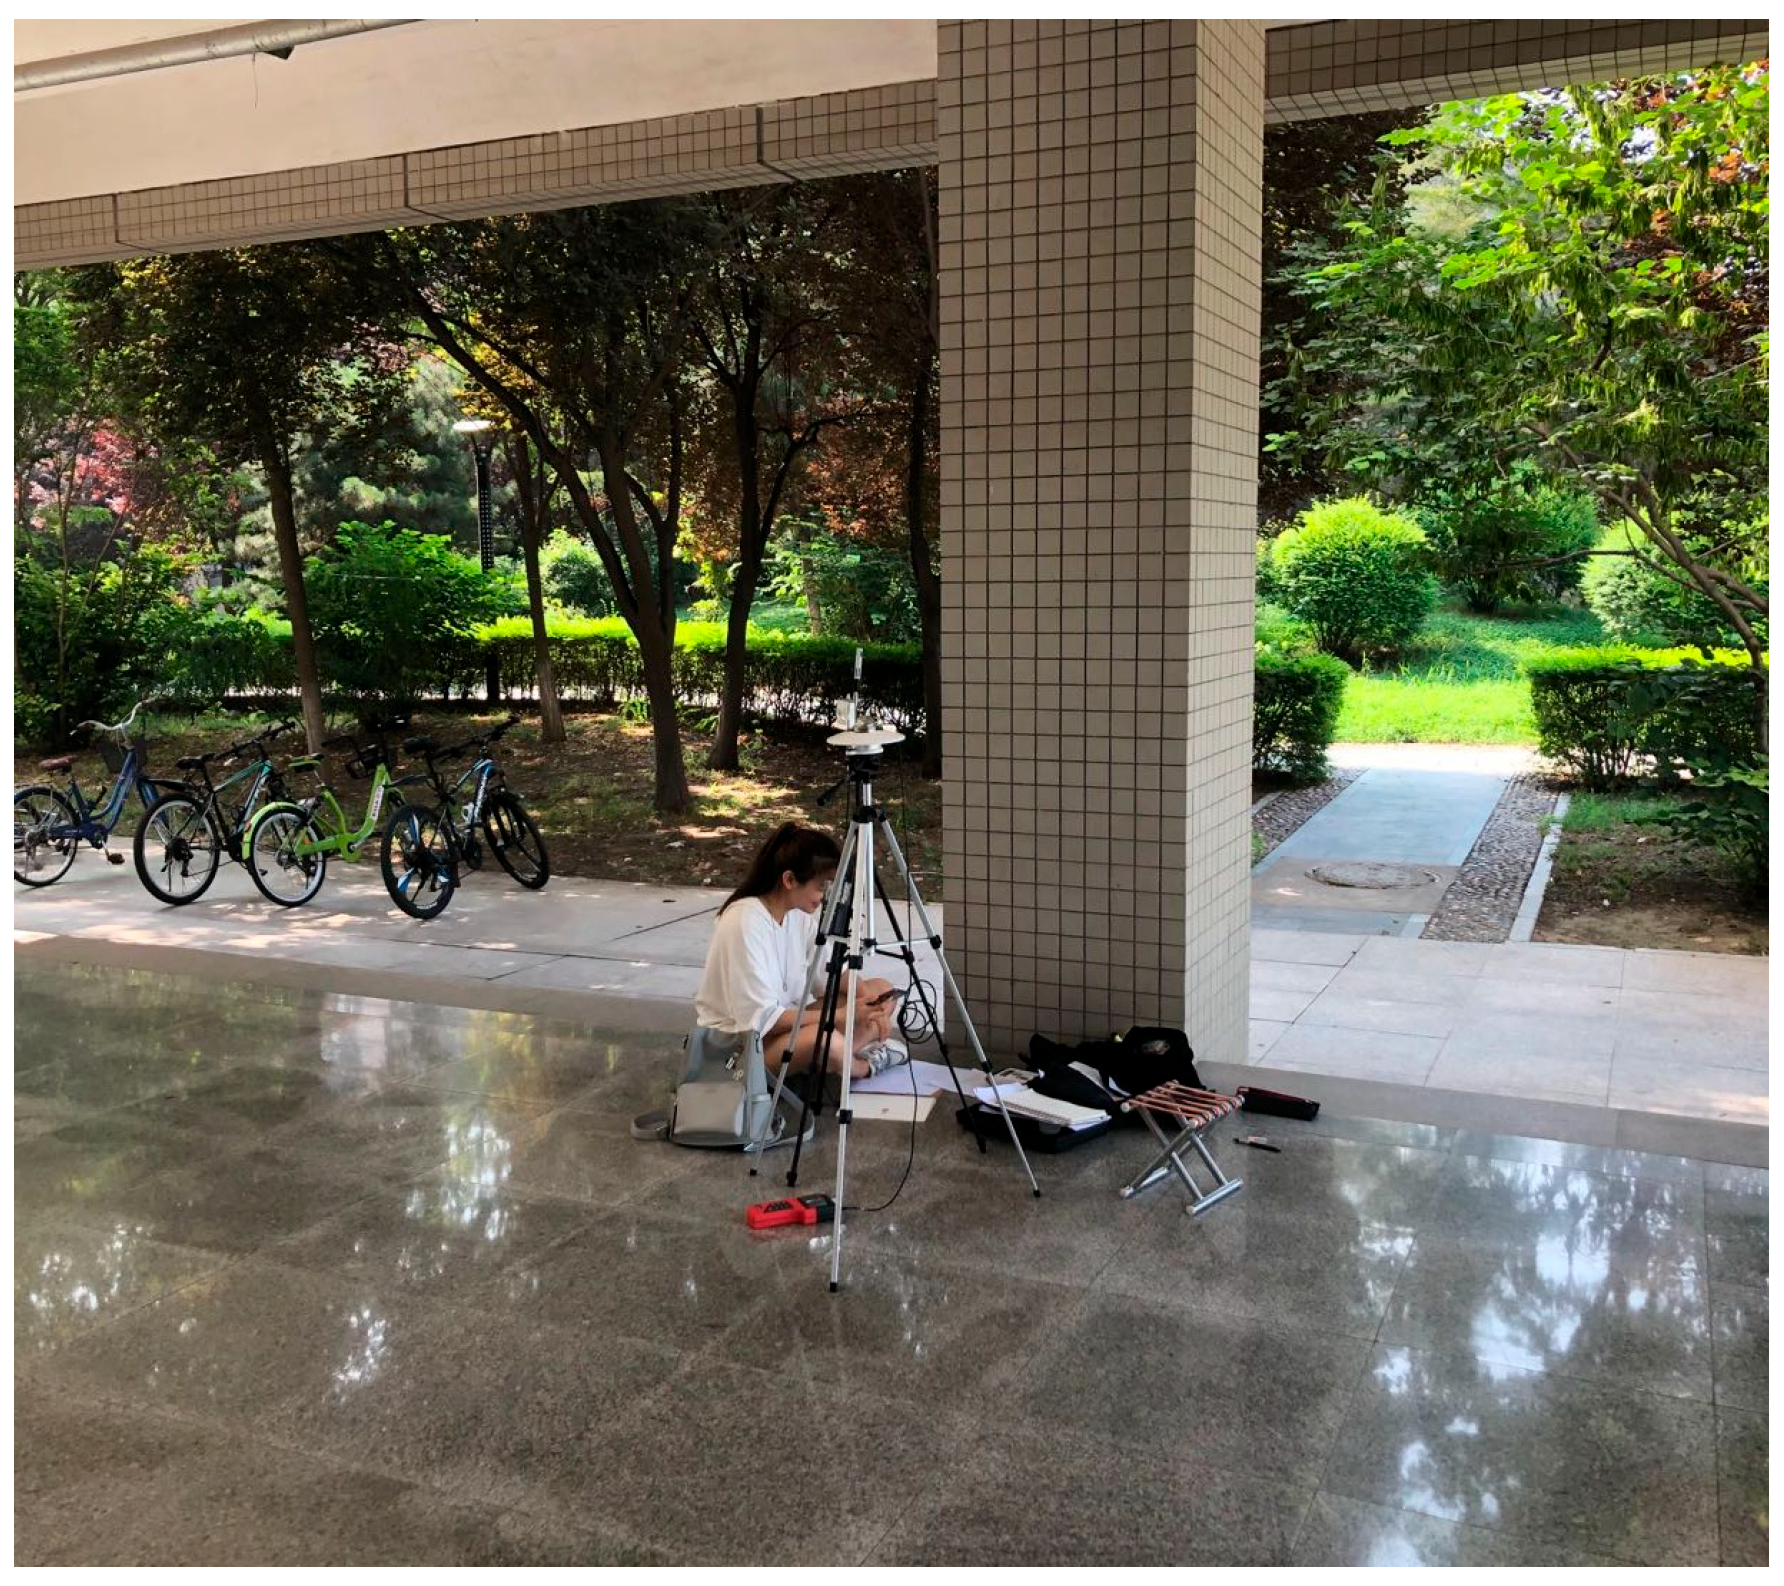
2.3. The Experimental Design
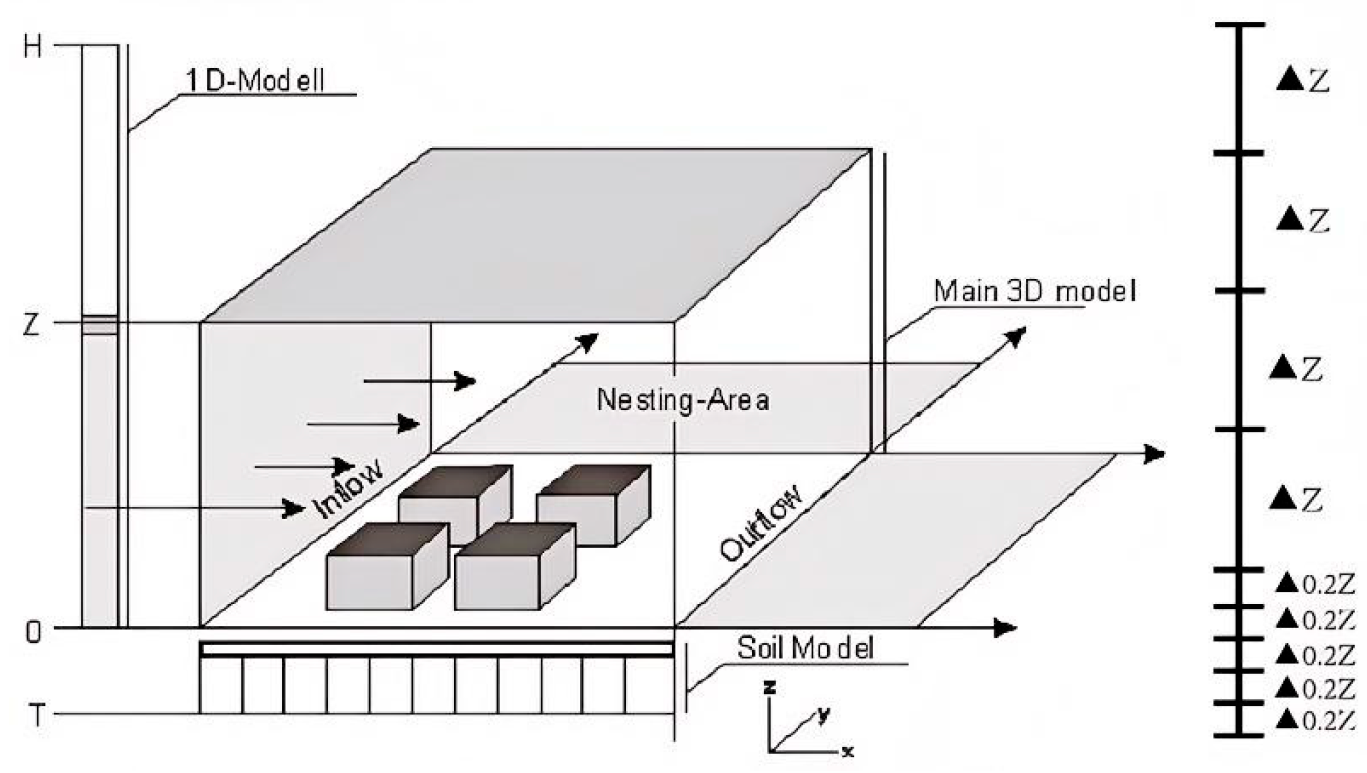
2.4. The Introduction of the ENVI-Met Modeling
2.5. The Framework of This Study
- Field Measurements: On-site microclimatic data were collected during two distinct periods—8–10 July 2020 (summer) and 4–6 January 2021 (winter)—to capture seasonal variations in thermal conditions.
- Model Validation: The ENVI-met simulation results were validated against the field measurements to ensure the reliability and accuracy of the model outputs.
- Analysis and Conclusions: A detailed analysis of the simulation results was conducted to derive key findings, identify optimal design parameters, and formulate conclusions relevant to thermal comfort optimization in elevated open spaces.
3. Analyzed Results
3.1. The ENVI-Met Boundary Conditions
3.2. The Validation Between the Measured and Simulated Data
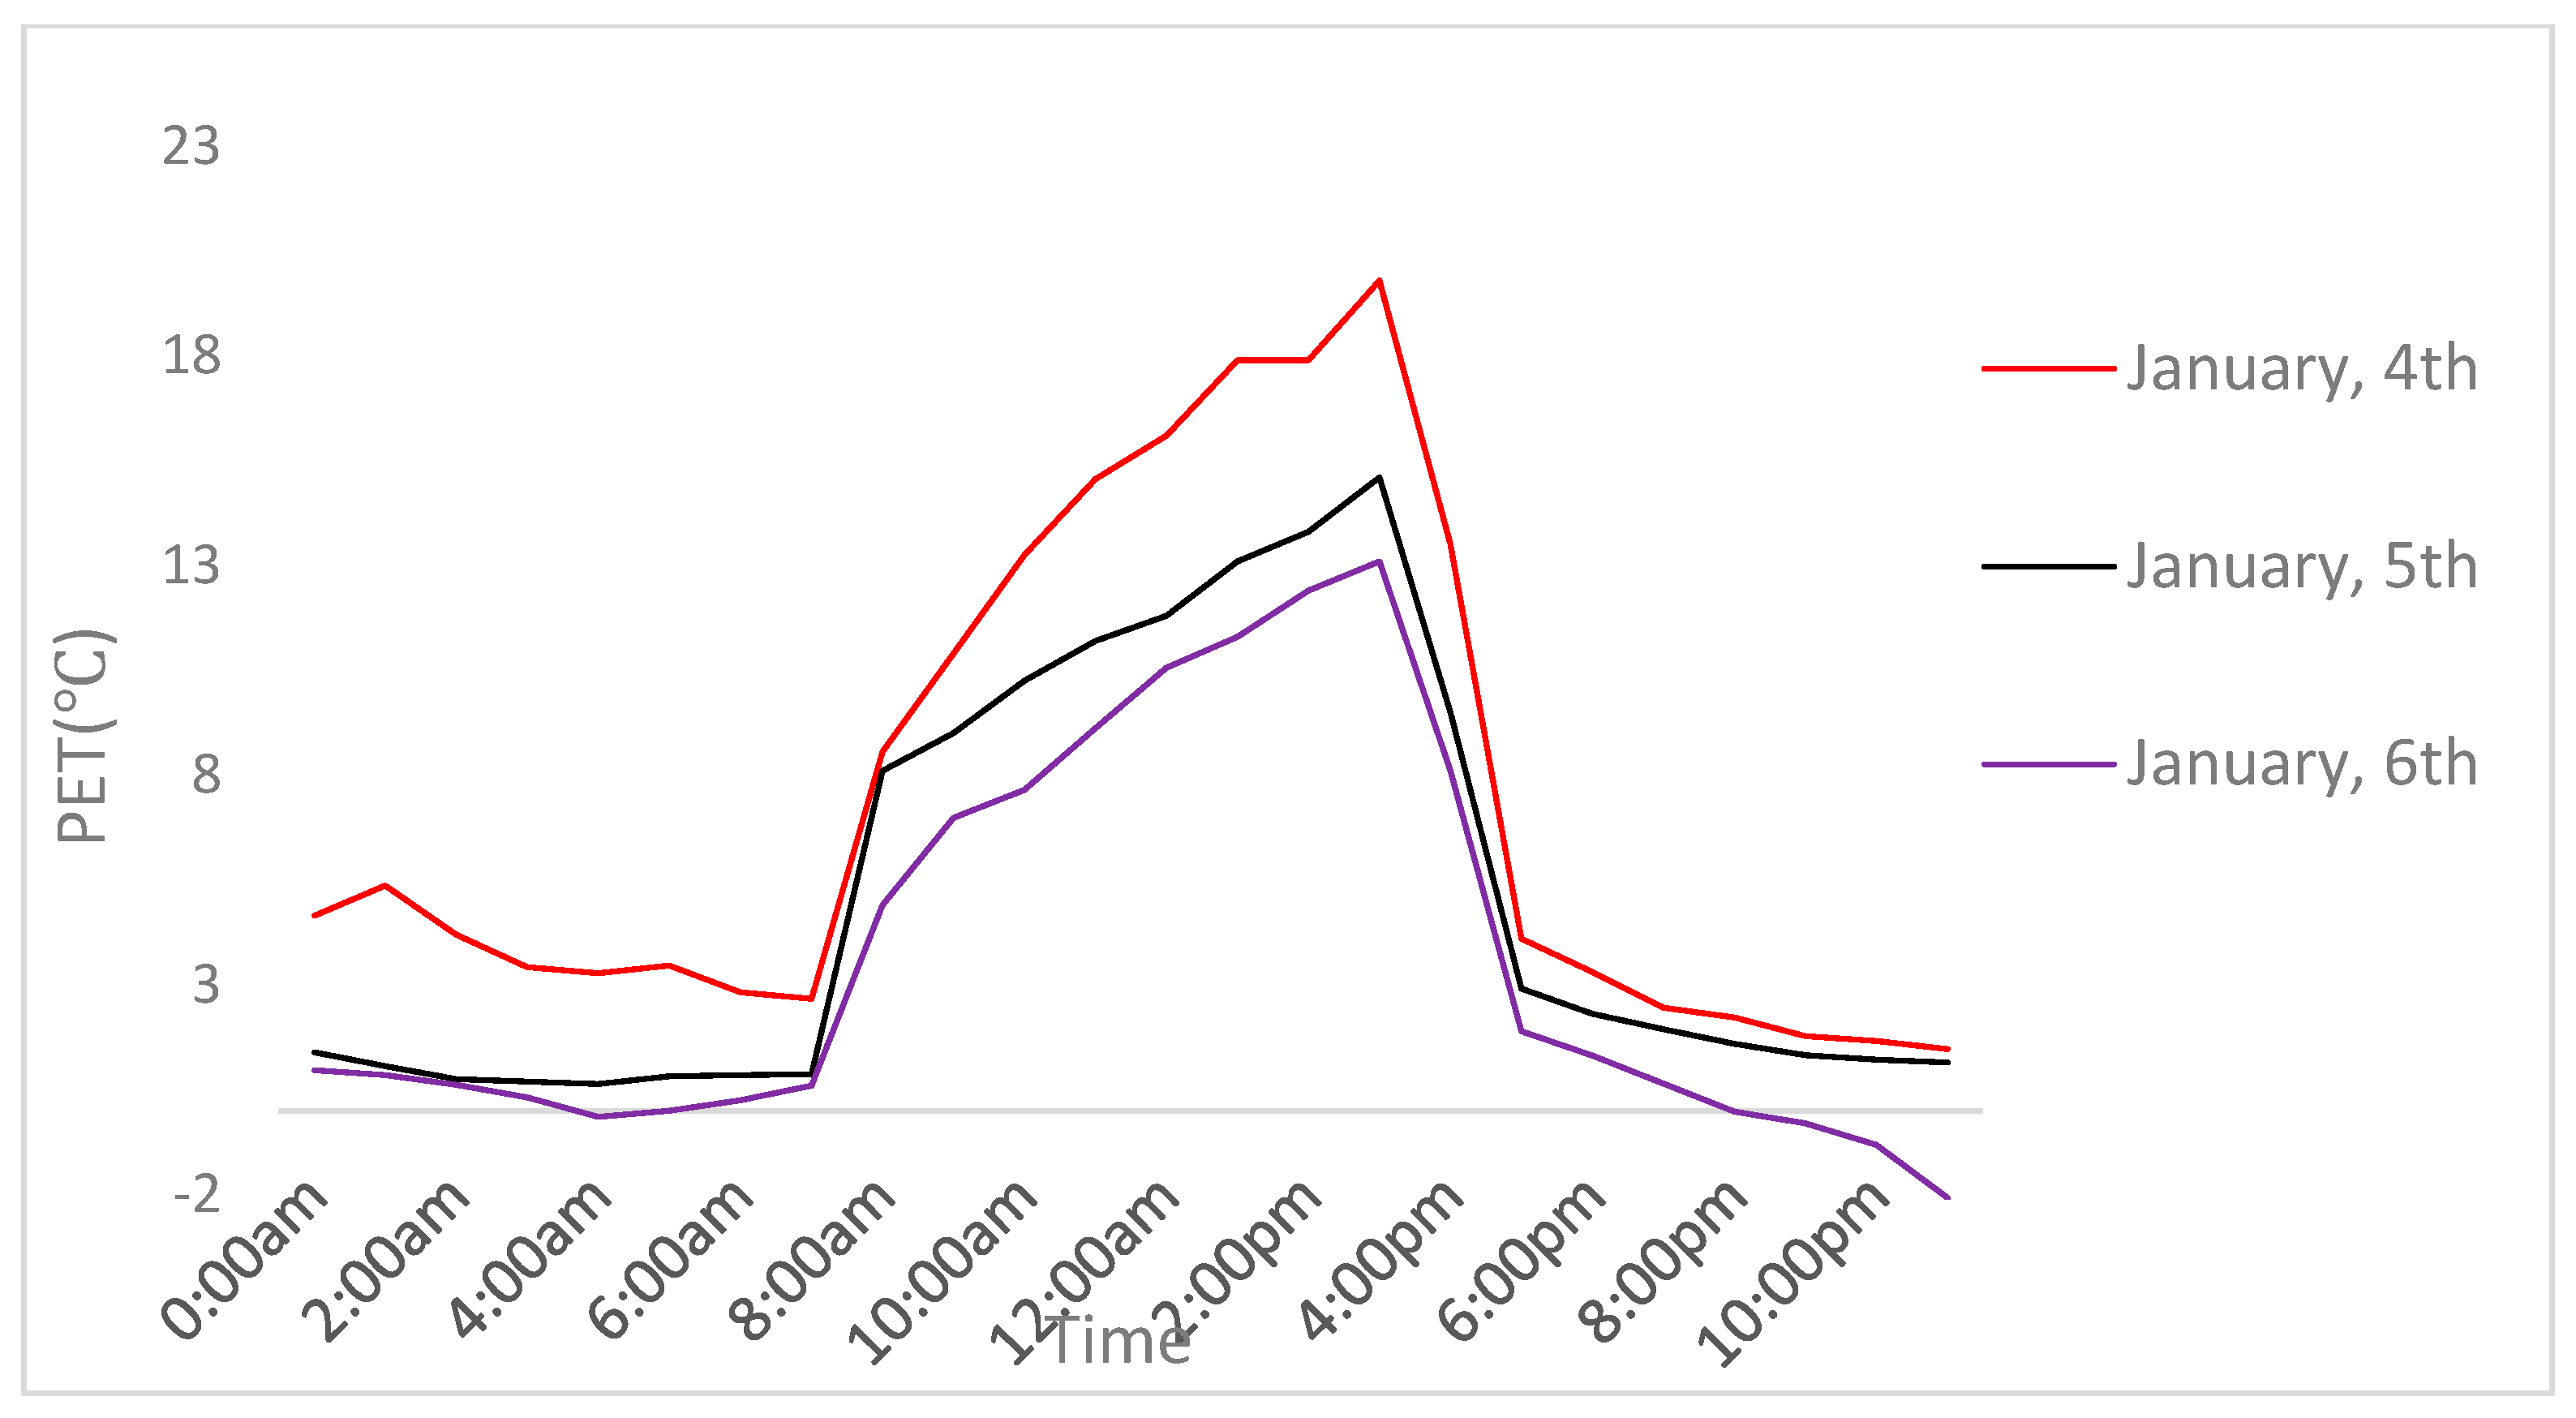
3.3. The PET Values of the Existing Scenario
4. Discussion
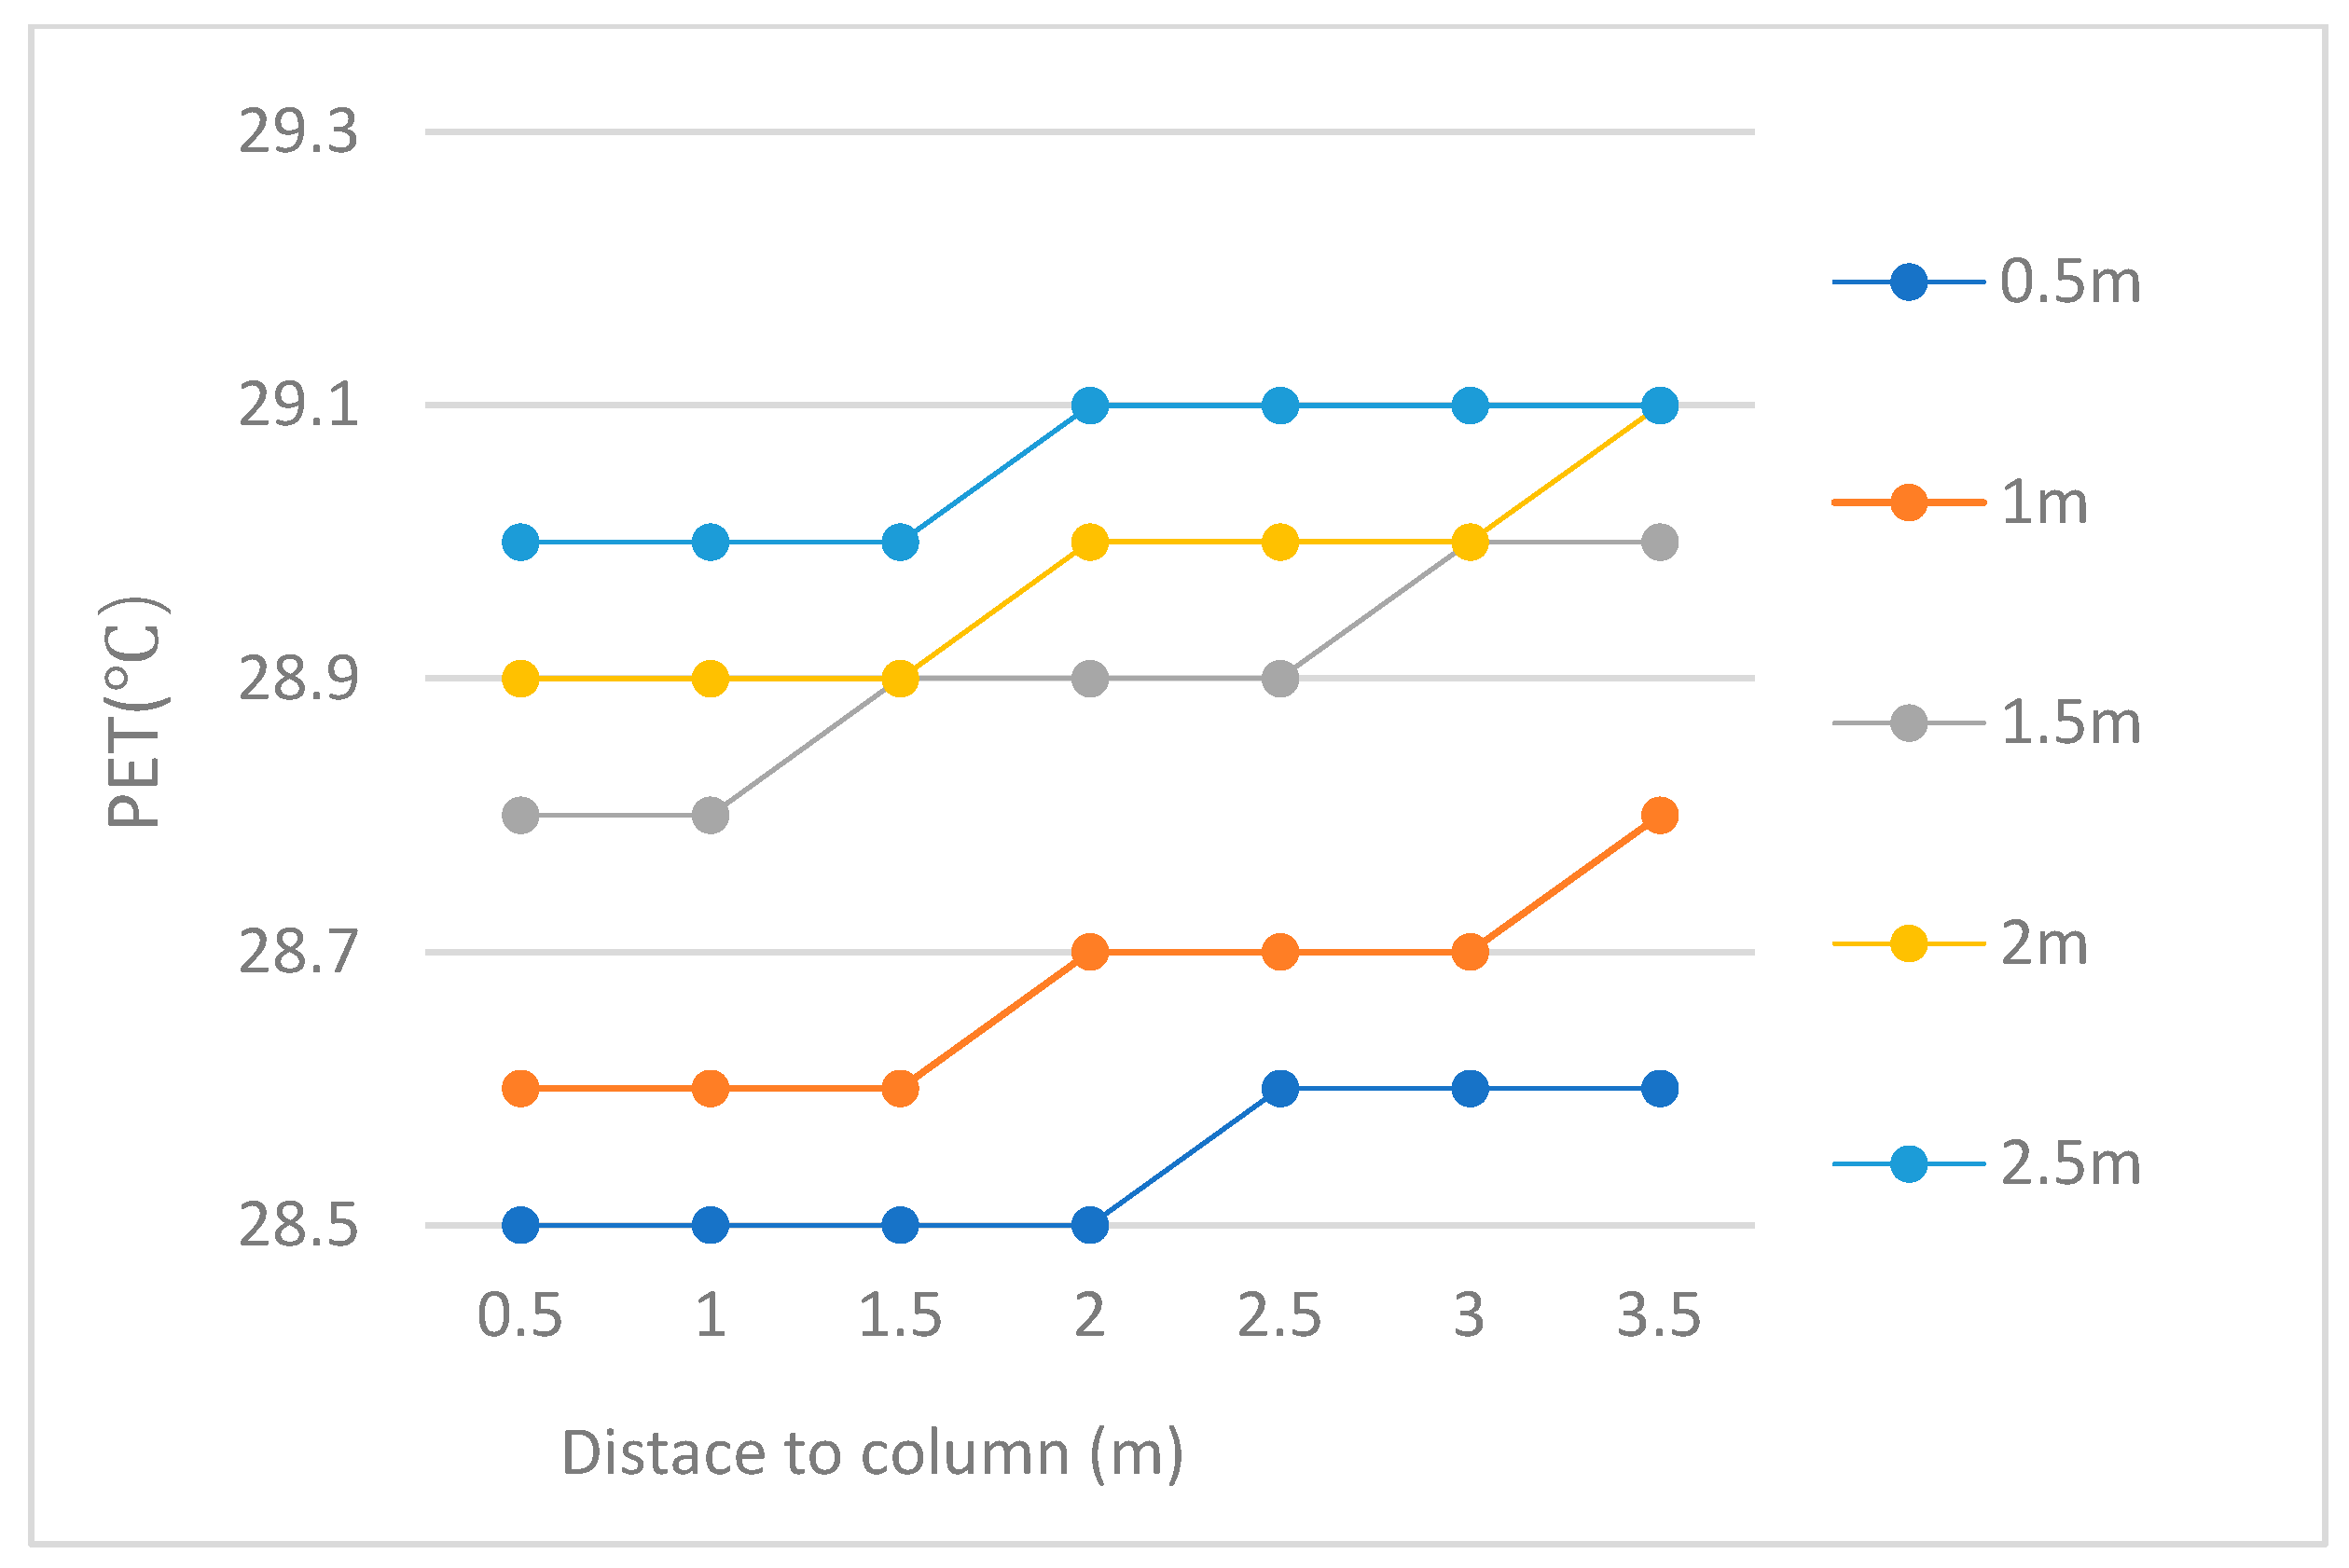
4.1. The Impact of the Columns on the Surrounding Thermal Environment
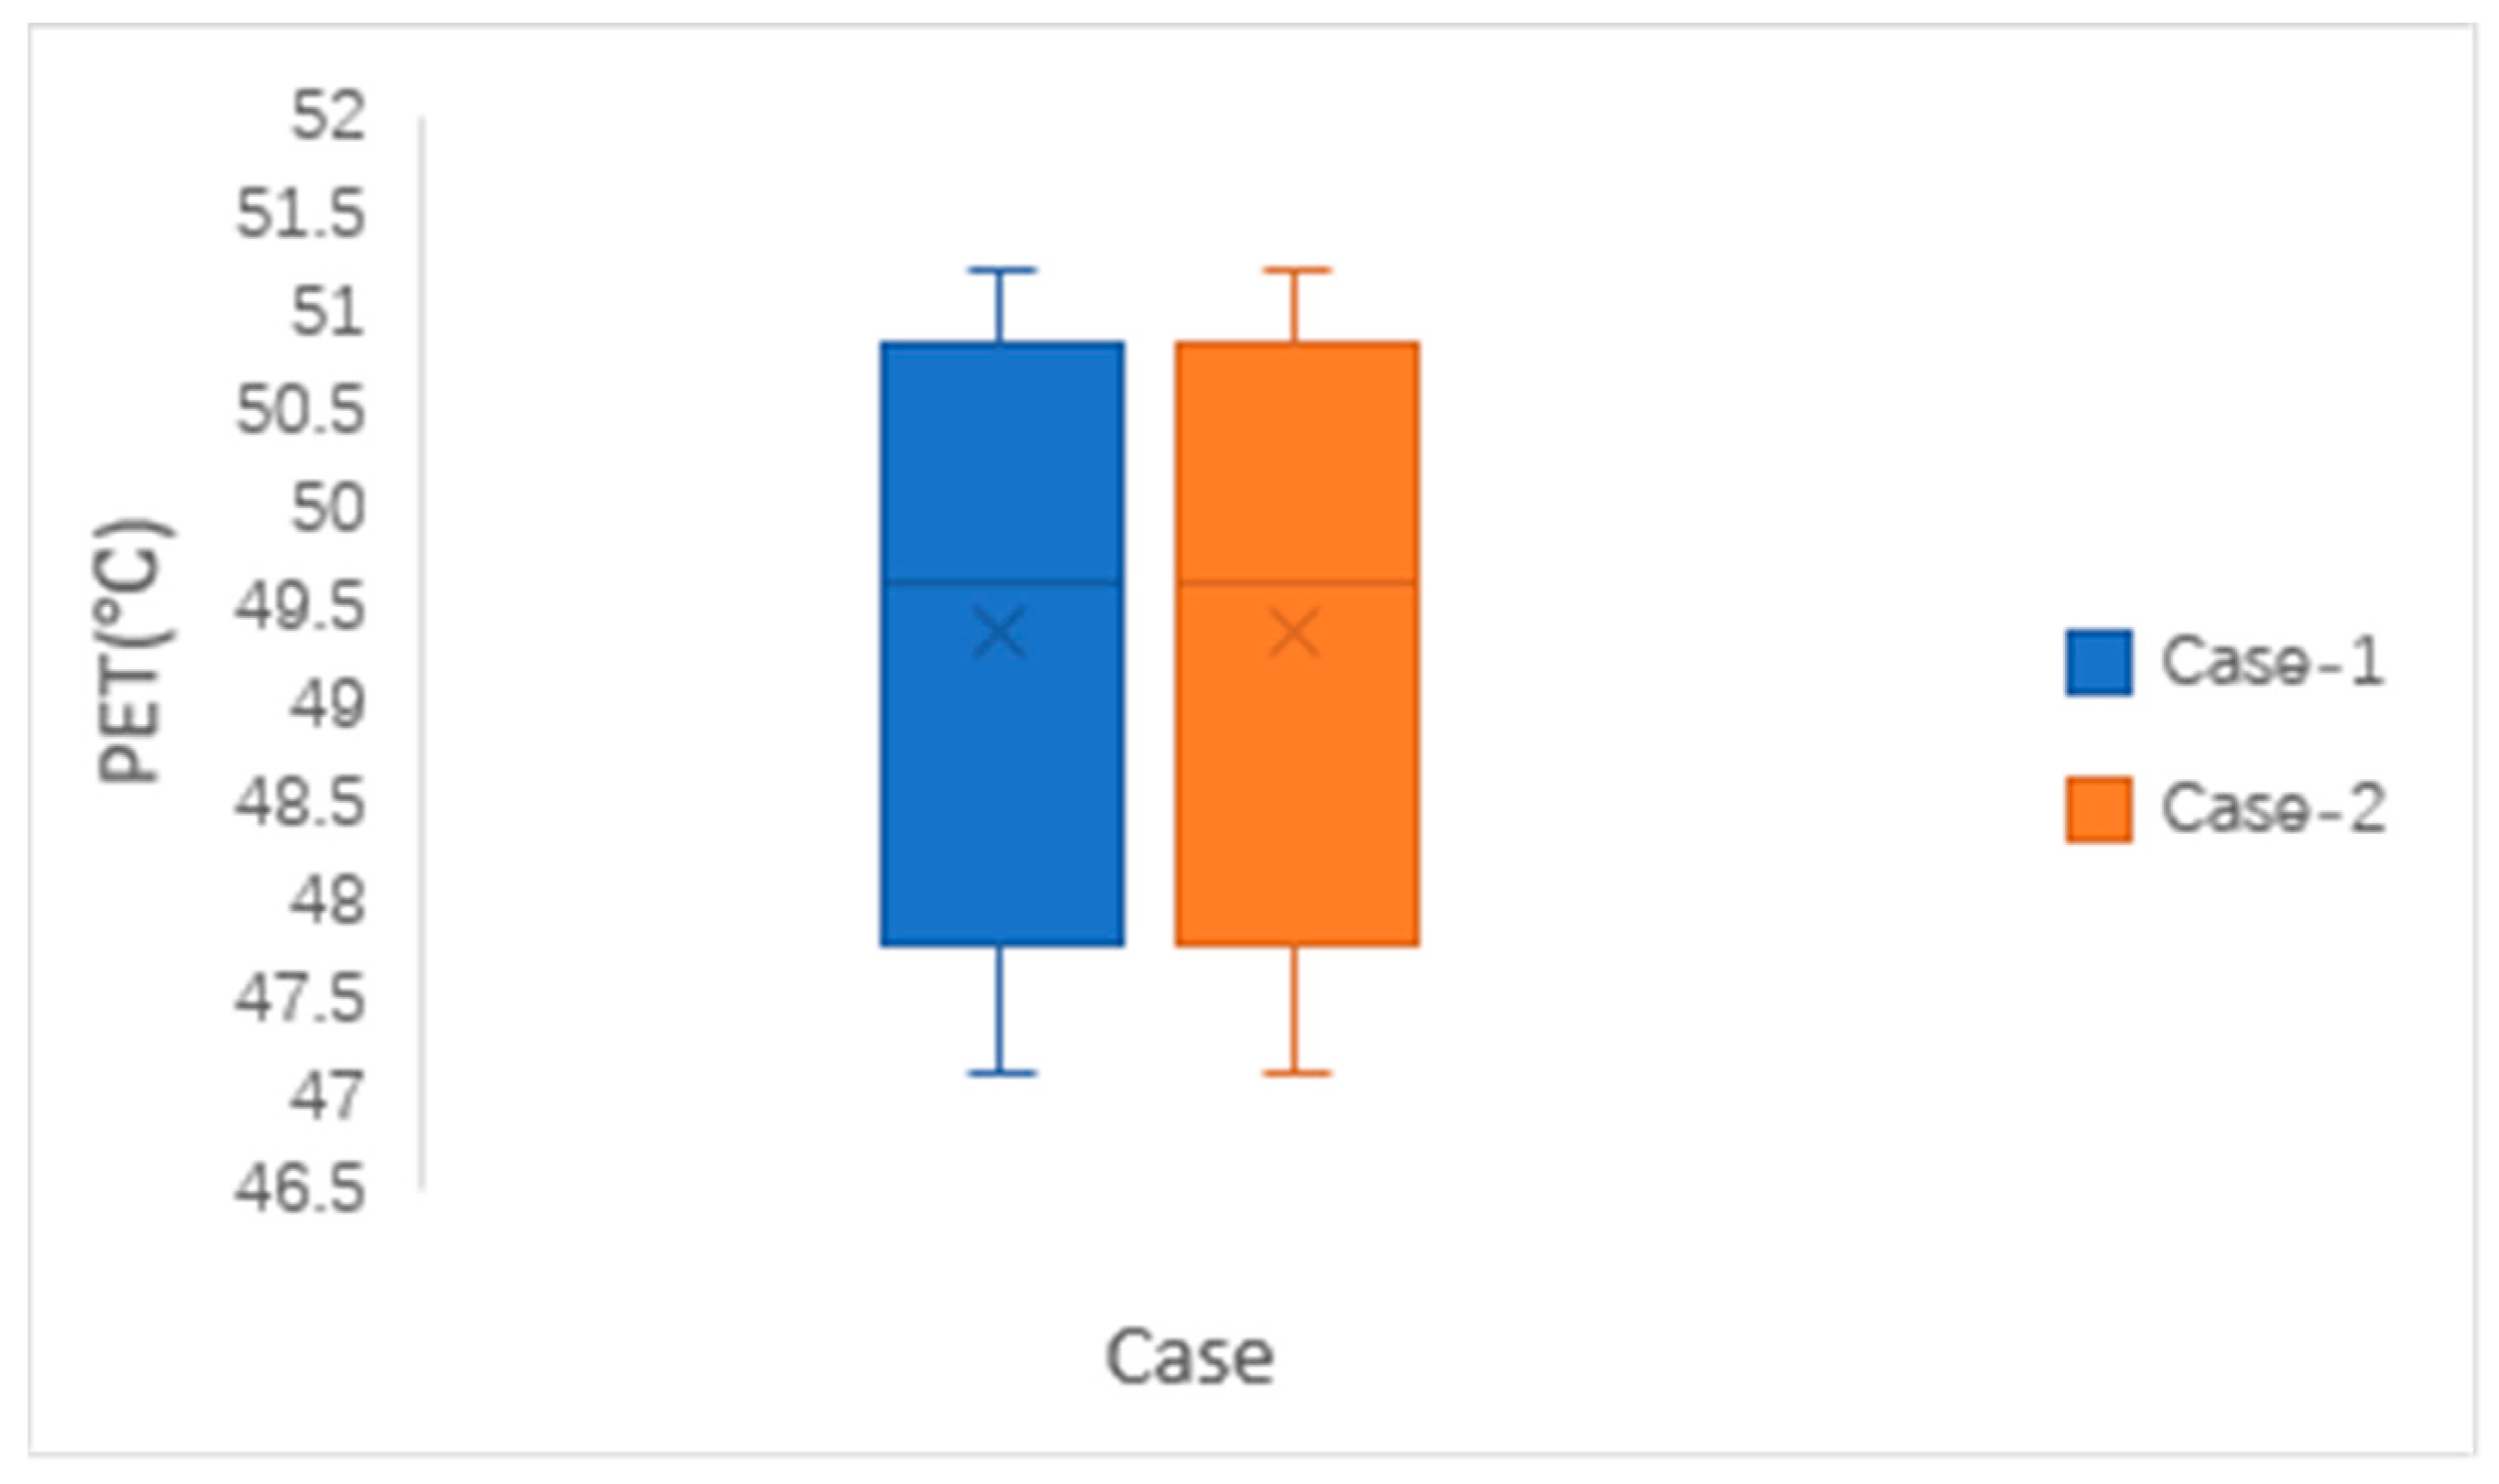
4.2. The Impact of the Bottom of the Elevated Building on the Surrounding Thermal Environment
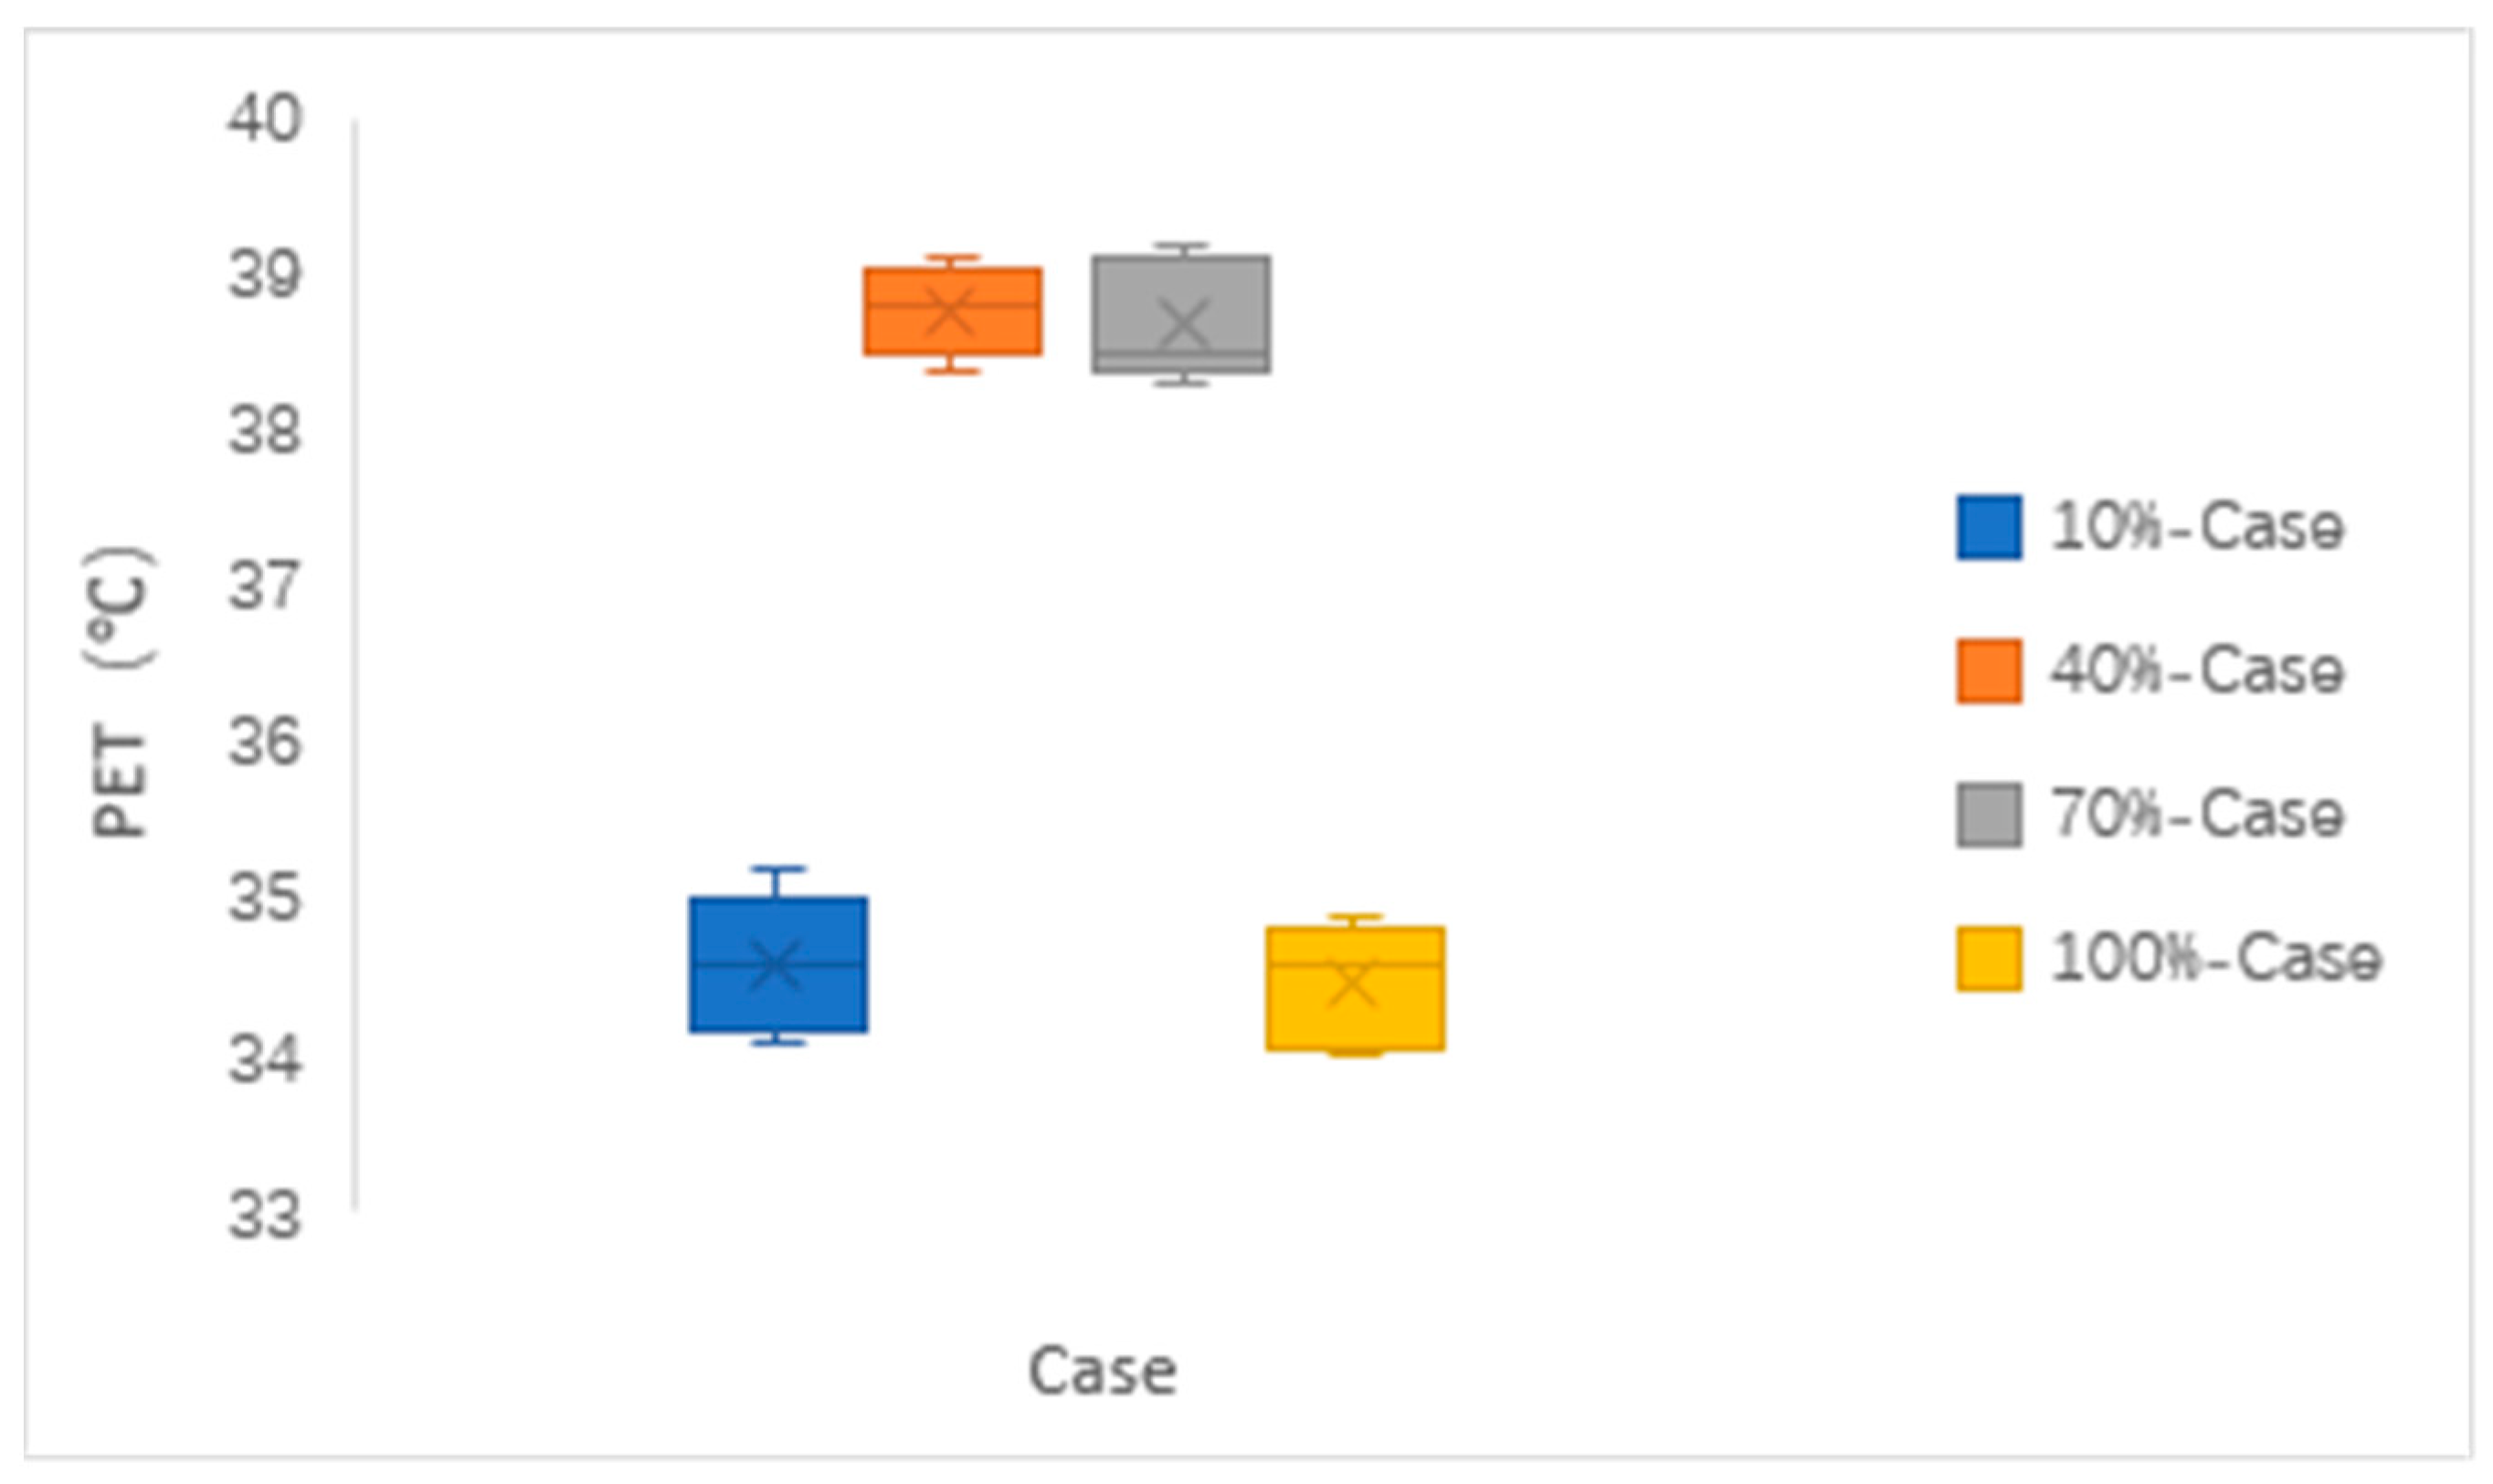
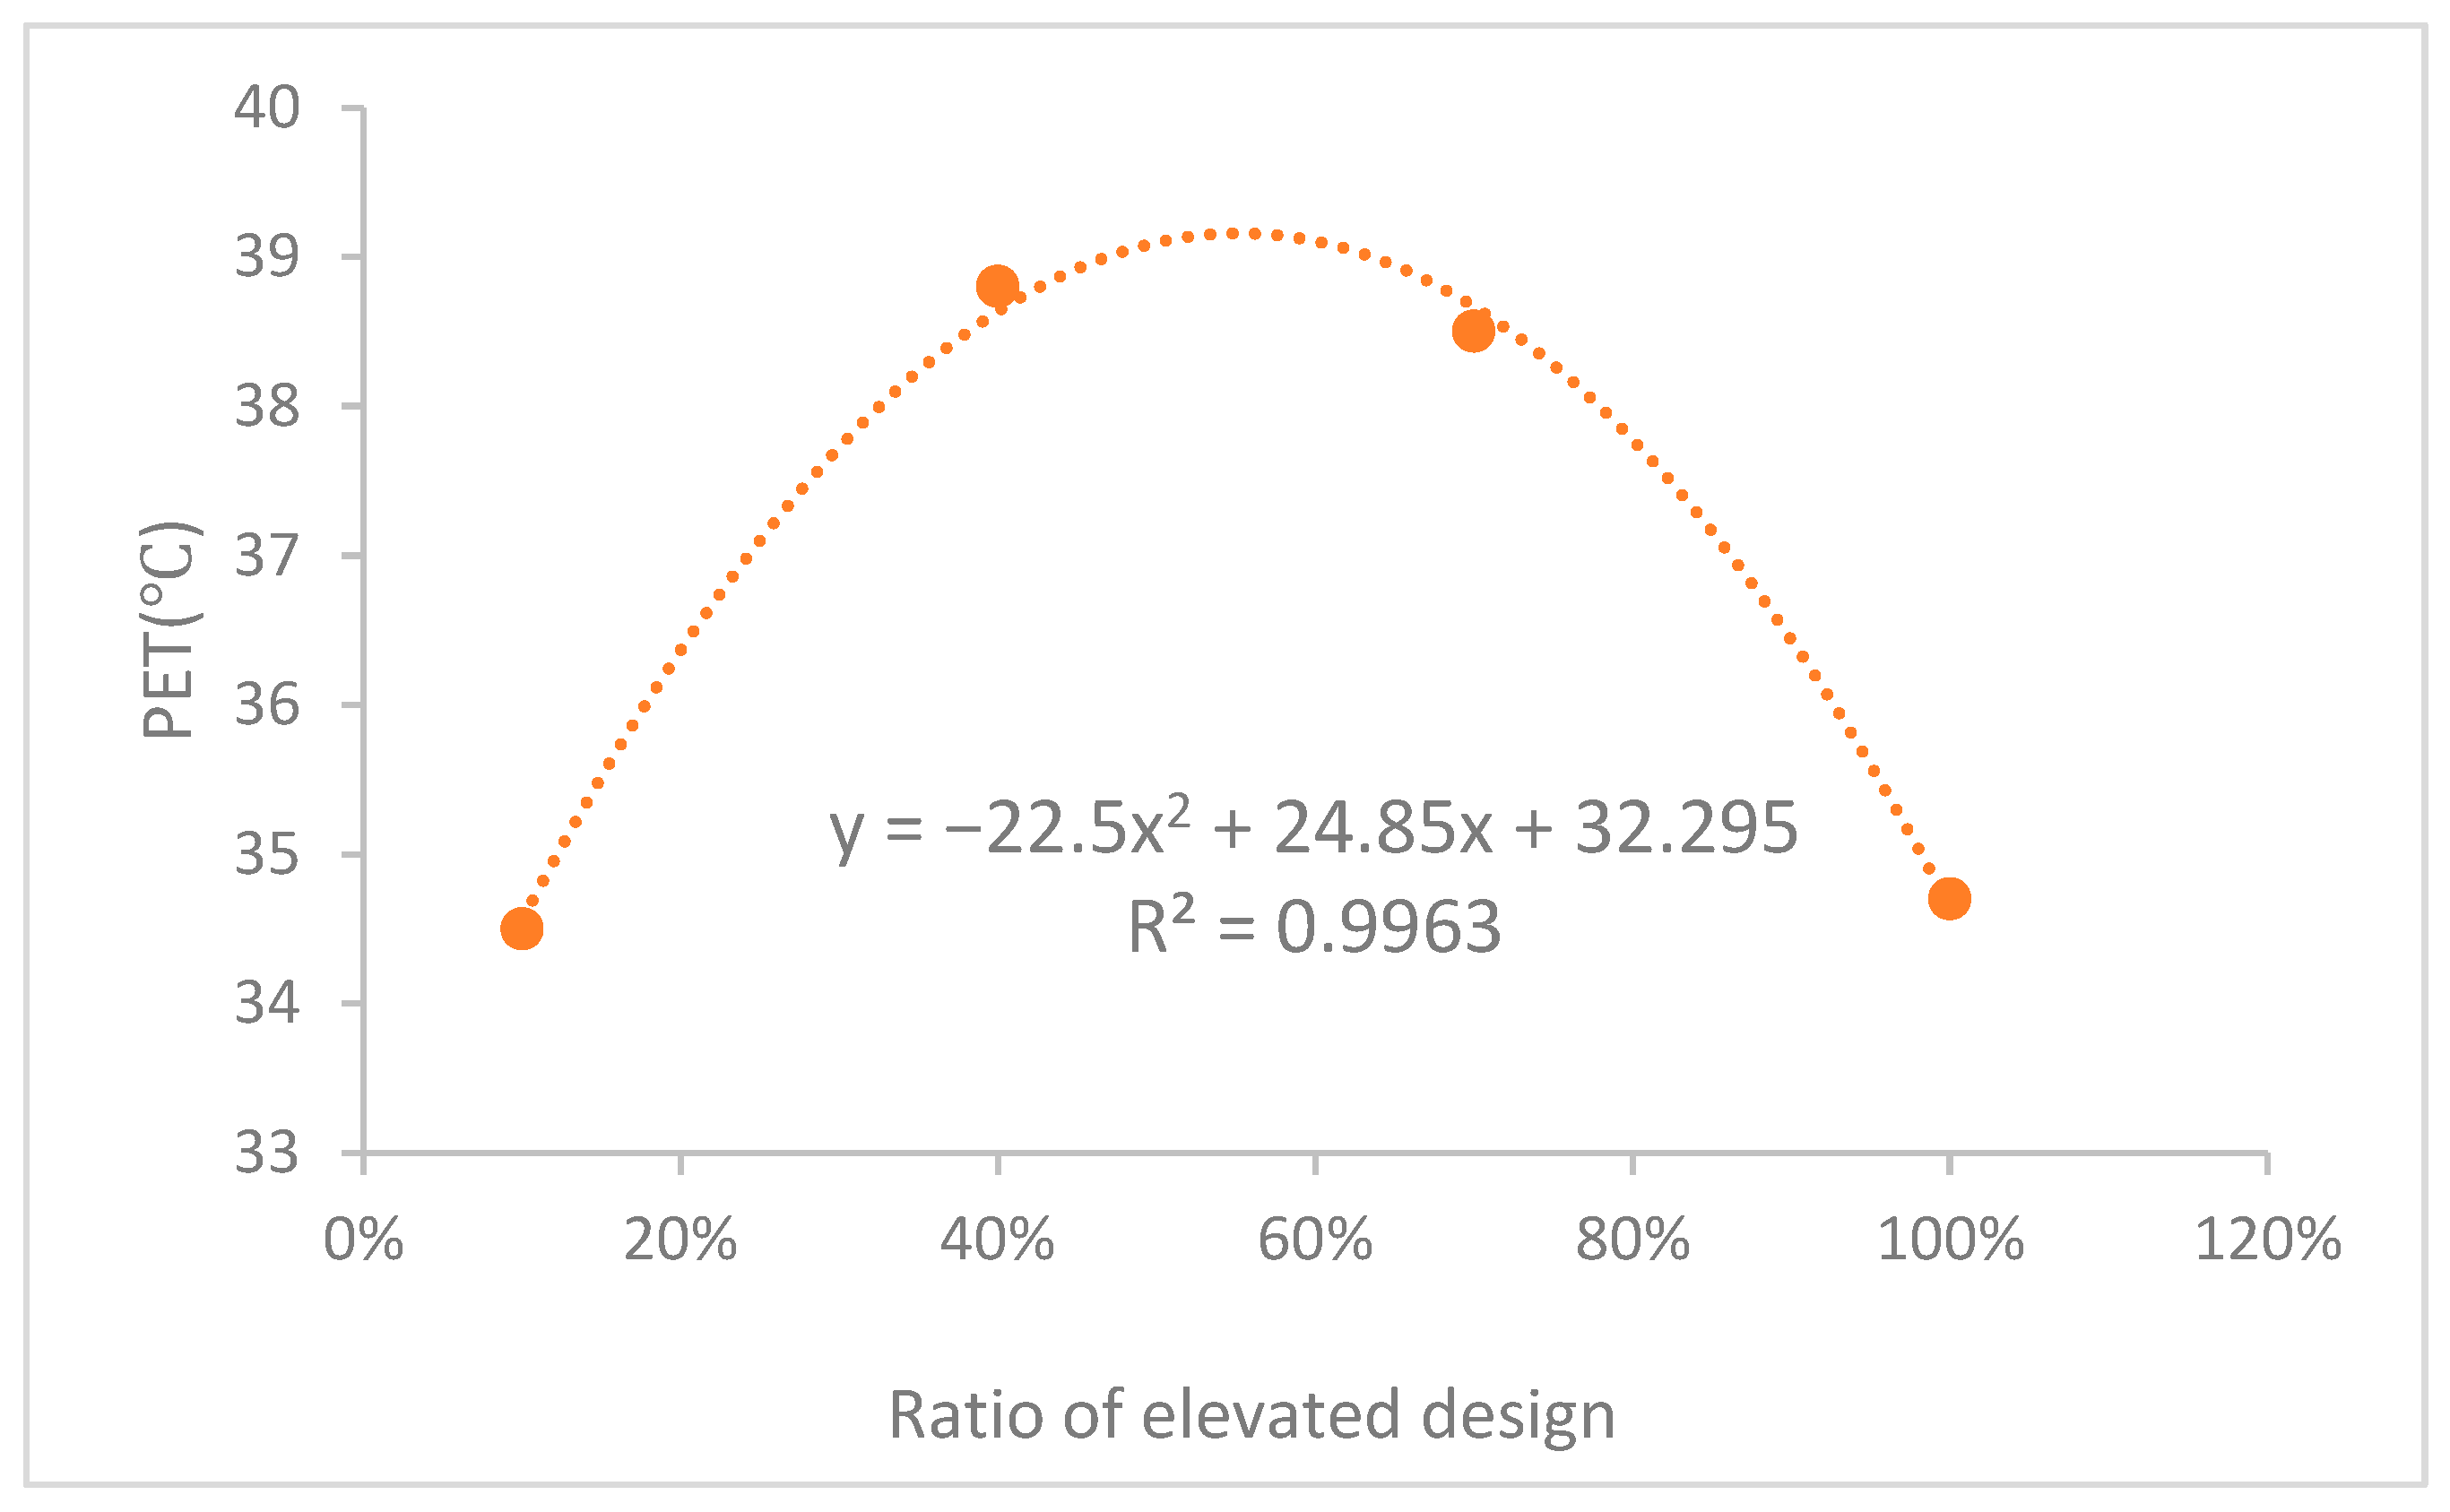
4.3. The Difference Between the Overall Elevated Design and the Partial Elevated Design
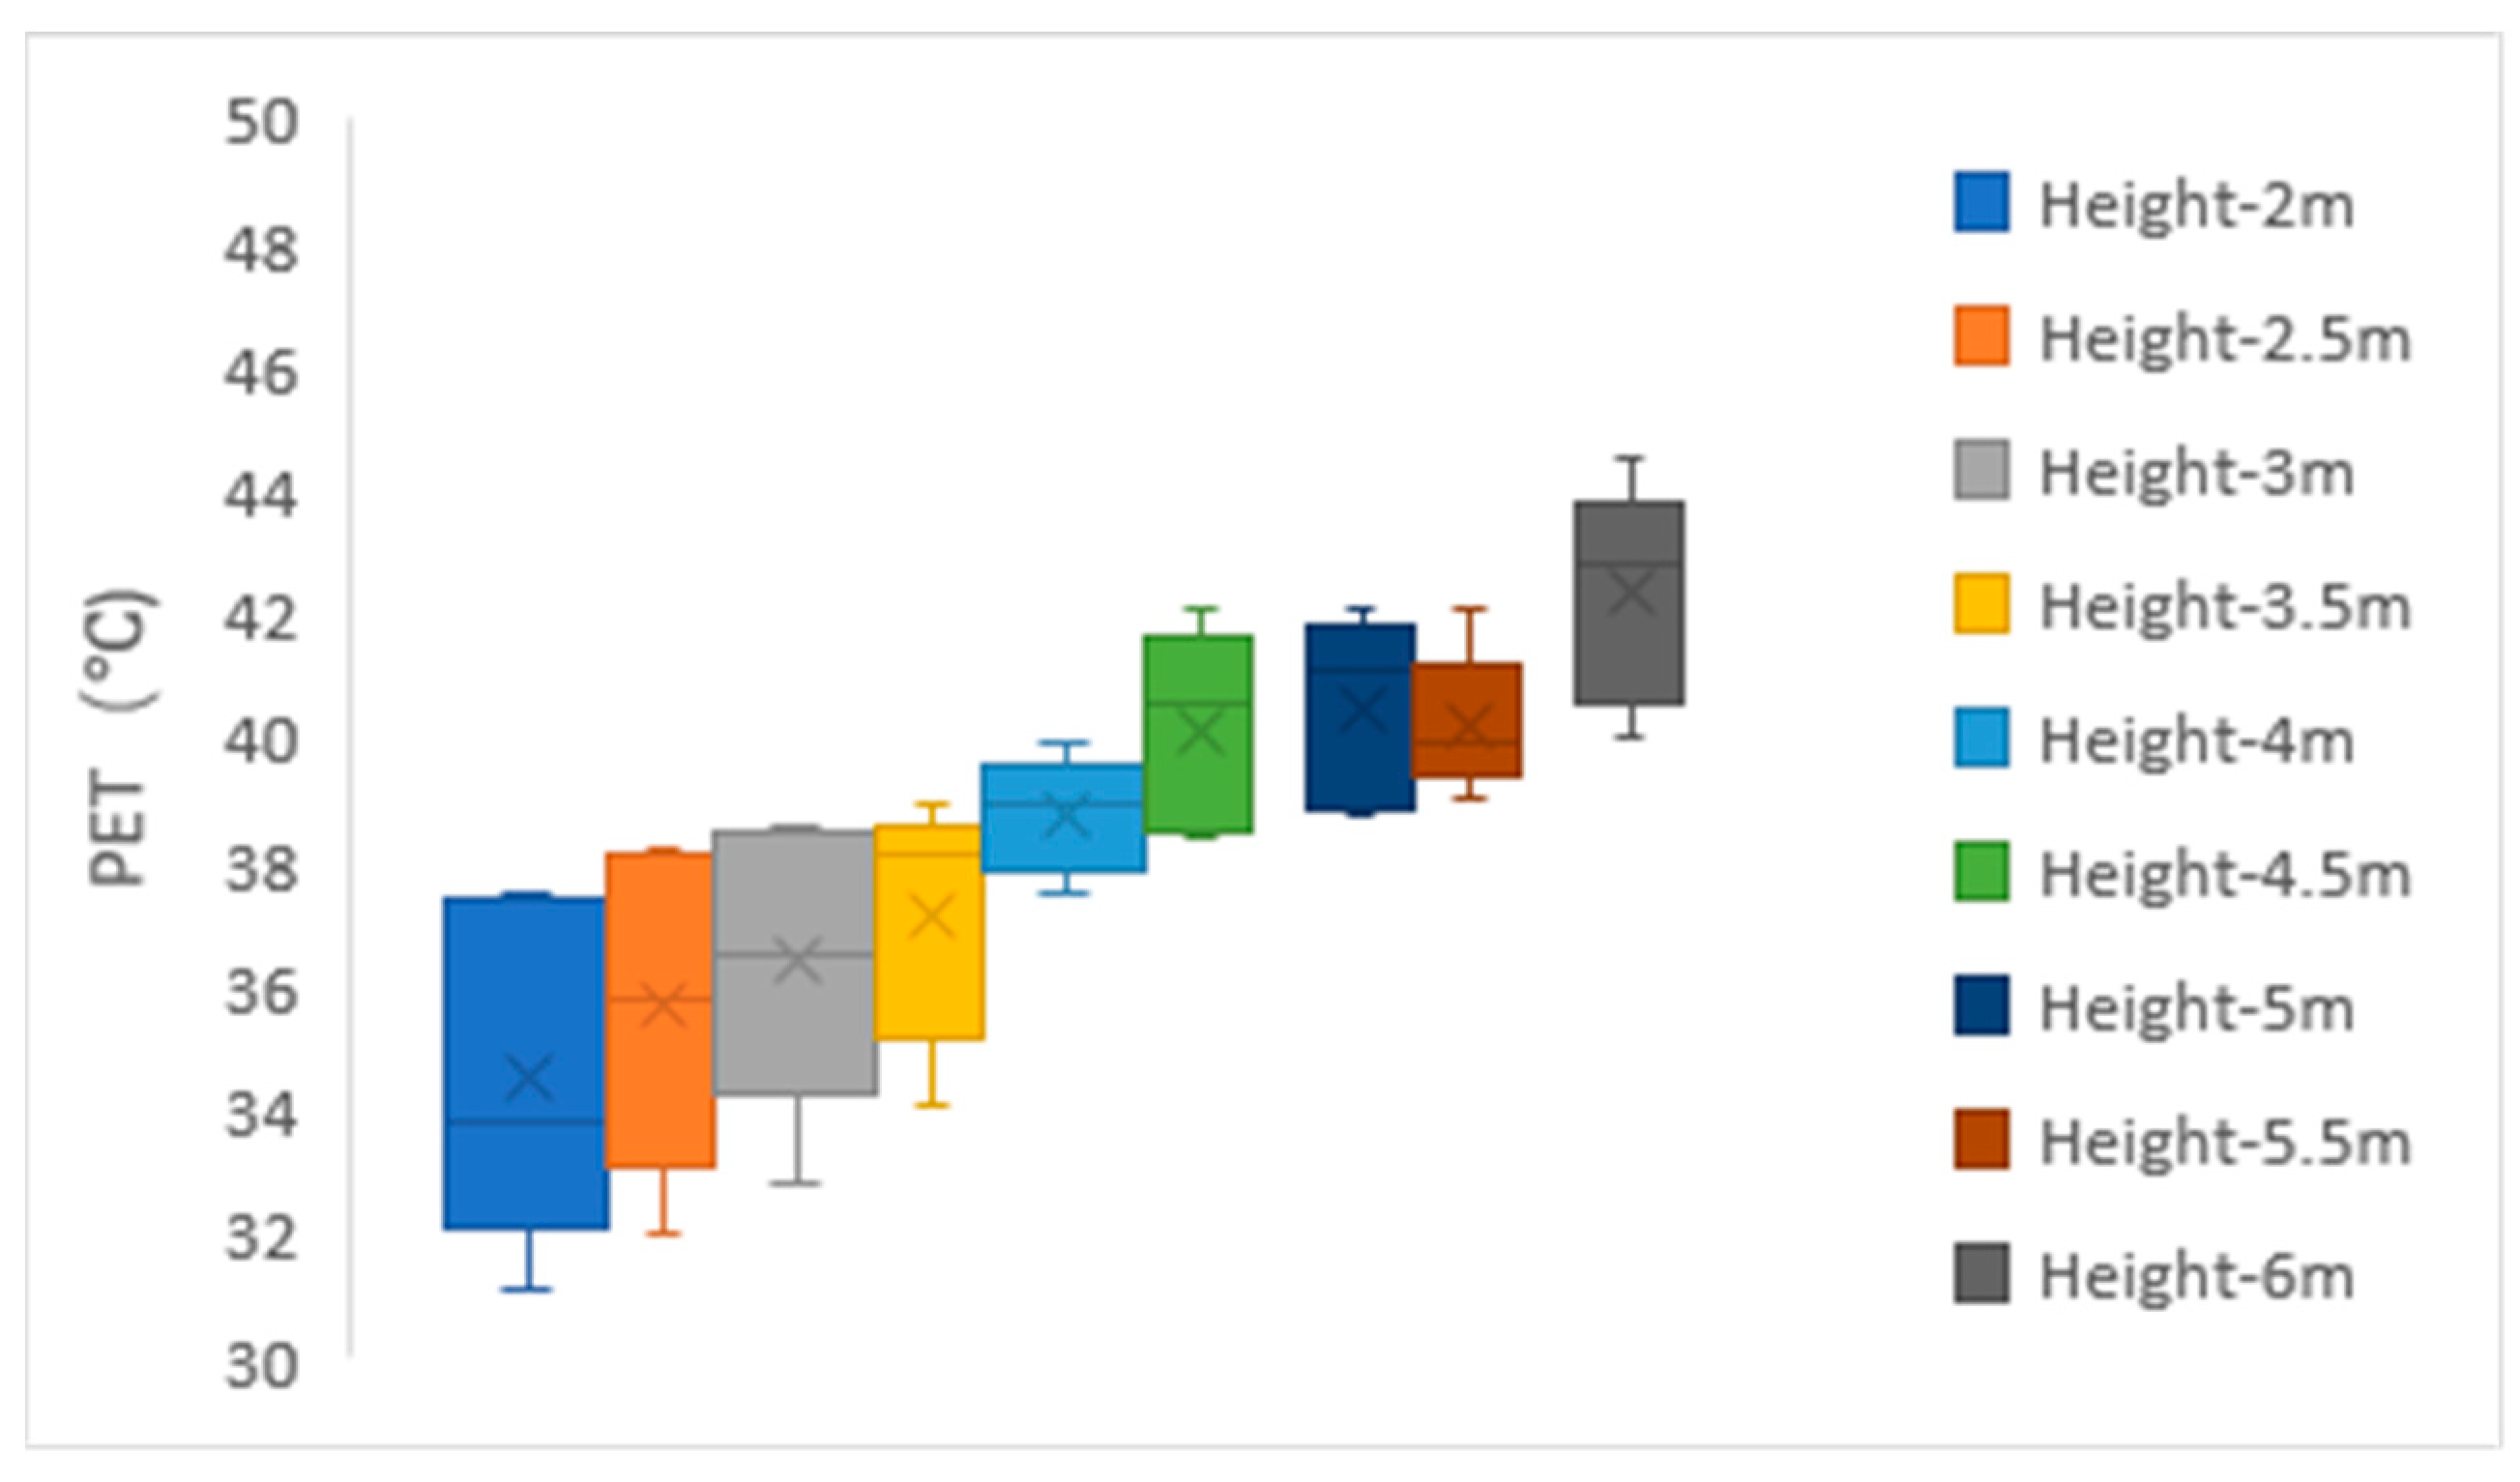
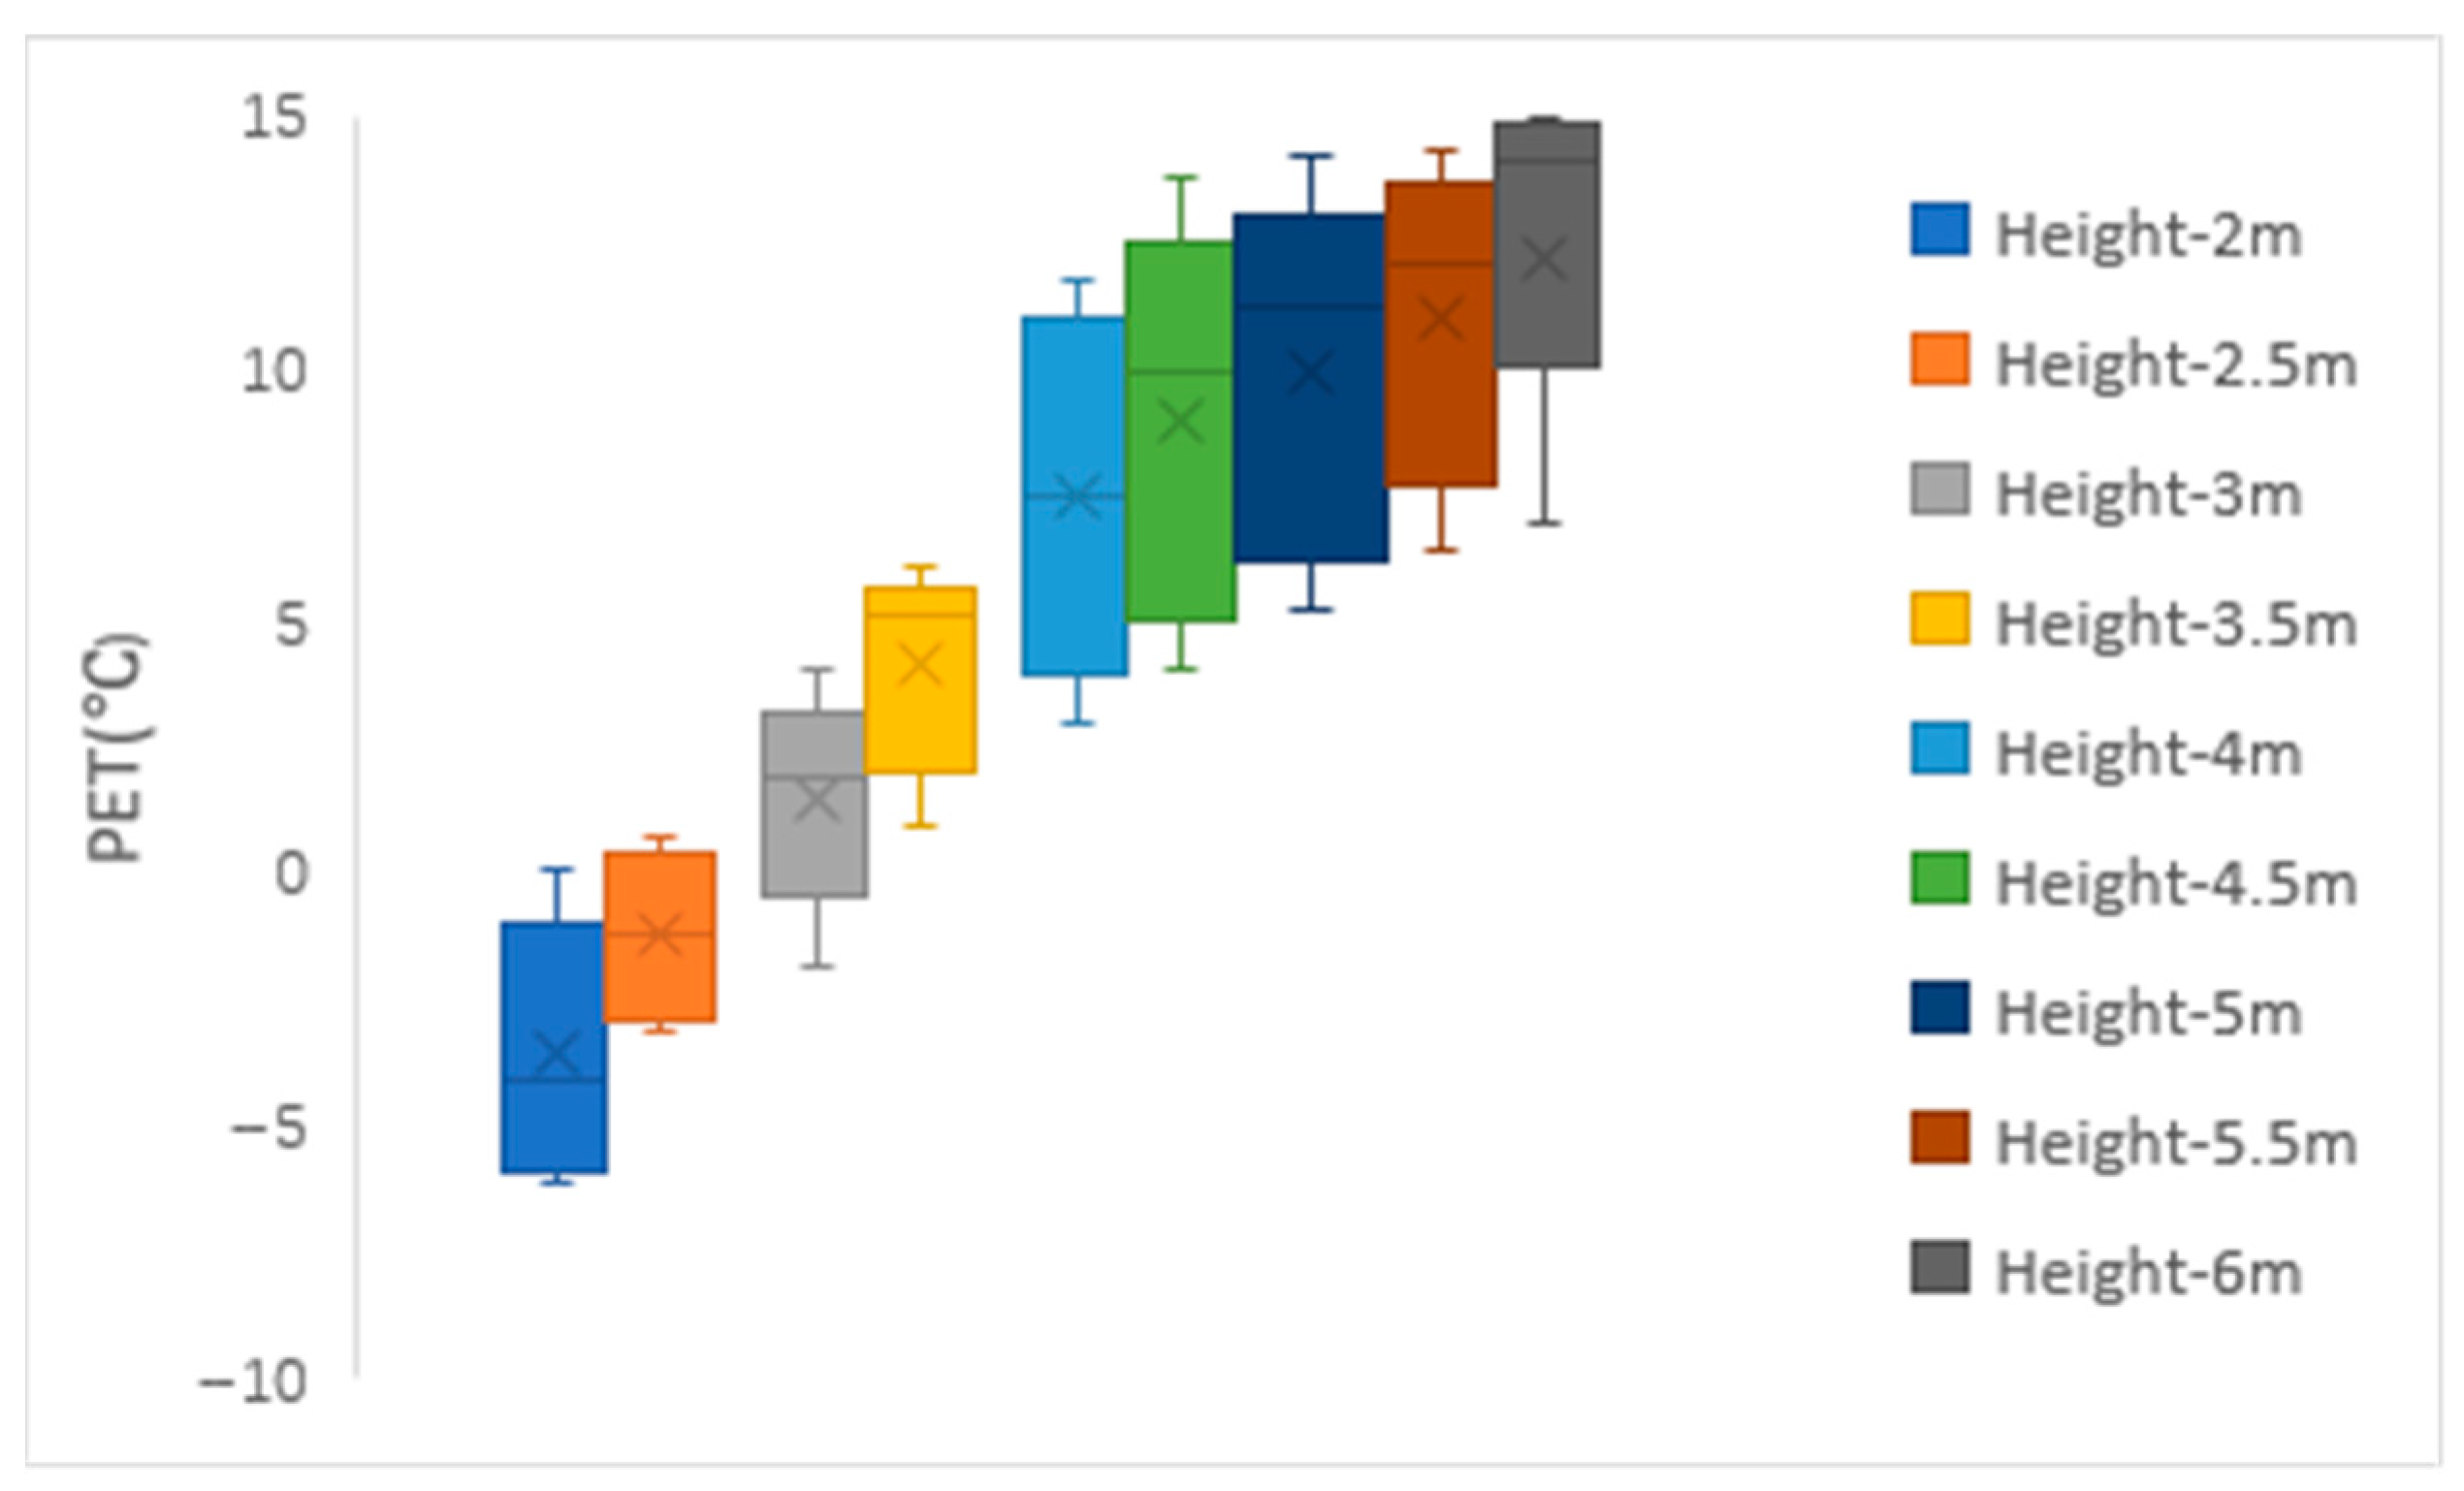
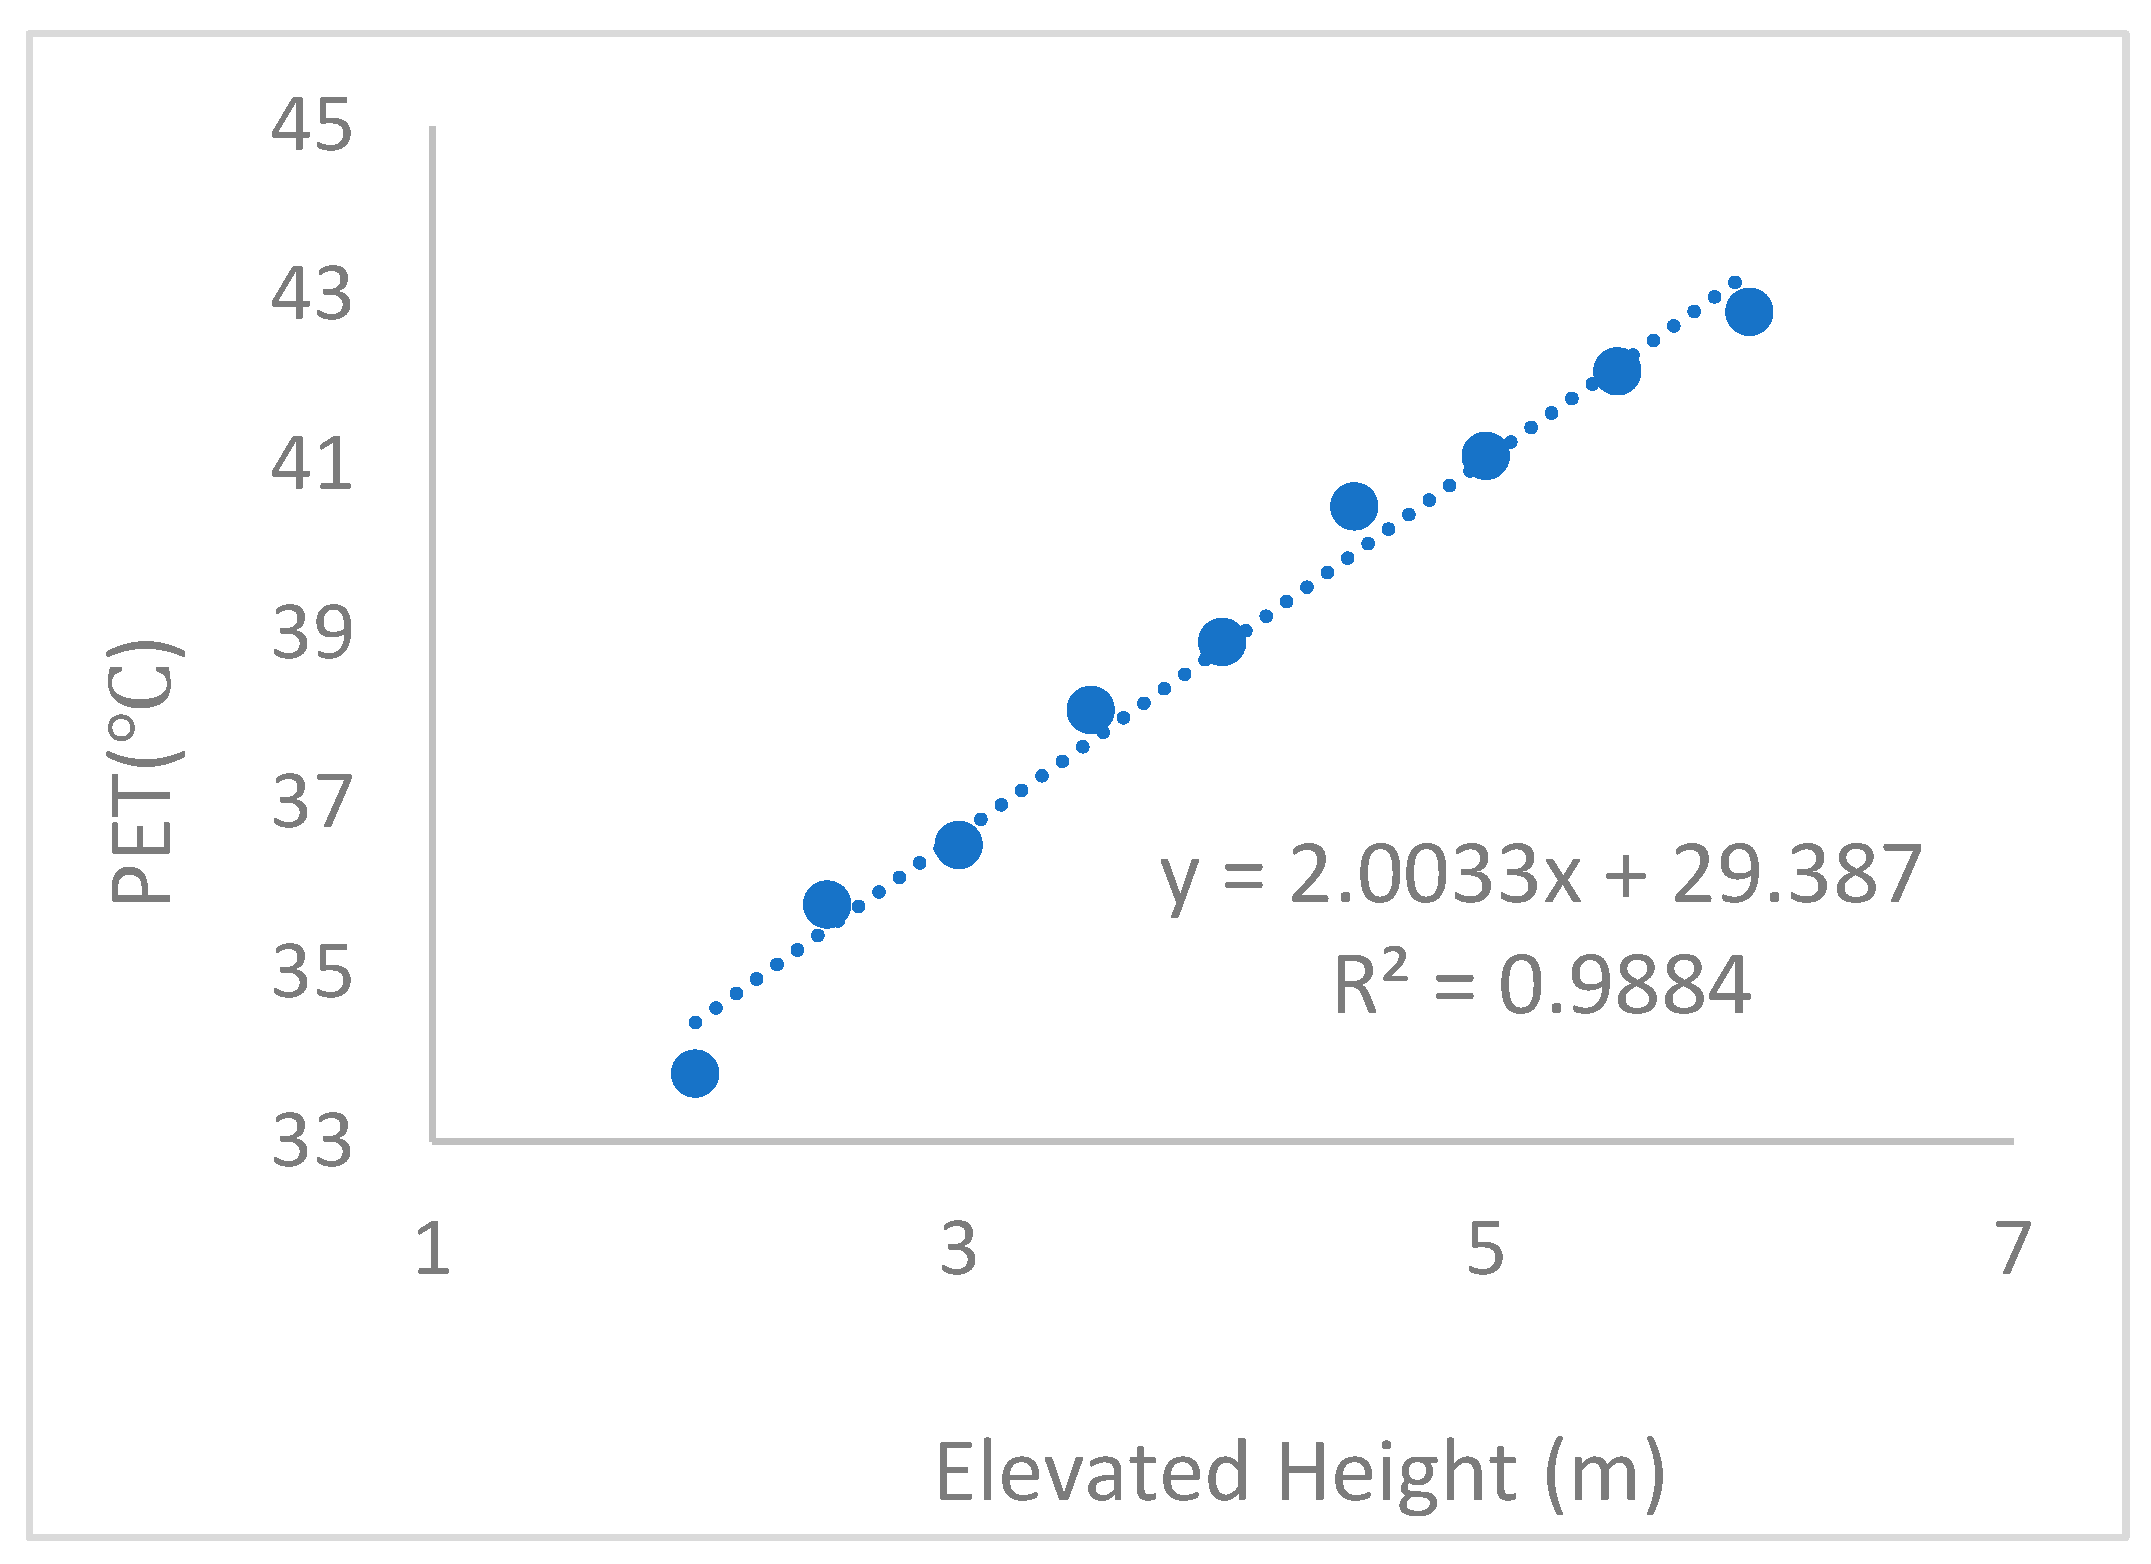
4.4. The Estimation of the Optimal Height of the Elevated Building
- Unsuitable: Very Cold, Cold, Very Hot, Hot
- Fairly Suitable: Cool, Warm
- Suitable: Slightly Cool, Neutral, Slightly Warm
5. Conclusions
6. Limitations and Outlook
Author Contributions
Funding
Data Availability Statement
Conflicts of Interest
References
- Lyu, J.; Yang, Y.; Lai, D.; Lai, D.; Lan, L.; Zhao, Z.; Du, H.; Lian, Z. Analysis of occupant thermal comfort and energy-saving potential based on cooling behaviors in residential buildings: A case study of Shanghai. Build. Environ. 2025, 275, 112792. [Google Scholar] [CrossRef]
- Ma, X.; Fukuda, H.; Zhou, D.; Gao, W.; Wang, M. The study on outdoor pedestrian thermal comfort in blocks: A case study of the Dao He Old Block in hot-summer and cold-winter area of southern China. Sol. Energy 2019, 179, 210–225. [Google Scholar] [CrossRef]
- Xu, D.; Zhou, D.; Wang, Y.; Xu, W.; Yang, Y. Field measurement study on the impacts of urban spatial indicators on urban climate in a Chinese basin and static-wind city. Build. Environ. 2019, 147, 482–494. [Google Scholar] [CrossRef]
- Liu, L.; Zhang, Z.; Lan, S.; Tian, X.; Liu, J.; Liao, W.; Wang, D. Developing a spatial optimization design approach towards energy-saving and outdoor thermal comfortable densely-built residential blocks using a dynamic local energy balance model. Energy Build. 2025, 328, 115194. [Google Scholar] [CrossRef]
- Tartarini, F.; Schiavon, S. Comparative analysis of PMV Models accuracy implemented in the ISO 7730: 2005 and ASHRAE 55: 2023. Build. Environ. 2025, 275, 112766. [Google Scholar] [CrossRef]
- Cheung, P.K.; Jim, C. Determination and application of outdoor thermal benchmarks. Build. Environ. 2017, 123, 333–350. [Google Scholar] [CrossRef]
- Potchter, O.; Cohen, P.; Lin, T.P.; Matzarakis, A. Outdoor human thermal perception in various climates: A comprehensive review of approaches, methods and quantification. Sci. Total Environ. 2018, 631–632, 390–406. [Google Scholar] [CrossRef] [PubMed]
- Gagge, A.P.; Fobelets, A.P.; Berglund, L. A standard predictive index of human response to the thermal environment. Ashrae Trans. 1986, 92, 709–731. [Google Scholar]
- Fanger, P.O. Thermal Comfort; McGraw Hill: New York, NY, USA, 1970. [Google Scholar]
- Jendritzky, G.; de Dear, R.; Havenith, G. UTCI–Why another thermal index? Int. J. Biometeorol. 2012, 56, 421–428. [Google Scholar] [CrossRef]
- Höppe, P. The physiological equivalent temperature—A universal index for the biometeorological assessment of the thermal environment. Int. J. Biometeorol. 1999, 43, 71–75. [Google Scholar] [CrossRef]
- Höppe, P.R. Heat balance modelling. Experientia 1993, 49, 741–746. [Google Scholar] [CrossRef]
- Jamei, E.; Rajagopalan, P. Urban development and pedestrian thermal comfort in Melbourne. Sol. Energy 2017, 144, 681–698. [Google Scholar] [CrossRef]
- Huo, K.; Qin, R.; Zhao, J.; Ma, X. Long-term tracking of urban structure and analysis of its impact on urban heat stress: A case study of Xi’an, China. Ecol. Indic. 2025, 174, 113418. [Google Scholar] [CrossRef]
- Sánchez-Montes, J.; Flores-Prieto, J.; López-Pérez, L.; Ríos-Rojas, C. Adaptive thermal comfort models comparison in dry and rainy seasons: A tropical climate case. Energy Build. 2025, 331, 115382. [Google Scholar] [CrossRef]
- Ma, X.; Fukuda, H.; Zhou, D.; Wang, M. The evaluation of outdoor thermal sensation and outdoor energy efficiency of a commercial pedestrianized zone. Energies 2019, 12, 1324. [Google Scholar] [CrossRef]
- Shashua-Bar, L.; Hoffman, M.E. Vegetation as a climatic component in the design of an urban street: An empirical model for predicting the cooling effect of urban green areas with trees. Energy Build. 2000, 31, 221–235. [Google Scholar] [CrossRef]
- Yang, W.; Wong, N.H.; Li, C.-Q. Effect of street design on outdoor thermal comfort in an urban street in Singapore. J. Urban Plann. Dev. 2016, 142, 05015003. [Google Scholar] [CrossRef]
- Ma, X.; Zhang, L.; Guo, M.; Zhao, J. The effect of various urban design parameter in alleviating urban heat island and improving thermal health—A case study in a built pedestrianized block of China. Environ. Sci. Pollut. Res. 2021, 28, 38406–38425. [Google Scholar] [CrossRef]
- Rosso, F.; Golasi, I.; Castaldo, V.L.; Piselli, C.; Pisello, A.L.; Salata, F.; Ferrero, M.; Cotana, F.; de Lieto Vollaro, A. On the impact of innovative materials on outdoor thermal comfort of pedestrians in historical urban canyons. Renew. Energy 2018, 118, 825–839. [Google Scholar] [CrossRef]
- Ma, X.; Wang, M.; Zhao, J.; Zhang, L.; Liu, W. Performance of Different Urban Design Parameters in Improving Outdoor Thermal Comfort and Health in a Pedestrianized Zone. Int. J. Environ. Res. Public Health 2020, 17, 2258. [Google Scholar] [CrossRef]
- Zhang, L.; Ma, X.; Zhao, J.; Wang, M. Tourists’ Thermal Experience and Health in a Commercial Pedestrianized Block: A Case Study in a Hot and Humid Region of Southern China. Int. J. Environ. Res. Public Health 2019, 16, 5072. [Google Scholar] [CrossRef] [PubMed]
- Rosso, F.; Pisello, A.L.; Cotana, F.; Ferrero, M. On the thermal and visual pedestrians’ perception about cool natural stones for urban paving: A field survey in summer conditions. Build. Environ. 2016, 107, 198–214. [Google Scholar] [CrossRef]
- Thorsson, S.; Lindqvist, M.; Lindqvist, S. Thermal bioclimatic conditions and patterns of behaviour in an urban park in Goteborg, Sweden. Int. J. Biometeorol. 2004, 48, 149–156. [Google Scholar] [CrossRef]
- Wang, Y.; de Groot, R.; Bakker, F.; Wörtche, H.; Leemans, R. Thermal comfort in urban green spaces: A survey on a Dutch university campus. Int. J. Biometeorol. 2017, 61, 87–101. [Google Scholar] [CrossRef] [PubMed]
- Yang, B.; Olofsson, T.; Nair, G.; Kabanshi, K. Outdoor thermal comfort under subarctic climate of north Sweden—A pilot study in Umeå. Sustain. Cities Soc. 2017, 28, 387–397. [Google Scholar] [CrossRef]
- He, Y.; Zhong, H.; Fan, Y.; Lau, S.S.Y.; Cui, G. A calibration framework for outdoor thermal comfort index and neutral range: Application in subtropical hot-humid campus. Indoor Built Environ. 2025, 34, 554–568. [Google Scholar] [CrossRef]
- Chen, L.; Wen, Y.Y.; Zhang, L.; Xiang, W.N. Studies of thermal comfort and space use in an urban park square in cool and cold seasons in Shanghai. Build. Environ. 2015, 94, 644–653. [Google Scholar] [CrossRef]
- Liu, W.; Zhang, Y.; Deng, Q. The effects of urban microclimate on outdoor thermal sensation and neutral temperature in hot-summer and cold-winter climate. Energy Build. 2016, 128, 190–197. [Google Scholar] [CrossRef]
- Zhang, L.; Zhan, Q.; Lan, Y. Effects of the tree distribution and species on outdoor environment conditions in a hot summer and cold winter zone: A case study in Wuhan residential quarters. Build. Environ. 2018, 130, 27–39. [Google Scholar] [CrossRef]
- Li, K.; Zhang, Y.; Zhao, L. Outdoor thermal comfort and activities in the urban residential community in a humid subtropical area of China. Energy Build. 2016, 133, 498–511. [Google Scholar] [CrossRef]
- Irakoze, A.; Kim, J.; Kim, K.H. Development of a real time setpoint temperature control method based on artificial neural network (ANN) and adaptive thermal comfort. Energy Build. 2025, 331, 115390. [Google Scholar] [CrossRef]
- Fang, Z.; Feng, X.; Liu, J.; Lin, Z.; Mak, C.M.; Niu, J.; Tse, K.T.; Xu, X. Investigation into the differences among several outdoor thermal comfort indices against field survey in subtropics. Sustain. Cities Soc. 2019, 44, 676–690. [Google Scholar] [CrossRef]
- Huang, J.; Zhou, C.; Zhuo, Y.; Xu, L.; Jiang, Y. Outdoor thermal environments and activities in open space: An experiment study in humid subtropical climates. Build. Environ. 2016, 103, 238–249. [Google Scholar] [CrossRef]
- Li, J.; Niu, J.; Mak, C.M.; Huang, T.; Xie, Y. Assessment of outdoor thermal comfort in Hong Kong based on the individual desirability and acceptability of sun and wind conditions. Build. Environ. 2018, 145, 50–61. [Google Scholar] [CrossRef]
- Chen, X.; Xue, P.; Liu, L.; Gao, L.; Liu, J. Outdoor thermal comfort and adaptation in severe cold area: A longitudinal survey in Harbin, China. Build. Environ. 2018, 143, 548–560. [Google Scholar] [CrossRef]
- Shui, T.; Liu, J.; Yuan, Q.; Qu, Y.; Jin, H.; Cao, J.; Liu, L.; Chen, X. Assessment of pedestrian–level wind conditions in severe cold regions of China. Build. Environ. 2018, 135, 53–67. [Google Scholar] [CrossRef]
- Chen, X.; Xue, P.; Gao, L.; Du, J.; Liu, J. Physiological and thermal response to real—Life transient conditions during winter in severe cold area. Build. Environ. 2019, 157, 284–296. [Google Scholar] [CrossRef]
- GB 50176–2016; Thermal Design Code for Civil Buildings, TDCFCB. China Architecture & Building Press: Beijing, China, 2016.
- Lai, D.; Guo, D.; Hou, Y.; Lin, C.; Chen, Q. Studies of outdoor thermal comfort in northern China. Build. Environ. 2014, 77, 110–118. [Google Scholar] [CrossRef]
- Yan, H.; Wu, F.; Dong, L. Influence of a large urban park on the local urban thermal environment. Sci. Total Environ. 2018, 622–623, 882–891. [Google Scholar] [CrossRef]
- Xu, M.; Hong, B.; Mi, J.; Yan, S. Outdoor thermal comfort in an urban park during winter in cold regions of China. Sustain. Cities Soc. 2018, 43, 208–220. [Google Scholar] [CrossRef]
- Lin, T.P. Thermal perception, adaptation and attendance in a public square in hot and humid regions. Build. Environ. 2009, 44, 2017–2026. [Google Scholar] [CrossRef]
- Wang, Y.; Bakker, F.; de Groot, R.; Wörtche, H.; Leemans, R. Effects of urban green infrastructure (UGI) on local outdoor microclimate during the growing season. Monit. Assess. 2015, 187, 732. [Google Scholar] [CrossRef] [PubMed]
- Yin, J.; Zheng, Y.; Tan, J.; Ye, D.; Wang, W. An analysis of influential factors on outdoor thermal comfort in summer. Int. J. Biometeorol. 2012, 56, 941–948. [Google Scholar] [CrossRef]
- Liu, J.; Niu, J.; Xia, Q. Combining measured thermal parameters and simulated wind velocity to predict outdoor thermal comfort. Build. Environ. 2016, 105, 185–197. [Google Scholar] [CrossRef]
- Niu, J.; Liu, J.; Lee, T.-C.; Lin, Z.; Mak, C.; Tse, K.-T.; Tang, B.-S.; Kwok, K.C. A new method to assess spatial variations of outdoor thermal comfort: Onsite monitoring results and implications for precinct planning. Build. Environ. 2015, 91, 263–270. [Google Scholar] [CrossRef]
- Liu, J.; Niu, J. CFD simulation of the wind environment around an isolated high rise building: An evaluation of SRANS, LES and DES models. Build. Environ. 2016, 96, 91–106. [Google Scholar] [CrossRef]
- Xia, Q.; Liu, X.; Niu, J.; Kwok, K.C.S. Effects of building lift-up design on the wind environment for pedestrians. Indoor Built Environ. 2015, 26, 1214–1231. [Google Scholar] [CrossRef]
- Wang, D.; Xu, H.; Yang, J.; Luo, Y.; Yang, L. Energy consumption analysis and electricity pricing strategies of university dormitories in hot summer and warm winter region: A case from Guangzhou University, South China. Energy Build. 2025, 335, 115525. [Google Scholar] [CrossRef]
- Peel, M.C.; Finlayson, B.L.; Mcmahon, T.A. Updated world map of the Köppen—Geiger climate classification. Hydrol. Earth Syst. Sci. 2007, 11, 259–263. [Google Scholar] [CrossRef]
- Meteorological Organization Country. Available online: https://www.cma.gov.cn/ (accessed on 31 July 2025).
- Meteorological Organization of Xi’an City. Available online: http://sn.cma.gov.cn/dsqx/xaqx/ (accessed on 31 July 2025).
- Alfano, F.R.D.; Dell’iSola, M.; Ficco, G.; Palella, B.I.; Riccio, G. Small globes and pocket heat stress meters for WBGT and PHS evaluations. A critical analysis under controlled conditions. Build. Environ. 2022, 226, 109781. [Google Scholar] [CrossRef]
- Bruse, M. ENVI-Met 4.4: Updated Model Overview, University of Bochum. 2021. Available online: http://www.envi-met.com (accessed on 31 July 2025).
- Jiang, Y.; Han, X.; Shi, T.; Song, D. Adaptive analysis of green space network planning for the cooling effect of residential blocks in summer: A case study in shanghai. Sustainability 2018, 10, 3189. [Google Scholar] [CrossRef]
- Zheng, B.; Bedra, K.B.; Zheng, J.; Wang, G. Combination of tree configuration with street configuration for thermal comfort optimization under extreme summer conditions in the urban center of Shantou City. Sustainability 2018, 10, 4192. [Google Scholar] [CrossRef]
- Bochenek, A.D.; Klemm, K. The impact of passive green technologies on the microclimate of historic urban structures: The case study of lodz. Atmosphere 2020, 11, 974. [Google Scholar] [CrossRef]
- Willmott, C.J. Some Comments on the Evaluation of Model Performance. Bull. Am. Meteorol. Soc. 1982, 63, 1309–1313. [Google Scholar] [CrossRef]
- ISO7726; Ergonomics of the Thermal Environment-Instruments for Measuring Physical Quantities. International Standards Organization: Geneva, Switzerland, 2003.
- Mi, J.; Hong, B.; Zhang, T.; Huang, B.; Niu, J. Outdoor thermal benchmarks and their application to climateresponsive designs of residential open spaces in a cold region of China. Build. Environ. 2020, 169, 106592. [Google Scholar] [CrossRef]
- GB 50352-2019; Uniform Standard for Design of Civil Buildings. National Standard of the People’s Republic of China: Beijing, China, 2019. Available online: https://baijiahao.baidu.com/s?id=1668633499138401533&wfr=spider&for=pc (accessed on 4 August 2023).
- Liu, L.; Xia, B.; Zhang, L. Outdoor thermal comfort of urban river landscape belt in China’s cold region: A case study of Xi’an. Urban Clim. 2023, 48, 101406. [Google Scholar] [CrossRef]
- Yin, P.; Ji, Y.; Xie, J.; Liu, J.; Hou, Q.; Zhao, S.; Jing, P. Residential wintry thermal comfort and adaptive behaviors in a cold climate in Beijing, China. Energy Build. 2022, 265, 111942. [Google Scholar] [CrossRef]



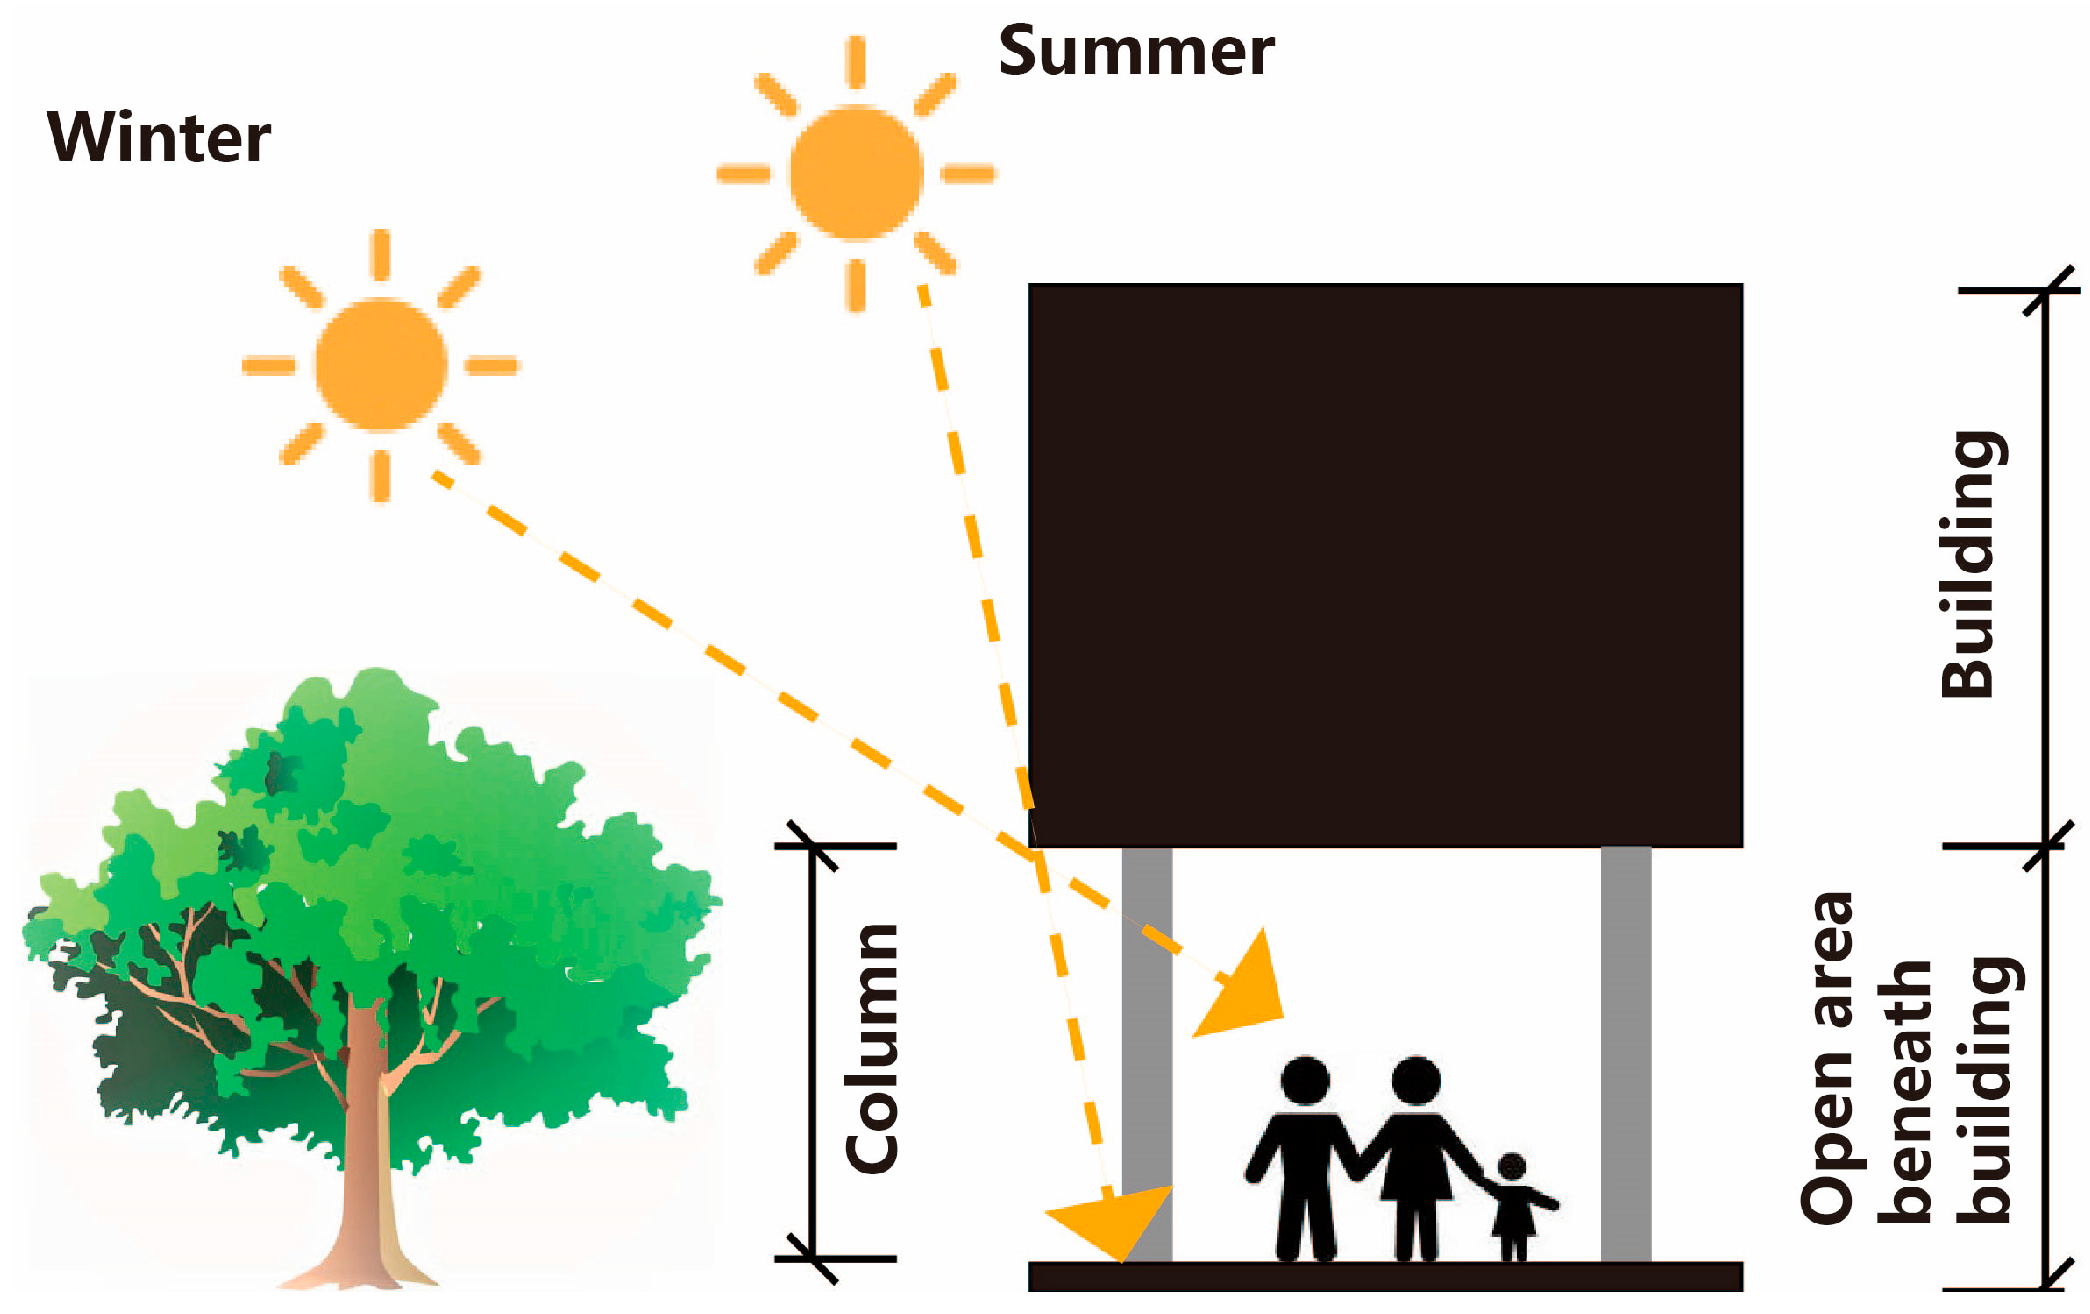

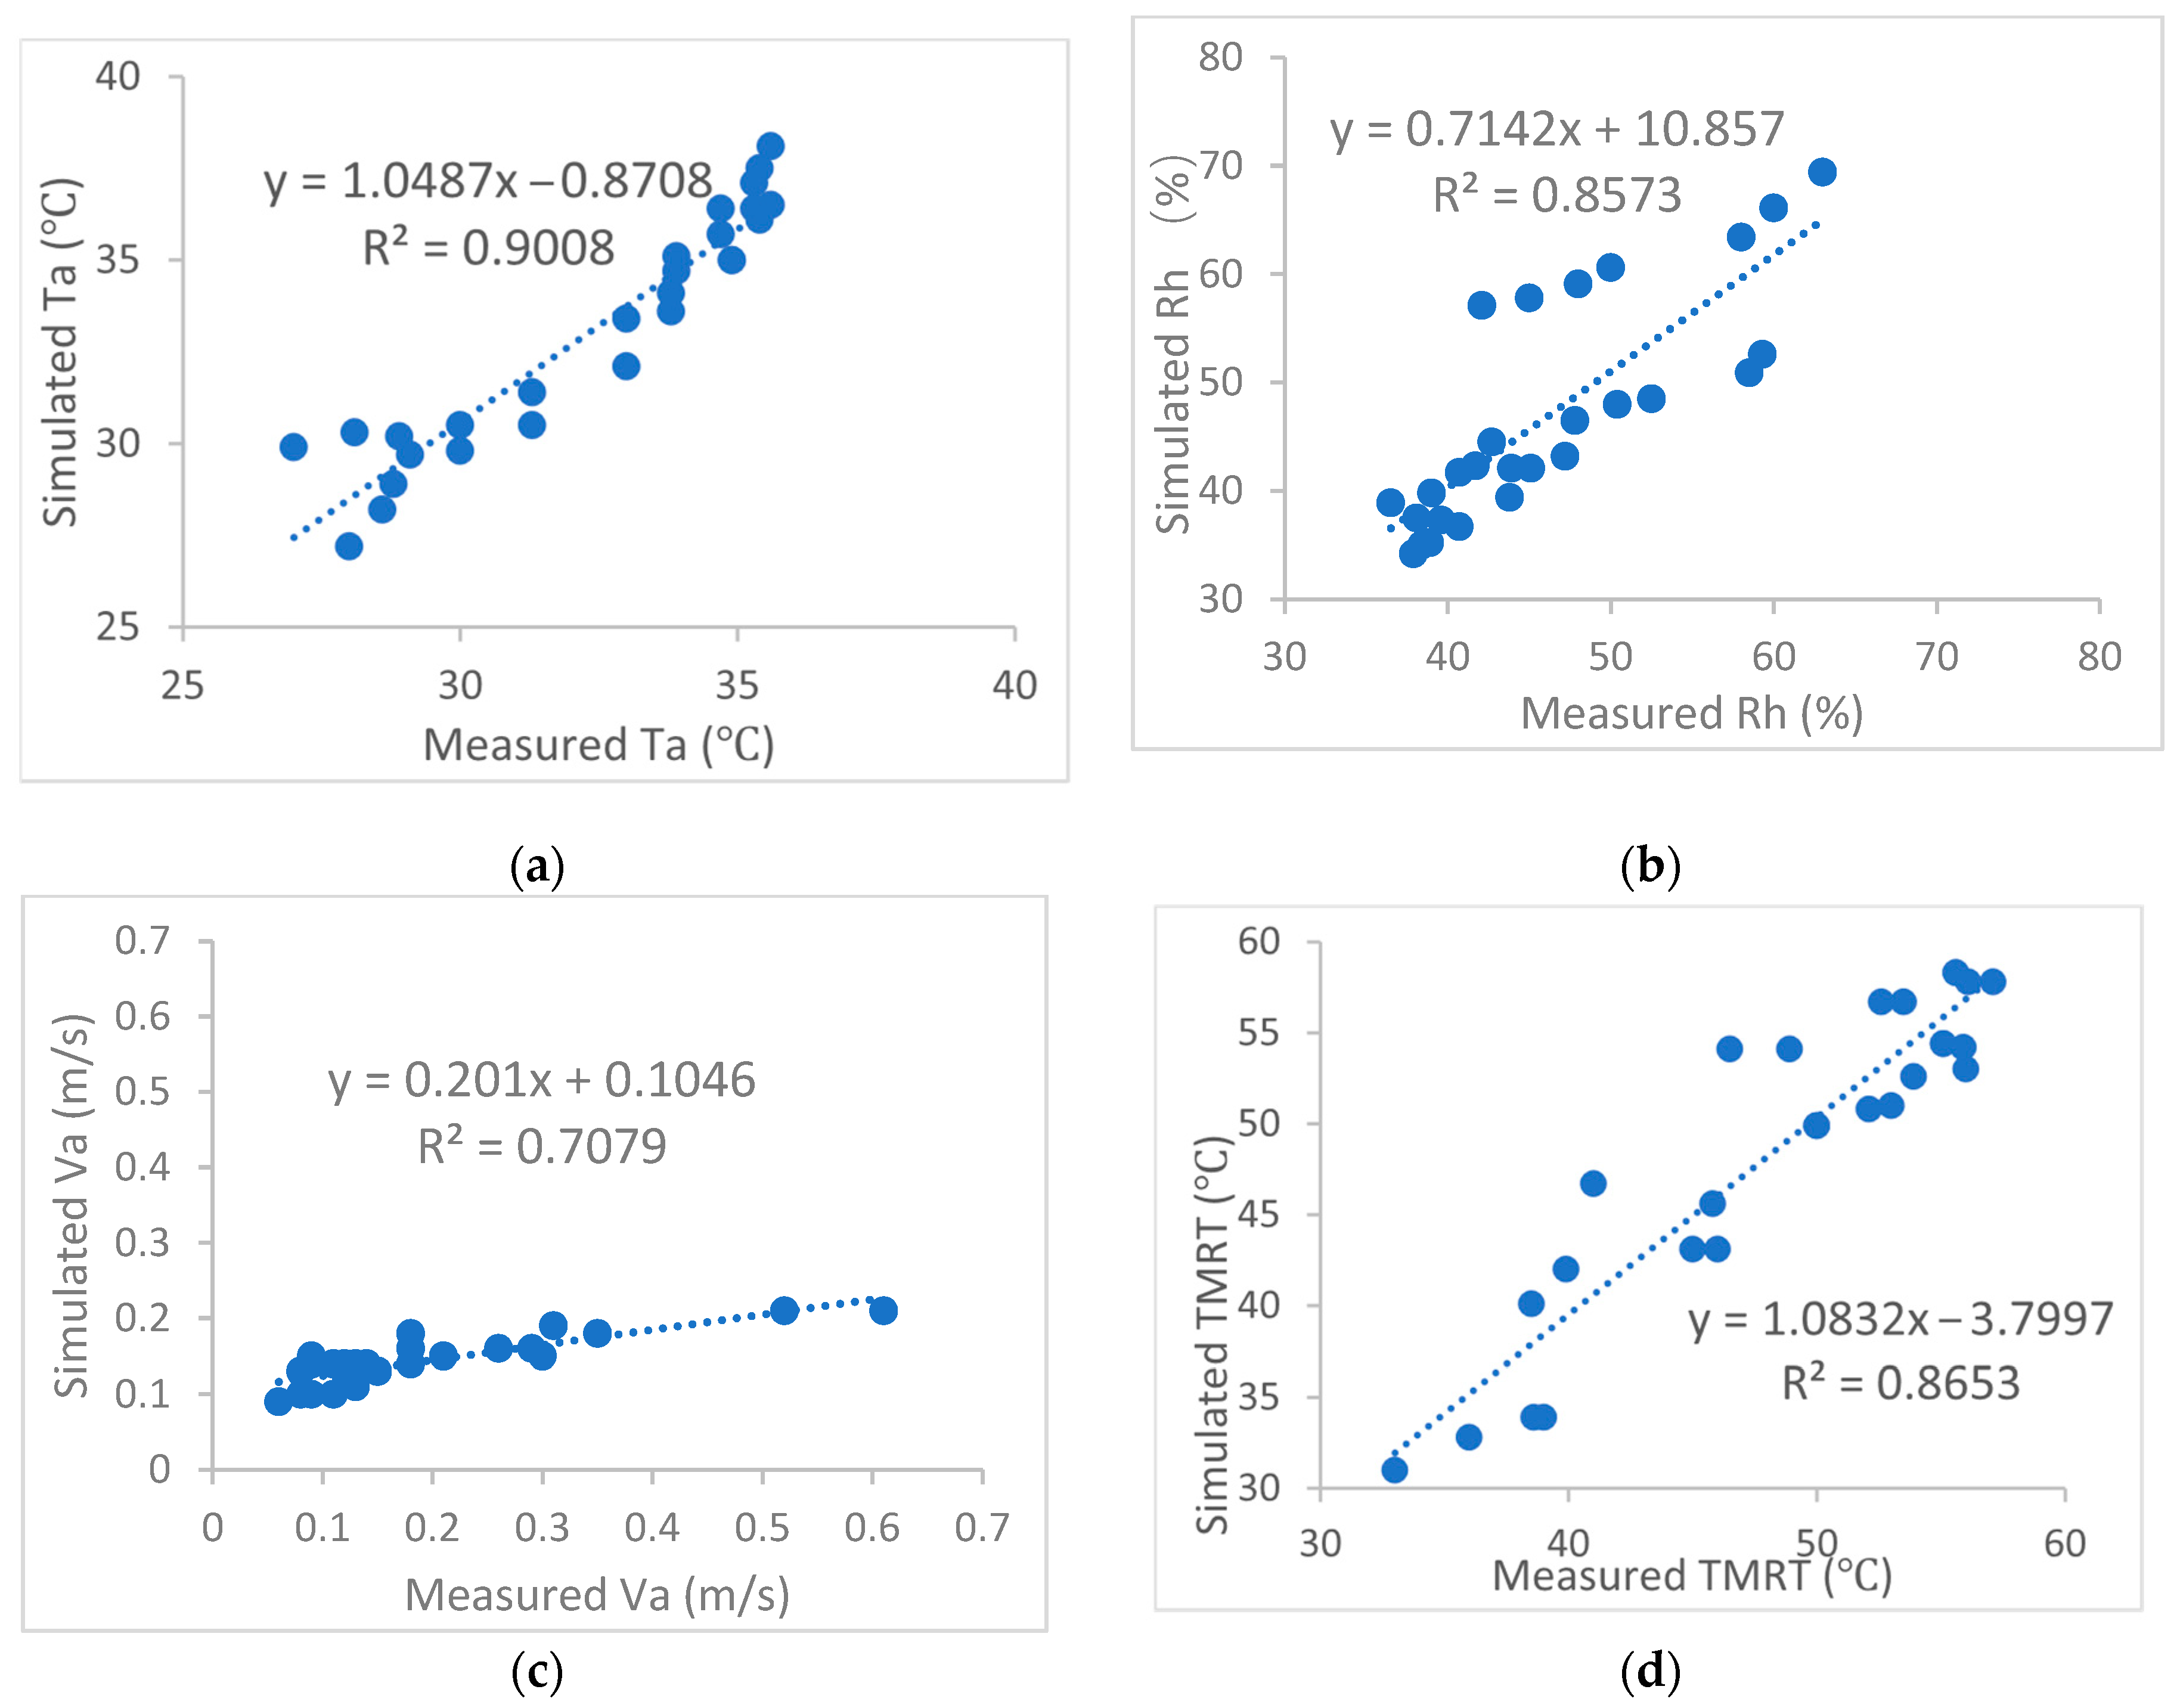
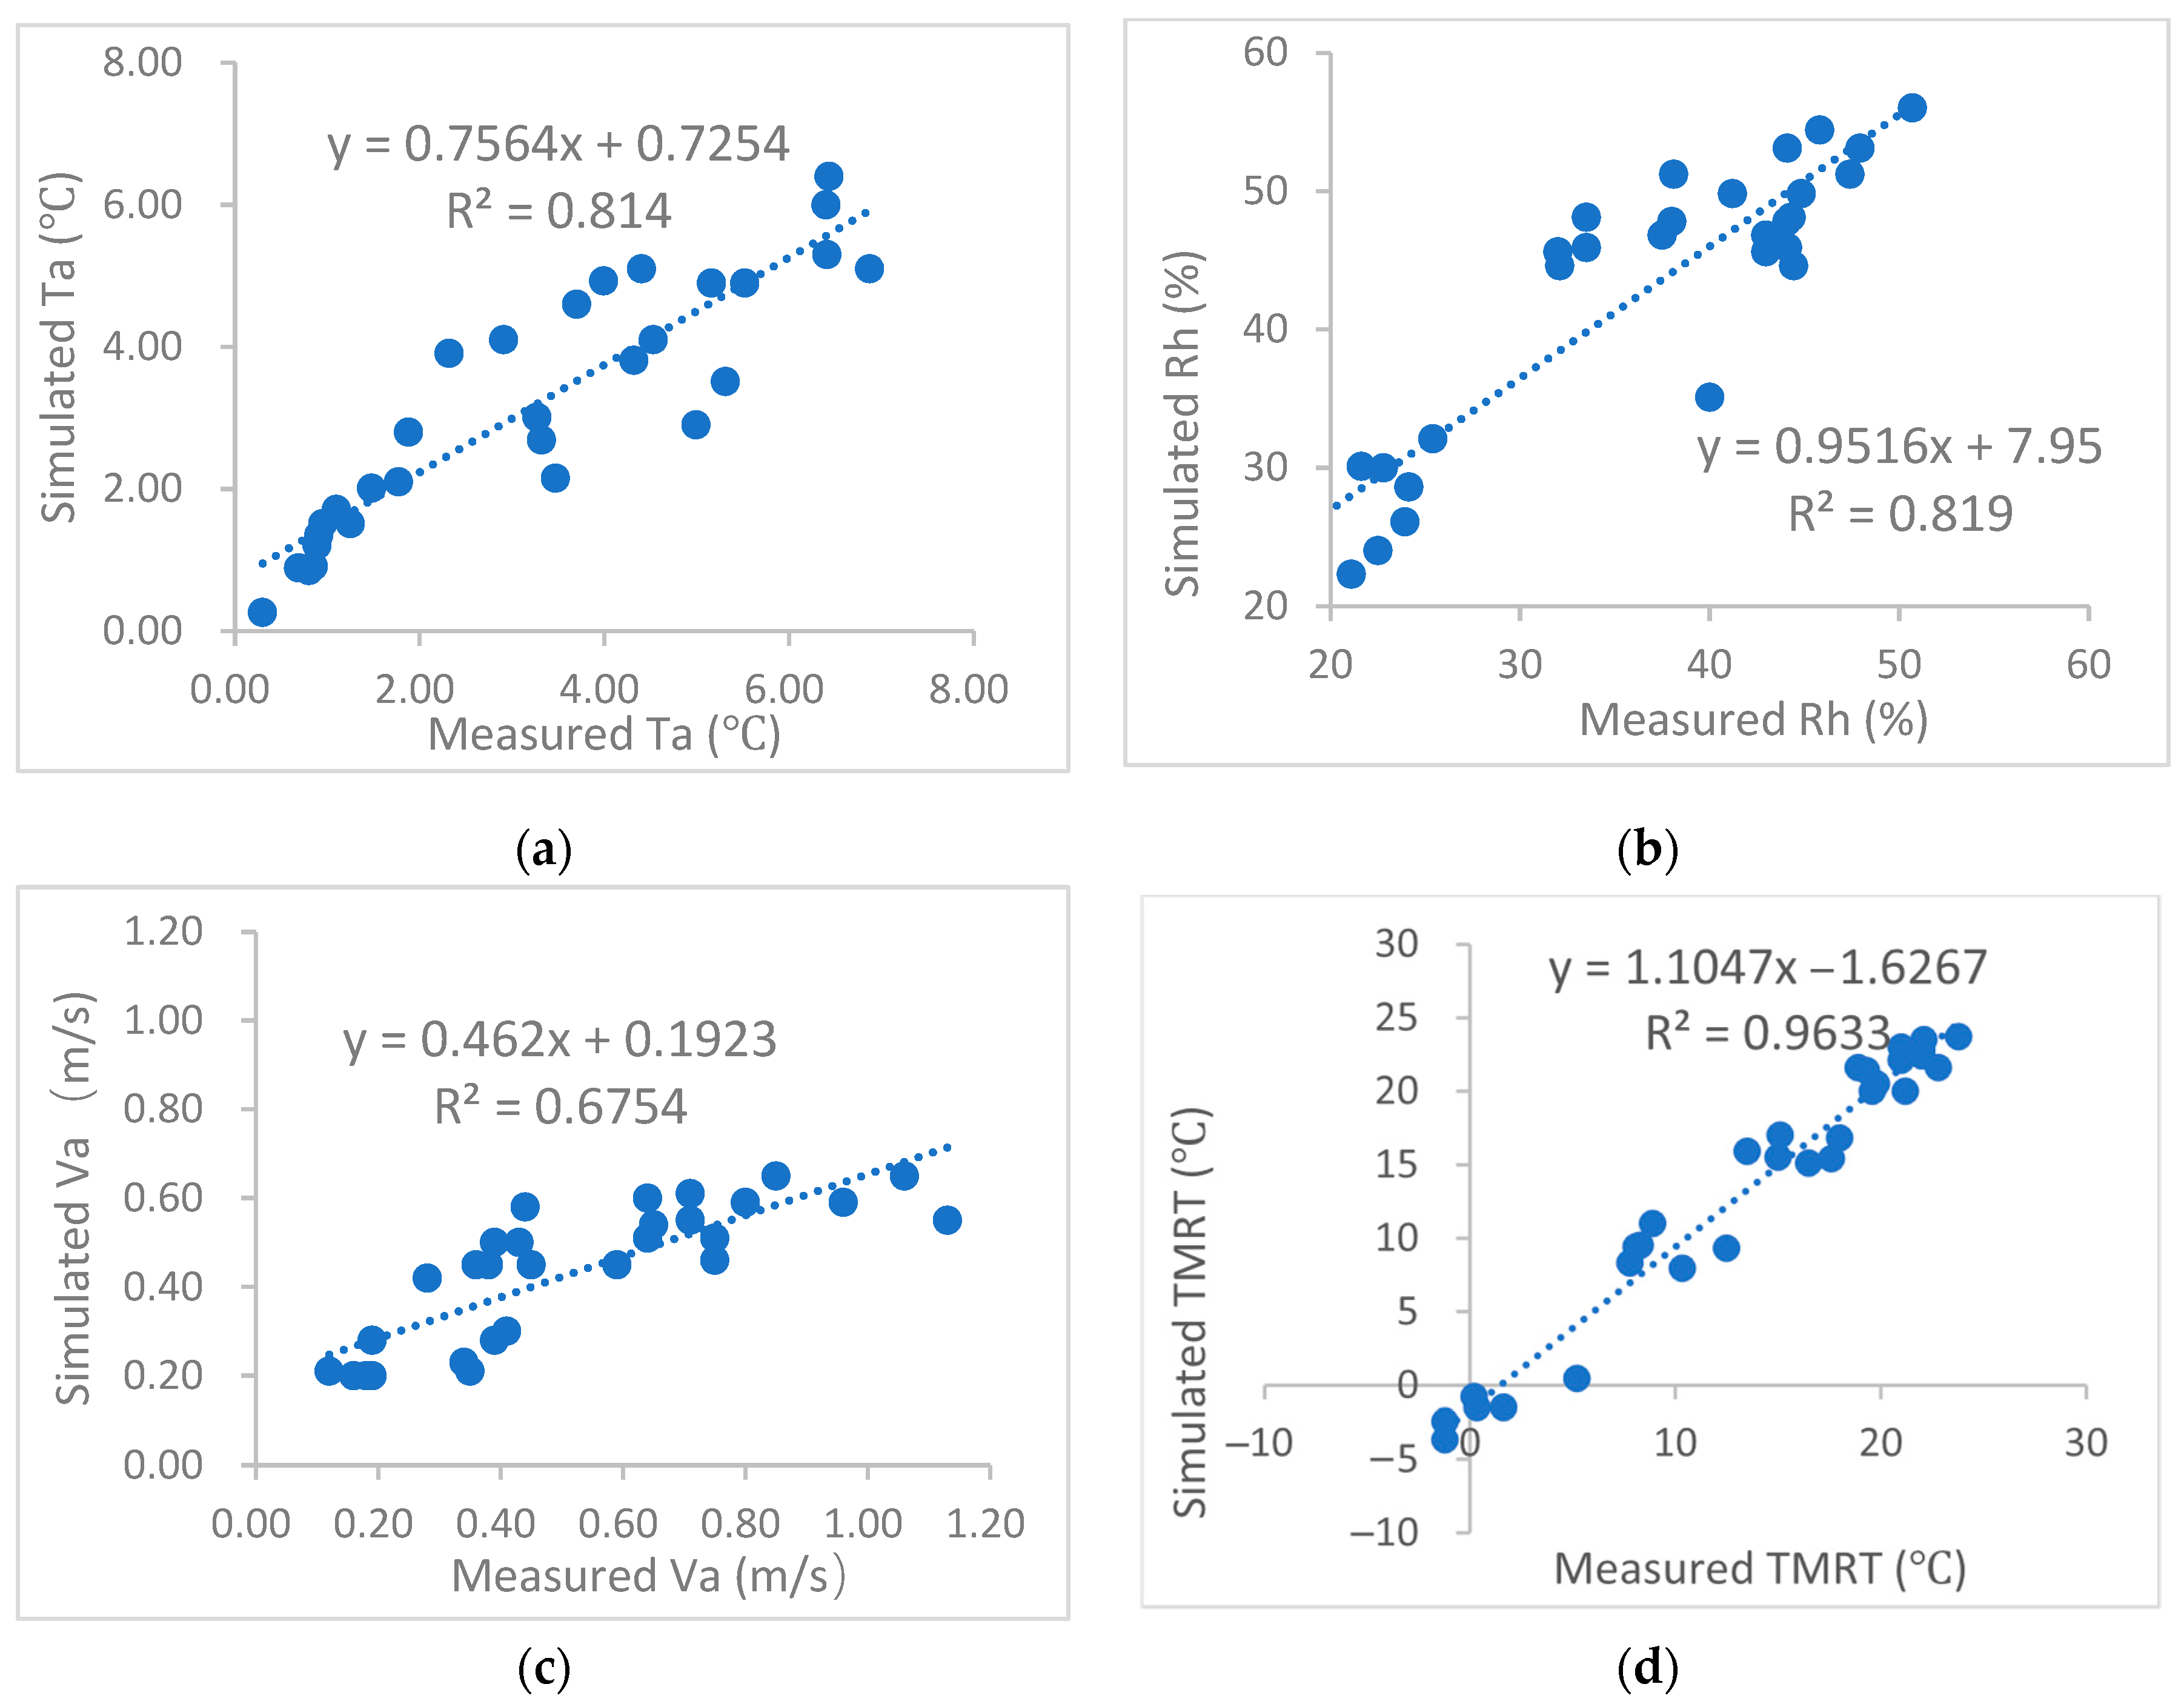
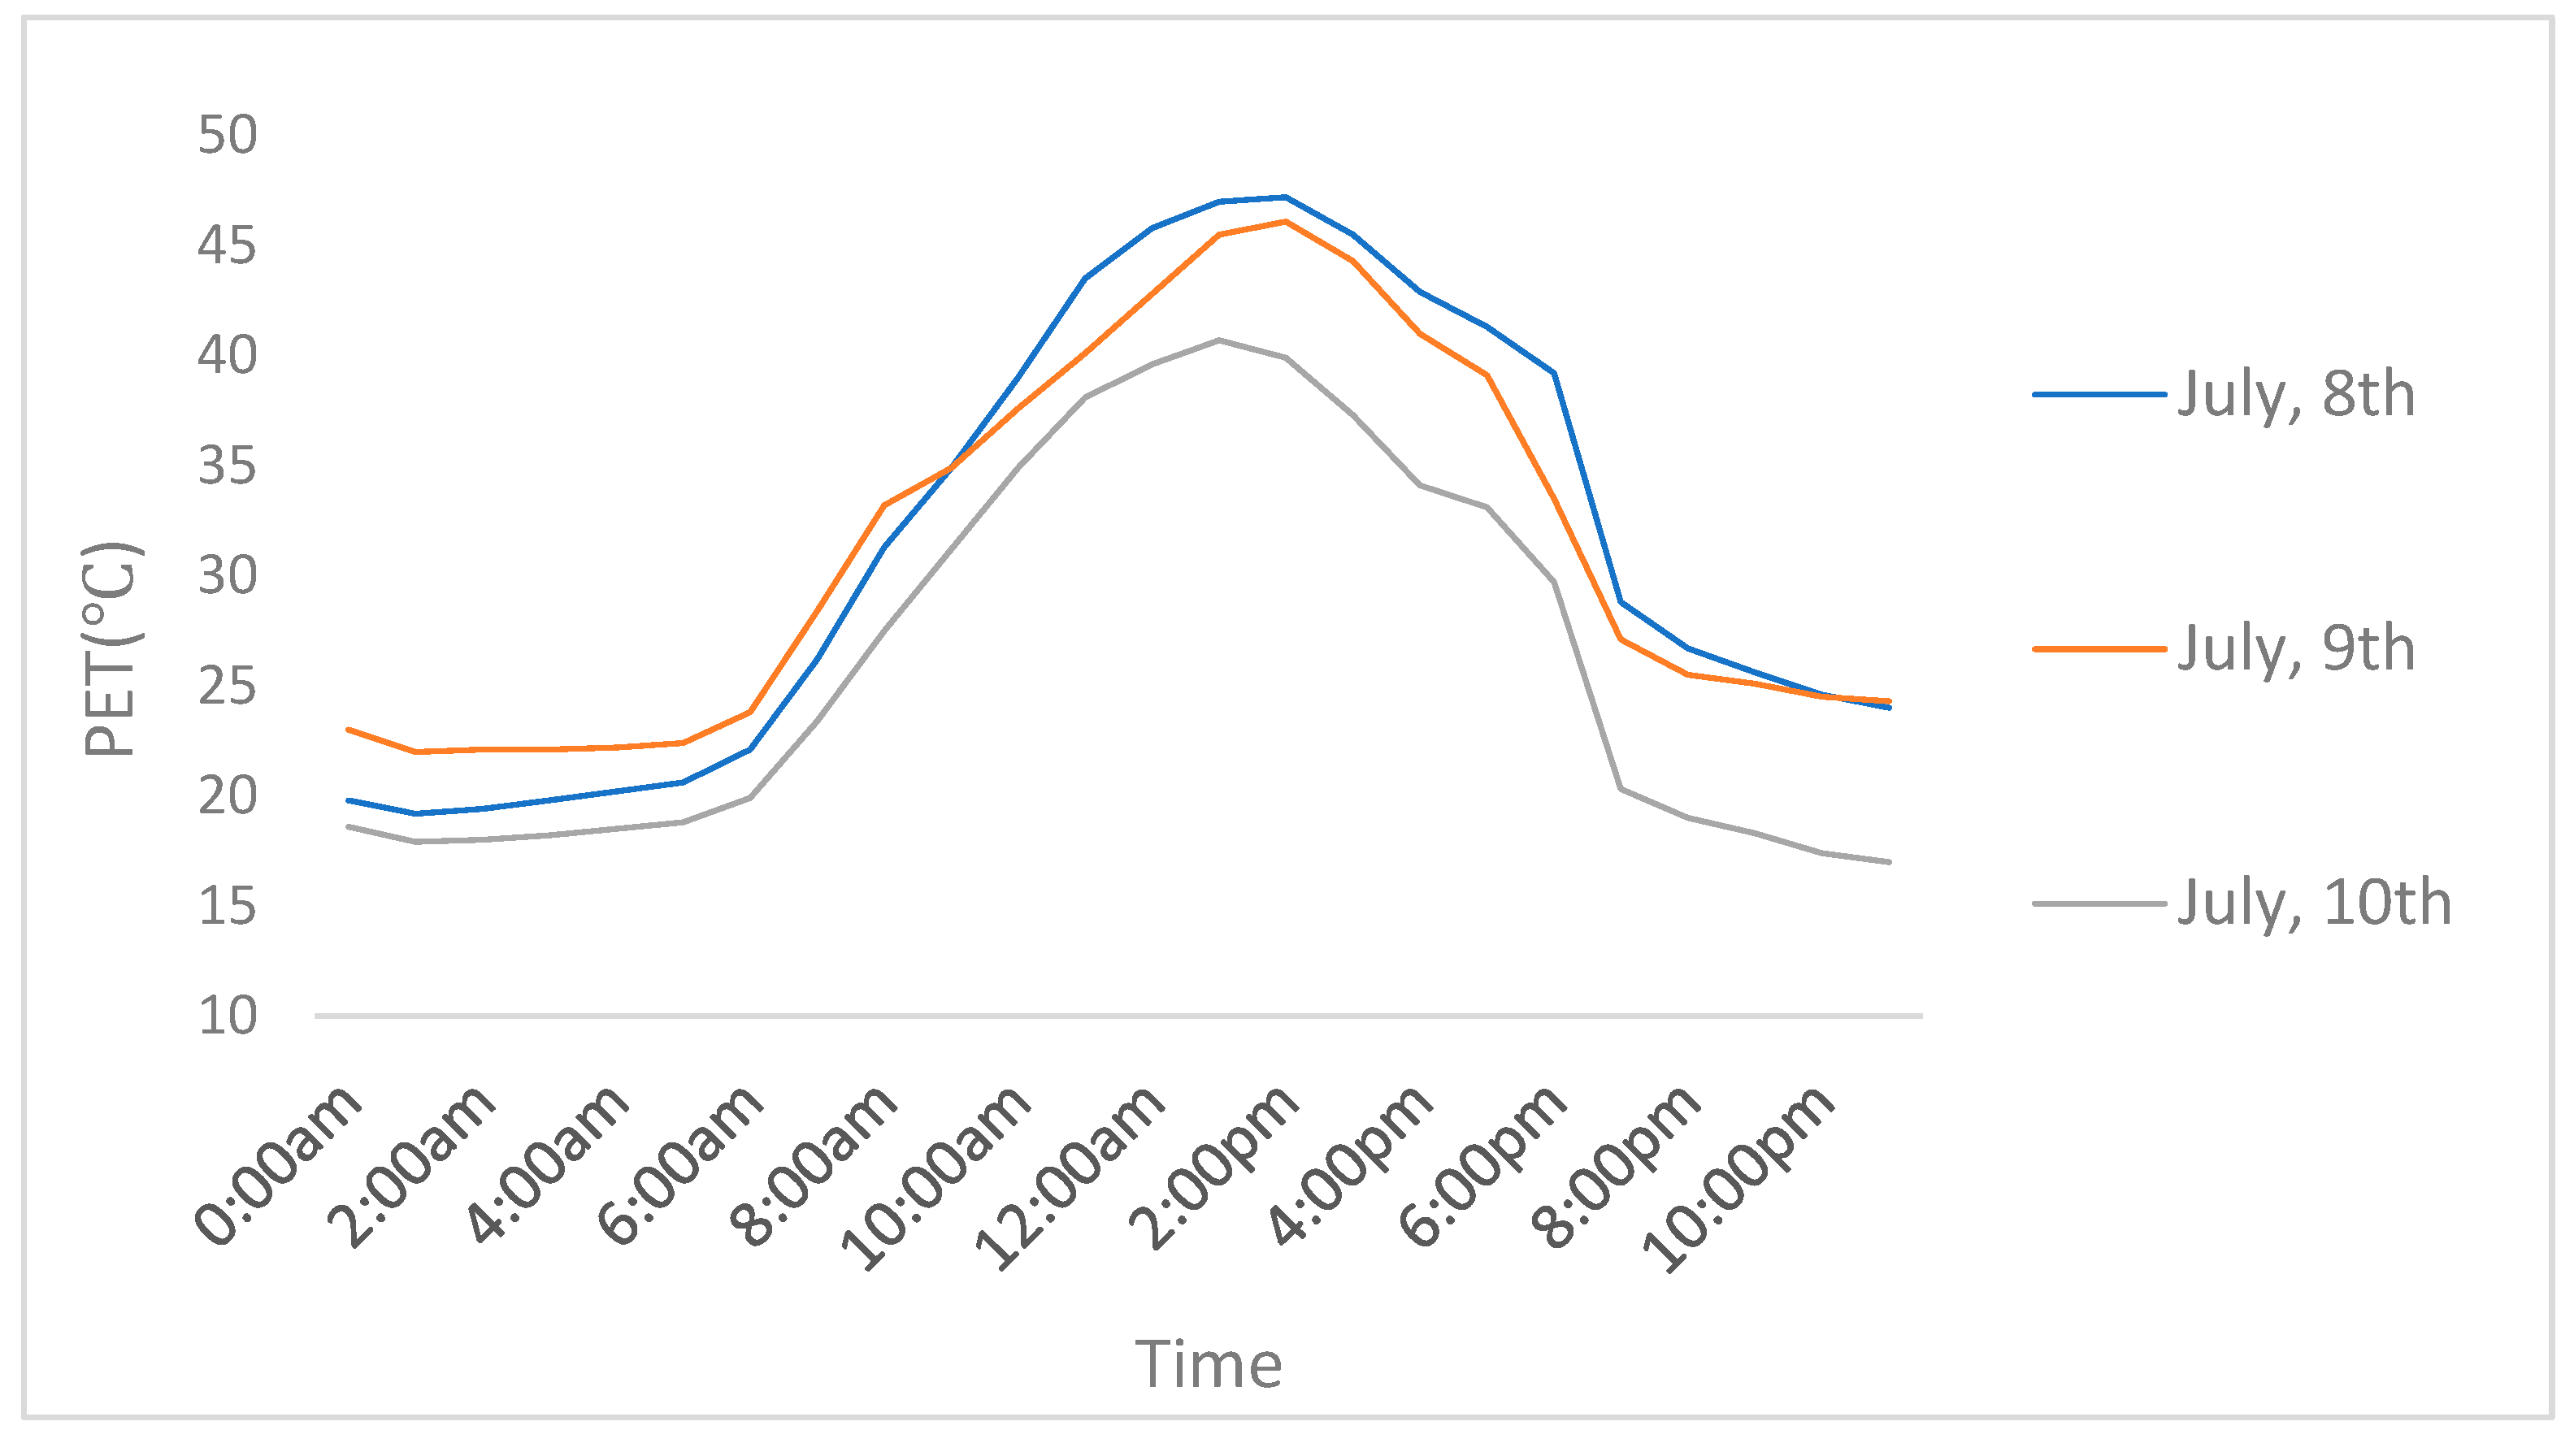

| Measured Date | Mini Temperature | Max Temperature |
|---|---|---|
| 8 July 2020 | 26 °C | 36 °C |
| 9 July 2020 | 25 °C | 37 °C |
| 10 July 2020 | 22 °C | 29 °C |
| 4 January 2021 | −2 °C | 3 °C |
| 5 January 2021 | −8 °C | 1 °C |
| 6 January 2021 | −9 °C | 0 °C |
| Instrument | Parameter | Accuracy | Range | Resolution |
|---|---|---|---|---|
| Kestrel | Wind velocity | ±3% of reading or ±0.1 m/s | 0.6–40 m/s | 0.1 m/s |
| HOBO | Air temperature Relative humidity | ±0.2 °C ±2.5% | −40 °C ± 70 °C 0–100% | 0.02 °C 0.05% |
| HD32.2 WBGT Index | Globe temperature | 0.1 °C | −10–100 °C | 0.1 °C |
| Parameters | Value | ||
|---|---|---|---|
| Material properties (elevated surface) | Tile | Roughness length | 0.01 |
| Albedo | 0.5 | ||
| Emissivity | 0.9 | ||
| Boundary conditions | Air temperature | Table 4, Table 5, Table 6, Table 7, Table 8 and Table 9 | |
| Relative humidity | |||
| Turbulent model | Kinetic energy (TKE) model | ||
| Case-1 (Summer) | |||
| Wind speed(m/s) | 1.5 m/s | ||
| Wind direction (°) | 145 | ||
| Grid in dx (m) | 1 | ||
| Grid in dy (m) | 1 | ||
| Grid in dz (m) | 0.5 | ||
| Number of x grid | 200 | ||
| Number of y grid | 200 | ||
| Number of z grid | 30 | ||
| Simulation | Starting day | 8–10 July 2020 | |
| Starting time | 0:00 a.m. | ||
| Total simulation time | 72 h | ||
| 8 July | 24 h | ||
| 9 July | 24 h | ||
| 10 July | 24 h | ||
| Boundary conditions | Case-2 (Winter) | ||
| Wind speed (m/s) | 1.3 m/s | ||
| Wind direction (°) | 45 | ||
| Grid in dx (m) | 1 | ||
| Grid in dy (m) | 1 | ||
| Grid in dz (m) | 0.5 | ||
| Number of x grid | 200 | ||
| Number of y grid | 200 | ||
| Number of z grid | 30 | ||
| Simulation | Starting day | 4–6 January 2021 | |
| Starting time | 0:00 a.m. | ||
| Total simulation time | 72 h | ||
| 4 January | 24 h | ||
| 5 January | 24 h | ||
| 6 January | 24 h | ||
| Time | Air Temperature (°C) | Relative Humidity (%) | Time | Air Temperature (°C) | Relative Humidity (%) |
|---|---|---|---|---|---|
| 0:00 a.m. | 24.6 | 67.3 | 12:00 a.m. | 35.4 | 38.8 |
| 1:00 a.m. | 24 | 71 | 1:00 p.m. | 36 | 37.5 |
| 2:00 a.m. | 24.5 | 68.5 | 2:00 p.m. | 36.3 | 36.1 |
| 3:00 a.m. | 25.6 | 63.9 | 3:00 p.m. | 36.9 | 34.5 |
| 4:00 a.m. | 26.8 | 62 | 4:00 p.m. | 36.1 | 34.9 |
| 5:00 a.m. | 28.9 | 59.8 | 5:00 p.m. | 35.2 | 35.9 |
| 6:00 a.m. | 29.1 | 58.7 | 6:00 p.m. | 34.2 | 38.8 |
| 7:00 a.m. | 30.2 | 58.1 | 7:00 p.m. | 32.5 | 45.6 |
| 8:00 a.m. | 31 | 54.8 | 8:00 p.m. | 29.8 | 48.3 |
| 9:00 a.m. | 31.6 | 54.5 | 9:00 p.m. | 27 | 52.8 |
| 10:00 a.m. | 33.4 | 44.9 | 10:00 p.m. | 25.9 | 61.8 |
| 11:00 a.m. | 34.6 | 42.3 | 11:00 p.m. | 25.1 | 62.5 |
| Time | Air Temperature (°C) | Relative Humidity (%) | Time | Air Temperature (°C) | Relative Humidity (%) |
|---|---|---|---|---|---|
| 0:00 a.m. | 27 | 65.1 | 12:00 a.m. | 34.8 | 39.8 |
| 1:00 a.m. | 26.3 | 71.1 | 1:00 p.m. | 35.8 | 37.6 |
| 2:00 a.m. | 26.8 | 68.3 | 2:00 p.m. | 36.5 | 36 |
| 3:00 a.m. | 27.6 | 66.5 | 3:00 p.m. | 36.9 | 35.5 |
| 4:00 a.m. | 27.9 | 62.1 | 4:00 p.m. | 36.6 | 36.2 |
| 5:00 a.m. | 28.3 | 59.5 | 5:00 p.m. | 36.1 | 38.1 |
| 6:00 a.m. | 28.9 | 58.1 | 6:00 p.m. | 35.3 | 39.1 |
| 7:00 a.m. | 29.4 | 56.3 | 7:00 p.m. | 34.1 | 40.5 |
| 8:00 a.m. | 29.9 | 55.1 | 8:00 p.m. | 32.3 | 42.1 |
| 9:00 a.m. | 30.6 | 53.2 | 9:00 p.m. | 30.8 | 48.6 |
| 10:00 a.m. | 33.3 | 44.9 | 10:00 p.m. | 28.9 | 55.1 |
| 11:00 a.m. | 33.8 | 40.9 | 11:00 p.m. | 27.8 | 61.2 |
| Time | Air Temperature (°C) | Relative Humidity (%) | Time | Air Temperature (°C) | Relative Humidity (%) |
|---|---|---|---|---|---|
| 0:00 a.m. | 24.1 | 72.2 | 12:00 a.m. | 29.9 | 61.2 |
| 1:00 a.m. | 23.2 | 75.1 | 1:00 p.m. | 30.1 | 58.9 |
| 2:00 a.m. | 24.2 | 73.1 | 2:00 p.m. | 31.2 | 58 |
| 3:00 a.m. | 24.9 | 71.5 | 3:00 p.m. | 32 | 57 |
| 4:00 a.m. | 25.6 | 69.9 | 4:00 p.m. | 31 | 57.9 |
| 5:00 a.m. | 26.9 | 68.1 | 5:00 p.m. | 30.5 | 58.9 |
| 6:00 a.m. | 27.1 | 67 | 6:00 p.m. | 30 | 59.3 |
| 7:00 a.m. | 27.8 | 66.1 | 7:00 p.m. | 28.5 | 60.2 |
| 8:00 a.m. | 28.3 | 65.1 | 8:00 p.m. | 27.1 | 63.1 |
| 9:00 a.m. | 28.6 | 64.8 | 9:00 p.m. | 26.5 | 65.6 |
| 10:00 a.m. | 28.9 | 63.9 | 10:00 p.m. | 25.4 | 67.8 |
| 11:00 a.m. | 29 | 62.7 | 11:00 p.m. | 24.8 | 69.1 |
| Time | Air Temperature (°C) | Relative Humidity (%) | Time | Air Temperature (°C) | Relative Humidity (%) |
|---|---|---|---|---|---|
| 0:00 a.m. | −2.1 | 51.2 | 12:00 a.m. | 2.91 | 44.08 |
| 1:00 a.m. | −2.5 | 53.1 | 1:00 p.m. | 3.70 | 42.96 |
| 2:00 a.m. | −1.9 | 50.8 | 2:00 p.m. | 3.99 | 44.12 |
| 3:00 a.m. | −1.5 | 49.7 | 3:00 p.m. | 4.40 | 44.43 |
| 4:00 a.m. | −1.1 | 49.6 | 4:00 p.m. | 5.16 | 42.96 |
| 5:00 a.m. | −0.63 | 49.1 | 5:00 p.m. | 4.32 | 44.31 |
| 6:00 a.m. | 0.16 | 48.8 | 6:00 p.m. | 3.27 | 47.41 |
| 7:00 a.m. | 0.95 | 48.5 | 7:00 p.m. | 2.51 | 48.1 |
| 8:00 a.m. | 1.23 | 48.4 | 8:00 p.m. | 1.68 | 48.93 |
| 9:00 a.m. | 1.77 | 47.99 | 9:00 p.m. | 0.91 | 49.21 |
| 10:00 a.m. | 1.88 | 47.94 | 10:00 p.m. | −0.85 | 49.6 |
| 11:00 a.m. | 2.32 | 44.83 | 11:00 p.m. | −1.63 | 49.9 |
| Time | Air Temperature (°C) | Relative Humidity (%) | Time | Air Temperature (°C) | Relative Humidity (%) |
|---|---|---|---|---|---|
| 0:00 a.m. | −3.9 | 39.5 | 12:00 a.m. | 5.52 | 26.92 |
| 1:00 a.m. | −4.5 | 39.9 | 1:00 p.m. | 5.52 | 26.47 |
| 2:00 a.m. | −3.5 | 39.1 | 2:00 p.m. | 6.41 | 26.36 |
| 3:00 a.m. | −2.6 | 38.8 | 3:00 p.m. | 6.40 | 26.89 |
| 4:00 a.m. | −1.7 | 38.5 | 4:00 p.m. | 6.43 | 26.49 |
| 5:00 a.m. | −0.86 | 38 | 5:00 p.m. | 6.87 | 29.36 |
| 6:00 a.m. | 0.35 | 36.1 | 6:00 p.m. | 5.31 | 31.36 |
| 7:00 a.m. | 1.15 | 33.5 | 7:00 p.m. | 3.85 | 33.2 |
| 8:00 a.m. | 2.35 | 31.5 | 8:00 p.m. | 2.56 | 34.8 |
| 9:00 a.m. | 3.47 | 30.17 | 9:00 p.m. | 1.68 | 36.12 |
| 10:00 a.m. | 3.32 | 29.76 | 10:00 p.m. | 0.98 | 36.85 |
| 11:00 a.m. | 4.53 | 27.88 | 11:00 p.m. | −1.12 | 38.5 |
| Time | Air Temperature (°C) | Relative Humidity (%) | Time | Air Temperature (°C) | Relative Humidity (%) |
|---|---|---|---|---|---|
| 0:00 a.m. | −8.3 | 32.1 | 12:00 a.m. | 0.91 | 24.1 |
| 1:00 a.m. | −9.3 | 33.5 | 1:00 p.m. | 0.95 | 23.9 |
| 2:00 a.m. | −7.1 | 30.4 | 2:00 p.m. | 1.10 | 23.1 |
| 3:00 a.m. | −5.1 | 29.7 | 3:00 p.m. | 1.48 | 22.8 |
| 4:00 a.m. | −4.2 | 29 | 4:00 p.m. | 1.25 | 21.5 |
| 5:00 a.m. | −3.5 | 28.15 | 5:00 p.m. | 0.69 | 21.4 |
| 6:00 a.m. | −2.4 | 25.3 | 6:00 p.m. | 0.30 | 21.63 |
| 7:00 a.m. | −0.8 | 25.1 | 7:00 p.m. | −1.36 | 26.5 |
| 8:00 a.m. | 0.1 | 24.9 | 8:00 p.m. | −3.51 | 27.85 |
| 9:00 a.m. | 0.80 | 24.34 | 9:00 p.m. | −4.15 | 28.91 |
| 10:00 a.m. | 0.85 | 25.40 | 10:00 p.m. | −5.89 | 29.9 |
| 11:00 a.m. | 0.80 | 22.79 | 11:00 p.m. | −7.1 | 30.5 |
| Parameter | RMSE | RMSEu | RMSEs |
|---|---|---|---|
| Ta | 1.22 °C | 1.98 °C | 1.03 °C |
| Rh | 6.86% | 7.02% | 4.85% |
| Va | 0.11 m/s | 0.08 m/s | 0.065 m/s |
| TMRT | 3.12 °C | 3.26 °C | 1.89 °C |
| Parameter | RMSE | RMSEu | RMSEs |
|---|---|---|---|
| Ta | 0.88 °C | 1.21 °C | 0.69 °C |
| Rh | 7.65% | 8.3% | 6.59% |
| Va | 0.19 m/s | 0.13 m/s | 0.11 m/s |
| TMRT | 1.91 °C | 2.09 °C | 1.96 °C |
| Thermal Stress | Thermal Sensation | PET (°C) |
|---|---|---|
| Extreme cold stress | Very Cold | <−4 |
| Strong cold stress | Cold | −4~8 |
| Moderate cold stress | Cool | 8~16 |
| Slightly cold stress | Slightly Cool | 16~22 |
| No thermal stress | Neutral | 22~28 |
| Slight heat stress | Slightly Warm | 28~32 |
| Moderate heat stress | Warm | 32~38 |
| Strong heat stress | Hot | 38~44 |
| Extreme heat stress | Very Hot | >44 |
| Column Width | PET |
|---|---|
| 0.5 m | 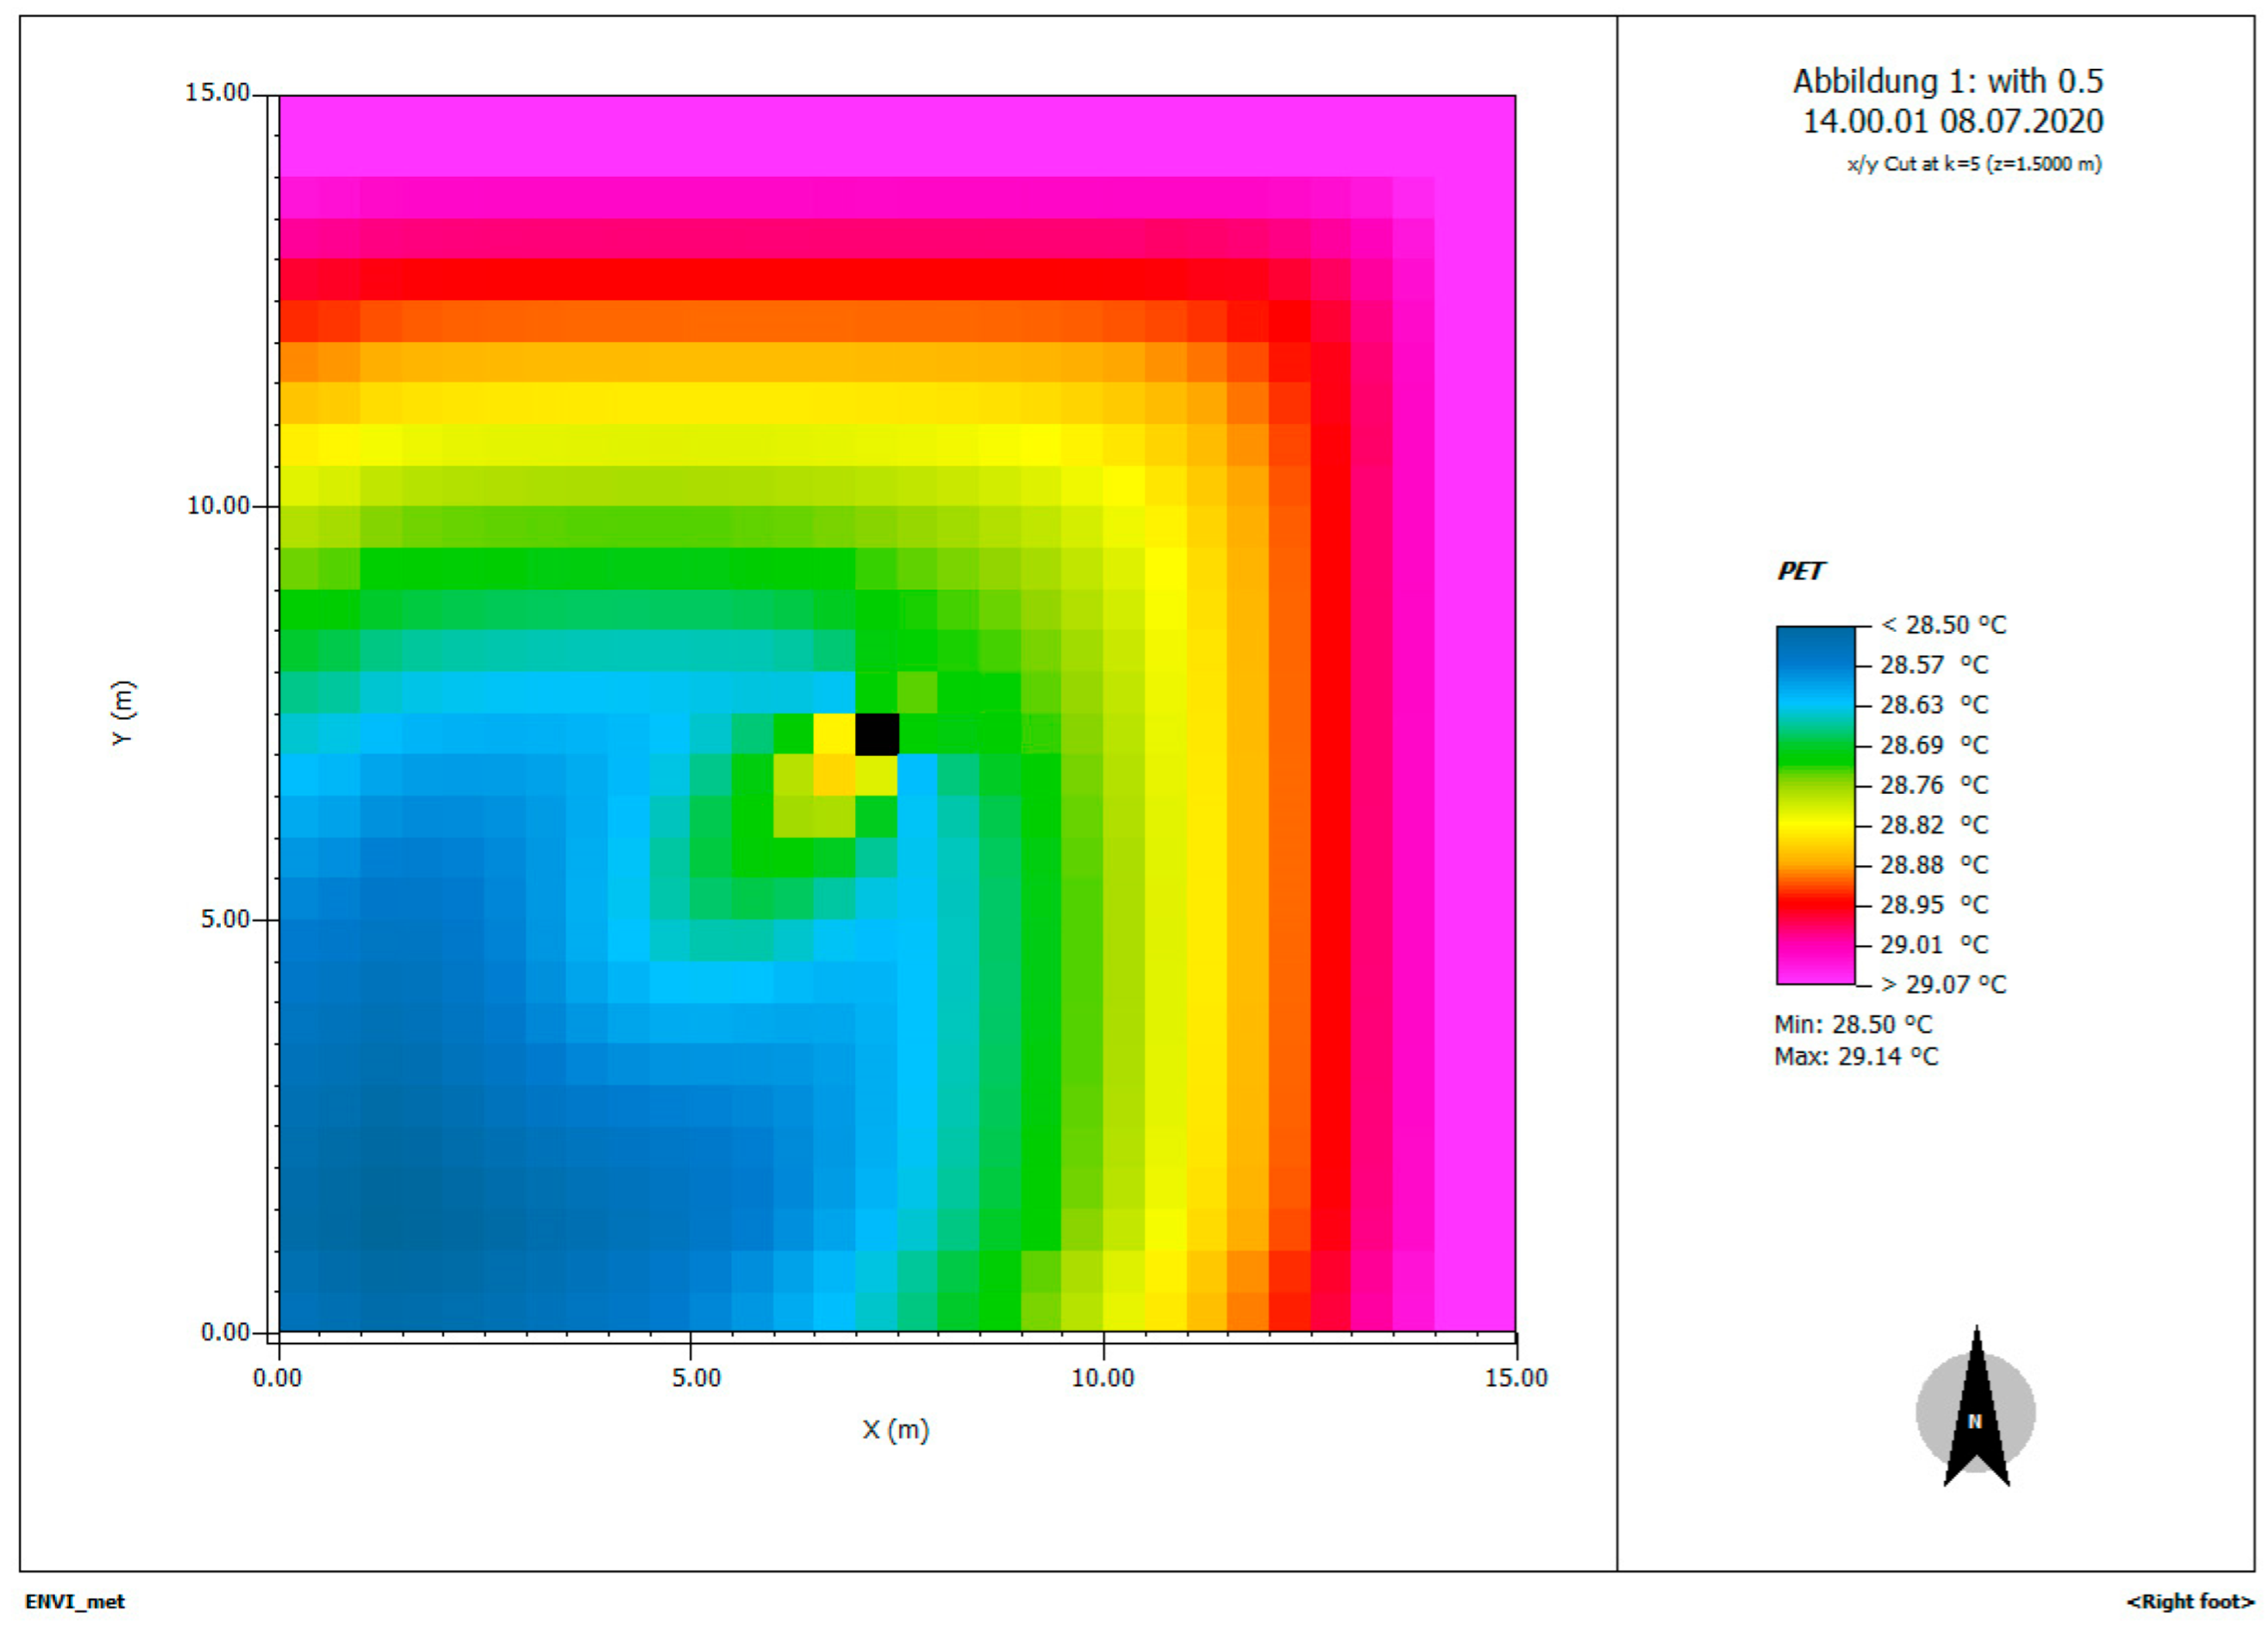 |
| 1 m |  |
| 1.5 m |  |
| 2 m |  |
| 2.5 m |  |
| Base Case | Case-1 | Case-2 |
|---|---|---|
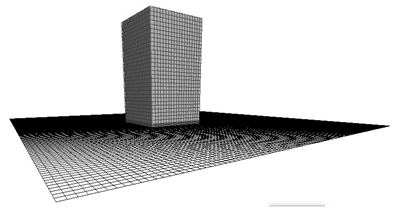 | 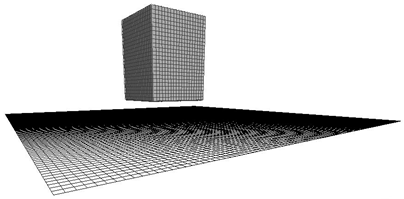 | 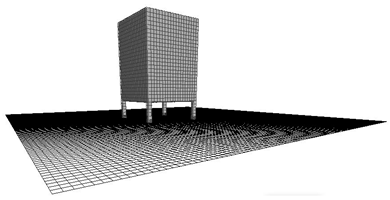 |
| Case | PET |
|---|---|
| Case-1 | 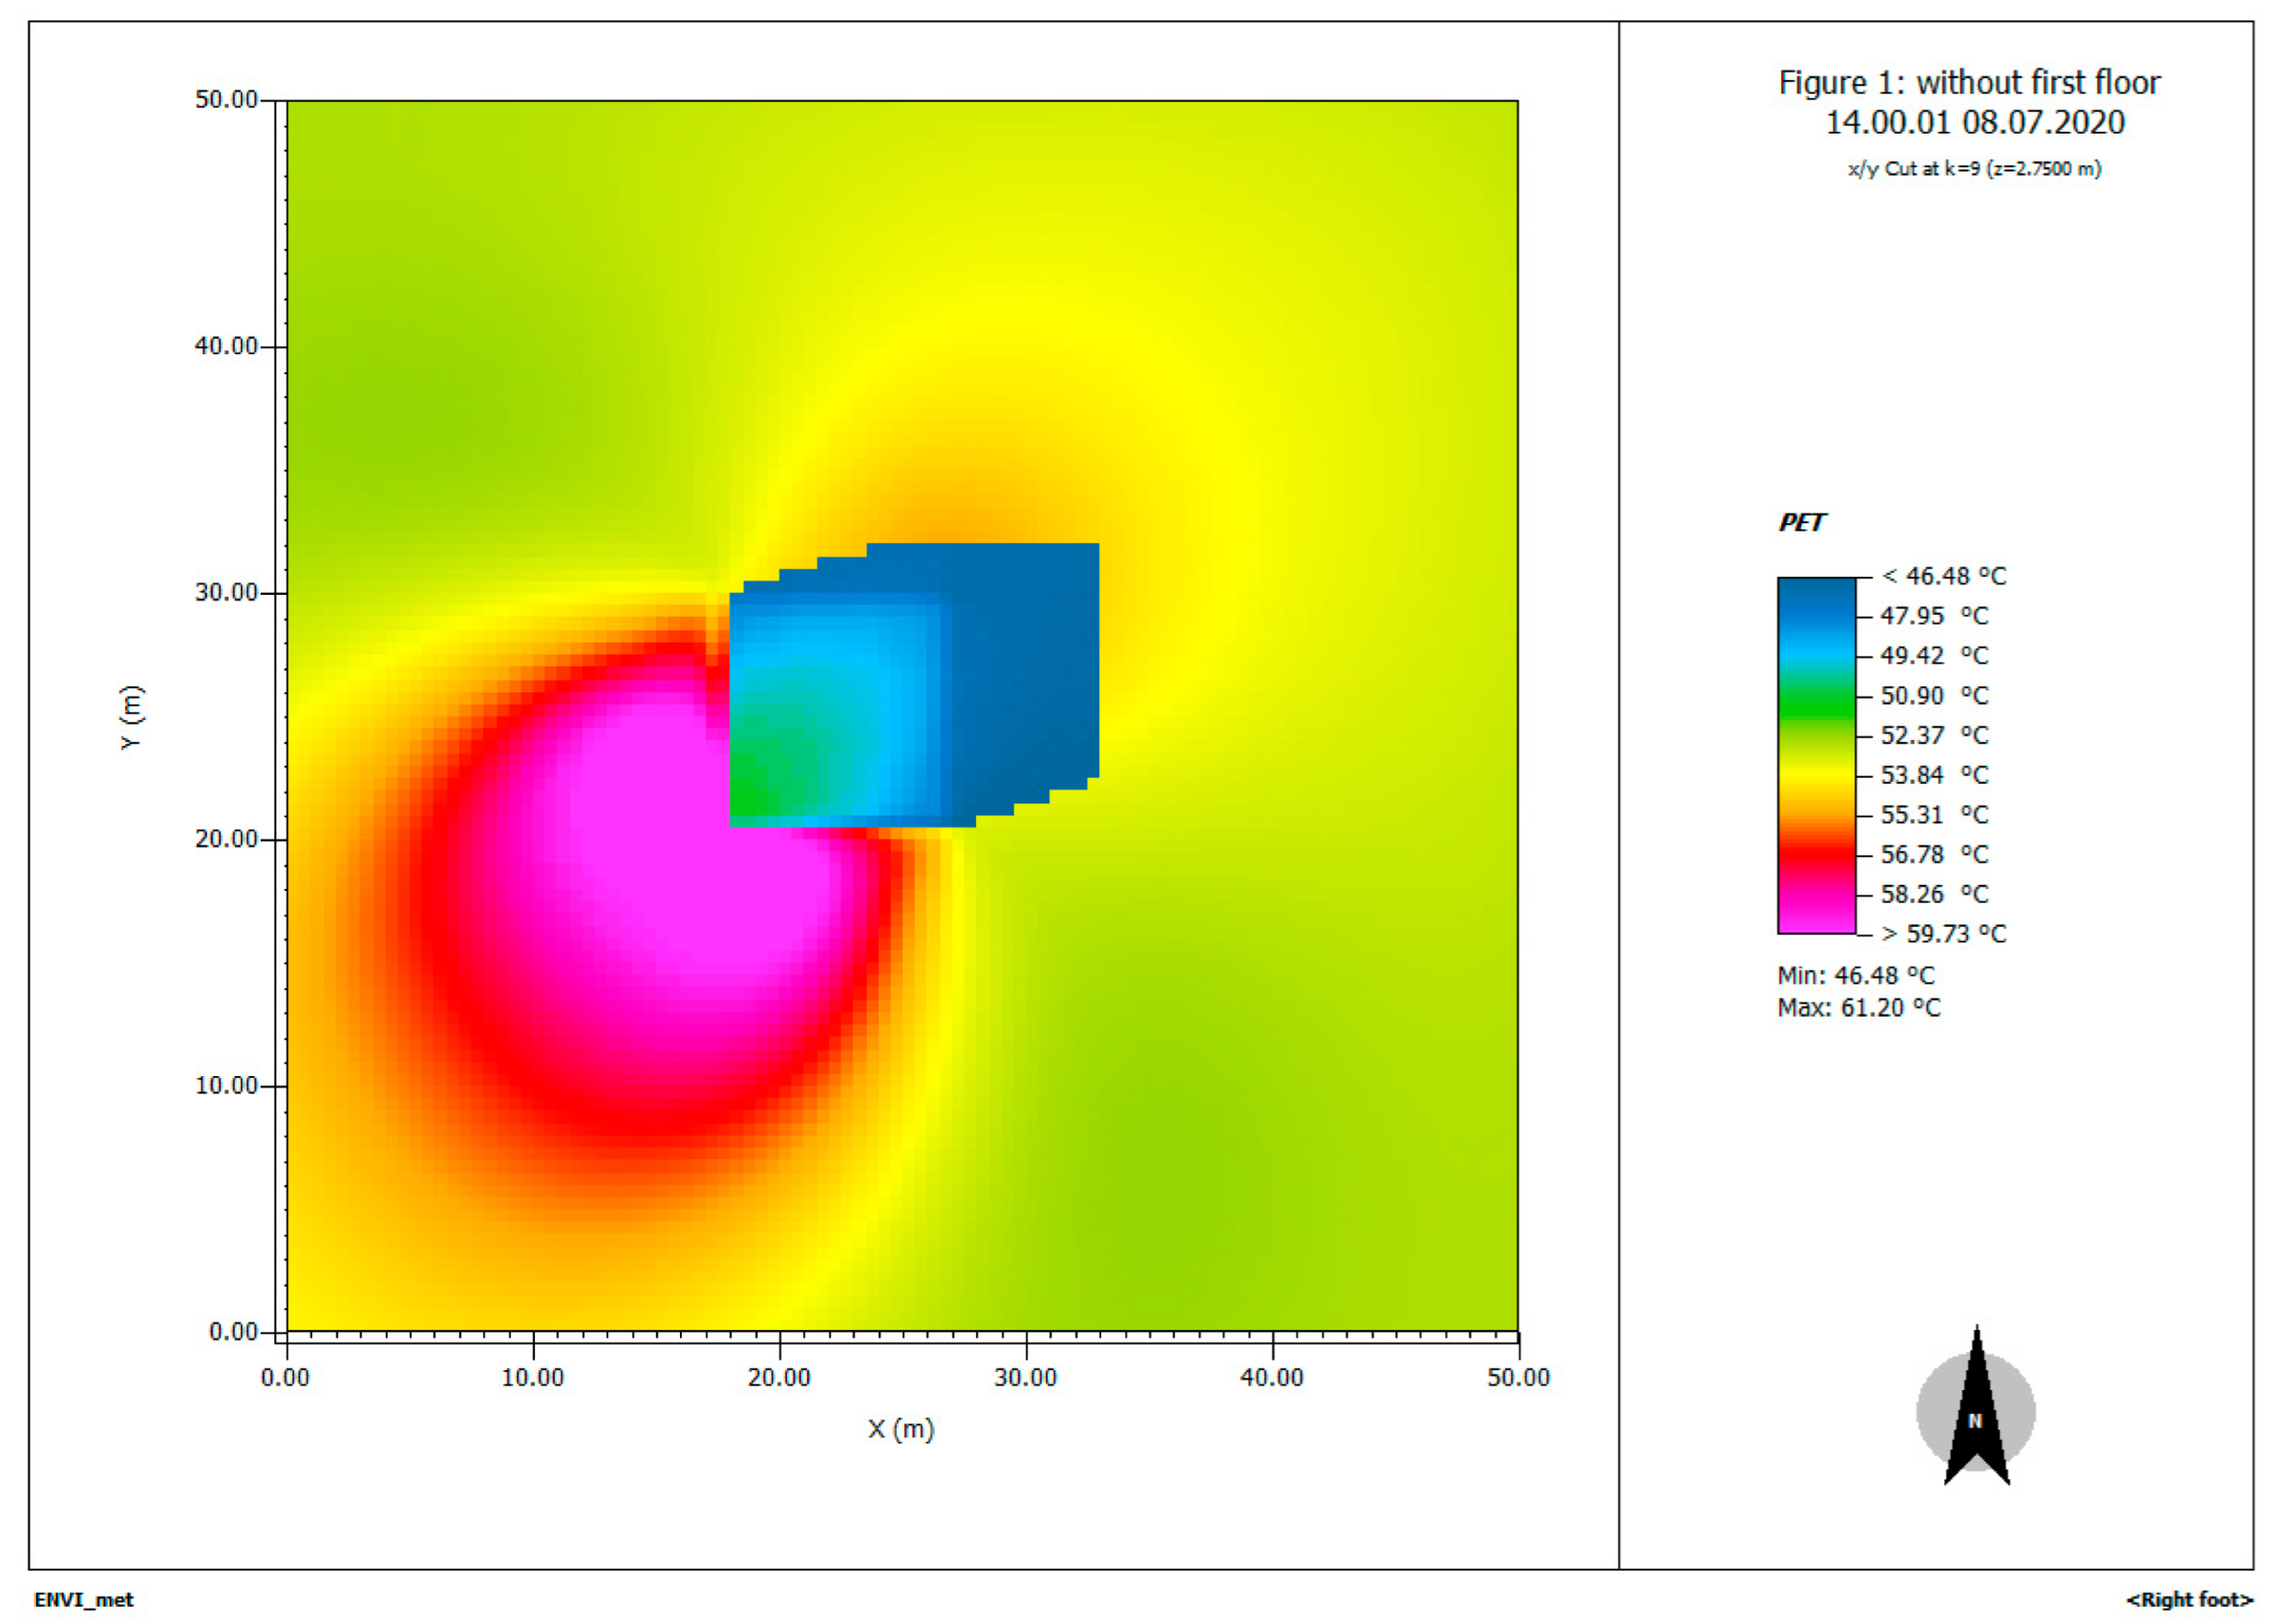 |
| Case-2 |  |
| Case | PET |
|---|---|
| 10%-case |  |
| 40%-case |  |
| 70%-case | 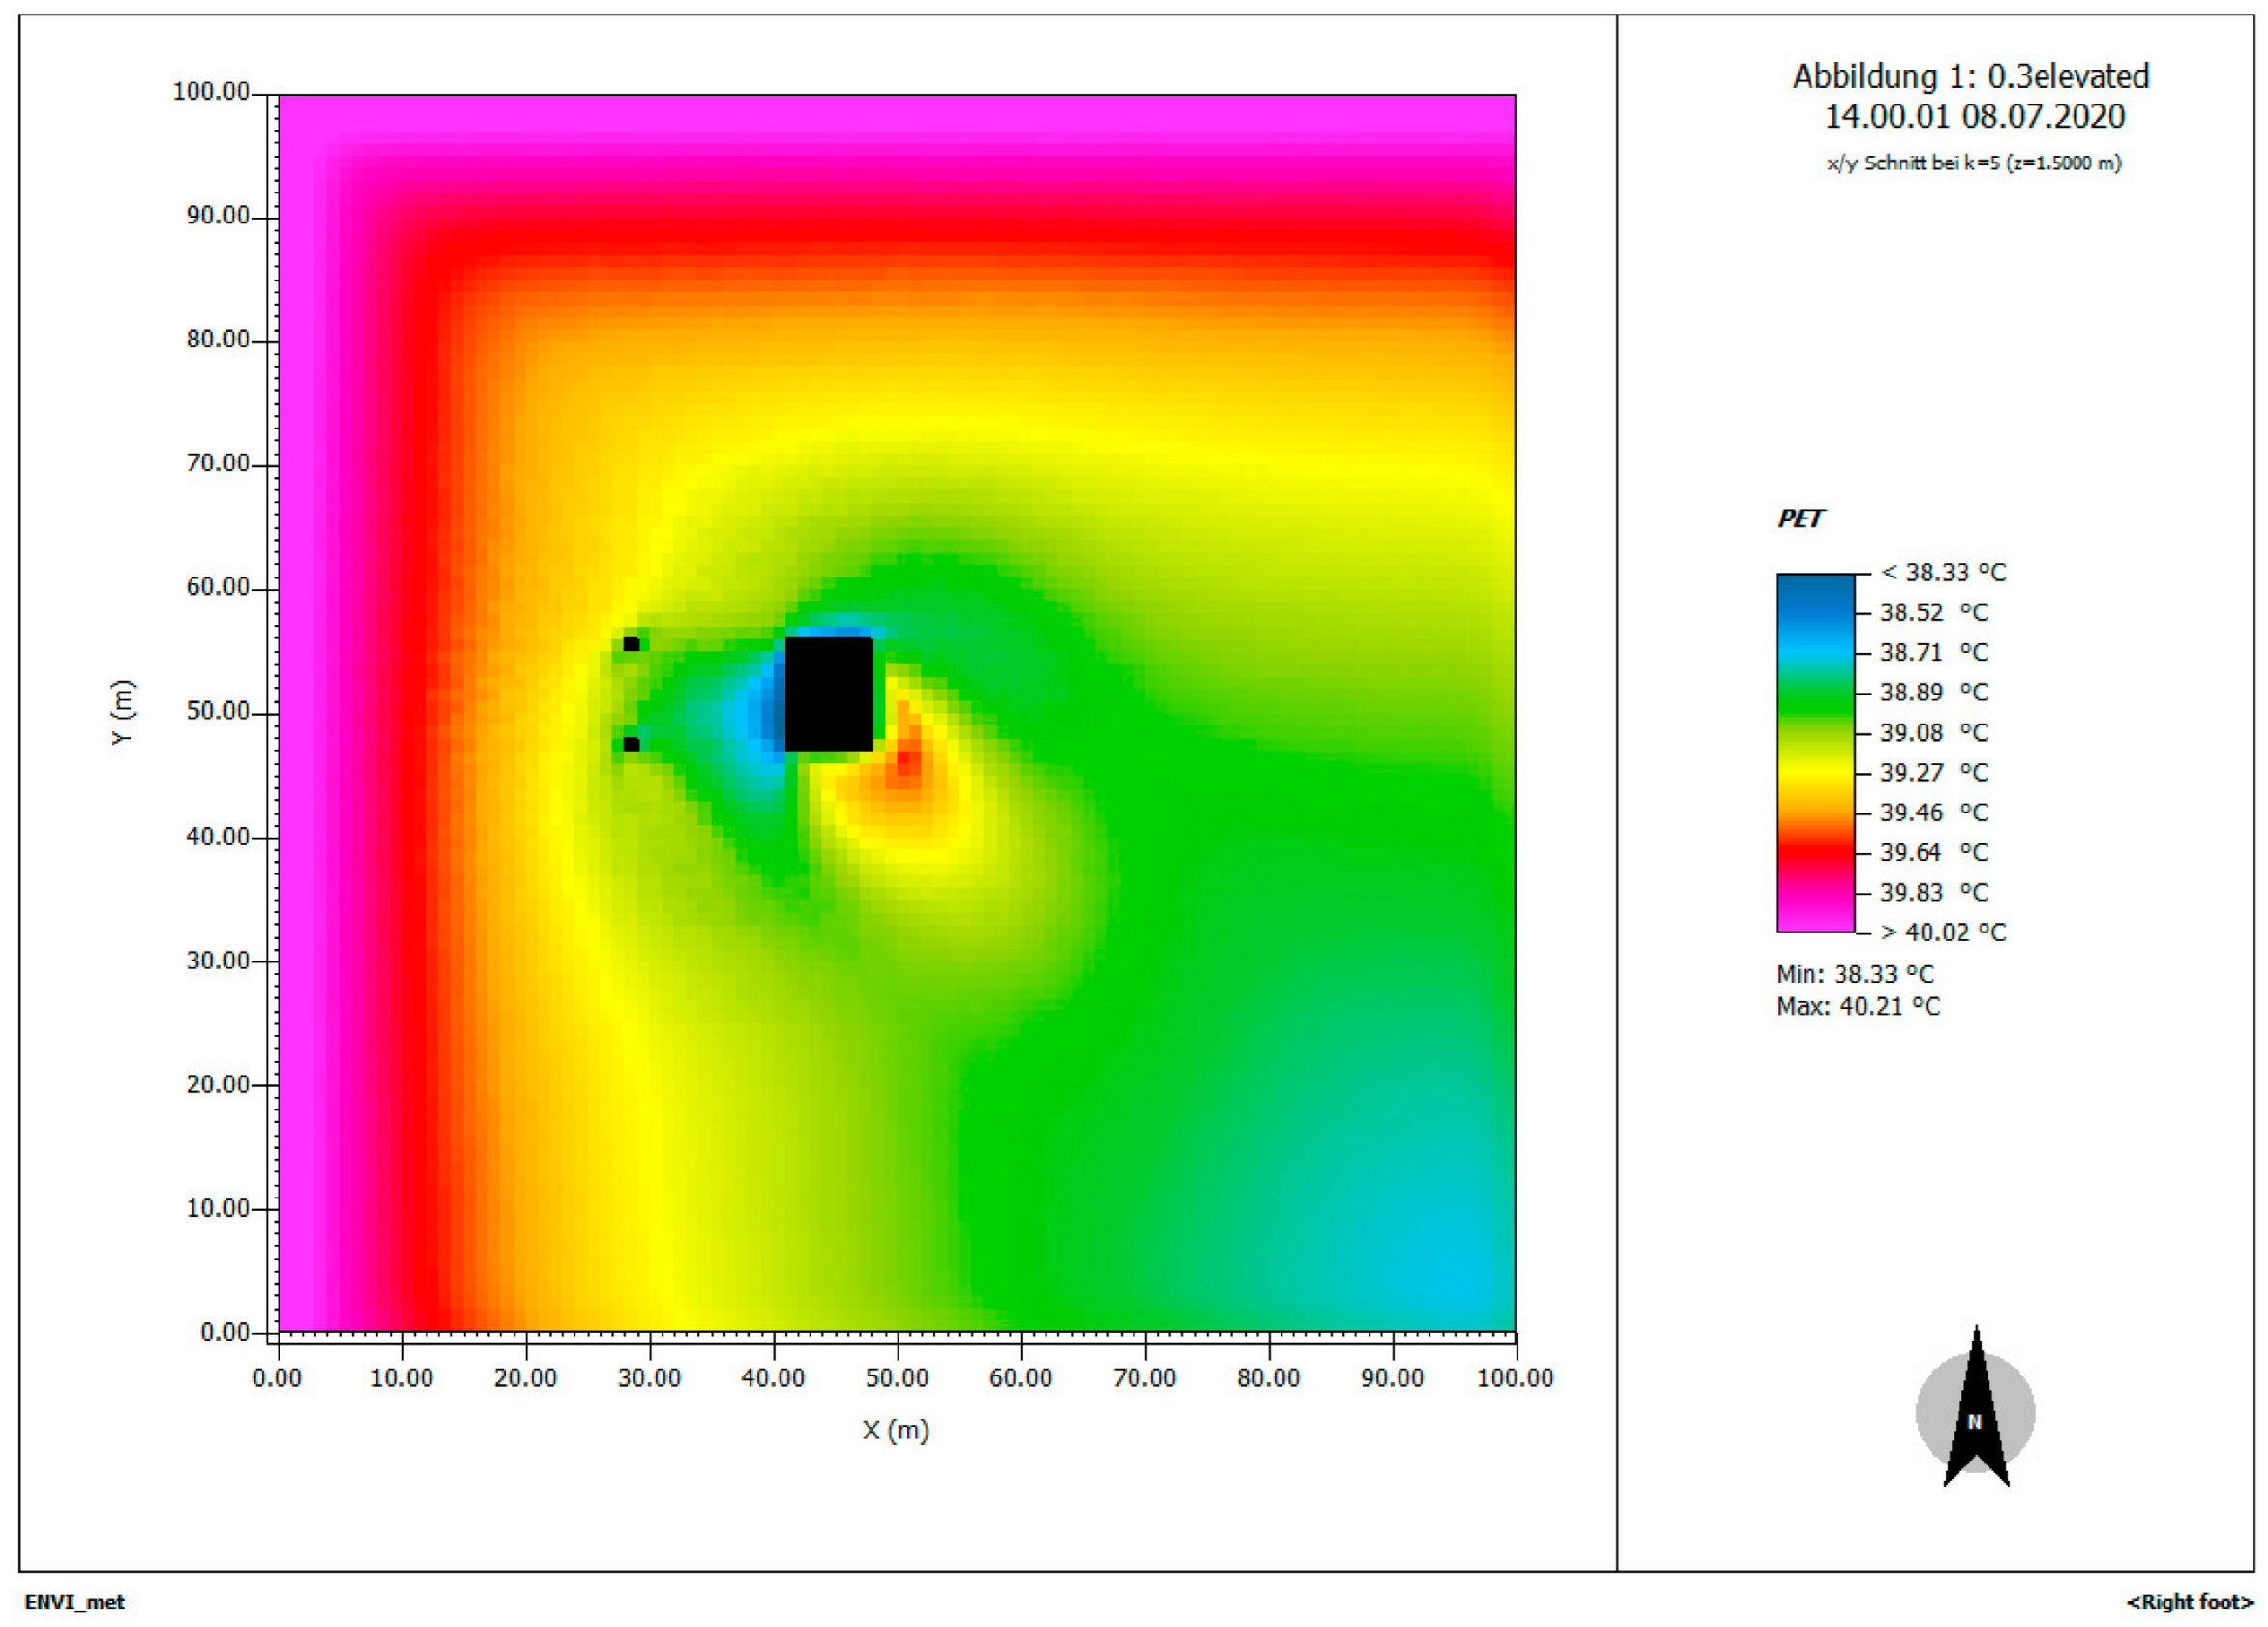 |
| 100%-case | 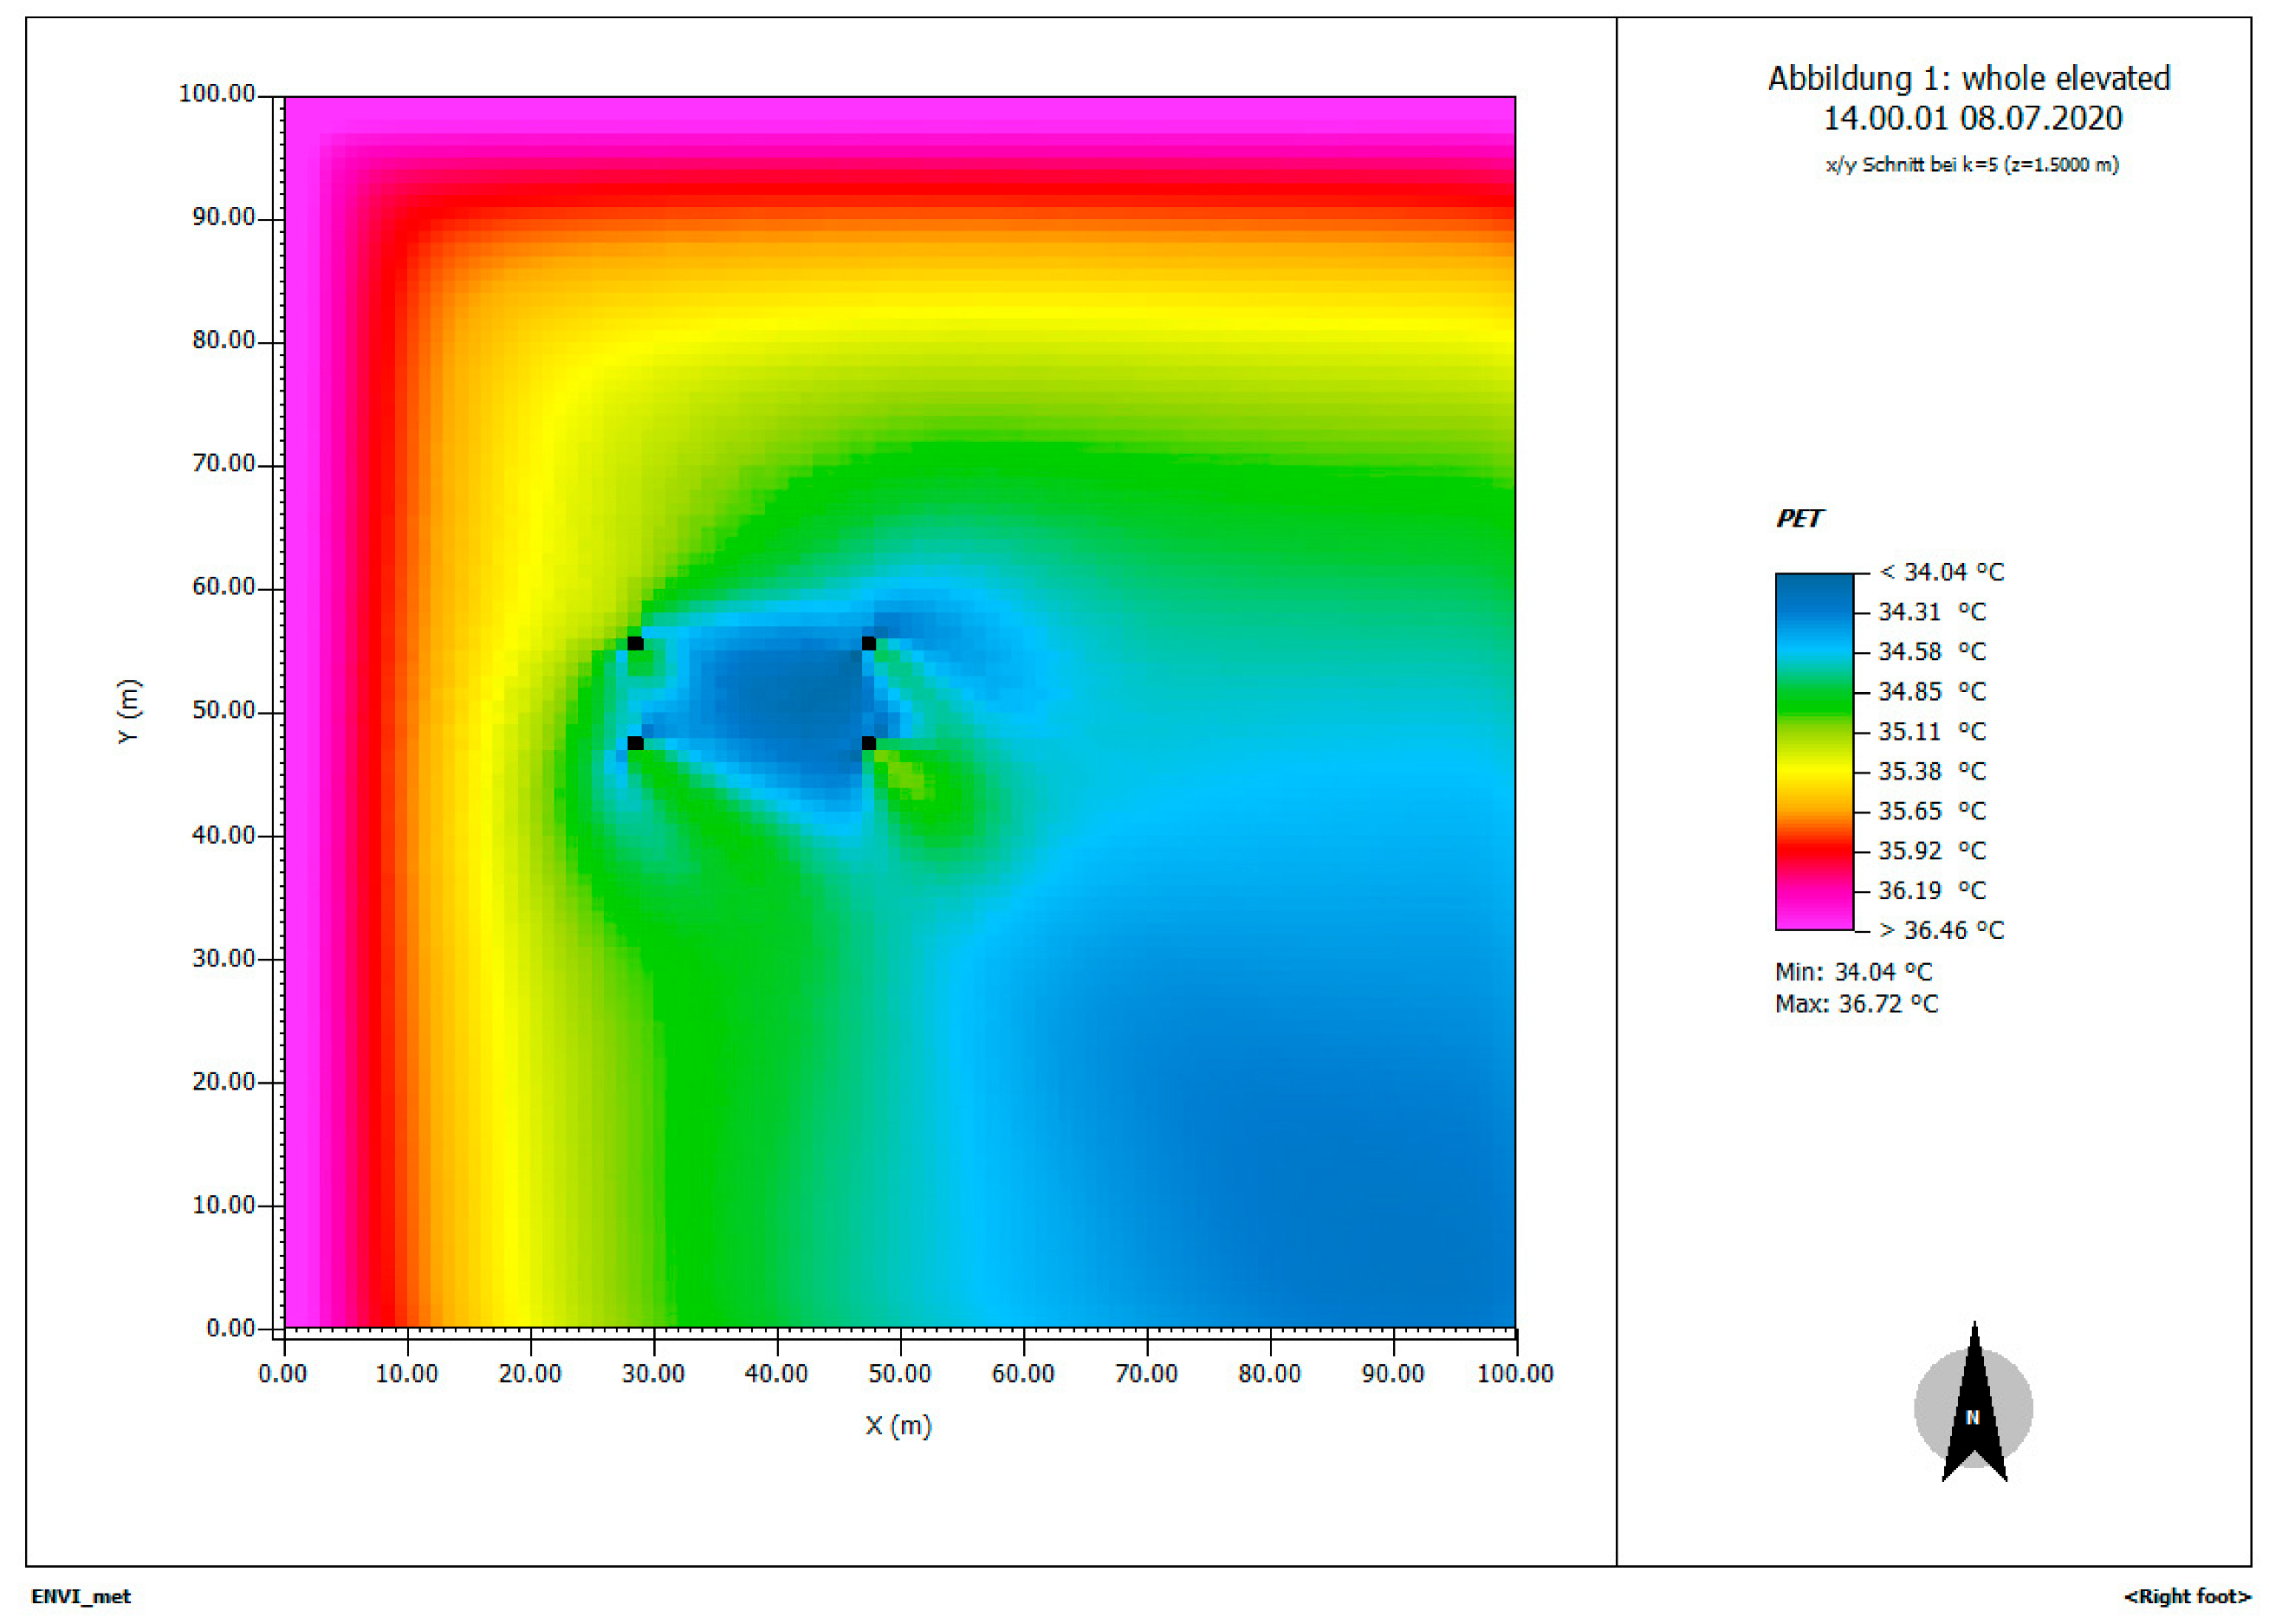 |
Disclaimer/Publisher’s Note: The statements, opinions and data contained in all publications are solely those of the individual author(s) and contributor(s) and not of MDPI and/or the editor(s). MDPI and/or the editor(s) disclaim responsibility for any injury to people or property resulting from any ideas, methods, instructions or products referred to in the content. |
© 2025 by the authors. Licensee MDPI, Basel, Switzerland. This article is an open access article distributed under the terms and conditions of the Creative Commons Attribution (CC BY) license (https://creativecommons.org/licenses/by/4.0/).
Share and Cite
Ma, X.; Luo, Q.; Yan, F.; Lei, Y.; Lu, Y.; Chen, H.; Yang, Y.; Feng, H.; Zhou, M.; Ding, H.; et al. Evaluating the Microclimatic Performance of Elevated Open Spaces for Outdoor Thermal Comfort in Cold Climate Zones. Buildings 2025, 15, 2777. https://doi.org/10.3390/buildings15152777
Ma X, Luo Q, Yan F, Lei Y, Lu Y, Chen H, Yang Y, Feng H, Zhou M, Ding H, et al. Evaluating the Microclimatic Performance of Elevated Open Spaces for Outdoor Thermal Comfort in Cold Climate Zones. Buildings. 2025; 15(15):2777. https://doi.org/10.3390/buildings15152777
Chicago/Turabian StyleMa, Xuan, Qian Luo, Fangxi Yan, Yibo Lei, Yuyang Lu, Haoyang Chen, Yuhuan Yang, Han Feng, Mengyuan Zhou, Hua Ding, and et al. 2025. "Evaluating the Microclimatic Performance of Elevated Open Spaces for Outdoor Thermal Comfort in Cold Climate Zones" Buildings 15, no. 15: 2777. https://doi.org/10.3390/buildings15152777
APA StyleMa, X., Luo, Q., Yan, F., Lei, Y., Lu, Y., Chen, H., Yang, Y., Feng, H., Zhou, M., Ding, H., & Zhao, J. (2025). Evaluating the Microclimatic Performance of Elevated Open Spaces for Outdoor Thermal Comfort in Cold Climate Zones. Buildings, 15(15), 2777. https://doi.org/10.3390/buildings15152777


