Article

Experimental Evaluation of Thermal and Moisture Behavior of Stearic Acid-Coated Expanded Perlite for Sustainable Insulation Mortars

by
Betül Tülin Asan
1,*,
Lütfullah Gündüz
2 and
Gülay Yakar
1
1
Department of Mechanical Engineering, Pamukkale University, Denizli 20160, Türkiye
2
Department of Civil Engineering, İzmir Kâtip Çelebi University, İzmir 35620, Türkiye
*
Author to whom correspondence should be addressed.
Buildings 2025, 15(15), 2749; https://doi.org/10.3390/buildings15152749
Submission received: 9 June 2025 / Revised: 26 July 2025 / Accepted: 30 July 2025 / Published: 4 August 2025
(This article belongs to the Section Building Materials, and Repair & Renovation)

Abstract

In this study, the water-repellent performance of Expanded Perlite (EP) coated with stearic acid (SA) at different coating/EP ratios (0.1%, 0.2%, 0.3%, 0.4%, 0.5%, 1%, 2%, 3%, 4% and 5%) and the capillary water absorption and thermal conductivity behaviors of the modified insulation mortars prepared at these different coating/EP ratios were investigated experimentally. In contrast to the existing literature, experimental studies were carried out for both coated and uncoated EP particles used in mortars to which water-repellent polymers were not added, and the minimum and maximum coating amounts showing the lowest capillary water absorption and slump were determined. In addition, the sustainability of modified insulation mortars consisting of EP-coated SA was determined by sustainable thermal performance (STP). In other words, this study is the first in the literature to determine how the thermal conductivity values of these mortars may change during their use in buildings. According to the experimental results, water absorption, which is an undesirable property, decreased significantly when coated with SA, and even SA-coated expanded coarse perlite (SCP) showed almost no water-absorption behavior at coating levels above 2%. The water-repellent performance of SCP was determined to be 83.2% between 0.1% and 0.4%. In addition, for coarse mortars (MCs), the best water-repellent performance was achieved at a 5% coating/EP ratio, with a 37% reduction in the capillary water-absorption coefficient. In addition, it was found that STP values increased as the coating/EP ratio increased. In other words, modified insulation mortars became more sustainable with an increasing SA coating/EP ratio. The highest STP values were observed in Groups 2 and 4 at a 5% coating/EP ratio, with MC-5 reaching 39.27% in Group 2 and MF-5 reaching 30.30% in Group 4. The results are important from a practical/industrial point of view and from a scientific point of view.

1. Introduction

Perlite, an acidic volcanic glass, exhibits the ability to expand and become porous when exposed to heat. In addition to its properties, such as heat and sound insulation, EP is also known for its lightweight structure, which contributes to savings in building costs [1]. Extensive research has been conducted on the characteristic properties of EP and its potential applications as a building material [2,3,4].
EP aggregate is incorporated into various building elements. Furthermore, composite insulation mortars modified using EP differ from traditional mortar applications in their technical properties and superior advantages: Türkmen and Kantarcı [5] investigated the effects of an EP aggregate and different curing conditions on the physical and mechanical properties of self-compacting concrete. They found that for self-compacting concrete (SCC) containing EP aggregate made with a constant dosage of cement + silica fume as binder and using a superplasticizer to reduce water/binder ratios, the capillarity coefficient, and apparent porosity increased, whereas the compressive strength decreased. In the study conducted by Gündüz and Kalkan [6], the use of Alaçatı–Alapietra stone, found as a production waste, in calcium sulphate anhydride binder mortars was investigated experimentally. They found that the use of Alaçatı–Alapietra stone as an aggregate in cementless mortars is suitable. Pramusanto et al. [7] examined the advantages of lightweight concrete produced with a mixture of EP and natural sand compared to normal concrete. Their results showed that the most optimum composition of the lightweight concrete is 50% EP and 50% natural sand with a total aggregate content of 80%. Pichor et al. [8] studied the effect of granulated foam glass (GFG) on the thermal insulation and mechanical properties of lightweight cement mortars, modified with ground perlite powder in amounts of different cement mass percentages. They found that GFG increased strength while reducing thermal conductivity. In addition, their results showed that a higher perlite content improved thermal insulation, replacing GFG with quartz sand increased thermal conductivity, and a higher GFG content decreased compressive strength. Vyšvařil et al. [9] examined non-hydrophobic lightweight plasters for repair and thermal insulation, replacing silica sand with EP and evaluating structural parameters, moisture and heat conduction, storage properties, and mechanical performance. Their results showed that adding lime and natural hydraulic lime to perlite-based mortars met all criteria for functionality, compatibility, durability, and thermal insulation, making them suitable for historic wall repair and heritage preservation. Ragul et al. [10] compared the performance of replacing different levels of natural perlite with fine aggregate in conventional concrete, focusing on density reduction without changing compressive and tensile strengths. They determined that replacing more than 15% of perlite resulted in a compressive strength reduction of up to 13% compared to the control concrete. Karakaş et al. [11] produced and tested samples of fly ash based lightweight geopolymer mortar with aggregate composition of river sand, raw perlite, and different ratios EP. Their results showed that the use of raw perlite and EP reduced unit weight and mechanical strengths but improved thermal insulation, water absorption, and porosity. Szymczak-Graczyk et al. [12] investigated the effects of prolonged water exposure on the thermal conductivity of three different insulation materials—perlite concrete block, spray-applied polyurethane foam, and expanded clay in loose form. Their results demonstrated that increasing the moisture content significantly deteriorates the thermal performance of these materials, emphasizing the need for proper handling and installation practices in passive building applications. Gündüz and Kalkan [13] experimentally investigated the thermal comfort properties of the tested mortars for building applications, namely thermal conductivity, thermal diffusivity, specific heat value, heat storage capacity, and heat storage efficiency. They concluded that the density and porosity ratio of the aggregate used in the preparation of the mortar samples is an effective parameter influencing the specific heat of the material.
EP has been coated with substances such as SA, boric acid, and aerogel to enhance strength and reduce water absorption. Similarly, other expanded materials have also been coated with substances such as SA. Slavica et al. [14] investigated water suspensions of natural limestone with >95% calcite content using SA dissolved in chloroform at concentrations of 0.5–4% to achieve hydrophobicity. Their thermal analysis showed that concentrations up to 2% led to chemisorption of molecules on the calcite surface, while higher concentrations led to additional physical adsorption. Gürsoy and Karaman [15] used radio frequency (RF) plasma to deposit thin poly hexafluorobutyl acrylate (PHFBA) polymeric films on EP, successfully transforming the surface of the hydrophilic porous material into super-hydrophobic due to the highly fluorinated chain of PHFBA. Their results showed that the water retention capacity of shock-modified EP was reduced from approximately 70% to about 4%. In the study by Pichor and Janiec [16], thermal stability results of mullite-modified EP were presented. They determined that the sol-gel method, which allowed the production of mullite synthesized from alumino-silicate gel at relatively low temperatures, provided the formation of a homogeneous and reactive gel. Alazhari et al. [17] used coated EP to immobilize bacterial spores and encapsulate nutrients for self-healing concrete. Their results indicated that replacing 20% of fine aggregate with this coated perlite and using an optimal ratio of spores to calcium acetate effectively enabled self-healing in the concrete. Jia et al. [18] developed a thermal insulation composite, aerogel/EP (AEP), by adding aerogel to the porous structure of EP and gelling SiO2 hydrosol. The results of this study showed that AEP 14.7–31.8% decrease in thermal conductivity compared to EP. Similarly, Jia and Li [19] studied the improved processability, physical properties, and microstructure in aerogel/EP (AEP) based cement composites (AEPC) for building materials. They determined that coatings with KH550 or HPMC improved processability and slowed down hydration. In addition, their results showed that AEPC achieved 10.8–28.5% lower thermal conductivity than conventional composites. Liu et al. [20] developed a composite phase change material (PCM) using capric-SA and various coating methods and highlighted the potential of organic modifications to enhance the adsorption capacity and thermal storage performance in inorganic matrices for building energy efficiency. Feng et al. [21] proposed a Na+ modification method to improve the thermal expandability of vermiculite. They indicated that sodium ions replaced interlayer calcium ions and increased the expansion ratio by up to 26.5% at 400–700 °C. Gündüz and Kalkan [22] studied the effects of exfoliation temperature for vermiculate aggregates modified by sodium ions on the thermal and comfort properties of a new generation cementitious mortar. They saw that the thermal comfort properties of mortars using Na+-modified exfoliated vermiculite are better than those of mortars with non-modified exfoliated vermiculite. Akyuncu and Sanliturk [23] examined physical and mechanical properties of mortars produced by polymer coated perlite aggregate. Their results indicated that the polymer coating of EP improved physical and mechanical properties. Myronyuk et al. [24] investigated organic superhydrophobic coatings using EP and regenerated adsorbents. They found that coatings containing more than 50 wt% polymer for untreated perlite and more than 40 wt% polymer for treated perlite were effective. Qi et al. [25], in their study, prepared EP with high oil/water selectivity for different sizes modified with SA by immersion in acetone solution and developed a mineral sorbent with high oil/water selectivity for oil removal from water. Their results showed that the optimized amount of SA coated on the EP surface was 2%. Vogt and Plachta [26] improved the hydrophobic properties of EP by mixing 8% SA by mass with crude perlite in a laboratory evaporator at high temperatures and dissolving it in ethanol and petroleum ether. Their results showed that the coated perlite particles acquired suitable hydrophobic properties for oil pollution removal. Huang et al. [27] prepared controlled-release fosthiazate (FOS)-SA/EP particles by a series of complex methods via vacuum impregnation using EP as the carrier, FOS as the model pesticide, and SA as the hydrophobic matrix. Their results indicated that FOS and SA were adsorbed into the EP pores through physical interactions. Bian et al. [28] developed an EP-aerogel (AEP) composite matrix with different SA varieties to address the poor thermal stability and leakage issues in phase change materials (PCMs). Their results indicated that the AEP composite exhibits 200% adsorption capacity after heating for capric-SA. Hait and Chen [29] investigated the surface modification of calcium carbonate particles (calcite) precipitated in a planetary ball mill using SA as a modification agent to create dispersion in hydrocarbon oil. As a result, in recent years, innovative materials such as organic coatings, nano-silica, aerogel, and polymer-modified mortars have been intensively investigated to increase the water resistance and long-term thermal performance of lightweight insulation mortars [30,31,32]. The thermal conductivity of mortars prepared with lightweight aggregates such as silica aerogel, expanded polystyrene (EPS), and vermiculite decreases by up to 60%, while their water-absorption rates may also decrease. However, there is still a lack of information on the hygrothermal and long-term performance of aerogel-based mortars [31,33]. The water-absorption rate of mortars containing nano-aerogel and nano-silica additives decreases by up to 75%, and their thermal conductivity decreases to 0.08 “W/mK”, thus offering significant advantages in water resistance and insulation [32,34]. Polymer/aerogel hybrids and organic-inorganic “ceramer” aerogels stand out with their high flexibility, superior hydrophobicity and fire resistance [35,36]. However, the optimum additive ratio is also critical in these systems, and excessive additives may adversely affect mechanical strength [37,38,39]. In terms of long-term performance of aerogel-based coating mortars, accelerated aging tests show that there may be a 10–30% increase in thermal conductivity after 10 years [30,33].
According to the literature reviewed, in current applications, EP is used as an important material type in combinations of modified insulation mortars, especially those aiming to contribute to thermal insulation. However, the porous, therefore brittle structure of EP and its high water-absorption property negatively affect the physical and mechanical properties of the hardened mortar when used in mortar mixtures. It is stated that future research will focus on large-scale production with cheaper, environmentally friendly materials. Most of the polymer modified alternatives are expensive and toxic and sometimes evaporate or drain away during daily applications [40]. The EP mineral used in this study is environmentally friendly, as it is a natural rock. In addition, the SA used for the coating is natural fatty acid. Due to the high energy consumption of EP during the expansion process, its carbon footprint (A1–A3: cradle to gate) is generally moderate in kgCO2e/kg. However, due to the very low unit bulk density of the material after expansion, it has been observed in applications where it helps reduce CO2 emissions per m2 or m3 to a very low level when used with building materials [41,42,43].
As seen in the literature summary above, no building material has been encountered where coated EP particles are used. Usually, high-cost water-repellent polymers are added to building materials together with EP particles. In this study, EP particles coated with SA were added to mortars used as building materials, and therefore water-repellent polymers were not added because water-repellent properties are improved in EP particles coated with SA. In addition, water-repellent polymers are approximately 10 times more expensive than SA. Therefore, not using water-repellent polymers in this study is also important from a cost perspective.
A review of the literature indicates that water-repellent performance is approximately constant at SA coating/EP ratios above 3%. Additionally, SA coating/EP ratios of 1% and above have been analyzed. In this study, experiments were carried out for SA coating/EP ratios both below 1% and above 3%.
In building materials, due to the partial pressure difference between the indoor and outdoor environment, water vapor diffusion occurs from the side where the partial pressure is high to the side where the partial pressure is low. In addition to vapor diffusion, rainwater can also penetrate into building structures. Therefore, no matter how low the thermal conductivity coefficient obtained under laboratory conditions for the modified insulation material is, this value does not remain constant and increases after moisture and water absorption during use. This means that the STP of the material decreases during its use in buildings. In other words, for a modified insulation material to be sustainable, its insulation performance must exhibit constant behavior during its use in buildings, i.e., the thermal conductivity coefficient value must remain approximately constant.
In this study, the EP used in the modified insulation mortar was coated with stearic acid to increase water repellency in case of exposure to water by vapor diffusion, rainwater, etc., during use in buildings. A coating method that was both easy and cheap was used during coating. When the literature was examined, no study was found on the sustainability of SA-coated mortars, that is, how the thermal conductivity values of these mortars change during their use in buildings using the STP. Therefore, the results of this study on sustainability, determined using the STP, are a first of their kind in the literature. In addition, the capillary water absorption, STP, and thermal conductivity values of samples with different coating/EP ratios during their use in buildings were investigated, and thus the best coating/EP ratios were determined.

2. Materials and Methods

The perlite used in this study was supplied by Bülbüller Mining (İzmir, Türkiye). Its particle size varied between 0 and 3 mm, and sieve analysis was performed manually. According to the European standard EN 13139 [44], if the ratio of the largest size to the smallest size of the aggregate is greater than three, these aggregate particles are considered defective and may affect the strength. Since raw perlite does not have standard sizes when expanded, EP was sieved and grouped accordingly. Expanded coarse perlite (ECP) was classified as having a particle diameter of 1–3 mm and expanded fine perlite (EFP) as having a particle diameter of 0–1 mm (Figure 1). The bulk density of ECP was determined to be approximately 80 ± 20 kg/m3, and the bulk density of EFP was determined to be approximately 100 ± 20 kg/m3.
In this study, the effect of EP aggregates used as a mineral additive on the properties of modified insulation mortar was investigated. In the mortar, EP, which has a porous structure, was used to reduce the thermal conductivity coefficient. In addition, CEM I 52.5 R white Portland cement, which complies with the EN 197-1 standard [45] and has a compressive strength of 52.5 N/mm2, was used as the main binder material in the prepared test samples. This cement was procured by OYAK Cement Industry and Trade Inc. (İzmir, Türkiye). To improve the workability of all mortar samples used in this study, a melamine sulfonate-based superplasticizer was added to the mixed mortars in powder form. The second purpose of the superplasticizer was to extend the setting time, and it was supplied by Ata Kimya (Ankara, Türkiye). Quartz and calcite powders were also used to improve abrasion resistance, impact tolerance, and dust suppression characteristics under mechanical loads of the mixture mortars. In addition, the very fine micronized calcite powder was used as a filling material, called “mineral fillers”, and was sourced from Polat Mining (Konya, Türkiye). In this study, since bond-strength-enhancing polymers, which have water-repellent properties, were not used, adhesion-enhancing powder polymers and filler materials were used to increase the bond strength of the aggregates in the mortar mixture. Lime is a white, inorganic binder that, when mixed with water, solidifies in air or water, depending on its type. The lime (CL-80) used was sourced from the market. To further improve the mechanical properties of the composite mortars, particularly their flexural strength and crack resistance, 3–4 mm long glass fibers were added. These glass fibers were supplied by REV Glassfiber Company (İzmir, Türkiye). In addition, the other components, apart from EP, constituting the mixture mortars used in the study were in powder form.
EP particles were coated with SA, one of the most common saturated fatty acids and usually in the form of glyceride stearin, to acquire its water-repellent behavior. Table 1 shows the physical properties of SA.
In this study, EP was first coated with SA at ten different coating/EP ratios, and the water-repellent performance analyses of these coated EP particles were carried out. Then, mortars were produced with these SA-coated EP particles. These process steps are explained in order below:
  • Manual sieving of EP (ECP and EFP);
  • Coating of ECPs with different SA coating/EP ratios (Group 1 and Group 2);
  • Coating of EFPs with different SA coating/EP ratios (Group 3 and Group 4);
  • Water-repellent performance analysis for Groups 1, 2, 3, and 4;
  • Preparation of mortars with ECP (MC);
  • Preparation of mortars with EFP (MF);
  • Compressive strength tests for MCs and MFs;
  • Capillary water-absorption tests for MCs and MFs;
  • Thermal conductivity measurements of MCs and MFs under dry conditions and different moisture contents.

2.1. Coating Procedure of EP Particles

In this study, EP particles were used to reduce the heat conduction coefficient by creating a porous structure within the mortar.
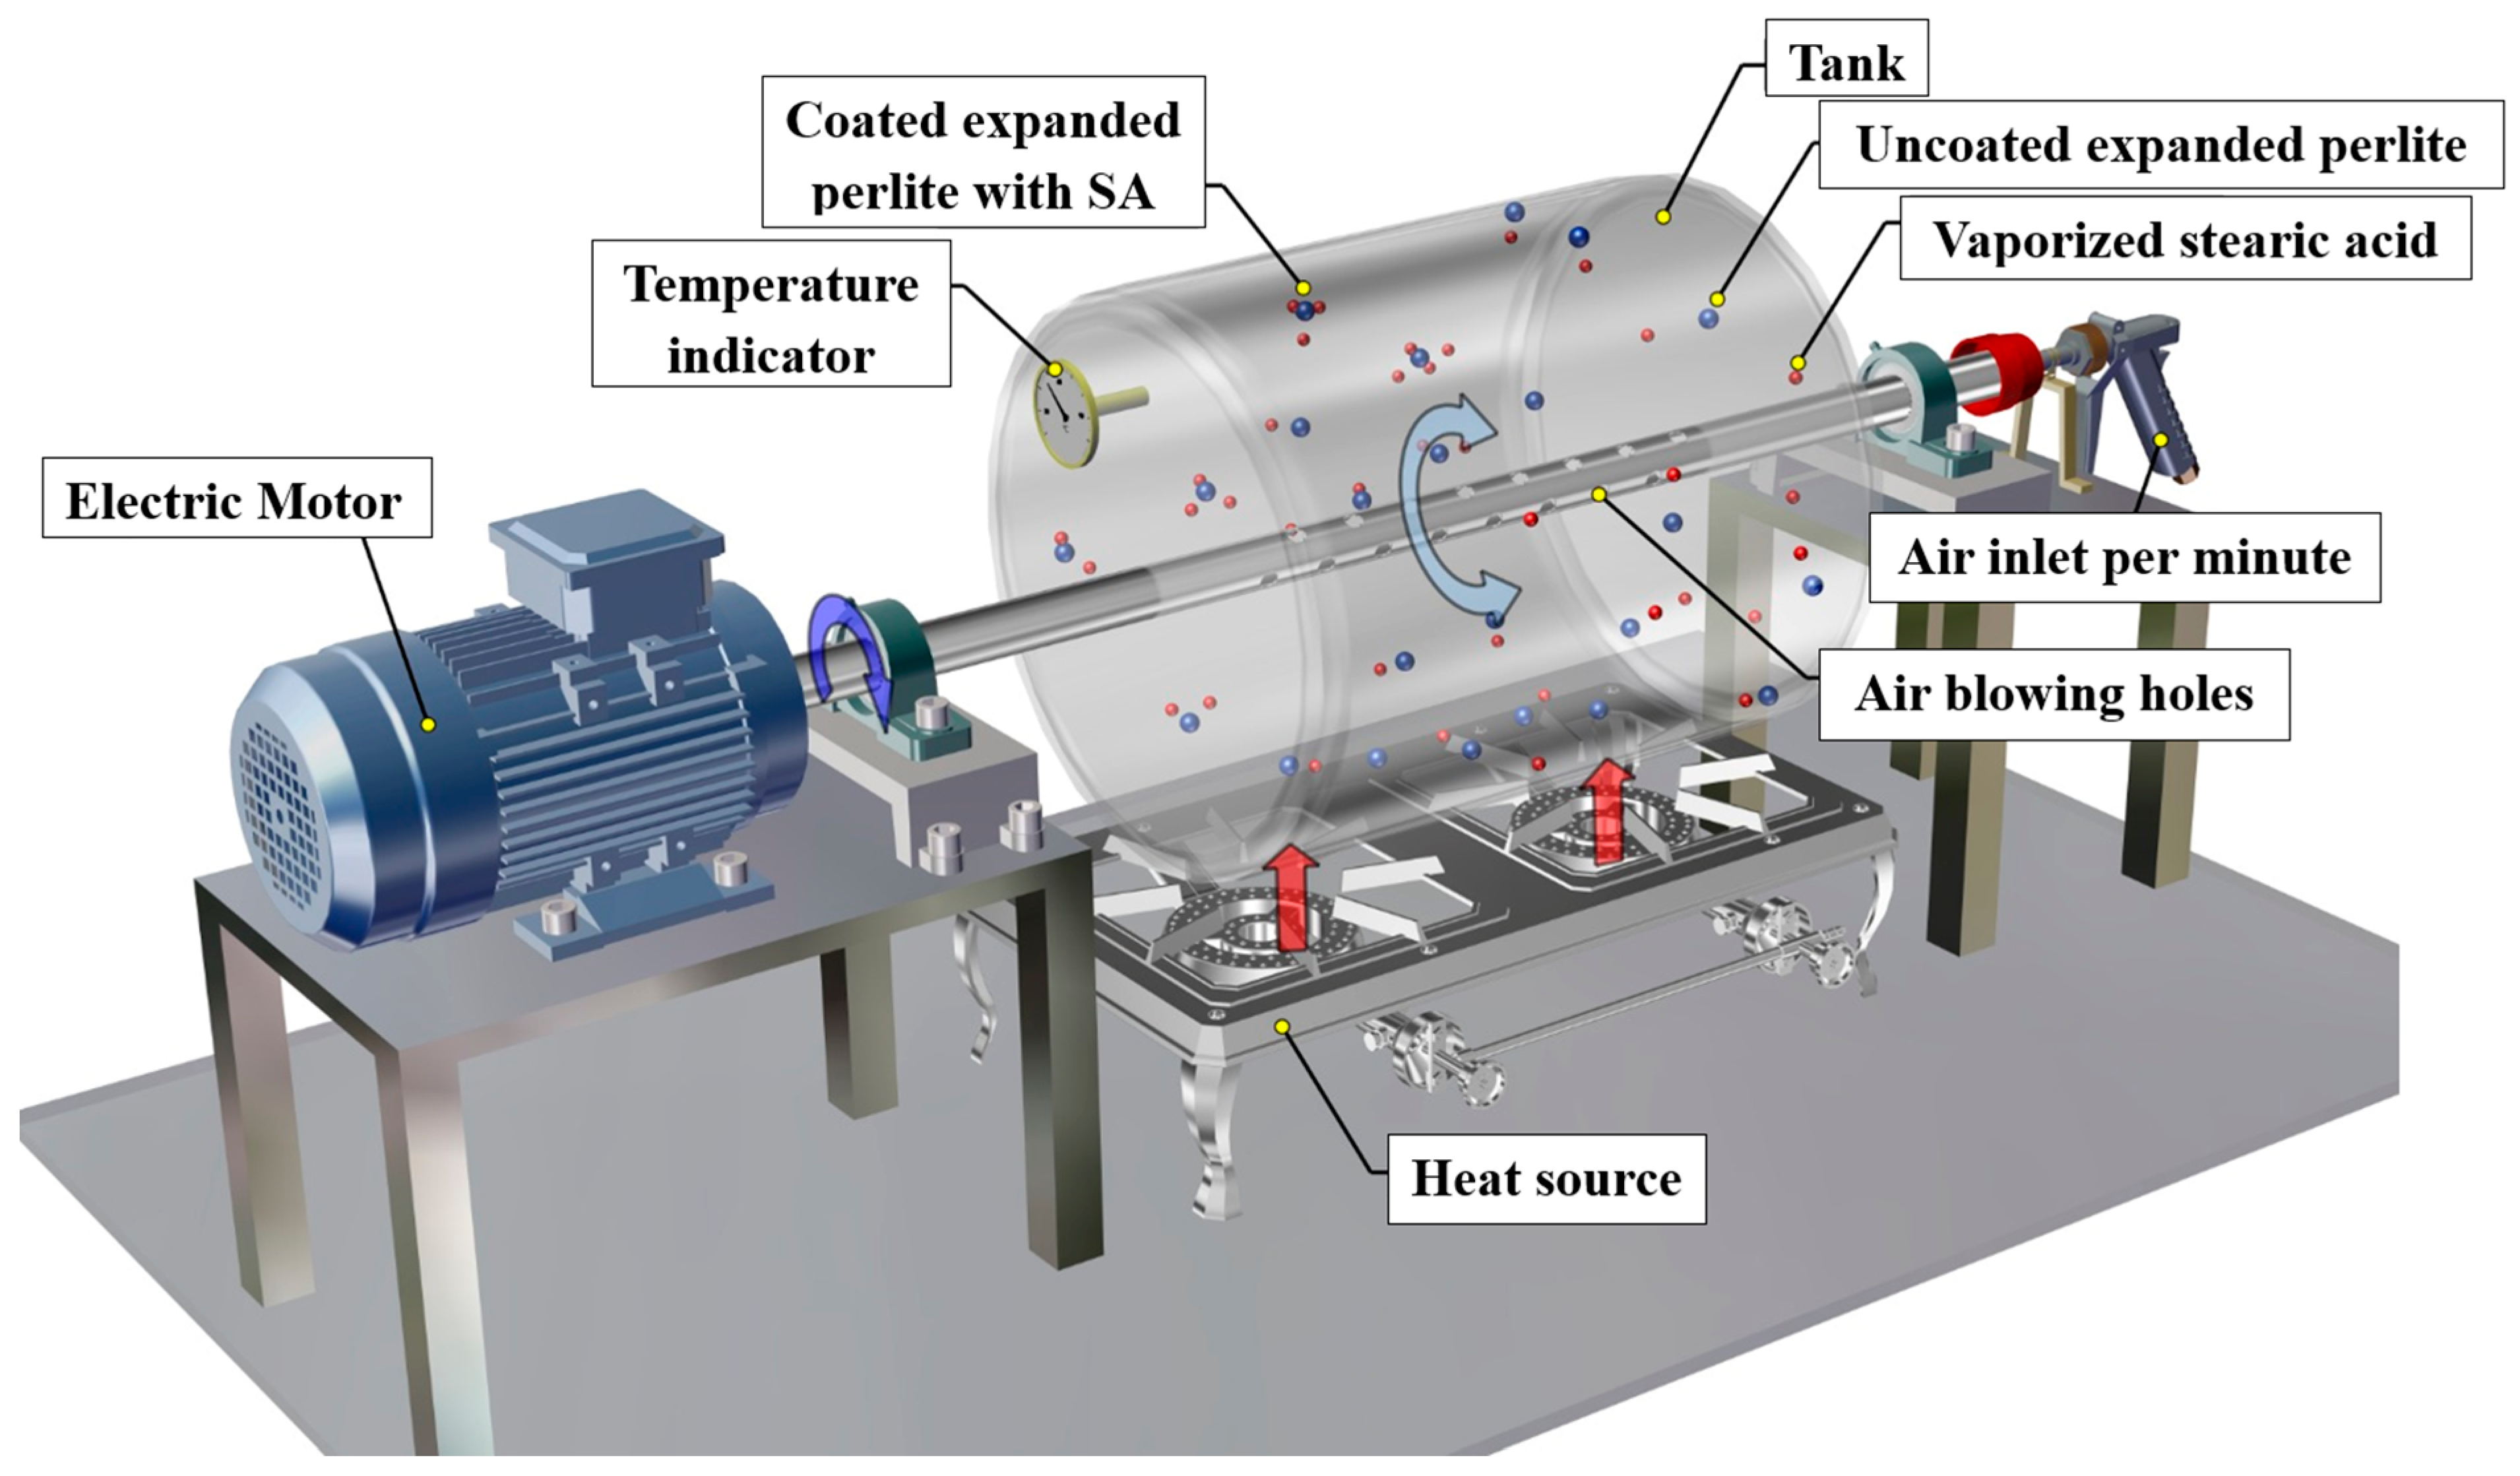
When the mortar was mixed with EP, it was observed that EP particles were broken. Therefore, EP was coated with SA to achieve the required hardness and water-repellent properties. For this, ECP and EFP were coated with SA according to ten different coating/EP ratios for 5 min. Based on these coating/EP ratio values, the terms SA-coated expanded coarse perlite (SCP) and SA-coated expanded fine perlite (SFP) were used. Figure 2 shows the schematic view of the EP-coating instrument.
ECP and EFP particles were coated using the experimental instrument schematically illustrated in Figure 2. The coating process was performed by coating/EP ratios of 0.1%, 0.2%, 0.3%, 0.4%, 0.5%, 1%, 2%, 3%, 4%, and 5% for a period of five minutes. The detailed steps of the process are as follows:
First, the mixing vessel was heated while rotating until it reached a temperature of 90 ± 10 °C, creating the necessary environment for the subsequent coating steps. The heat source was automatically turned on or off when the temperature of the vessel was above or below 90 ± 10 °C. Once the target temperature was achieved, the predetermined quantity of SA, specific to each group, was accurately weighed and added into the preheated vessel. Since the melting point of SA is 69.3 °C, SA melted rapidly when added. Following this, the designated amount of EP was added through the feeding port of the mixing vessel. At this point, the timer was activated, and the vessel continued to rotate at a 300 rpm to ensure uniform mixing. The melting SA adhered to the surface of the EP particles, thereby coating them effectively. To enhance the homogeneity of the coating, a stream of air was passed through a pipe inside the vessel, facilitating an even distribution of SA over all surfaces of the perlite particles. After five minutes of continuous mixing, the coated perlite particles were collected. With this method, homogeneously coated EP particles were produced, which were used in subsequent analyses.

2.2. Water-Repellent Performance Analysis

Due to its bulk density, perlite exhibits a tendency to slump into water from the surface, a behavior seen in materials with water absorption capacity, due to the hydrostatic pressure it creates after contact with the still water surface. Materials exhibiting hydrophobic properties may not show a tendency to slump from the water surface. Therefore, the decrease in the amount of slump in stagnant water can be defined as an indicator of hydrophobic behavior of that material. In this study, an approach was attempted in order to define this property.
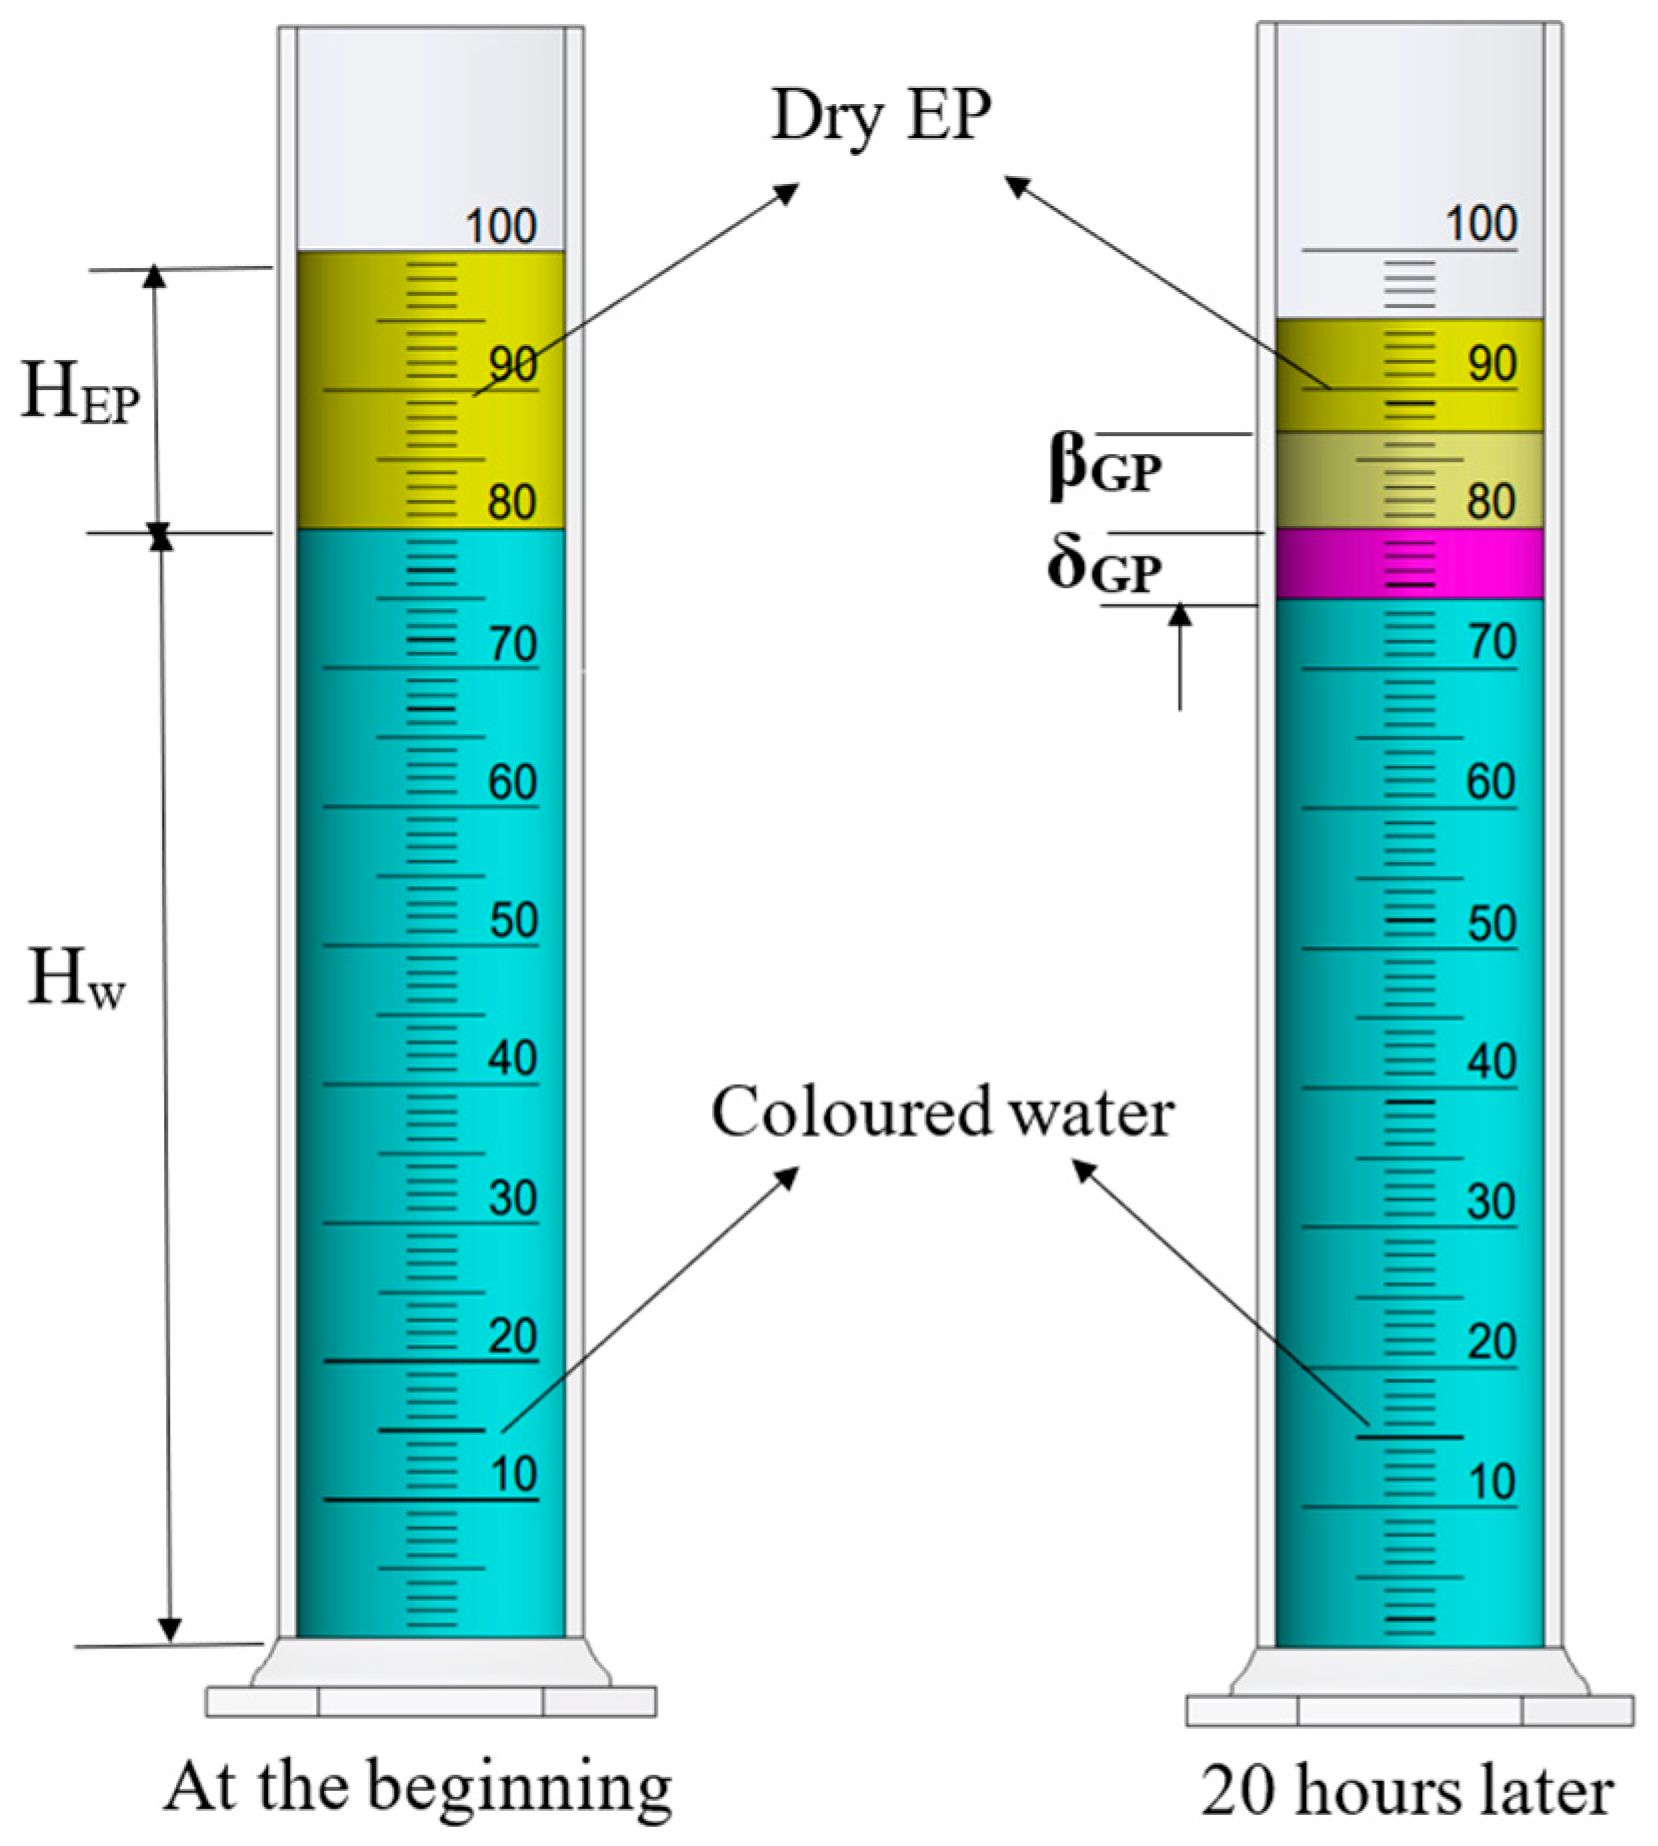
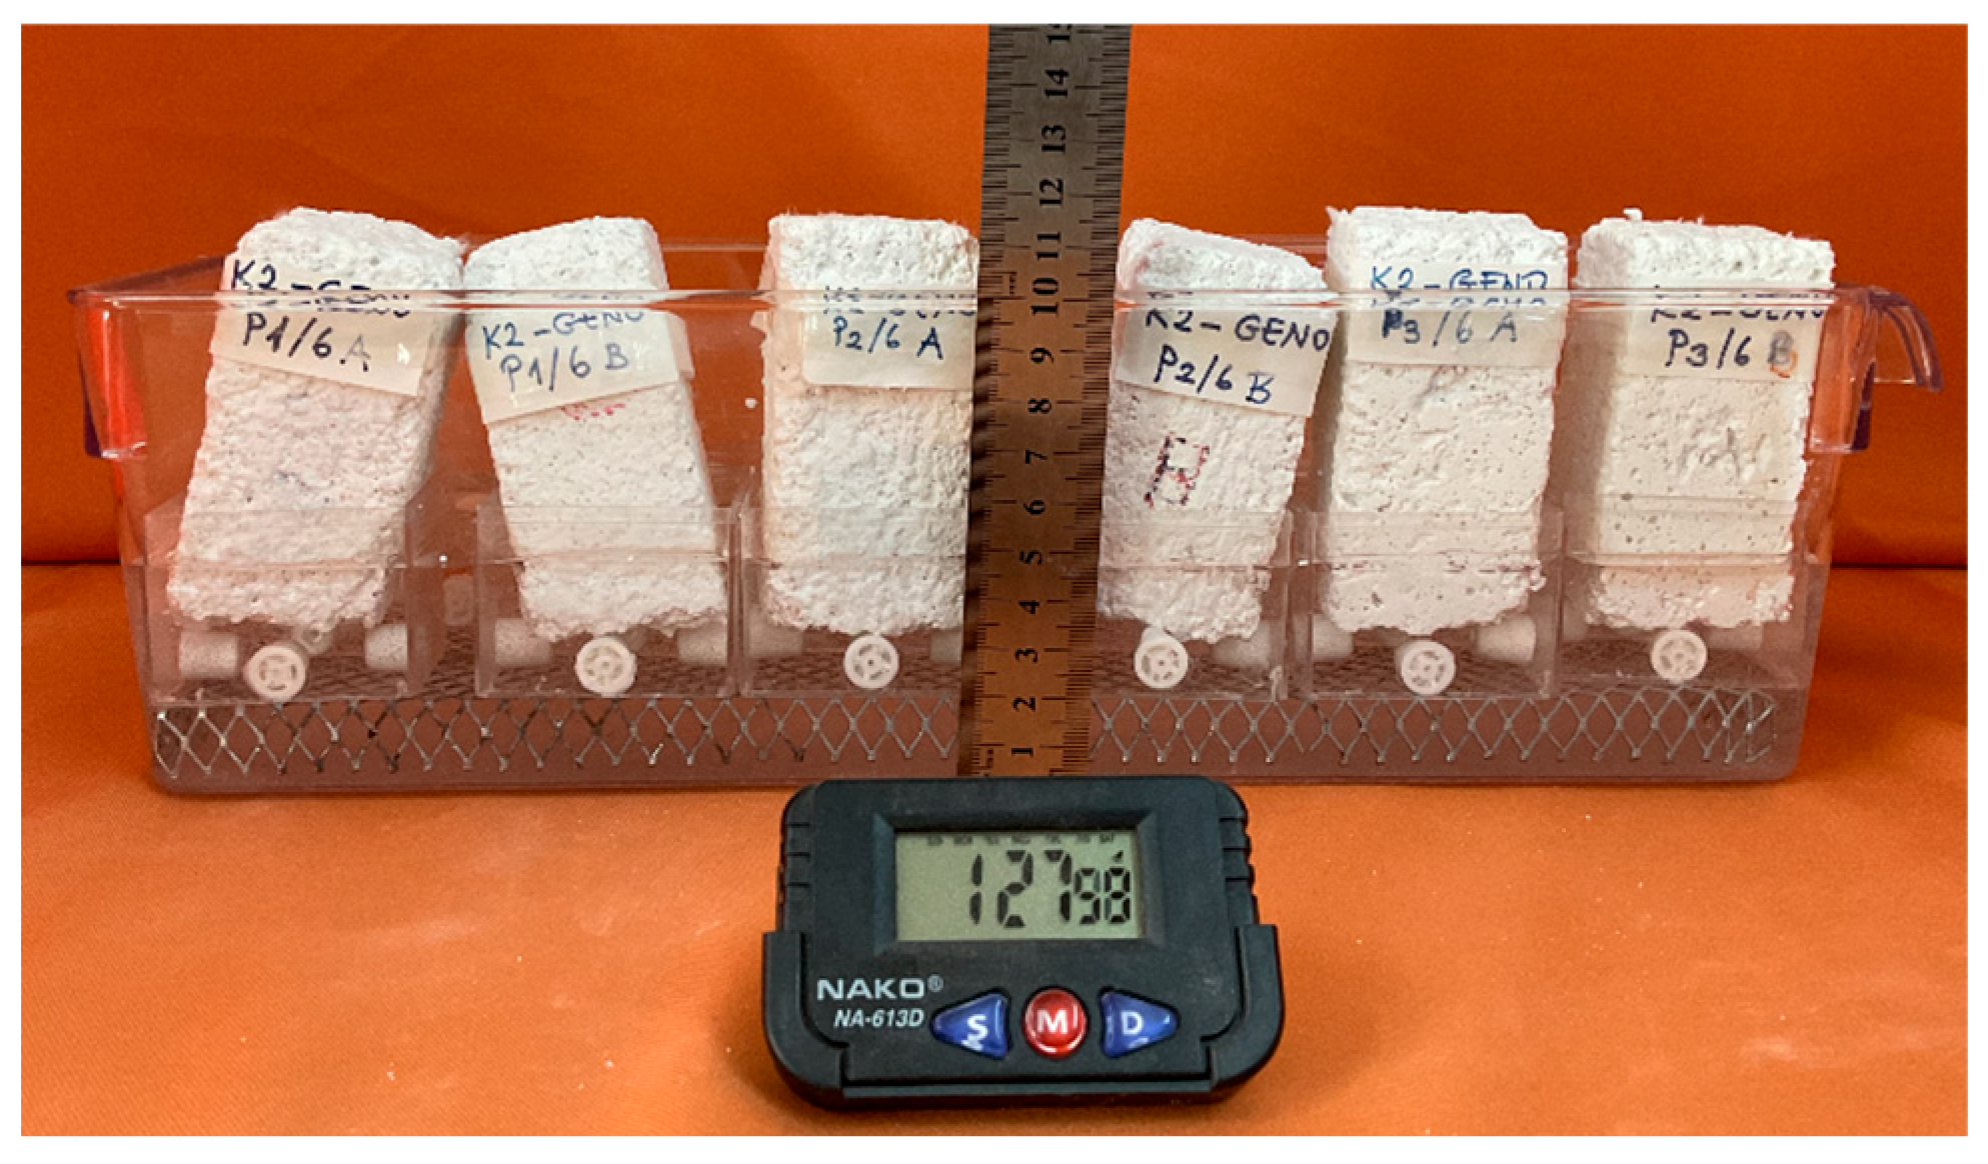
Before mixing SCP and SFP aggregates into mortar combinations, they were placed inside a 100 mL measuring tape filled with colored water so that the amount of capillary water absorption and slump could be clearly seen without changing its density and their slump and capillary water absorption amounts were observed after 20 h. After 20 h, both slump and capillary water absorption become stable. As seen in Figure 3, at the beginning, the amount of dry EP was shown as HEP (20 mL/5.60 cm2), and the amount of colored water was shown as Hw (80 mL/5.60 cm2). After 20 h, the state in which EP slumped into stagnant water was referred to as “δGP: slump amount of EP (mL/cm2)”, and the colored water that passed into the EP without causing slump was called “βGP: Capillary water absorption amount of EP (mL/cm2)”. The measurement units for slump and capillary water absorption amounts are determined as mL/5.60 cm2, to be valid not only for this measurement tape but also for all cases (based on a measuring tape diameter of 2.67 cm).
As seen in Table 2, the slump grouping of the samples coated with SA at different coating/EP ratios and with a coating time of 5 min was performed. In Group 1, ECP was coated with 0.1% to 0.5% SA for 5 min, while in Group 2, ECP was coated with 1% to 5% SA for 5 min. The control sample for Group 1 and Group 2 was uncoated ECP. In Group 3, EFP was coated with 0.1% to 0.5% SA for 5 min, while in Group 4, EFP was coated with 1% to 5% SA for 5 min. The control sample for Group 3 and Group 4 was uncoated EFP.
While creating SEP types, six 100 mL tape measures were filled with water mixed with 80 mL of paint in order to determine the amount of slump and capillary water absorption, and SCP and SFP samples were added to this stagnant water, 20 mL each, for 5 different SA coating/EP ratios. The stopwatch was started while the first sample was poured.

2.3. Mixture Design for Mortar

In this study, the mortar with ECP was called the Coarse Mortar (MC), and the mortar with EFP was called the Fine Mortar (MF). The ten different mixture combinations were prepared using ECP coated with different percentages of SA for Group 1 and Group 2. Additionally, one control sample was produced using ECP. Similarly, the ten different mixture combinations were prepared using EFP coated with different percentages of SA for Group 3 and Group 4, and a control sample using EFP. The codes for the mixture combinations are shown in Table 3.
Since the initial results from the experiments conducted on a total of 22 samples showed almost identical values, the second phase of experiments was conducted only on samples with 0.1%, 0.3%, 0.5%, 1%, 3%, and 5% SA ratios. Therefore, the results from a total of 14 samples were used. The mixture contents for Group 1, Group 2, Group 3, and Group 4 are presented in Table 4.

2.3.1. Determination of Fresh Mortar Consistency

The determination of fresh mortar consistency was carried out according to the EN 1015-3 standard [46], and the flow values defined in this standard were used (Figure 4). In addition, according to this standard, the experiments were repeated twice, and each mixture was mixed with a trowel for 5–7 min to preserve the coating properties.

2.3.2. Determination of the Compressive Strength

In accordance with the EN 1015-11 [47] compression and flexural strength test standard, a total of 66 samples were prepared, 3 samples for each mixture. The prepared samples were kept in the molds for 2 days (at 95% ± 5% relative humidity) at a temperature of 20 °C ± 2 °C specified in the standard. After being removed from the mold, they were left in an environment of 95% ± 5% relative humidity (for 5 days) and then cured for 21 days in an environment of 65% ± 5% relative humidity (at 20 °C ± 2 °C temperature). A climate chamber was created to provide these environmental conditions. The test samples were dried in an air circulating oven at 60 °C ± 5 °C until they reached a constant mass.
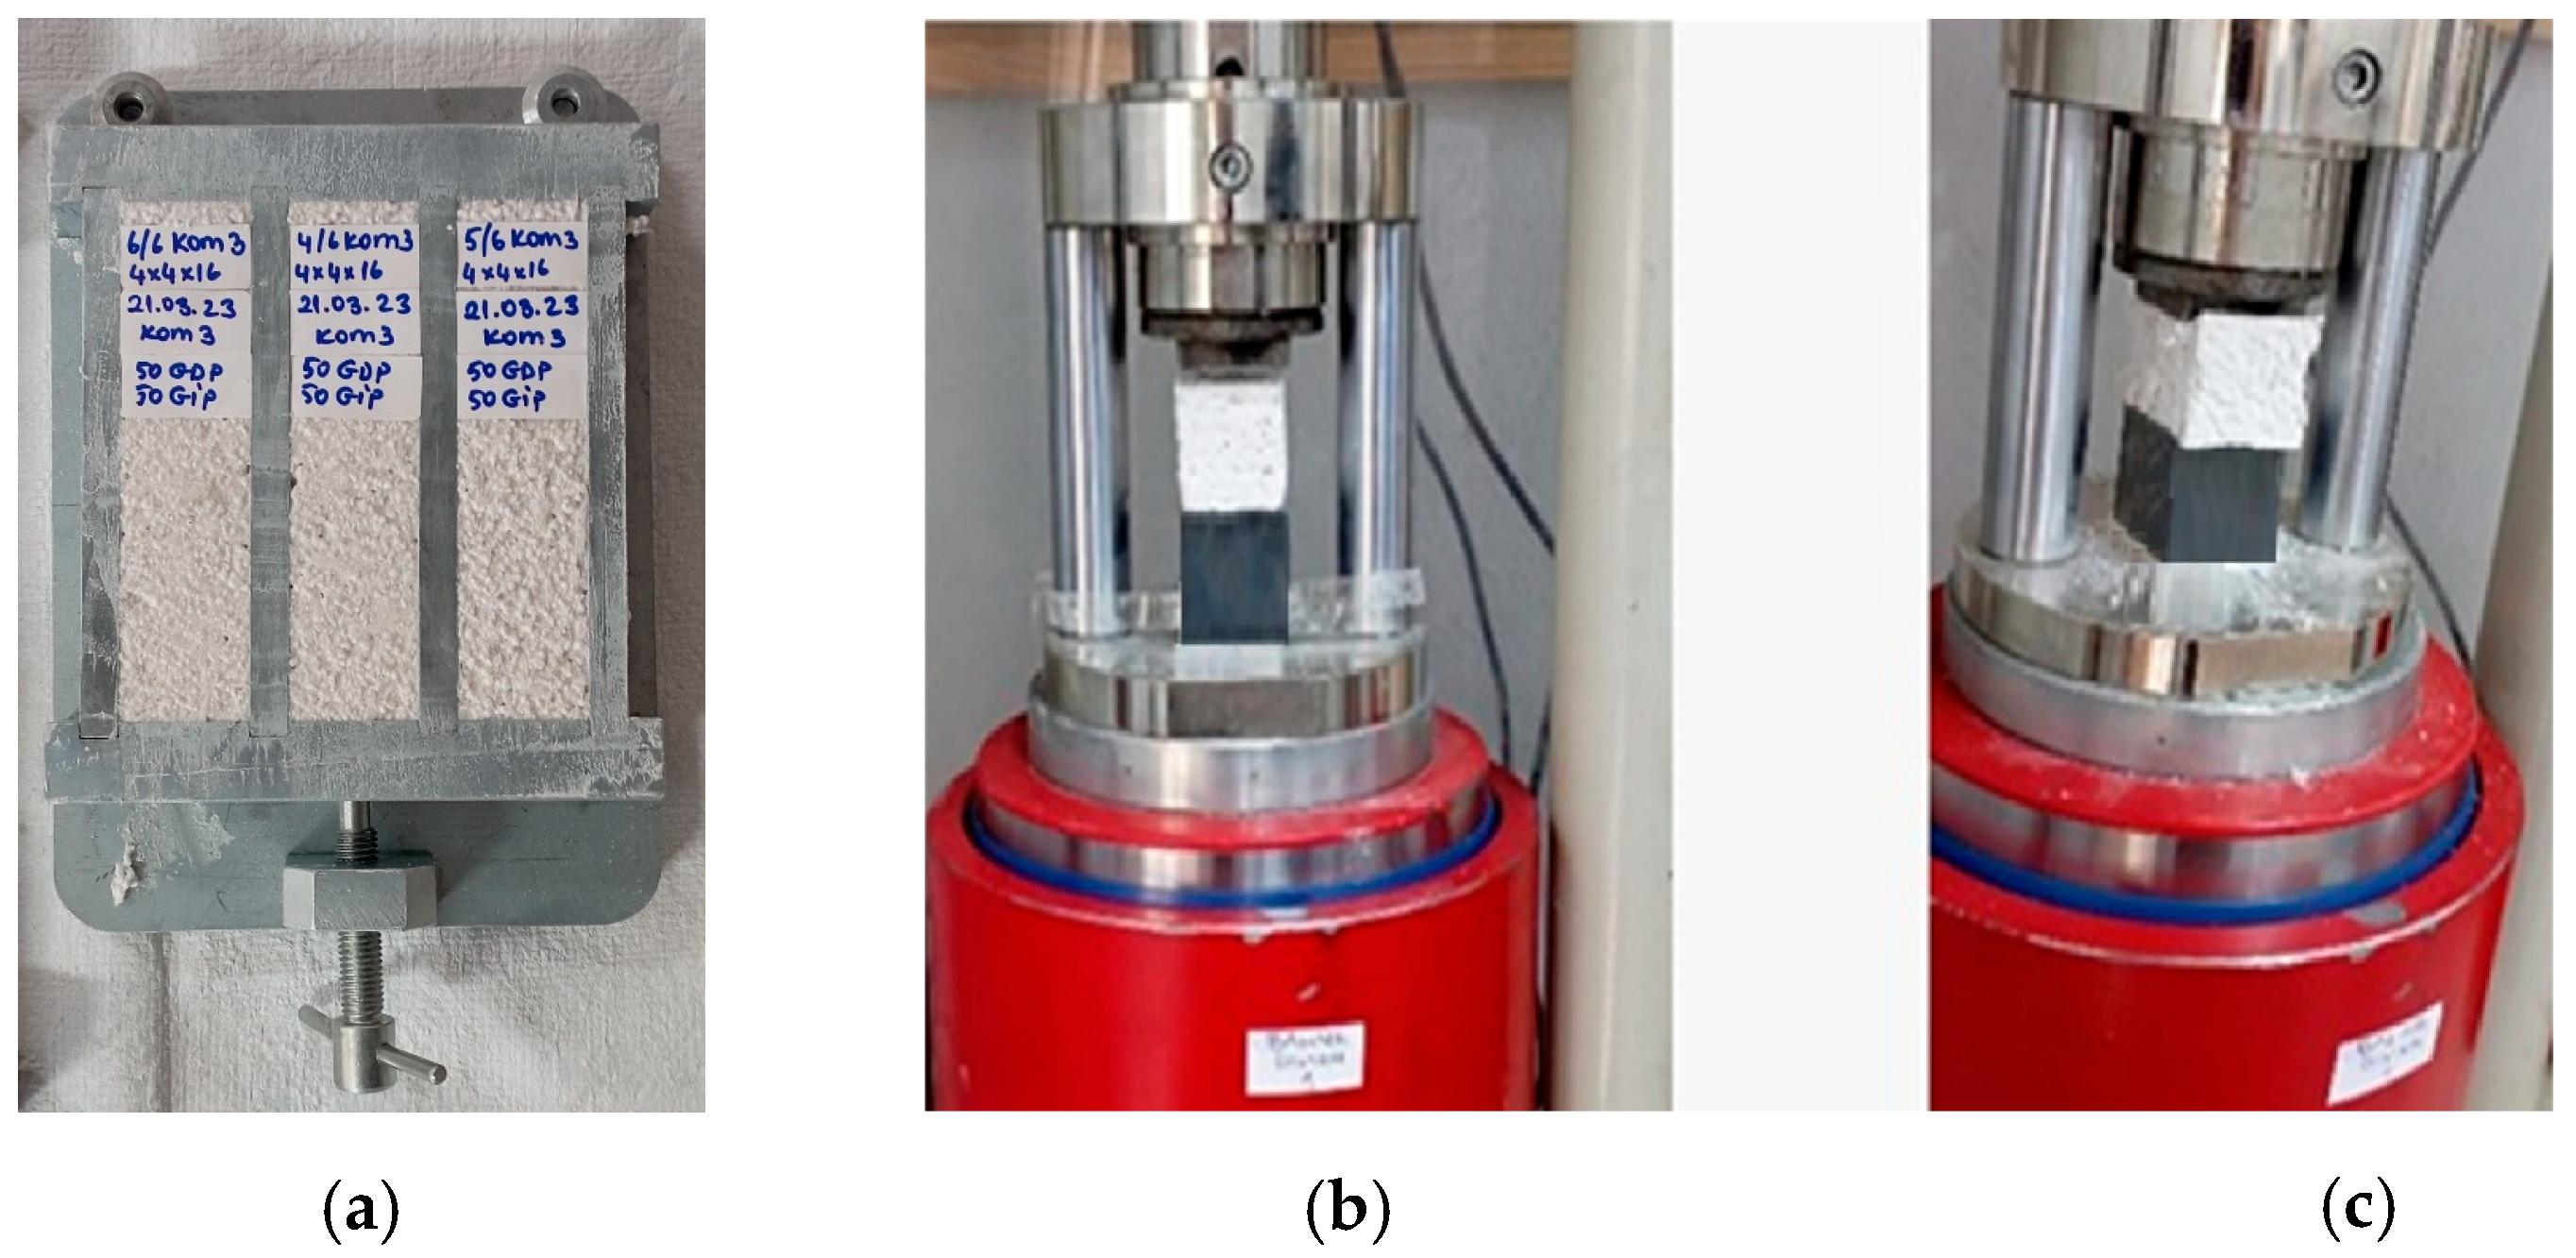
The prismatic sample removed from the mold (Figure 5a) was placed approximately 160 mm ± 1 mm from the edge, with the loading heads in contact with the top and bottom surfaces. For testing, the sample was positioned with its long axis perpendicular to the loading direction. Then, the maximum force applied to the sample was recorded, and the fracture of the sample was noted.
TMM-2560 compression and tensile strength testing press (250/50 kN) was used for the compressive strength test. The 40 mm × 40 mm × 40 mm ± 1 mm cubic samples were loaded without sudden impact for a period of 30 to 90 s. The loading rate was between 50 N/s and 500 N/s, and the load was applied continuously at this rate until the sample fractured. According to this standard, the experiments were repeated six times. The compressive strength of each sample was recorded to the nearest 0.05 N/mm2. The average strength was then calculated and rounded to the nearest 0.1 N/mm2 (Figure 5b).

2.3.3. Capillary Water-Absorption Test

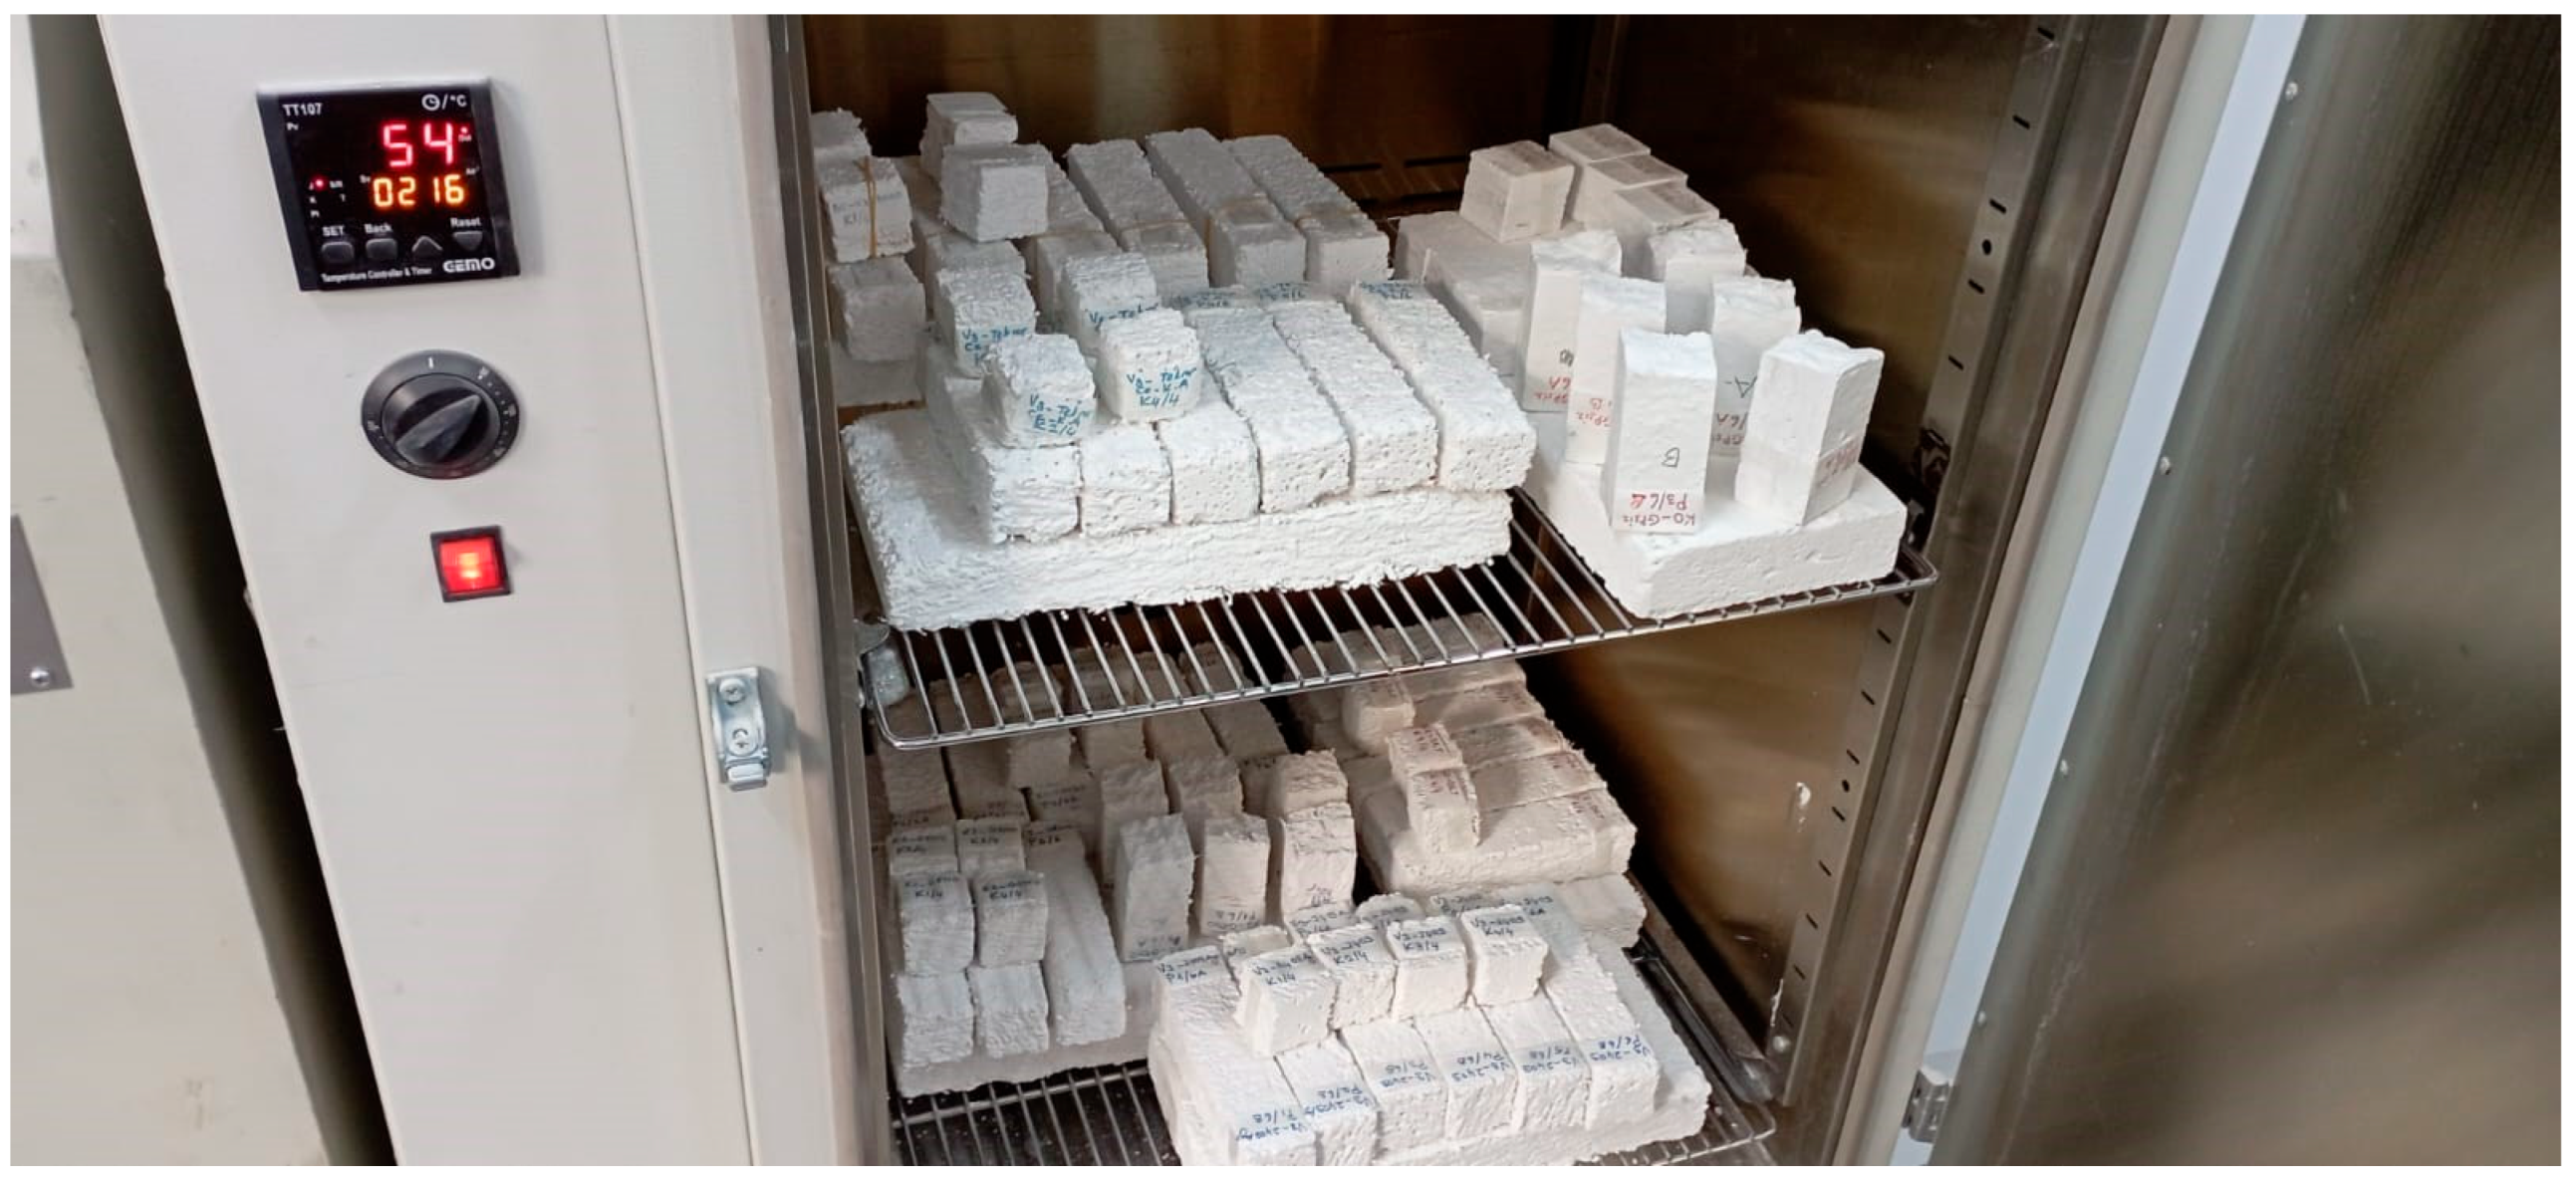
A total of 66 samples of the same dimensions were prepared according to the EN 1015-18 [48] capillary water-absorption standard. Curing was performed as specified in Section 2.3.2. Figure 6 shows the air-circulating oven.
According to the EN 1015-18 standard, the difference between the masses determined by weighing at 24 h intervals during drying was less than 0.2% of the total mass. The four long faces of the cured samples were sealed with paraffin to ensure they were leakproof, as shown in Figure 7a. The samples were then cut into two pieces (approximately 80 mm) and prepared for testing (Figure 7b).
The samples were placed on four supported legs, with the fractured surfaces of the prisms facing downwards, and plunged to a depth of 5 mm to 10 mm, making sure they did not touch the bottom of the tray. The samples were kept in water throughout the test period (Figure 8). According to the EN 1015-18 standard, these tests were repeated six times for each mixture.
The capillary water-absorption coefficient (C) was defined as the slope of the line formed by connecting the points representing the measurements taken at the 10th and 90th minutes with a straight line on the graph and was given in Equation (1) [48]:
C = 0.1 M 2 M 1
where
M1: Mass of the sample after 10 min (g);
M2: Mass of the sample after 90 min (g).

2.3.4. Thermal Conductivity Measurement

The determination of thermal properties of the samples was carried out in accordance with the TS EN 1745 standard [49]. Thermal conductivity measurements were conducted using the Quick Thermal Conductivity-500 (QTM-500) thermal conductivity testing machine with a PD-11 sensor probe (Kyoto Electronics Manufacturing Co., Ltd., Tokyo, Japan) (Figure 9).
Before all experiments, calibration measurements of the device were performed, and then the test started, and each sample was measured automatically for 60 s. The measurement of the thermal conductivity coefficient of the reference plate (0.035 “W/mK”) for the calibration of the QTM-500 device with the PD-11 probe is shown in Figure 9. This device operates within a measurement range of 0.023–11.63 ± 5% “W/mK” using the hot wire system.
With the hot wire method, the commonly applied sampling method is to fix the probe between two pieces of sample material. However, when using PD-11, only one sample piece is required. Thermal conductivity, λ, is determined using Equation (2) [50]:
λ = K × I 2 × ln t 2 t 1 T 2   T 1   H  
where
λ: Thermal conductivity coefficient (W/mK);
I: Heater current (A);
t1, t2: Time after heating started (t1 = 30 s and t2 = 60 s);
T1: Temperature at t1 (°C);
T2: Temperature at t2 (°C).
For the PD-11 probe, the K and H constants were selected as 1 and 0, respectively, for samples with a thermal conductivity less than 0.2 “W/mK”. Calibration was performed with a sensitivity of 0.036 ± 5% “W/mK” by entering the K and H values after the device was started and measuring the reference sample. Measurements were performed at a specified ambient temperature between 10 °C and 20 °C, with a tolerance of ±5 °C. After each measurement was completed, the heated wire was balanced on a cooling plate. For each new sample, the process was repeated by measuring the reference sample.
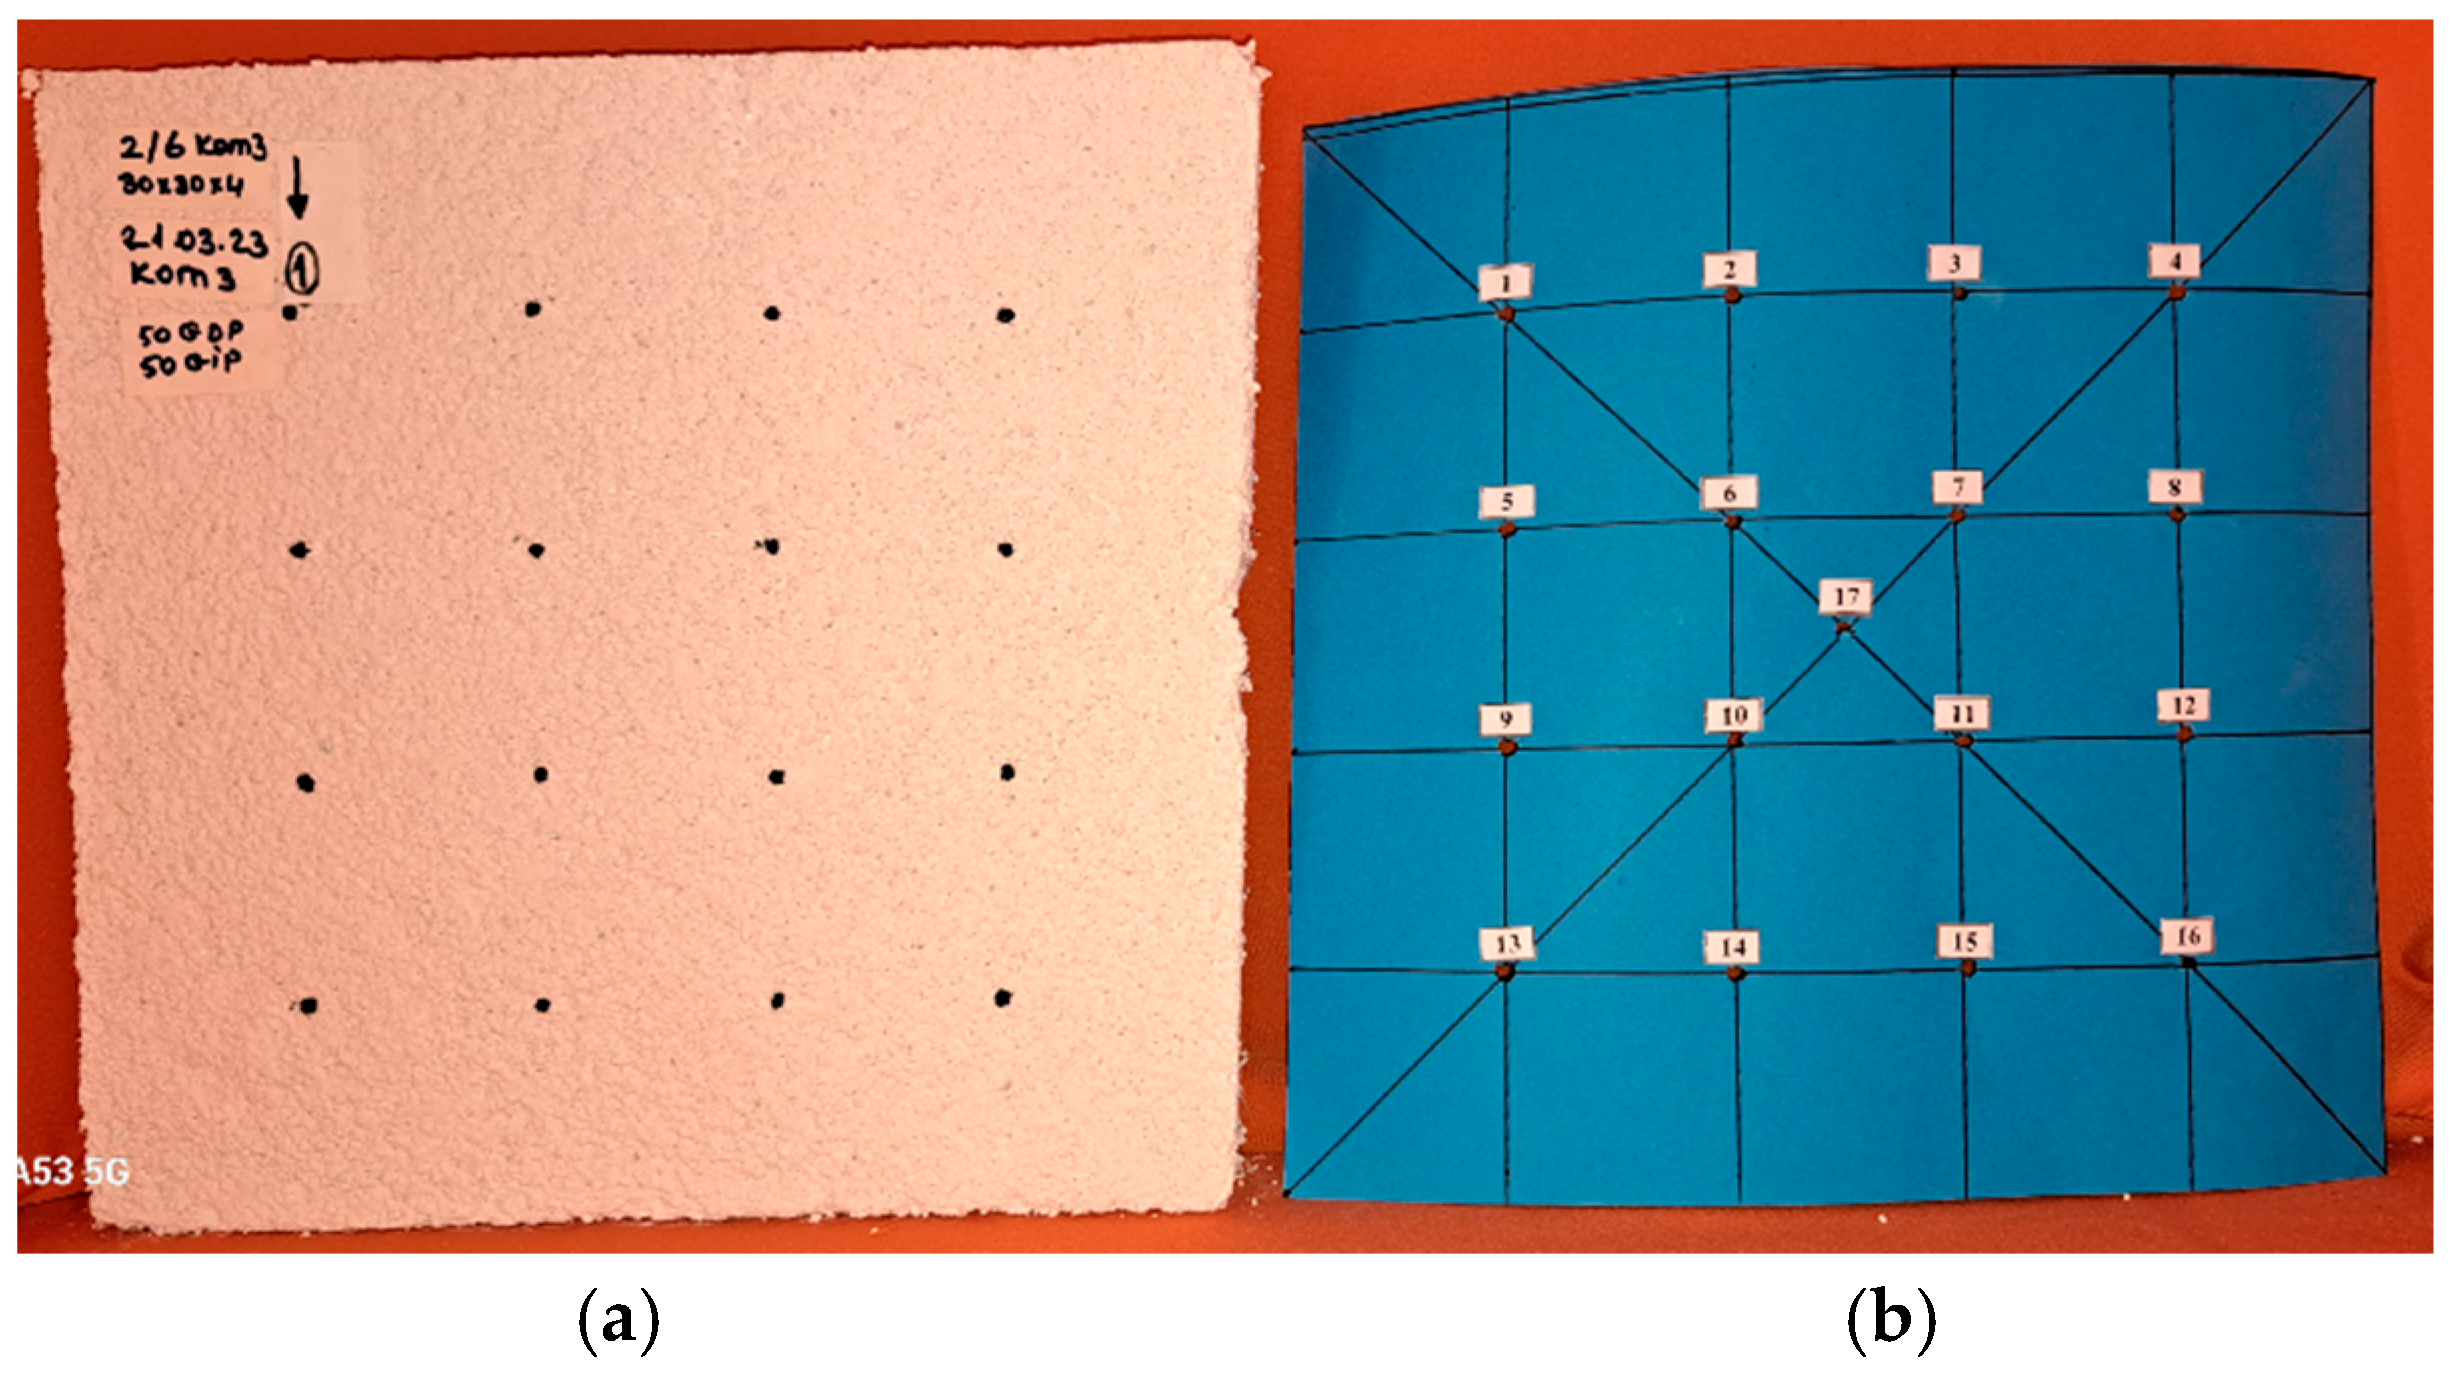
Figure 10 shows the thermal conductivity measurement method, consisting of a marked sample and a marking pattern.
As seen in Figure 10, 16 different measurement points were evaluated, and the statistical accuracy analysis of experimental data was performed based on specific confidence intervals and the t-factor for multiple measurements. This method was determined to be the most suitable approach for statistical evaluation of analytical data and investigation of errors. In addition, a total of 66 samples with dimensions of 300 mm × 300 mm × 50 mm were prepared to determine the thermal conductivity coefficient according to Equation (2), and the samples were marked (Figure 10a) using a marking pattern (Figure 10b) of the same dimensions.

3. Results and Discussion

3.1. Performance Analysis for Coated EP

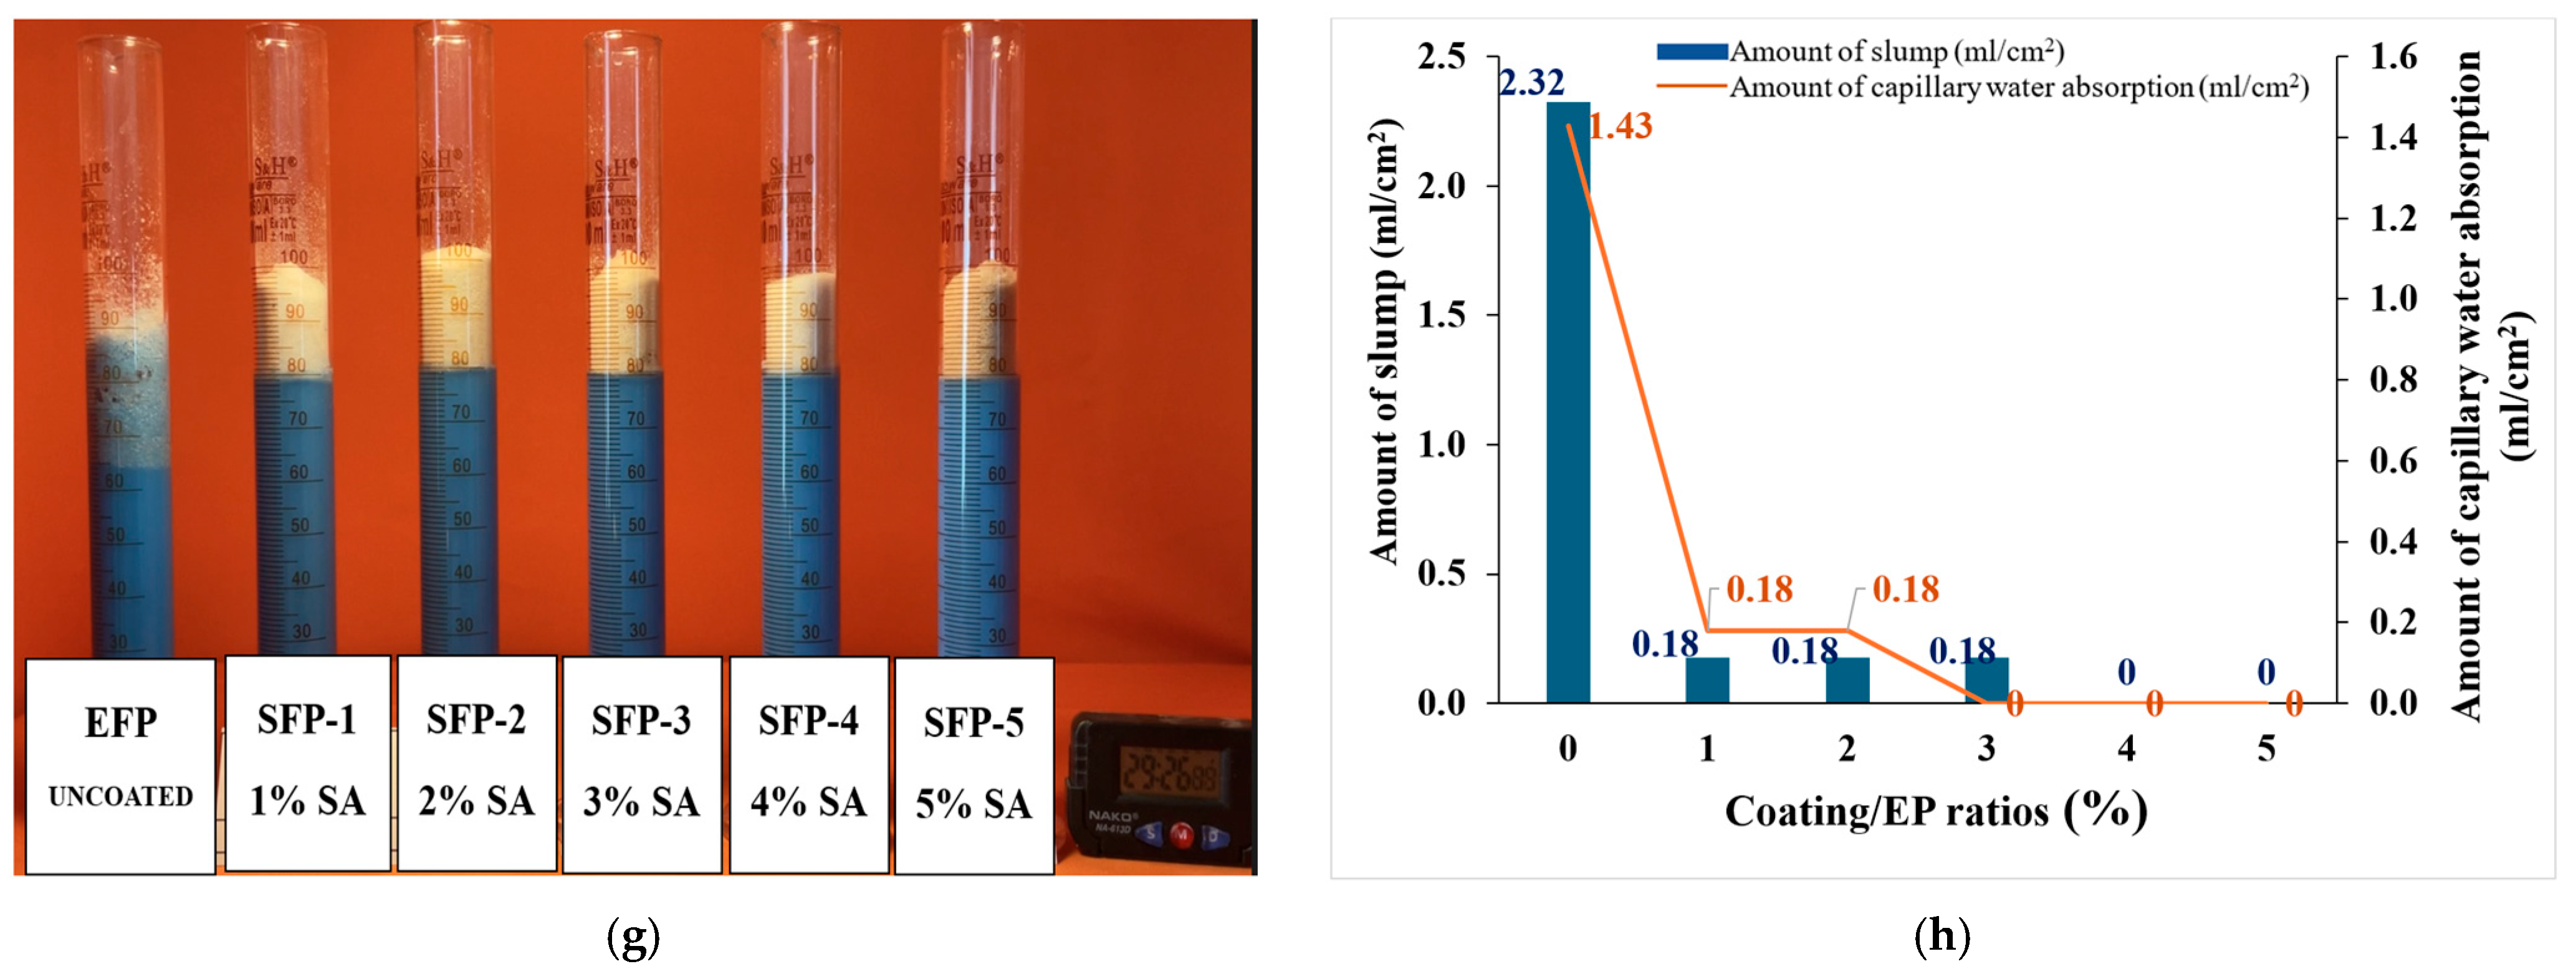
The analysis results regarding the water-repellent performance for Group 1, Group 2, Group 3, and Group 4 are shown in Figure 11a,c,e,g. In addition, the changes in capillary water absorption and slump amounts according to different coating percentages by weight are illustrated in Figure 11b,d,f,h. That is, the slump and capillary water-absorption values in Figure 11b were obtained from the 20 h images in Figure 11a. The same relationship applies to the images in Figure 11c–h.
As seen in Figure 11a, for Group 1, the lowest slump amount was obtained at SCP-0.5 compared to the uncoated sample. Additionally, for Group 2, the best water repellency was observed between SCP-2 and SCP-5 (Figure 11c). For Group 3, the best water repellency was obtained at SFP-0.5 (Figure 11e), and for Group 4 no slump was observed between SFP-4 and 5 (Figure 11g).
The experimental findings of water-repellent performance analysis were evaluated in two stages: In the first stage, the slump and capillary water absorption amounts of ECP were compared with those of the SCPs in Group 1 and Group 2, as well as with the EFP in Group 3 and Group 4. In the second stage, the slump and capillary water absorption amounts of SCPs and SFPs with the same coating/EP ratios were compared between Group 1 and Group 3 and between Group 2 and Group 4.
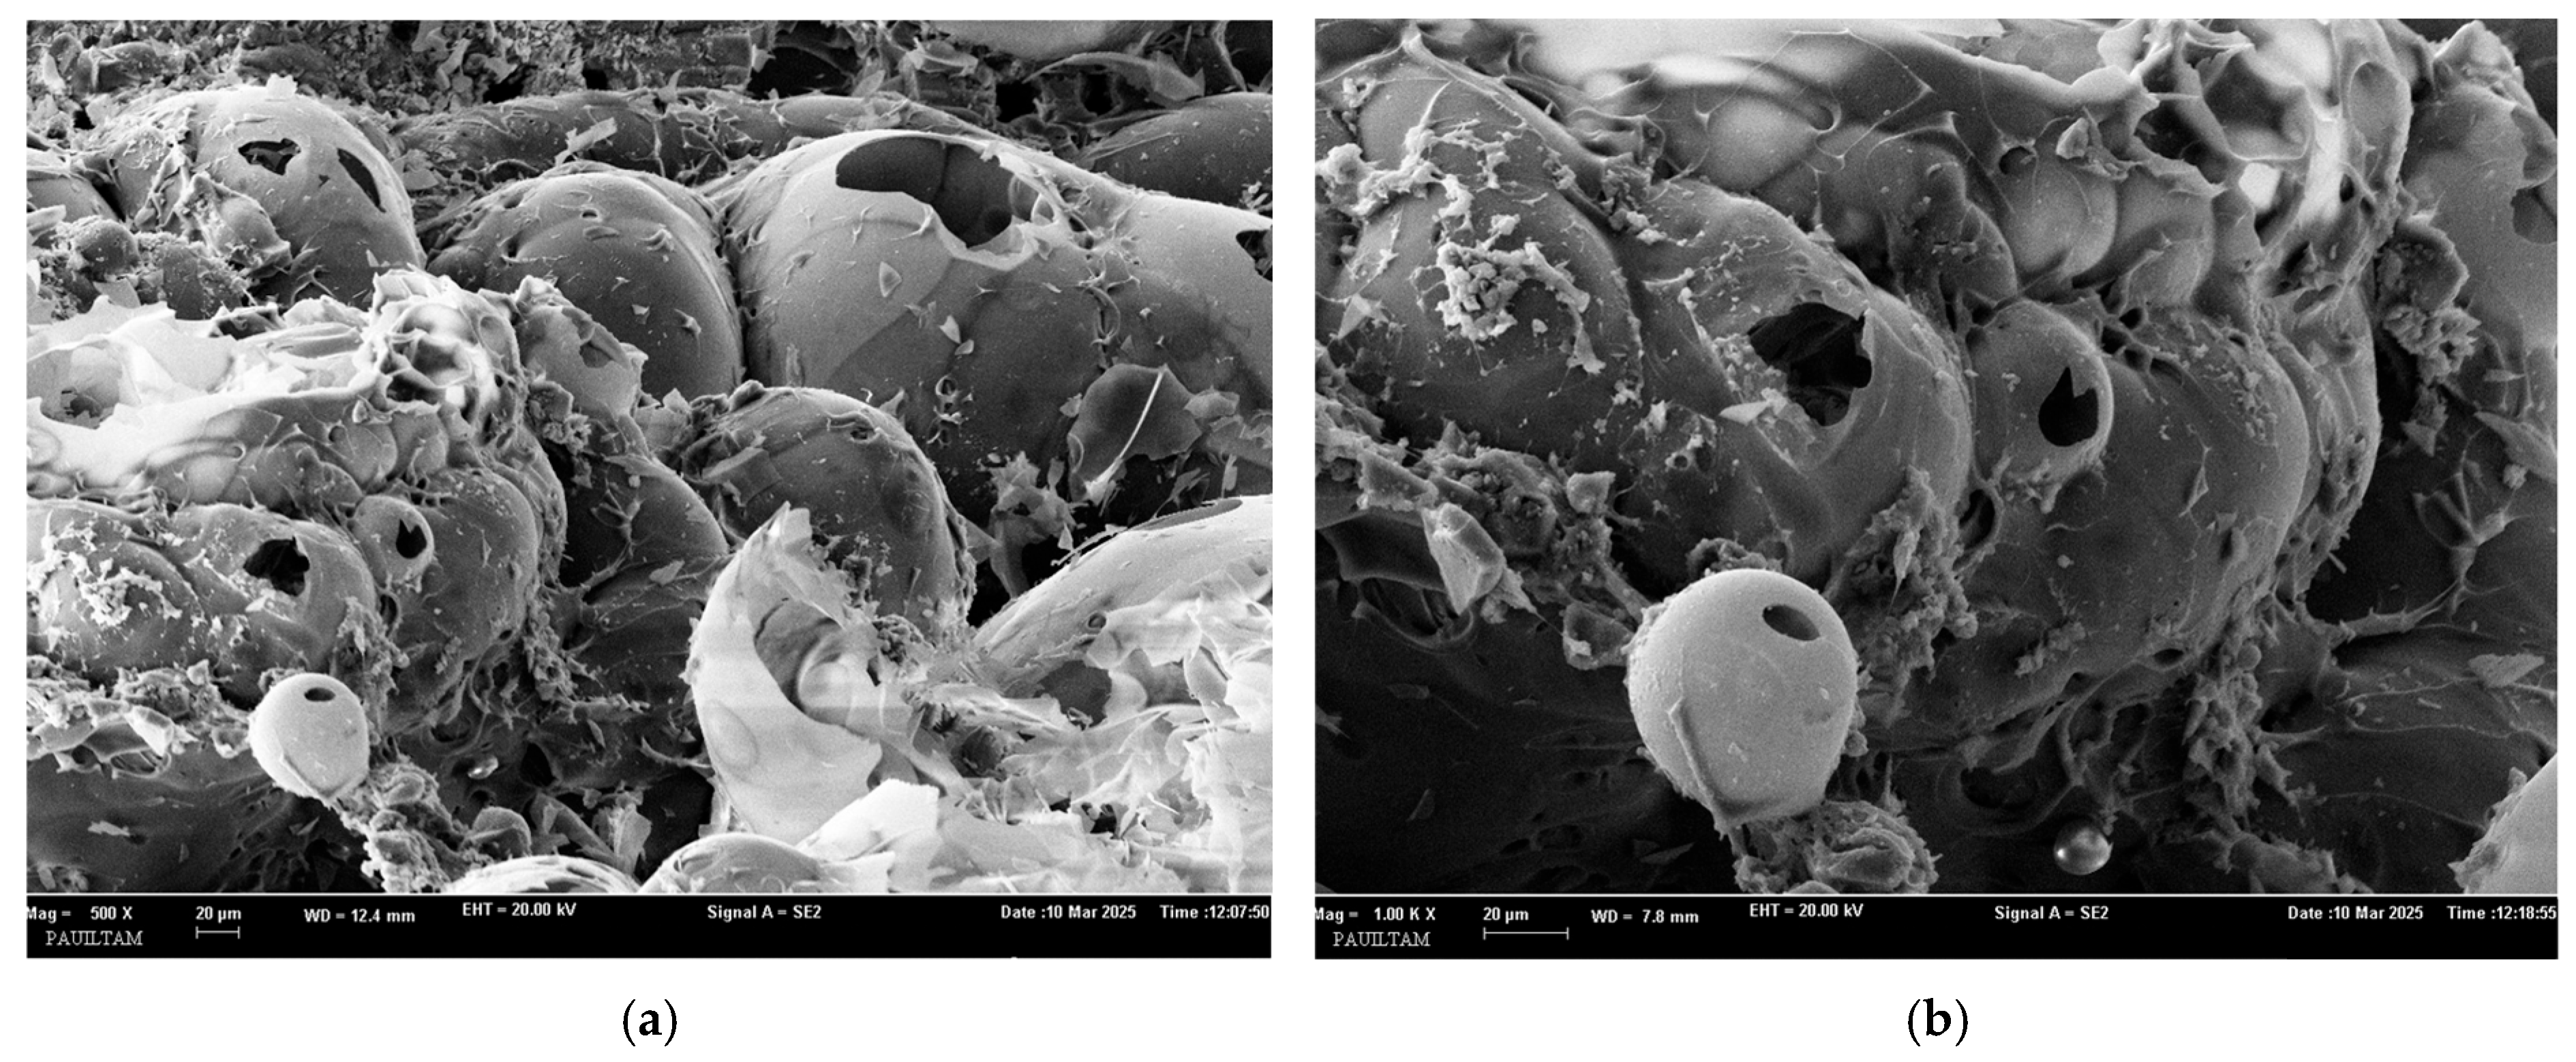
Within the scope of this study, Scanning Electron Microscope (SEM) analyses of uncoated and coated EP particles were carried out, and the SEM analysis images of the uncoated EP with 500× and 1000× magnifications are shown in Figure 12a and Figure 12b, respectively.
For the uncoated EP, each expanded grain appears to have a high degree of open porosity and a spherical shape after expansion (Figure 12). As seen in Figure 12b, the grain surface exhibits melting levels that can be partially assessed as being dependent on the expansion temperature. Additionally, the aggregate skin thicknesses after expansion exhibit a very thin and brittle structure.
SEM images of EP after coating with 5% SA at 250× and 1000× magnifications are shown in Figure 13a and Figure 13b, respectively.
The EP coated with 5% SA appears to have lost its spherical form due to the partial brittleness of the expanded aggregate after coating, resulting in all aggregates becoming open porous. However, due to the coating, a film layer of coating material was formed on all surfaces, providing complete coating performance (Figure 13). This feature can be seen more clearly in the SEM image at 1000× magnification (Figure 13b). In addition, the surfaces of each internal layer in the perlite structure after expansion are also observed to be coated. This feature shows that EP will resist high levels of water permeability after coating.

3.1.1. Comparative Analysis of Slump and Capillary Water Absorption Amounts for Coated and Uncoated EP Particles

As seen in Figure 11b,d, the slump amount of ECP for Groups 1 and 2 is 2.14 mL/cm2, while that of EFP for Groups 3 and 4 is 2.32 mL/cm2 (Figure 11f,h). In both groups, ECP and EFP were completely slumped in standing water. The difference between the amounts is considered to be due to the higher density of EFP compared to that of ECP. It was also observed that ECP, which has a porous structure, was in a higher position than EFP.
The slump amount decreased to 0.36 mL/cm2 for samples SCP-0.1 to SCP-0.4 and to 0.18 mL/cm2 for SCP-0.5 and SCP-1. In other words, there was an improvement of 83.2% and 91.6% in water-repellent performance, respectively (Figure 11b,d). For the SCP-2 to SCP-5 specimens, no slump was observed, and there was a 100% improvement (Figure 11d). Additionally, for SFP-0.4 and SFP-0.5 the slump amounts decreased to 0.36 mL/cm2 and 0.24 mL/cm2, respectively, indicating an improvement of 84.5% and 89.7% in water-repellent performance (Figure 11f). However, although the slump amounts for SFP-0.1, SFP-0.2, and SFP 0.3 were quite high compared to the others, their water-repellent performances were still significantly improved by 38%, 54%, and 62%, respectively, decreasing to 1.43 mL/cm2, 1.07 mL/cm2, and 0.89 mL/cm2 (Figure 11f). Similarly, as shown in Figure 11h, a slump amount of 0.18 mL/cm2 was obtained for the samples between SFP-1 and SFP-4, indicating an improvement of 92.2%. At the same time, no slump was observed for SFP-5. This means 100% improvement in water-repellent performance (Figure 11h).
The changes in capillary water absorption amounts for different coating/EP ratios of all investigated groups exhibit approximately similar behaviors to the changes in slump amounts. EP particles are materials with a high water absorption amount due to their bulk density. In other words, they exhibit a high slump amount (δGP). In addition, the capillary water absorption amount (βGP) of these uncoated ones is also high. However, as seen in the obtained results, both slump and the capillary water absorption amounts decreased in the coated cases. This is thought to be due to the change in bulk density (i.e., the change in the hydrostatic pressure behavior it exerts).

3.1.2. Comparative Analysis of Slump and Capillary Water Absorption Amounts Between Coarse and Fine EP Particles

By comparing the slump amounts for Group 1 and Group 3 at the same coating/EP ratios, the following results were obtained: As seen in Figure 11b,f, at a 0.1% coating/EP ratio, the slump amounts were 0.36 mL/cm2 and 1.43 mL/cm2, corresponding to a 74.8% difference. For 0.2%, these values were 0.36 mL/cm2 and 1.07 mL/cm2 (66.4% difference), and for 0.3%, they were 0.36 mL/cm2 and 0.89 mL/cm2 (59.6% difference). At a 0.4% coating/EP ratio, both groups showed identical slump amounts of 0.36 mL/cm2 (0% difference), while at 0.5%, the amounts were 0.18 mL/cm2 and 0.24 mL/cm2 (25% difference). For a 1% coating/EP ratio, the slump amounts for both groups were identical at 0.18 mL/cm2 (Figure 11d,h). Beyond this, at 2%, 3%, and 4% coating/EP ratios, Group 4 maintained a slump amount of 0.18 mL/cm2 (Figure 11h), while no slump was observed in Group 2 (Figure 11d). As a result, at a 5% coating/EP ratio, no slump was observed in any group. In other words, 100% water repellency was achieved. According to the results obtained, high performance was determined for SCPs in terms of water-repellent behavior even at low coating/EP ratios (0.1–0.5%). However, better performance was obtained for Group 2 and Group 4 in terms of water repellency. According to the obtained results, it was observed that SCP and SFP exhibited hydrophobic behavior when compared to ECP and EFP. In other words, water absorption, which is an undesirable property, was significantly reduced when coated with SA, and even SCP showed almost no water absorption behavior at coatings above 2%. These findings will provide valuable contributions to both industrial applications and the literature on SEP.
Moreover, in this study, unlike in the literature, findings regarding the water-repellent performances of very low coating/EP ratios were also obtained.

3.2. Analysis of Mixture Compositions of Coarse and Fine Mortars

In this study, the relationship between the bulk densities and water/solid ratios of powder mixtures, as well as of fresh and hardened mortars coated with different coating/EP ratios for both fine and coarse mortars, as shown in Table 5, was investigated. Fresh mortar was mixed by hand, the measurements were taken on the flow table according to the EN 1015-3 standard [46], and the water content was gradually adjusted to reach a constant flow diameter of 160 mm. To determine the bulk density of powder, the mortar components before water was added were placed in a graduated cylinder, and their masses were measured. The bulk density of the mortar components was then determined based on the powder volume in the cylinder after the cylinder was shaken 10 times.
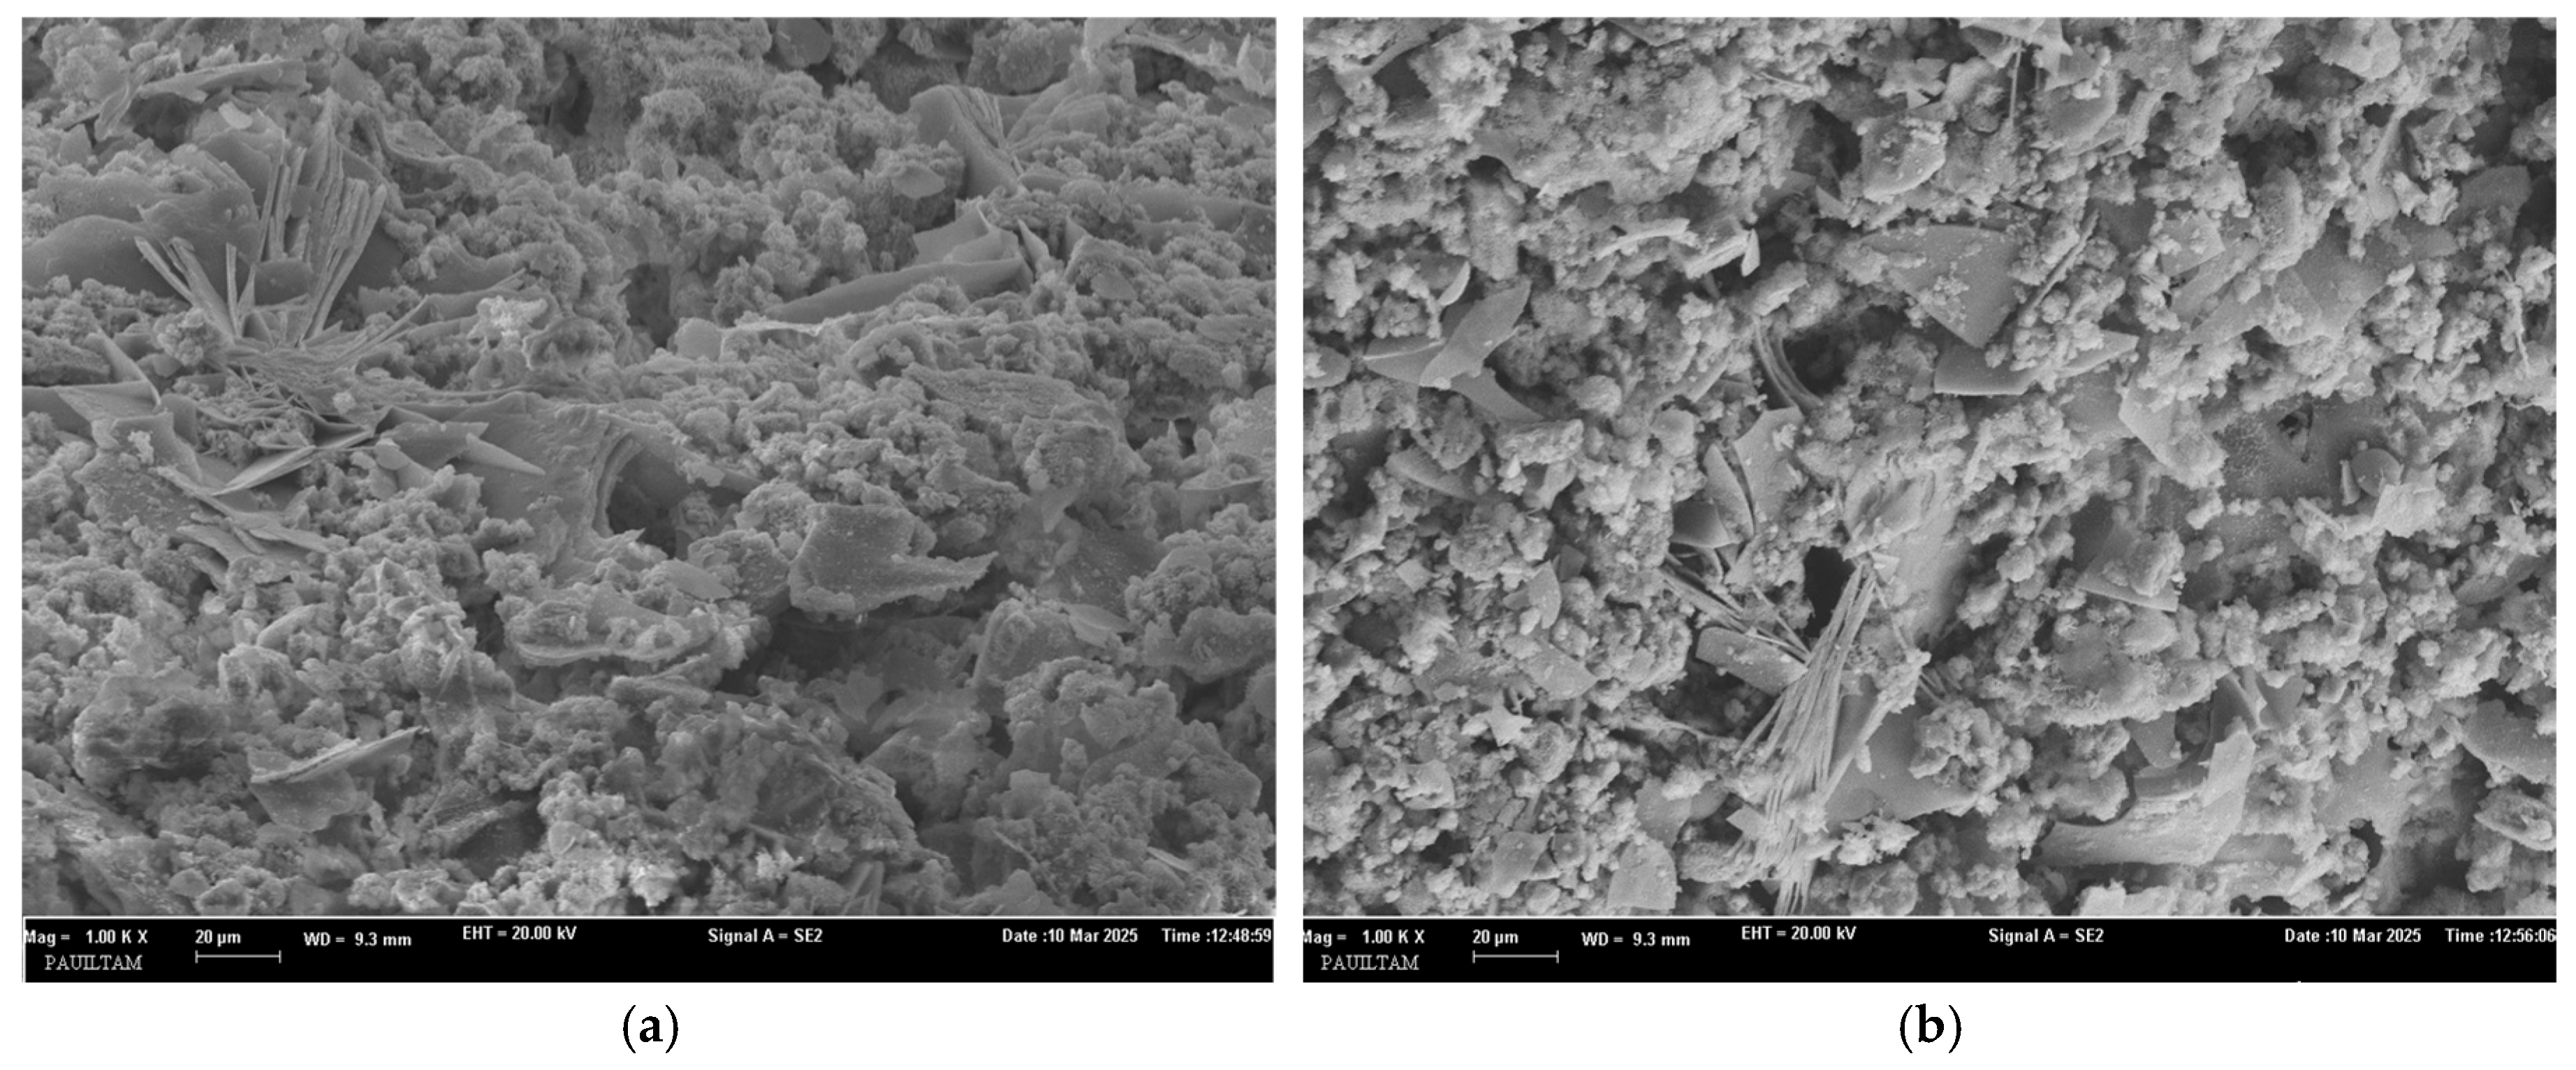
MC and MF mortars were imaged using SEM analyses, and the SEM images are shown in Figure 14.
The use of coarse perlite, along with the fact that the perlite was coated, was observed to have no negative effect on the matrix structure after hydration. Additionally, it was seen that the coated perlite aggregates were distributed throughout the structure in the form of lamellar shapes (Figure 14a). Similarly, it was observed that fine perlite, after coating, exhibited a higher degree of lamellar dispersion within the mortar matrix compared to coarse perlite. Accordingly, the matrix structure demonstrated a lower level of porosity. This indicates that the material density can be achieved at a relatively higher level (Figure 14b). On the other hand, no adverse effect of the coating material on the matrix structure was observed after the completion of cement hydration. In both matrix structures, it is evident that the high dispersion density of the coated material components can be anticipated to have a positive effect on enhancing the water-repellent performance of the mortar.
As the coating/EP ratio increased, the bulk density of the powder mixture also increased. This shows that most of the SA is adsorbed onto EP in the evaporation process, and therefore efficient results are achieved with the coating method used. In addition, as the coating/EP ratio increased, both the water/solid ratio and the bulk density of fresh mortar decreased for both MCs and MFs, while the powder mixture density and bulk density of hardened mortar increased. However, the water/solid ratio of MCs was greater than that of MFs. In addition, both the bulk density of fresh mortar and the bulk density of hardened mortar of MCs were lower than that of MFs (Table 5).
As a result, the increase in the coating/EP ratio decreases the water/solid ratio and increases both the dry powder mixture and hardened mortar densities of the samples. However, at coating/EP ratios of 3% and above, the increase in the bulk density of hardened mortar is limited to a certain level, and no further increase can be achieved. This finding shows that the coating/EP ratio loses its effect on the bulk density of hardened mortar after this value. Therefore, the maximum coating/EP ratio that can be applied for the bulk density of hardened mortar has been determined.

3.2.1. Effect of SA Coating on Compressive Strength

One of the type tests required under the EN 998-1 standard [51] is the compressive strength test, which is conducted according to the EN 1015-11 standard. Within the scope of this test, the changes in compressive strengths for different groups according to different coating amounts are shown in Figure 15. Moreover, traditionally used compressive strength-enhancing polymers were not added to the samples used in this study because they exhibit a property that improves water repellency, in addition to their compressive strength-enhancing properties.
While the compressive strength for MC-0 was 0.12 N/mm2, it was 0.13 N/mm2 for MC-0.1 and 0.3, and 0.15 N/mm2 for MC-0.5 in Group 1. Similarly, while it was 0.15 N/mm2 for MF-0, those for MF-0.1, 0.3 and 0.5 were 0.17 N/mm2, 0.18 N/mm2 and 0.25 N/mm2 in Group 3, respectively. That is, the compressive strength of the coated samples increased compared to the uncoated ones. In addition, these findings show that the compressive strength increases as the coating/EP ratio increases (Figure 15). The increase in compressive strength was higher for coating/EP ratios above 1%. In Group 2, the compressive strength reached 0.17 N/mm2, 0.25 N/mm2, and 0.30 N/mm2 for MC-1, 3, and 5, respectively, indicating an increase of 42%, 108%, and 150% compared to MC-0, respectively. In Group 4, the compressive strength of MF-1, 3, and 5 increased by 120%, 140%, and 167% compared to MF-0, respectively. The results indicate that coating has significant effects on compressive strength. Especially, a significant improvement in compressive strength was observed at coating/EP ratios of 3% and above. In other words, coating with SA made a significant contribution to the undesirable fragile structure of EP in terms of strength. As a result, higher strength values were obtained in mortars prepared using coated fine perlite. This is thought to be due to the fact that more surface is covered for the same coverage rate in fine mortars.

3.2.2. Performance Analysis of Water-Repellent Properties

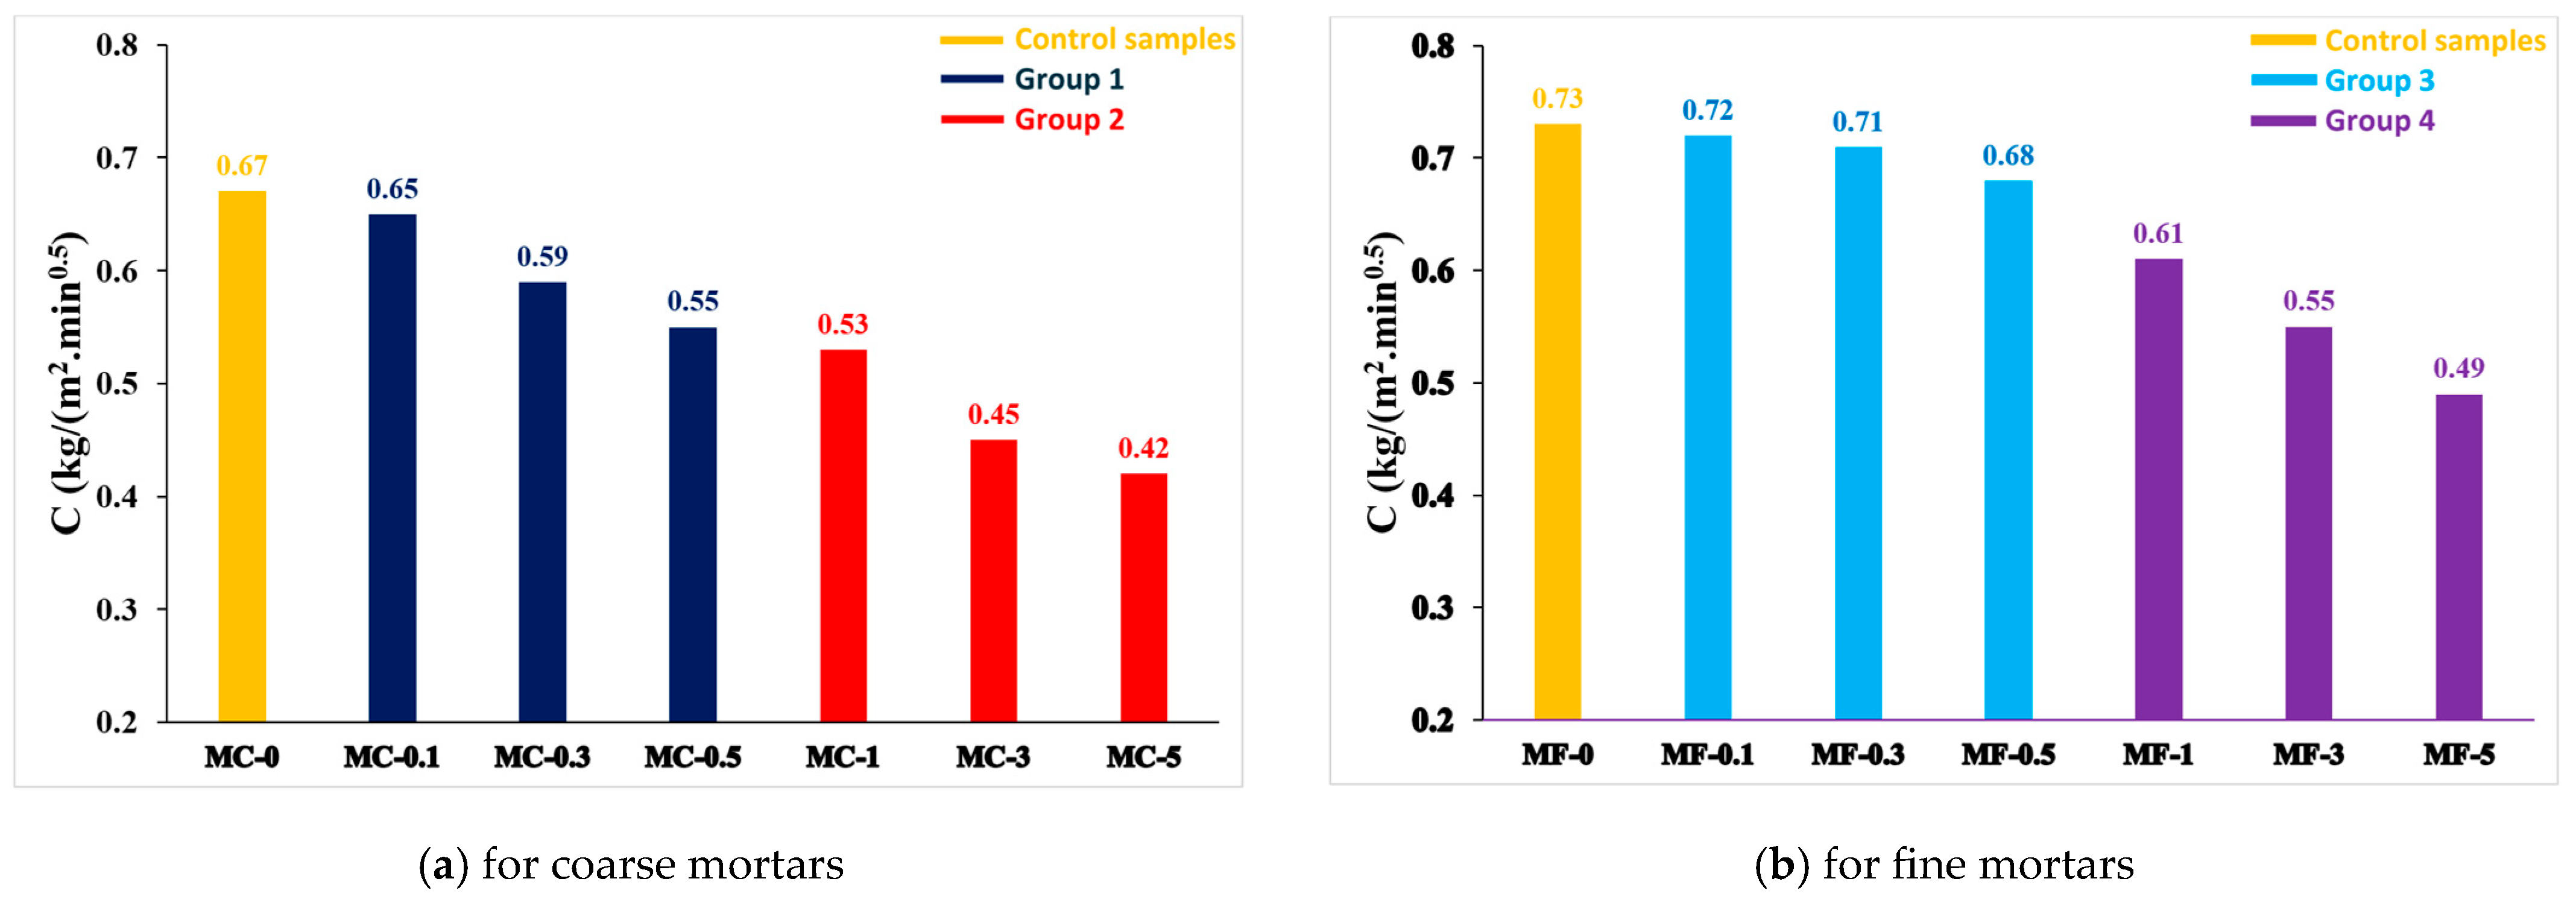
In this study, water repellency performance was determined according to the EN 1015-18 standard. Figure 16 shows the changes in the capillary water-absorption coefficients for MC and MF with different coating/EP ratios.
In order to investigate the effect of the coating/EP ratio on capillary water absorption, uncoated samples were first compared with coated samples for the same group, and then MF and MCs with the same coating/EP ratios were compared
  • Comparative analysis of capillary water-absorption behavior for coated and uncoated mortars
As seen in Figure 16a, when MC-0 was compared with the samples of MC-0.1, -0.3, -0.5 and MC-1, -3, -5, the capillary water-absorption coefficient decreased with the increase in the coating/EP ratio, and thus the water-repellent property improved. In addition, a similar behavior was observed when MF-0 was compared with the samples of MF-0.1, -0.3, -0.5 and MF-1, -3, -5 (Figure 16b). MC-0.1 exhibited a 3% lower water-absorption rate compared to MC-0. This improvement was found to be 12% and 18% for MC-0.3 and 0.5, respectively, and 16%, 25%, and 37% for MC-1, 3 and 5. The capillary water-absorption coefficient of MF-0.1, 0.3, and 0.5 is approximately the same as that of MF-0. However, the capillary water-absorption coefficients for the samples MF-1, 3, and 5 showed an improvement of 16%, 25%, and 33%, respectively.
  • Comparative analysis of capillary water-absorption behavior between coarse and fine mortars
When MC and MF samples were compared for the same coating/EP ratio, it was determined that MCs had better water-repellent performance. It was found that the capillary water-absorption coefficient was 10%, 17%, 19% lower at 0.1%, 0.3% and 0.5% coating/EP ratios compared to MC and MF, respectively, and also 13%, 18% and 14% lower at 1%, 3% and 5% coating/EP ratios compared to MC and MF, respectively.
These findings show the capillary water absorption coefficient decreases and the water-repellent performance improves while the SA coating/EP ratio increases. Although it is stated in the literature that water-repellent performance remains approximately constant at a coating/EP ratio of over 3%, it was observed that the water-repellent performance increased at a coating/EP ratio of 5% with the coating method used in this study.
In our subsequent studies, field tests will be conducted and less water-repellent polymers will be added to mortars using EP coated with SA compared to the current amount used because in the current study, it was determined that there was an improvement in the water repellency of SA-coated EP compared to the uncoated EP. This is also a commercially important development.

3.2.3. Thermal Conductivity Analysis

In building materials, due to the partial pressure difference of water vapor between the inside and outside environments, water vapor diffusion occurs from the side where the partial pressure is high to the side where it is low. If it comes into contact with a surface below the dew point temperature, some condensation occurs on the surface of the building material, sweating occurs, the remaining water vapor diffuses into the building material, and condensation begins when the partial pressure of water vapor equals the saturation pressure of water vapor at that temperature in the inner layers. The water vapor that does not condense leaves the building material and passes into the outside air. In addition to vapor diffusion, rainwater can also penetrate the building structures. That is, during long-term use in buildings, the materials continue to absorb moisture. Therefore, no matter how low the thermal conductivity coefficient obtained in laboratory conditions is, this value does not remain constant after moisture absorption, which leads to the lack of sustainable energy efficiency in the material. That is, if the thermal insulation performance of a material changes due to moisture absorption, then this material is not sustainable. In other words, for a material to be sustainable, its insulation performance must exhibit constant behavior.
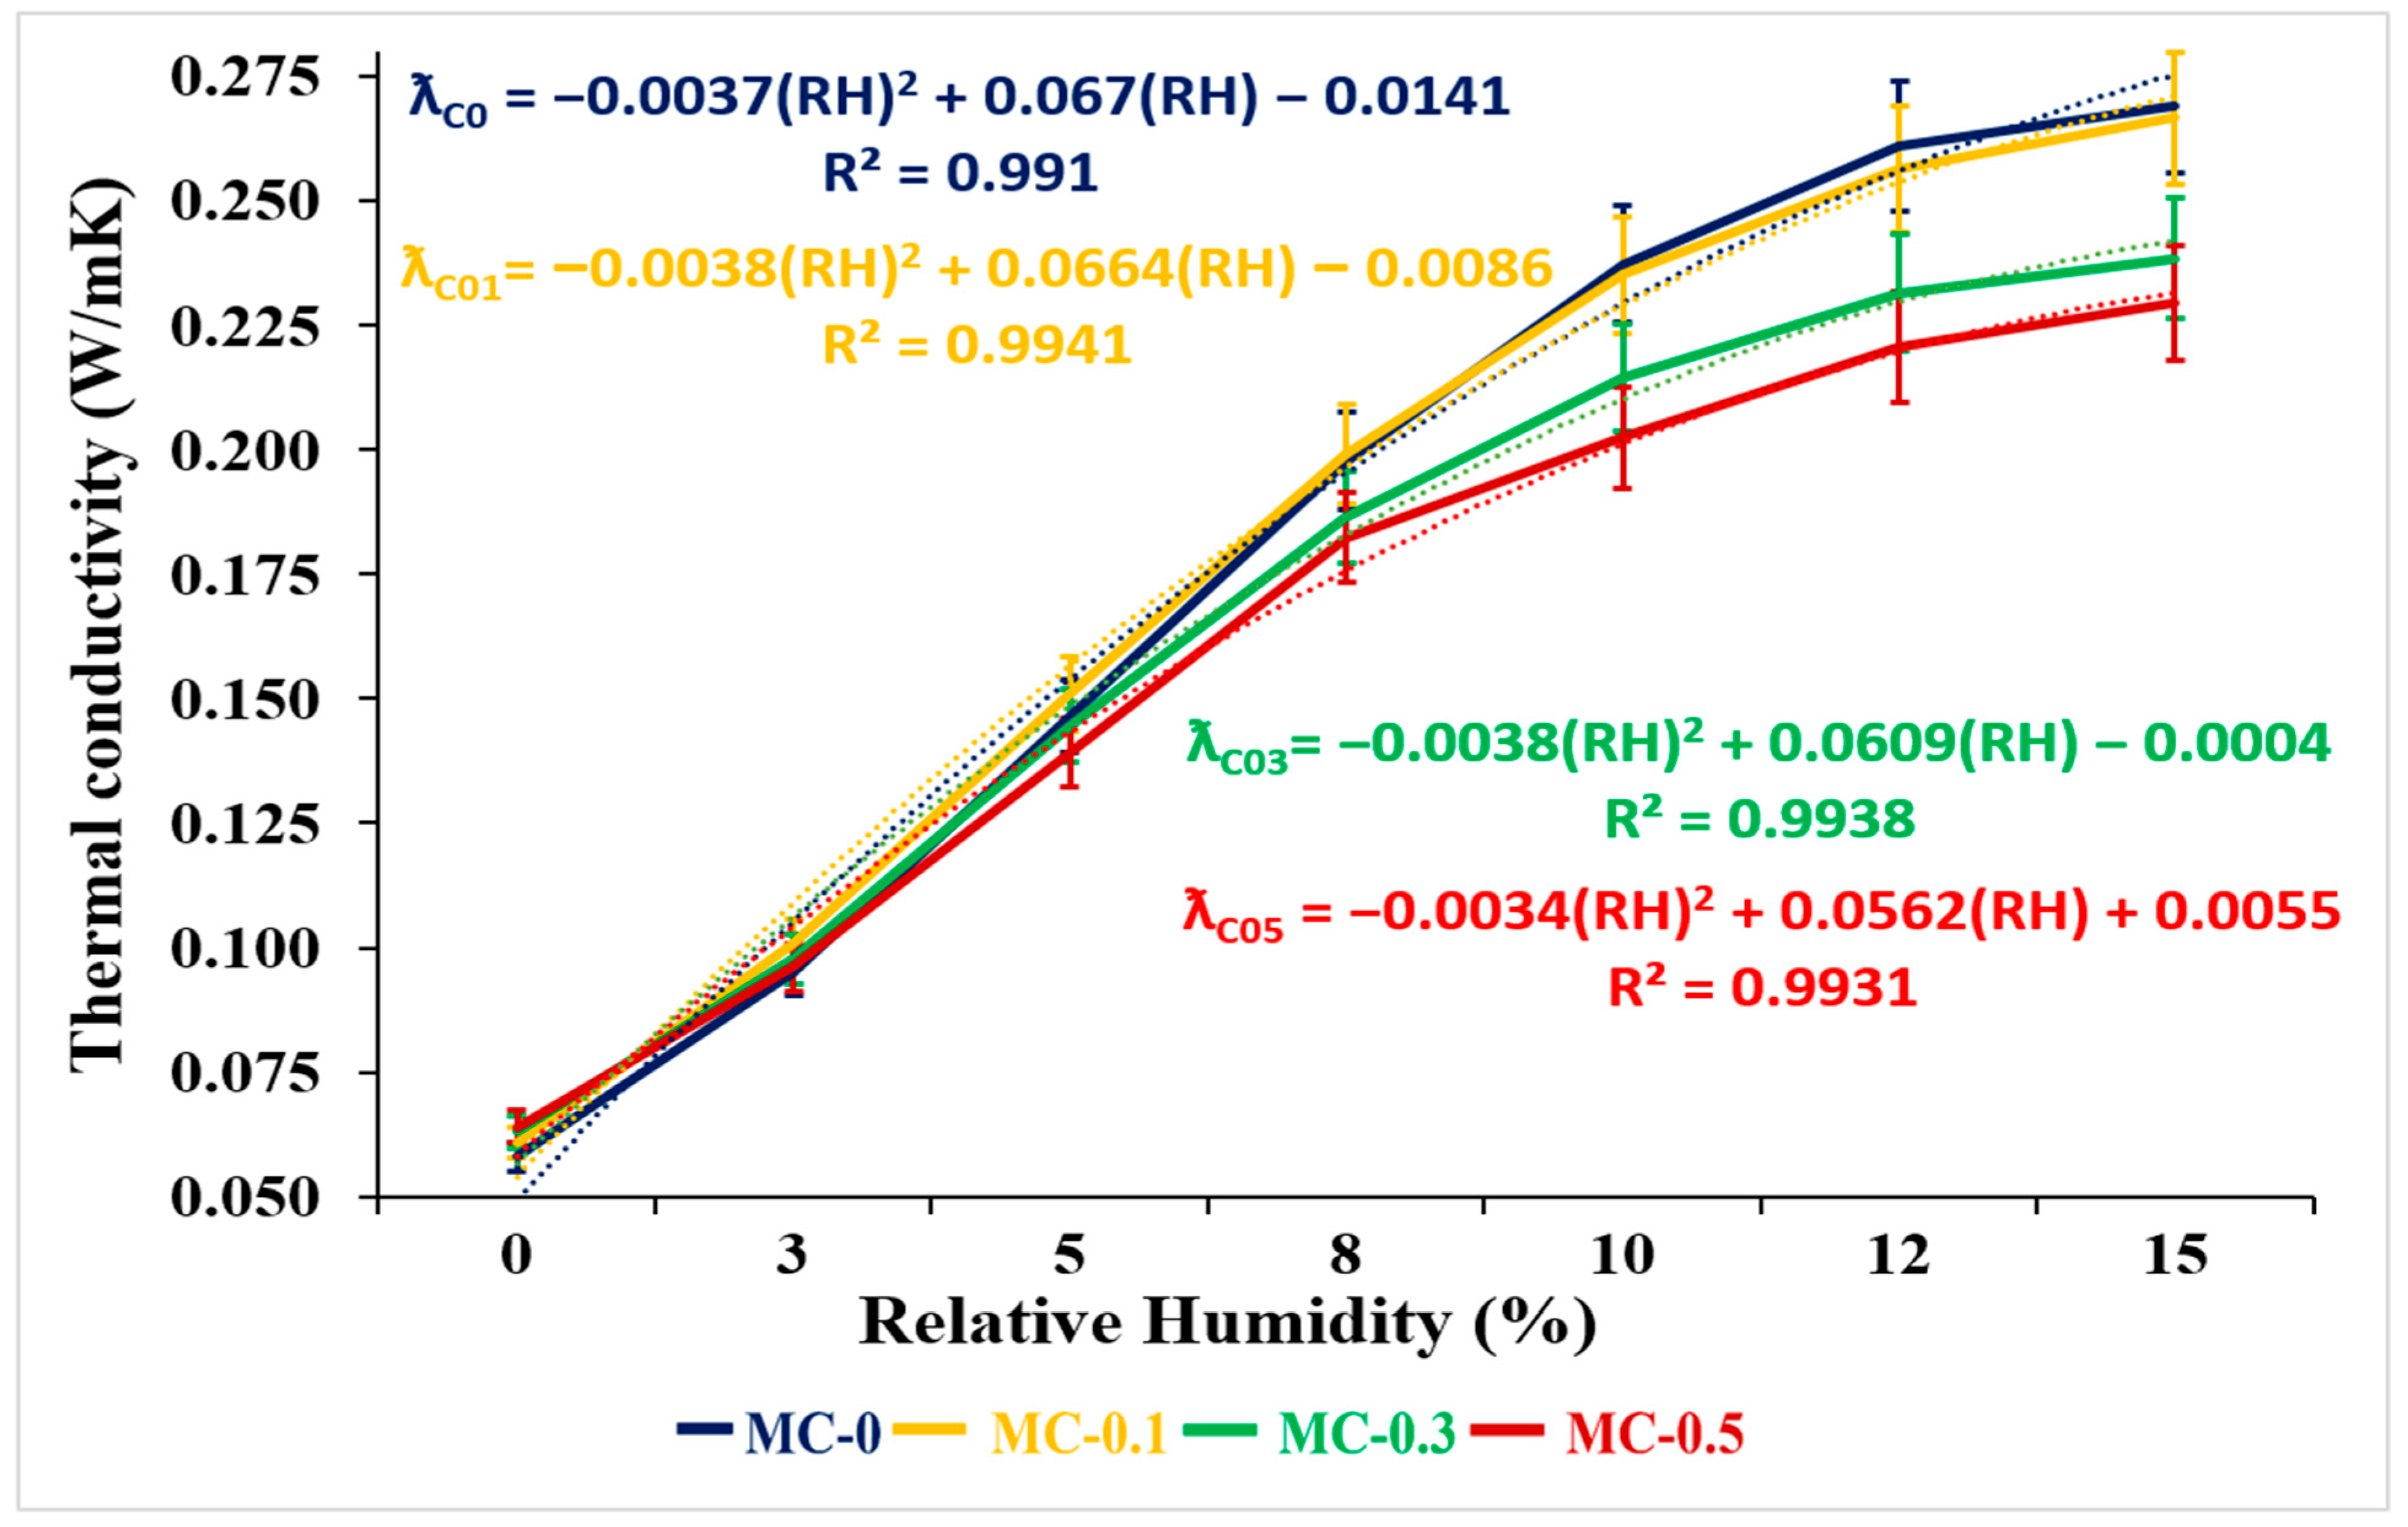
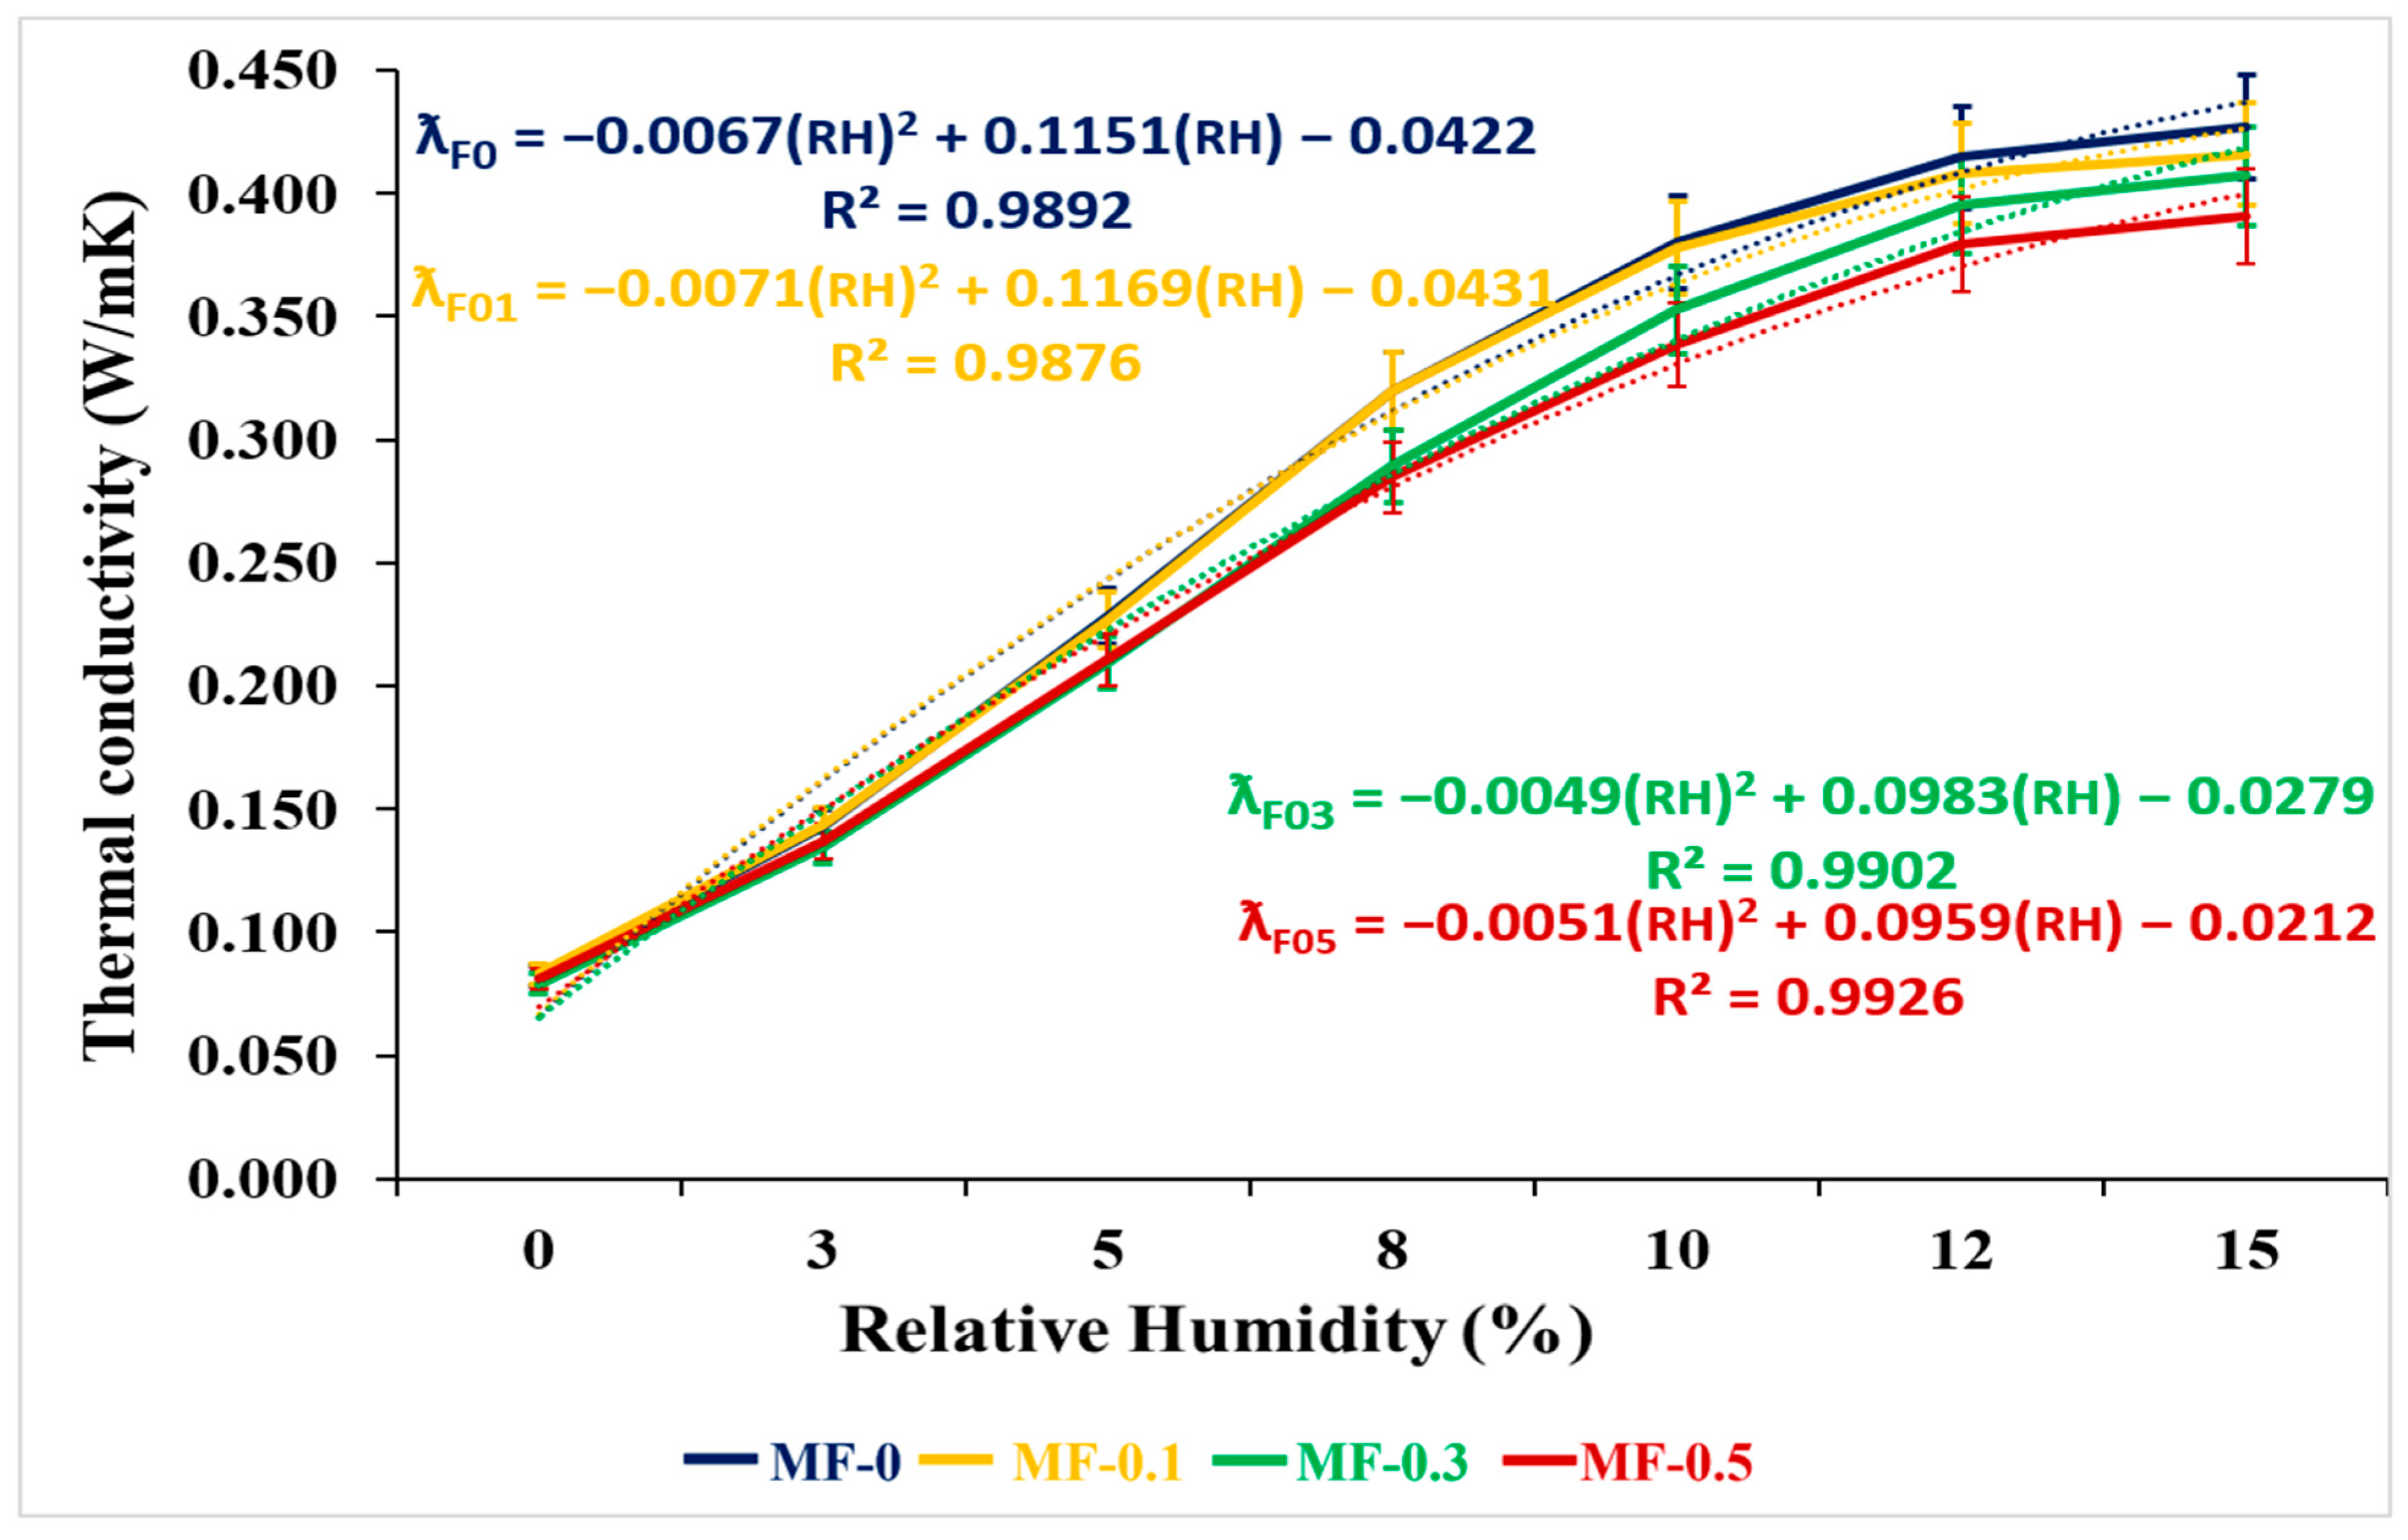
In this study, while determining the thermal conductivity values for coated and uncoated mortars, dry samples were first measured in a laboratory environment. Then, the measurements were repeated for different RH values (Table 6 and Table 7). In the graphs (Figure 17, Figure 18, Figure 19 and Figure 20) showing the changes in thermal conductivity according to different RHs, the area under the curve of the uncoated case (A0) and the area under the curve of the coated case (Ai) were determined, and thus the STP values were obtained according to Equation (3). In this approach, the method of calculating the area between two curves with the integral method [52,53] was used by adapting it to the findings of this study. The purpose of this approach is to reveal the sustainability of existing mortars during their continuous use in buildings. In this case, the higher the STP values obtained, the more sustainable the material is, and the more it maintains its thermal performance not only under laboratory conditions but also in humid environments. This also reveals the sustainability of the material.
Within the scope of this study, the dry mortar densities of all mortar samples between MC-0 and MC-5 varied between 245 and 281 kg/m3 (Table 5). The thermal conductivity measurement values of these samples in the dry state varied between 0.045 and 0.054 “W/mK”, as seen in Table 6. When these values were compared according to the thermal conductivity values depending on the plaster mortar material densities specified in Table A-12 of the EN 1745 standard, it was seen that better thermal conductivity values were obtained than the values declared in the standard. The density-dependent thermal conductivity values for the P = 50% condition in the standard vary between 0.074 and 1.17 “W/mK” [49]. Based on density, it was determined that a 27–39% improvement was achieved with the use of EP in MC mortars. Similarly, it was observed that an improvement in thermal conductivity values of up to 6.8% could be achieved with the use of EP in MF mortars.
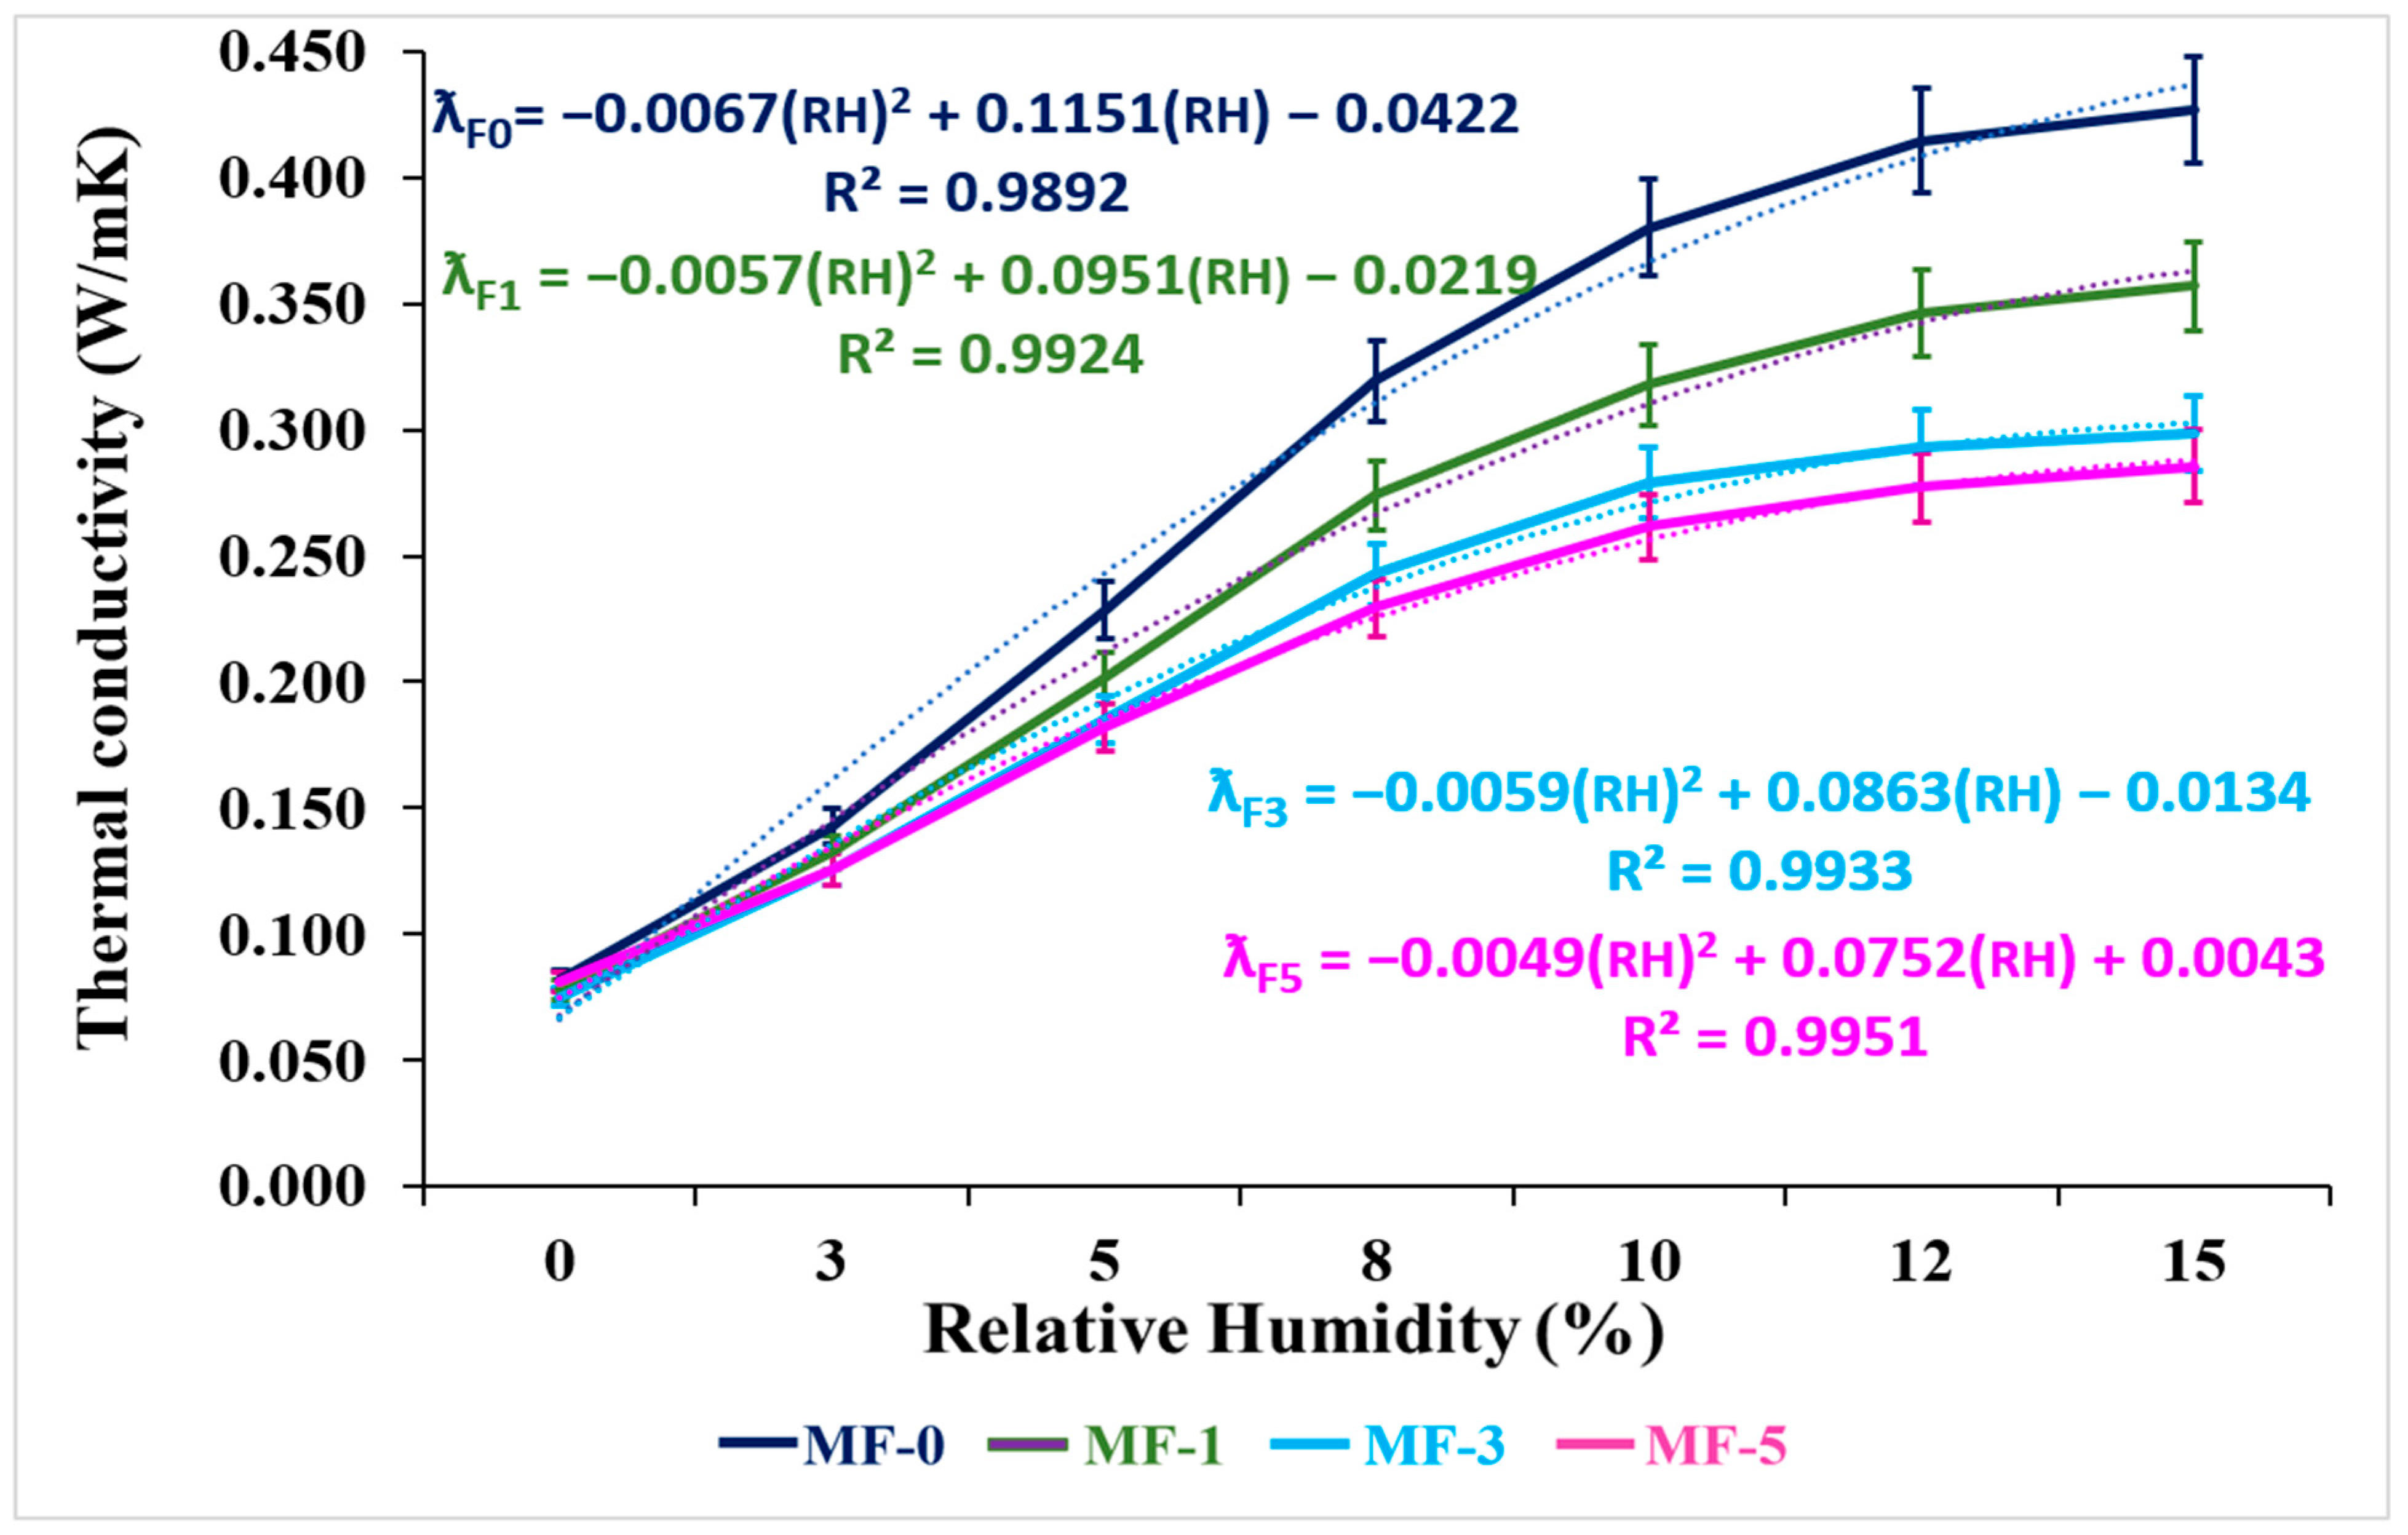
When the data are examined, it is seen that the thermal conductivity values of the mortar samples increase as the RH increases. As the thermal conductivity value increases in the materials, the thermal transmittance value in the equivalent thickness also tends to increase. This represents the weakening of the insulation feature in terms of thermal performance of the material [54]. In order to examine the coating effect in the mortar samples in detail and to analyze its effects on insulation, the thermal conductivity values measured against the RH rate changes were graphically correlated and are shown separately for four groups in Figure 17, Figure 18, Figure 19 and Figure 20. It was determined that there were graphical trends between the RH and thermal conductivity values in each group that could be considered linear, and that the linear relationship was in the form of second-degree parabolas due to high correlation coefficients.
The thermal conductivity values of the test samples in the context of sustainability will change according to the RH environment to which the mortar will be exposed in the application area. It is desired that the change in the thermal conductivity value be kept at a minimum level for a sustainable material [55]. The thermal conductivity value of a material with equivalent thickness increases with increasing RH; the higher this value, the lower the energy efficiency of the material is considered to be in the context of decreasing thermal resistance [56]. In order to ensure the sustainable energy efficiency of materials, minimum changes in thermal conductivity values and high thermal resistance are among the main parameters [57]. In this context, the areas under the linear-parabola curves of the thermal conductivity values, depending on the increasing RH of the test samples prepared within the scope of this study, as mentioned above, have been accepted as an indicator of the thermal conductivity change performance, depending on the structural components of the material. The smaller the area obtained depending on the increasing RH is, the more efficient it can be in terms of thermal insulation properties. The possible effects of the difference between the coating/EP ratios of the materials on the STP [58,59,60,61,62,63] were analyzed numerically.
S T P = A 0 A İ A İ × 100  
where
STP: sustainable thermal performance (%);
A0: area for the test sample with %0 coverage ratio (uncoated) (m2);
Ai: area for the test sample with %i coverage ratio (coated) (m2).
For Groups 1–4, the STP values of coarse and fine mortars, calculated according to different coating/EP ratios, are shown in Figure 21.
When the uncoated and coated samples were compared, the thermal conductivity values of the uncoated ones were higher (Figure 17, Figure 18, Figure 19 and Figure 20). As seen in Figure 17, as RH increased, thermal conductivity also increased up to 8% RH, but remained approximately constant beyond 8%. The same situation was observed in Figure 18 and Figure 20. Furthermore, the difference between the thermal conductivity values of the uncoated and coated cases in Figure 18 was greater than that in Figure 17, and a similar trend was observed in Figure 19 and Figure 20. For the same coating/EP ratios, the thermal conductivities of the MFs in Figure 20 were greater than those of the MCs in Figure 18. The same behavior was observed in Figure 17, Figure 18 and Figure 19.
Considering Figure 21, energy efficiency increased significantly in MC-0.1, -0.3, -0.5 as the coating/EP ratio increased. While a low gain was achieved at MC-0.1, the STP values increased to 10.22% and 12.39% at MC-0.3 and MC-0.5, respectively. This shows that even small amounts of coating are effective in increasing energy efficiency. Similarly, in MF-0.1, -0.3, -0.5, energy efficiency increased as the coating/EP ratio increased. However, the MF group had lower STP values than the MC group. This shows that MFs are less effective in terms of energy efficiency than coarse mortars. Significant increases in energy efficiency were observed with high coating/EP ratios in MC-1, -3, -5. High STP value of 39.27% was obtained at MC-5. These results prove that energy efficiency improved sustainably in the MC group as the coating/EP ratio increased. In MF-1, -3, -5, energy efficiency increased as the coating/EP ratio increased, but remained at lower levels compared to the MC group. The highest value was obtained at MF-5, 30.30%. This shows that the MF group is less sustainable in terms of energy efficiency. As the coating/EP ratio increased, an increase in STP values was observed in both the MC and MF groups. However, the increases in the MF groups remained lower compared to the MC groups. Especially at high ratios (3% and 5%), the MC groups exhibited stronger performance. At low coating/EP ratios (0.1% and 0.3%), the MF groups showed lower performance, and it was determined that the MC groups provided 3.73 times and 3.24 times higher energy efficiency, respectively. When the coating/EP ratio was 0.5%, the difference decreased, and MC-0.5 showed a value 1.78 times higher than MF-0.5. At high coating/EP ratios (1%, 3% and 5%), the MC groups provided 1.44-, 1.23-, and 1.30-times higher energy efficiency than the MF groups, respectively.
As a result, the MC mortars exhibited higher energy efficiency at each coating/EP ratio compared to the MF mortars and thus showed a more sustainable behavior.

4. Conclusions

An experimental study of EP particles coated with SA was carried out, and the results obtained are listed below:
(1)
Both the slump and the capillary water absorption amounts decreased in SA-coated EP particles compared to the uncoated ones.
(2)
Water absorption, which is an undesirable property, was significantly reduced when coated with SA, and even SCP showed almost no water absorption behavior at coatings above 2%. These findings will provide valuable contributions to both industrial applications and the literature on SEP.
(3)
A significant improvement in compressive strength was observed at coating/EP ratios of 3% and above. In addition, higher strength values were obtained in mortars prepared using coated fine perlite.
(4)
When MC-0 was compared with the samples of MC-0.1, -0.3, -0.5 and MC-1, -3, -5, the capillary water-absorption coefficient decreased with the increase in the coating/EP ratio, and thus the water-repellent property improved. In addition, a similar behavior was observed when MF-0 was compared with the samples of MF-0.1, -0.3, -0.5 and MF-1, -3, -5.
(5)
The capillary water-absorption coefficient decreased, and therefore the water-repellent performance improved as the SA coating/EP ratio increased. Although it is stated in the literature that water-repellent performance is not optimal at a coating/EP ratio of over 3%, it was observed that the water-repellent performance increased at a coating/EP ratio of 5% with the coating method used in this study.
(6)
The thermal conductivity values of the uncoated samples were higher. Additionally, the STP value of MF-0.1 increased by a factor of 3.73 compared to MC-0.1, while the STP value of MC increased 3.24-, 1.78-, 1.44-, 1.23-, and 1.30-fold for coating/EP ratios of 0.3%, 0.5%, 1%, 3%, and 5%, respectively. This situation shows that MC mortars are better than MF mortars in terms of sustainability.
(7)
As the coating/EP ratio increased, STP values increased for both MCs and MFs. That is, with the increase in the coating/EP ratio, the mixed mortars became more sustainable.

Author Contributions

Conceptualization, B.T.A., L.G. and G.Y.; methodology, B.T.A. and L.G.; validation, B.T.A., L.G. and G.Y.; formal analysis, B.T.A.; investigation, B.T.A.; resources, B.T.A.; data curation, B.T.A., L.G. and G.Y.; writing—original draft preparation, B.T.A.; writing—review and editing, B.T.A. and G.Y.; visualization, B.T.A.; supervision, L.G. and G.Y.; project administration, B.T.A., L.G. and G.Y.; funding acquisition, G.Y. All authors have read and agreed to the published version of the manuscript.

Funding

The financial support of this study, provided by the Research Fund of Pamukkale University Scientific Research Projects Council under Grant No: [2024FEBE007], is gratefully acknowledged. The funders had no role in the design of this study; in the collection, analyses, or interpretation of data; in the writing of the manuscript; or in the decision to publish the results.

Data Availability Statement

The original contributions presented in this study are included in the article. Further inquiries can be directed to the corresponding author.

Acknowledgments

The authors would like to extend their sincere gratitude to İzoroyal İnşaat and San. ve Tic. A.Ş firm for their financial and moral support throughout this study. Their contributions played a crucial role in enabling the successful completion of this research. We deeply appreciate their dedication to advancing scientific innovation and their commitment to fostering sustainability in the building materials industry.

Conflicts of Interest

The authors declare no conflicts of interest.

List of Symbols

A0Area for test sample with %0 coverage ratio (uncoated) (m2)
AiArea for test sample with %i coverage ratio (coated) (m2)
CCapillary water-absorption coefficient (kg/(m2.min0.5)
HwBeginning amount of colored water (80 mL/5.60 cm2)
HEPBeginning amount of dry EP (20 mL/5.60 cm2)
IHeater current (A)
M1Mass of the sample after 10 min (g)
M2Mass of the sample after 90 min (g)
STPSustainable thermal performance (%)
t1Time after heating started (t1 = 30 s)
t2Time after heating started (t2 = 60 s)
T1Temperature at t1 (°C)
T2Temperature at t2 (°C)
δGPSlump amount of EP (mL/cm2)
βGPCapillary water absorption amount of EP (mL/cm2)
λ Thermal conductivity coefficient (W/mK)

Abbreviations

The following abbreviations are used in this manuscript:
EPExpanded perlite
SAStearic acid
ECPExpanded coarse perlite
EFPExpanded fine perlite
SCPSA-coated expanded coarse perlite
SFPSA-coated expanded fine perlite
MCCoarse mortar
MFFine mortar
STPSustainable thermal performance

References

  1. Topcu, I.B.; Isikdag, B. Effect of expanded perlite aggregate on the properties of lightweight concrete. J. Mater. Process. Technol. 2008, 204, 34–38. [Google Scholar] [CrossRef]
  2. Sengul, O.; Azizi, S.; Karaosmanoglu, F.; Tasdemir, M. Effect of expanded perlite on the mechanical properties and thermal conductivity of lightweight concrete. Energy Build. 2011, 43, 671–676. [Google Scholar] [CrossRef]
  3. Demirboga, R.; Orun, I.; Gul, R. Effects of expanded perlite aggregate and mineral admixtures on the compressive strength of low-density concretes. Cem. Concr. Res. 2001, 31, 1627–1632. [Google Scholar] [CrossRef]
  4. Demirboga, R.; Gul, R. The effects of expanded perlite aggregate, silica fume and fly ash on the thermal conductivity of lightweight concrete. Cem. Concr. Res. 2003, 33, 723–727. [Google Scholar] [CrossRef]
  5. Türkmen, İ.; Kantarcı, A. Effects of expanded perlite aggregate and different curing conditions on the physical and mechanical properties of self-compacting concrete. Build. Environ. 2007, 42, 2378–2383. [Google Scholar] [CrossRef]
  6. Kalkan, Ş.O.; Gündüz, L. Effect of porous aggregate size on the techno-mechanical properties of cementless lightweight mortars. El-Cezerî J. Sci. Eng. 2018, 5, 168–175. [Google Scholar] [CrossRef]
  7. Pramusanto, P.; Nurrochman, A.; Mamby, H.E.; Nugraha, P. High strength lightweight concrete with expandable perlite as the aggregate. Mater. Sci. Eng. 2020, 830, 042040. [Google Scholar] [CrossRef]
  8. Pichor, W.; Kamiński, A.; Szołdra, P.; Fra, M. Lightweight cement mortars with granulated foam glass and waste perlite addition. Adv. Civ. Eng. 2019, 2019, 1705490. [Google Scholar] [CrossRef]
  9. Vyšvařil, M.; Pavlíková, M.; Záleská, M.; Pivák, A.; Žižlavský, T.; Rovnaníková, P.; Bayer, P.; Pavlík, Z. Non-Hydrophobized perlite renders for repair and thermal insulation purposes: Influence of different binders on their properties and durability. Constr. Build. Mater. 2020, 263, 120617. [Google Scholar] [CrossRef]
  10. Ragul, P.; Naga Theera Hari, M.; Arunachelam, N.; Chellapandian, M. An experimental study on the partial replacement of fine aggregate with perlite in cement concrete. Mater. Today Proc. 2022, 68, 1219–1224. [Google Scholar] [CrossRef]
  11. Karakaş, H.; İlkentapar, S.; Durak, U.; Örklemez, E.; Özuzun, S.; Karahan, O.; Atiş, C.D. Properties of fly ash-based lightweight-geopolymer mortars containing perlite aggregates: Mechanical, microstructure, and thermal conductivity coefficient. Constr. Build. Mater. 2023, 362, 129717. [Google Scholar] [CrossRef]
  12. Szymczak-Graczyk, A.; Gajewska, G.; Laks, I.; Kostrzewski, W. Influence of Variable Moisture Conditions on the Value of the Thermal Conductivity of Selected Insulation Materials Used in Passive Buildings. Energies 2022, 15, 2626. [Google Scholar] [CrossRef]
  13. Gündüz, L.; Kalkan, Ş.O. The effect of different natural porous aggregates on thermal characteristic feature in cementitious lightweight mortars for sustainable buildings. Iran. J. Sci. Technol. Trans. Civ. Eng. 2023, 47, 843–861. [Google Scholar] [CrossRef]
  14. Slavica, R.M.; Sekulić, Z.; Daković, A.; Jovanović, V. Surface properties of natural calcite filler treated with stearic acid. Ceram. Silik. 2009, 53, 84–106. [Google Scholar]
  15. Gürsoy, M.; Karaman, M. Hydrophobic coating of expanded perlite particles by plasma polymerization. Chem. Eng. J. 2016, 284, 343–350. [Google Scholar] [CrossRef]
  16. Pichor, W.; Janiec, A. Thermal stability of expanded perlite modified by mullite. Ceram. Int. 2009, 35, 527–530. [Google Scholar] [CrossRef]
  17. Alazhari, M.; Sharma, T.; Heath, A.; Cooper, R.; Paine, K. Application of expanded perlite encapsulated bacteria and growth media for self-healing concrete. Constr. Build. Mater. 2018, 160, 610–619. [Google Scholar] [CrossRef]
  18. Jia, G.; Li, Z.; Liu, P.; Jing, Q. Preparation and characterization of aerogel/expanded perlite composite as building thermal insulation material. J. Non-Cryst. Solids 2018, 482, 192–202. [Google Scholar] [CrossRef]
  19. Jia, G.; Li, Z. Influence of the aerogel/expanded perlite composite as thermal insulation aggregate on the cement-based materials: Preparation, property, and microstructure. Constr. Build. Mater. 2021, 273, 121728. [Google Scholar] [CrossRef]
  20. Liu, F.; Zhu, J.; Liu, J.; Ma, B.; Zhou, W.; Li, R.; Qin, W. Microstructure and characterization of capric-stearic acid/modified expanded vermiculite thermal storage composites. J. Wuhan Univ. Technol.-Mater. Sci. Ed. 2018, 33, 296–304. [Google Scholar] [CrossRef]
  21. Feng, J.; Liu, M.; Fu, L.; Zhang, K.; Xie, Z.; Shi, D.; Ma, X. Enhancement and mechanism of vermiculite thermal expansion modified by sodium ions. R. Soc. Chem. Adv. 2020, 10, 7635–7642. [Google Scholar] [CrossRef] [PubMed]
  22. Gündüz, L.; Kalkan, Ş.O. Effects of exfoliation temperature for vermiculate aggregates modified by sodium ions on thermal and comfort properties of a new generation cementitious mortar. J. Sustain. Constr. Mater. Technol. 2022, 7, 266–281. [Google Scholar] [CrossRef]
  23. Akyuncu, V.; Sanliturk, F. Investigation of physical and mechanical properties of mortars produced by polymer coated perlite aggregate. J. Build. Eng. 2021, 38, 102182. [Google Scholar] [CrossRef]
  24. Myronyuk, O.; Baklan, D.; Zilong, J.; Sokolova, L. Obtaining water-repellent coatings based on expanded perlite materials. Mater. Today Proc. 2022, 62, 7720–7725. [Google Scholar] [CrossRef]
  25. Qi, P.; Lin, N.; Liu, Y.; Zhao, J. Improvement of oil/water selectivity by stearic acid modified expanded perlite for oil spill cleanup. J. Shanghai Jiaotong Univ. (Sci.) 2013, 18, 500–507. [Google Scholar] [CrossRef]
  26. Vogt, E.; Plachta, L. The new method of modifying the hydrophobic properties of expanded perlite. Energy Fuels 2017, 14, 02034. [Google Scholar] [CrossRef]
  27. Huang, H.; Wu, Z.; Zhou, Z.; Xu, Q.; Yan, J.; Li, Q. Study on sustained-release pesticides blended with fosthiazate-stearic acid/expanded perlite. J. Renew. Mater. 2021, 11, 256–272. [Google Scholar] [CrossRef]
  28. Bian, Y.; Wang, W.; Wang, J.; Yu, Y.; Liu, M.; Lv, Y. Preparation and properties of capric acid: Stearic acid/hydrophobic expanded perlite-aerogel composite phase change materials. Renew. Energy 2021, 179, 1027–1035. [Google Scholar] [CrossRef]
  29. Deepika; Hait, S.K.; Chen, Y. Optimization of milling parameters on the synthesis of stearic acid coated CaCO3 nanoparticles. J. Coat. Technol. Res. 2014, 11, 273–282. [Google Scholar] [CrossRef]
  30. Karim, A.N.; Johansson, P.; Sasic Kalagasidis, A. Knowledge gaps regarding the hygrothermal and long-term performance of aerogel-based coating mortars. Constr. Build. Mater. 2022, 314, 125602. [Google Scholar] [CrossRef]
  31. Becker, P.; Effting, C.; Schackow, A. Lightweight thermal insulating coating mortars with aerogel, EPS, and vermiculite for energy conservation in buildings. Cem. Concr. Compos. 2022, 125, 104283. [Google Scholar] [CrossRef]
  32. Yoon, H.; Lim, T.; Jeong, S.; Yang, K. Thermal transfer and moisture resistances of nano-aerogel-embedded foam concrete. Constr. Build. Mater. 2020, 236, 117575. [Google Scholar] [CrossRef]
  33. Karim, A.N.; Johansson, P.; Sasic Kalagasidis, A. Increasing Water Absorptivity of an Aerogel-Based Coating Mortar in Subsequent Wetting and Drying. Gels 2022, 8, 764. [Google Scholar] [CrossRef]
  34. Shen, Y.; Wang, Z.; Zhou, Y.; Du, J.; Lai, J.; Qian, K.; Ruan, S.; Bi, Y.; Qian, X. The influence of nano-silica composite superabsorbent polymer on the autogenous shrinkage of mortar. Constr. Build. Mater. 2024, 442, 137683. [Google Scholar] [CrossRef]
  35. Tian, J.; Yang, Y.; Xue, T.; Chao, G.; Fan, W.; Liu, T. Highly flexible and compressible polyimide/silica aerogels with integrated double network for thermal insulation and fire-retardancy. J. Mater. Sci. Technol. 2022, 105, 194–202. [Google Scholar] [CrossRef]
  36. Wang, X.; Zhang, Z.; Wang, Y.; Malfait, W.; Zhao, S.; Tian, Y.; Liu, T.; Zhang, X.; Du, A.; Shen, J. Flexible, high-temperature-resistant silica-polymer aerogel hybrids by templating polymethylsilsesquioxane microstructure with trace polyimide. Adv. Compos. Hybrid Mater. 2023, 6, 32. [Google Scholar] [CrossRef]
  37. Valdez-Cano, R.; González-López, J.; Guerra-Cossío, M. Effects on the Mechanical and Thermal Behaviors of an Alternative Mortar when Adding Modified Silica Aerogel with Aminopropyl Triethoxysilane and PEG-PPG-PEG Triblock Copolymer Additives. Silicon 2023, 15, 5353–5366. [Google Scholar] [CrossRef]
  38. Liu, X.; Liu, R.; Xie, X.; Zuo, J.; Lyu, K.; Shah, S. Chloride corrosion resistance of cement mortar with recycled concrete powder modified by nano-silica. Constr. Build. Mater. 2023, 364, 129907. [Google Scholar] [CrossRef]
  39. Muthalvan, R.; Selvaraj, L.; Avudaiappan, S.; Liseitsev, Y. Performance evaluation of super absorbent polymer modified cement mortar with nano-silica/GGBS. Case Stud. Constr. Mater. 2023, 19, e02359. [Google Scholar] [CrossRef]
  40. Yildirim Erbil, H. Practical applications of superhydrophobic materials and coatings: Problems and perspectives. Langmuir 2020, 36, 2493–2509. [Google Scholar] [CrossRef]
  41. Perlite: The Most Sustainable Insulation Solution for Buildings. Available online: https://www.perlite.org/wp-content/uploads/2024/01/Perlite-Sustainable-Insulation.pdf (accessed on 17 July 2025).
  42. Embodied Carbon Inventory Data for Construction Materials. Available online: https://www.cidb.gov.my/wp-content/uploads/2022/11/V4_EMBODIED-CARBON-INVENTORY-TEMPLATE-final-1.pdf (accessed on 17 July 2025).
  43. Carbon Footprint for Building Products. Available online: https://publications.vtt.fi/pdf/technology/2013/T115.pdf (accessed on 17 July 2025).
  44. EN 13139; Aggregates for Mortar. Turkish Standard Institute: Ankara, Turkey, 2013.
  45. EN 197-1; Cement—Part 1: Compositions and Conformity Criteria for Common Cements. Turkish Standard Institute: Ankara, Turkey, 2002.
  46. EN 1015-3; Methods of Test for Mortar for Masonry—Part 3: Determination of Consistence of Fresh Mortar (by Flow Table). Turkish Standard Institute: Ankara, Turkey, 2000.
  47. EN 1015-11; Methods of Test for Mortar for Masonry—Part 11: Determination of Flexural and Compressive Strength of Hardened Mortar. Turkish Standard Institute: Ankara, Turkey, 2020.
  48. EN 1015-18; Methods of Test for Mortar for Masonry—Part 18: Determination of Water Absorption Coefficient Due to Capillary Action of Hardened Mortar. Turkish Standard Institute: Ankara, Turkey, 2014.
  49. EN 1745; Masonry and Masonry Products—Methods for Determining Design Thermal Values. Turkish Standard Institute: Ankara, Turkey, 2020.
  50. QTM-500; Quick Thermal Conductivity Meter User’s Guide. Available online: https://cdn2.hubspot.net/hubfs/105273/Manuals/QTM-500_Operation_Manual_Ver08.pdf (accessed on 29 July 2025).
  51. EN 998-1; Specification for Mortar for Masonry—Part 1: Rendering and Plastering Mortar. Turkish Standard Institute: Ankara, Turkey, 2011.
  52. Rochester Institute of Technology (R.I.T.). Areas by Integration. Available online: https://www.rit.edu/academicsuccesscenter/ (accessed on 5 June 2025).
  53. Cankaya University. Math 111-11 Integral Techniques. Available online: https://math111.cankaya.edu.tr (accessed on 5 June 2025).
  54. Yue, J.; Liu, J.; Song, X.; Yan, C. Research on the design and thermal performance of vacuum insulation panel composite insulation materials. Case Stud. Therm. Eng. 2024, 64, 105437. [Google Scholar] [CrossRef]
  55. Hung Anh, L.D.; Pásztory, Z. An overview of factors influencing thermal conductivity of building insulation materials. J. Build. Eng. 2021, 44, 102604. [Google Scholar] [CrossRef]
  56. TS EN ISO 6946; Building Components and Building Elements—Thermal Resistance and Thermal Transmittance—Calculation Methods (ISO 6946:2017). Turkish Standards Institute: Ankara, Turkey, 2017; p. 57.
  57. Qin, Z.; Li, M.; Flohn, J.; Hu, Y. Thermal management materials for energy-efficient and sustainable future buildings. Chem. Commun. 2021, 57, 12236–12253. [Google Scholar] [CrossRef] [PubMed]
  58. Revuelta-Acosta, J.D.; García-Díaz, A.; Soto-Zarazúa, G.M.; Rico-García, E. Adobe as a sustainable material: A thermal performance. J. Appl. Sci. 2010, 10, 2211–2216. [Google Scholar] [CrossRef]
  59. Kendzierawska, W.; Trochonowicz, M. Effect of temperature and humidity on the thermal conductivity of insulation materials. Civ. Environ. Eng. Rep. 2023, 33, 42–49. [Google Scholar] [CrossRef]
  60. Gbekou, F.K.; Benmahiddine, F.; Boudenne, A.; Belarbi, R.; Eddhahak, A.; Benzarti, K. Hygrothermal characterization of cement mortar composites incorporating micronized miscanthus fibers. Case Stud. Constr. Mater. 2024, 21, e04004. [Google Scholar] [CrossRef]
  61. Baptista da Silva, F.S. Thermal Conductivity of Thermal Mortars with EPS and Silica Aerogel; Tecnico Lisboa: Lisboa, Portugal, 2017; Available online: https://fenix.tecnico.ulisboa.pt/downloadFile/1407770020545701/ExtendedAbstractFilipaFinal.pdf (accessed on 29 July 2025).
  62. Gawin, D.; Kosny, J.; Desjarlais, A. Effect of moisture on thermal performance and energy efficiency of buildings with lightweight concrete walls. Proc. ACEEE Summ. Stud. Energy Eff. Build. 2000, 3, 3149–3160. [Google Scholar]
  63. Pessoa, S.; Jesus, M.; Guimaraes, A.S.; Lucas, S.S.; Simoes, N. Experimental characterisation of hygrothermal properties of a 3D printed cementitious mortar. Case Stud. Constr. Mater. 2023, 19, e02355. [Google Scholar] [CrossRef]
Figure 1. A photograph of the EP.
Buildings 15 02749 g001
Figure 2. Schematic view of the EP coating instrument.
Buildings 15 02749 g002
Figure 3. Schematic view of the amounts of slump and capillary water absorption.
Buildings 15 02749 g003
Figure 4. Determination of fresh mortar consistency by flow table.
Buildings 15 02749 g004
Figure 5. Compressive strength test: (a) 160 × 40 × 40 mm prismatic mold samples, (b) 40 × 40 × 40 mm cubic sample before the test, and (c) 40 × 40 × 40 mm cubic sample after the test.
Buildings 15 02749 g005
Figure 6. Drying of samples in an air-circulating oven according to the EN 1015-18 standard.
Buildings 15 02749 g006
Figure 7. Samples in accordance with EN 1015-18.
Buildings 15 02749 g007
Figure 8. Test apparatus, according to the EN 1015-18 standard.
Buildings 15 02749 g008
Figure 9. QTM-500 device with PD-11 probe and calibration demonstration.
Buildings 15 02749 g009
Figure 10. Thermal conductivity measurement method: (a) marked sample, (b) marking pattern.
Buildings 15 02749 g010
Figure 11. Water-repellent performance analysis: slump and capillary water absorption apparatus [(a) Group1, (c) Group 2, (e) Group 3, and (g) Group 4] and the changes in capillary water absorption and slump amounts for different coating percentages by weight apparatus [(b) Group 1, (d) Group 2, (f) Group 3, and (h) Group 4].
Buildings 15 02749 g011aBuildings 15 02749 g011b
Figure 12. SEM image of uncoated EP: (a) 500× and (b) 1000×.
Buildings 15 02749 g012
Figure 13. SEM images of EP coated with 5% SA: (a) 250× and (b) 1000×.
Buildings 15 02749 g013
Figure 14. SEM images of coated mortars: (a) for MC (1000×) and (b) for MF (1000×).
Buildings 15 02749 g014
Figure 15. Compressive strength of mixture mortars for different coating/EP ratios.
Buildings 15 02749 g015
Figure 16. The change in capillary water-absorption coefficients according to different coating/EP ratios.
Buildings 15 02749 g016
Figure 17. The change in thermal conductivity with respect to relative humidity for Group 1.
Buildings 15 02749 g017
Figure 18. The change in thermal conductivity with respect to relative humidity for Group 2.
Buildings 15 02749 g018
Figure 19. The change in thermal conductivity with respect to relative humidity for Group 3.
Buildings 15 02749 g019
Figure 20. The change in thermal conductivity with respect to relative humidity for Group 4.
Buildings 15 02749 g020
Figure 21. STP values of coarse and fine mortars based on different coating/EP ratios.
Buildings 15 02749 g021
Table 1. Physical properties of SA.
General Feature
ColorWhite solid
SmellSharp, oil-like
Bulk density0.9408 g/cm3
Boiling point361 °C
Melting point69.3 °C
Vapor pressure0.01 kPa (158 °C)
Solubility (in water)0.00029 g/100 g (20 °C)
Table 2. Slump grouping of EP particles coated with SA.
Group NameControl
Samples
Coated Coarse and Fine EP Particles
Group 1ECPSCP-0.1SCP-0.2SCP-0.3SCP-0.4SCP-0.5
Group 2SCP-1SCP-2SCP-3SCP-4SCP-5
Group 3EFPSFP-0.1SFP-0.2SFP-0.3SFP-0.4SFP-0.5
Group 4SFP-1SFP-2SFP-3SFP-4SFP-5
Table 3. Codes of the mortar samples.
Mixture
Mortar Types
Coating/EP Ratios (%)
Control0.10.20.30.40.512345
Sample Codes
Samples with EFPMF-0MF-0.1MF-0.2MF-0.3MF-0.4MF-0.5MF-1MF-2MF-3MF-4MF-5
Samples with ECPMC-0MC-0.1MC-0.2MC-0.3MC-0.4MC-0.5MC-1MC-2MC-3MC-4MC-5
Table 4. Contents of the mortar mixtures.
Coarse Mortars (MCs)Coarse Mortar ComponentsFine Mortars
(MFs)
Fine Mortar ComponentsPercentage by Weight
(%)
MC-0ECPMF-0EFP30
MC-0.1SCP-0.1MF-0.1SFP-0.1
MC-0.3SCP-0.3MF-0.3SFP-0.3
MC-0.5SCP-0.5MF-0.5SFP-0.5
MC-1SCP-1MF-1SFP-1
MC-3SCP-3MF-3SFP-3
MC-5SCP-5MF-5SFP-5
For all mortarsCementFor all mortarsCement30
Powder LimePowder Lime4
Powder polymerPowder polymer2.5
Glass fiberGlass fiber1.50
Filling materialFilling material11
SuperplasticizerSuperplasticizer0.10
Calcite + quartzCalcite + quartz20.90
Table 5. Technical properties of mixture compositions of coarse and fine mortars (for a constant flow diameter of 160 mm).
Sample CodesCoarse Mortar Properties
Water/SolidBulk Density of Powder (kg/m3)Bulk Density of Fresh Mortar
(kg/m3)
Dry Bulk Density of Hardened Mortar
(kg/m3)
MC-01.88200489245
MC-0.11.88200491248
MC-0.31.85200496251
MC-0.51.80201491259
MC-11.75202489265
MC-31.63204473274
MC-51.58210481281
Sample CodesFine Mortar Properties
Water/SolidBulk density of powder
(kg/m3)
Bulk density of fresh mortar
(kg/m3)
Dry bulk density of hardened mortar
(kg/m3)
MF-01.38333679339
MF-0.11.38333679345
MF-0.31.33334664346
MC-0.51.33334641346
MF-11.30336617350
MF-31.30339613356
MF-51.28347603366
Table 6. Thermal conductivity values of coarse mortars depending on relative humidity.
Coarse Mortars (MCs) Relative Humidity (%)
0 (dry)358101215
Thermal Conductivity (W/mK)
MC-00.0450.0950.1460.1980.2370.2610.269
MC-0.10.0450.1010.1510.1990.2350.2560.267
MC-0.30.0460.0980.1450.1860.2140.2320.238
MC-0.50.0480.0960.1390.1820.2020.2210.229
MC-10.0490.0950.1360.1780.2020.2210.230
MC-30.0520.0860.1130.1330.1440.1480.153
MC-50.0540.0820.0970.1070.1150.1190.122
Table 7. Thermal conductivity values of fine mortars based on relative humidity.
Fine Mortars (MFs)Relative Humidity (%)
0 (Dry)358101215
Thermal Conductivity (W/mK)
MF-00.0690.1430.2280.3200.3800.4150.427
MF-0.10.0700.1440.2270.3200.3770.4080.416
MF-0.30.0710.1340.2100.2890.3530.3950.407
MC-0.50.0700.0960.1390.1820.2020.2210.229
MF-10.0710.1330.2020.2740.3180.3470.357
MF-30.0730.1260.1850.2430.2790.2930.299
MF-50.0760.1260.1820.2290.2610.2770.285
Disclaimer/Publisher’s Note: The statements, opinions and data contained in all publications are solely those of the individual author(s) and contributor(s) and not of MDPI and/or the editor(s). MDPI and/or the editor(s) disclaim responsibility for any injury to people or property resulting from any ideas, methods, instructions or products referred to in the content.