1. Introduction
The mechanical properties of reinforced concrete (RC) piers are vital for the safety and service life of RC bridges [
1]. In practical engineering, sudden dynamic loads, e.g., vehicle collisions, rockfall impacts, etc., could generate local damage or even the collapse of the RC piers [
2,
3,
4]. Meanwhile, in coastal regions or saline soil areas, RC piers are subjected to the environmental effects characterized by chloride ingress, leading to progressive deterioration, including the corrosion of steel bars and the cracking of the concrete cover [
5,
6]. When corroded RC piers are subjected to the impact loads induced by the aforementioned vehicles or rockfall, not only the nonlinear variation of bearing capacity and ductility, but also the brittle failure would be generated. Therefore, it is necessary to conduct an analysis of the dynamic response and residual bearing capacity of corroded RC piers under impact loading.
Regarding the dynamic response of corroded RC elements under impact loads, numerous experimental studies and numerical simulations have been carried out [
6,
7,
8,
9,
10,
11,
12]. Tamai et al. [
7] studied the mechanical properties of corroded RC beams under static and impact loads on the basis of drop hammer impact tests. It was found that when the corrosion rate of the steel bars exceeded 10%, the impact resistance of the beams significantly decreased and the failure mode tended to be brittle. The weakening effect of corrosion on the dynamic response under impact loading was much higher than that on the bearing capacity under static loading. In the study of Gu et al. [
8], it was concluded that as the corrosion rate increased from 10% to 20%, the number of diagonal cracks in the RC beams after impact loading increased and the location of cracks tended to be near the impact point with obvious shear damage. Similarly, the experimental study of corroded short columns under impact loading conducted by Bo [
9] indicated that as the corrosion rate increased from 5% to 10%, the duration of the impact force, the peak impact force, and the peak acceleration increased by 27.9%, 12.3%, and 21.1%, respectively. Wu et al. [
10] experimentally studied the dynamic response of RC columns with corrosion rates of 0 to 15%. It was shown that all of the specimens suffered bending failure, and the specimens with a 15% corrosion rate exhibited severe concrete cracking and spalling phenomena. With the aid of LS-DYNA finite element software, Chen et al. [
11] simulated the dynamic response of RC columns under the impact loading incorporating the action of chloride salt corrosion, in which the effects of steel corrosion on the yield strength and the cross-sectional area of the steel bars, the concrete strength, as well as the bond strength between the steel bars and the concrete were considered, which was verified by the experimental results. It was found that in the stirrup dense zone, the stirrups could significantly improve the impact energy dissipation capacity and inhibit the shear failure. Liu et al. [
12] adopted a two-stage simulation method to analyze the dynamic response, where the implicit analysis was used in the first stage to define the rust expansion stress effect of the corroded RC columns, and the explicit dynamics was used in the second stage to establish a refined finite element model of a vehicle impacting the RC pier. The simulation results showed that after being impacted by the vehicle, the overall damage of the corroded RC pier was severe with an obvious spalling of local concrete. During the service periods of the RC structures, the durability damage degree, e.g., the corrosion rate, would continuously increase with the service time, and hence, the impact resistance of bridge structures during different service periods has received attention recently. For example, Fan et al. [
13] established a model of a barge impacting the RC pier, taking into account the relationship between the corrosion effect of the RC pier changing with service time. The variation of the impact resistance of the RC pier during the service time of up to 100 years was analyzed and it was shown that the displacement of the RC pier at the impact point with the service time of 100 years was at least 1.25 times that of the RC pier with the service time of 50 years. That is, the service time significantly aggravated the corrosion damage, leading to the increased deformation of the RC structures after impact loading. However, the impact loading induced by the rockfalls, ships, and vehicles is different, and the dynamic response of RC piers under rockfall impact during the service periods is still unclear.
After the impact loading, the residual bearing capacity is an important parameter for the safety assessment of the RC piers, which is affected by multiple factors such as the impact energy dissipation mechanism, the collaborative working effect of the reinforcement system, and the nonlinear damage evolution of materials. Liu [
14] conducted a test on the residual bearing capacity of RC columns after the impact loading. Results showed that the residual bearing capacity of RC columns depended on the residual deformation and the failure mode, in which the increase of the residual deformation and the shear failure mode could decrease the residual bearing capacity. Through the numerical simulation, Fan et al. [
15] proposed a prediction formula for the residual bearing capacity considering the influence of the reinforcement ratio and the axial compression ratio. In the study of Zhong et al. [
16], the residual strength analysis, structural damage evaluation, and protection measures were focused on with the establishment of a full-scale numerical model of the RC pier against rockfall. Based on the residual axial capacity, the damage index was established and it was shown that the composite protective structure could enhance anti-collision performances. Luan et al. [
17] proposed a damage prediction formula considering the residual displacement and column height ratio after impact, with a model error of no more than 3.6%. Li et al. [
18] proposed a quantitative evaluation method considering the damage correlation of components through a case study of a vehicle-bridge collision. The Residual Resistance Index (RRI) system proposed by Zhang et al. [
19] successfully quantified the probability distribution characteristics of the performance degradation of RC piers under rockfall impact. In the study of Liu et al. [
20], the vulnerability surface model considering the steel corrosion and explosion loading was established, which provided a probabilistic analysis framework for the performance assessment within the whole life cycle. Zhou et al. [
21] investigated the failure mechanism and residual bearing capacity of RC bridge columns with bottom corrosion in coastal areas under non-close-range blast effects, and it was found that the influence of corrosion on the residual bearing capacity of RC bridge columns under blast loads varied with the scaled blast distance. Nevertheless, among the previous studies [
13,
14,
15,
16], the residual bearing capacity and damage assessment of RC piers after being impacted by rockfalls, especially considering the corrosion variation during the service periods, are rarely investigated.
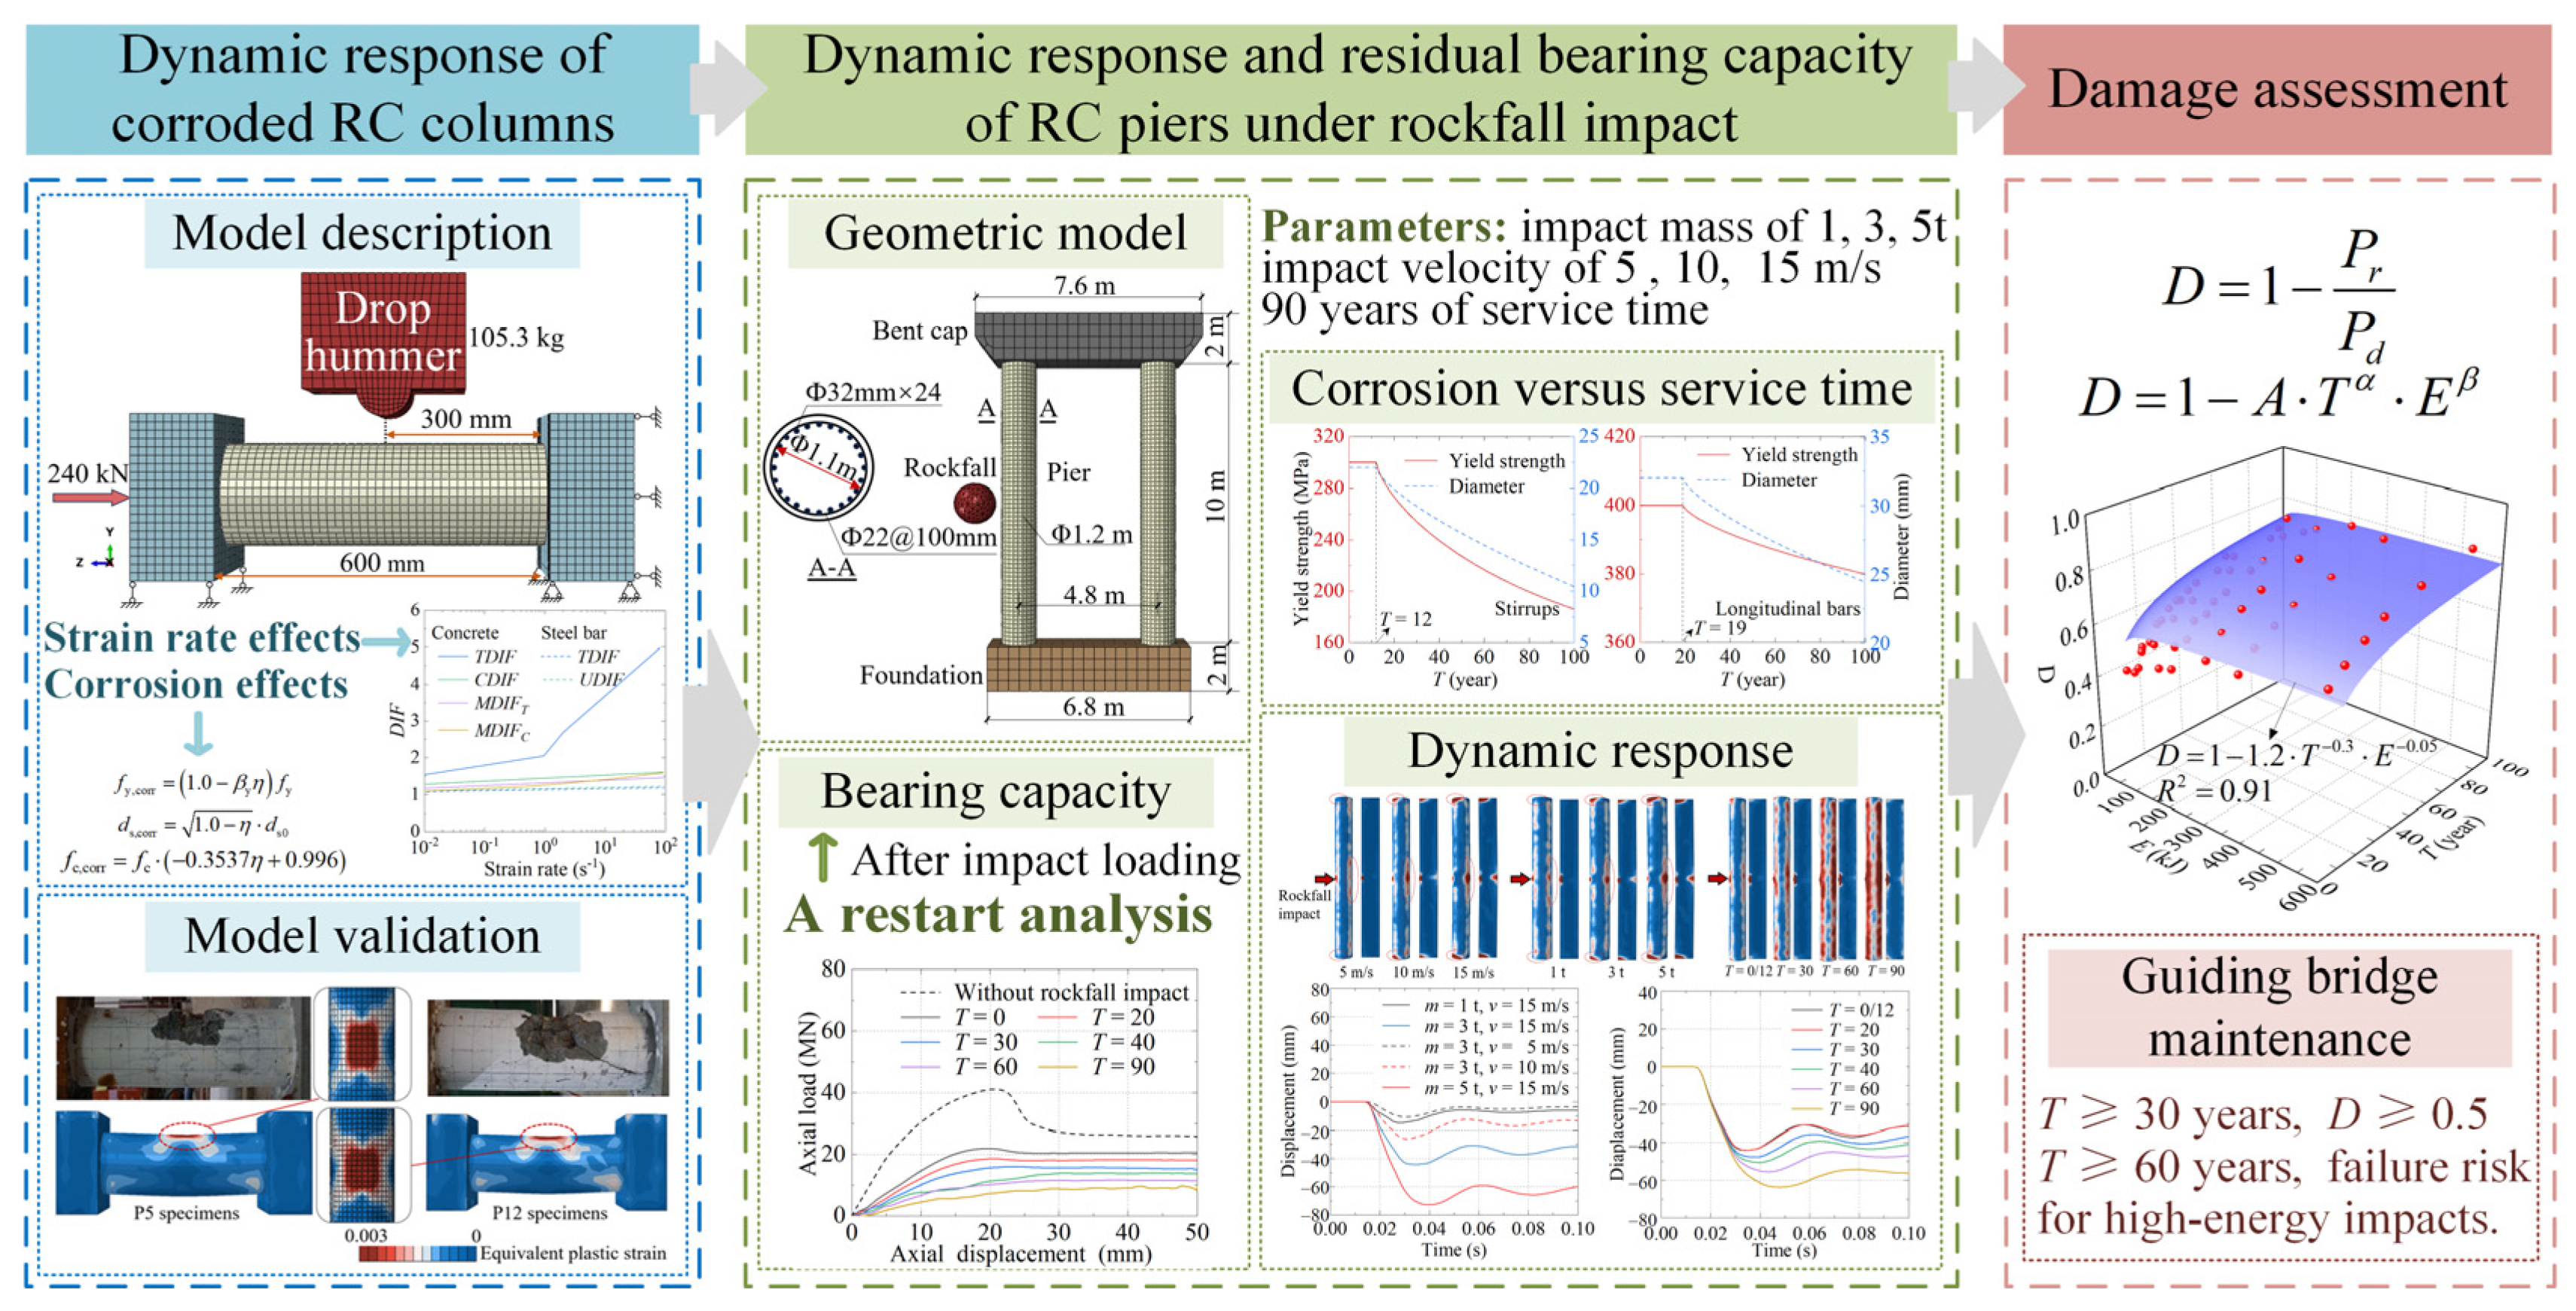
Therefore, in this study, the dynamic response and residual bearing capacity of corroded RC piers under rockfall impact, incorporating the corrosion variations during the service time of up to 90 years, are concentrated following the research framework diagram as shown in
Figure 1. Specifically, a numerical analysis model of the dynamic response of corroded RC columns under impact loading is first established and verified. Then, based on the above model, the dynamic response and residual bearing capacity of an actual RC pier after being impacted by rockfalls during different service times are analyzed, in which the influences of the impact energy (characterized by the impact mass and impact velocity) and the service time are studied. Finally, a damage assessment formula for the RC piers based on the impact energy and service time is proposed, which would provide a theoretical basis for the impact resistance performance and safety assessment of the RC structures. In terms of the dynamic response and residual bearing capacity of corroded RC columns under impact loading,
Table 1 summarizes the research details of the related numerical simulation research [
11,
12,
13,
15,
16,
17,
18,
19,
21] and this study, to further streamline the comparative analysis, indicating that this study is the first to evaluate the combined effects of rockfall impacts and long-term corrosion in a fully validated numerical framework.
3. Model Description of RC Piers Under Rockfall Impact During Different Service Times
Based on the above-mentioned modeling method for corroded RC columns under impact loads, a case study of an RC pier in the western mountainous area of China is carried out. With consideration of the corrosion degree variation of steel bars during the service life, an analysis model for the dynamic response and residual bearing capacity of the RC pier after being impacted by rockfalls during different service times is established. The influences of the impact energy € represented by the impact mass (labeled as “
m”) and impact velocity (labeled as “
v”), and the service time (labeled as “
T”) up to 90 years are explored, in which the impact energy € can be described as
As concluded by the study of Muraishi et al. [
37], the proportion of rockfall events with impact energy less than 100 kJ is 68%, and the proportion of rockfall events with impact energy less than 1000 kJ reaches 90%. Meanwhile, in the study of Hu et al. [
38] focusing on the western mountainous area of China, the impact mass is 5.4 t, and the impact velocity ranges from 10 m/s to 25 m/s. Hence, in this study, the impact masses are set as 1 t, 3 t, and 5 t, while the impact velocities are set as 5 m/s, 10 m/s, and 15 m/s, corresponding to the impact energy range of 12.5 kJ–562.5 kJ.
3.1. Geometric Model
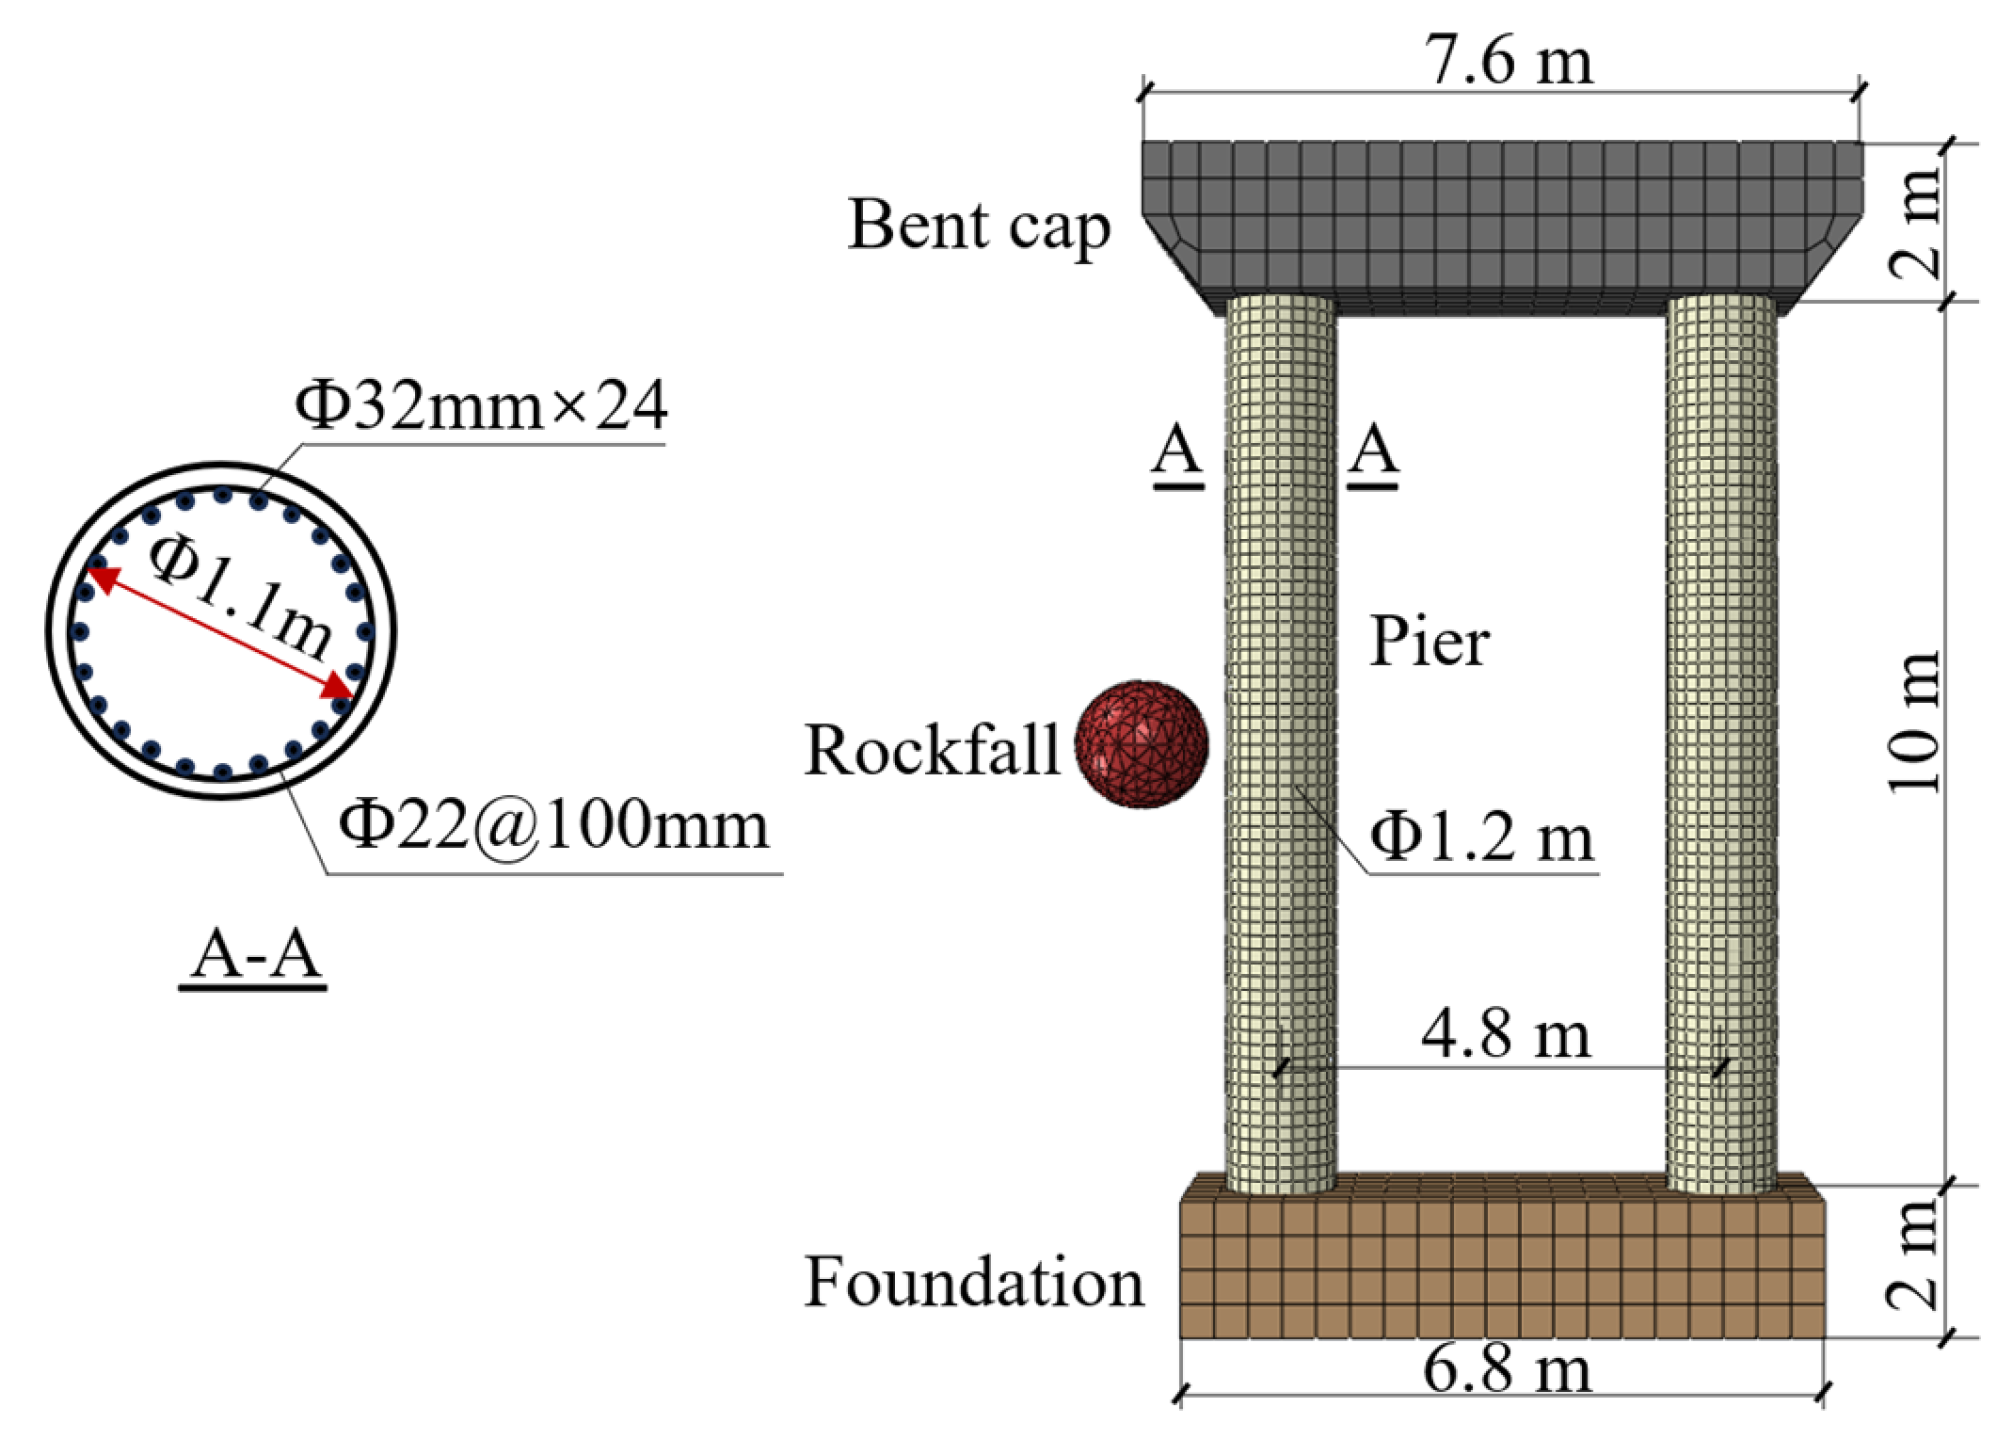
As shown in
Figure 8, the height of the RC pier is 10 m with a cross-sectional diameter of 1.2 m. The concrete strength grade is C40, while the longitudinal bars are HRB400 steel bars and the stirrups are HPB300 steel bars. The thickness of the concrete cover is 50 mm. Referring to the existing studies [
39,
40], the foundation and the cap beam are set as elastic bodies, and the contact type with the pier body is set as a tie constraint to simplify the model. According to the study of Gu [
41], the rockfall is modeled as a spherical elastic body, and it is assumed that the material is granite with a density of 3200 kg/m
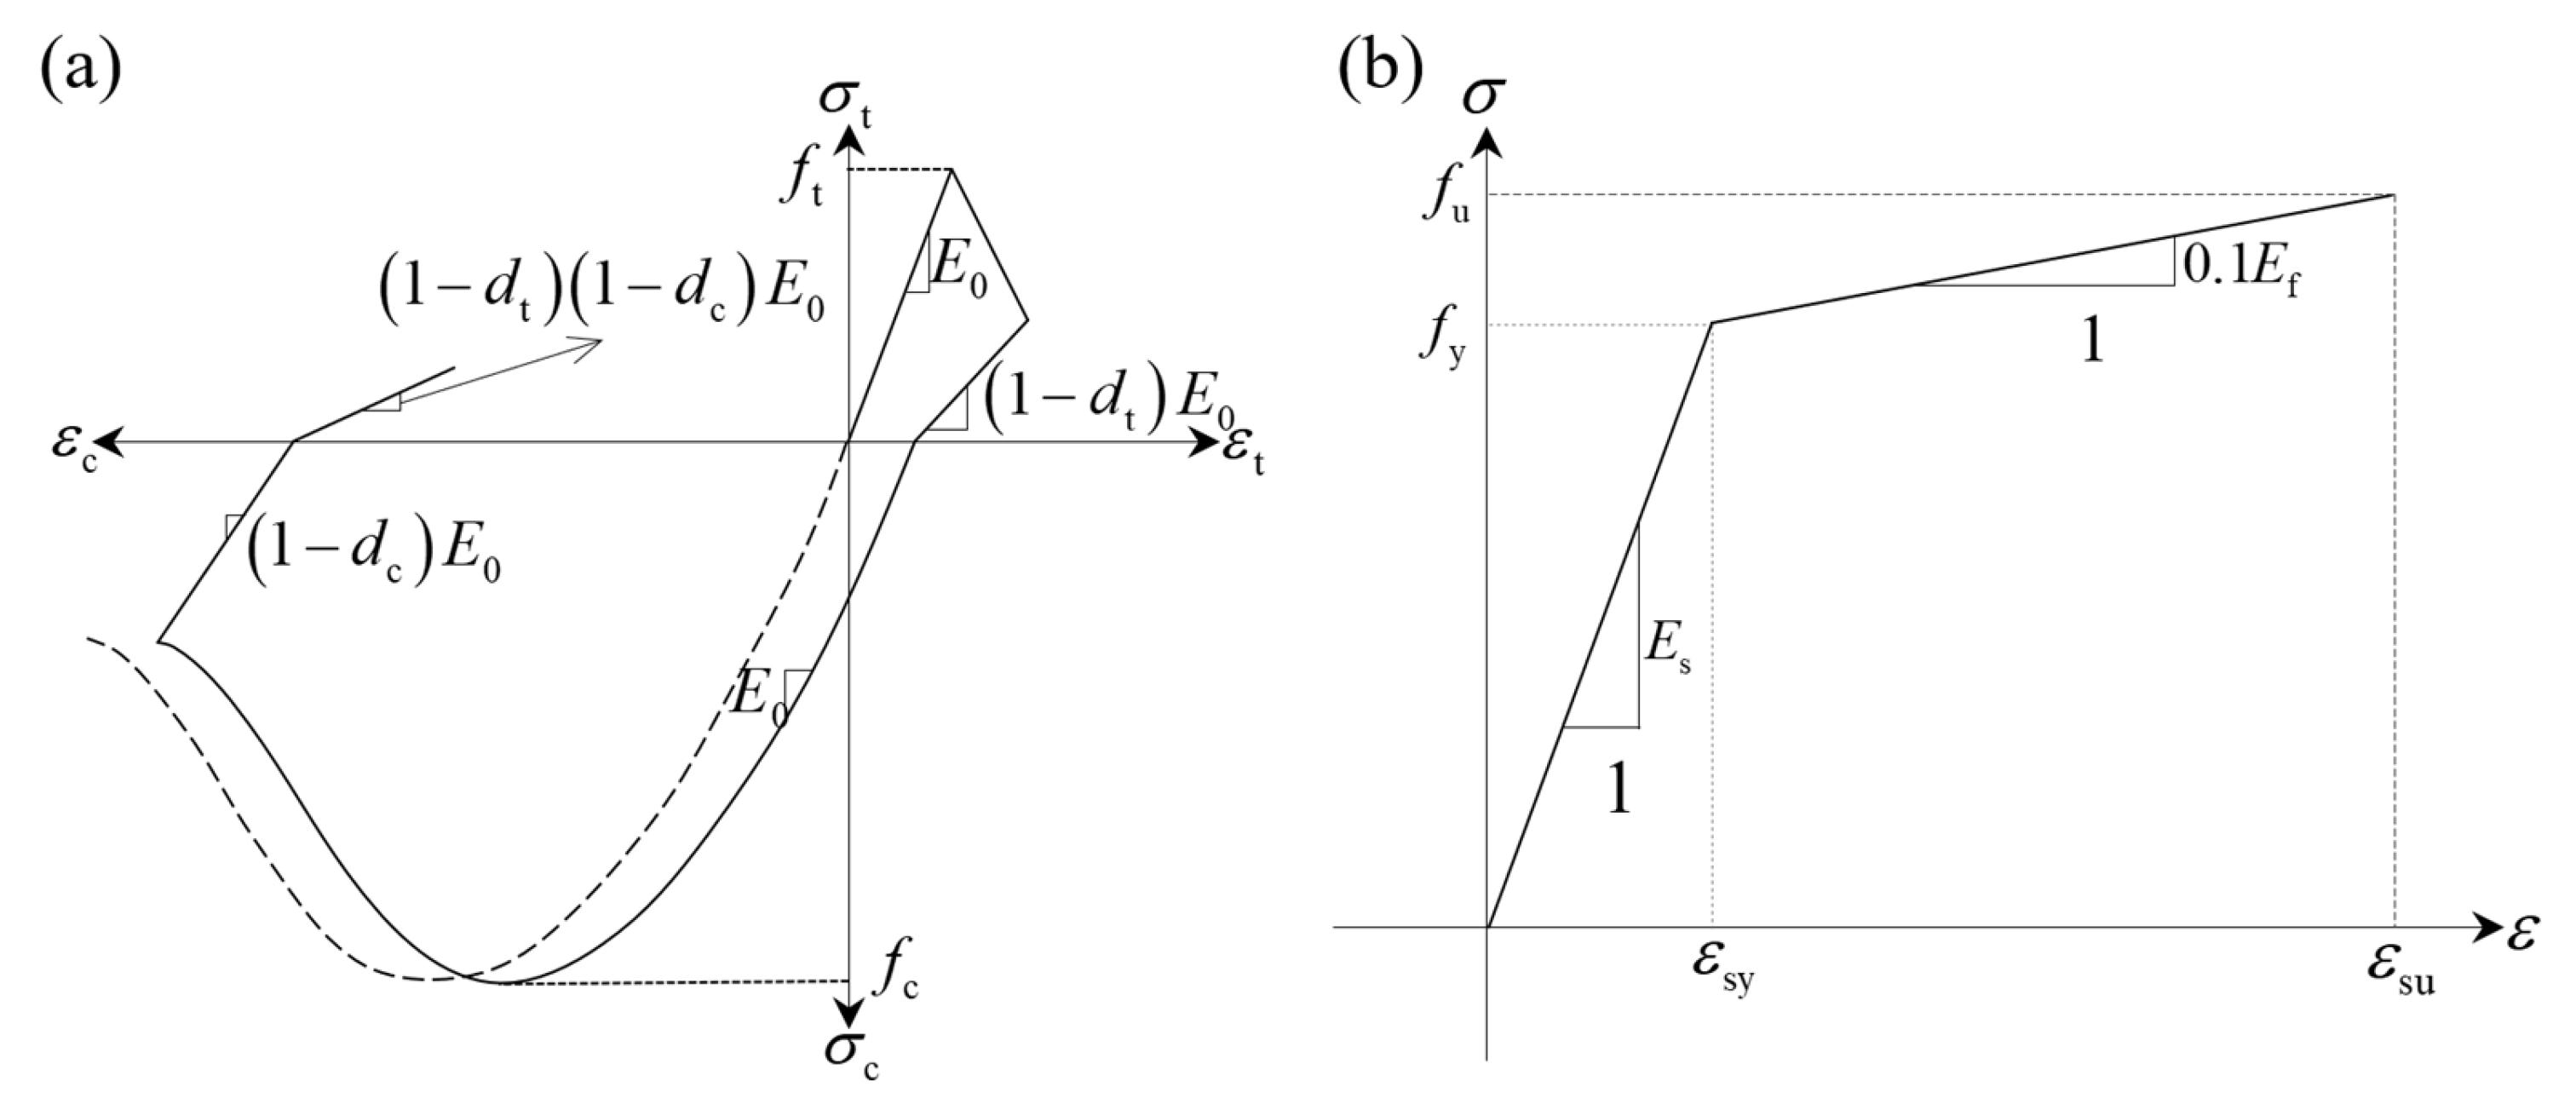
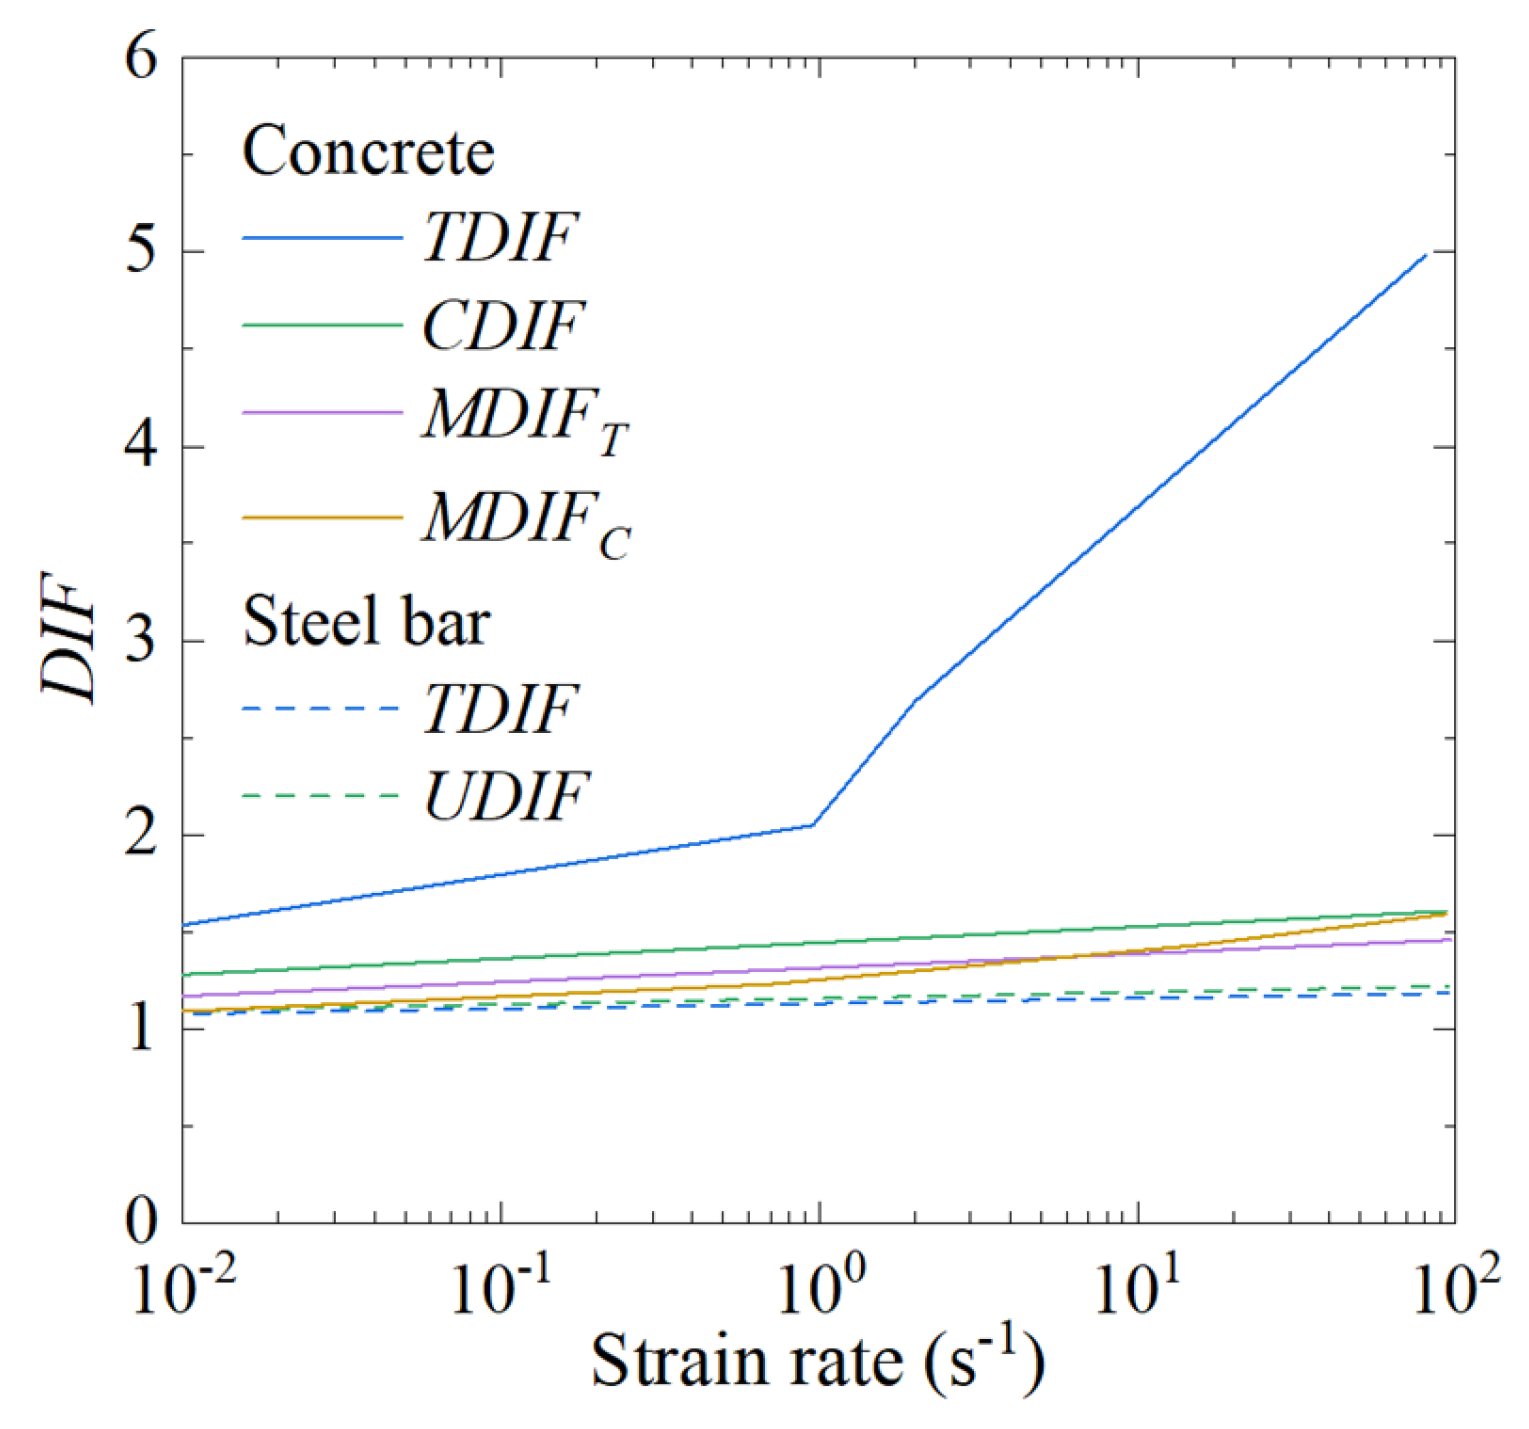
3, an elastic modulus of 26 GPa, and a Poisson’s ratio of 0.3. The concrete and steel bars adopt the same material properties and constitutive models as described above in
Section 2.1. The method of applying the axial force is the same as the method mentioned in
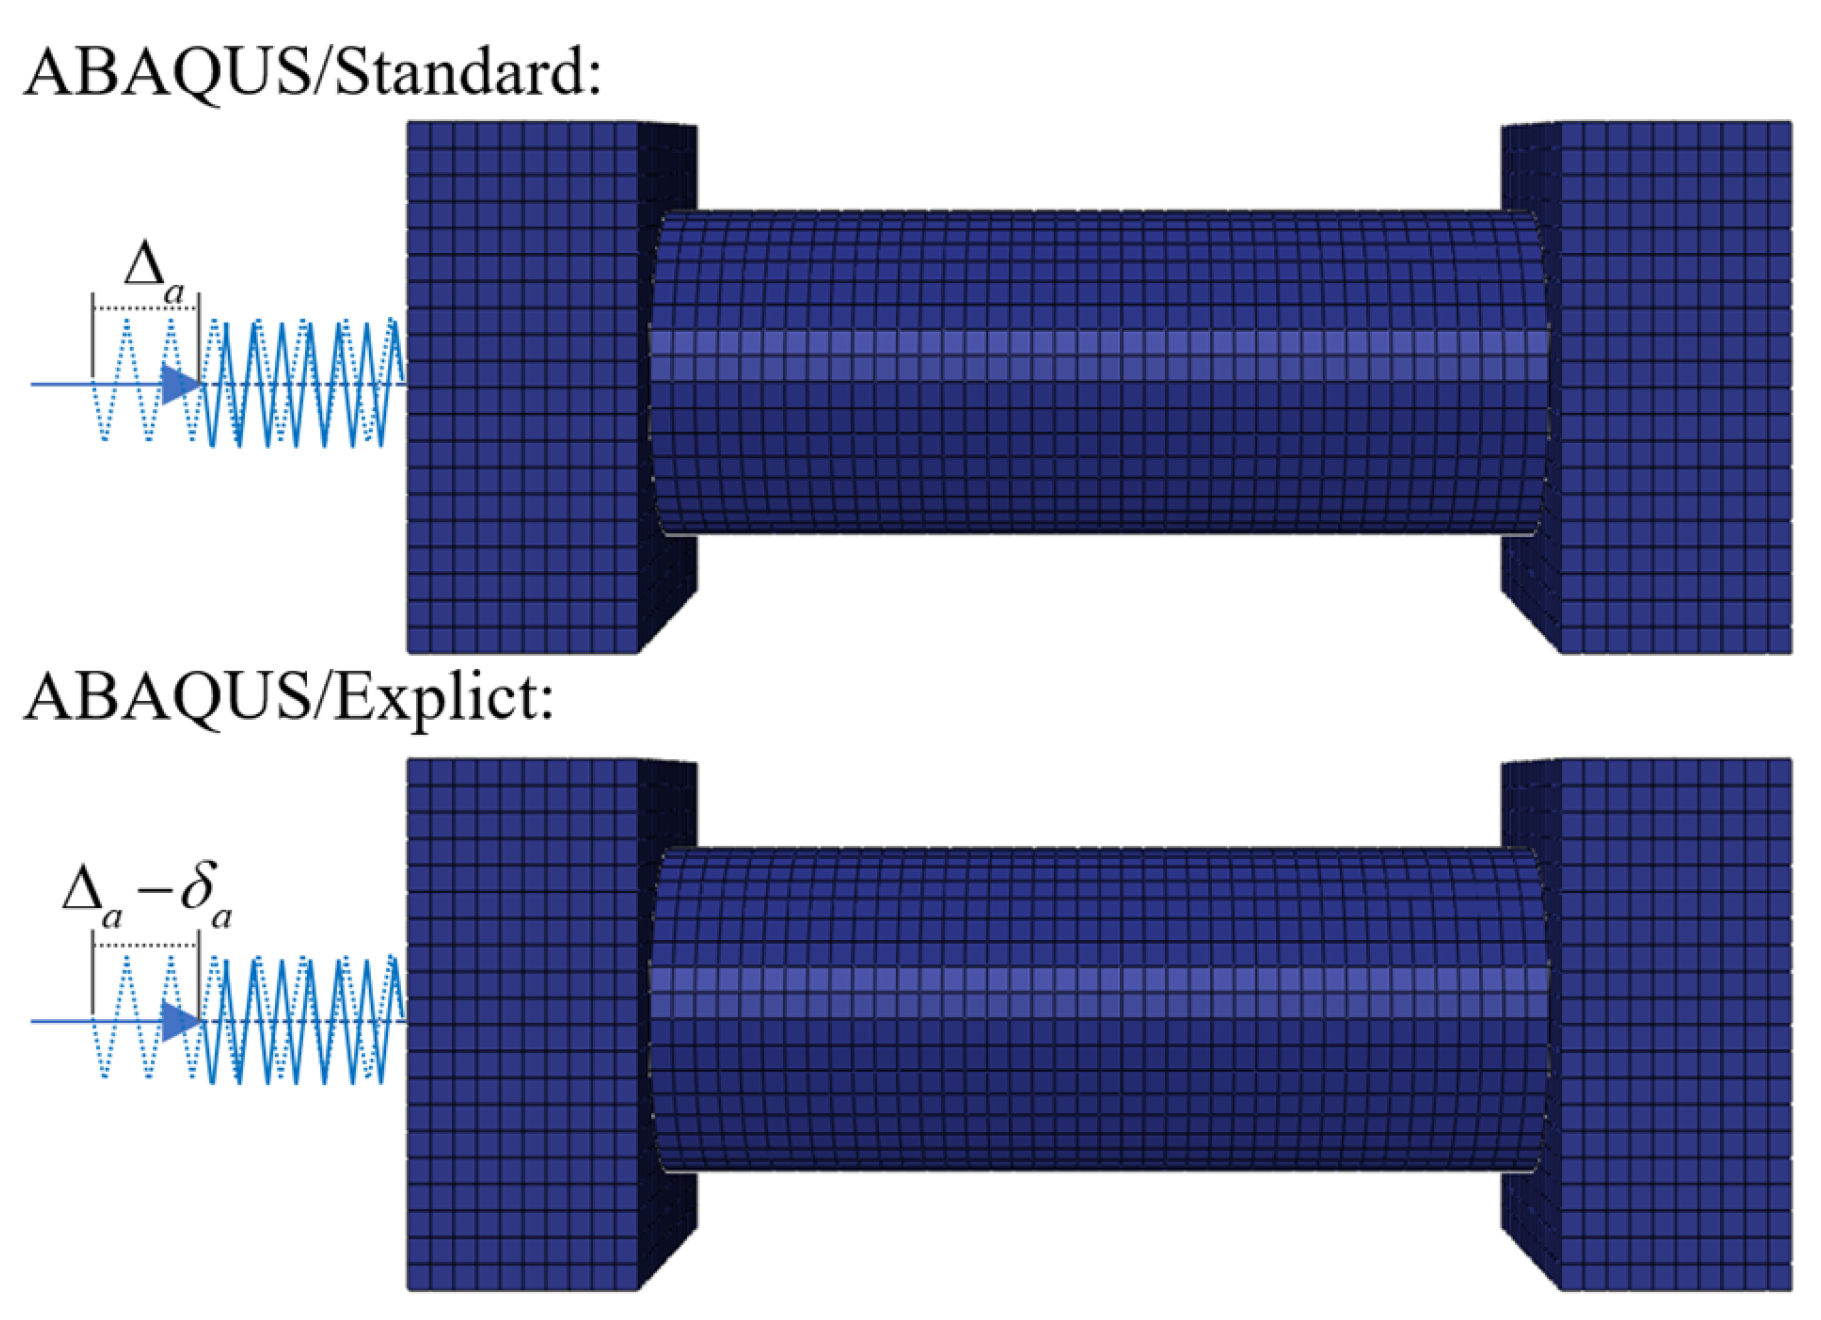
Section 2.1, i.e., an axial force with an axial compression ratio of 0.2 [
22] is applied to the top of the cap beam. The boundary condition is that the foundation is completely fixed, and the constraints in directions other than the axial direction of the cap beam are restricted. Referring to the investigation results of rockfall disasters in the western region of China [
42], the impact position of the rockfall is set at the mid-span of the RC pier.
3.2. Effects of Service Time
With the aid of the Life-365 software [
43], the initiation time of steel corrosion in the RC pier can be obtained by inputting the environmental characteristics (temperature, humidity, etc.). In Life-365 software, the length of this time is a function of the concrete quality, cover thickness, the exposure conditions (the surface chloride and the environmental temperature), and the threshold chloride concentration to initiate corrosion [
43]. Further, for the calculation of the corrosion initiation time, the assumptions included that no damage is considered and the diffusion is the sole chloride transport mechanism in the saturated concrete; however, the chloride transport model, known as Conflux, is capable of dealing with combined diffusion and convection [
43]. The above method for calculating the corrosion initiation time has been verified by the existing studies [
10,
13]. For the above western mountainous area of China, the initiation corrosion time of the stirrups is 12 years, and that of the longitudinal bars is 19 years. After the steel bars start to corrode, the mass loss rate can be determined as follows [
44]:
where
w/
c is the water–cement ratio;
T is the corrosion time of the steel bars (year), i.e., the service time in this study;
Ti is the corrosion initiation time, which could be calculated with the aid of Life-365 software [
43];
a is the thickness of the concrete cover (cm). The influences of the material properties, reinforcement arrangements, and service time on the corrosion variation are incorporated in Equation (4) [
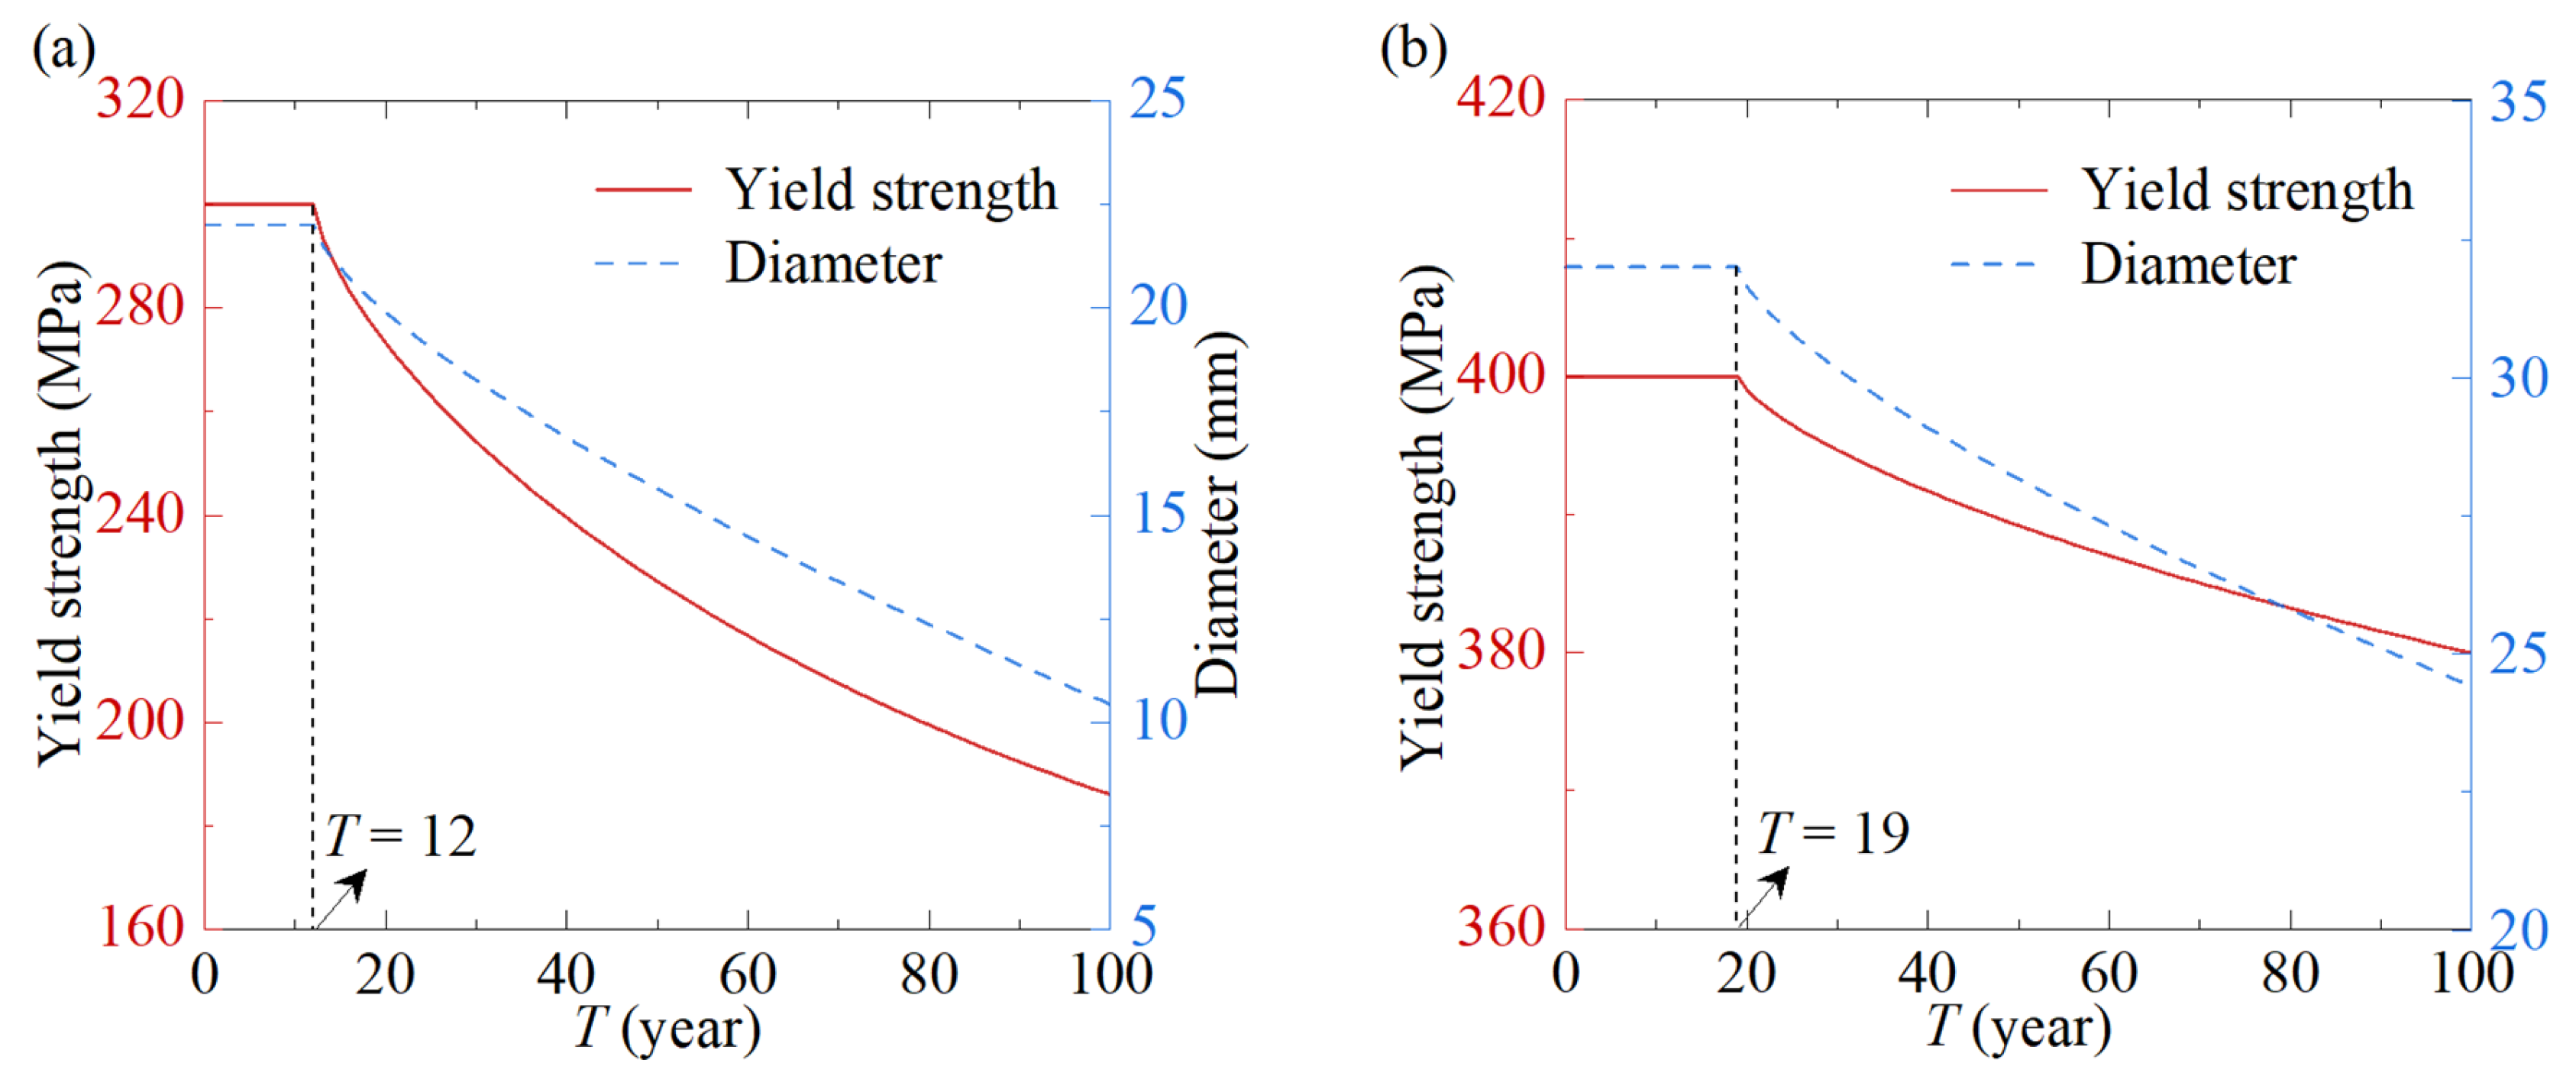
43]. Combined with Equations (1) and (2), the relationships between the strength/diameter of the steel bar and the service time incorporating the steel corrosion can be obtained, as plotted in
Figure 9. In this study, the service times of 0, 20, 30, 40, 60 and 90 years are selected to analyze the dynamic response and residual bearing capacity of the RC pier. In addition, after 12 years, the stirrups begin to corrode; meanwhile, in this study, the mechanical degradation of the materials is merely caused by the steel corrosion, and consequently, the dynamic response and residual bearing capacity are identical for the service time of 0 and 12 years in the following discussions.
3.3. Calculation for the Residual Bearing Capacity
In this study, an axial compression load is applied to the RC pier after the rockfall impact to test its residual bearing capacity, i.e., a restart analysis is carried out through the ABAQUS software. A predefined field is created first. In other words, the state of the RC pier after being impacted is assigned as the initial state before the axial compression. Then, an axial displacement load is applied to the RC pier to test its bearing capacity. The above-mentioned modeling method has been verified by the study of Jin et al. [
45].
4. Results and Discussion
4.1. Failure Mode
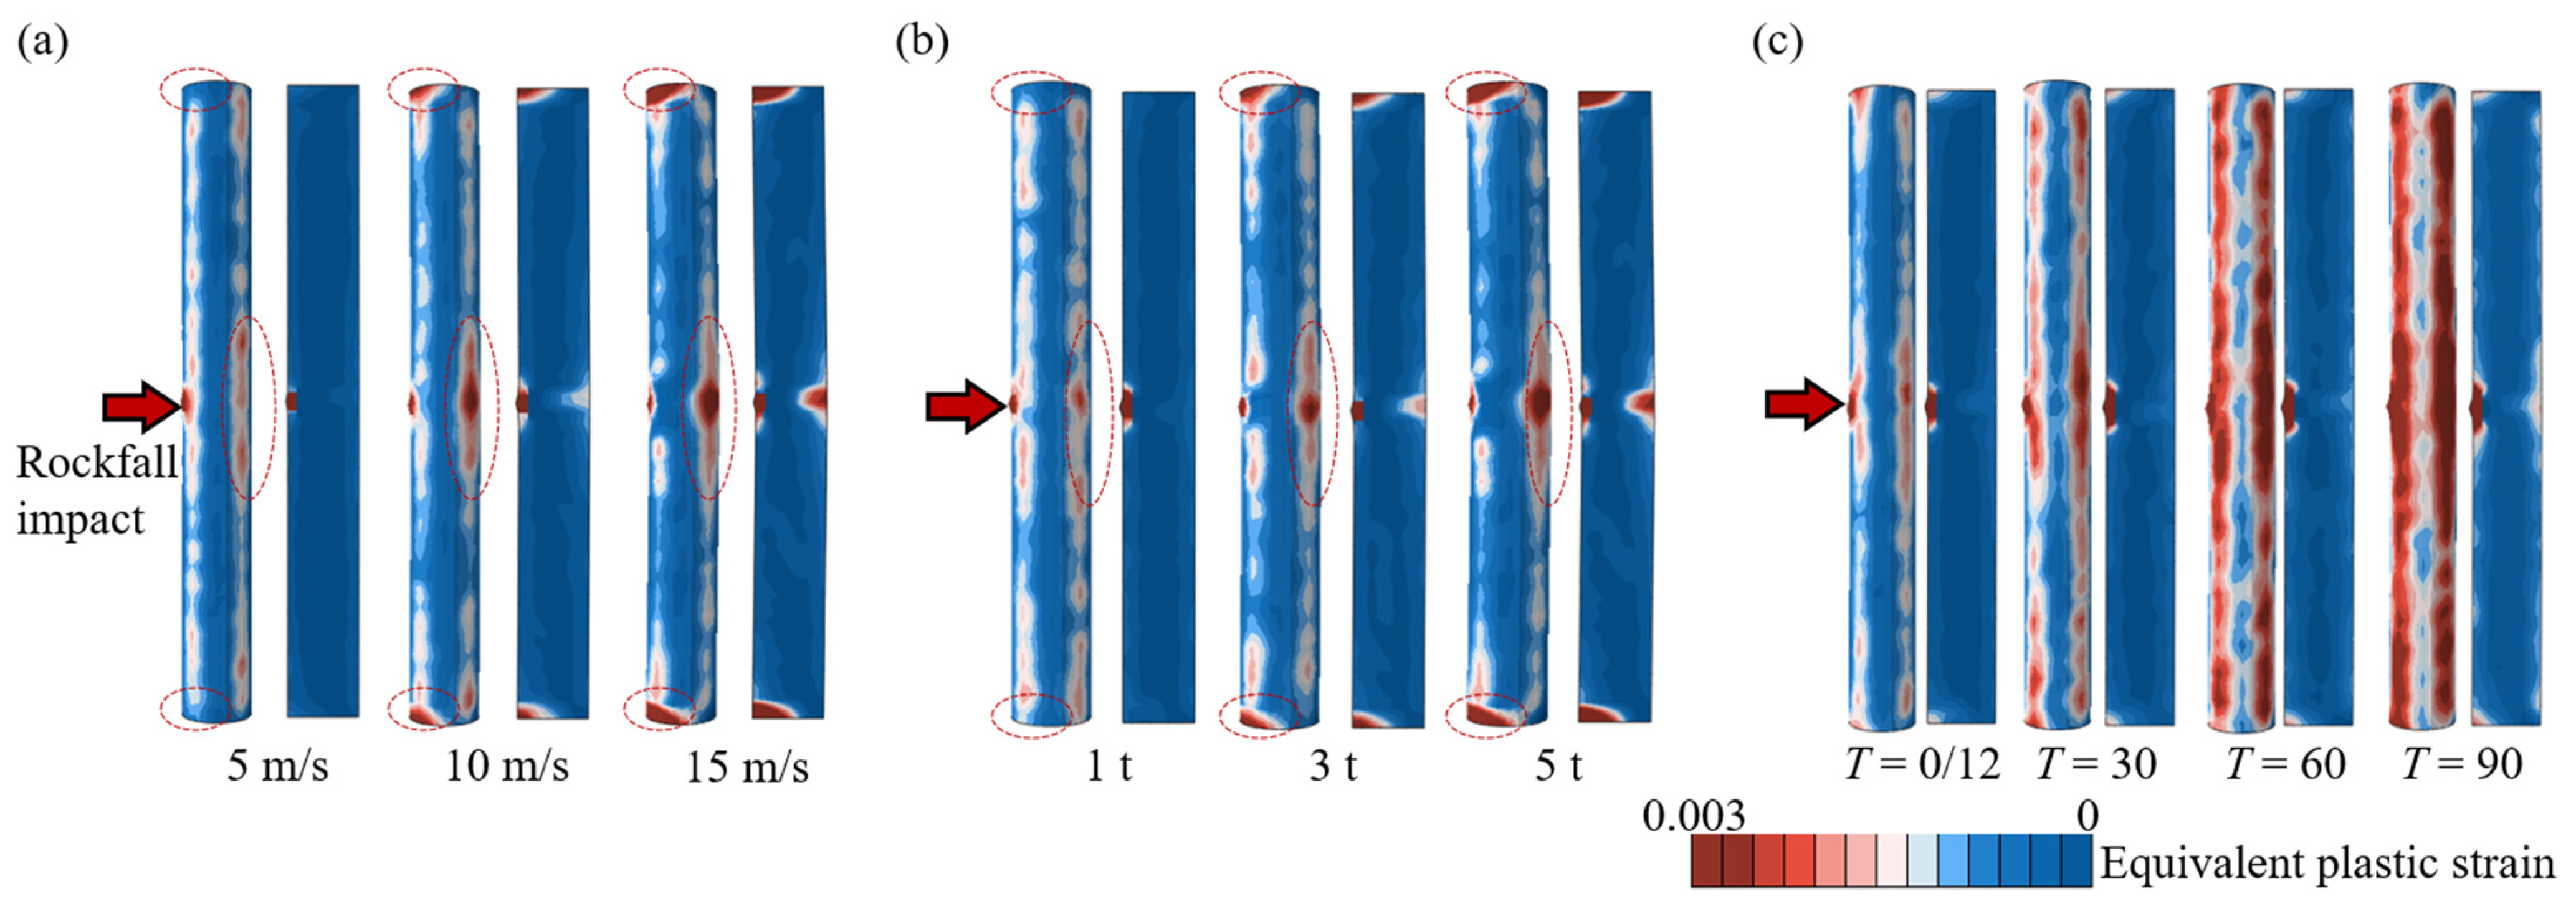
Figure 10 shows the damage contour for the RC pier after the rockfall impact. Firstly, the damage of the bridge pier is mainly concentrated at the connection between the bridge pier and the foundation, the connection between the bridge pier and the cap beam, the impact point of the bridge pier, and the back side of the impact point. As concluded by the study of Pham et al. [
46], the connection between the bridge pier and the foundation/cap beam is generally a weak part of the structure; hence, under impacting loading, this connection area is prone to cracking or plastic deformation. The connection parts need to be strengthened in terms of the structural design. Meanwhile, the local crushing of the concrete caused instantaneously by the impact is likely to cause compressive damage to the concrete and the flexural cracking of the concrete on the back side of the impact point, which expands from the surface of the RC pier to the inside, as shown in the sectional view. Secondly, with the increase of the impact velocity and impact mass, the damage range of the RC pier continuously expands and extends inward, as indicated by
Figure 10a,b. Specifically, when the impact velocity increases from 5 m/s to 15 m/s (
Figure 10a), the area of severe damage (equivalent plastic strain ≥0.003) on the surface of the RC pier increases by 360%, and the damage depth on the back side of the impact point increases from 75 mm to 350 mm. When the velocity reaches 15 m/s, the concrete in the tension zone presents cracks and can hardly bear the load. Similarly, at the impact mass of 1 t (
Figure 10b), the severe damage (equivalent plastic strain ≥ 0.003) is concentrated near the impact point, and the damage depth on the back side of the impact point is 80 mm. As the impact mass increases to 3 t, the severe damage area increases by 79%, and the damage expands towards both ends of the bridge pier, with the damage depth reaching 200 mm on the back side of the impact point. When the impact mass reaches 5 t, the severe damage area increases by 229% in comparison to that when the impact mass is 1 t, and the damage depth reaches 350 mm. In addition, with the increase of the service time, the damage range of the RC pier continuously expands, including the inward expansion of damage and an obvious damage extension on the surface (
Figure 10c). In the early stage of the service (
T = 0), the severe damage (equivalent plastic strain ≥ 0.003) is concentrated near the impact point with a damage depth of 75 mm. At the service time of 30 years, the severe damage range expands to more than twice the service time of 0, and as the service time increases to 60 years, the damage has penetrated through the pier. At 90 years, the severe damage area on the surface of the RC pier accounts for more than 50%, and the damage depth on the back side of the impact point increases to 180 mm, which is about 1.4 times that of the non-corroded pier (
T = 0/12). This indicates that under the combined actions of corrosion and impact, a large area of the concrete on the surface of the bridge pier is damaged, and the damage expands from the surface to the inside.
Therefore, the rockfall impact damage in the RC pier concentrates at pier-foundation/cap beam connections (structurally vulnerable areas), the impact point, and the back side of the impact point. The damage extent expands significantly with impact velocity (e.g., 360% higher of severe damage area, equivalent plastic strain ≥ 0.003, at 15 m/s than 5 m/s), mass (e.g., 229% higher of severe damage area at 5 t than 1 t), and service time. At 90 years of service time, the surface severe damage area exceeds 50%, and backside damage depth reaches 180 mm (1.4 times that of the non-corroded pier), while the damage progresses inward, penetrating the pier section after 60 years.
4.2. Dynamic Response
4.2.1. Impact Force
Figure 11 shows the time history curve of the impact force after being impacted by the rockfall, in which the impact force rapidly reaches its peak within a short period, typically around 0.01–0.02 s, while
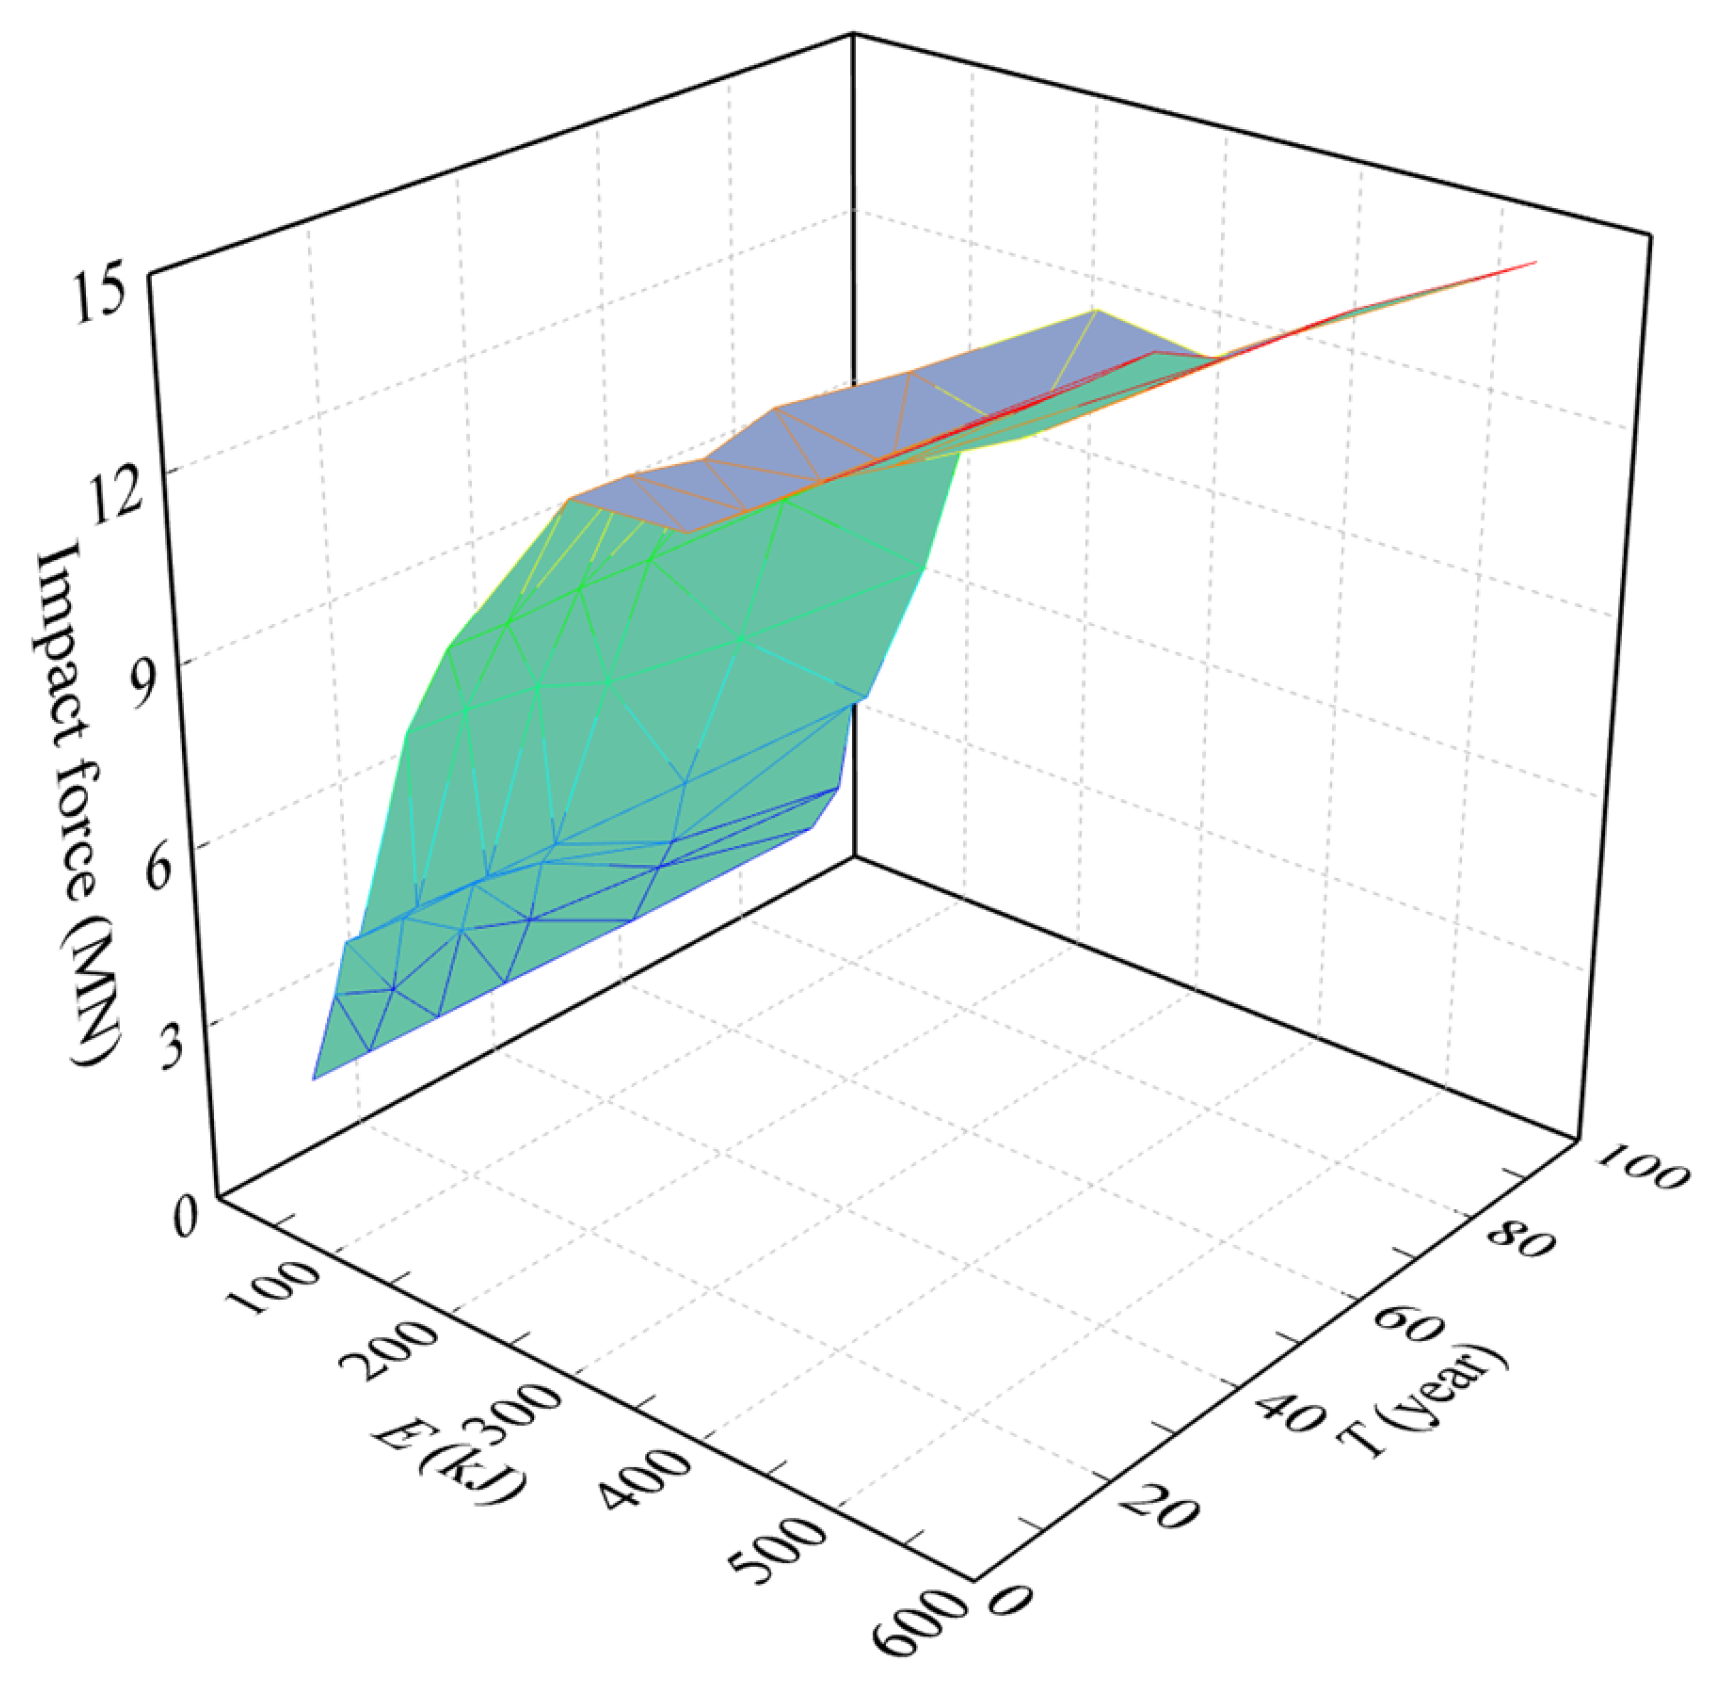
Figure 12 depicts the peak impact force with the variations of the impact energy and service time. On one hand, higher impact velocities and larger impact masses result in greater peak impact forces, while the duration of the impact force increases with the impact mass and decreases with the impact velocity. The increase in mass prolongs the duration through inertia effects and deformation processes, while the rise in velocity shortens the duration resulting from the strain rate effects and accelerated energy release rates. This phenomenon aligns with classical collision theory, which is further amplified in numerical simulations due to the material nonlinearities as verified by references [
47,
48]. As described in
Figure 11a and
Figure 12, when the impact mass is fixed at 3 t, increasing the impact velocity to 15 m/s significantly elevates the peak impact force to about 9.72 MN, which is approximately 3.09 times that with the impact velocity of 5 m/s, while the duration of the impact force is shortened by about 2 ms. Similarly, when the impact velocity is held constant at 10 m/s, increasing the mass from 1 t to 5 t also results in a substantial increase (206.14%) in the peak impact force, and the duration of the impact force increases by about 4 ms.
On the other hand, with the increase in the service time, the peak value of the impact force shows the variation characteristics of continuously decreasing with a significant decrease within the service time of 30 to 60 years. Taking the impact mass of 1 t and impact velocity of 15 m/s as examples in
Figure 11b and
Figure 12, when the service time increases to 30 years, the peak value of the impact force is almost 7.92 MN, with a decrement of 2.73% in comparison to that of 0/12 years, and then as the service time continually increases to 60 years, the peak value of the impact force decreases to about 7.13 MN, i.e., a decrement of 10.00% compared with that of 30 years. When the service time reaches 90 years, the peak value of the impact force decreases to approximately 6.85 MN, with a decrement of 3.96% in comparison to that of 60 years. A possible explanation is that as the service time increases, severe corrosion is generated, leading to a significant decrease in the strength of the steel bars and concrete as plotted in
Figure 9, which in turn leads to a decrease in the contact stiffness between the rockfall and the RC pier, resulting in a decrease in the peak impact force. During the first 30 years of service time, the RC pier undergoes the initial corrosion stage characterized by surface corrosion or microcrack initiation, showing relatively little impact on the overall stiffness. During the service time of 30 to 60 years, the corrosion-induced concrete crack increases and penetrates leading to non-linear stiffness attenuation, while during the last 30 years of service time, the RC pier has lost the majority of the bearing capacity due to previous damage, further degradation would be limited, i.e., significant decreases during the service time of 30 to 60 years.
Thus, peak rockfall impact force occurs within 0.01–0.02 s, increasing nonlinearly with impact velocity (e.g., 3.09 times higher at 15 m/s than 5 m/s for 3 t mass) and mass (e.g., 206.14% higher at 5 t than 1 t for 10 m/s velocity), while force duration lengthens with mass but shortens with velocity. Service time reduces peak force progressively (e.g., 2.73% decreases at 30 years with a following 10.00% decrease at 60 years).
4.2.2. Displacement at the Impact Point
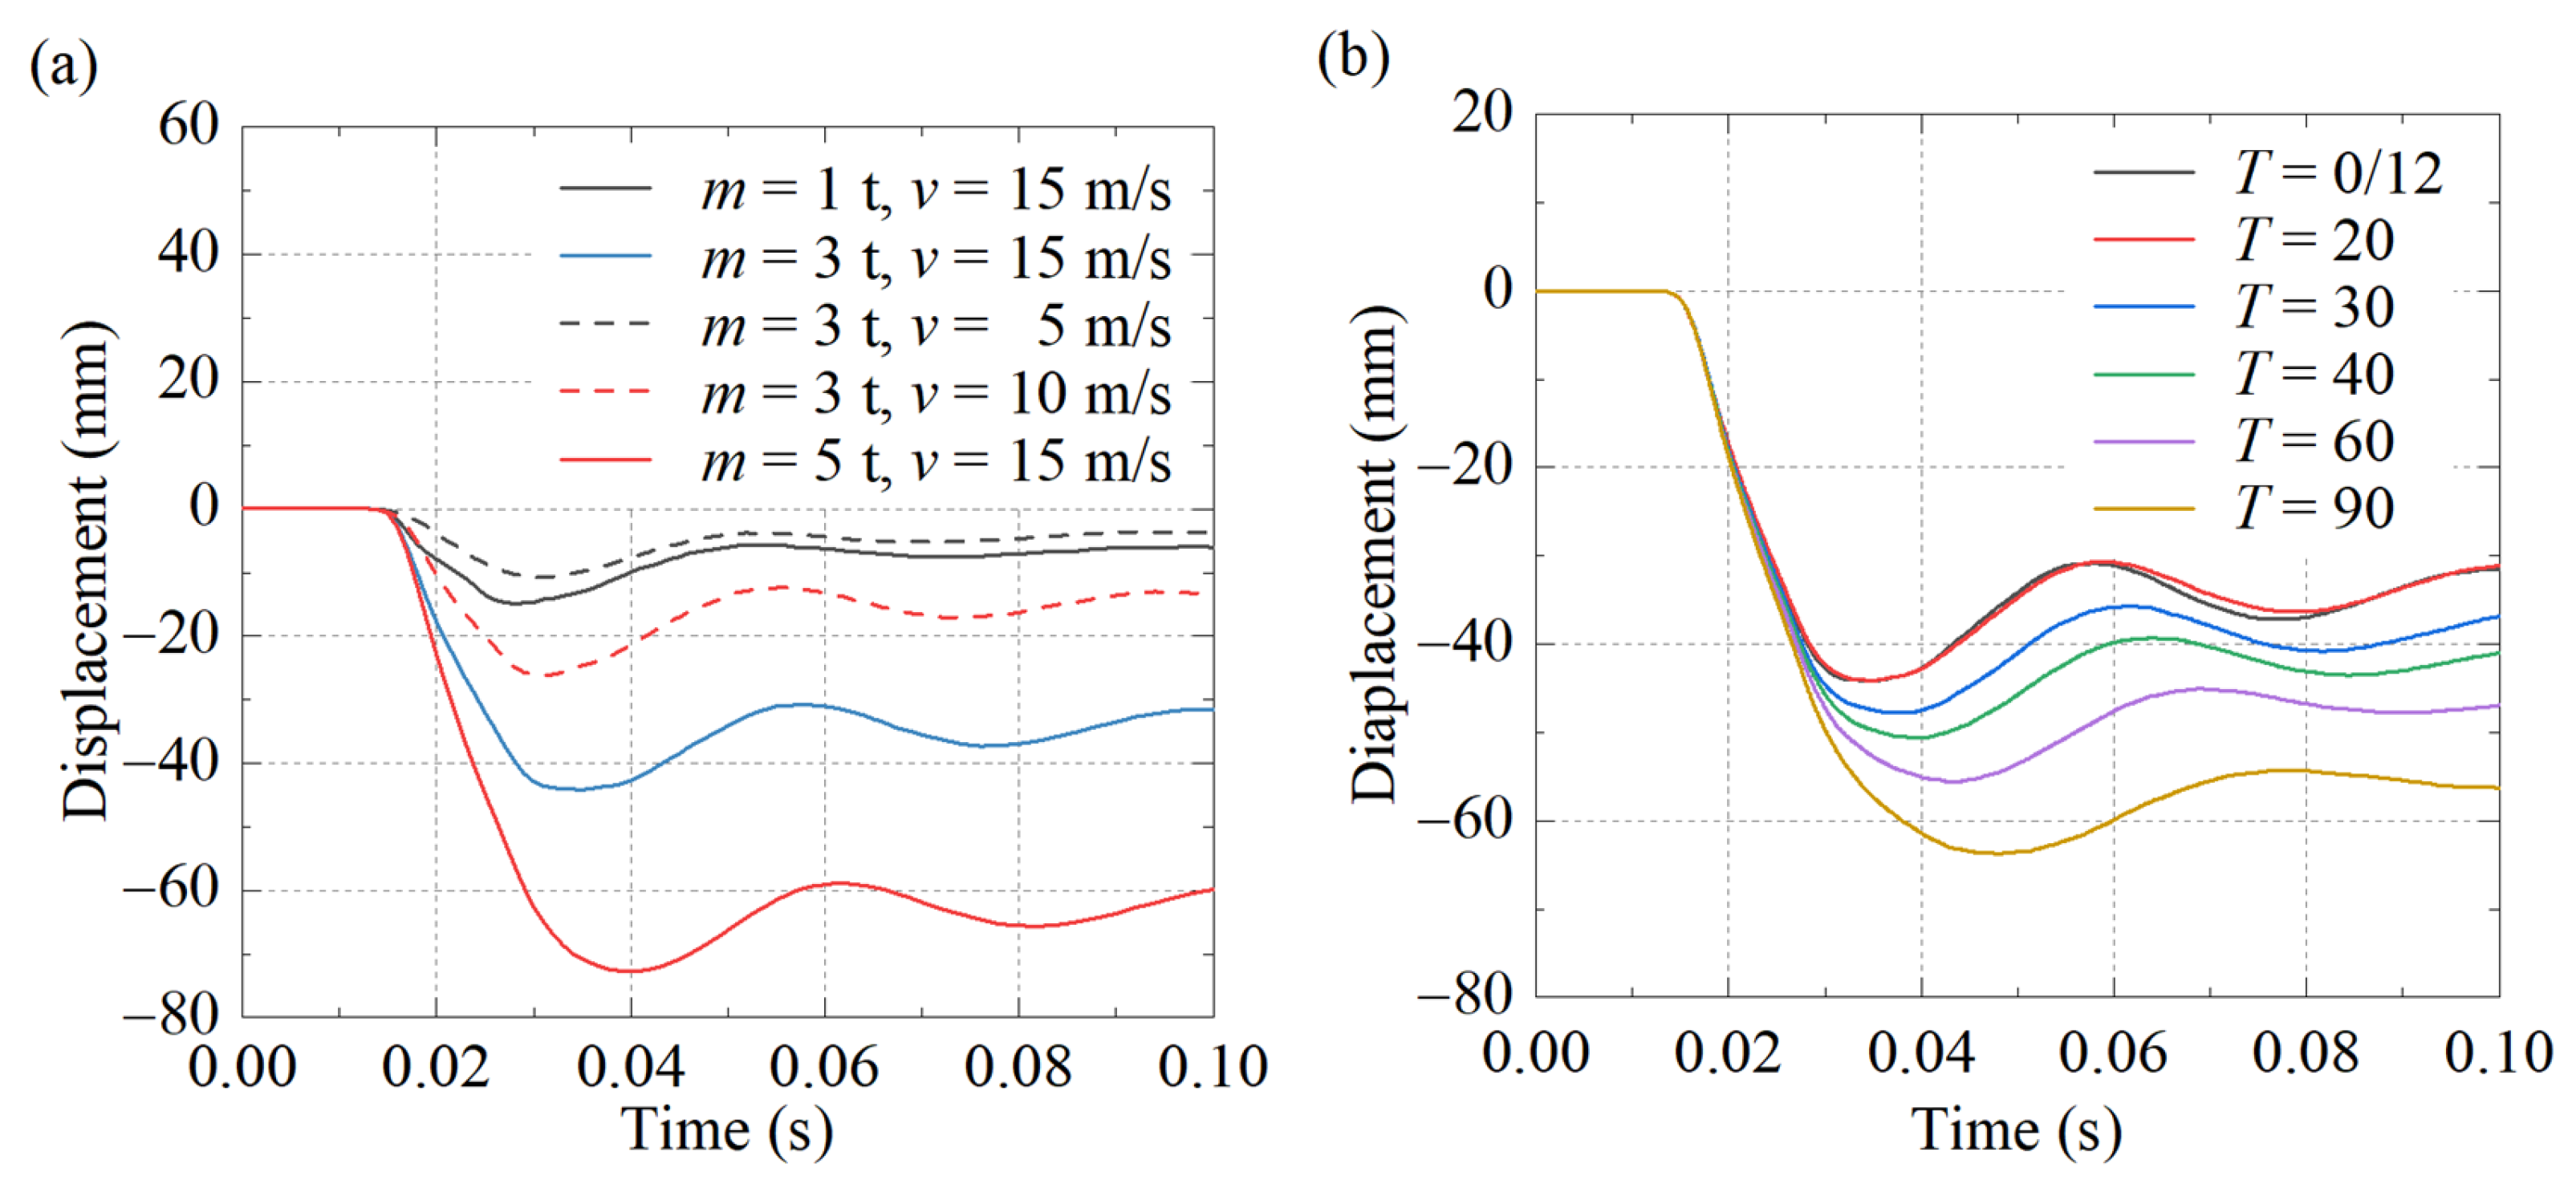
The time history curve of the displacement at the impact point after being impacted by the rockfall is shown in
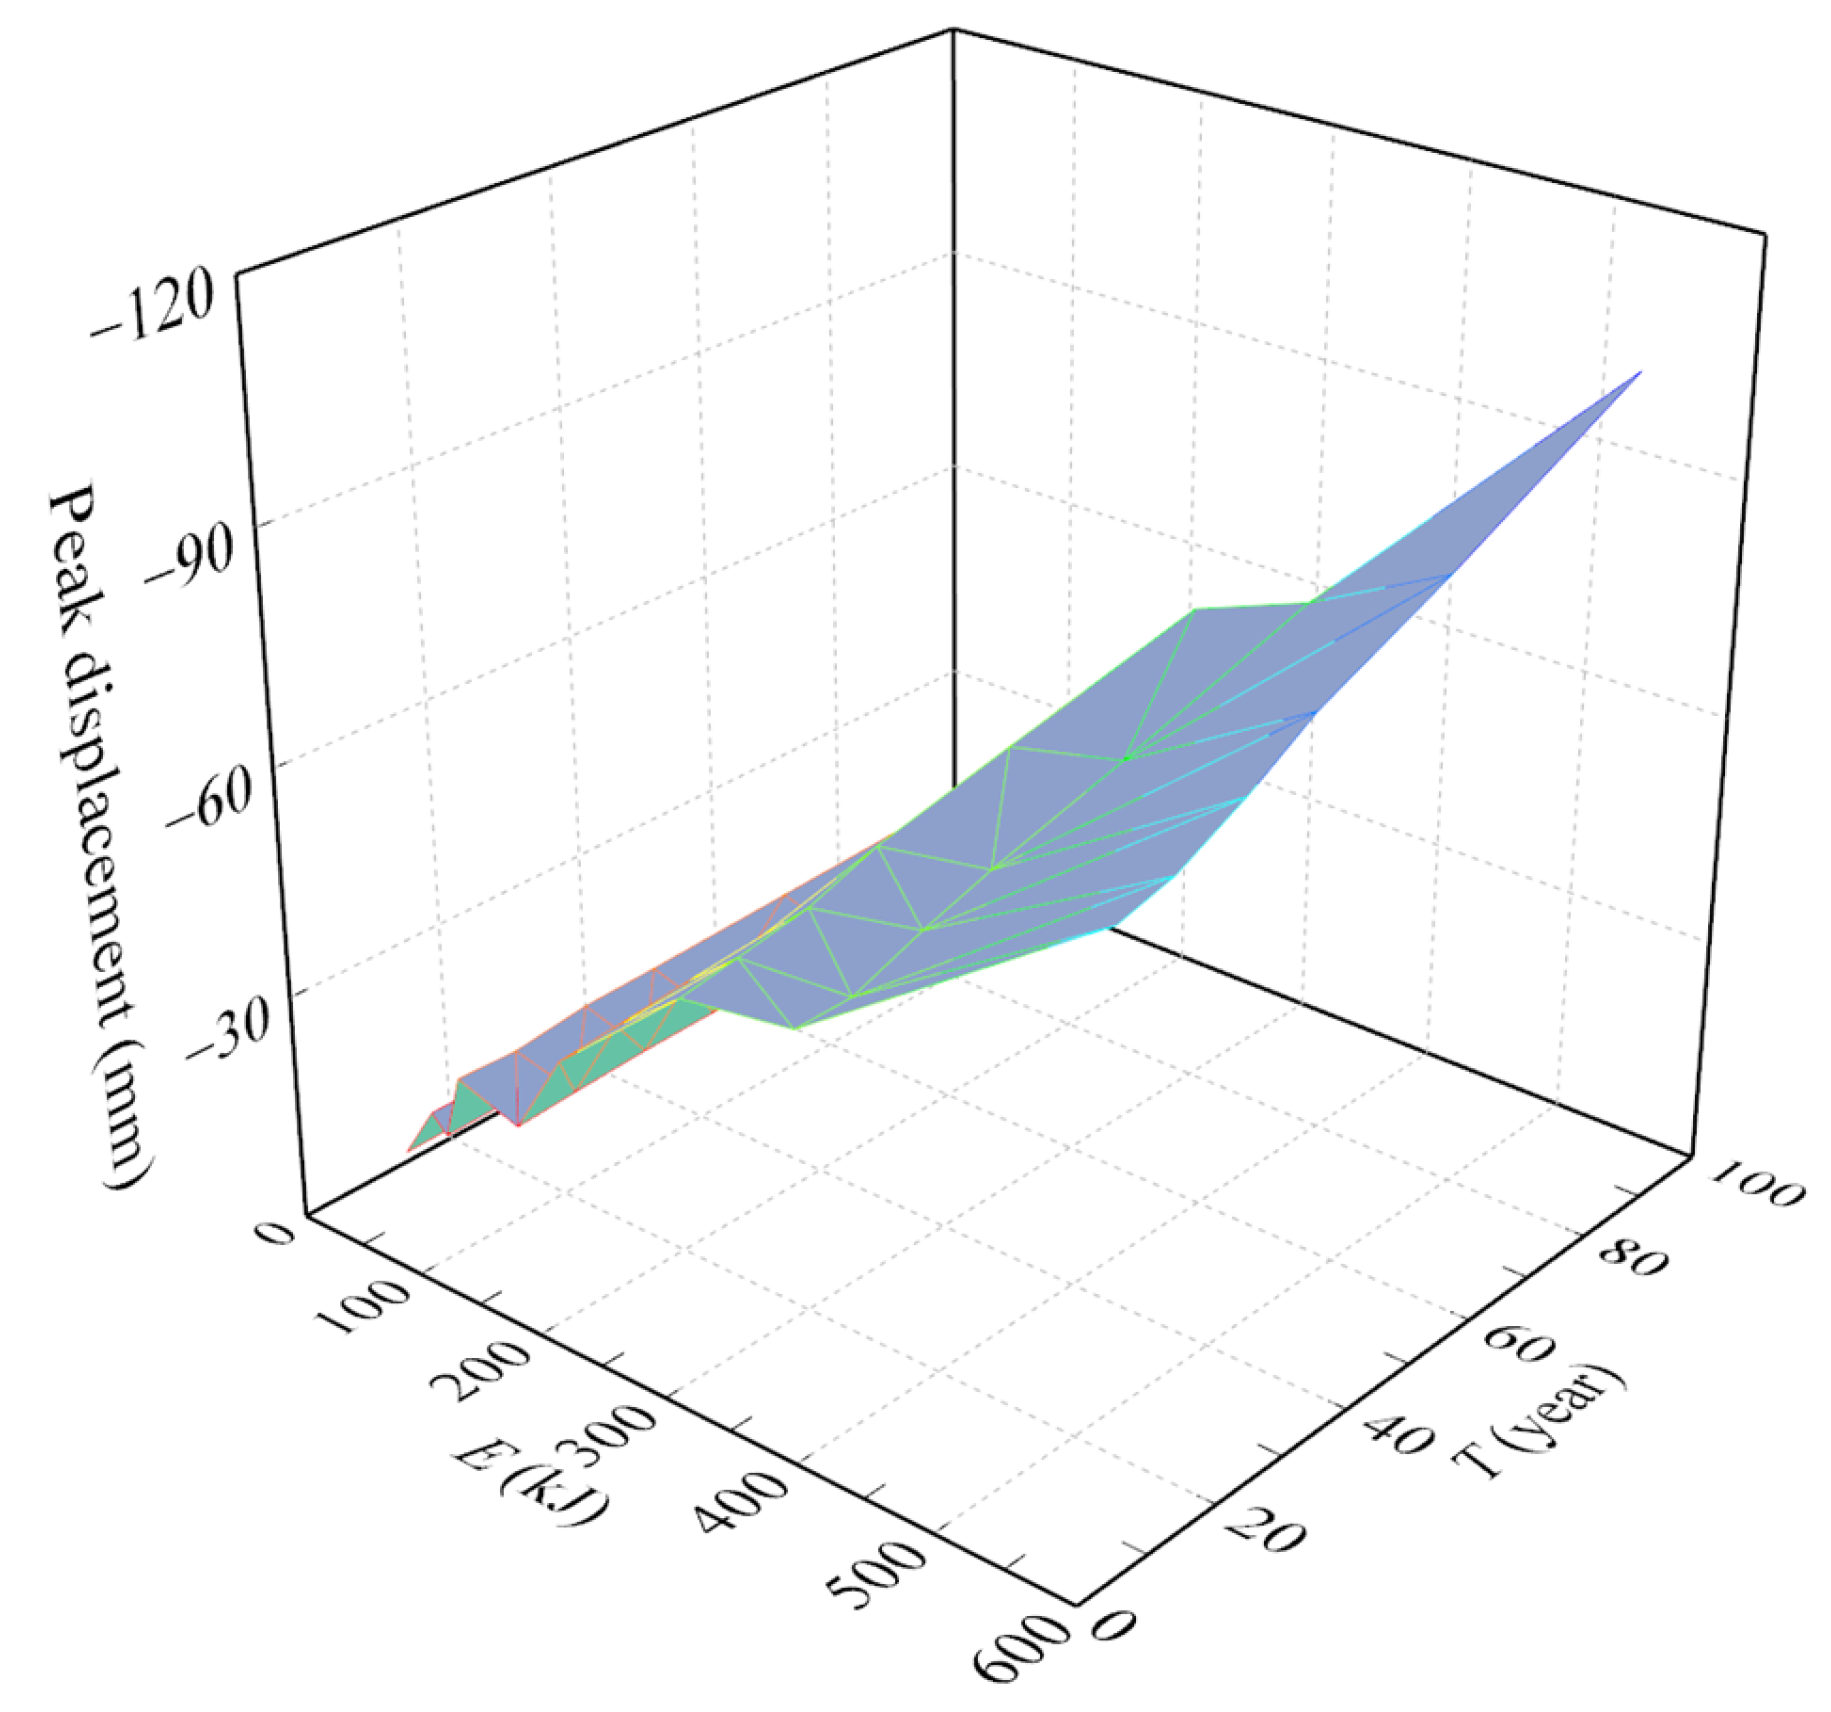
Figure 13, while the peak displacement is plotted in
Figure 14. It is evident that both the peak displacement and the residual displacement increase substantially with the increase in impact velocity and impact mass. When the impact velocity rises from 5 m/s to 15 m/s, the peak displacement experiences a notable increment of 33.41 mm, which is 3.10 times that with the impact velocity of 5 m/s, while the residual displacement surges from 5.02 mm to 33.96 mm. Similarly, as the impact mass increases from 1 t to 5 t, the peak displacement grows by 58.81 mm, and the residual displacement increases by around 55.21 mm. This demonstrates a direct and significant correlation between impact velocity/mass and the displacement response of the RC pier, highlighting the crucial role of these dynamic parameters in determining the structural deformation under impact. In addition, as the service time increases, both the peak displacement and the residual displacement exhibit an upward trend. When the service time is more than 20 years, the peak displacement almost linearly increases with the extension of service time. When the service time increases from 20 years to 90 years, the peak displacement rises by approximately 19.54 mm, and the residual displacement grows by around 22.02 mm. This indicates that over the service time, material degradation and cumulative damage caused by environmental factors increase the structural deformation capacity under impact, suggesting a decline in the overall structural integrity and stiffness of the RC pier. In other words, the long-term service process gradually alters the mechanical properties of the materials, including reducing their strength (
Figure 9), and then decreases the stiffness of the RC pier, thereby increasing the peak displacement under the same condition of rockfall impact [
39].
In summary, peak and residual displacements at the impact point increase with impact velocity (e.g., 33.41 mm peak displacement higher at 15 m/s than 5 m/s) and mass (58.81 mm peak displacement higher at 5 t than 1 t). Service time beyond 20 years induces near-linear growth, e.g., 19.54 mm peak displacement growth from 20 to 90 years.
4.3. Residual Bearing Capacity
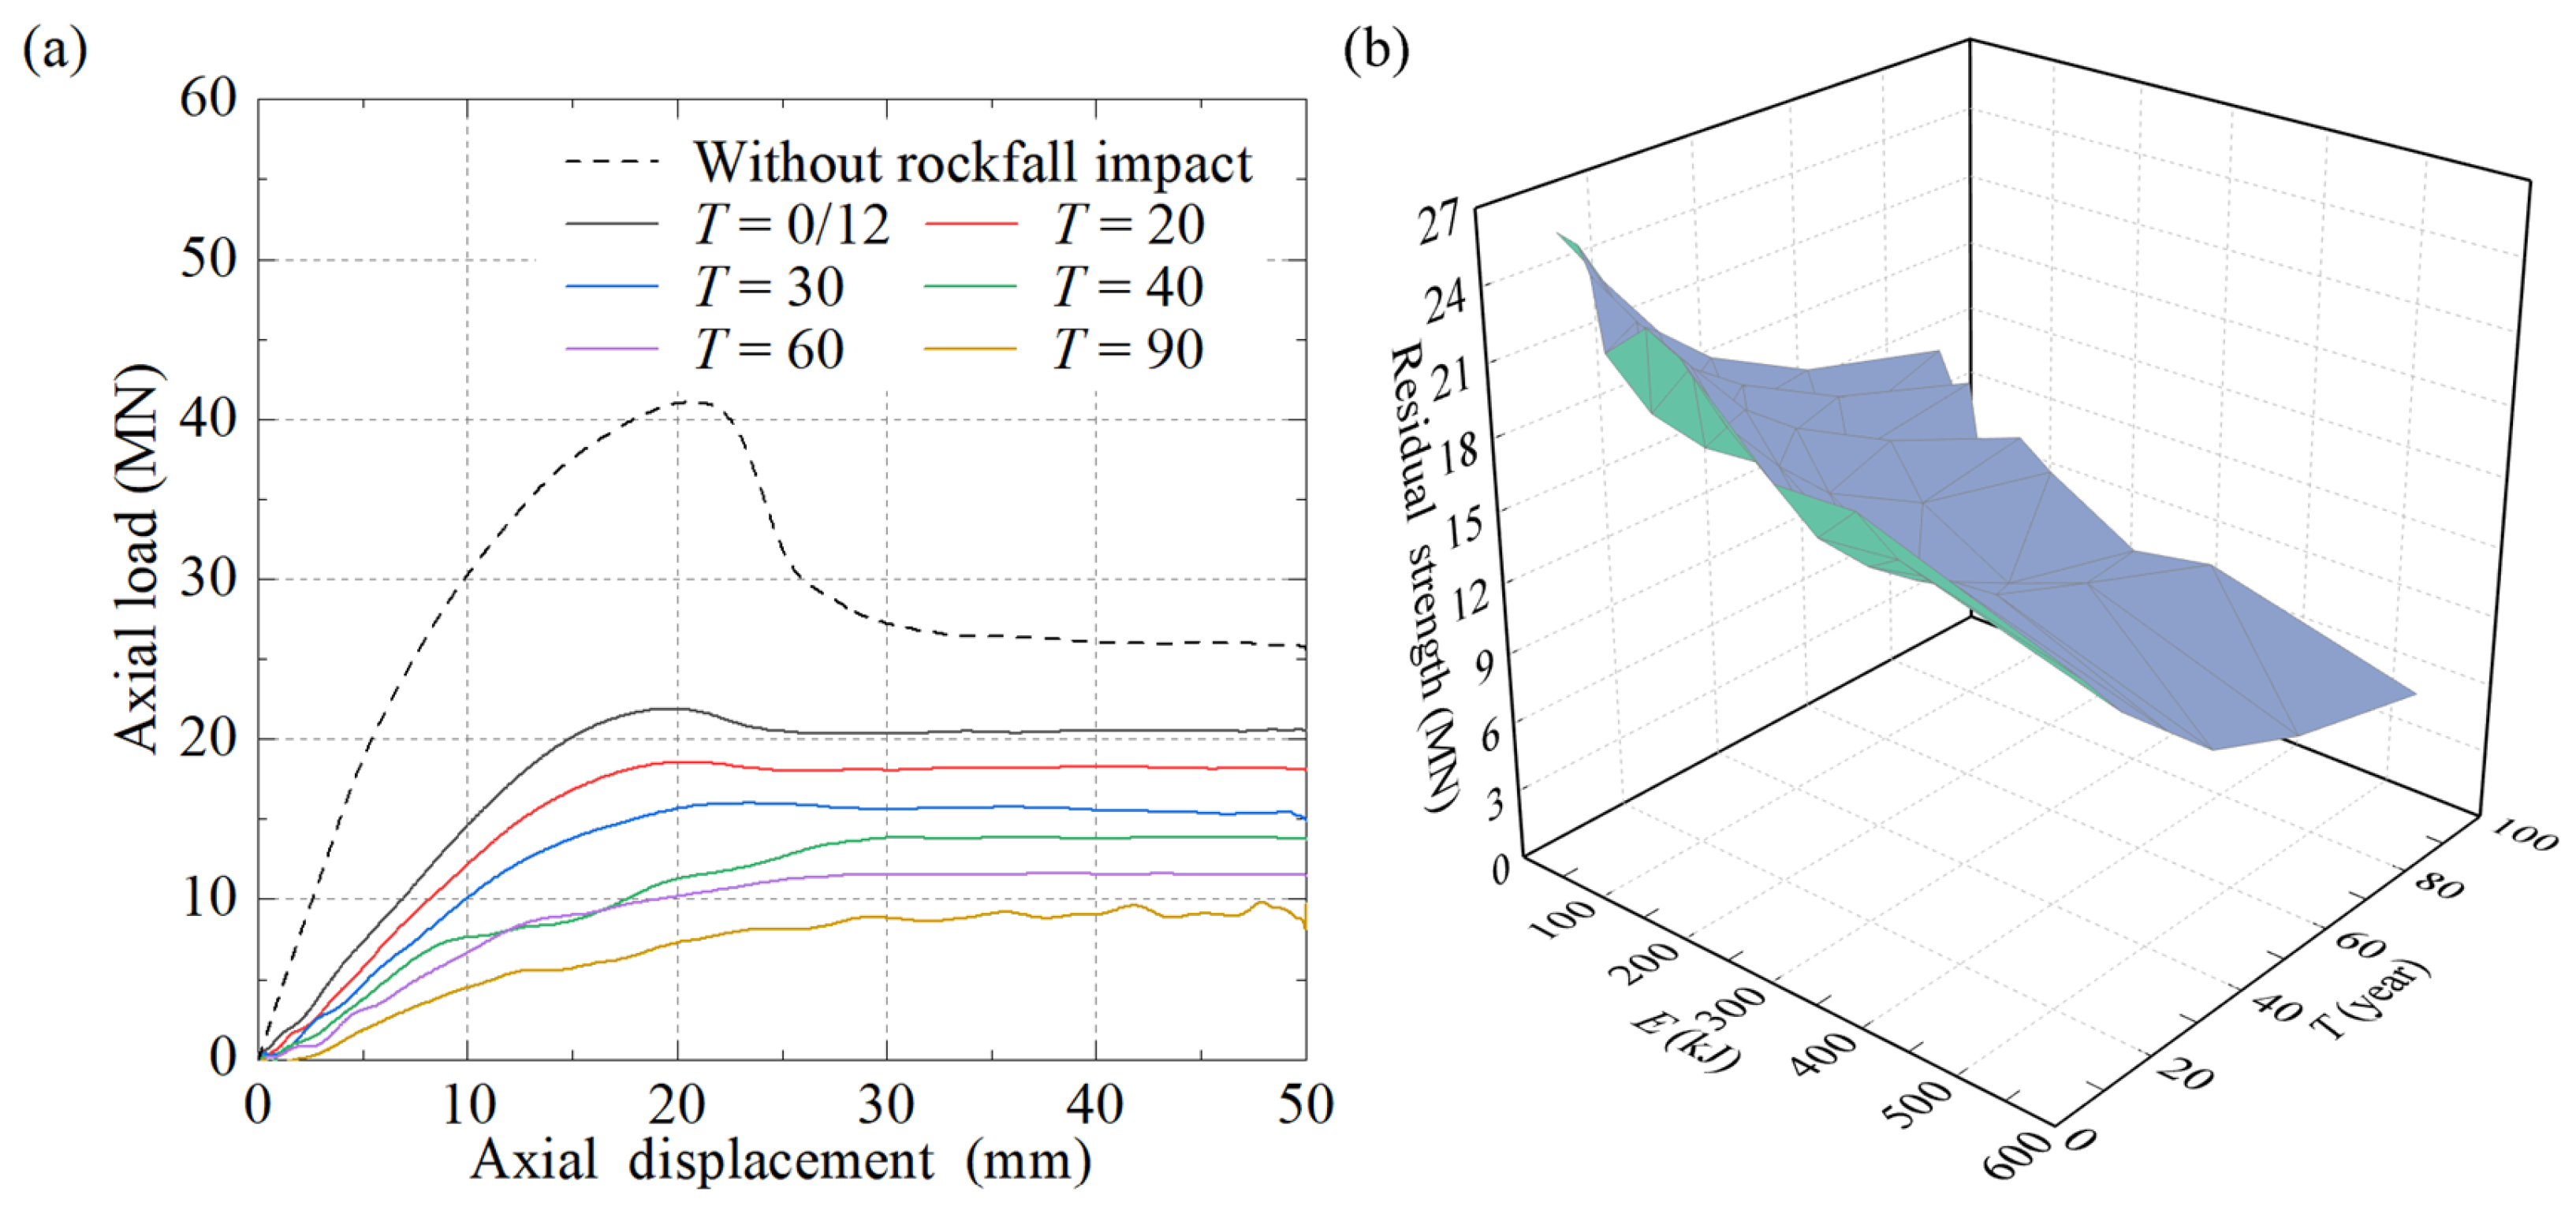
Figure 15 plots the residual bearing capacity of the RC pier after being impacted by rockfalls with different service times. The axial load-displacement curve in
Figure 15a demonstrates the influence of service time on the mechanical behavior of the RC pier. As the service time progresses, notable transformations occur in the shape of the load-displacement curve. Specifically, the peak load shows a decreasing trend, signifying a reduction in the ability of the pier to withstand axial loads. The slope of the ascending segment also diminishes, indicating a decrease in the stiffness during the initial loading phase. Moreover, the slope of the descending segment decreases or becomes smooth, reflecting a change in the post-peak deformation behavior. These variations suggest that the long-term service process, combined with rockfall impact, gradually deteriorates the mechanical properties of the RC pier, weakening its structural integrity.
Figure 15b further elaborates on the variation of the residual bearing capacity with service time. It is evident that as the service time increases, the residual bearing capacity of the RC pier shows a clear downward trend, albeit with a decreasing rate of decrease. For instance, under the condition of
m = 3 t and
v = 10 m/s, when the service time reaches 60 years, the residual bearing capacity drops from 22.02 MN to 11.64 MN, decreasing by 47.14%. When the service time extends from 60 years to 90 years, the residual bearing capacity decreases from 11.64 MN to 10.16 MN, decreasing by 12.71%. That is, the effects of material degradation caused by corrosion and impact damage over time continuously erode the bearing capacity.
Thus, it can be concluded that residual bearing capacity of the RC pier decreases nonlinearly with service time, evidenced by reduced peak load (e.g., 47.14% drop at 60 years), diminished initial stiffness (shallow ascending slope), and altered post-peak behavior (flattened descending slope), with decay rate slowing after 60 years (12.71% drop from 60 to 90 years).
4.4. Damage Assessment
In order to quantify the damage degree of the RC pier caused by the impact load and the steel corrosion during the service time, the damage index (
D) is adopted to assess the damage degree of the corroded RC pier after being affected by the impact, as follows [
49]:
where
Pr is the residual bearing capacity of the RC pier after the impact loading without the steel corrosion, i.e., the condition of
T = 0–12 in this study; and
Pd is the residual bearing capacity of the corroded RC pier, i.e., the condition of
T ≥ 12 in this study. The damage indices of the bridge piers under various working conditions are listed in
Table 4. It can be seen that the damage indices of the RC pier after the impact loading are all more than 0.35. With the increase of the service time, the damage degree becomes serious, i.e., when the service time is more than 30 years, the damage index of the RC pier is more than 0.5, indicating severe damage. For the RC pier with a service time of more than 60 years, a risk of failure would be present when it comes to the high-energy impacts.
Randomly select 36 data points from
Table 4, which are plotted in
Figure 16. It is indicated that with the goodness of fit (
R2) of 0.91, the relationship of the damage index
D can be obtained as
where
A is the proportional constant (
A = 1.2);
α is the time decay effect index (
α = −0.3); and
β is the kinetic energy damage effect index (
β = −0.05). It is worth noting that
T should be no less than the corrosion imitation time, i.e.,
T ≥ 12 years in this study. Except for the above 36 random data points, the remaining data are used to conduct the model verification, based on which, the comparisons between the calculated damage index (
Dcal.) from Equation (6) and the damage index from the simulation results (
Dsim.) are shown in
Figure 17. It can be found that all of the data stand within the error of 20%, and the majority of the data stand within the error of 10%, indicating the rationality of Equation (6).
Therefore, the proposed damage index formula (Equation (6)) in this study accurately quantifies the combined effects of corrosion and rockfall impact damage (R2 = 0.91, error < 20%), enabling reliable prediction of impact-induced damage to RC piers over their service life and providing a quantitative basis for maintenance decision-making.
Targeted maintenance strategies can be formulated based on the damage index (D) thresholds. For moderate or relatively low damage (D < 0.5), localized reinforcement at the impact zone and pier ends (e.g., epoxy injection for minor cracks, additional stirrups) is recommended, which balances structural safety and cost-efficiency given the limited damage extent. For severe damage (0.5 ≤ D < 0.8), comprehensive repairs are necessary, including concrete spalling replacement, corroded steel bar replacement, and full-section strengthening (e.g., carbon fiber wrapping), to restore residual bearing capacity by 30–40% and avoid progressive failure. For critical damage (D ≥ 0.8), immediate demolition and replacement are imperative, as the pier’s load-bearing capacity is irreversibly lost, and continued service would pose unacceptable safety risks (e.g., collapse under subsequent impacts or static loads). In addition, from a lifecycle perspective, the derived thresholds support proactive maintenance planning. For RC piers in mountainous or coastal areas, biennial inspections after 30 years of service (when D ≥ 0.5, indicating severe damage onset) are recommended to monitor damage progression, and mandatory strengthening before 60 years (to prevent D from exceeding 0.8) is critical to avoid catastrophic failure and higher retrofitting costs. Notably, these findings can inform the revision of design codes for RC structures in hazard-prone regions, and the proposed damage index could be integrated to incorporate combined corrosion–rockfall effects, guiding the selection of protective measures (e.g., thicker concrete covers for corrosion resistance, impact-resistant barriers) during the design phase of piers in mountainous coastal or saline areas. It should be noted that due to the lack of long-term field monitoring data on corroded RC piers under rockfall impacts, the long-service damage predictions based on Equation (6) require further validation through extended in-situ observations.
4.5. Uncertainty Quantification of Damage Index D via Monte Carlo Simulation
To address the statistical uncertainty in the damage assessment of corroded RC piers under rockfall impact, a Monte Carlo simulation is performed here to quantify the probabilistic distribution of the damage index
D. This analysis complements the deterministic results presented in
Section 4.4 by accounting for the inherent variability in key parameters, thereby enhancing the reliability of the proposed damage assessment framework. Based on the parameter ranges and material properties specified in this study, the input parameters include service time (
T) ranging from 12 to 90 years, impact mass (
m) of 1 t to 5 t, and impact velocity (
v) from 5 m/s to 15 m/s. In this study, the uniform distribution and normal distribution are assumed for the above input parameters to conduct the Monte Carlo simulation. In terms of the normal distribution assumption, service time (
T) presents a mean of 51 years and a standard deviation of 13 years, and impact mass (
m) shows a mean of 3 t and a standard deviation of 0.67 t, while impact velocity (
v) exhibits a mean of 10 m/s and a standard deviation of 1.67 m/s. A total of 10,000 random samples are generated for each parameter to ensure convergence, and the corresponding
D values are computed using Equation (6).
In terms of the uniform distribution assumption, the probability density function (PDF) of
D is presented in
Figure 18a, with key statistical metrics summarized in
Table 5. Results indicate that the mean value of
D is 0.62, with a standard deviation of 0.11, reflecting moderate variability induced by parameter uncertainties. The 95% confidence interval for
D is [0.40, 0.84], which aligns well with the range of deterministic
D values (0.387–0.851) reported in
Table 4, validating the reliability of the simulation. Additionally, the probability density function of
D exhibits a slight right skewness (skewness = 0.28), with the majority of values concentrated between 0.5 and 0.8, consistent with the severe damage range observed in long-term service scenarios. Meanwhile, the cumulative distribution functions (CDFs) of
D for critical service times of 30, 60, and 90 years are shown in
Figure 18b, further illustrating the increased dispersion of
D with service time and then emphasizing the importance of periodic inspections (e.g., every 5 years for
T ≥ 60 years) to reduce uncertainty in damage evaluation. For
T = 90 years, the probability of
D ≥ 0.5 (severe damage) reaches 92.3%, and the probability of
D ≥ 0.8 (failure risk) increases to 32.5%, highlighting the necessity of proactive maintenance for aging piers in high-risk areas.
Regarding the normal distribution assumption, the probability density function (PDF) of
D and the cumulative distribution functions (CDFs) of
D for critical service times of 30, 60, and 90 years are shown in
Figure 19, while key statistical metrics are summarized in
Table 5. The mean value of
D is 0.60, with a standard deviation of 0.09, reflecting relatively low variability induced by parameter uncertainties compared to the uniform distribution case. The 95% confidence interval for
D is [0.42, 0.78], which aligns well with the range of deterministic
D values reported in
Table 4, validating the simulation’s reliability. The probability density function of
D exhibits a symmetric bell-shaped curve (skewness = 0.02), with the majority of values concentrated around the mean, indicating a predictable damage evolution under the normal distribution assumption. For the service time of 90 years, the probability of
D ≥ 0.5 (severe damage) reaches 87.3%, and the probability of
D ≥ 0.8 (failure risk) increases to 27.5%.
The Monte Carlo simulations under uniform and normal distribution assumptions yield distinct insights into the uncertainty propagation of the damage index D. The mean under the normal distribution (0.60) is slightly smaller than under the uniform distribution (0.62), reflecting the central tendency of the former. However, the standard deviation is significantly reduced (0.09 vs. 0.11), indicating less variability in the normal distribution case. In addition, for the uniform distribution, the PDF exhibits a broader, flatter shape with heavier tails, leading to higher probabilities of extreme D values. This reflects the assumption of equal likelihood across the entire parameter range. For the normal distribution, the PDF follows a symmetric bell curve, concentrating probability mass around the mean. This reduces the likelihood of extreme outcomes but increases the precision of predictions.
Thus, the above probabilistic analysis strengthens the robustness of the proposed damage assessment framework, providing a quantitative basis for risk-informed maintenance strategies of RC piers subjected to combined corrosion and rockfall impact. The comparison between uniform and normal distribution assumptions highlights the sensitivity of uncertainty quantification to parameter distribution choices, emphasizing the need for careful consideration of underlying data characteristics in future studies.
5. Conclusions
In this study, the dynamic response and residual bearing capacity of corroded RC piers under rockfall impact are investigated based on a validated numerical model for corroded RC columns under impact loading. The effects of impact energy characterized by the mass of 1 t to 5 t and velocity of 5 to 15 m/s, and the service time of 90 years, are analyzed, which firstly evaluates the combined effects of rockfall impacts and long-term corrosion. The main conclusions are as follows:
- (1)
Increasing the impact mass and velocity significantly expands the damage range of RC piers, and increases the peak impact forces and displacements. Increasing velocity from 5 m/s to 15 m/s expands the severe damage area (equivalent plastic strain ≥ 0.003) by 360% with the damage depth on the back side of the impact point increasing from 75 mm to 350 mm, while the peak impact force increases 3.09 times and the peak displacement experiences a notable increment of 33.41 mm. Increasing mass from 1 t to 5 t enlarges the severe damage area by 229% with damage propagating toward both ends of the pier, and the peak impact force increases by 206.14% with a 58.81 mm increase in the peak displacement.
- (2)
As the service time increases, an inward expansion of damage, a reduction in peak impact force, an increase in displacement, and a significant decline in residual bearing capacity after the rockfall impact are exhibited due to severe steel corrosion and concrete degradation. Increasing the service time to 90 years, the severe damage area on the RC pier surface accounts for more than 50%, and the damage depth on the back side of the impact point increases almost 1.4 times. The peak impact force shows an obvious 10.00% decrease during the service time of 30 to 60 years, while during the service time of 20 to 90 years, the peak displacement almost linearly rises by about 19.54 mm, and the residual displacement grows by around 22.02 mm.
- (3)
As the service time increases, the residual bearing capacity of the RC pier significantly declines with a decreased decrement. At an impact mass of 3 t and velocity of 10 m/s, the residual bearing capacity presents a 47.14% decrease at 60 years and a further 12.71% decrease at 90 years.
- (4)
The study adopts a damage index (D) to quantify the damage degree of RC piers caused by impact load and steel corrosion during service time, defined as the relationship between the residual bearing capacity of non-corroded and corroded piers after impact. Meanwhile, a damage assessment formula is proposed and validated (error < 20%), which incorporates the effects of the impact energy and service time, enabling lifecycle damage prediction. For mountainous or coastal bridges, biennial inspections after 30 years (D ≥ 0.5) are recommended and mandatory strengthening before 60 years to avoid failure risk.
- (5)
A Monte Carlo simulation is conducted to quantify the uncertainty of the damage index D for corroded RC piers under rockfall impact, assuming uniform and normal distributions for service time (12–90 years), impact mass (1–5 t), and impact velocity (5–15 m/s), the results of which align well with the range of deterministic D values from the numerical simulation. Uniform distribution yields high variability and extreme values, while normal distribution shows symmetric, concentrated patterns, both validating the damage assessment framework and highlighting distribution choice sensitivity for risk-informed maintenance.
In this study, the numerical model ignores the damage before the corrosion initiation, the concrete cover cracking or spalling induced by the steel corrosion, the uneven corrosion conditions, and the bond deterioration in the steel–concrete interface. However, the ignorance of the damage before the corrosion initiation would overestimate the corrosion initiation time, and the localized corrosion may lead to stress concentration, resulting in actual residual bearing capacity being at least 10% smaller than the predicted value of Equation (6). At the same time, the protective layer peeling would overestimate the initial stiffness, and the bond degradation neglects the local slip under impact load may exacerbate displacement. The above limitations may underestimate the damage to concrete structures and then influence their dynamic response and residual bearing capacity. Further studies should be conducted to address the above factors. It is also worth noting that the findings of this study can provide valuable insights for RC structures in buildings. Similar to RC piers, building components, e.g., RC columns, beams, and shear walls in coastal or saline soil areas, are also susceptible to chloride-induced steel corrosion. Additionally, buildings may face unexpected impact loads, such as falling debris from construction activities, vehicle collisions with ground-floor columns, or even accidental impacts from heavy objects. The damage assessment formula proposed in this study (Equation (6)), which considers the combined effects of corrosion and impact energy, can be extended to evaluate the residual bearing capacity of these building components. For instance, in high-rise buildings or industrial structures where RC columns are critical for vertical load-bearing, the relationship between service time, corrosion degree, and impact-induced damage derived herein can guide maintenance strategies.
