Article

Acoustic Emission Monitoring Method for Multi-Strand Fractures in Post-Tensioned Prestressed Hollow Core Slab Bridges Using Waveguide Rods

1
Henan Zhongtian High-Tech Smart Technology Co., Ltd., Zhengzhou 450001, China
2
Henan High Speed Railway Co., Ltd., Zhengzhou 450001, China
3
Henan Railway Construction Investment Group Co., Ltd., Zhengzhou 450001, China
4
Henan Yu-Xi Expressway Co., Ltd., Zhengzhou 450001, China
5
School of Civil Engineering, Zhengzhou University, Zhengzhou 450001, China
6
Henan Province Engineering Research Center of Safety and Life Extension of Prestressed Cable Structure, Zhengzhou 450001, China
7
School of Ecology and Environment, Zhengzhou University, Zhengzhou 450001, China
*
Authors to whom correspondence should be addressed.
Buildings 2025, 15(14), 2576; https://doi.org/10.3390/buildings15142576
Submission received: 27 April 2025 / Revised: 26 May 2025 / Accepted: 16 June 2025 / Published: 21 July 2025
(This article belongs to the Topic Nondestructive Testing and Evaluation)

Abstract

Acoustic emission (AE) technology has been extensively applied in the damage assessment of steel strands; however, it remains inadequate in identifying and quantifying the number of strand fractures, which limits the accuracy and reliability of prestressed structure monitoring. In this study, a test platform based on practical engineering was built. The AE monitoring method using a waveguide rod was applied to identify signals from different numbers of strand fractures, and their acoustic characteristics were analyzed using Fourier transform and multi-bandwidth wavelet transform. The propagation attenuation behavior of the AE signals in the waveguide rod was then analyzed, and the optimal parameters for field monitoring as well as the maximum number of plates suitable for series beam plates were determined. The results show that AE signals decrease exponentially with an increasing propagation distance, and attenuation models for various AE parameters were established. As the number of strand fractures increases, the amplitude of the dominant frequency increases significantly, and the energy distribution shifts towards higher-frequency bands. This finding introduces a novel approach for quantifying fractures in steel strands, enhancing the effectiveness of AE technology in monitoring and laying a foundation for the development of related technologies.

1. Introduction

Prestressed hollow slab bridges are a crucial component of global transportation infrastructure, with prestressed steel strands serving as key load-bearing elements [1,2,3]. However, under high alternating tensile stress and humid conditions, the corrosion resistance of prestressed steel strands is significantly reduced, making them susceptible to damage and strand fracture. This, in turn, directly affects the comfort, durability, and safety of a bridge [4,5,6]. Severe failure of the steel strands can lead to bridge collapse, posing serious safety risks [7,8,9]. Therefore, research on monitoring the strand fracture of steel strands is of paramount importance. AE technology is a non-destructive testing method that monitors high-frequency elastic waves emitted during structural damage in real time. It offers several advantages, including high-frequency response, non-contact signal acquisition, and strong sensitivity to sudden events, making it particularly suitable for capturing transient signals generated during the fracture of steel strands [10,11,12]. AE signals can reflect damage phenomena, such as local strand breakage, interface slippage, and corrosion evolution, thus providing a valuable basis for damage identification and early warning under complex stress conditions [13,14].
At present, AE technology has been widely applied in structures such as bridge girders [15,16], cable systems [17], reinforced concrete components [14,18], and pressure vessels [19,20], demonstrating strong field adaptability and engineering feasibility in crack identification, fatigue damage monitoring, and early structural warning. Steel strand AE monitoring technology has made significant advancements in detecting strand breakage and corrosion, particularly for early damage warning and localization [21,22]. Matthias et al. successfully demonstrated the monitoring and localization of strand fractures through failure testing of full-scale prestressed concrete bridges [23]. Li et al. analyzed the time-frequency characteristics of AE signals using wavelet transform, identified various types of damage, and provided early warnings for strand fractures [24]. Li et al. applied clustering analysis to AE signals from prestressed steel strands in different stages of corrosion to characterize each stage [25]. Despite these advances in prestressed steel strand monitoring, acoustic emission-based health monitoring of prestressed concrete hollow slab bridges still faces significant challenges. Due to the composition of a bridge of multiple hollow plates, a large number of sensors are required for comprehensive monitoring, increasing both system complexity and costs [26,27]. To address this, Li et al. proposed a spatial AE positioning method using a profiled waveguide rod with a dual sensor array, which enabled precise localization of spatial damage [28]. In another study, Li et al. connected the hollow plates of a slab bridge in series using a waveguide rod and performed damage localization through simulated hammer signals, validating the monitoring technique for steel strand damage in hollow slabs [29]. While existing studies primarily focus on the detection and localization of strand fractures, effective methods for identifying and quantifying the number of strand fractures remain limited. In practical engineering applications, multiple strands within a steel strand may fracture simultaneously, and the number of fractures is closely associated with structural safety. Traditional approaches often fall short of meeting the requirements for accurate assessment. Therefore, there is an urgent need to develop a method capable of identifying and quantitatively analyzing multiple strand fractures based on the characteristic features of acoustic emission signals.
Compared to conventional AE techniques that require sensors to be directly installed at monitoring points, the waveguide rod approach offers notable advantages for monitoring large-scale or inaccessible structures [30,31,32]. First, in confined or harsh environments—such as areas with high humidity or radiation—the waveguide rod can efficiently transmit AE signals to sensor-accessible locations, thereby improving the system’s adaptability and deployment flexibility. Second, the material and geometry of the waveguide can be customized, enabling standardized configurations. This is particularly advantageous in long-distance or high-density monitoring scenarios, such as bridges and tunnels, where it helps reduce the number of required sensors and overall system costs.
In steel strand damage monitoring, the damage signal typically needs to be transmitted over long distances before being detected by the sensor, leading to signal attenuation and subsequently affecting monitoring accuracy [33,34,35]. Therefore, investigating the attenuation characteristics of AE signals in prestressed structures is crucial. Kading studied the anisotropic attenuation behavior between different structures, providing a significant reference for sensor placement in bridge monitoring [36]. Li et al. developed a general attenuation model for AE parameters through attenuation tests on embedded steel strands in concrete [37]. Hou et al. explored the propagation mechanisms of AE waves in prestressed steel strands through numerical simulations and established a model to assess the impact of prestress levels on AE wave amplitudes and energy attenuation [38]. Li et al. conducted pencil lead defect tests on a T-beam model to determine the optimal sensor placement for monitoring prestressed steel strands [39]. However, these studies utilized analog signals for analysis, rather than real signals from broken strand damage. The investigation of attenuation laws based on actual damage signals holds greater engineering applicational value.
Different damage modes exhibit distinct characteristics in the frequency domain of AE signals, making spectrum analysis more informative than AE parameter analysis in identifying AE sources [40,41,42]. Wang et al. quantitatively revealed the evolution of micro-cracks in concrete prisms through wavelet packet transform frequency analysis [43]. Wulan et al. combined wavelet packet analysis and cluster analysis to establish correlations between AE signals and different types of microscopic damage in reinforced concrete beam shear tests [44]. Barile et al. performed wavelet decomposition on damage signals to differentiate the frequency bands and energy percentages associated with each damage mechanism in double-cantilever beam specimens [45]. Han et al. proposed a feature extraction method based on the improved FAST-ICA algorithm and wavelet packet energy spectrum, enhancing the accuracy and efficiency of AE feature extraction for bearing faults [46]. These studies demonstrate that spectrum analysis performs well in damage identification and is well-established in this field. However, there is still a lack of research on identifying the number of strand fractures in AE signals.
This study aims to develop an AE monitoring method for identifying the number of fractured prestressed steel strands in hollow slab bridges. Based on a previously constructed waveguide rod-based test platform, the system is further enhanced through full-scale simulations and the incorporation of welded ribbed steel rod components to better capture real fracture signals. In the experimental setup, multiple 7-wire prestressed strands were subjected to varying displacement-controlled loading conditions, with AE sensors evenly arranged on both the strands and the waveguide rods to collect fracture-related signals. The propagation attenuation behavior of AE signals along the waveguide rod was analyzed to determine optimal parameters for on-site monitoring and to assess the maximum number of slabs applicable to serial monitoring. Subsequently, AE signals corresponding to different numbers of fractured wires were processed using Fourier transform and wavelet packet decomposition to extract and analyze their acoustic characteristics. The results indicate that AE technology can effectively distinguish between varying strand fracture quantities, significantly enhancing the accuracy of structural monitoring in hollow slab bridges. This method also demonstrates strong potential for long-term health monitoring of in-service bridge structures.

2. Multi-Plate Series Strand Fracture Test

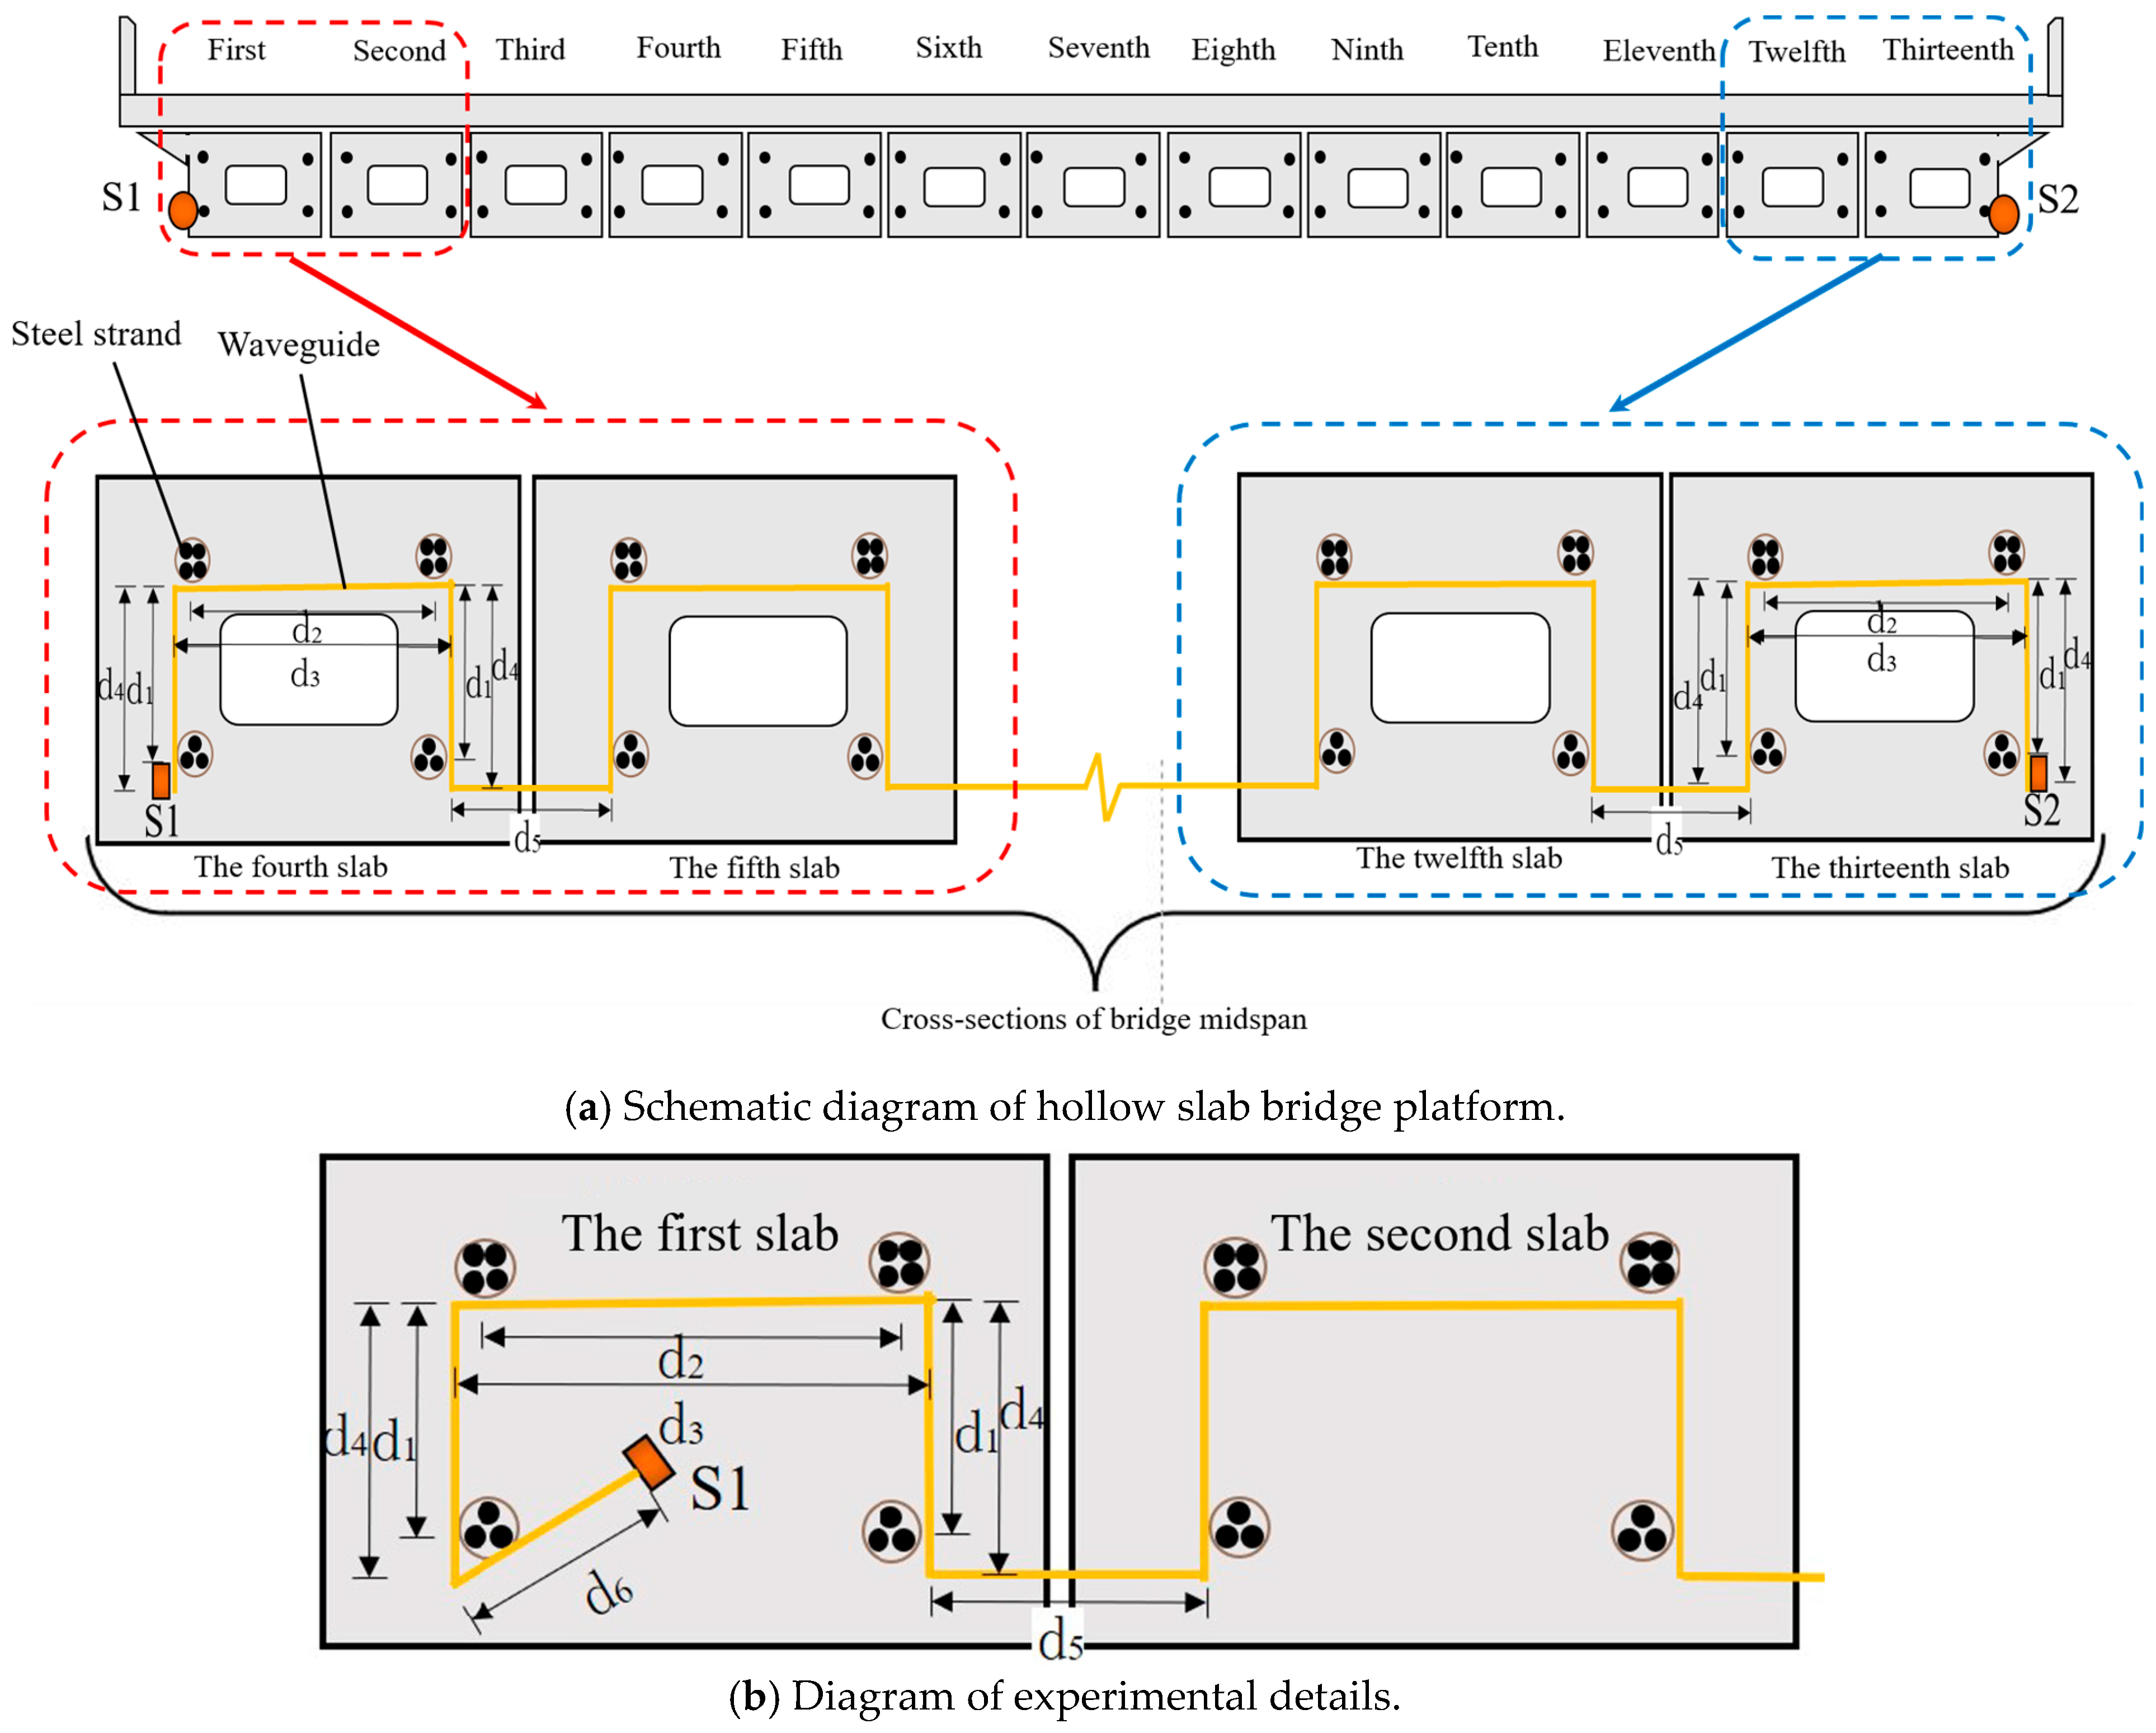
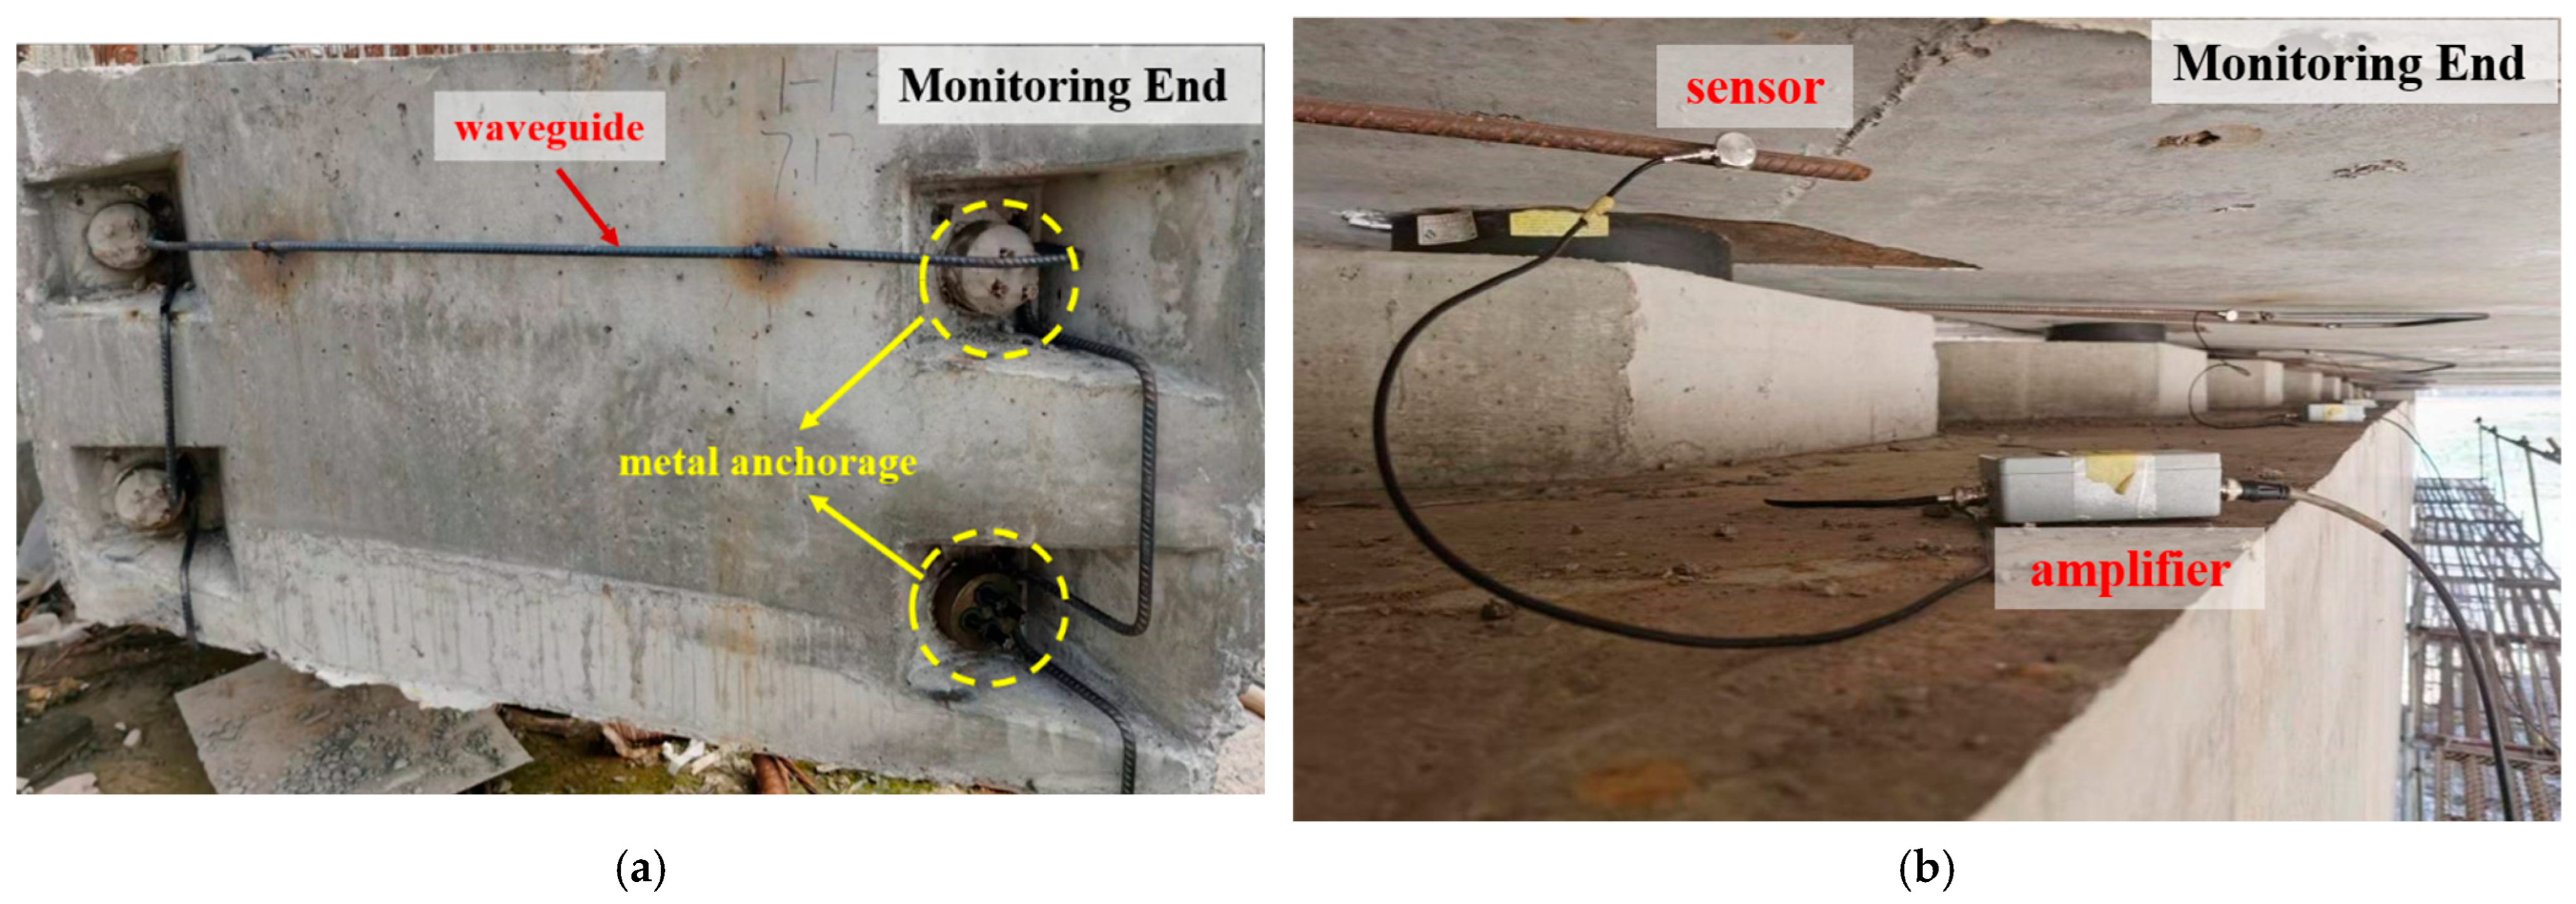
2.1. Series Test Scheme for Multiple Hollow Plates Based on Waveguide Rod

To ensure that the experimental setup exhibited strong engineering representativeness, the parallel arrangement of the 13 hollow slabs selected in this study derived from the prototype structure of a typical in-service small-span prestressed hollow slab bridge. As shown in Figure 1, the reference bridge consists of 13 hollow slabs and a total of 52 prestressed steel strands. The four strands in each slab are interconnected via waveguide rods and form a continuous serial configuration across adjacent slabs. Each waveguide segment is connected by welding, ensuring stable transmission of AE signals across multiple spans. Sensors are placed at both ends of the serial waveguide path to receive the transmitted signals. Figure 2 illustrates the on-site layout of the experimental platform. The waveguide rods are directly bonded to the steel strands at the metal anchorage points, and the anchorage regions are sealed. As shown in Figure 2a, the waveguide rods sequentially connect the four anchorage ends within each slab. Figure 2b shows that a short extension of waveguide rods is added to both ends of the slab bridge to facilitate sensor installation and signal acquisition.
Based on the layout and dimensional specifications of the actual bridge, the waveguide rod structure used in the test was replicated at a 1:1 scale to ensure that the component lengths, connection forms, and layout configurations matched those of the real engineering structure. The waveguide rod was fabricated using HRB400 steel rods with a diameter of 10 mm. It was assembled from multiple welded segments, resulting in a total length of 55.15 m. The structural configuration is illustrated in Figure 1b, with segment lengths defined as follows: d1 = 450 mm, d2 = 1000 mm, d3 = 1100 mm, d4 = 1440 mm, and d5 = 250 mm. Table 1 shows the operating conditions that achieve different numbers of strand fractures under different loading rates.

2.2. Methods for Achieving Different Numbers of Strand Fractures

The steel strand specimens used in this study are low-relaxation, high-strength strands with a nominal tensile strength of 1860 MPa and a diameter of 15.2 mm. To simulate different numbers of wire fractures, the strands were pre-treated prior to testing. Spot welding was applied to both ends of each strand using welding rods to counteract the internal twisting force between wires during cutting, thereby enabling controlled ring-cutting operations. A circular cut was then made at the midsection of the strand, with care taken to ensure a uniform cutting depth across the outer six wires. To ensure experimental safety and achieve accurate fracture simulations, the cutting depth was set at 3.5 mm. The cut strands were subsequently measured with precision to confirm the accuracy of both depth and position. This method ensures that a fracture occurs within the designated region under axial loading, maintaining the sudden nature of failure while enhancing the repeatability and controllability of the experimental design. This effectively satisfies the requirements for signal authenticity in the acoustic emission-based identification of strand fractures.

2.3. Test Procedure for AE Monitoring of Strand Fractures

In this experiment, the RS-2A acoustic emission sensor and the DS5-16B full-waveform acoustic emission analyzer, both manufactured by Beijing Soft Island Times Technology Co., Ltd. (Beijing, China), were used to collect and record the acoustic emission signals. The sensors were connected to the analyzer via a preamplifier with a gain of 40 dB. The sampling frequency was set to 3 MHz to ensure high-resolution waveform acquisition. A system threshold of 40 dB was configured to effectively filter background noise. To further reduce the influence of external low-frequency interference and ambient noise, a band-pass filter with a frequency range of 100–900 kHz was applied.
As shown in Figure 3, the test system consists of a loading system, test specimens, and an AE acquisition system. To ensure signal integrity and repeatability, the steel strand was fixed to the waveguide rod via welding. The welding point was located at the lower midsection of the steel strand, and the connection details are provided in the magnified view in Figure 3. To ensure the effective collection of acoustic emission signals, a total of five sensors were deployed in the experiment. Sensor #1 was positioned approximately 50 mm below the expected fracture point of the steel strand to capture the original AE signal. Sensor #2 to #4 were evenly spaced along the direction of the waveguide, while Sensor #5 was placed at the terminal end of the waveguide. All sensors were aligned along the axis of the waveguide to ensure consistency with the primary signal propagation path.

3. Analysis of AE Identification Results for Multiple Fractures in Steel Strands

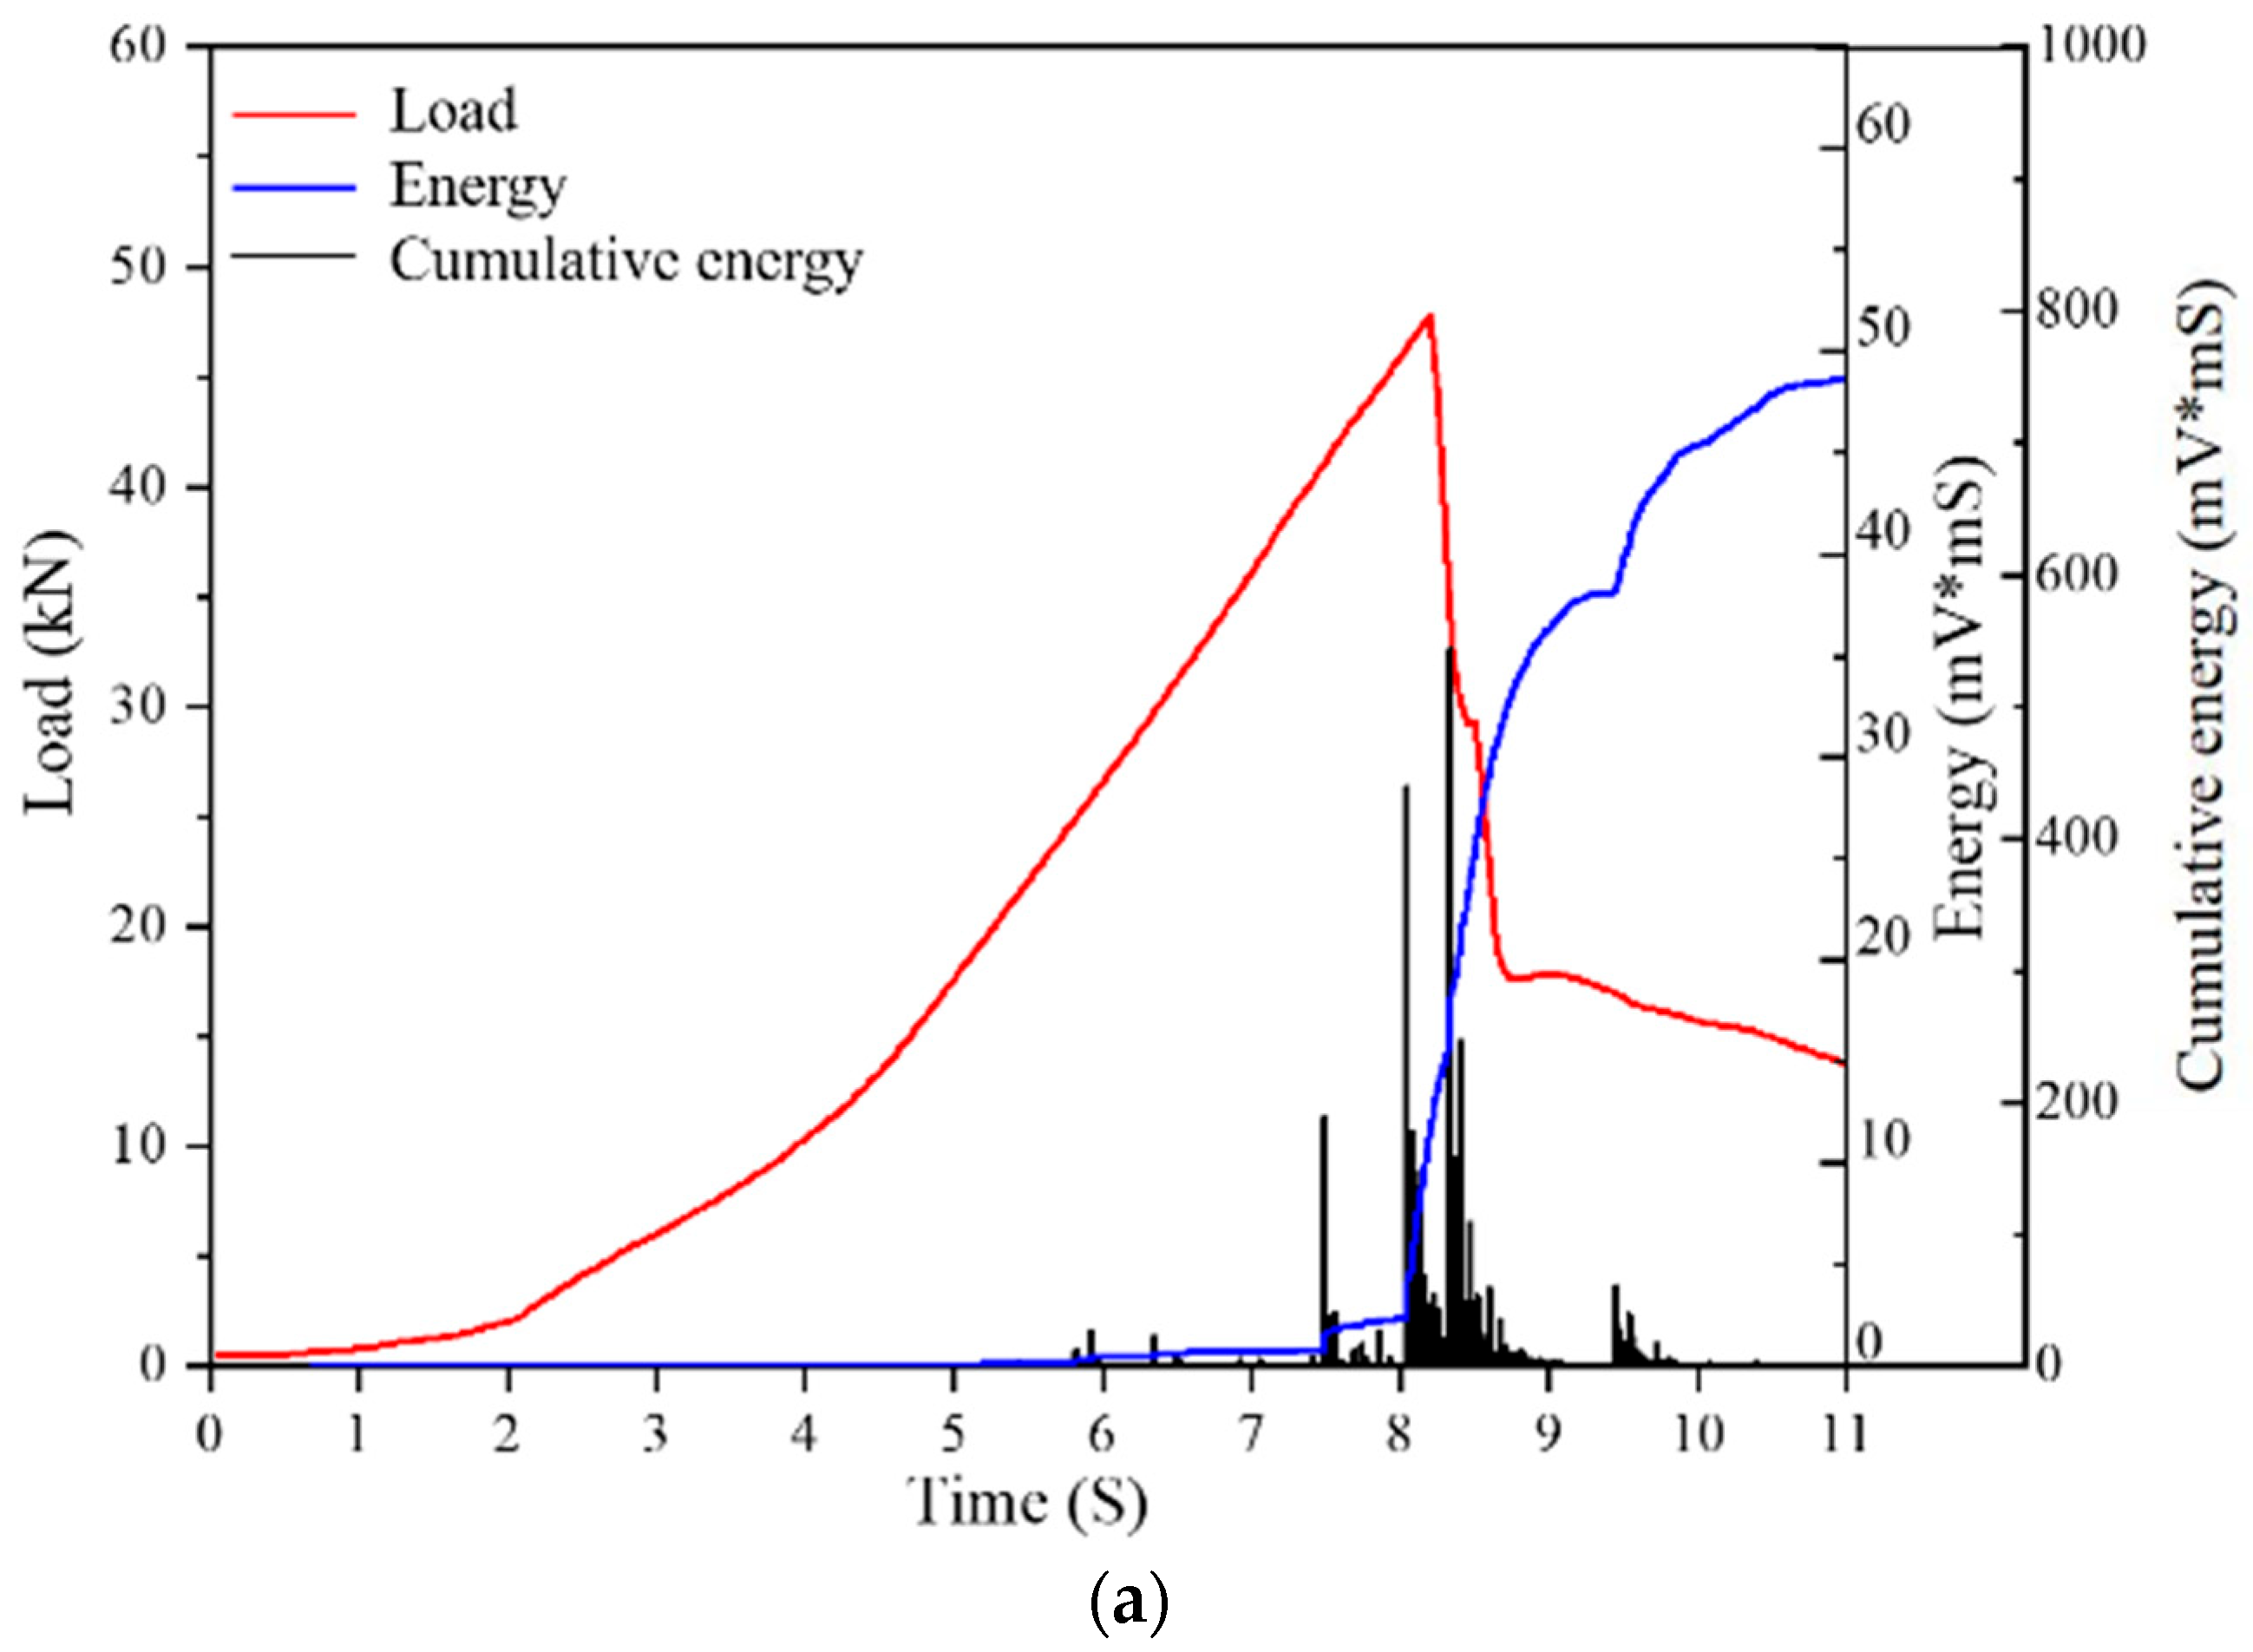
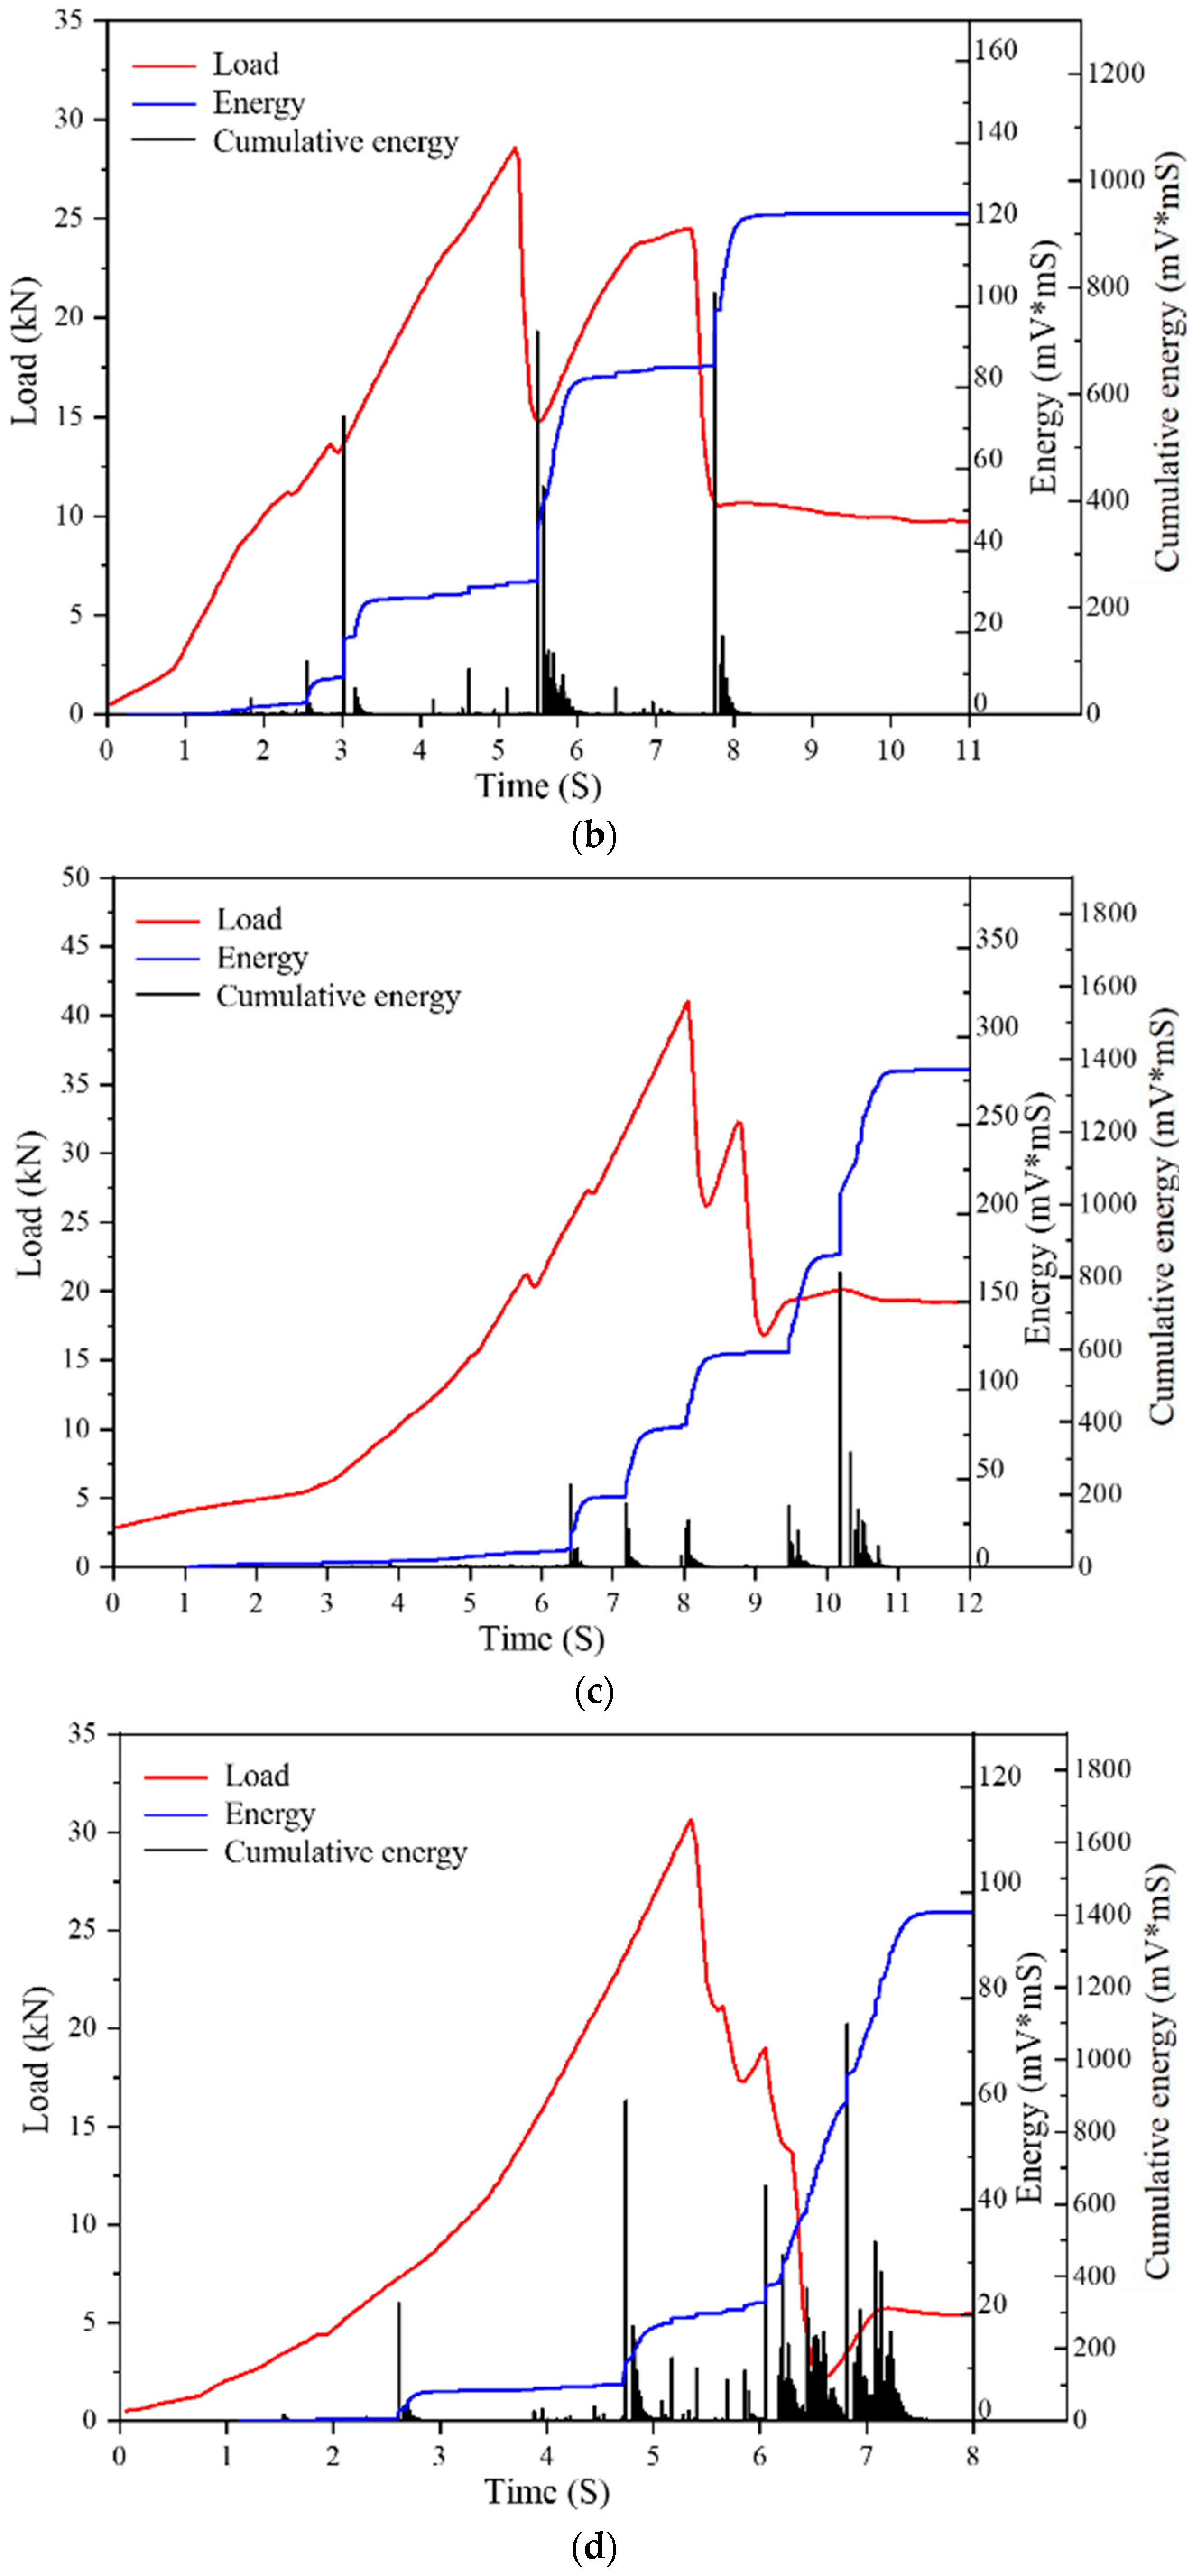
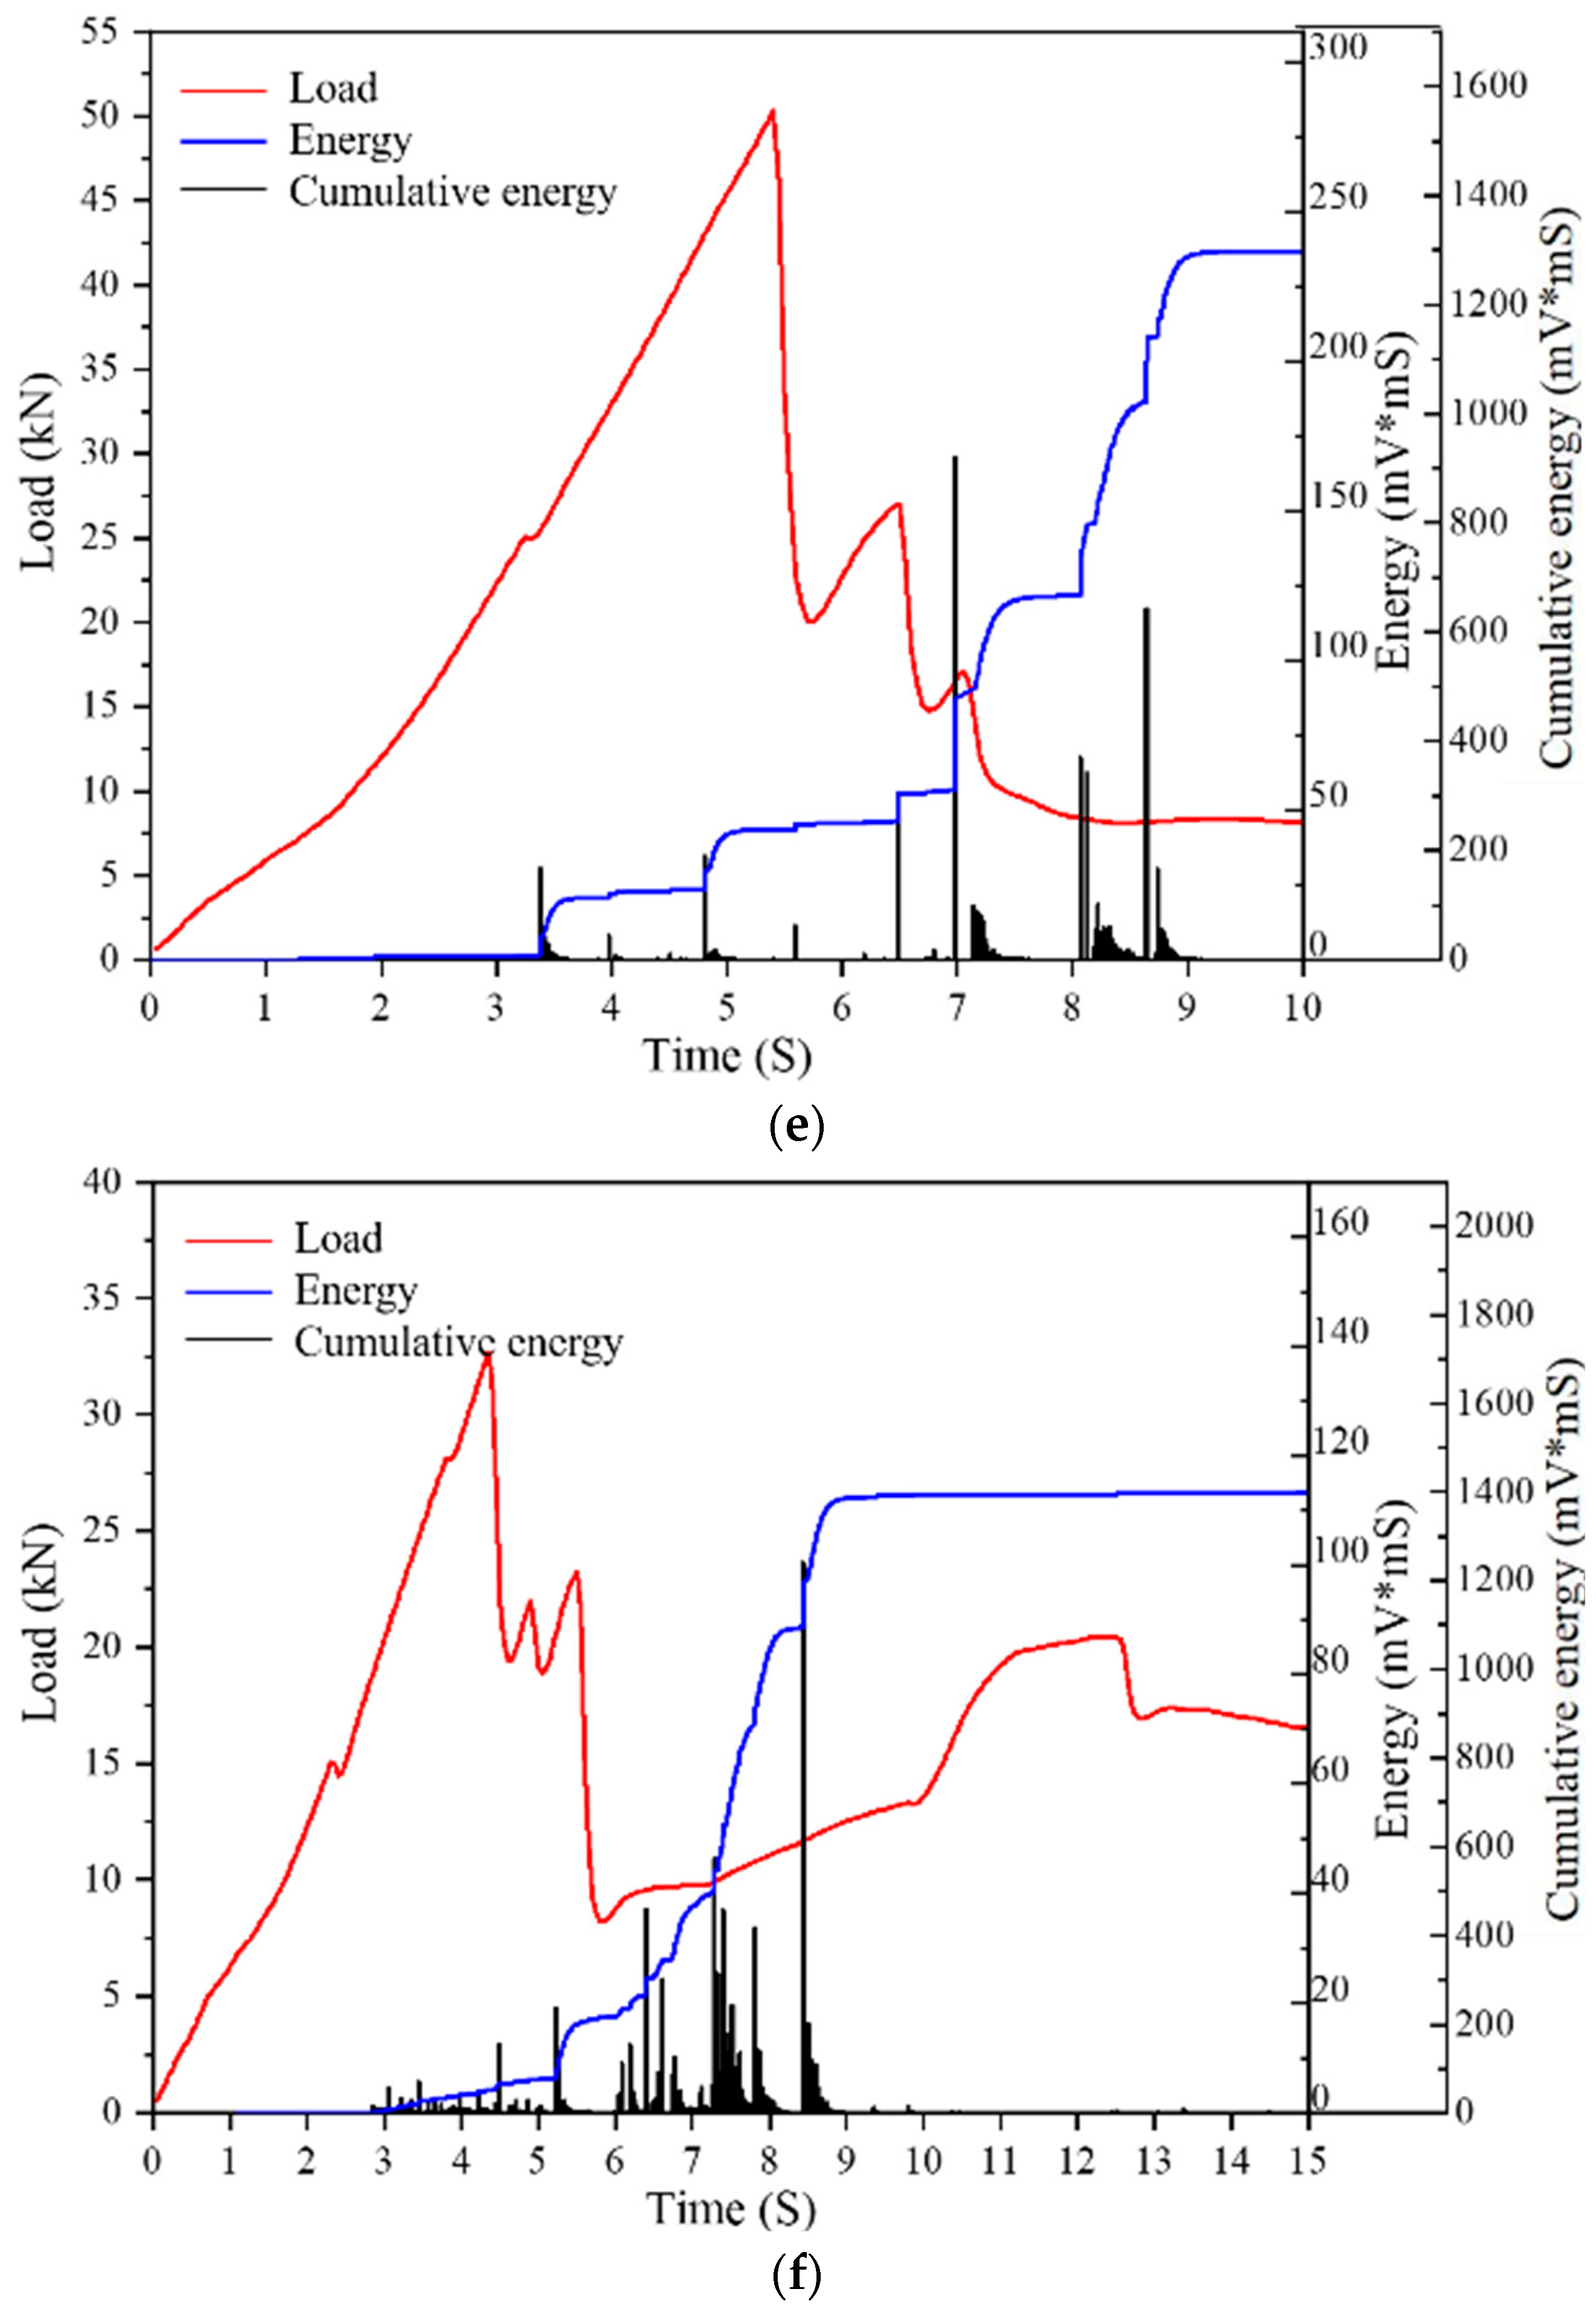
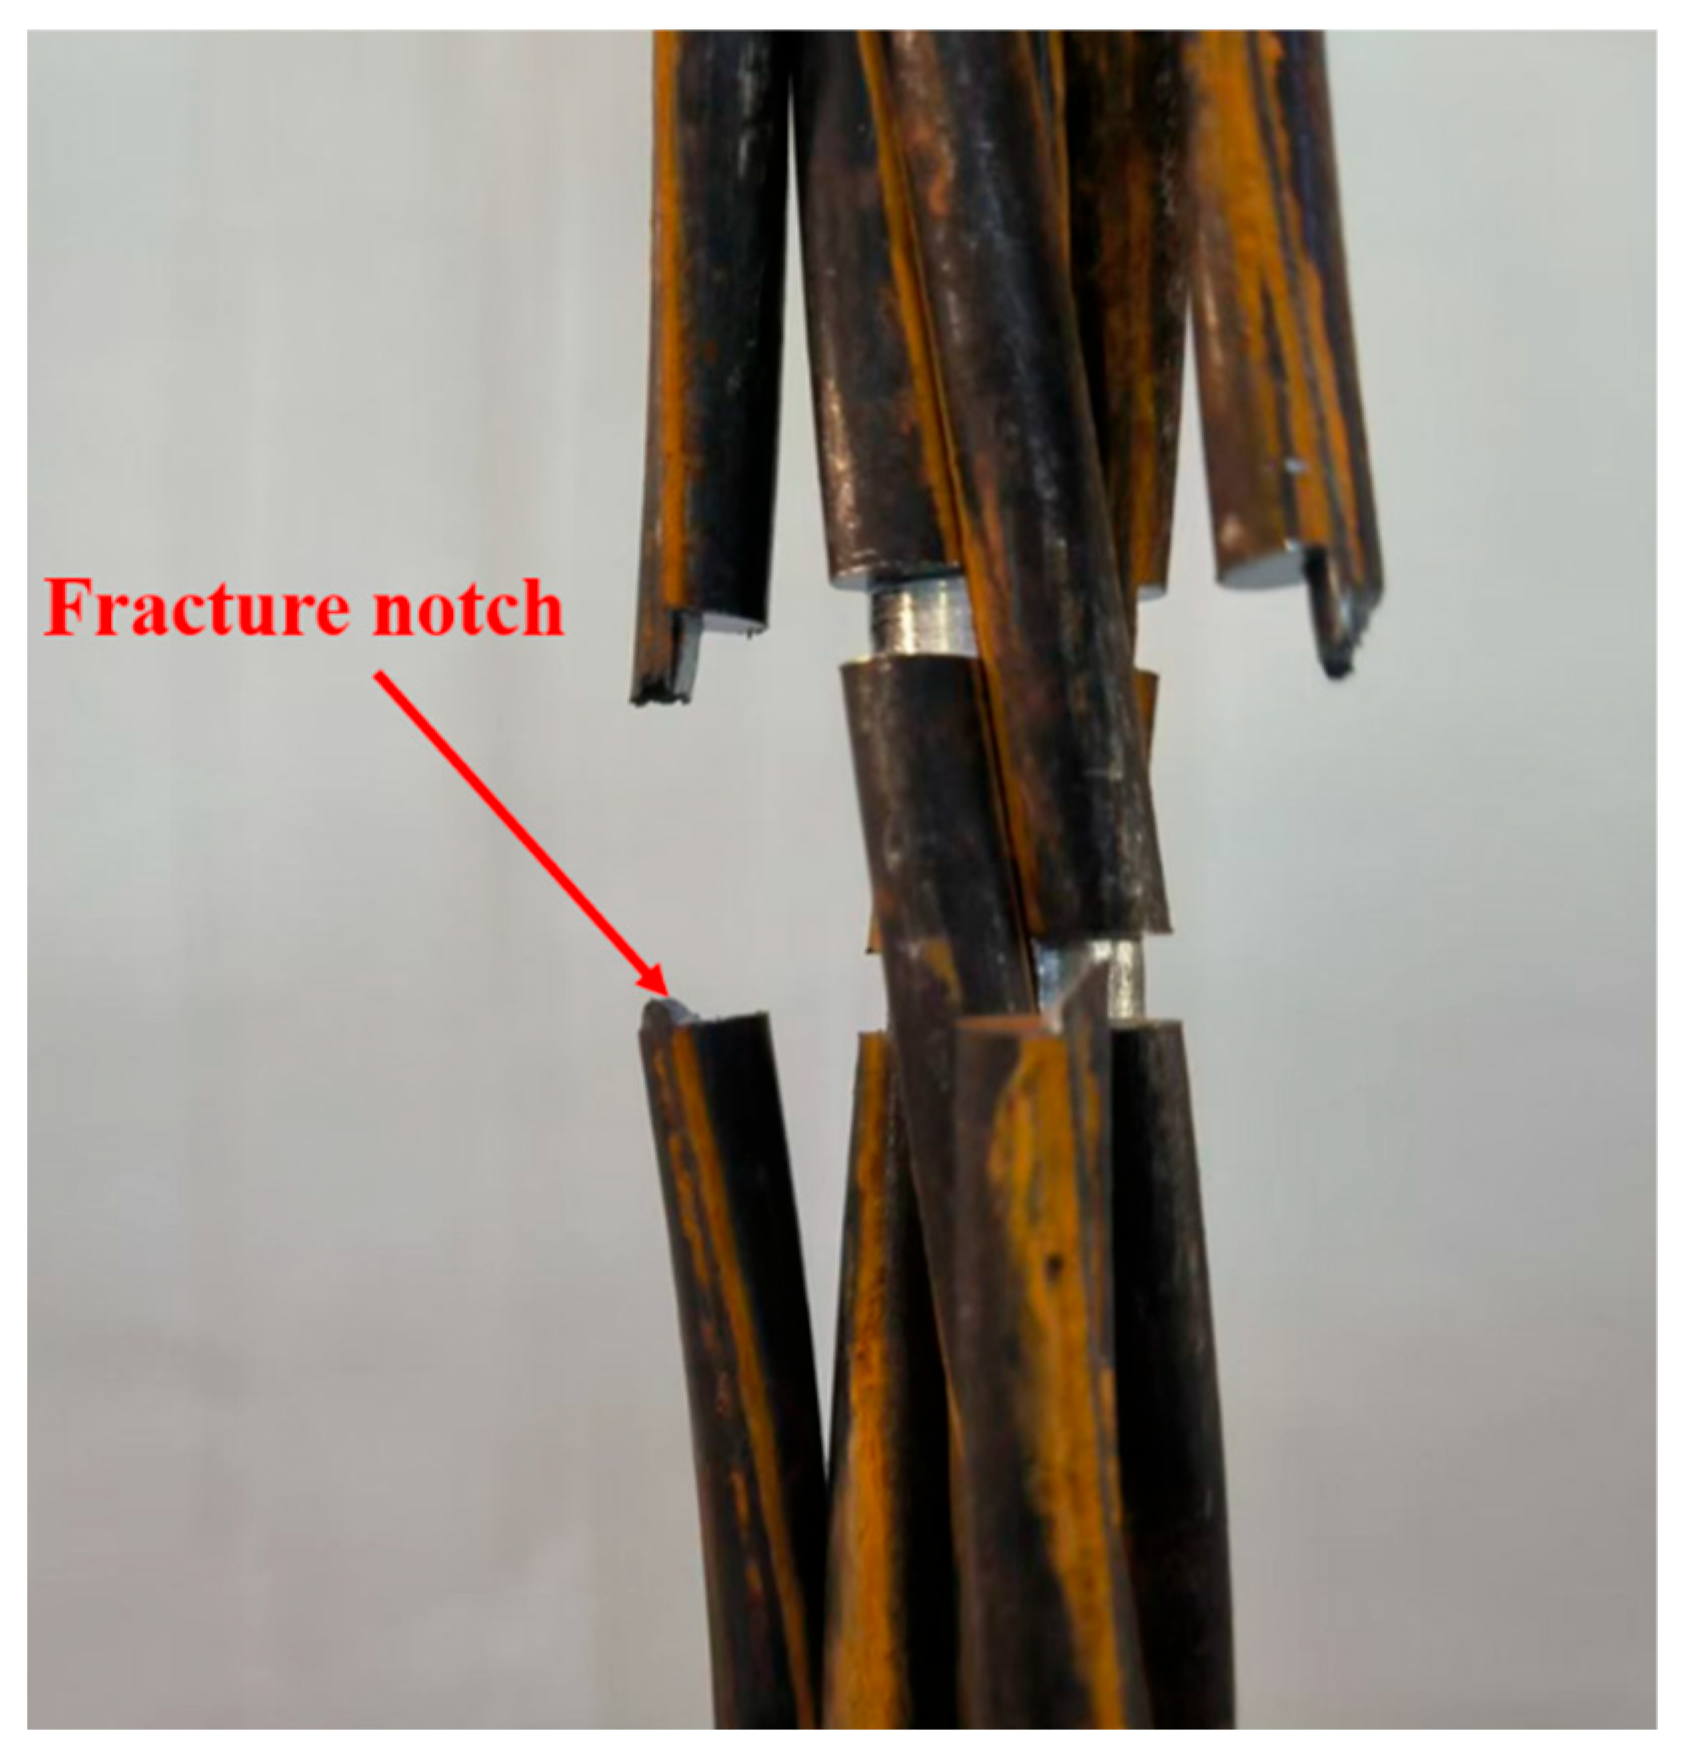
3.1. Analysis of Strand Fracture Results

The results of the strand fractures after loading are shown in Figure 4. The wire breaks occurred at the pre-made notches, with relatively smooth fracture surfaces. By applying different loading rates, the breakage of six steel strands was successfully achieved. However, the complete breakage of seven steel strands could not be realized during the experiment.
The material testing machine continuously recorded load–displacement data during the loading process, while the acoustic emission system simultaneously collected AE signals. Figure 5 presents representative results for different strand fracture quantities. In the early stage of loading, AE energy levels remained low, primarily due to friction and minor slippage. As the load increased and fractures occurred, the AE energy exhibited a sudden spike, with the cumulative energy curve showing a sharp rise. For instance, in the one-strand fracture condition (Figure 5a), a high-energy AE signal was detected near 40 kN, with cumulative energy increasing from approximately 50 mV·ms to 600 mV·ms. This energy spike behavior was consistently observed across all test conditions and strongly coincided with the mechanical fracture point.
Due to the effect of spot welding on both ends of the steel strands, strand misalignment occurred at the strand fracture points with continued loading (as shown in Figure 6), after which no further strand fracture signals were observed. The load and cumulative energy curves became smoother. This demonstrates that AE signals can effectively reflect the strand fracture process in steel strands.

3.2. Analysis of Identification Results of Number of Strand Fractures Without Signal Attenuation

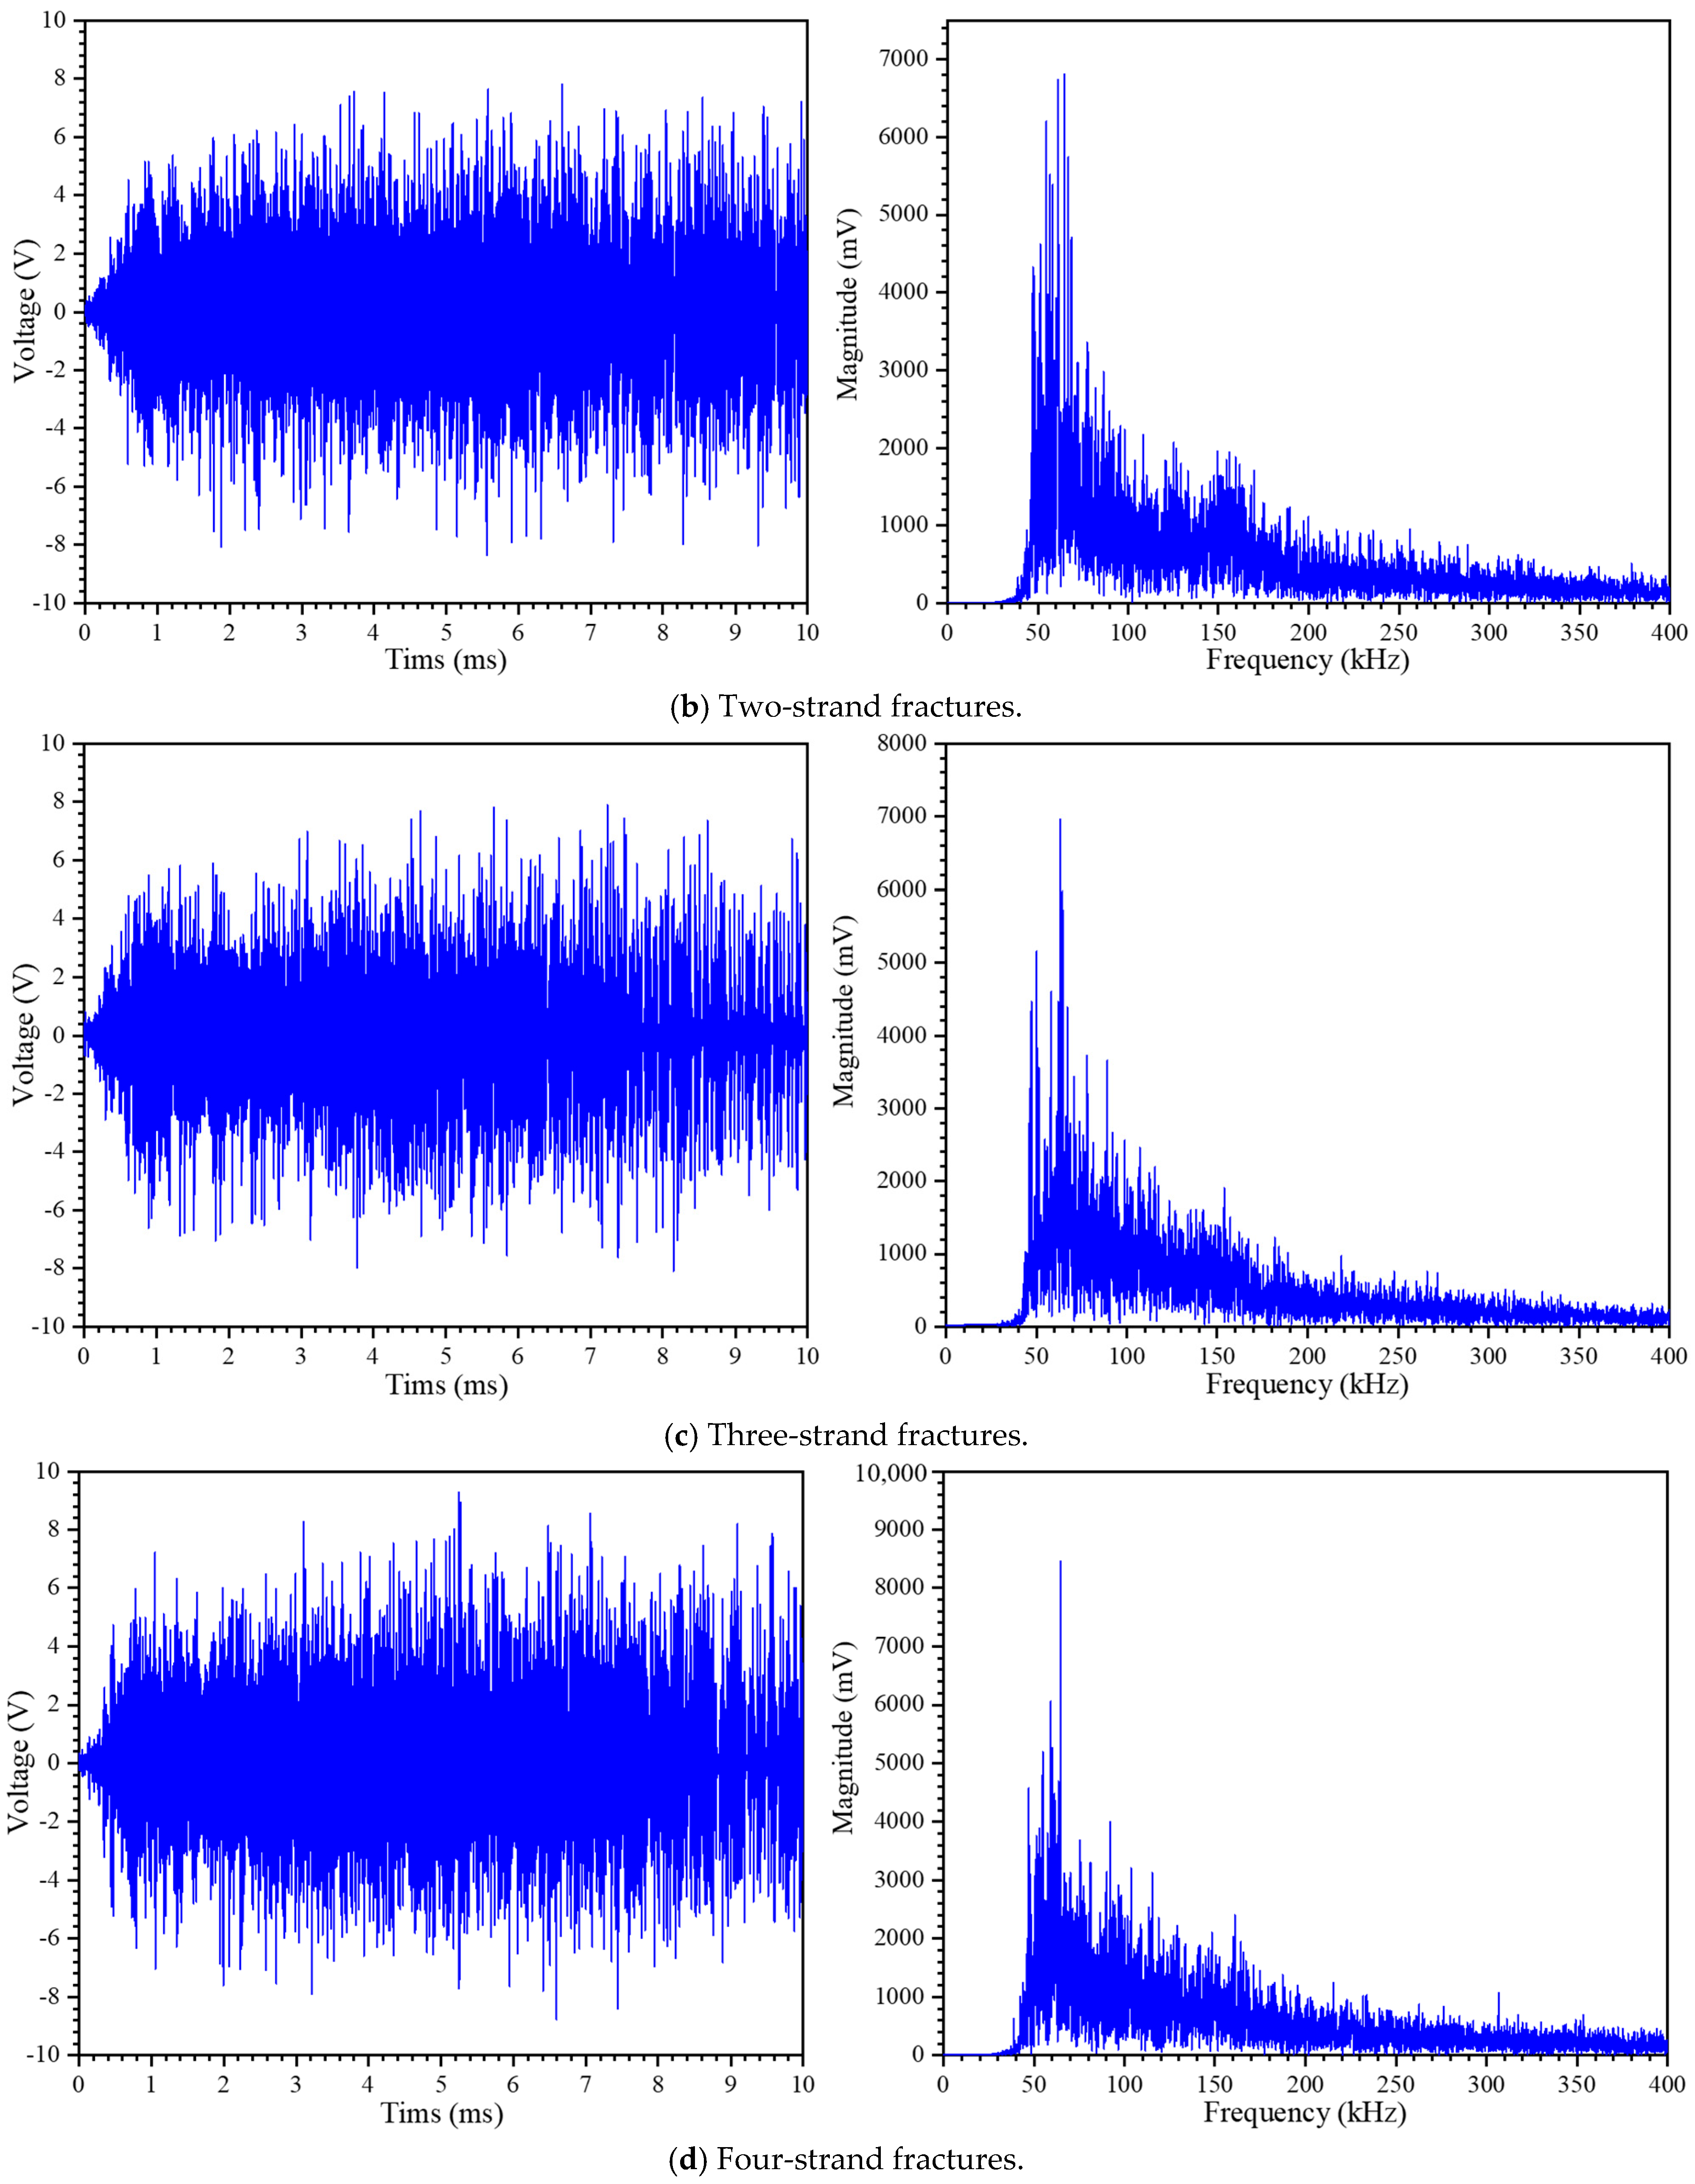
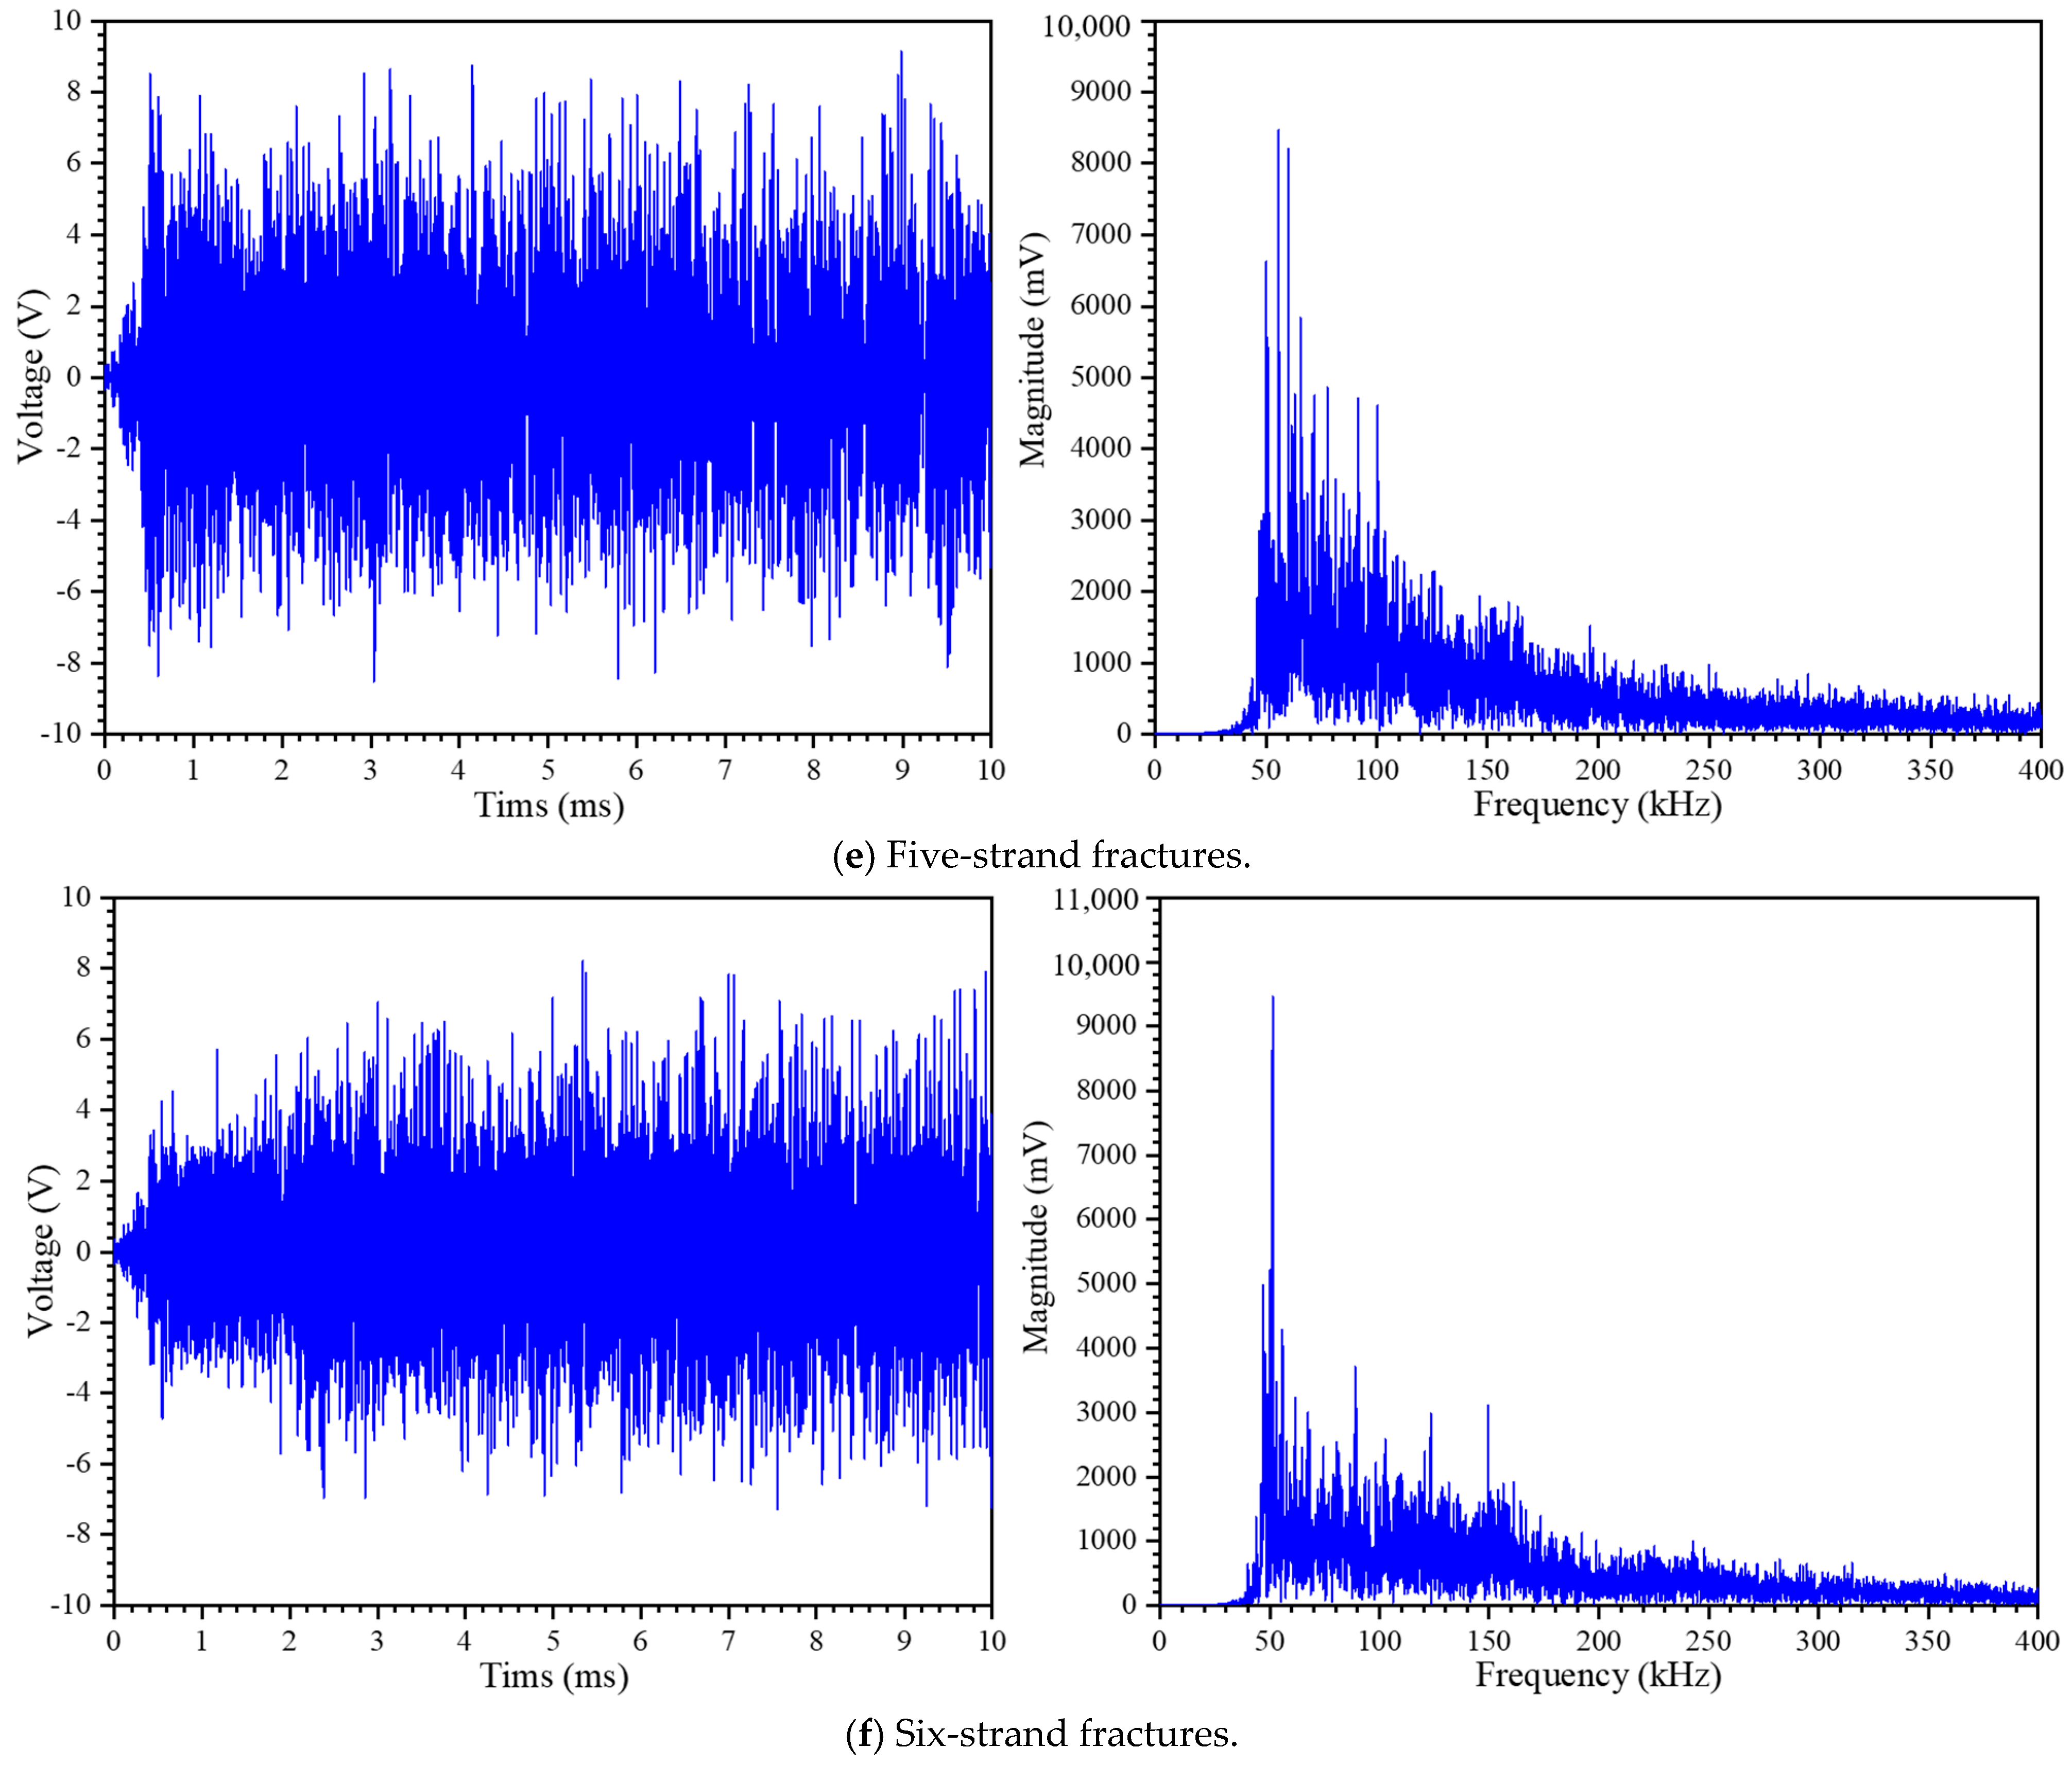
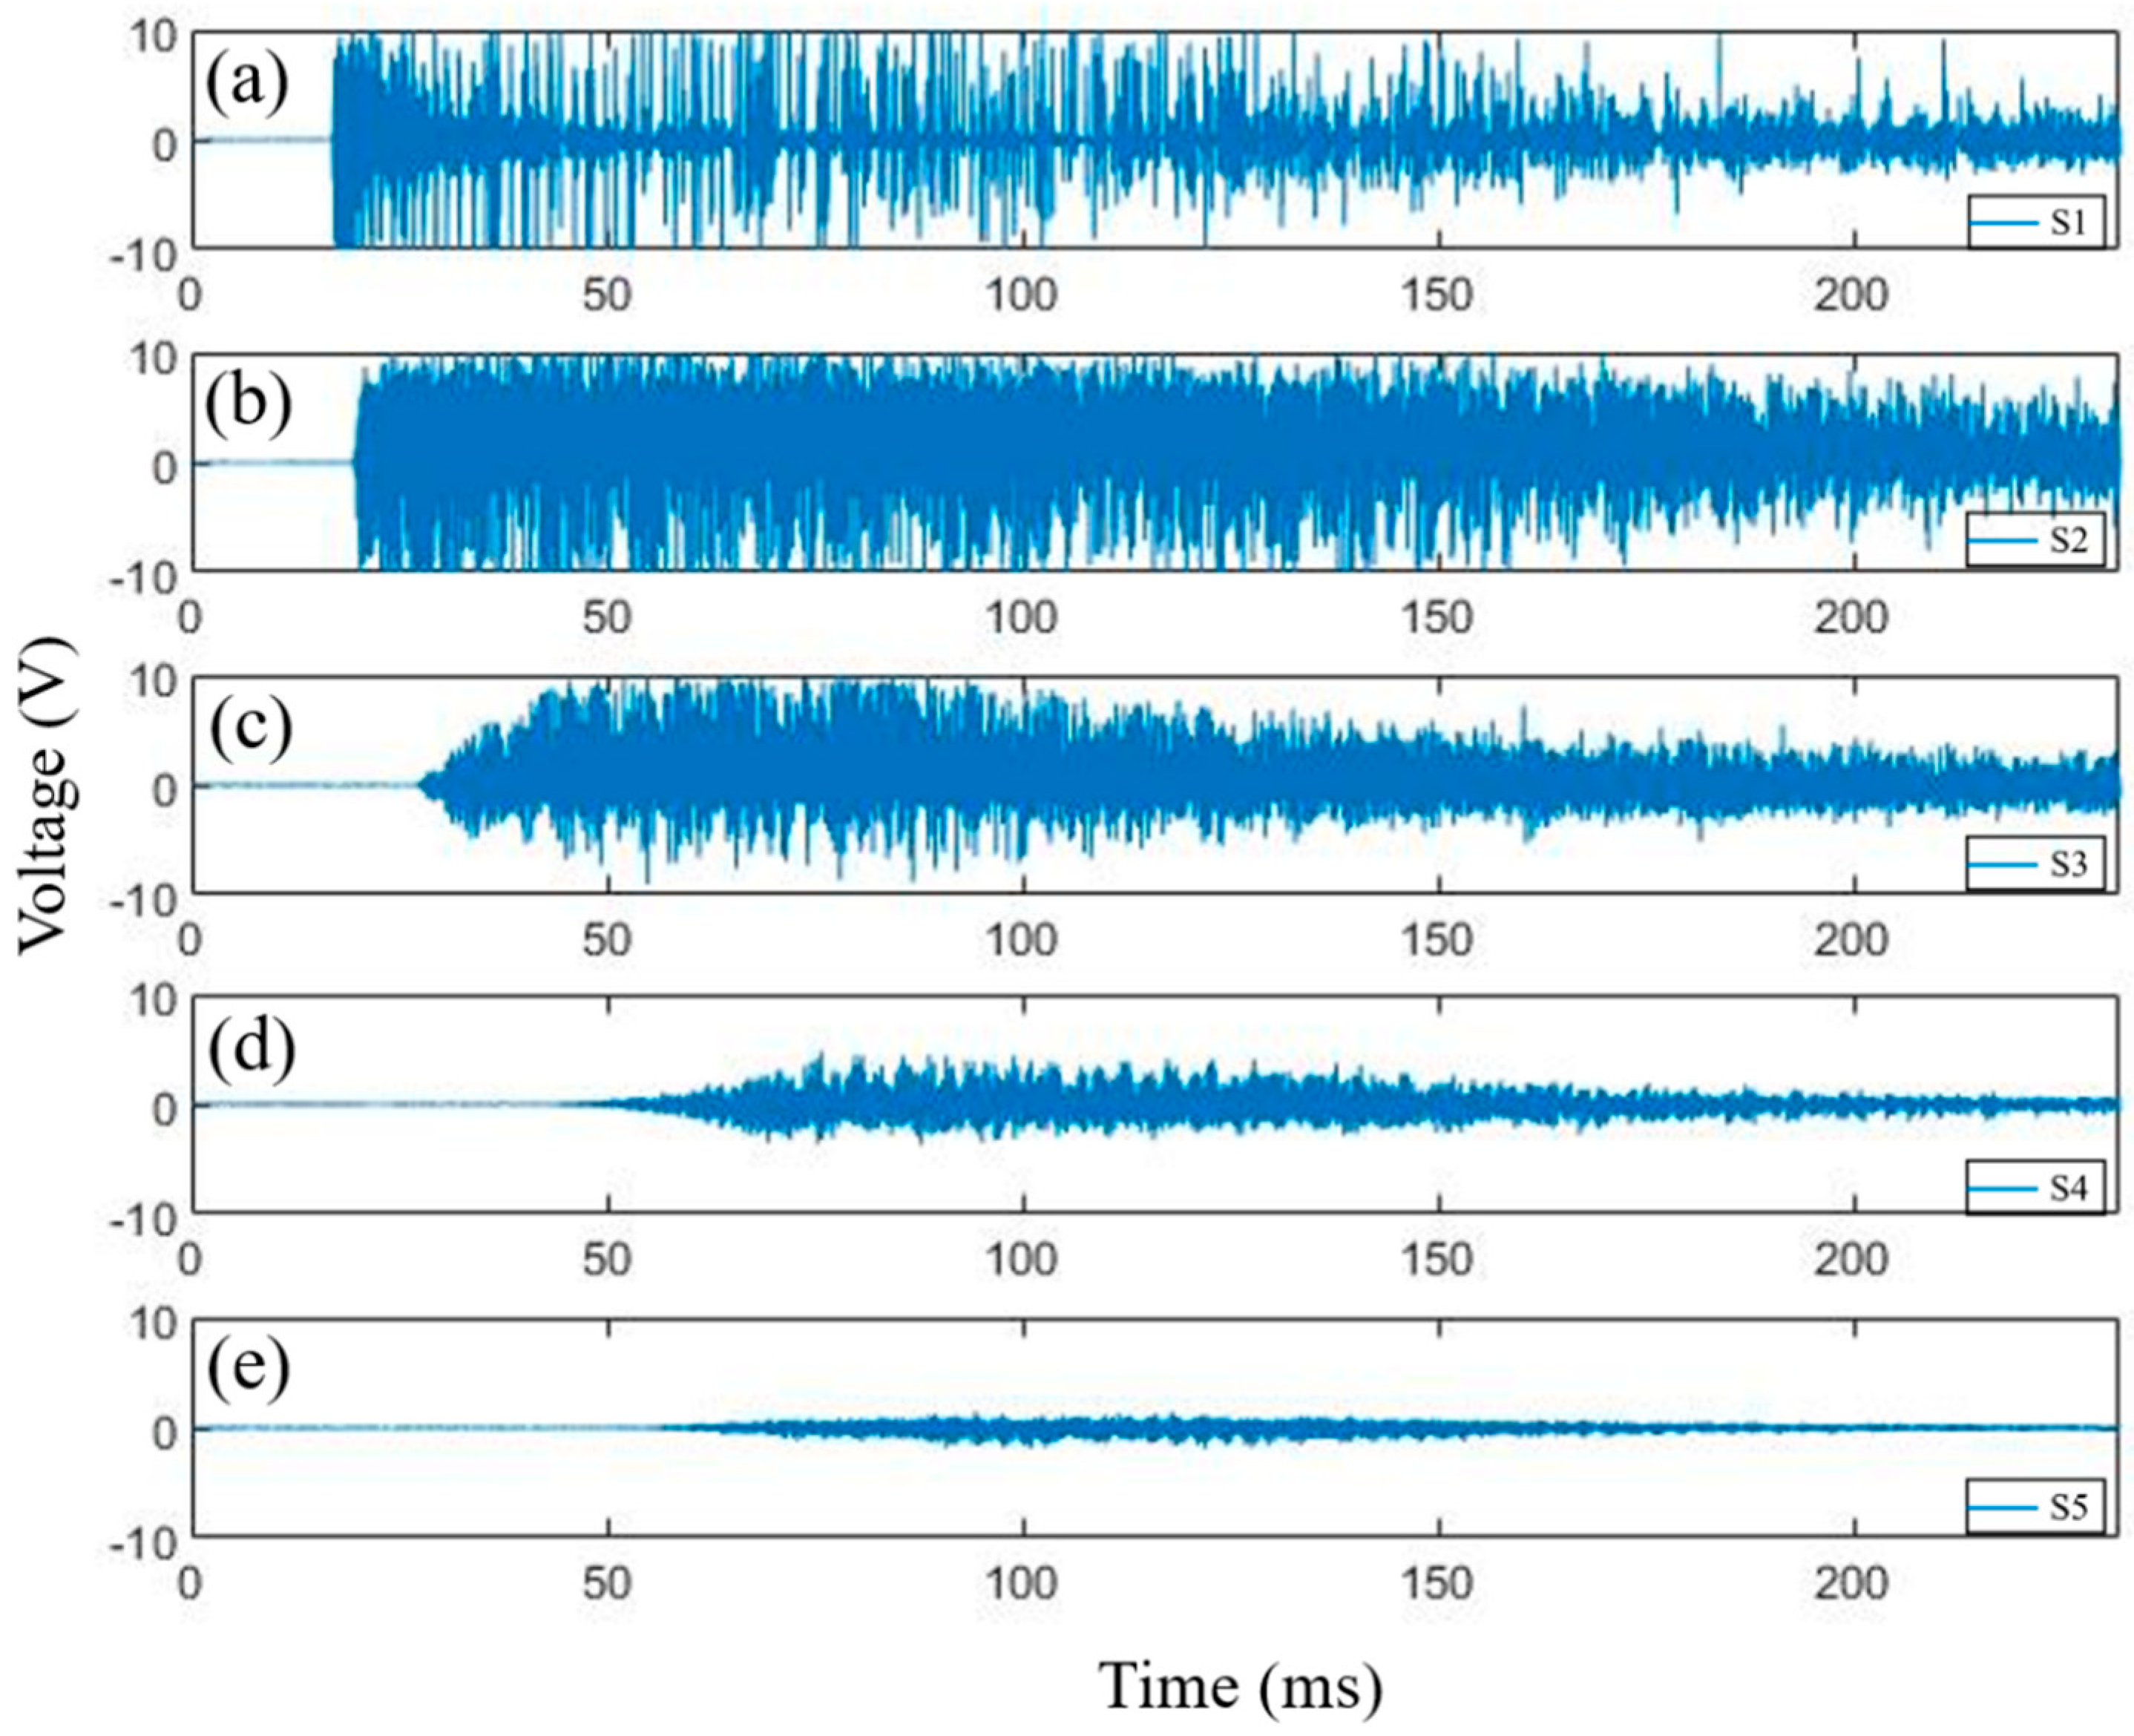
3.2.1. Feature Analysis of Strand Fracture Signals
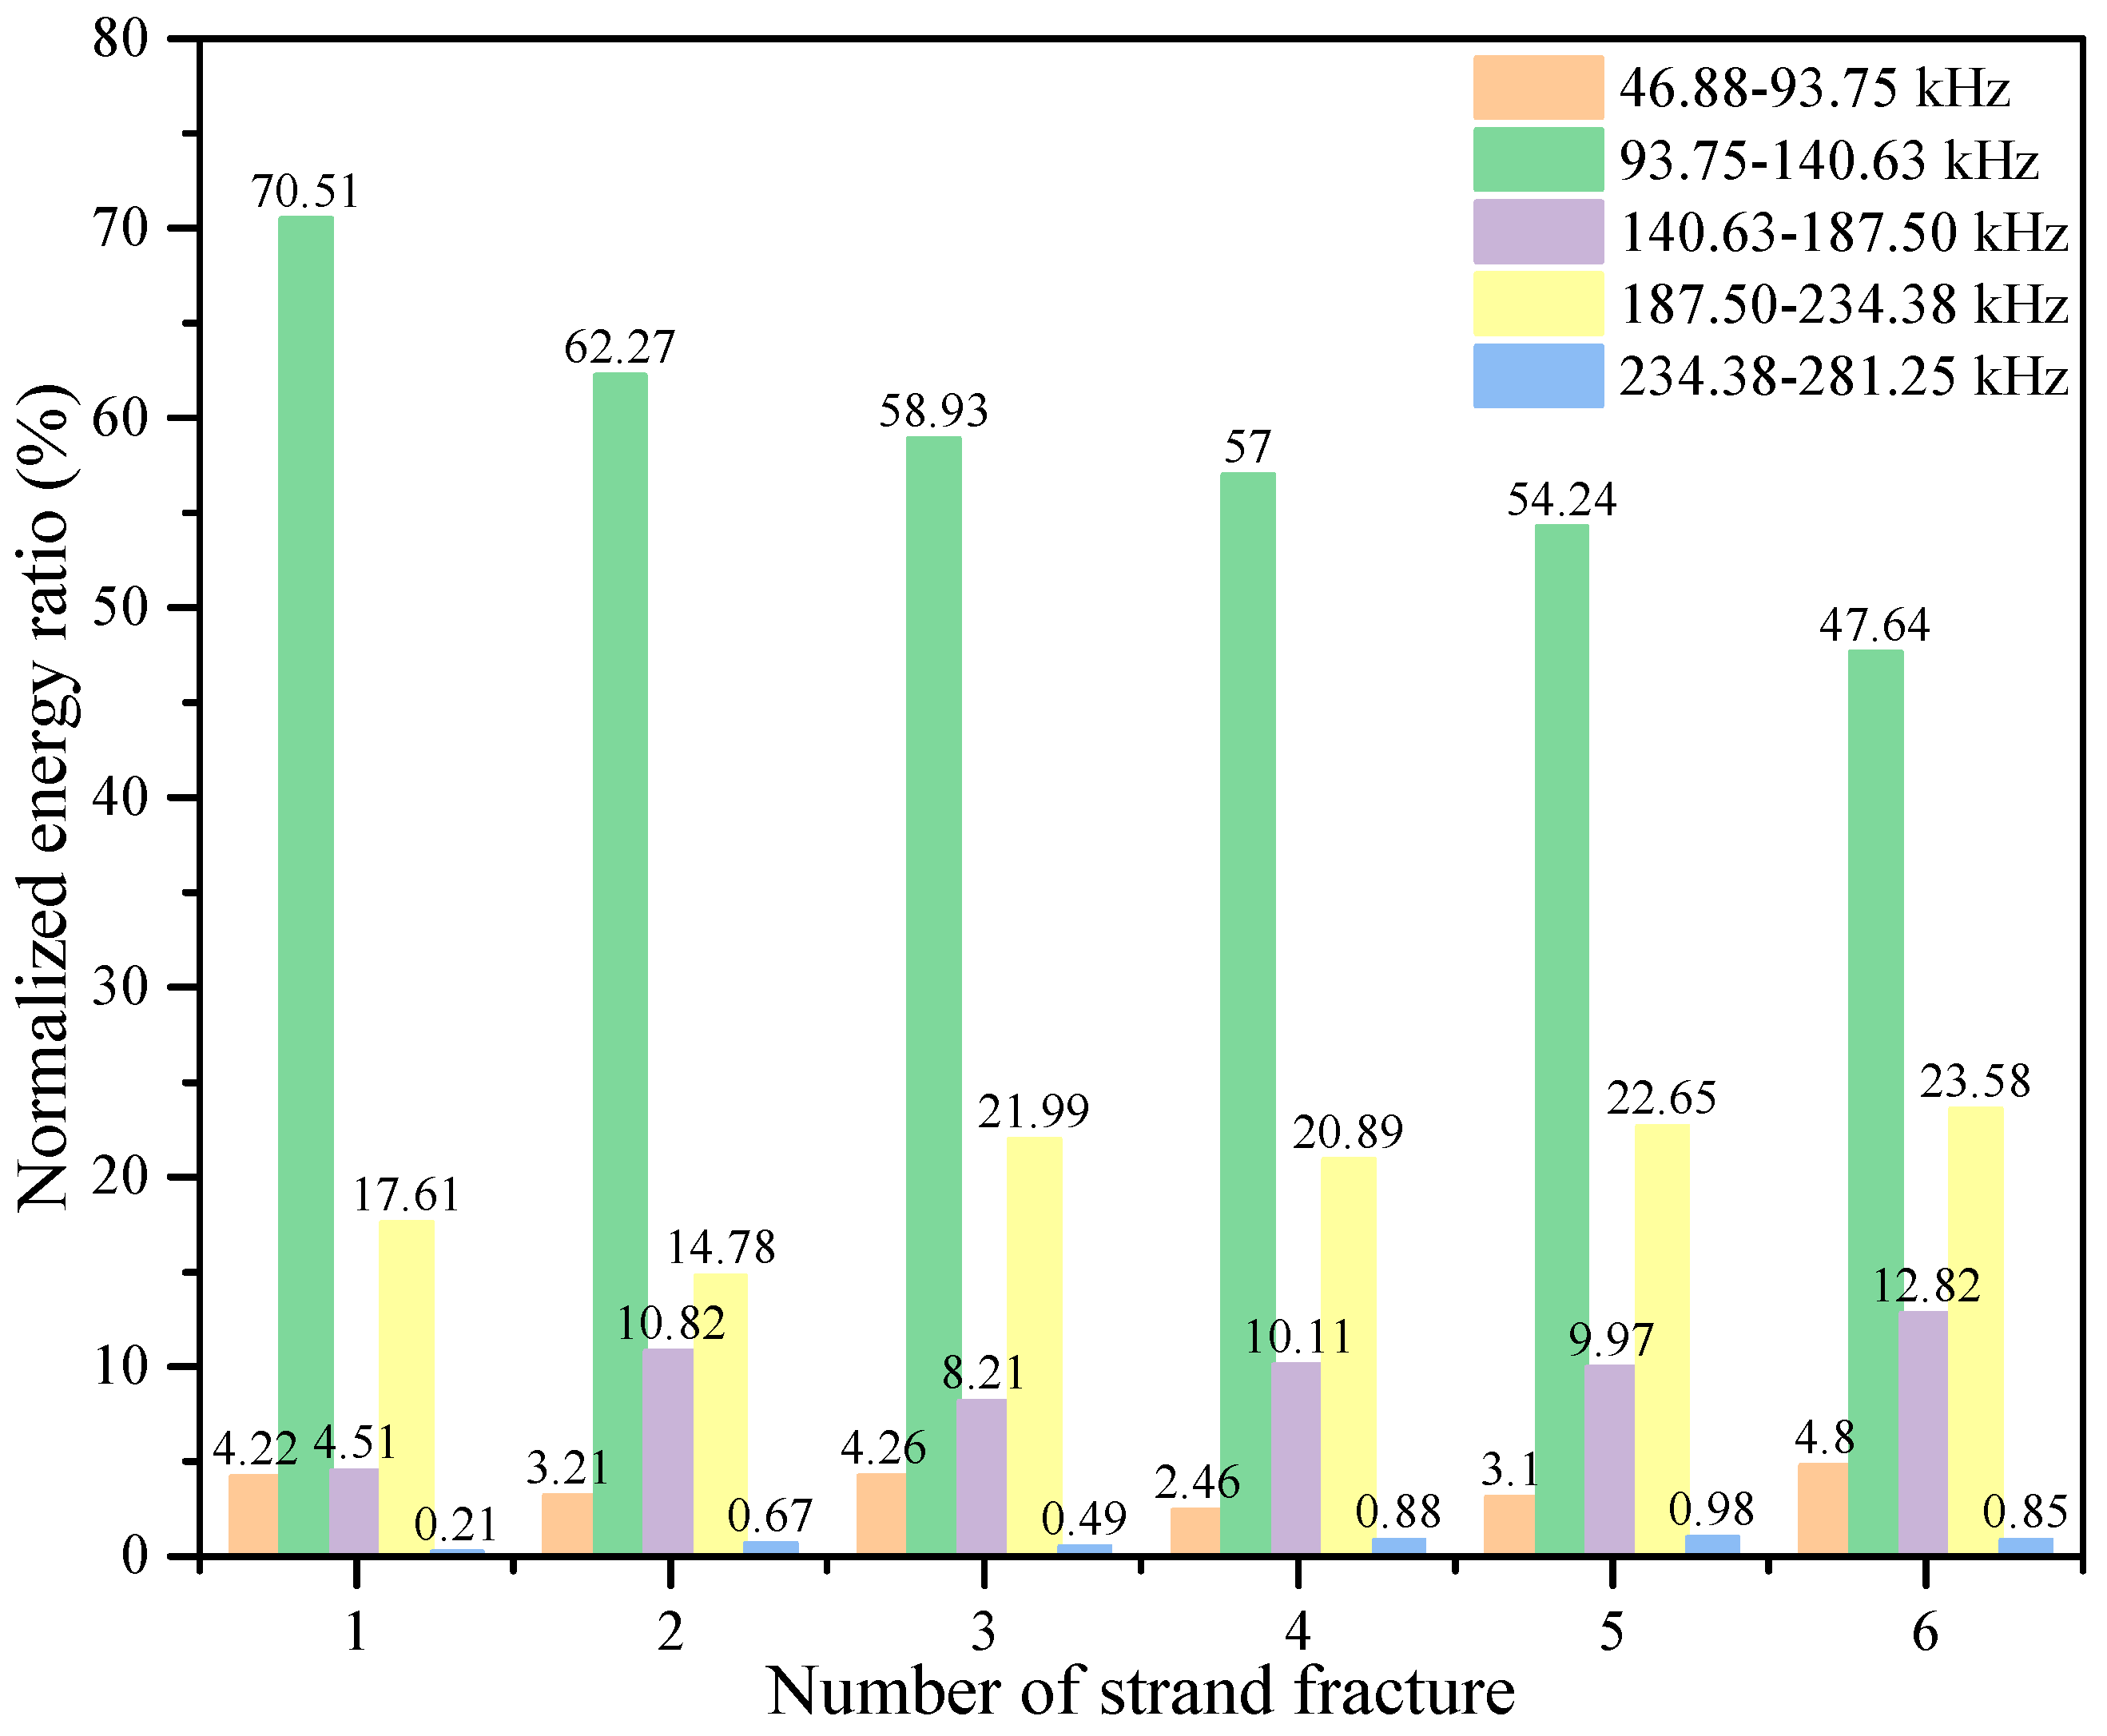
To establish the relationship between the number of strand fractures and AE signals, the characteristics of AE signals under different strand fracture scenarios were thoroughly investigated by applying Fourier transform to the waveform data and plotting the waveforms and spectra (as shown in Figure 7). The dominant frequency amplitude was 5720 mV for one-strand fractures, 6807 mV for two-strand fractures, 6959 mV for three-, 8455 mV for four-, 8469 mV for five-, and 9463 mV for six-strand fractures. It can be observed that the number of strand fractures is positively correlated with the amplitude of the main frequency, which increases significantly as more strands fracture. This phenomenon can be attributed to the cumulative effect of mechanical energy released during strand breakage, as well as the more complex vibrations generated when multiple strands fail. In simple terms, the more steel strands that fracture, the more energy is released, resulting in more complex vibrations and, consequently, a higher-frequency amplitude. Additionally, the fracture of more strands leads to faster stress release, further contributing to the increase in main frequency amplitude.

3.2.2. WPT Results

Wavelet packet decomposition is a time-frequency analysis method that effectively handles AE signals with non-stationary and random characteristics. The principle involves decomposing the signal into low-frequency and high-frequency components, where the low-frequency part represents the approximation and the high-frequency part represents the details. Moreover, this decomposition is both non-redundant and complete [45,47]. Therefore, for a time-frequency analysis of waveform signals containing substantial mid-to-high-frequency information, wavelet packet decomposition is the preferred method. Each specific position in the wavelet packet tree corresponds to a different frequency band, with the frequency range of each component defined by Equation (1).
n 1 2 f s 2 i ,   ( n + 1 ) 1 2 f s 2 i , n = 0 , 1 , , 2 i 1
where fs is the sampling rate, n is the decomposition level indicator, and i is the decomposition level.
The energy of each component in the decomposition layer i ( E i n ) is calculated by Equation (2).
E i n ( t ) = t = t 0 t ( f i n ( τ ) ) 2
where is the decomposition component of the wavelet packet, and t and t0 represent its time period. The ratio of the energy of each frequency band to the total energy of the original signal is calculated by Equation (3).
P i n = E i n ( t ) n = 0 2 i 1 E i n ( t )
Wavelet packet analysis requires selecting an appropriate basis function for transformation to accurately extract the energy characteristics of each frequency band. In this study, the dmey wavelet function was used due to its excellent time-frequency localization properties, enabling it to accurately capture the instantaneous changes in non-stationary signals. Using the dmey wavelet function, the decomposition level was set to 5, resulting in 32 decomposition bands, each with a frequency bandwidth of 46.87 kHz, represented as S500 to S531. Based on the energy proportion within the frequency range, the energy of the first five wavelet packets accounted for more than 99% of the total energy. Therefore, the first five wavelet packets—S500 (46.88–93.75 kHz), S501 (93.75–140.63 kHz), S502 (140.63–187.50 kHz), S503 (187.50–234.38 kHz), and S504 (234.38–281.25 kHz)—were selected for further analysis.
The trend of normalized energy distribution across different frequency bands for varying numbers of strand fractures is shown in Figure 8. It can be observed that regardless of the number of strand fractures, the 93.75–140.63 kHz frequency band consistently exhibits the highest normalized energy proportion, indicating that this band is the most significant energy concentration zone during the strand fracture process. However, as the number of strand fractures increased, the energy proportion in this frequency band gradually decreased. Specifically, the energy proportion for one-strand fractures was 69.77%, which dropped to 47.64% for six-strand fractures, indicating a significant downward trend. Additionally, the energy ratios in the 140.63–187.50 kHz and 187.50–234.38 kHz bands fluctuated at around 20% and 10%, respectively. However, the sum of the normalized energy ratios for these two bands showed an overall upward trend, suggesting that these higher-frequency bands are more sensitive to identifying multiple strand fractures. In contrast, the energy proportion in the 46.88–93.75 kHz band remained relatively low and stable, between 4.24% and 4.76%, with little variation. Similarly, the 234.38–281.25 kHz band exhibited a lower energy share, fluctuating between 0.87% and 1.32%. The energy in the low-frequency bands remained nearly constant across all fracture scenarios. This indicates that as the number of strand fractures increases, the energy distribution of the AE signals gradually shifts towards higher-frequency bands. These shifts in energy distribution across frequency bands can effectively assist in identifying the number of strand fractures.
This frequency variation phenomenon can be explained by the structural changes that occur in steel strands as the number of strand fractures increases. More strand fractures lead to changes in the overall stiffness and mass distribution of a steel strand, which in turn alters its vibration modes and frequency characteristics. As a result, the distribution of energy across the frequency bands in the AE signals is affected.

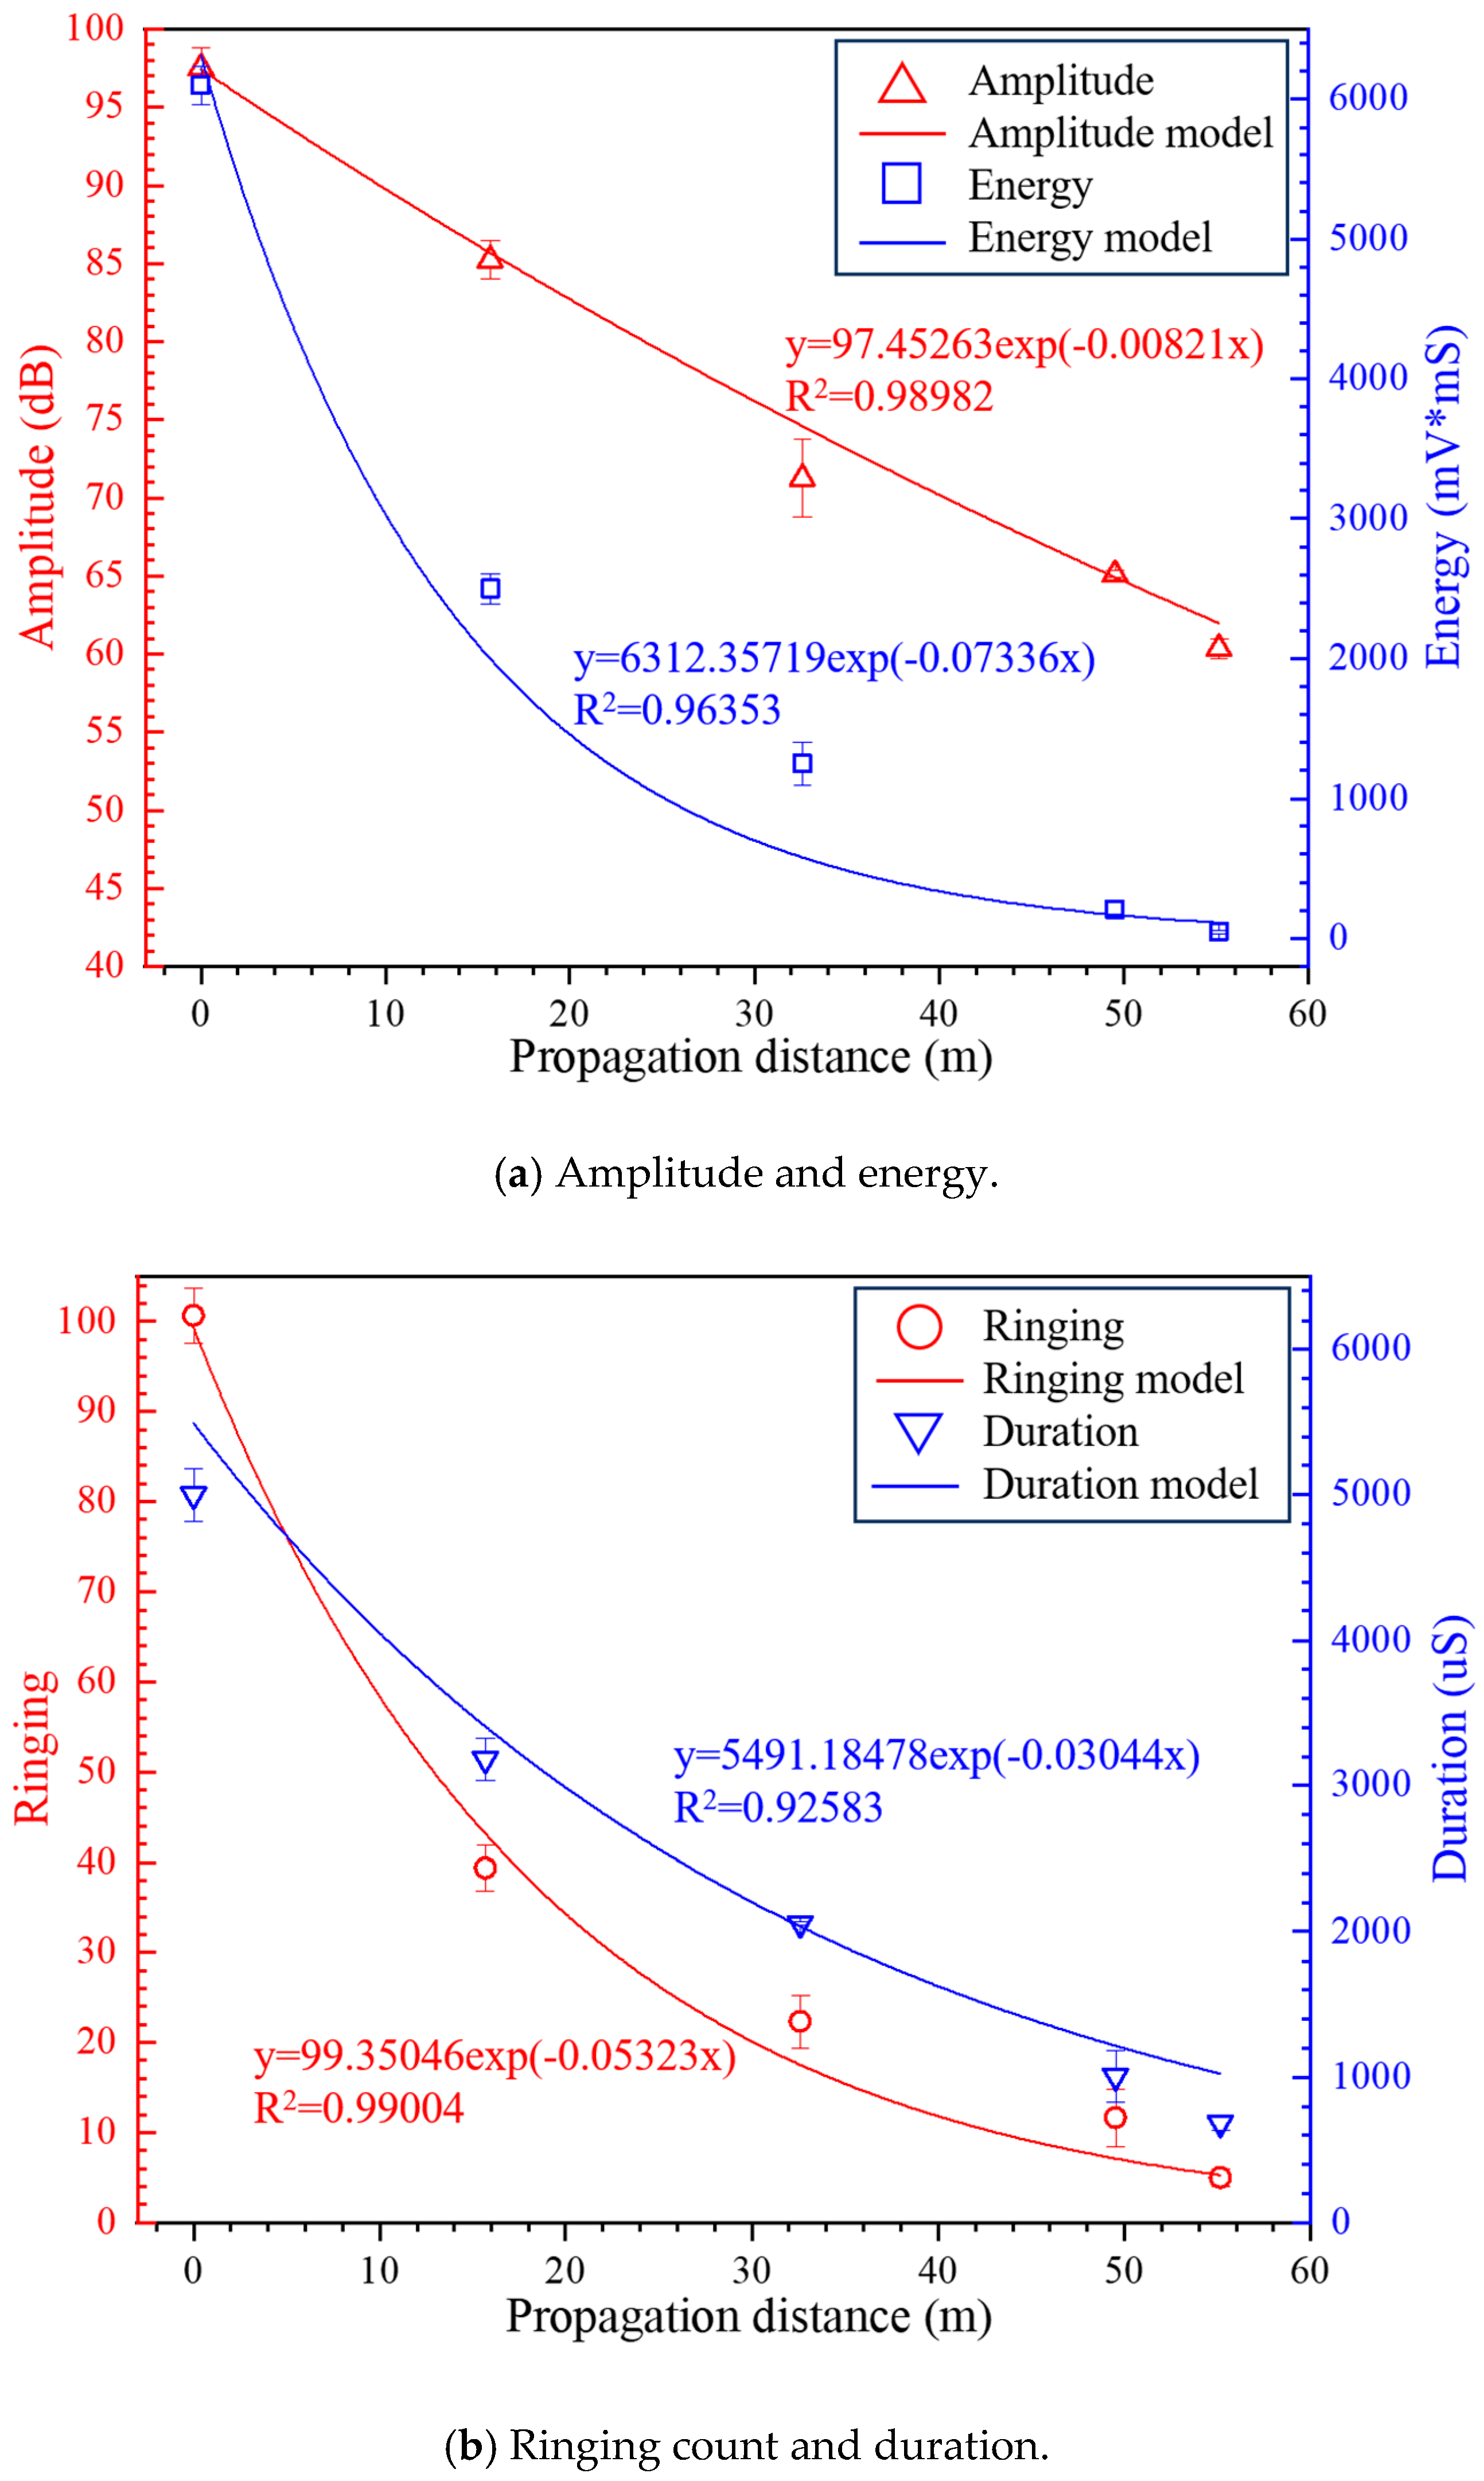
3.3. An Analysis of the Maximum Monitoring Distance for Identifying the Number of Strand Fractures

To investigate the propagation characteristics of strand fracture AE signals along the waveguide rods, signals collected at different propagation distances during the AE test were analyzed. The results are shown in Figure 9. The amplitude of the AE signal recorded by the first sensor was close to 10 V. As the propagation distance increased, the signal amplitude gradually decreased, with the final sensor receiving a strand fracture signal of approximately 0.5 V. Due to structural constraints, after placing four sensors at equal intervals, a fifth sensor was positioned at the end of the waveguide rod. As shown in Figure 9d,e, due to the relatively short propagation distance, the voltage values of the AE signals from the strand fractures collected by the S4 and S5 sensors show little difference. This indicates that the signals can still propagate further, and the AE sensors are able to continue collecting AE signals. Based on this observation, it can be preliminarily concluded that this method of using serially connected waveguide rods for strand fracture monitoring is not limited to the 13-slab serial configuration and can potentially be applied to the monitoring of strand fractures in longer serial beam–plate structures.
To investigate the maximum transmission distance of acoustic emission signals containing complete fracture information along the waveguide rod, attenuation analyses were performed on the collected AE signals. As shown in Figure 10, all four parameters—ringing count, duration, amplitude, and energy—exhibit exponential attenuation with an increasing propagation distance. The derived attenuation coefficients are as follows: amplitude (0.00821 dB/m), energy (0.07336 mV·mS/m), ringing count (0.05323 /m), and duration (0.03044 μs/m). Among these, amplitude demonstrates the smallest attenuation coefficient, reflecting the strongest stability and anti-decay capacity in long-distance signal transmissions. In contrast, energy shows the most severe decay and the weakest stability. Therefore, from the perspective of signal stability and distinguishability in long-distance propagation, amplitude exhibits the highest engineering adaptability among the AE parameters evaluated and is recommended as the preferred characteristic feature for identifying wire break events in waveguide-based monitoring systems.
The attenuation rates of key parameters are shown in Figure 11. As the propagation distance increases, the attenuation rates of all parameters exhibit an upward trend but with significant differences in growth rates. Energy increases the fastest, indicating its high sensitivity to propagation distance. Duration shows a moderate growth rate, reflecting its medium sensitivity to distance, while amplitude increases the slowest, indicating a relatively sluggish response to propagation distance. A comparison of the attenuation patterns reveals that amplitude has the lowest attenuation rate, followed by ring count and duration, while energy exhibits the highest attenuation rate. Energy, as a parameter that comprehensively reflects wave intensity, experiences the fastest decay. The attenuation rates of other parameters can be understood in relation to the rapid decay of energy.
Based on an analysis of the experimental results, when using waveguide rods for AE monitoring of wire breaks in prestressed hollow slab bridges, the signal attenuation rate for amplitude was only 40% at a propagation distance of 55 m. To ensure the accuracy and completeness of the collected AE signals, the amplitude attenuation model allowed us to estimate that the maximum sensor placement distance for receiving AE signals is 103 m. This indicates that when using AE amplitudes for serial monitoring of beam–plate structures, up to 23 slabs can be connected in series, enabling effective strand fracture monitoring in most prestressed hollow slab bridges.

4. Conclusions

This paper presents a method for controlling the number of strand fractures in the tensile test of steel strands. A relationship between the number of strand fractures and the collected AE signals was established, and the optimal characteristic AE parameters were obtained through an analysis of the strand fracture signals. Additionally, by combining the attenuation curve in practical engineering, the maximum number of series plates could be deduced. The main conclusions are summarized as follows:
  • The main frequency amplitude of AE signals is positively correlated with the number of strand fractures. Changes in the main frequency amplitude can serve as an effective criterion for identifying the number of broken wires and predicting the fracture state of the strand.
  • The 93.75–140.63 kHz frequency band in a strand fracture signal contains the highest energy and is the most sensitive and critical frequency band for monitoring strand fractures. As the number of strand fractures increases, the energy distribution of the AE signals shifts towards higher-frequency bands.
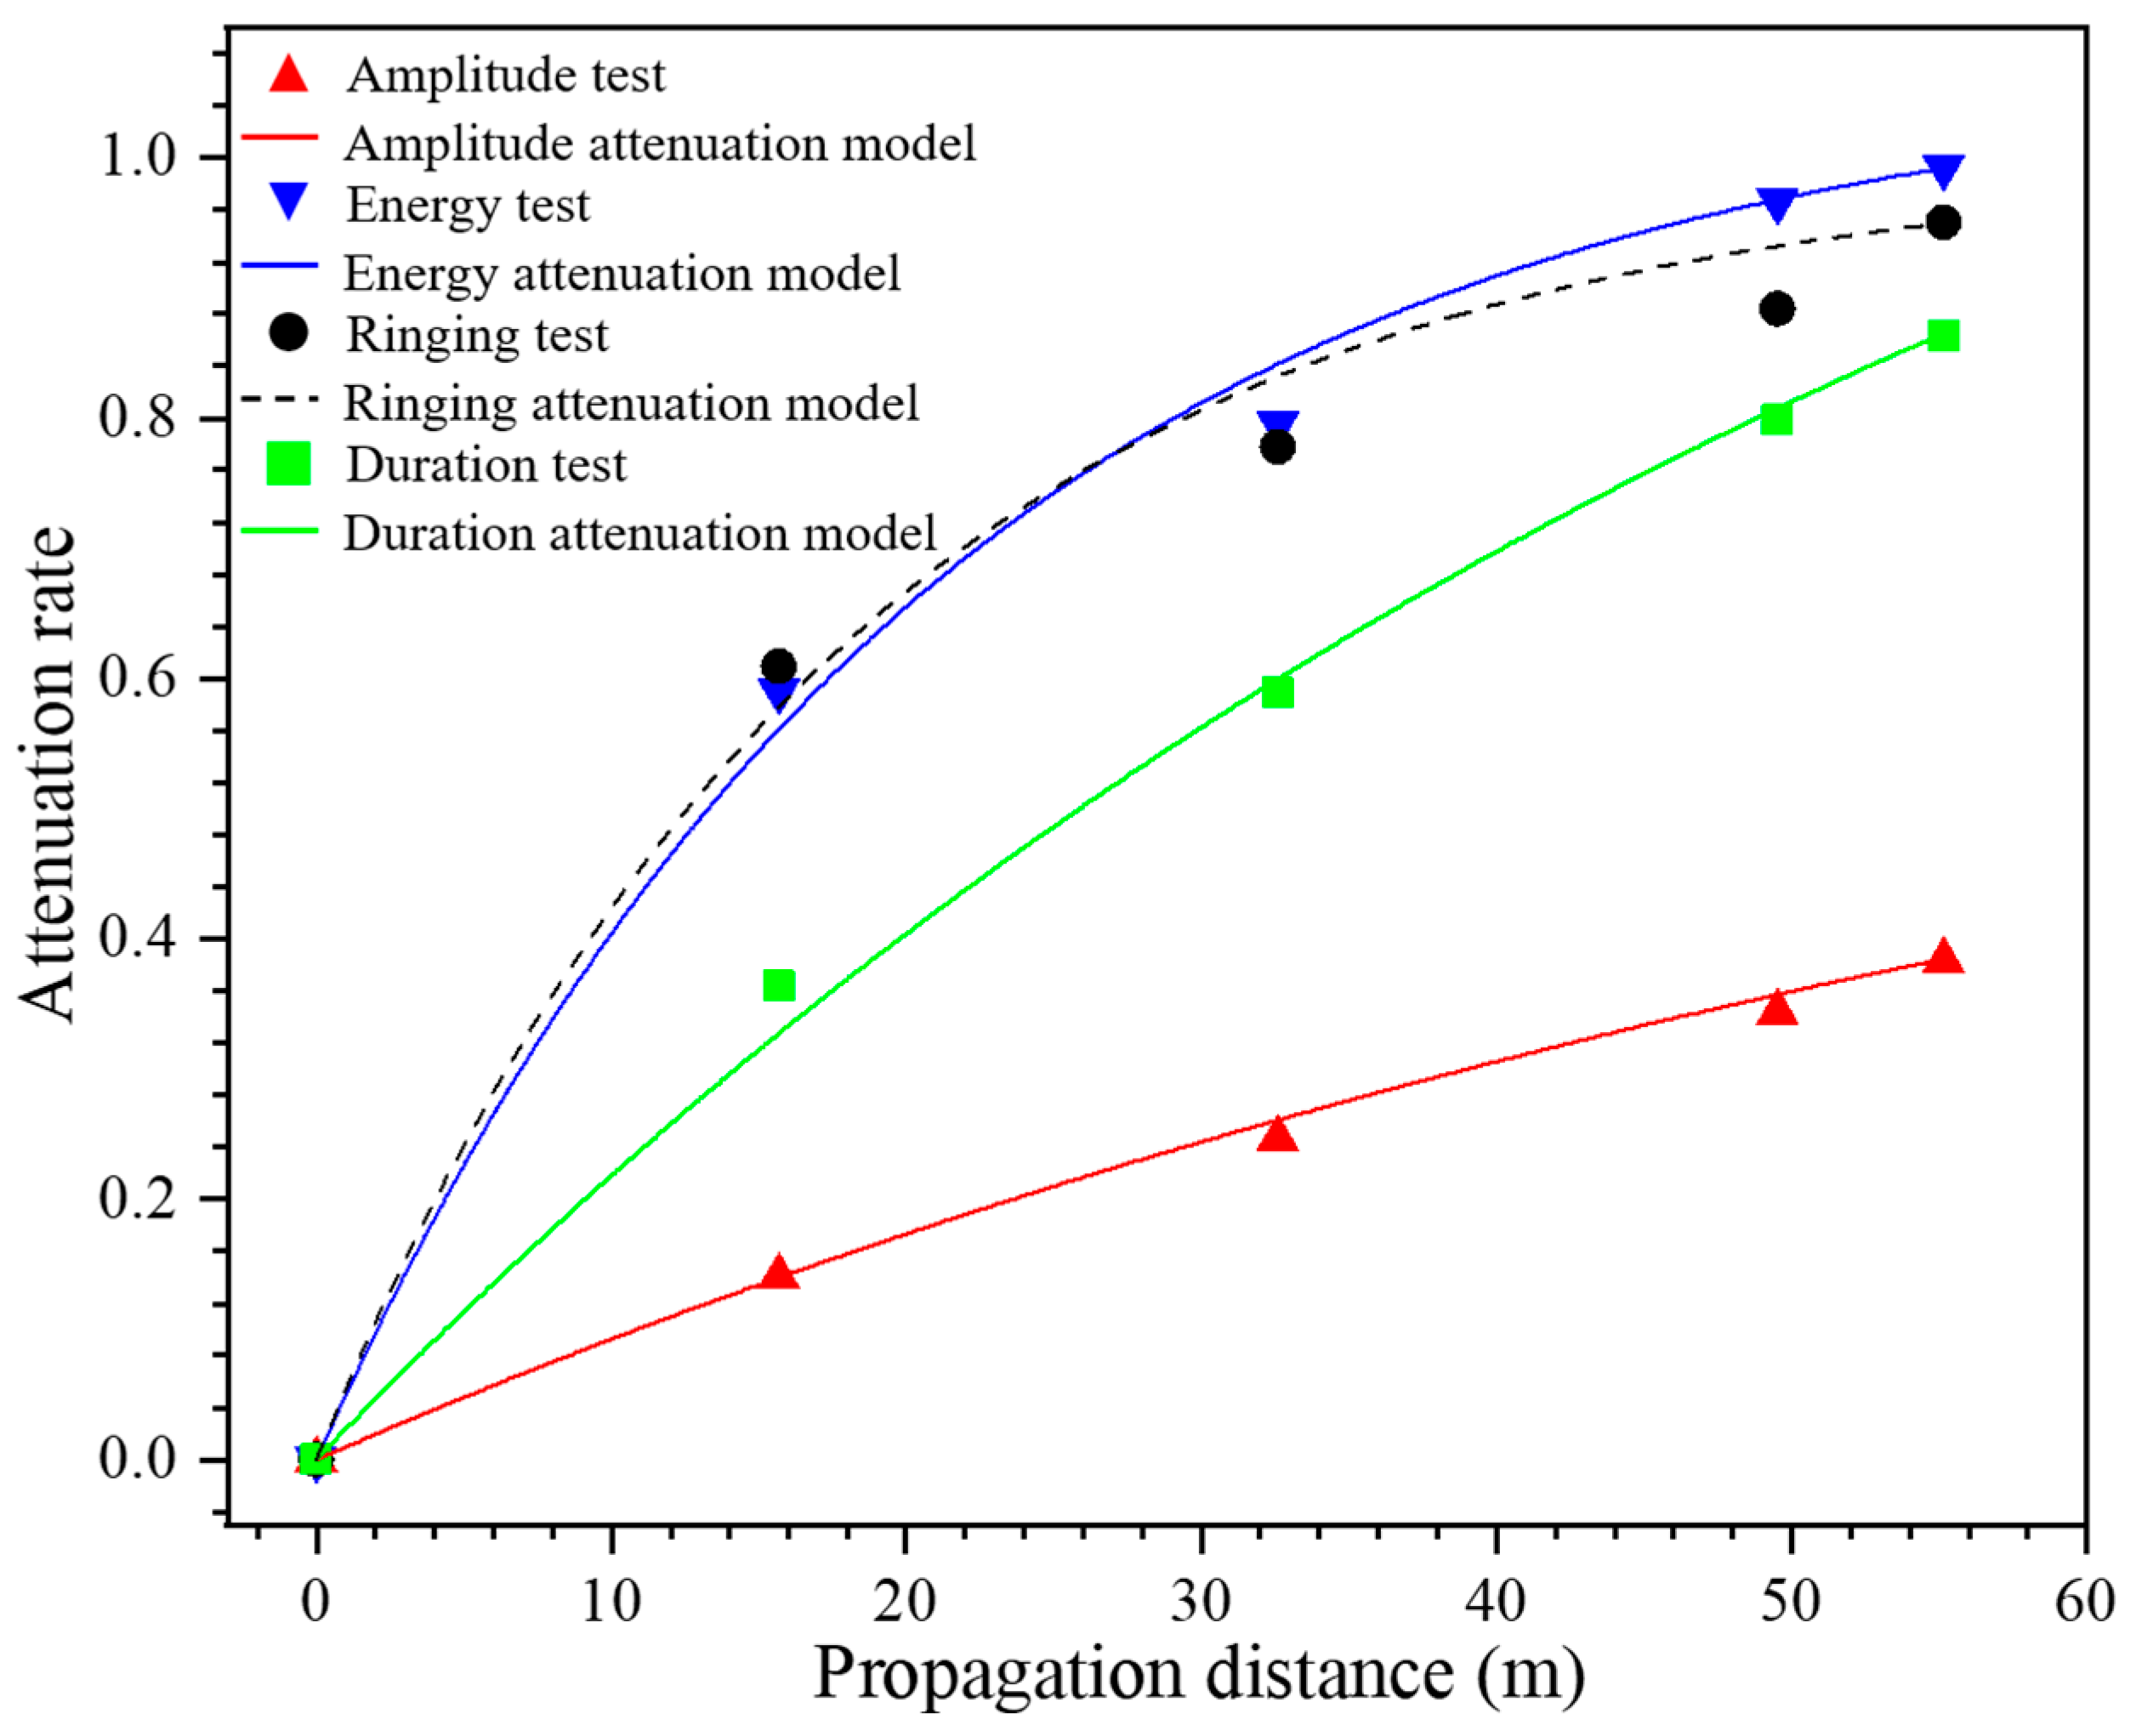
  • Amplitude is the optimal AE parameter for engineering monitoring of steel strand fractures. Compared to duration, energy, and ringing counts, amplitude exhibits the lowest and slowest decay rate during propagation, making it more effective for long-distance monitoring and well-suited for practical engineering applications.
  • An attenuation curve model of AE signals based on actual strand fracture damage was established, with the farthest propagation distance of the AE signal calculated to be 103 m. This allows for the monitoring of strand fractures in bridge steel strands up to 23 series plates, meeting the monitoring requirements for most prestressed steel strand bridges.
The AE-based method proposed in this study for identifying the number of strand fractures using waveguide signal feature analysis demonstrates strong universality and engineering applicability. Provided that suitable waveguide layouts or signal transmission channels can be established, this method may be extended to a range of prestressed structural forms, including T-beams, box girders, prestressed pipe piles, and underground pipe galleries. Future research will focus on expanding the application scenarios and conducting adaptation and optimization based on the specific boundary coupling conditions of different structural systems. However, this study still has several limitations. First, the number of strand fracture tests and the experimental conditions may be limited. The method used to simulate different numbers of fractured strands is not yet universally validated and requires further testing across a broader set of scenarios. Second, the reported maximum AE signal propagation distance was obtained under ideal laboratory conditions and does not account for real-world factors, such as concrete encapsulation, wave impedance mismatches, or interface energy losses. In practical bridge structures, environmental noise, temperature fluctuations, and operational vibrations may also impact signal stability and reduce trigger sensitivity. Therefore, the effective monitoring range of the waveguide system in actual bridge applications still needs to be validated and calibrated under in situ conditions.

Author Contributions

Methodology, S.C., G.W. and S.N.; software, J.L.; validation, N.J.; formal analysis, J.L.; investigation, W.L. and X.Q.; resources, W.Y., S.N. and S.S.; data curation, W.L.; writing—original draft preparation, S.C.; writing—review and editing, G.W.; visualization, N.J.; supervision, X.Q. and S.L.; project administration, W.Y.; funding acquisition, N.J. and S.L. All authors have read and agreed to the published version of the manuscript.

Funding

The authors are grateful for financial support from the Henan Provincial Science and Technology Research Project (232102320010) and Zhongyuan Sci-Tech Innovation Leading Talents (254000510019).

Data Availability Statement

The original contributions presented in the study are included in the article, further inquiries can be directed to the corresponding authors.

Conflicts of Interest

Authors Wei Yan, Juan Li, Shu Si and Xilong Qi were employed by the company Henan Zhongtian High-Tech Smart Technology Co., Ltd. Author Shiwei Niu was employed by the company Henan High Speed Railway Co., Ltd. Author Shiwei Niu was employed by the company Henan Railway Construction Investment Group Co., Ltd. Author Wei Liu was employed by the company Henan Yu-Xi Expressway Co., Ltd. The remaining authors declare that the research was conducted in the absence of any commercial or financial relationships that could be construed as a potential conflict of interest.

References

  1. Guo, H.; Yang, J.; Tang, R.; Yang, C.; Xu, F. Monitoring and Analysis of Prestress Loss in Prestressed Box Girder Bridges Strengthened with External Prestressing. Sensors 2024, 24, 4549. [Google Scholar] [CrossRef] [PubMed]
  2. Wu, J.; Liu, D.; Chen, X.; Zhang, J. Experimental Study on Shear Performance of Bond-Tooth Dry Joints in Prestressed Assembled Concrete Beams. J. Build. Eng. 2023, 68, 106189. [Google Scholar] [CrossRef]
  3. Zhu, W.; Shen, Q.; Qin, H. Monitoring of Prestress and Bond Stress of Self-Sensing FBG Steel Strand. Measurement 2021, 177, 109246. [Google Scholar] [CrossRef]
  4. Campione, G.; Zizzo, M. Influence of Strands Corrosion on the Flexural Behavior of Prestressed Concrete Beams. Structures 2022, 45, 1366–1375. [Google Scholar] [CrossRef]
  5. Ahmed, M.; El-Sayed, A.K.; Alhozaimy, A.M.; Al-Negheimish, A.I.; Alabdulkarim, A. Prediction of Strand Corrosion Damage in Prestressed Concrete Beams through Visual Inspection of Corrosion Concrete Cracking. Constr. Build. Mater. 2024, 416, 135232. [Google Scholar] [CrossRef]
  6. Ward, D.B.; Dang, C.N.; Floyd, R.W.; Hale, W.M. Prestress Losses of Double-Tee Girders Cast with Lightweight Self-Consolidating Concrete. J. Build. Eng. 2016, 7, 133–142. [Google Scholar] [CrossRef]
  7. De Abreu, M.; Iordachescu, M.; Santos, P.; Valiente, A. Damage Tolerance and Collapse Mechanism of Failed Prestressing Steel Strands in a 50-Year-Old Urban Viaduct. Eng. Fail. Anal. 2024, 159, 108101. [Google Scholar] [CrossRef]
  8. Yuyama, S.; Yokoyama, K.; Niitani, K.; Ohtsu, M.; Uomoto, T. Detection and Evaluation of Failures in High-Strength Tendon of Prestressed Concrete Bridges by Acoustic Emission. Constr. Build. Mater. 2007, 21, 491–500. [Google Scholar] [CrossRef]
  9. Páez, P.M.; Sensale-Cozzano, B. Prestress Loss in Unbonded Prestressed Concrete Beams Based on the Strain Reduction Coefficient. Mater. Struct. 2024, 57, 167. [Google Scholar] [CrossRef]
  10. Saeedifar, M.; Zarouchas, D. Damage Characterization of Laminated Composites Using Acoustic Emission: A Review. Compos. Part B Eng. 2020, 195, 108039. [Google Scholar] [CrossRef]
  11. Ciaburro, G.; Iannace, G. Machine-Learning-Based Methods for Acoustic Emission Testing: A Review. Appl. Sci. 2022, 12, 10476. [Google Scholar] [CrossRef]
  12. Gutkin, R. On Acoustic Emission for Failure Investigation in CFRP Pattern Recognition and Peak Frequency Analyses. Mech. Syst. Signal Process. 2011, 25, 1393–1407. [Google Scholar] [CrossRef]
  13. Mangual, J.; ElBatanouny, M.; Ziehl, P.; Matta, F. Corrosion Damage Quantification of Prestressing Strands Using Acoustic Emission. J. Mater. Civ. Eng. 2013, 25, 1326–1334. [Google Scholar] [CrossRef]
  14. Saha, I.; Vidya Sagar, R. Classification of the Acoustic Emissions Generated during the Tensile Fracture Process in Steel Fibre Reinforced Concrete Using a Waveform-Based Clustering Method. Constr. Build. Mater. 2021, 294, 123541. [Google Scholar] [CrossRef]
  15. Ashraf, S.; Rucka, M. Comparative Study on Fracture Evolution in Steel Fibre and Bar Reinforced Concrete Beams Using Acoustic Emission and Digital Image Correlation Techniques. Case Stud. Constr. Mater. 2024, 20, e03359. [Google Scholar] [CrossRef]
  16. Guo, R.; Zhang, X.; Lin, X.; Huang, S. Active and Passive Monitoring of Corrosion State of Reinforced Concrete Based on Embedded Cement-Based Acoustic Emission Sensor. J. Build. Eng. 2024, 89, 109276. [Google Scholar] [CrossRef]
  17. Zhao, S.; Li, G.; Wang, C. Bridge Cable Damage Identification Based on Acoustic Emission Technology: A Comprehensive Review. Measurement 2024, 237, 115195. [Google Scholar] [CrossRef]
  18. Tayfur, S.; Zhang, T.; Mahdi, M.; Issa, M.; Ozevin, D. Cluster-Based Sensor Selection Framework for Acoustic Emission Source Localization in Concrete. Measurement 2023, 219, 113293. [Google Scholar] [CrossRef]
  19. Liu, X.; Du, P.; Xue, S.; Ma, Y.; Wang, H.; Li, W.; Zhang, P. Study on Spectral Statistical Characteristics of Acoustic Emission Signals from the Leakage of Buried Gas Pipelines. Energy 2025, 320, 135068. [Google Scholar] [CrossRef]
  20. Zhang, Z.; Huang, J.; Yu, Y.; Qin, R.; Wang, J.; Zhang, S.; Su, Y.; Wen, G.; Cheng, W.; Chen, X. Microleakage Acoustic Emission Monitoring of Pipeline Weld Cracks under Complex Noise Interference: A Feasible Framework. J. Sound Vib. 2025, 604, 118980. [Google Scholar] [CrossRef]
  21. Goldaran, R.; Turer, A.; Kouhdaragh, M.; Ozlutas, K. Identification of Corrosion in a Prestressed Concrete Pipe Utilizing Acoustic Emission Technique. Constr. Build. Mater. 2020, 242, 118053. [Google Scholar] [CrossRef]
  22. Zhang, L.; Qiu, G.; Chen, Z. Structural Health Monitoring Methods of Cables in Cable-Stayed Bridge: A Review. Measurement 2021, 168, 108343. [Google Scholar] [CrossRef]
  23. Pirskawetz, S.M.; Schmidt, S. Detection of Wire Breaks in Prestressed Concrete Bridges by Acoustic Emission Analysis. Dev. Built Environ. 2023, 14, 100151. [Google Scholar] [CrossRef]
  24. Qu, H.; Li, T.; Cain, J.A.; Chen, G. Early Detection of Wire Fracture in 7-Wire Strands through Multiband Wavelet Analysis of Acoustic Emission Signals. Eng. Struct. 2020, 207, 110227. [Google Scholar] [CrossRef]
  25. Li, D.; Tan, M.; Zhang, S.; Ou, J. Stress Corrosion Damage Evolution Analysis and Mechanism Identification for Prestressed Steel Strands Using Acoustic Emission Technique. Struct. Control Health Monit. 2018, 25, e2189. [Google Scholar] [CrossRef]
  26. Thirumalaiselvi, A. Pattern Recognition Enabled Acoustic Emission Signatures for Crack Characterization during Damage Progression in Large Concrete Structures. Appl. Acoust. 2021, 175, 107797. [Google Scholar] [CrossRef]
  27. Aldahdooh, M.A.A.; Muhamad Bunnori, N. Crack Classification in Reinforced Concrete Beams with Varying Thicknesses by Mean of Acoustic Emission Signal Features. Constr. Build. Mater. 2013, 45, 282–288. [Google Scholar] [CrossRef]
  28. Li, S.-L.; Zhao, Y.-Q.; Kang, Z.-Z.; Wang, C. Acoustic Emission Technology-Based Waveguide Localization Method for Damaged Internal Tendons of in-Service Post-Tensioned Hollow Slab Bridges. Measurement 2024, 237, 114919. [Google Scholar] [CrossRef]
  29. Li, S.-L.; Feng, J.; Wang, T.-G.; Liu, B.; Wu, G.-M.; Kang, Z.-Z. Spatial Acoustic Emission Localization Method for Damage to Prestressed Steel Strands of Girders Using Special-Shaped Waveguide Rods. Measurement 2024, 235, 114951. [Google Scholar] [CrossRef]
  30. Yang, Z.; Yang, H.; Tian, T.; Deng, D.; Hu, M.; Ma, J.; Gao, D.; Zhang, J.; Ma, S.; Yang, L.; et al. A Review on Guided-Ultrasonic-Wave-Based Structural Health Monitoring: From Fundamental Theory to Machine Learning Techniques. Ultrasonics 2023, 133, 107014. [Google Scholar] [CrossRef]
  31. Zima, B.; Kędra, R. Baseline-Free Debonding Detection in Reinforced Concrete Structures by Elastic Wave Propagation. Measurement 2021, 172, 108907. [Google Scholar] [CrossRef]
  32. Zhang, Z.; Tang, F.; Cao, Q.; Pan, H.; Wang, X.; Lin, Z. Deep Learning-Enriched Stress Level Identification of Pretensioned Rods via Guided Wave Approaches. Buildings 2022, 12, 1772. [Google Scholar] [CrossRef]
  33. Yu, H.; Lu, L.; Qiao, P. Localization and Size Quantification of Surface Crack of Concrete Based on Rayleigh Wave Attenuation Model. Constr. Build. Mater. 2021, 280, 122437. [Google Scholar] [CrossRef]
  34. Sause, M.G.R.; Horn, S. Quantification of the Uncertainty of Pattern Recognition Approaches Applied to Acoustic Emission Signals. J. Nondestruct. Eval. 2013, 32, 242–255. [Google Scholar] [CrossRef]
  35. Liu, G. Experimental Research on the Ultrasonic Attenuation Mechanism of Coal. J. Geophys. Eng. 2017, 14, 502–512. [Google Scholar] [CrossRef]
  36. Käding, M.; Marx, S. Acoustic Emission Monitoring in Prestressed Concrete: A Comparative Study of Signal Attenuation from Wire Breaks and Rebound Hammer Impulses. Appl. Sci. 2024, 14, 3045. [Google Scholar] [CrossRef]
  37. Li, F.; Huang, L.; Zhang, H.; Yang, T. Attenuation of Acoustic Emission Propagation along a Steel Strand Embedded in Concrete. KSCE J. Civ. Eng. 2018, 22, 222–230. [Google Scholar] [CrossRef]
  38. Hou, J.; Wang, C.; Li, S.; Jiang, N.; Xu, B.; Wu, G. Study on Propagation Mechanism and Attenuation Law of Acoustic Emission Waves for Damage of Prestressed Steel Strands. Measurement 2023, 219, 113240. [Google Scholar] [CrossRef]
  39. Li, S.; Chang, S.; Li, P.; Zhang, X.; Jiang, N. Optimization of Concrete Surface Sensor Arrangement for Acoustic Emission Monitoring of Prestressed Steel Strand Damage in T-Beams. Appl. Acoust. 2024, 223, 110082. [Google Scholar] [CrossRef]
  40. Yu, X.; Montrésor, S.; Bentahar, M.; Mechri, C. Cluster Analysis of Acoustic Emission Signals for the Damage Pattern Recognition of Polymer Concrete. Appl. Acoust. 2023, 211, 109533. [Google Scholar] [CrossRef]
  41. Xu, J.; Luo, X.; Qiu, X.; Hu, G. Wavelet and Fractal Analysis of Acoustic Emission Characteristic of Fatigue Damage of Asphalt Mixtures. Constr. Build. Mater. 2022, 349, 128643. [Google Scholar] [CrossRef]
  42. Zhao, G.; Luo, D.; Su, G.; Chen, B.; Huang, J. Experimental Research on the Evolutionary Characteristics of Acoustic Signals for Concrete Cracking under Uniaxial Compression. Appl. Acoust. 2022, 191, 108671. [Google Scholar] [CrossRef]
  43. Wang, Z.; Ding, K.; Ren, H.; Ning, J. Quantitative Acoustic Emission Investigation on the Crack Evolution in Concrete Prisms by Frequency Analysis Based on Wavelet Packet Transform. Struct. Health Monit. 2022, 21, 1046–1060. [Google Scholar] [CrossRef]
  44. Wulan, T.; Li, G.; Huo, Y.; Zhao, F.; Yu, J.; Chang, J.; Yang, W.; Kou, Z. Study on the Meso-Damage Characteristics of RC Beam under Shear Failure Based on Acoustic Emission and Numerical Analysis. J. Build. Eng. 2024, 96, 110341. [Google Scholar] [CrossRef]
  45. Barile, C. Damage Characterization in Composite Materials Using Acoustic Emission Signal-Based and Parameter-Based Data. Compos. Part B 2019, 178, 107469. [Google Scholar] [CrossRef]
  46. Han, L. Feature Extraction Method of Bearing AE Signal Based on Improved FAST-ICA and Wavelet Packet Energy. Mech. Syst. Signal Process. 2015, 62–63, 91–99. [Google Scholar] [CrossRef]
  47. Qiao, S.; Zhou, W.; Liang, Y.; Liu, J.; Liu, S. Cluster Analysis on Damage Pattern Recognition in Carbon/Epoxy Composites Using Acoustic Emission Wavelet Packet. J. Reinf. Plast. Compos. 2022, 42, 1006–1021. [Google Scholar] [CrossRef]
Figure 1. Schematic diagram of hollow plate bridge waveguide rod.
Buildings 15 02576 g001
Figure 2. AE field test: (a) a waveguide was used in series to connect the four anchorage ends within a single hollow slab; (b) experimental setup.
Buildings 15 02576 g002
Figure 3. Test details of AE test device and loading device.
Buildings 15 02576 g003
Figure 4. Diagram of strand fracture results: (a) one-strand fractures; (b) two-strand fractures; (c) three-strand fractures; (d) four-strand fractures; (e) five-strand fractures; (f) six-strand fractures.
Buildings 15 02576 g004
Figure 5. Mechanical and corresponding AE signal diagrams under different strand fracture scenarios: (a) one-strand fractures; (b) two-strand fractures; (c) three-strand fractures; (d) four-strand fractures; (e) five-strand fractures; (f) six-strand fractures.
Buildings 15 02576 g005aBuildings 15 02576 g005bBuildings 15 02576 g005c
Figure 6. Dislocation diagram of steel strand fractures.
Buildings 15 02576 g006
Figure 7. Waveform and spectrum diagrams under different strand fracture scenarios.
Buildings 15 02576 g007aBuildings 15 02576 g007bBuildings 15 02576 g007c
Figure 8. Normalized energy ratio of strand fracture signals with different numbers of wires.
Buildings 15 02576 g008
Figure 9. Comparison of the signal of strand fractures received by the sensors: (a) Sensor S1; (b) Sensor S2; (c) Sensor S3; (d) Sensor S4; (e) Sensor S5.
Buildings 15 02576 g009
Figure 10. Attenuation model of AE parameters for strand fracture damage.
Buildings 15 02576 g010
Figure 11. Attenuation rate of AE parameters.
Buildings 15 02576 g011
Table 1. Loading rate conditions.
Test ConditionCondition 1Condition 2Condition 3Condition 4
Loading Rate (mm/min)36912
Disclaimer/Publisher’s Note: The statements, opinions and data contained in all publications are solely those of the individual author(s) and contributor(s) and not of MDPI and/or the editor(s). MDPI and/or the editor(s) disclaim responsibility for any injury to people or property resulting from any ideas, methods, instructions or products referred to in the content.

