Article

Ultrasonic Pulse Velocity for Real-Time Filament Quality Monitoring in 3D Concrete Printing Construction

1
Department of Civil and Environmental Engineering, University of Canterbury, Christchurch 8041, New Zealand
2
Department of Mechanical Engineering, University of Canterbury, Christchurch 8041, New Zealand
*
Authors to whom correspondence should be addressed.
Buildings 2025, 15(14), 2566; https://doi.org/10.3390/buildings15142566
Submission received: 27 June 2025 / Revised: 13 July 2025 / Accepted: 17 July 2025 / Published: 21 July 2025

Abstract

Three-dimensional (3D) concrete printing (3DCP) has gained significant attention over the last decade due to its many claimed benefits. The absence of effective real-time quality control mechanisms, however, can lead to inconsistencies in extrusion, compromising the integrity of 3D-printed structures. Although the importance of quality control in 3DCP is broadly acknowledged, research lacks systematic methods. This research investigates the feasibility of using ultrasonic pulse velocity (UPV) as a practical, in situ, real-time monitoring tool for 3DCP. Two different groups of binders were investigated: limestone calcined clay (LC3) and zeolite-based mixes in binary and ternary blends. Filaments of 200 mm were extruded every 5 min, and UPV, pocket hand vane, flow table, and viscometer tests were performed to measure pulse velocity, shear strength, relative deformation, yield stress, and plastic viscosity, respectively, in the fresh state. Once the filaments presented printing defects (e.g., filament tearing, filament width reduction), the tests were concluded, and the open time was recorded. Isothermal calorimetry tests were conducted to obtain the initial heat release and reactivity of the supplementary cementitious materials (SCMs). Results showed a strong correlation (R2 = 0.93) between UPV and initial heat release, indicating that early hydration (ettringite formation) influenced UPV and determined printability across different mixes. No correlation was observed between the other tests and hydration kinetics. UPV demonstrated potential as a real-time monitoring tool, provided the mix-specific pulse velocity is established beforehand. Further research is needed to evaluate UPV performance during active printing when there is an active flow through the printer.

1. Introduction

Three-dimensional (3D) concrete printing (3DCP) has demonstrated significant growth over the last decade [1]. Over 200 large-scale projects worldwide have been erected using 3DCP, where 48% of these projects are housing-related [2]. This new construction paradigm has resulted in significant innovation, presenting new challenges in building processes and concrete mechanics. Efforts to implement 3DCP focus on controlling concrete handling, ensuring resilience, standard compliance, and addressing operational boundaries and cost efficiency [3]. Effective control of hydration and rheological properties is essential for the successful execution of the printing process [4]. Previous research highlighted the importance of real-time quality control of the rheological properties of cementitious materials, particularly their evolution over time [5,6,7,8].
The design of printable mixes is crucial in 3DCP due to material constraints, specifically rheological requirements. Achieving specific rheological properties (yield stress, plastic viscosity, and thixotropy) is key to ensuring an optimal and consistent printing process [6,9,10]. The mix design should guarantee the repeatability of the fresh properties when using different materials [1]. Yield stress, plastic viscosity, and thixotropy are essential rheological properties in 3DCP [6,11]. The yield stress ( τ 0 ) is the minimum stress required for the material to begin deforming plastically. Plastic viscosity ( μ ) is the resistance of a fluid to flow when subjected to stress. Thixotropy ( A t h i x ) is defined as the reduction in viscosity with time when a fluid, initially at rest, is subjected to shear stress and, once the stress is not applied, the viscosity is recovered. These rheological properties determine the fresh properties of printable mixes (extrudability, workability, buildability, and open time) [6,10], which were identified by Le et al. (2012) [12]. Extrudability is the capacity of a fresh mortar mix to be pumped through a pump-hopper-nozzle system and be extruded in the form of uninterrupted filaments. Workability is the degree of ease of mixing, placing, and finishing the fresh mortar mix with a negligible loss of homogeneity. Buildability is the ability of fresh mortar to be built up in layers, obtaining a reasonably limited deformation in lower layers. Lastly, the open time is the period in which fresh mortar is still extrudable [12]. Shorter open times may cause variability (reduction) in the filament width during the printing process for constant extrusion rates. Thus, changes in the filament widths may influence the porosity levels in bonding regions. When there is not enough adhesion between printed filaments or layers, these bonding regions are called cold joints, which have a detrimental influence on the mechanical and durability properties of printed structures [13].
Printable mortars generally follow the Bingham materials model [6,10]. Thus, the relation between yield stress and viscosity is
τ = τ 0 + μ γ
where
τ —shear stress
τ 0 —yield stress
μ —viscosity
γ —shear rate
The thixotropic behaviour is critical in 3DPC since the material regains stiffness while the viscosity increases when agitation stops. Thus, it involves a shear stress recovery from the dynamic yield stress to the static yield stress [14]. The stress required to initiate the flow of a material is called the static yield stress. This corresponds to a state where the microstructure remains undisturbed (material at rest). In contrast, the stress necessary to maintain or terminate the flow of the material is referred to as the dynamic yield stress [5,14,15]
Both dynamic yield stress and plastic viscosity play a key role in assessing the pumpability of concrete and mortar mixtures [5]. The static yield stress and structural build-up (also known as structuration) are fundamental properties for evaluating the buildability. The buildability of a printable mix is significantly influenced by its initial static yield stress, while the extent of structuration plays a key role in determining the rate at which construction can proceed [5]. It is important to note that higher static yield stress values lead to stiffer materials when at rest, demanding additional energy to start the flow. Thus, an optimal balance between a high static yield stress and a low dynamic yield stress is crucial for applications in 3DCP [3]. In other words, a low dynamic yield stress promotes the pumpability and extrudability of printable mixtures (lower pumping pressures), while high static yield stress and high thixotropic properties enhance buildability by improving the retention of filament shape during the printing process [5,14].
Several methods can be used to measure the rheological properties of cementitious materials, classified into the following categories: free flow tests, confined flow tests, rotational rheometers, and vibration tests. There is no consensus on how to measure the rheological properties of printable mortars since different test methods give varying results [6]. The effects of the methodology on the results and the reasons for variability remain unexplained. Fresh properties are governed by the rheological properties of the mix. Extrudability is significantly influenced by the printer specifications, for example, the size of the nozzle and its geometry, extrusion rate, and type of extruder [6].
Two RILEM technical committees are focused on the fresh properties of cementitious materials for 3DCP: “303-PFC Performance requirements and testing of fresh printable cement-based materials” and “317-ACP Active Control of Properties of Fresh and Hardening Cementitious Materials”. Committee 303-PFC aims to establish requirements for the fresh properties of printable materials based on the printer and construction needs. It also seeks to develop measurement protocols for industrial quality control and create evaluation standards to ensure material homogeneity and printing reliability. On the other hand, the work of the 317-ACP committee is based on the active control of the properties of cementitious materials. Active control of concrete properties is an emerging subfield in concrete technology, first introduced in 2018. It investigates the application of external signals to actively modify concrete properties, beyond the initial mixing and during the casting stages. The key area of interest is the active rheology control via magneto-responsive particles and responsive functional polymers. However, material stability, signal efficacy, and practical feasibility are some of the challenges that need to be addressed [16].
The measurement of the rheological properties needs to be based on continuous rheology control systems [5,8]. Research suggests that rheology should be measured after pumping because the fresh properties of concrete change due to pumping. The use of a concrete pump decreases the viscosity and increases the yield stress. This is caused by the high pressure and shear rate from the pumping process [17]. The 3D printable mixes exhibit a rapid evolution of the yield stress, from a pumpable to a buildable material. This can be achieved either with admixtures or by modifying the material rheology at the print head through alternative methods: vibration, magnetic field, ultrasonic waves, and microwave heating. Modifying the rheology of the mixes at the print head is an effective solution without compromising the material pumpability [18,19].
The European Research Council’s “SmartCast” project, led by Prof. Geert De Schutter from 2016 to 2022, developed an innovative concrete casting concept. Although the main objective was to improve traditional formwork-based production methods, the results also hold great potential for advancing 3D concrete printing techniques. The research output was two novel concepts that facilitate real-time adjustments of the flowability of cementitious materials during processing and post-mixing, including pumping. These concepts were named active rheology control and active stiffening control. These techniques may be combined with 3DCP [18]. The active rheology control at the print head may be applied through vibration, magnetic field, ultrasonic waves, microwave heating, and chemicals [19]. A magnetic field can be used to modify the rheology of 3D printing cementitious mixes [18]. This technology is still in its early stages, with limited information about its reliability.

1.1. Background

Several techniques are commonly found in the literature to assess the fresh properties of cement-based mortars, each providing unique insights into their rheological behaviour. This work focuses on three techniques, shear vane, rotational rheometer, and ultrasonic pulse velocity tests, presenting previous research using these methods for the characterisation of cementitious materials in the fresh state.

1.1.1. Shear Vane Test

The shear vane test measures the maximum shear strength the mortar can resist before failure (static yield stress) [20]. Le et al. (2012) [12] used the shear vane test to evaluate the extrudability of cementitious materials for 3DCP. The authors assessed the open time of the mixtures and correlated it to shear strength measurements. The study found that mixtures were printable when their shear strengths were in the range of 0.3–0.9 kPa (300–900 Pa), using a 9 mm diameter nozzle. More recently, Rahul et al. (2019) [21] also utilised the shear vane test to determine the effects of viscosity modifying agents (VMAs), nano clay, and silica fume on the shear strength of the mixes with time. The authors used a rectangular nozzle of 30 × 20 mm. When the mixes exhibited a shear strength within the range of 1.5–2.5 kPa (1500–2500 Pa), the extrudability and buildability of these mixes were guaranteed. Extrudability is not only influenced by the rheological properties of the cementitious materials but also by the printing equipment (e.g., nozzle size and geometry, type of extruder). Therefore, the variability in the shear strength ranges may also be due to different factors related to the printing equipment [6].

1.1.2. Rotational Rheometer Test

Rheometers have been extensively investigated in the literature, and the main challenges and limitations highlighted are the high cost of the equipment, inadequate torque capacity, and inaccurate yield stress measurements in high thixotropic materials. Researchers compared rheological properties without explaining the variability in the data obtained and how the methodology influenced those results [6]. The significant variability in the results found in the literature indicates the need for the development of standardised testing protocols, ensuring consistency and uniformity across studies [22].
Banfill et al. (2000) [22] reported substantial variability in yield stress and viscosity even when using the same materials and mixing process. However, a good correlation between different rheometers was derived (95% confidence level). The authors highlighted the need for correlation functions between the rheological properties and the different rheometers. Also, they highlighted the importance of developing a standardized material for rheometer calibration. This could contribute to better characterisation of the workability of concrete. Alghamdi et al. (2019) [23] performed extrudability tests with mixtures based on cement, slag, limestone, and fly ash, using 4 mm and 6 mm diameter nozzles. The mixes that passed the extrudability tests exhibited yield stresses in the range of 150–750 Pa. The yield stress was influenced by the water content as it increased for lower water ratios. Also, the yield stress and viscosity were influenced by the particle size of the materials. A greater fraction of finer particles (range of 0.5–5 μm) increased the yield stress and plastic viscosity of mixes. Arunothayan et al. (2023) [24] investigated the feasibility of ultra-high-performance concrete for 3DPC. The influence of steel fibres and nano clay on the rheological properties was analysed. The authors conducted extrudability and buildability tests with a 30 mm diameter nozzle at different printing speeds (30, 50, and 80 mm/s). The mixes that achieved satisfactory extrudability and buildability results exhibited initial yield stresses in the range of 242–467 Pa. They concluded that the buildability was negatively influenced by the increase in the printing speed, showing plastic collapse failures in all cases except in mixes with 0.2% nano clay. Zhang et al. (2019) [25] assessed the rheological properties of five mixes based on cement, silica fume, and nano clay, where the variable of the study was the sand/cement ratio (0.6, 0.8, 1.0, 1.2, and 1.5). The authors used a 20 mm diameter nozzle. They concluded that yield stress within the range of 178.5–359.8 Pa and a viscosity range of 3.8–4.5 Pa∙s were needed to guarantee the printability of the mix. The yield stress and viscosity of the mixes increased (by 129.8% and 16.4%, respectively) while increasing the sand/cement ratios (from a ratio of 0.6 to 1.2).

1.1.3. Ultrasonic Pulse Velocity Test

The ultrasonic pulse velocity (UPV) test has been extensively used for the characterisation of cementitious materials at early ages and during their hardening process [26,27,28]. The UPV test represents a practical and feasible approach for monitoring the consistency of concrete production and for assessing the quality of newly developed binders [29]. In the material’s fresh state, the ultrasonic pulse velocity increases rapidly during setting and more gradually afterwards. Hydrates nucleate and grow on the surface of clinker particles and in the porous matrix. Isolated clusters are formed initially and merge into larger interconnected structures with time. This process transforms the material from a suspension into a porous elastic solid. The microstructural evolution occurring during cement hydration can be effectively analysed and characterized through the propagation of ultrasonic waves [26,30]. Previous studies investigated the setting and early hydration of cementitious materials using the UPV test [26,28,29,30]. Three different stages are observed when performing the UPV test in cement pastes at early ages (see Figure 1). Initially (stage I), the pulse velocity exhibits a constant value. Then, stage II is characterised by a rapid pulse velocity growth. Lastly, stage III shows a slowly increasing pulse velocity [31].
Reinhardt et al. (2004) [29] studied the influence of the water/cement ratio (0.5, 0.55, and 0.6) on the pulse velocity in mortars in a fresh state. The authors concluded that no major differences were found in UPV results when varying the water content. Although the mixes showed the same initial pulse velocity (~600 m/s), different final pulse velocity measurements were obtained for each water/cement ratio. The pulse velocity decreased when the water content increased, producing pulse velocities of 4200 m/s, 4000 m/s, and 3400 m/s after 24 h of hydration for water/cement ratios of 0.5, 0.55, and 0.6, respectively. However, other authors reported a significant influence of the water/cement ratio and state of hydration on the pulse velocity results, especially during the first 24 h. For example, Ye et al. (2001) [26] also investigated the effects of the water/cement ratio (0.4, 0.45, and 0.55) on the pulse velocity. The authors concluded that there was an increase of 8~10% in the pulse velocity during the first 24 h of hydration when the water/cement ratio decreased from 0.55 to 0.45. Boumiz et al. (1996) [30] assessed the influence of 0.34, 0.4, and 0.5 water/cement ratios on the UPV test results. The authors reported a pulse velocity of ~1500 m/s for all the mixes right after mixing, remaining constant during the dormant period. However, there is no consensus in this regard since the value of 1500 m/s for pulse velocity has been highlighted as the value in the final setting of the mix in some cases [29].
Real-time quality control procedures must be established to measure the rheological properties (yield stress, plastic viscosity, and thixotropy) of the mixes while printing. These need to identify changes in the properties of the fresh mixture that may impact the hardened properties of 3D-printed structures. They should be user friendly on-site and provide robust real-time data to adjust the required parameters (e.g., extrusion rates, dosage of admixtures) during printing, ensuring the quality of the printed elements. The goal of this study is to evaluate the feasibility of the UPV test as real-time quality monitoring in 3DCP. A critical aspect is whether UPV can differentiate between the proposed mix designs for a constant water/binder ratio. Also, UPV could provide the lower and upper limits of pulse velocities for optimal extrudability. This is essential to verify the applicability of this technique and guide further research. To validate this approach, the UPV test was used in printable mortars at their fresh state. Placing the mortars in a device designed for this study, pulse velocities were obtained every 5 min, concurring with the extrusion of filaments, while their quality was visually controlled to determine their acceptability. At the same time, the flow table, pocket hand vane, and viscometer were used to evaluate the evolution of the fresh properties (workability, extrudability, and open time) and correlate the results to the UPV and the observations during the printing process. Also, the isothermal calorimetry test was conducted to explore the relationship between hydration kinetics and the data gathered from the previously mentioned tests. By ensuring the reliability of UPV test results, this study aims to establish a method that can monitor the fresh properties of printable mixes. Ultimately, a prototype system that integrates UPV testing into the 3D printing set-up is proposed, enabling real-time control. This is an advantage over other methods, such as the pocket hand vane and viscometer, which cannot be directly installed on the printer.
This study is structured as follows: Section 1 discusses the challenges of 3DCP, the importance of the rheological properties of printable mixes, and the need for quality control and real-time monitoring. Section 2 outlines the experimental program, materials, and methodology. The results and discussion are presented in Section 3. Section 4 provides the conclusions drawn from the research, while Section 5 suggests future research directions.

2. Materials and Methods

2.1. Raw Materials

General-purpose cement was obtained from Golden Bay, New Zealand (NZ). High-purity calcined kaolinite (MK) was sourced by BASF Group, Auckland, New Zealand. The MK was not grounded and was used as supplied. Zeolite powder was provided by Commodities NZ Ltd. (Foxton, New Zealand) The zeolite was micronised (based on particle impact) at low feeding rates and maximum grinding pressures (70–75 psi/483–510 kPa) to obtain an extremely fine powder. Kakahu clay, a locally available clay, was supplied by Canterbury Clay Bricks, Christchurch, NZ. The clay was calcined at a temperature of 800 °C for 2 h in a rotary muffle furnace. Mussel shells were obtained from Pearsons Limited, Christchurch, NZ. The shells were washed and oven-dried (105 ± 5 °C) for 24 h. Due to the low grinding rate of the microniser, Kakahu clay and mussel shells were ground using a rod mill. Lime flour (calcium carbonate—CaCO3), was supplied by Ravensdown. Fine aggregate consisted of graded standard concrete river sand supplied by Christchurch Ready Mix Concrete, Christchurch, NZ. A commercial polycarboxylate-based superplasticiser from SIKA was added to regulate the water demand and improve the mix extrudability. Additionally, polyvinyl alcohol (PVA) fibres were included in the mix. The chemical composition of the raw materials, obtained from X-ray fluorescence (XRF) analysis, is presented in Table 1.

2.2. Mix Designs

Table 2 presents the mix designs tested in this study, which include two types of binders. The first one was based on a limestone calcined clay cement (LC3) system. The second type incorporated zeolite in binary and ternary blends, replacing up to 50% of the cement.

2.3. Mix Preparation

The mixing process was carried out in a benchtop planetary mixer following this procedure: (1) dry materials, including PVA fibres, were mixed at a low speed (107 rpm) for 2 min, (2) the superplasticiser was combined with the water, (3) the water was added into the mixer while the agitator was mixing, and (4) mixing continued for about 5 min at the same speed.

2.4. Experiments

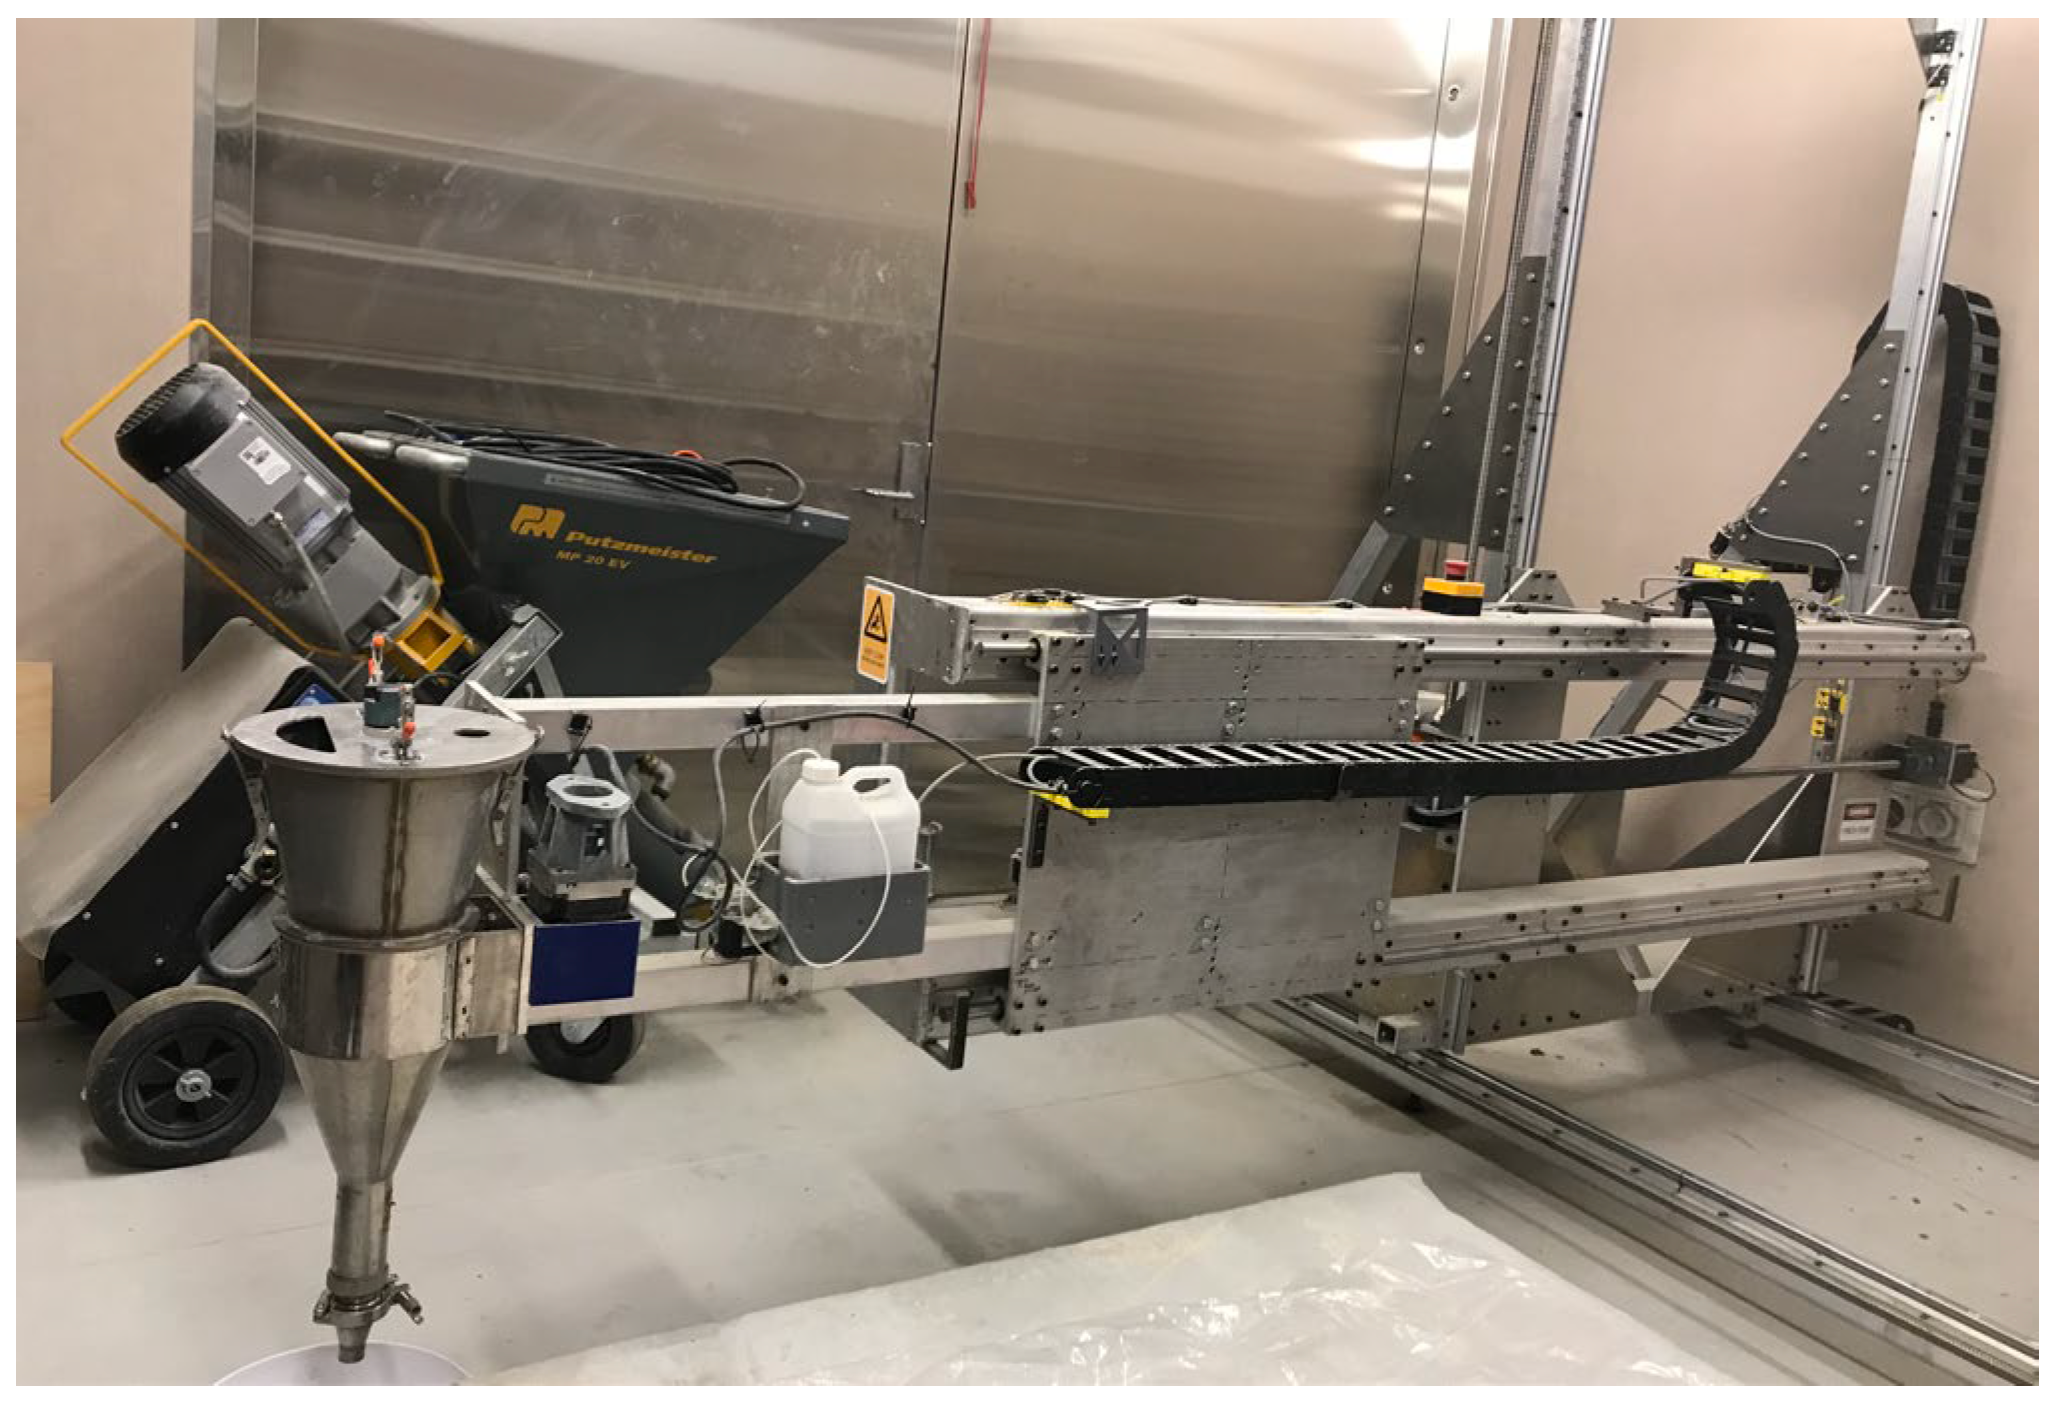
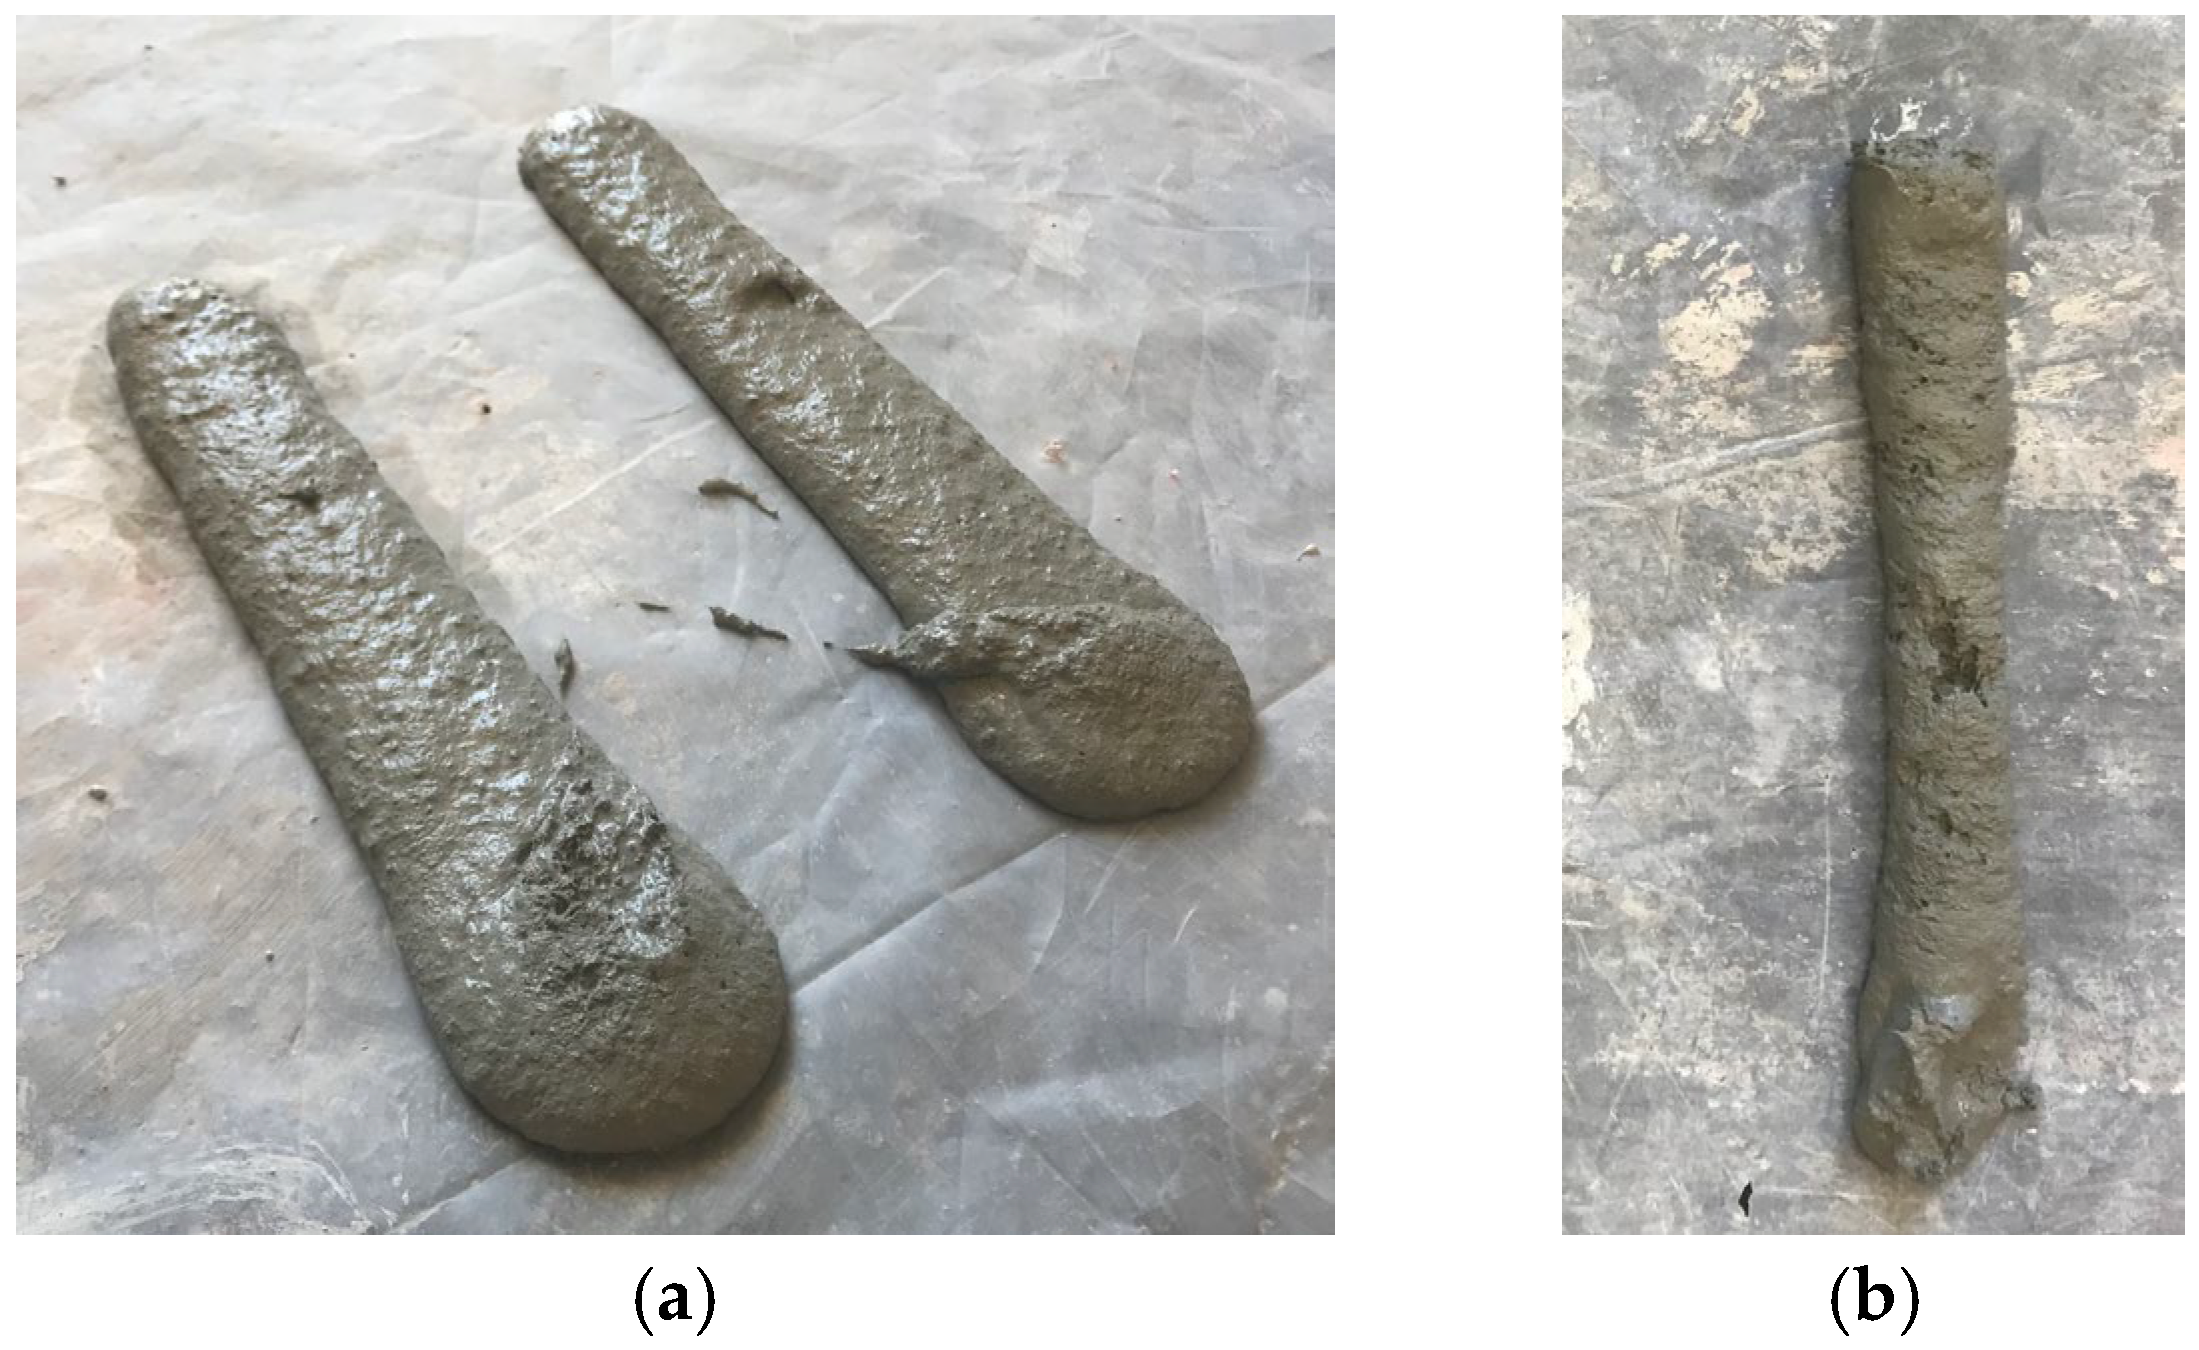
2.4.1. Extrudability Test

A custom-built gantry system 3D concrete printer (equipped with a hopper head and a screw system to extrude the material through a nozzle) was used (Figure 2). Filaments measuring 200 mm in length were extruded through a 20 mm inner-diameter circular nozzle every 5 min. Printing was carried out in the laboratory (20 ± 1 °C and RH of 60%) at a speed of approximately 35 mm/s. The nozzle offset (distance between the printing table and the nozzle) was 13 mm. The extrusion rate remained constant for all mixes. All mix designs had similar initial shear strengths at the start of printing since the superplasticiser content was adjusted for every mix. This approach was adopted to minimize variables in the process, ensuring the most accurate results for comparison. Thus, any printing defects detected during the extrudability tests were caused by the mix setting. Once the filaments presented printing defects (e.g., filament tearing, filament width reduction) (see Figure 3), the test was concluded, and the open time was recorded.

2.4.2. Pocket Hand Vane Test

The pocket hand vane is commonly used on-site to measure the shear strength of soils [32]. This could be used on-site for 3DCP since the test is cost-effective, user-friendly, and quick to perform. The pocket hand vane operates by measuring the shear strength (static yield stress) of mortars through rotational resistance. Thus, the maximum torque required to induce shear failure corresponds to the shear strength of the mortar. The measurements can be conducted during the material processing to ensure its printability, exhibiting good repeatability of the shear strength values. The period in which the mix remains printable (open time) can be derived from the shear strength measurements. Once the shear strength exceeds the predefined thresholds established for optimal printability, the open time can be defined [6,20,33].
The thresholds for optimal printability can be established through visual observations during the printing process, based on the printing defects detected on extruded filaments. When the shear strength values were in the range of 1.0–1.8 kPa (1000–1800 Pa), mortars were deemed acceptable for printing with the printer at the University of Canterbury [34,35]. A shear strength larger than 1.0 kPa (1000 Pa) prevents the mix from flowing freely through the nozzle when no extrusion is applied. On the other hand, a mix with shear strength values larger than 1.8 kPa (1800 Pa) exhibits filament printing defects. All the mortar mixes were designed to have an initial (when the extrudability test started) shear strength of ~1.4 kPa (1400 Pa). The shear strength of each mix was measured (as an average of two readings) every 5 min (see Figure 4). These measurements concurred with the extrudability test.
The main drawback of this technique is that the shear vane only obtains the static yield strength, while other methods (e.g., viscometers) can provide a wider range of data (e.g., plastic viscosity, dynamic yield stress, thixotropy). The pocket hand vane does not provide comprehensive insights into variations in other rheological properties (e.g., viscosity and thixotropy), which are essential for the characterization of the mix for 3DCP [6]. Also, the shear strength values may be influenced by different factors such as the calibration of the equipment, vane dimensions, and the user’s insertion technique [36].

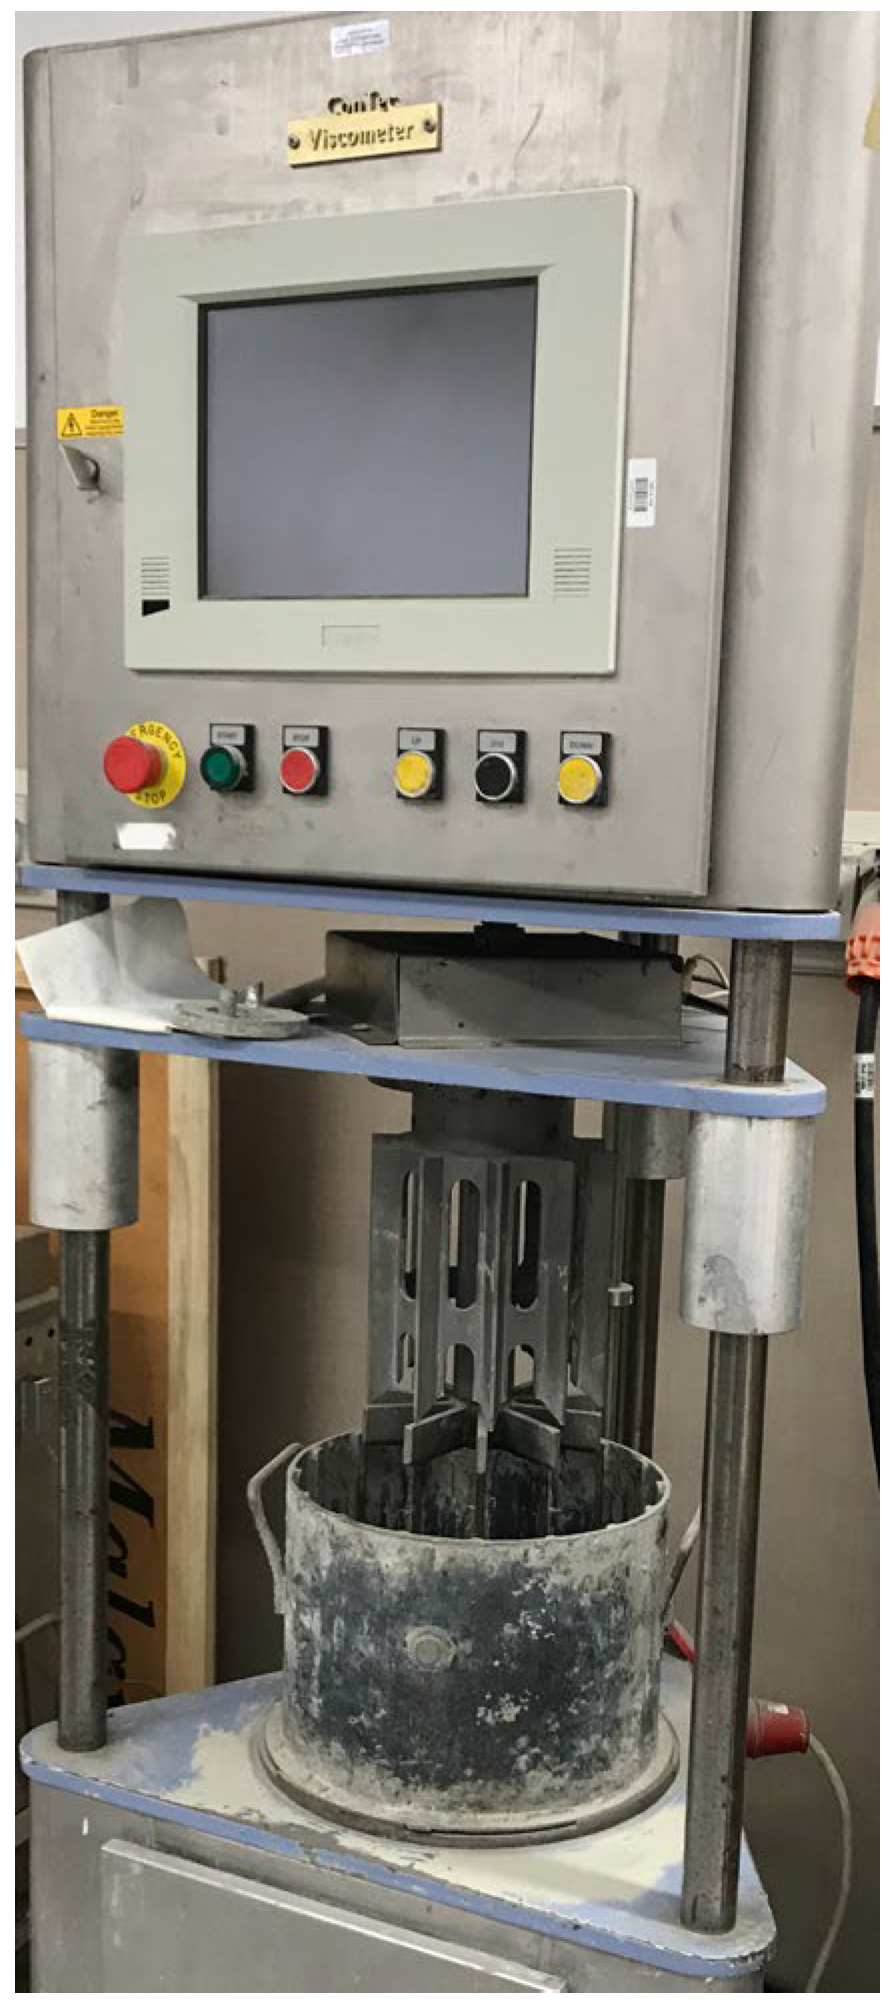
2.4.3. Rotational Viscometer Test

ConTec-Viscometer 5 was used to obtain the plastic viscosity and dynamic yield stress of the mortar mixes with time. This coaxial cylinder viscometer measures the rheological properties of cement paste, mortar, and concrete with a slump of 120 mm or higher (Figure 5). The test is conducted by placing the mortar mix in a cylindrical container while an inner vane rotates at controlled speeds. The resistance (torque) exerted by the mix on the vane is measured, determining the plastic viscosity and dynamic yield stress. This test was performed every 5 min during the time that the filaments were being printed. The machine was operated by the control software FreshWin v.4.01. The viscometer requires a minimum of ~15 litres of material to test the rheological properties. The mixes were characterised by plotting the relation between the dynamic yield value ( τ 0 ) and the plastic viscosity (μ). The distribution of the plotted points provided the qualitative behaviour that the printable mixes would follow in terms of rheological trends (wet, stiff, and viscous) [37].
The use of the viscometer and this data offers a significant advantage over the pocket shear vane measurements, as it provides a more comprehensive analysis of the rheological properties of the mixes. Plotting dynamic yield stress against plastic viscosity enables a deeper understanding of both the individual contributions of mix constituents and potential variations between different batches, facilitating more precise quality control and mix optimization. For example, the influence of the SCMs utilised in this study may be distinctly visualized in the corresponding graphical representation, while the water-to-binder ratio remains constant.

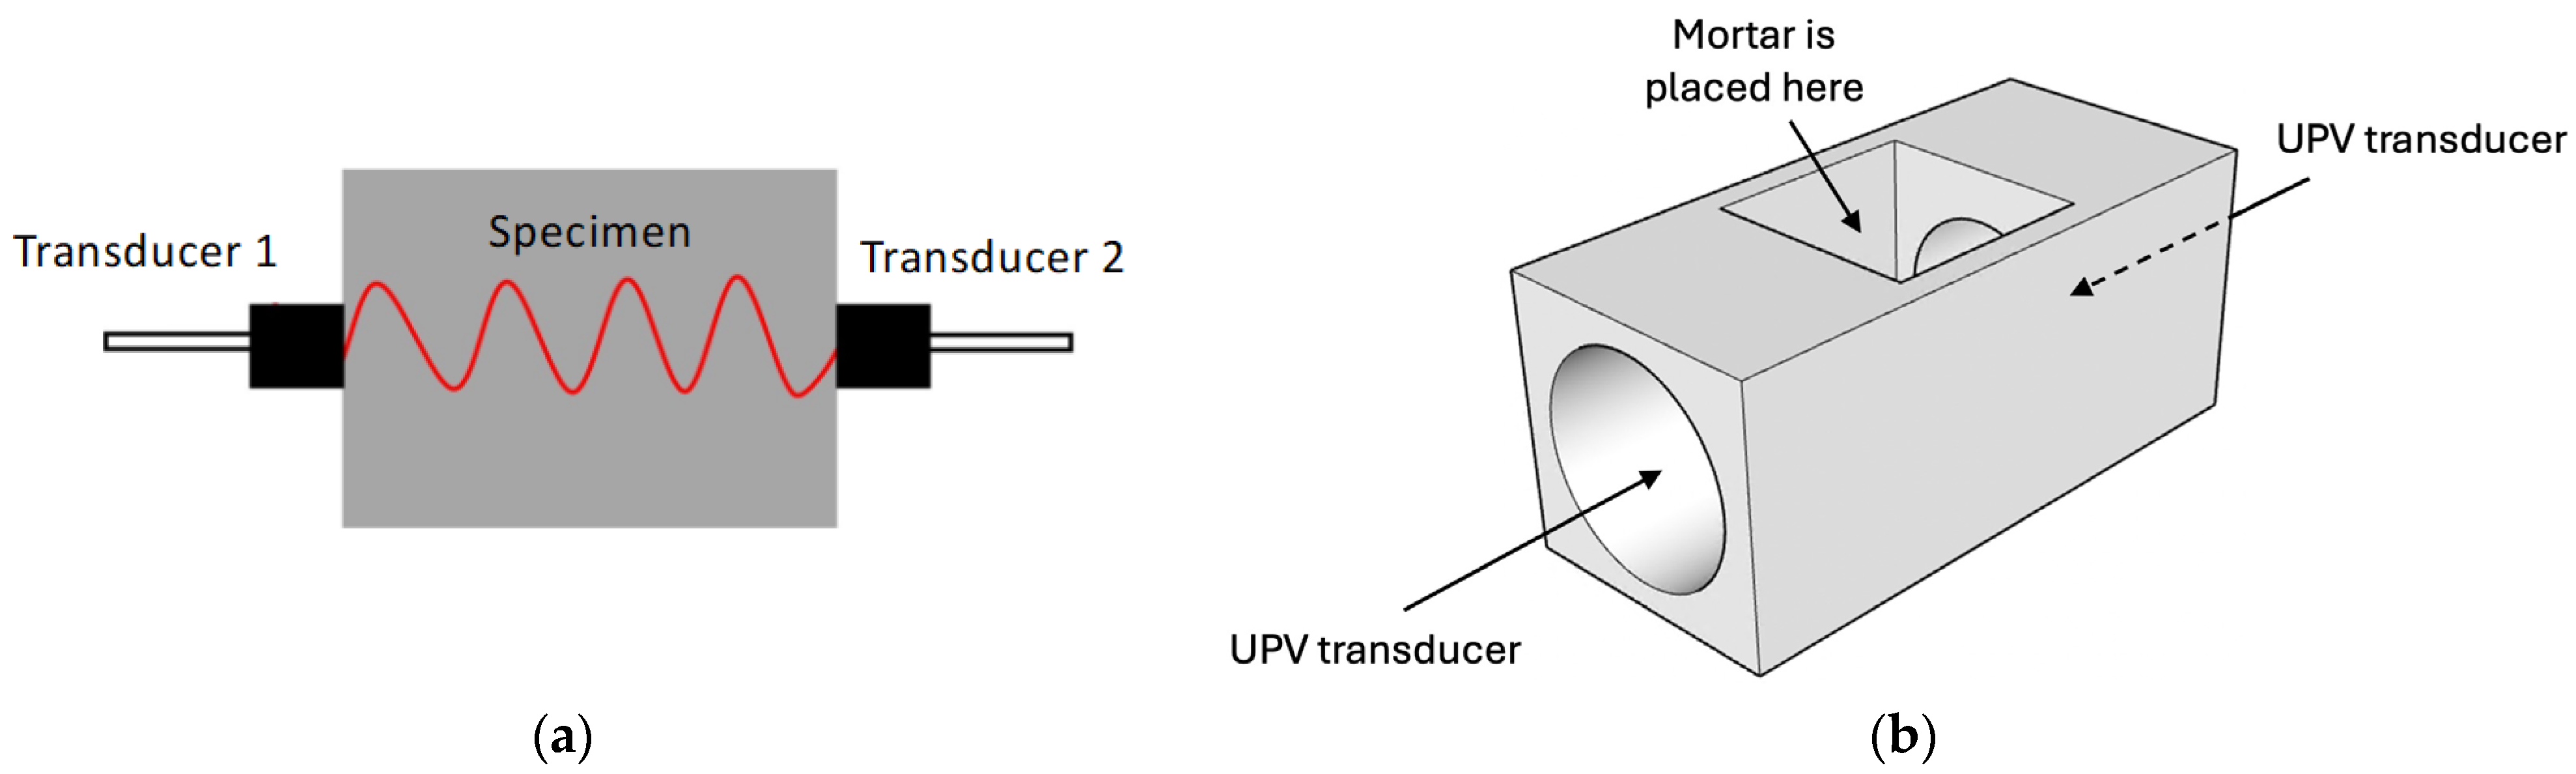
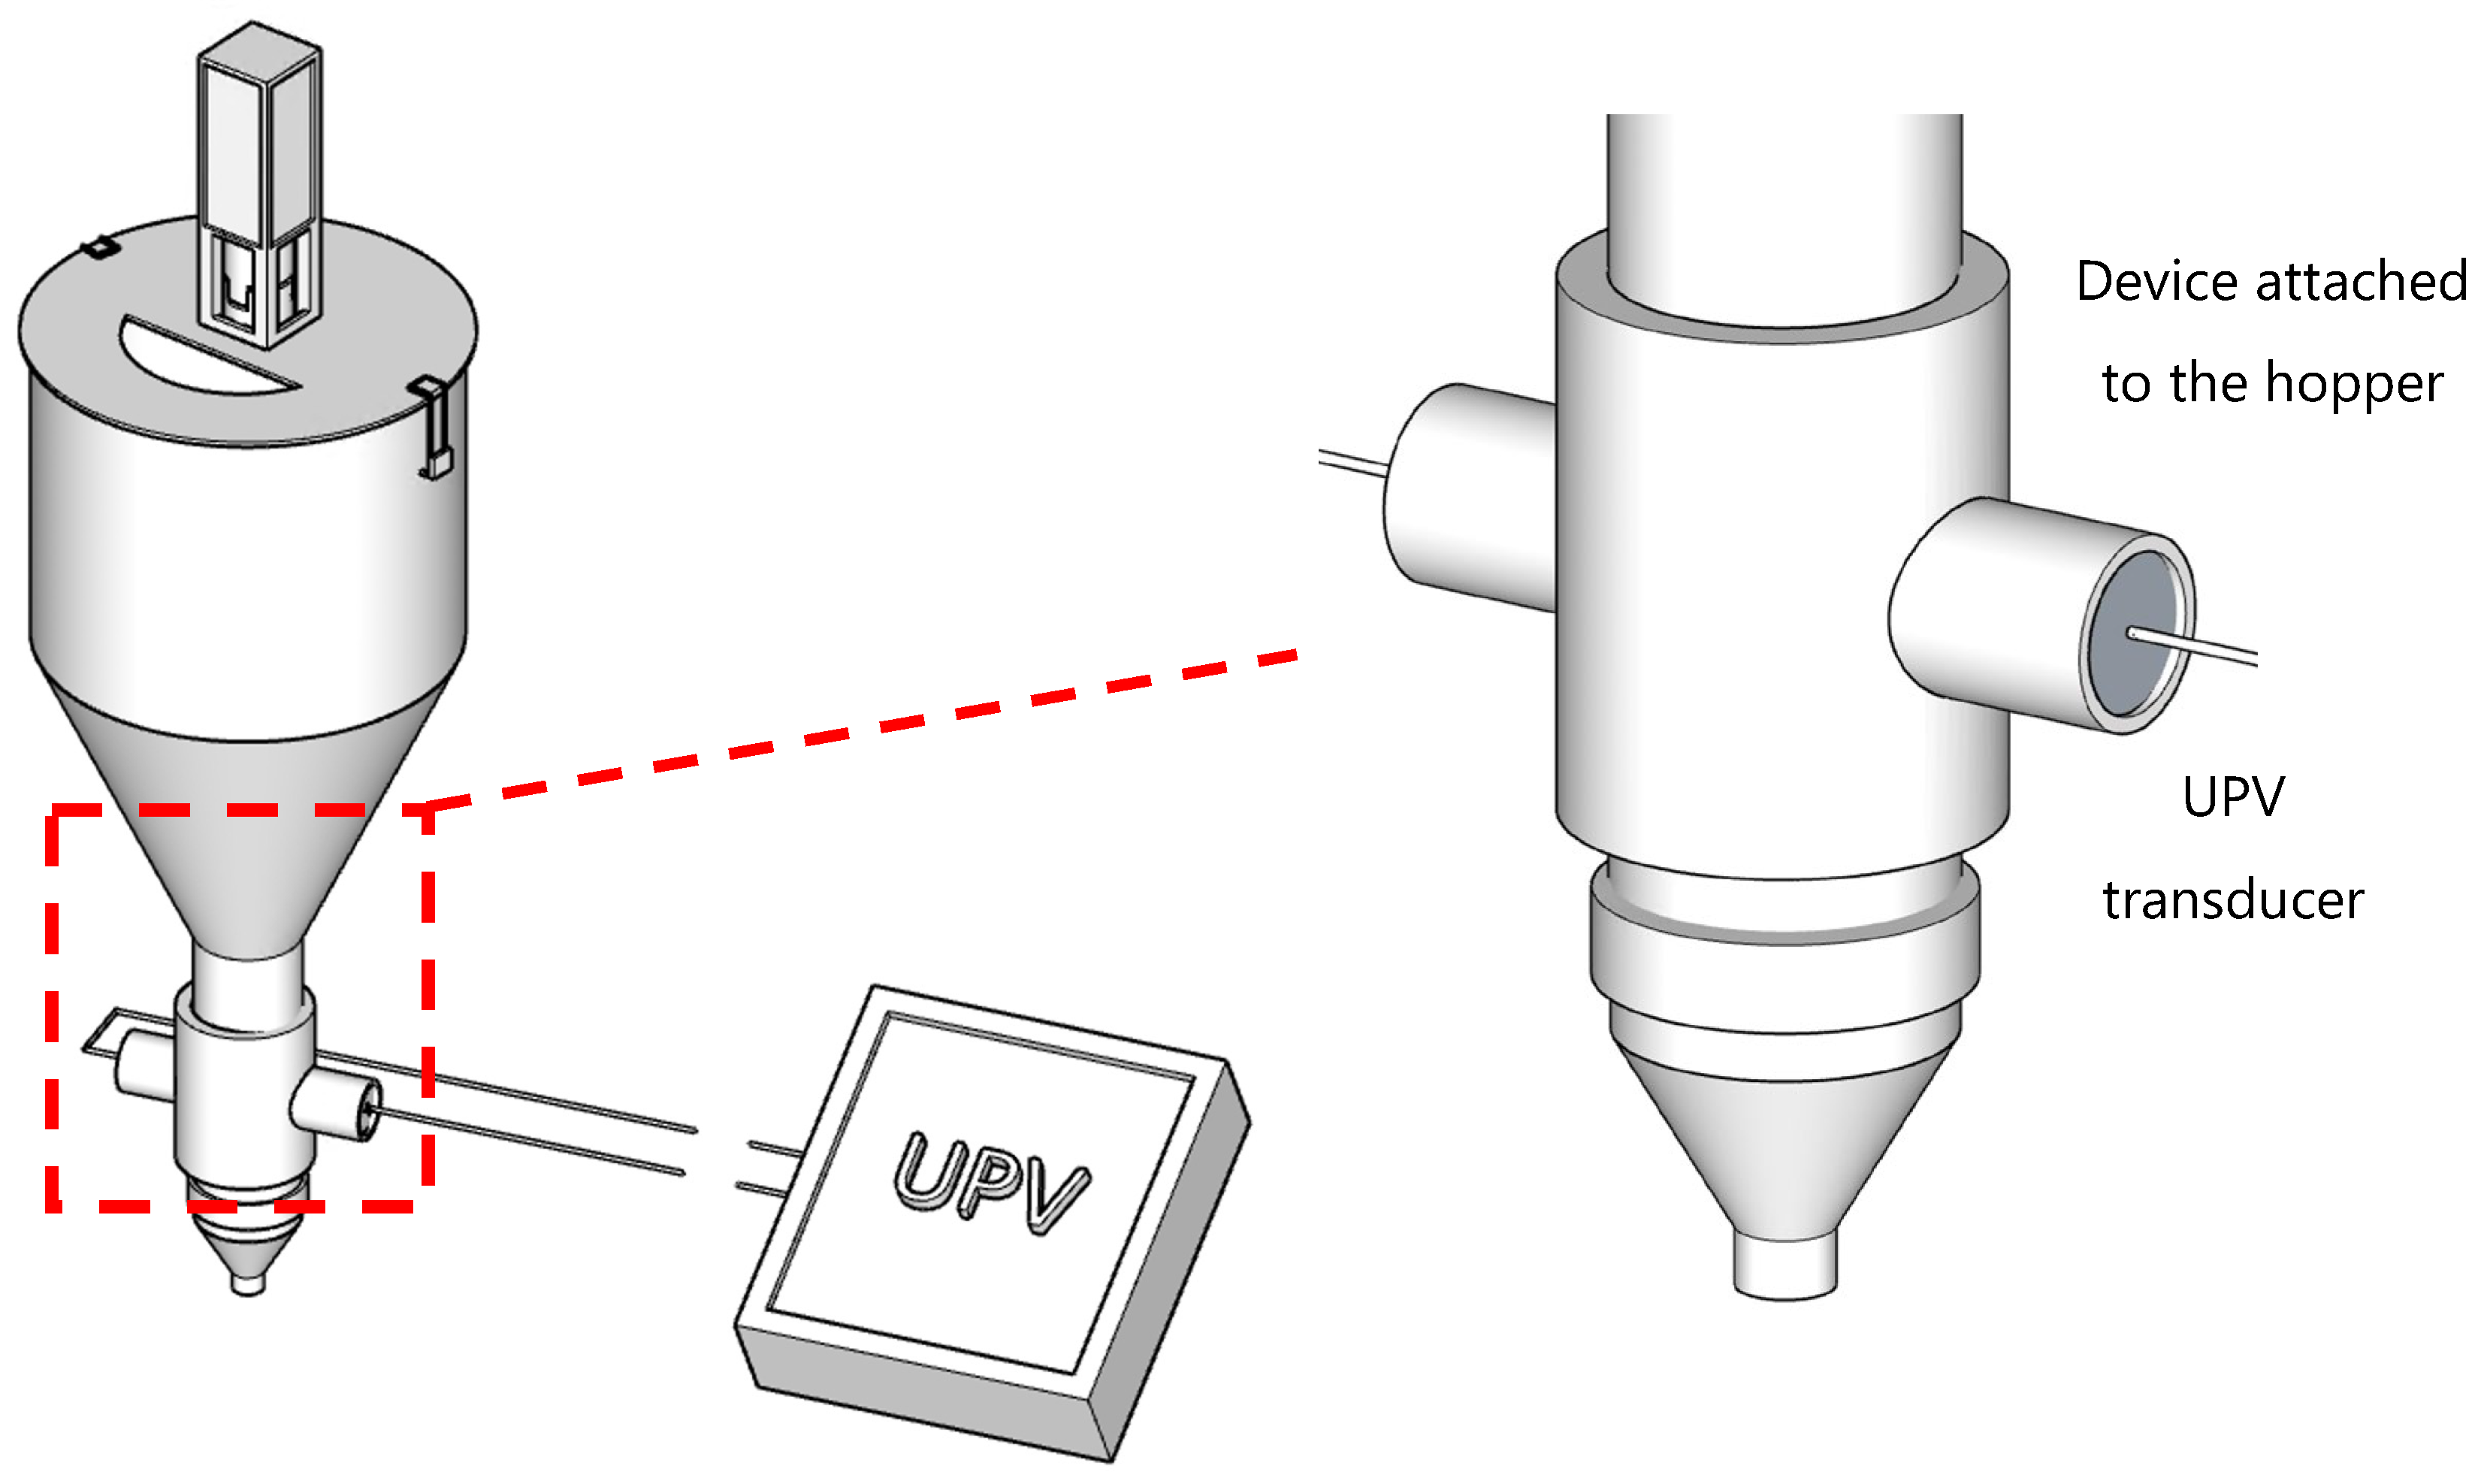
2.4.4. Ultrasonic Pulse Velocity Test

The Proceq Pundit PL-200 Tester was used to conduct the UPV test. The UPV test operates by sending an ultrasonic pulse from a transmitter to a receiver. Then, the velocity of the pulse is obtained based on the distance between the transducers and the time needed for this pulse to travel through the specimen under study [27]. The setup for the UPV test varies between different studies in the literature. However, the most common configuration is based on a direct transmission methodology [27], as shown in Figure 6a. The transducers are aligned but located on opposite sides of the sample. Figure 6b shows the device that was designed to perform the UPV test following a direct transmission set-up. The mortar mixes were placed in the central hole, which had a cubical geometric shape (50 × 50 × 50 mm). On the lateral sides of the device were the two apertures to place the transducers of the UPV tester. Cling film was used to prevent the water from being partially removed from the mix once it was placed in the device to conduct the UPV test.
Frequencies within the range of 20–500 Hz are normally used to perform the UPV test. However, to study the properties of cementitious materials at early ages, the use of low-frequency transducers is recommended [27]. In this study, transducers of 54 Hz were utilised. For this frequency, the authors recommended a distance of 150 mm between the transducers to avoid the near-field effect at low pulse velocities during the early hardening process. Nonetheless, there is no consensus in the literature about the optimal distance between the transducers. Aspects such as the frequency and type of transducers and the composition of the mixture influence the chosen distance between the transducers [27]. In this study, a distance of 50 mm between transducers was selected to be consistent with the measurements of the cubes (50 × 50 × 50 mm3) commonly used for compressive strength tests.
The UPV measurements were systematically conducted at 5-min intervals, concurring with the extrusion of the filaments. However, these measurements were not performed directly on the printed filaments. Instead, they were executed using the device shown in Figure 6b. The mixture was placed inside the device with a small scoop, without vibrating it. Thus, potential correlations between variations in pulse velocity values and the observable alterations in the print quality of the extruded filaments could be defined.

2.4.5. Particle Size Distribution

The particle size distribution (PSD) test was performed by using the Malvern Mastersizer 3000. The helium-neon laser (wavelength of 632.8 nm) and a blue solid-state light source enable measurements in the range of 0.01–3500 μm. The Mastersizer application v3.88 software is run to perform the particle size analysis.

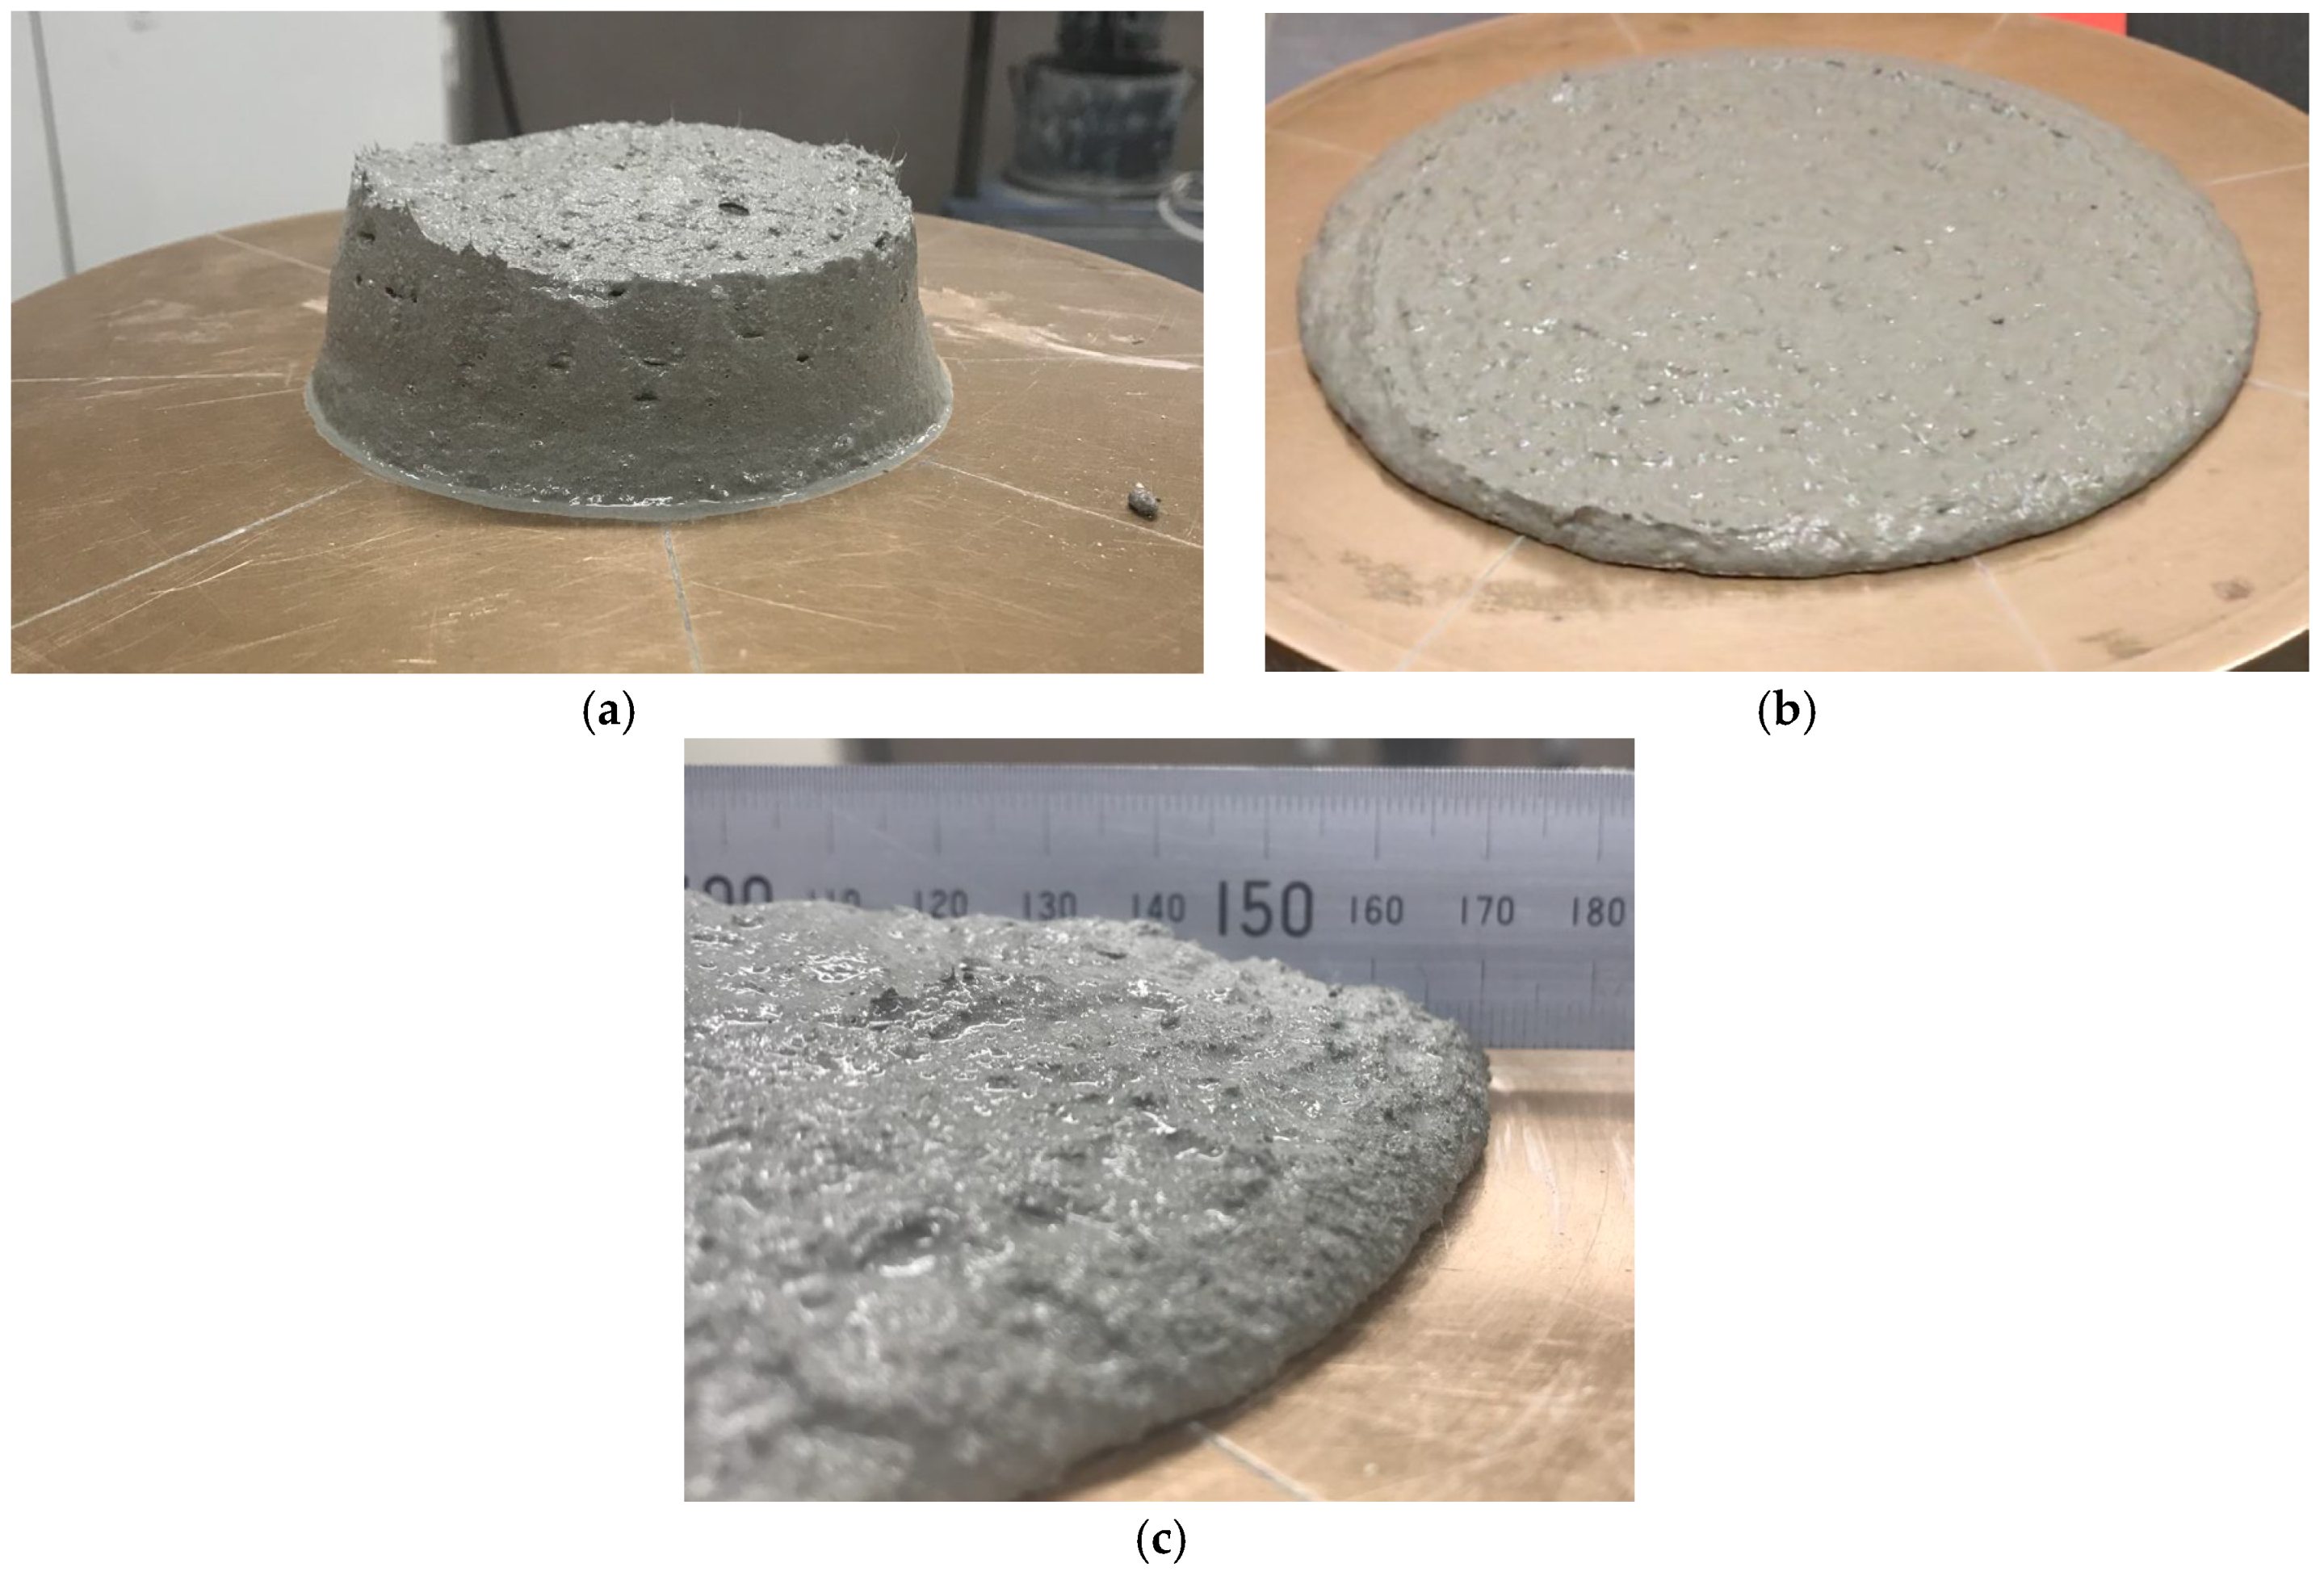
2.4.6. Flow Table Test

The flow table test was conducted according to ASTM C230/230M [38] and ASTM C1437 [39] to assess the workability of the mix designs. The mortars were placed inside the cone, tamped 20 times with the tamper, and the cone was lifted (see Figure 7a). Then, the flow table was dropped 25 times within 15 s (see Figure 7b), and the resulting spread diameter was measured (see Figure 7c). The diameter change (compared to the initial value) was expressed as the flow value of the mix (relative deformation). This method has been used in previous studies to assess the printability of 3DCP mixes [40,41,42]. Tay et al. (2019) [41] concluded that the flow table test could be used to determine the printability of mortar mixes, establishing a flow range of 150–190 mm to guarantee an optimal extrudability and buildability. On the other hand, Cho et al. (2020) [40] investigated the relationship between the results obtained from rheometer and flow table tests and concluded that no strong and direct correlation was found. Also, there is no analytical relationship to link the spread value from the flow table test with rheological parameters [6].

2.4.7. Isothermal Calorimetry and Reactivity Test

The heat evolution of the mix designs and the reactivity of the SCMs were examined through an isothermal heat flow calorimeter (I-Cal Ultra isothermal calorimeter, Calmetrix, Arlington, MA, USA). The heat evolution of the mixes was obtained at a measurement temperature of 20 °C. The samples were mixed for 60 s. The samples were placed into the calorimeter within 2 min after mixing to capture the heat release associated with the initial mix reaction (see Figure 8). The heat flow data was recorded for 7 days every 60 s. The calorimetry test measures the heat released during the hydration of cementitious materials. The test provides valuable insights into the kinetics of hydration, including the timing and intensity of exothermic peaks that correspond to different stages of the chemical reactions. Figure 8 shows the typical stages in the isothermal calorimetry graph, illustrating the heat evolution over time. Calorimetry is essential for understanding the early-age behaviour of cementitious materials (e.g., setting time, strength development, influence of SCMs), helping to optimize mix designs for specific applications.
The chemical reactivity of the SCMs (MK, Kakahu clay, and zeolite) was assessed according to ASTM C1897-20 [43]. In this case, the heat evolution related to the reactivity of the SCMs was obtained at a measurement temperature of 40 °C. The samples were also placed into the calorimeter within ~2 min of the start of mixing (<10 min required [43]).

3. Results and Discussion

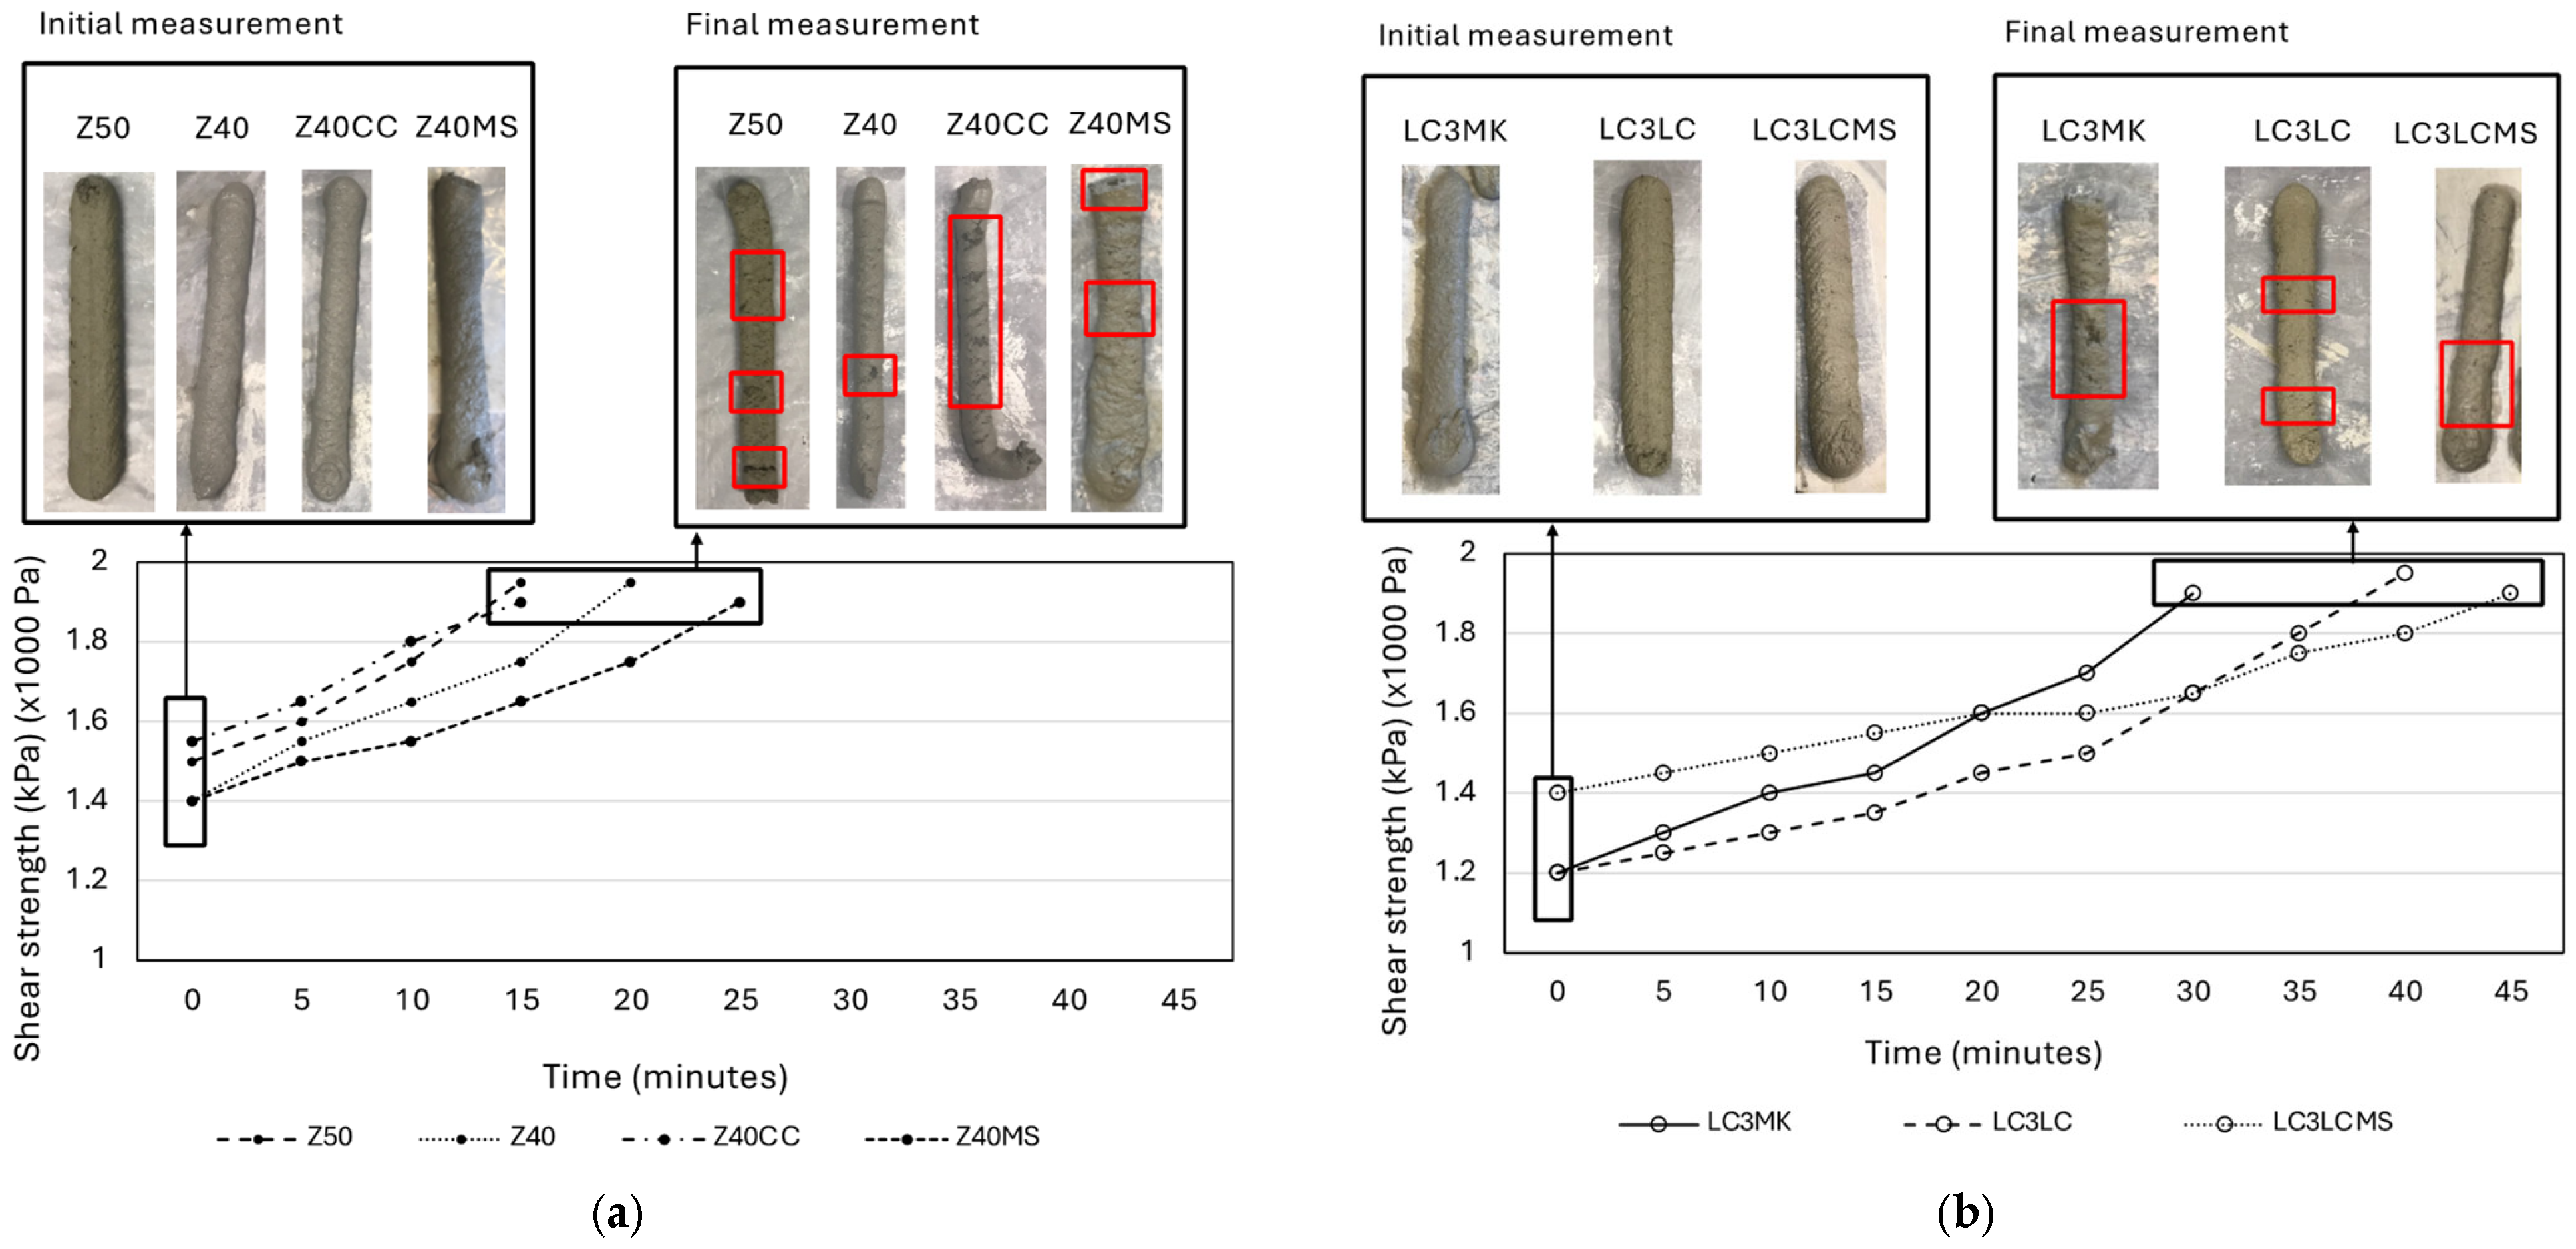
3.1. Shear Vane Test

Figure 9 shows the evolution of the shear strength of the mixes over time, with each point representing a measurement taken every 5 min. When the mixture is at rest, an intermolecular network is created and binding forces are enhanced due to the cement hydration bonding, increasing the viscosity of the material. This is called flocculation. External energy (through static yield stress) is required to break down this bonding network, decreasing the viscosity of the material and causing its flow (de-flocculation) [15,44]. Thus, the shear strength was expected to increase with time since no agitation was applied to the mixes during the test. The initial measurement represents the first printed filament after mixing, and the final measurement exhibits the end of the test, where the printed filaments showed printing defects (e.g., filament tearing). The open times of the different mixes, as determined from the extrudability tests, are presented in Table 3.
Mixes Z50 and Z40CC exhibited the steepest slopes in the graph, exhibiting the shortest open times compared to the rest of the mixes. Both mixes showed a similar shear strength evolution. In general, the filaments printed with the zeolite-based mixes exhibited the lowest deformation, retaining their shape once they were extruded. However, Z40MS exhibited a spread of less than 2 mm on average in the first filament. Lertwattanaruk et al. (2012) [45] reported reduced water demand and improved workability when using ground seashells in the mix design. On the other hand, Souidi et al. (2024) [46] observed high water absorption due to ground mussel shells and poor workability. Although Z40MS exhibited a filament spread, results are aligned with the observations reported by Souidi et al. (2024) [46]. The shear strength of Z50 and Z40CC rapidly increased, reaching values of ~1.8 kPa (1800 Pa) (upper limit for printability) after 10 min. Z40MS exhibited the longest open time among the zeolite-based mixtures (~25 min). This is consistent with the literature, since the use of seashell powder delays the hydration, extending the setting time of the mix [45,47].
LC3-based mixes showed longer printability windows than the zeolite series of mixes. An LC3-based system with MK was used as a reference mix since MK has been extensively investigated in the literature, exhibiting consistent material properties, and containing minimal impurities [48]. LC3MK showed the shortest open time among the LC3-based binders. When the Kakahu clay was used instead of MK, the open time increased (by ~10 min). This is consistent with the literature since the setting time reduces as the purity of the clay (kaolinite content) increases [9,49]. LC3LCMS exhibited a significant flowability, showing the greatest spread after extrusion, increasing the filament width by about 2 mm on average. However, LC3LCMS exhibited inferior workability (initial shear strength of ~1.4 kPa, 1400 Pa) than LC3MK and LC3LC (~1.2. kPa, 1200 Pa) for the same water and superplasticiser ratios. As occurred with Z40MS, LC3LCMS also exhibited the longest open time. This indicates that the use of mussel shell powder, as the source of CaCO3, delayed the hydration [45,47]. This may be due to the greater P2O5 content in mussel shell powder than in commercial CaCO3 (see Table 1). This extra content of P2O5 forms phosphoric acid, which reduces the pH of the mix and declines the hydration rate at early ages [50].
Precise control over the printability window of mortars is crucial to ensuring an optimal printing process. In 3DCP, achieving the necessary balance between pumpability, extrudability, and buildability requires careful control of rheological properties. Mortars must exhibit low yield stress and minimal structural build-up during pumping while rapidly developing stiffness after extrusion to maintain structural integrity [51]. The ability to regulate cement hydration chemically is essential to advancing digital construction techniques. Admixtures, particularly “set-on-demand” solutions, play a vital role in enabling real-time control over these printing requirements [3]. Therefore, future research is required to assess the effect of these admixtures on the printability window as well as on the tests performed in the following subsections.

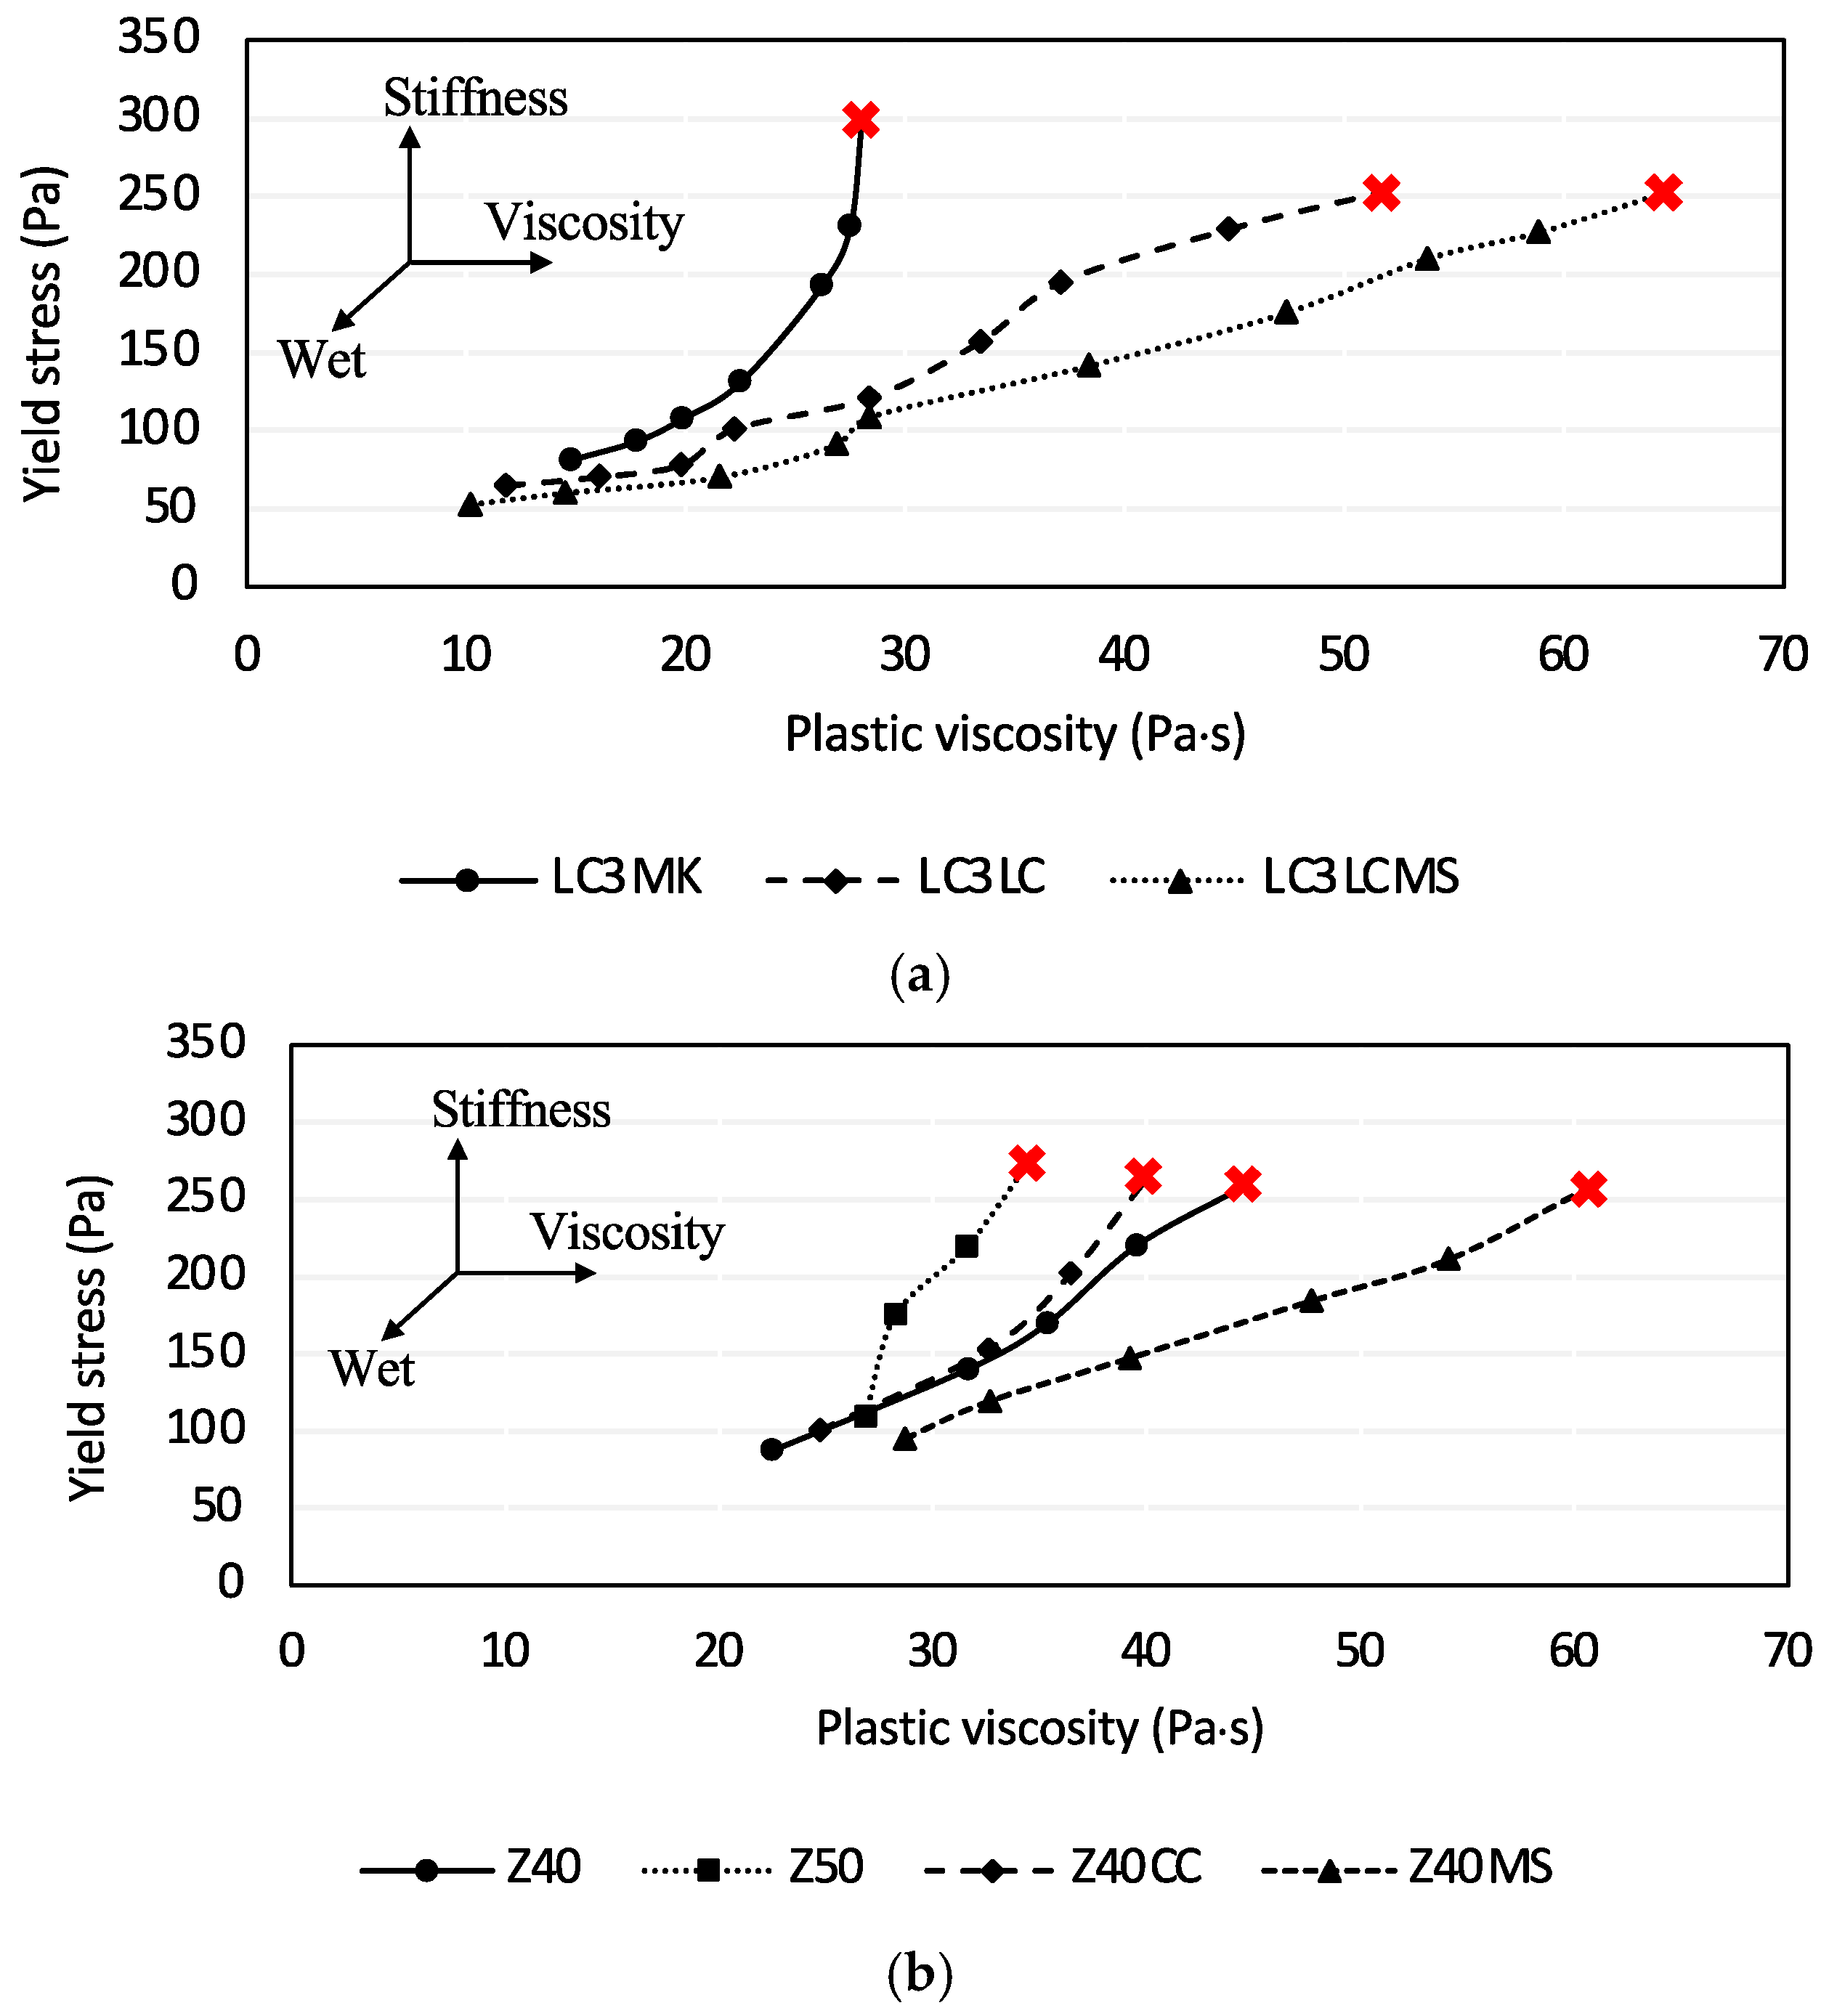
3.2. Rotational Rheometer

Figure 10a,b present the viscometer test results for LC3- and zeolite-based mixes, with yield stress vs. viscosity graphs plotted for each. LC3-based mixes exhibited an initial wetter consistency than the zeolite-based mixes. This is consistent with the observations during the printing process since LC3-based mixes showed a higher filament spread than zeolite-based mixes (for a similar initial shear strength). This could be attributed to the absorption properties of zeolites. Their internal structure consists of a network of tetrahedral crystals with very small pores and channels. As a result, zeolites can have a high specific surface area range (34–45 m2/g), promoting water absorption [52].
The LC3MK mix exhibited a significant stiffness increase with time. On the other hand, LC3LC and LC3LCMS showed gradual slopes, where LC3LCMS displayed the least steep pattern. This trend was due to the kaolinite content in clays and the influence of the mussel shell powder when used as the main source of CaCO3. The degree of the clinker reaction is influenced by the kaolinite content in calcined clays [48]. Thus, the slope of the graphs became steeper when the purity of the clay increased. Mussel shell powder has a higher content of P2O5 than commercial CaCO3 (see Table 1). Greater P2O5 content enhances the phosphoric acid formation, which reduces the pH of the mixture and decreases the hydration rate at early ages [50]. Also, the mineralogy or the PSD of the mussel shell powder and the impurities present in its composition might affect the hydration [53]. The zeolite-based mixes, Z50, Z40, and Z40CC, exhibited steeper patterns than Z40MS. Z50 exhibited the most pronounced trend, rapidly exceeding the upper threshold of printability. As occurred in LC3-based mixes, the mussel shell powder delayed the hydration, influencing the rheological properties of the mix. Thus, early stiffness is reduced, and the setting time of the mix is extended, which is corroborated by the open time (see Table 3). LC3LCMS and Z40MS exhibited longer printability windows than their counterparts with commercial CaCO3, retaining their workability for longer durations.
The printability window is limited to a yield stress value of ~250 Pa, regardless of the viscosity values of the mixes. This indicates that the extrudability of the mixes can be governed by the yield stress, considered the most important parameter for mix design [21]. This increment is caused by the thixotropy (temporary changes in the matrix, i.e., structural breakdown or dispersion) and the hydration (permanent changes, i.e., re-coagulation) [21,54]. Nonetheless, the pumpability of the mixes may be compromised not only for high-yield stress values but also when the viscosity increases [21].
There is a dynamic yield stress limit (~250 Pa) that governs the printability of the mixes in the present study. However, the printability of the mixes was guaranteed for a wide plastic viscosity range, which varied from 12 to 65 Pa∙s. On the other hand, Zhang et al., 2019 [25], reported a considerably narrow plastic viscosity range in which mixes were printable (3.8–4.5 Pa∙s). The authors used a 20 mm diameter nozzle, which coincides with the nozzle diameter used in this research. However, these variabilities in the results may be due to differences related to the printing equipment and experimental methodologies [6,21]. The lack of consistency in the reported results establishes a significant challenge to data comparison. Variations in experimental methodologies, measurement techniques, and material properties may contribute to discrepancies that interfere with the interpretation of previous research findings.
Viscometers provide valuable data on the rheological properties of the mixes that may be neglected when using the pocket shear vane. The shear vane determines whether a mix is printable based on shear strength. However, viscometers provide other rheological measurements (e.g., plastic viscosity), detecting variations in flow resistance that not only influence the extrudability and print quality but also the pumpability of the mixes.

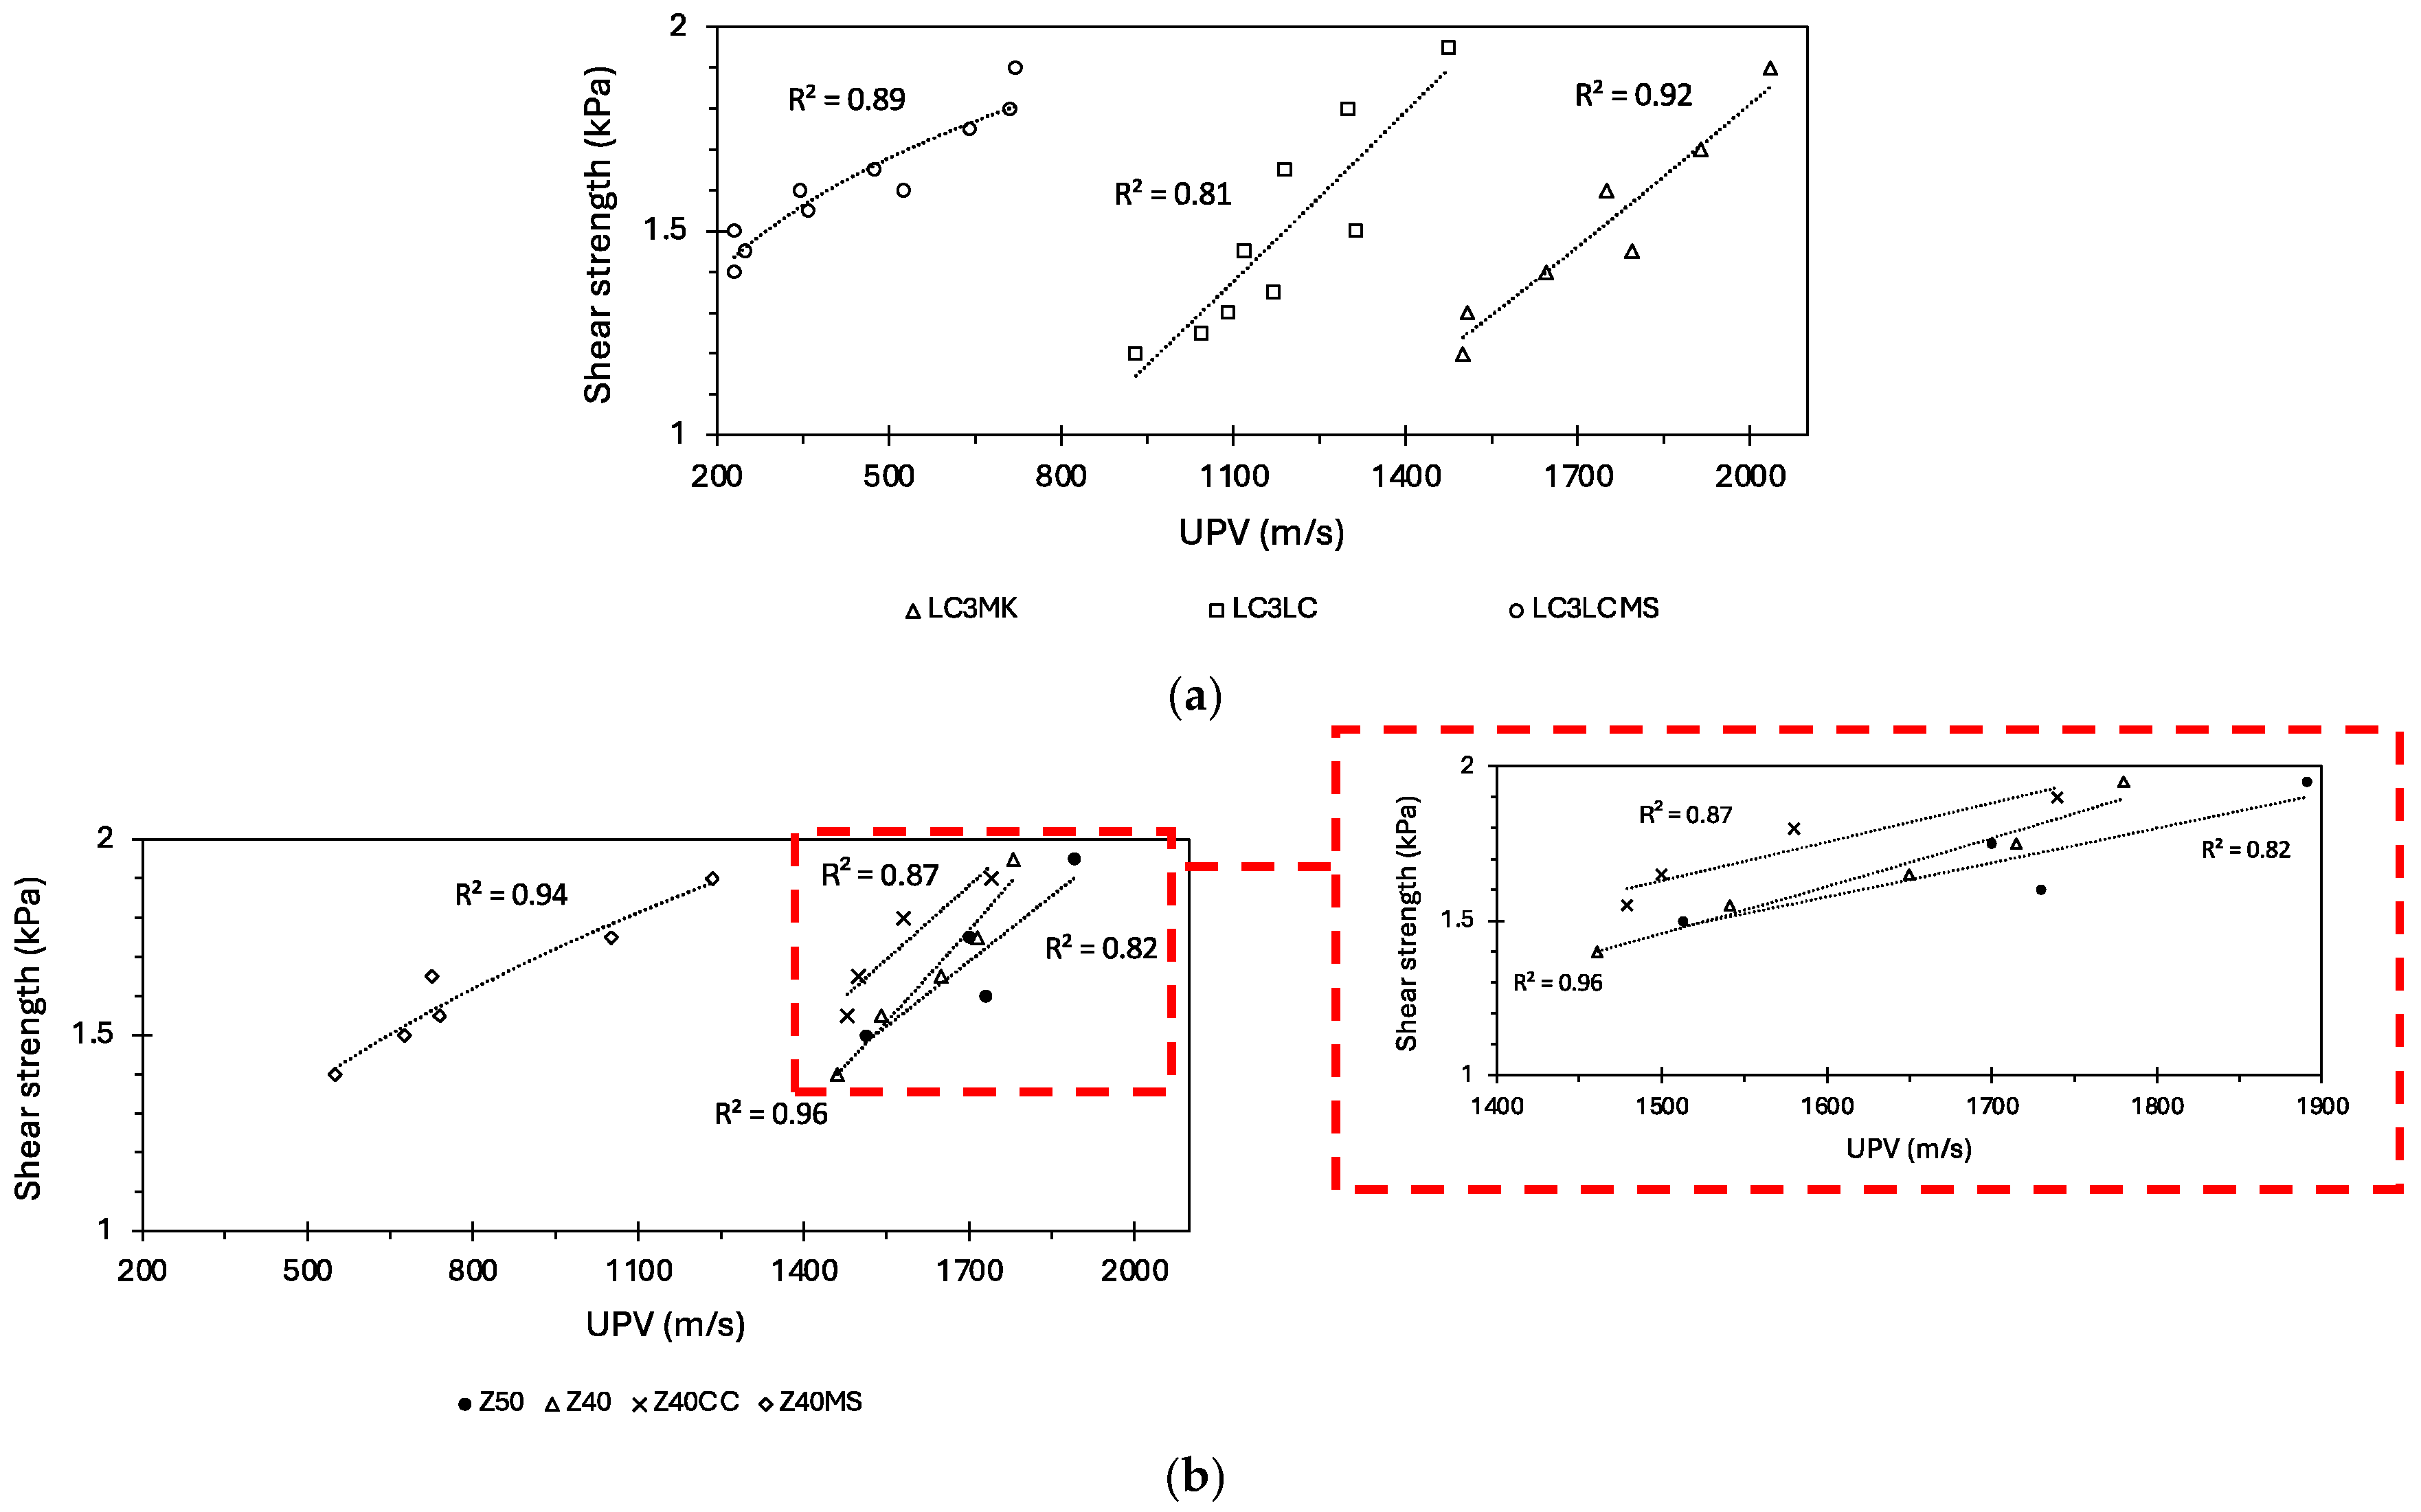
3.3. Ultrasonic Pulse Velocity

Figure 11 shows the evolution of the UPV for the different mixes. The results exhibited substantial variations in the wave propagation velocities based on the composition of the mixes. The incorporation of mussel shell powder, as the source of calcium carbonate in LC3LCMS and Z40MS, led to lower pulse velocity values than in the rest of the mixes. This can be attributed to the mineralogy and impurities present in the mussel shell powder, delaying the hydration of the mix [53]. Thus, the delay in the precipitation of hydrates could limit the transmission of the ultrasonic waves [26,30]. Also, the pulse velocity results were influenced by the mix design and the synergy between the different SCMs. This indicates the need for a better understanding of the synergy between different SCMs and how they individually influence the hydration process, as well as the microstructural changes involved during hydration. The pulse velocity obtained for zeolite-based mixes (Z40, Z50, and Z40CC) and LC3MK exhibited comparable results during the whole extrudability test, starting with a pulse velocity of ~1500 m/s in both groups of mixes. Furthermore, a decrease in pulse velocity was observed when the Kakahu clay was utilised. This could be related to the lower reactivity of the Kakahu clay than for high-purity clays such as MK.
As occurred with other techniques used in the present research (pocket hand vane and viscometer), there is a lack of consistency about the UPV results in the literature. Thus, it is crucial to develop standardised testing protocols to promote consistency within experimental investigations. Also, it is necessary to develop a standard mix to obtain reliable data, not only to calibrate the UPV equipment but also for comparison purposes. The pulse velocities exhibited significant increases when comparing initial and final measurements. The magnitude of these increases varied across the tested mixes, ranging from 261 to 685 m/s. This variation suggests that the evolution of pulse velocity is mix-dependent, reflecting differences in rheological and hydration kinetics. Figure 12a,b show the correlation between shear strength and the pulse velocities for different mix designs. The plotted data indicate moderate to strong correlations, with R2 ranging from 0.81 to 0.96 across different printable mixtures. These results suggest a consistent relationship between pulse velocity and shear strength. However, further investigation is required to determine whether UPV could be used to estimate the printability window of printable mixes.

3.4. Flow Table Test Correlations

Figure 13 shows the correlation (R2 = 0.05) between the relative deformation (flow table test) with the initial shear strength (pocket hand vane). Relative deformation refers to the spread of the mortar after the flow table test compared to its original dimensions (100 mm at the cone base). The lack of correlation indicates that the flow table test is not suitable to characterise printable mixes based on their rheology, which is consistent with the literature [6,55]. LC3LCMS and Z40MS exhibited the highest relative deformations for the same shear strength values (first filament print). This suggests that other factors (e.g., hydration kinetics, structuration rate, and thixotropic behaviour) may play a key role in determining the flowability of printable mixtures.
Figure 14a,b show the relationship between relative deformation and the results obtained with the viscometer: yield stress (Pa) and plastic viscosity (Pa·s). Both graphs exhibited correlations of R2 = 0.69 and R2 = 0.40, respectively. While these correlations were stronger (compared to Figure 13), they did not exhibit a robust relationship, highlighting the necessity of using an alternative approach to characterise the mixes. For example, Z40 and LC3LC exhibited similar deformation levels despite differing yield stress and viscosity values. The same was observed for the mixes LC3MK and Z40CC. Also, Z40MS showed greater relative deformation (65%) than expected since it had the highest plastic viscosity of all the mixes and a relatively high value of yield stress.
On the other hand, the relationship between pulse velocity and relative deformation exhibited a moderate correlation (R2 = 0.81) (see Figure 15). The results indicate that higher pulse velocities correspond with lower relative deformation. However, the scattered data points still suggest variability in the response of printable mixes, and the influence of the mix composition is underscored.
The correlations derived from this study highlighted the complexity of deformation mechanisms in 3D printable mortar-based materials. The mix designs strongly influenced these correlations, highlighting the need for comprehensive rheological and mechanical testing to ensure quality in 3DCP. Thus, the flow table test is not a suitable method to obtain reliable data related to the rheological properties of printable materials, but it can be used for comparison purposes between 3DCP mixes [41,42].

3.5. Reactivity of the SCMs

Figure 16 shows the results of the reactivity test for three SCMs, MK, zeolite, and Kakahu clay. Table 4 shows the PSD of the materials used in the present study. MK exhibited the highest heat release, with a pronounced exothermic peak occurring within the first few hours (after ~6 h) of hydration, followed by a gradual decline. This indicates a rapid and intense pozzolanic reaction due to its high amorphous silica and alumina content and fine PSD (D90: 14.8 μm), promoting early hydration and ettringite formation [56,57]. In contrast, zeolite showed the lowest heat evolution for a similar PSD (D90: 15.6 μm), with more gradual and sustained hydration activity. Kakahu clay also exhibited a sustained hydration activity; however, the reactivity was unexpectedly greater than the activity of zeolite for a significantly greater PSD (D90: 164.3 μm).
The results obtained from the reactivity test exhibited no correlation with the results from UPV, pocket hand vane, and viscometer. Kakahu clay showed greater reactivity than the zeolite (see Figure 16); however, zeolite-based mixes (Z40, Z50, and Z40CC) obtained pulse velocities similar to LC3MK (~1500 m/s) (see Figure 11). Also, the zeolite-based mixes exhibited shorter open times with a faster evolution of the shear strengths with time than the mixes with Kakahu clay. This lack of correlation indicates that the reactivity test cannot be used as a reliable technique to explain the variations in the rheological properties of the mixes, limiting its applicability to estimate the initial UPV values and the extrudability of the mixes.

3.6. Initial Mixing Reaction—The Rate of Heat Generation

Tricalcium aluminate (C3A) is a key constituent of Portland cement. Despite its relatively low content (~2–10%), C3A plays a fundamental role in the workability of cement pastes. It energetically reacts with water, forming ettringite in the presence of sulphates. Ettringite is the primary product that forms within the first hour of hydration, with significant precipitation during the first 20 min. The formation of ettringite influences the particle packing, inter-particle distance, and particle network structure. Thus, the rheological properties of the mixes are influenced by the formation of ettringite [58].
Figure 17 shows the heat released during the initial mixing reaction (see Figure 8) for the different mix designs. This initial mixing reaction corresponds to the pre-induction phase of hydration. During this phase, there is a rapid evolution of the heat that occurs before the dormant period and lasts for approximately 15–20 min [59]. LC3MK exhibited the highest heat release, indicating a greater intensity in the initial reaction than the rest of the mixes. LC3LCMS and Z40MS showed the lowest heat values, suggesting reduced early-stage reactivity. Thus, the delayed hydration in mixes with mussel shell powder may be aligned with the low pulse velocity results obtained for these mixes (see Figure 11). Z40, Z50, and Z40CC showed comparable heat results, where the reaction of Z40CC was influenced by the CaCO3, reducing the heat released by ~10%, compared to Z50 with the same level of cement substitution. The differences in the heat rate during hydration were attributed to ettringite precipitation, which influenced early hydration kinetics [58].
Figure 18 shows the correlation (R2 = 0.93) between the initial heat release and the pulse velocity for the different mixes. The trend suggests that an increase in the pulse velocity range (of the different mix designs) was associated with a higher initial rate of heat release (e.g., due to ettringite formation). This may be attributed to enhanced early binder hydration and structural densification. Roussel et al. (2012) [60] highlighted the importance of early hydration products, which could have macroscopic effects on rheological behaviour. Early hydration products precipitate on the surface of cement particles, bridging these grains and forming a rigid network [60]. For example, Jakob et al. (2019) [61] reported a high quantity of ettringite crystals covering the cement particles (after just 15 min of hydration). Therefore, pulse velocity values could be determined by this rigid network, even at early hydration, facilitating the propagation of ultrasonic waves. The strong correlation observed highlights the potential of UPV as an effective method to ensure real-time quality control in assessing the hydration behaviour of printable mixes.

3.7. Prototype for Measuring Active Mortar Flows in 3DCP

As explained in Section 2.4 Experiments, the tests to assess the rheological properties (pocket hand vane, viscometer, and UPV) were conducted simultaneously while performing the extrudability test. It is important to note that the material placed inside the 3D printer was not subjected to direct testing (apart from the extrusion test). As a result, there could be an inadequate correlation between the UPV test results (or those obtained from the pocket hand vane and viscometer) and the actual rheological behaviour of the material inside the hopper. Thus, the UPV would need to be performed on the mortar being extruded with an active flow of material. Figure 19 shows a proposed monitoring set-up integrated into the 3D printer hopper for real-time rheological assessment. The system includes a stainless-steel feature attached to the hopper, with two openings for the UPV transducers. The transducers are placed within the device, enabling them to perform ultrasonic measurements without disrupting the material flow. Also, this configuration allows the printer to operate normally while continuously assessing variations in the rheological properties of the printable mix. The non-invasive nature of this monitoring system ensures that measurements do not interfere with printing operations, thereby enhancing process reliability and print quality while providing valuable insights into material behaviour. Contrary to the pocket hand vane and the viscometer, the equipment for the UPV test could be easily installed on the hopper, and the material would be tested right before extrusion.
New correlations between pulse velocity and the initial heat reaction of printable materials should be established, considering the flow of the material during extrusion. These correlations could provide deeper insights into the material’s behaviour under specific processing conditions (e.g., extrusion rates, pumping pressures, the influence of admixtures), facilitating more accurate predictions and enhanced control over material performance in applications on-site. However, the lack of continuous flow or the presence of gaps within the material during the printing process might be a limitation for this approach, potentially affecting the reliability of these correlations.
The printable mix should be characterised to establish its optimal pulse velocity threshold. Then, continuous pulse velocity measurements would be performed during the printing process to detect variations in rheology, allowing for immediate adjustments and improved process reliability. Further research is recommended to assess the ettringite content at early hydration (e.g., within the first hour) and corroborate its influence on the initial heat and the UPV results.
In summary, to effectively use UPV as a real-time quality control method, the following key steps should be considered:
  • Material characterization and calibration:
    Preliminary tests to establish the relation between pulse velocity, rheological properties, and hydration kinetics of specific mix designs.
    Define an optimal pulse velocity value/range for the printable mixes under study.
  • Real-time monitoring:
    Continuous UPV measurements during the printing process to assess the mix behaviour.
    Detect potential deviations from the predefined pulse velocity value/range that may indicate rheological inconsistencies.
  • Process control and adjustment:
    Apply corrective actions (e.g., adjustments on the admixture dosage, printing parameters) to maintain printing quality.

4. Conclusions

This experimental study investigated the feasibility of the UPV test as a real-time quality control technique for 3DCP. The results from the UPV test were compared to those obtained by the rotational viscometer, pocket hand vane, flow table test, and isothermal calorimetry. Simultaneously, the extrudability test was conducted using the different mix designs while visually controlling the printing quality of the filaments to determine their acceptability. These tests were performed at 5 min intervals, except for the flow table test, which was performed only during the first filament print. The following conclusions could be drawn:
  • The incorporation of mussel shell powder into the LC3 system (LC3LCMS) resulted in a reduction in workability (greater initial shear strength) compared to their counterparts with MK and CaCO3 (LC3MK and LC3LC). However, the relative deformation as well as the spread of the printed filament were greater in LC3LCMS.
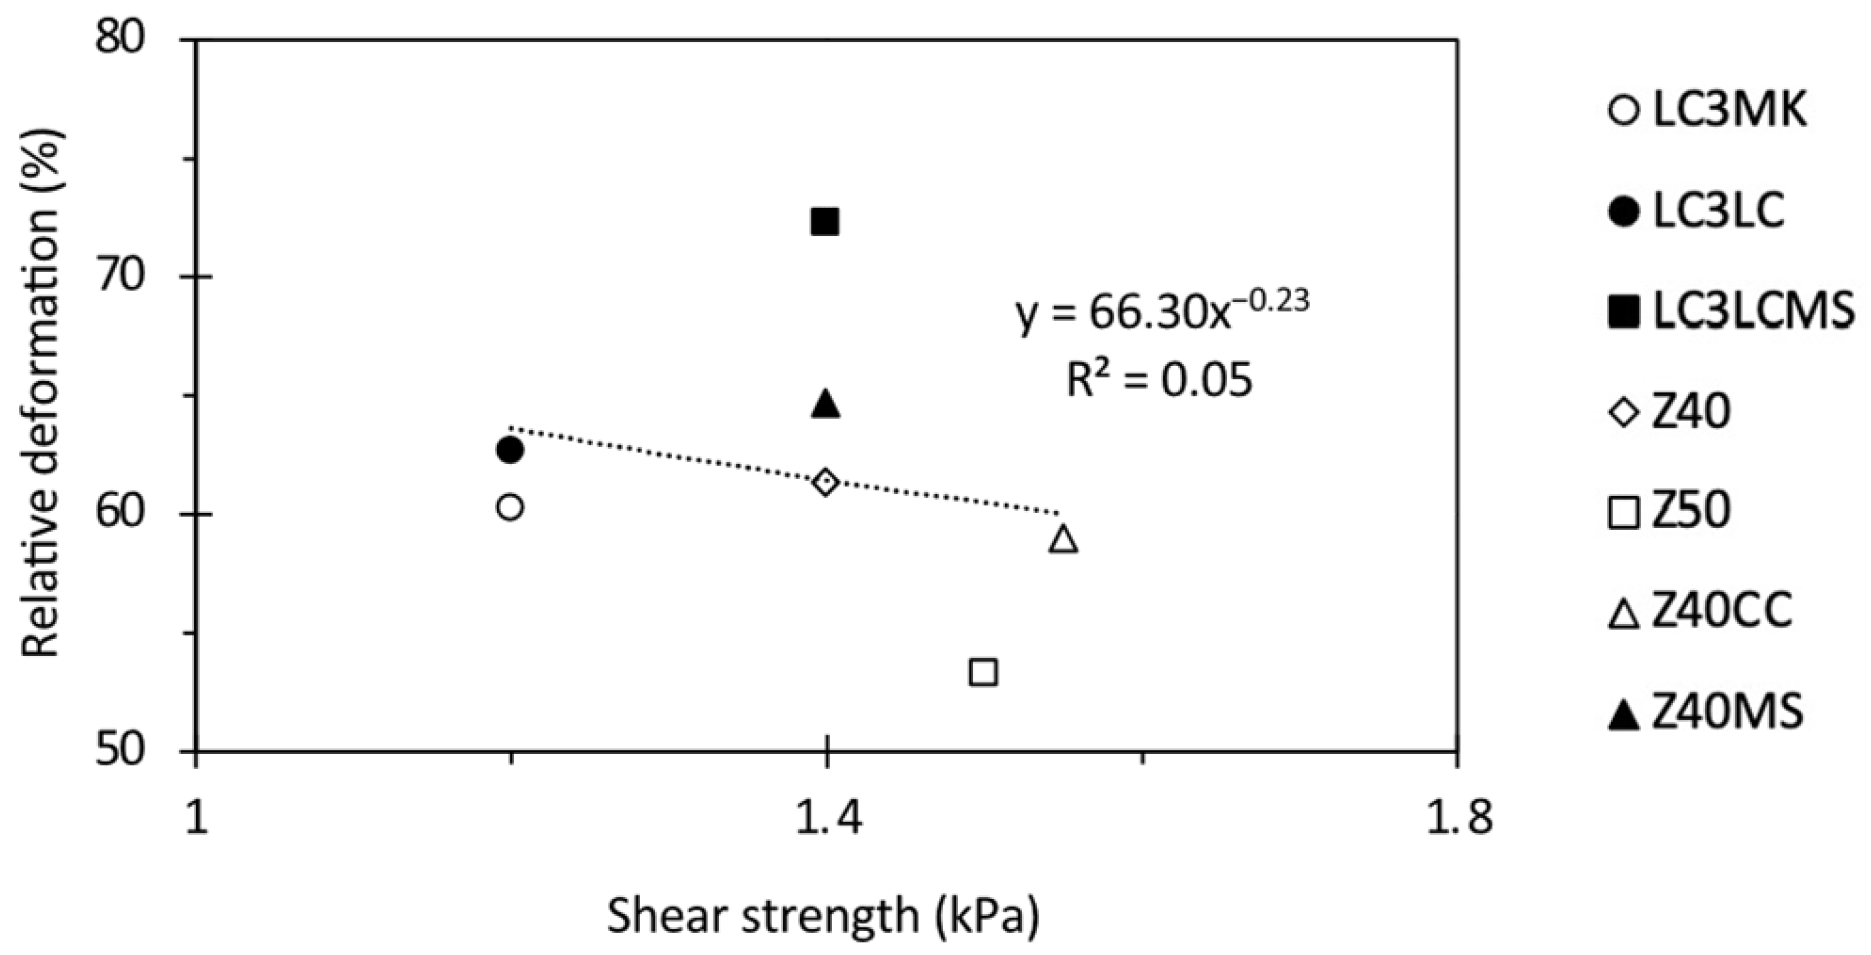
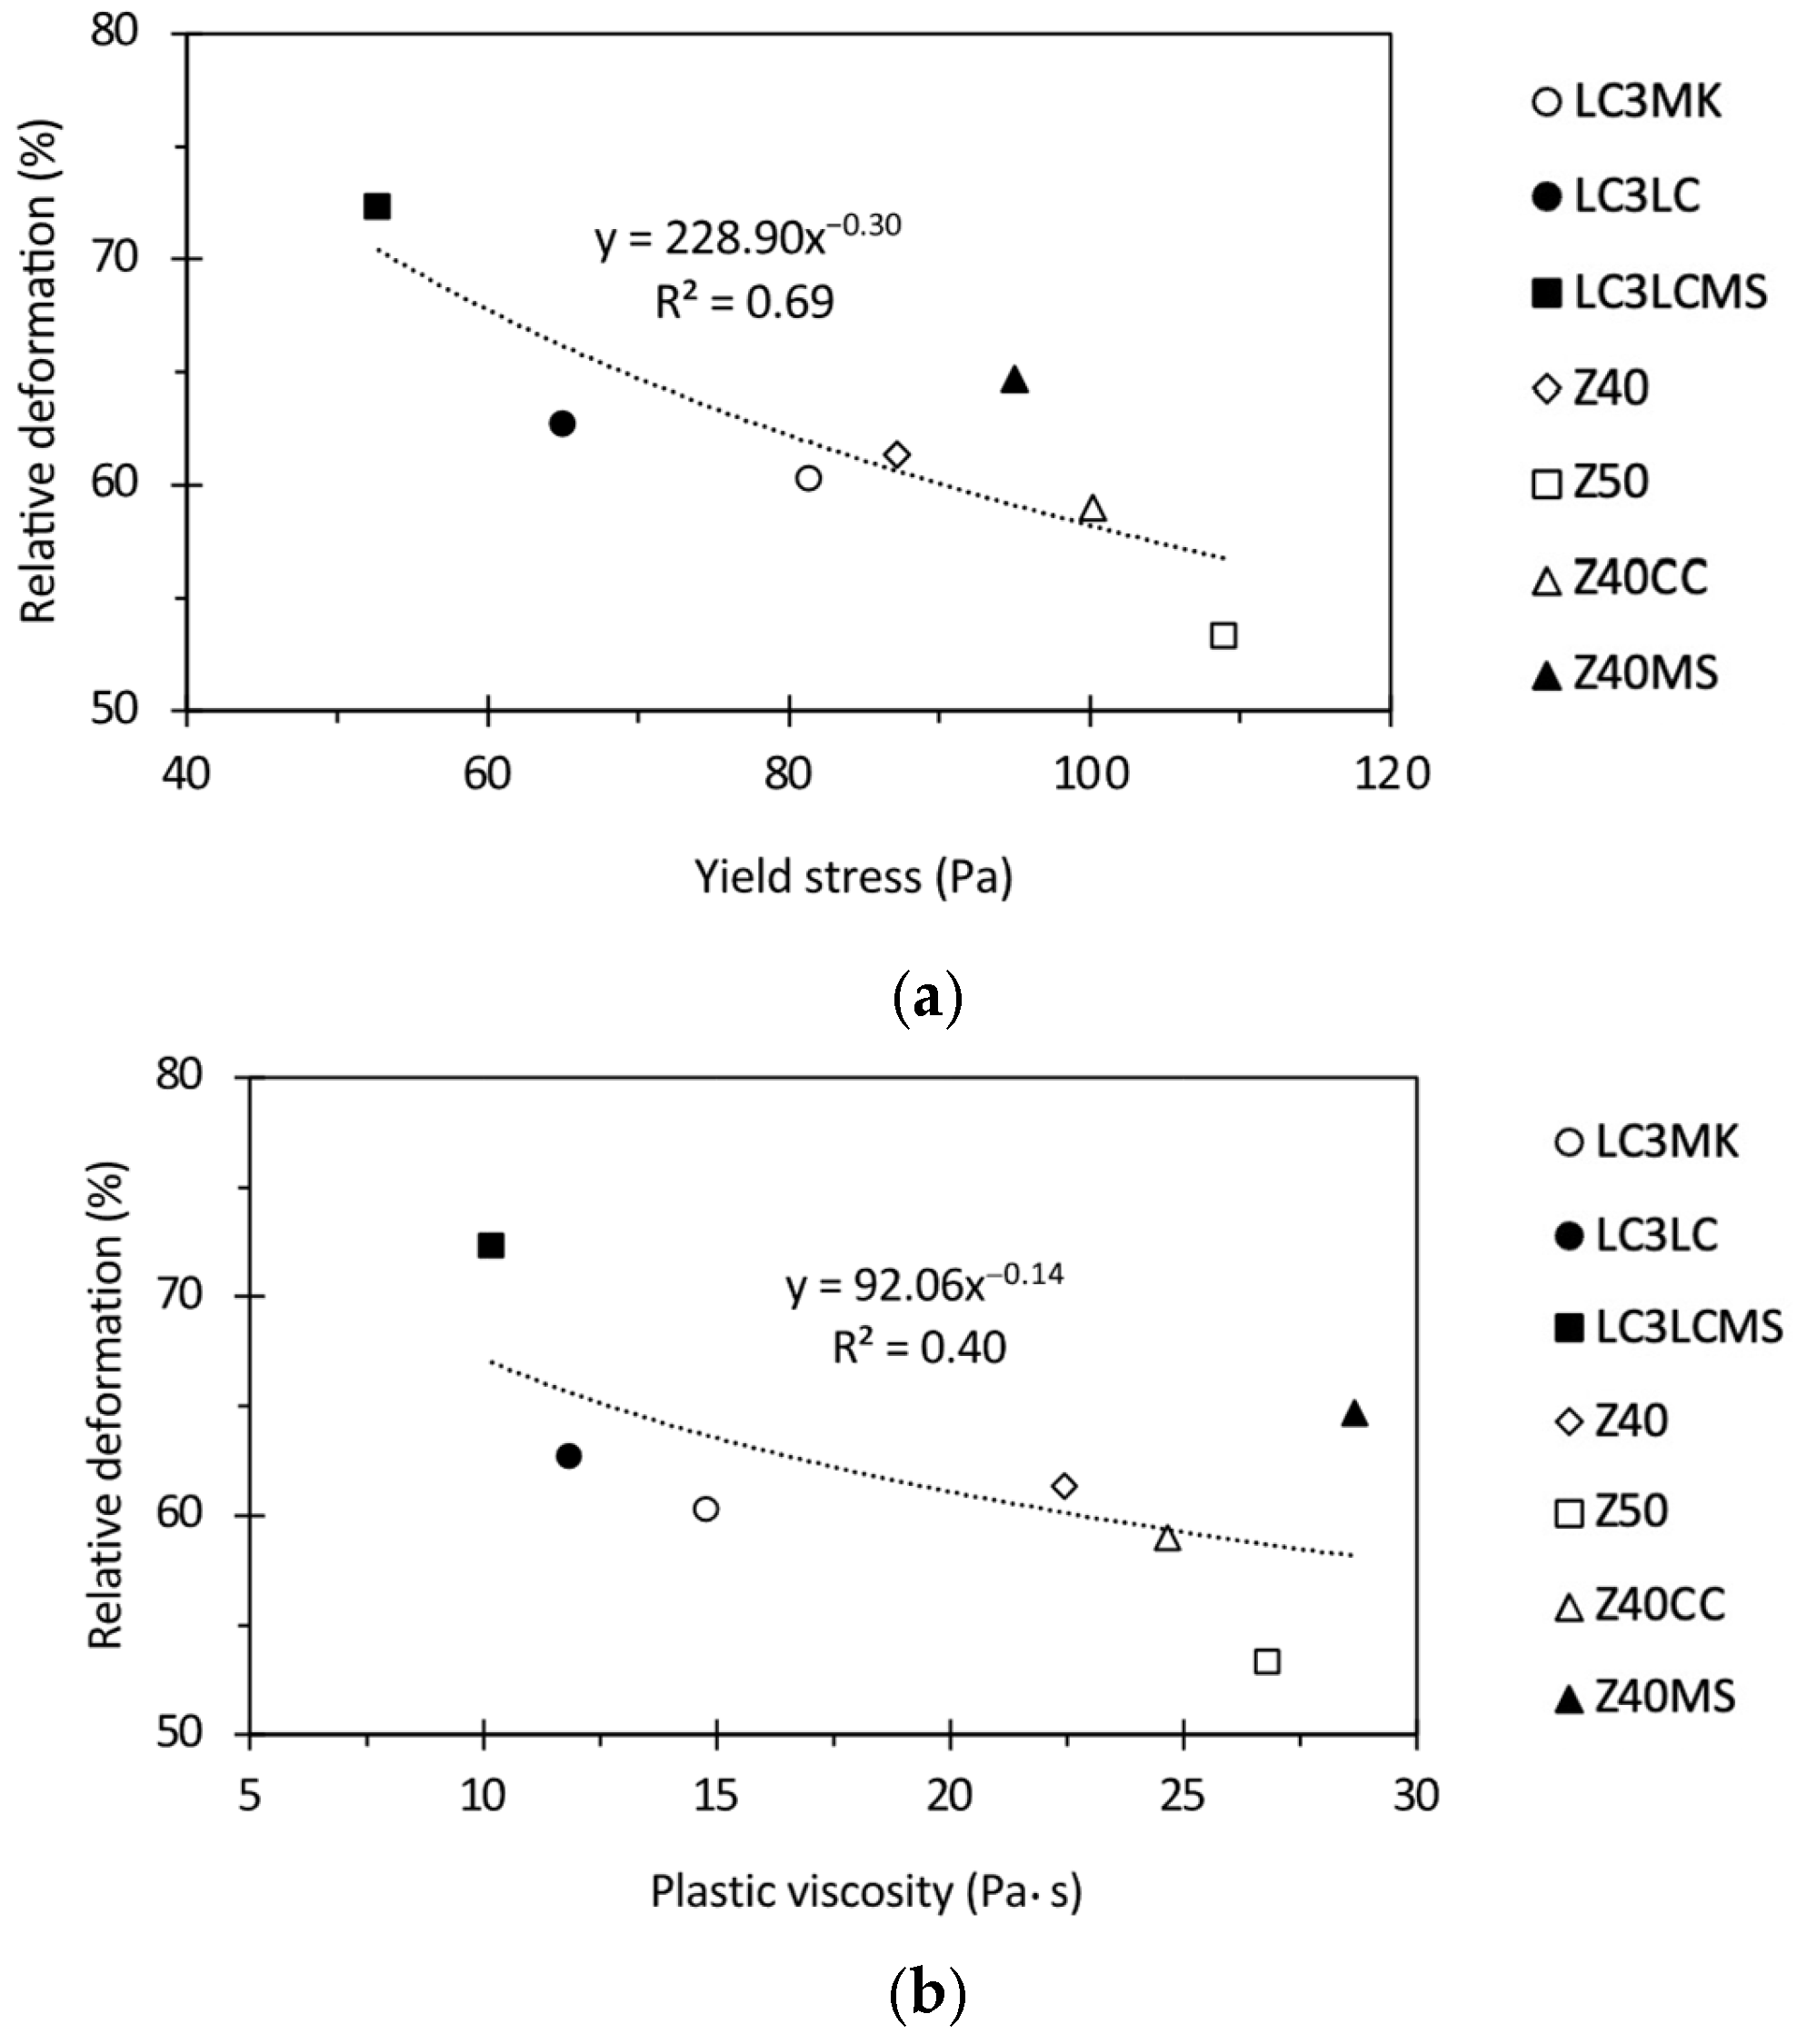
  • No correlation (R2 = 0.05) was found between the results from the flow table test and the shear strength (static yield stress). LC3LCMS and Z40MS exhibited greater relative deformation than Z40 for the same value of shear strength. Poor correlations were obtained between the relative deformation and the dynamic yield stress and plastic viscosity (R2 = 0.69 and R2 = 0.40, respectively). This indicates that the flow table test is not suitable to characterize printable cementitious materials, as suggested in other publications [6,55].
  • The printability window is limited by a dynamic yield stress value of ~250 Pa, regardless of the viscosity values of the mixes. The yield stress was the same for all the mixes tested.
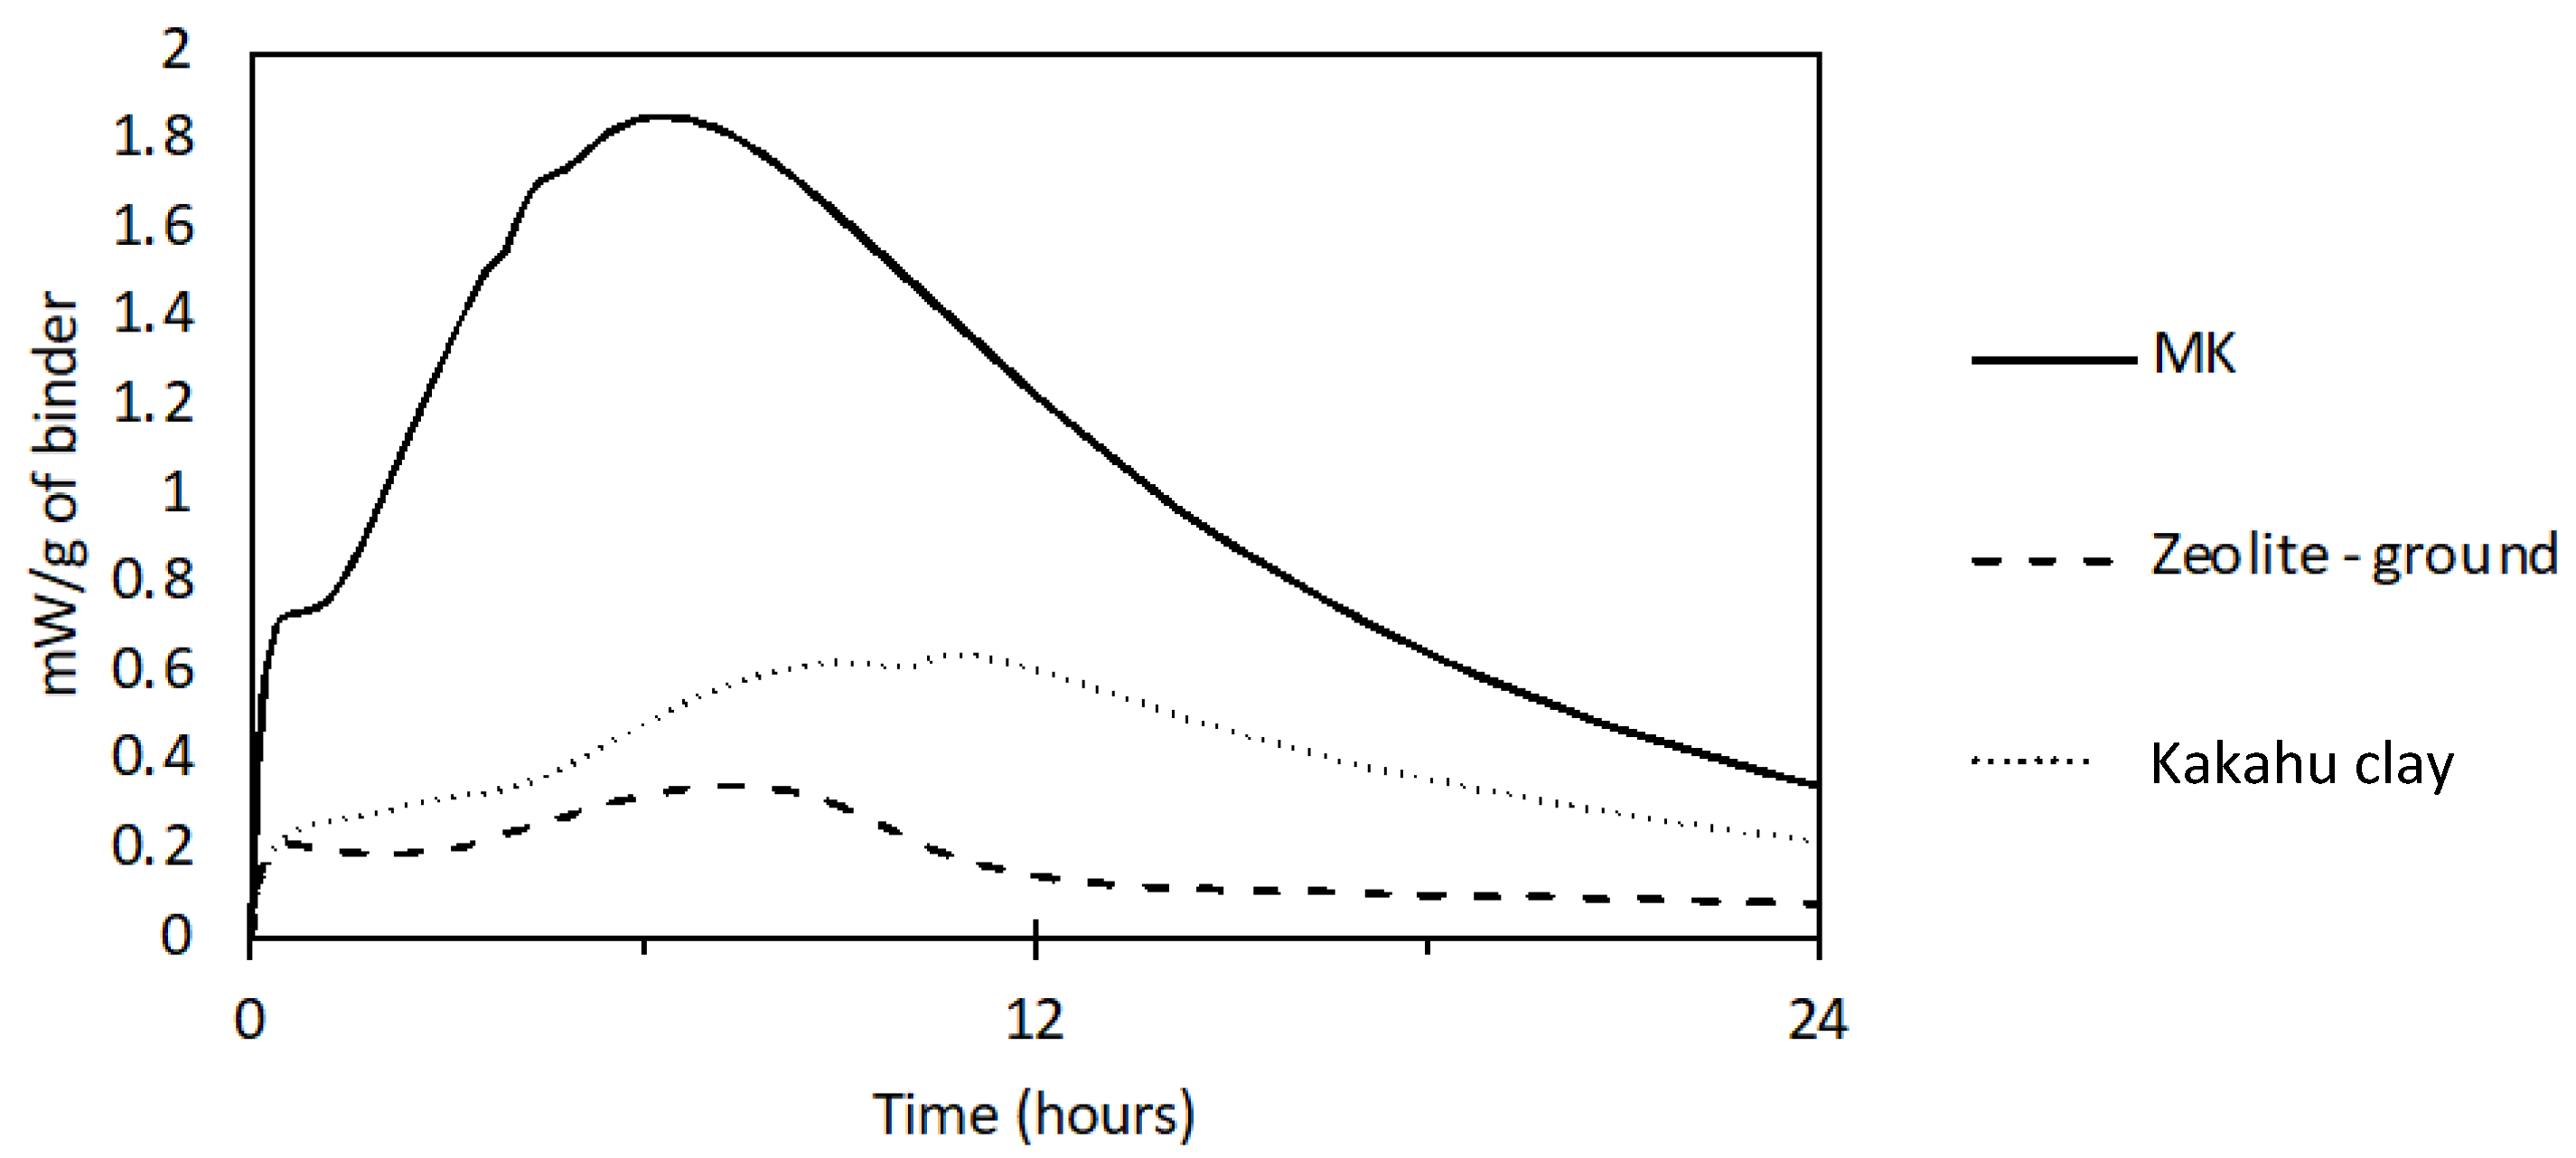
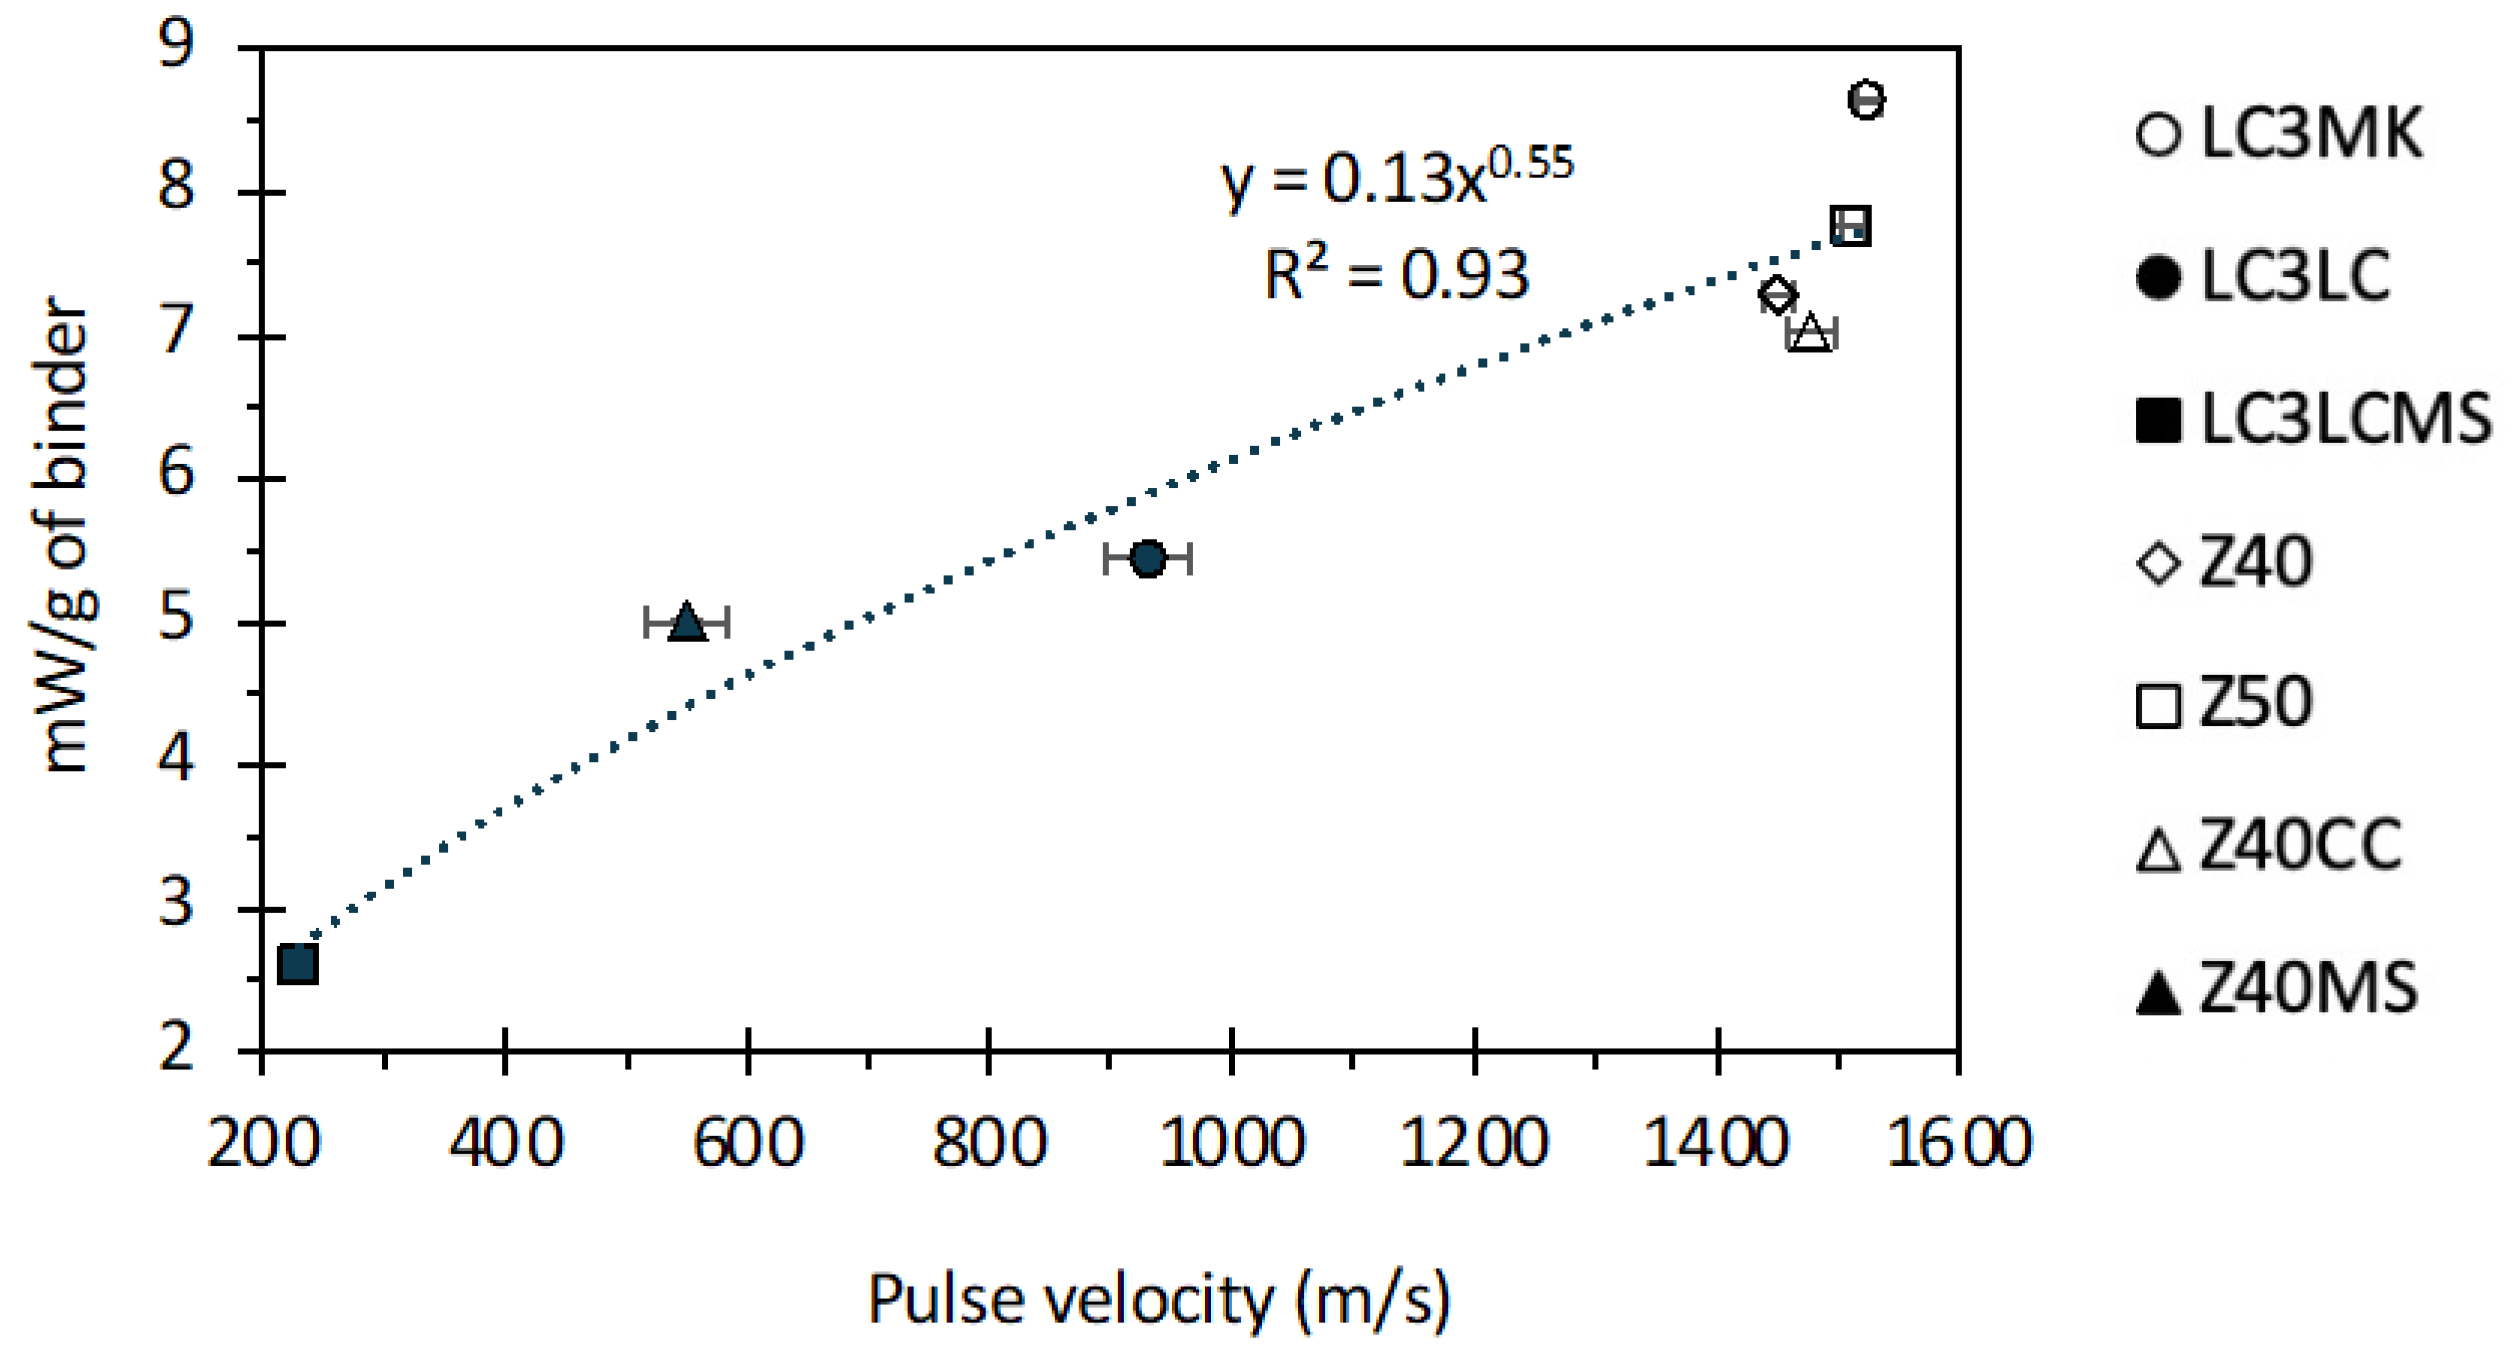
  • A strong correlation (R2 = 0.93) was observed between the heat released during the initial mixing reaction and the UPV measurements. This suggests that the early heat evolution (e.g., due to ettringite formation) may have a significant influence on the UPV results.
  • The UPV results were influenced by the mix design, being grouped in different pulse velocity ranges according to the initial heat released. Initial pulses of ~230 m/s, ~550 m/s, ~930 m/s, and ~1500 m/s were obtained, at which the different mixes were considered optimal for extrudability at the beginning of the test.
  • The UPV test has the potential to be used as an effective real-time monitoring technique during the printing process. To ensure optimal quality control and extrudability, the pulse velocity (mix-specific) should be determined for the printable mix beforehand.

5. Recommendations for Future Research

  • Evaluate the influence of admixtures and viscosity-modifying agents normally used to adjust the setting time and consistency of the mixes for 3DCP (e.g., retarder, accelerator, superplasticiser) on the pulse velocity measurements.
  • Quantify the ettringite content and provide a more accurate model to estimate its influence on the UPV.
  • Conduct the UPV test during the printing process while there is an active flow through the printer.
  • Develop a repeatable standard mix to investigate variabilities within the different methodologies to assess the rheological properties.

Author Contributions

Conceptualization, L.d.l.F.J.; methodology, L.d.l.F.J.; formal analysis, L.d.l.F.J., A.S., D.C. and G.L.; investigation, L.d.l.F.J.; resources, D.C. and G.L.; data curation, L.d.l.F.J.; writing—original draft preparation, L.d.l.F.J.; writing—review and editing, L.d.l.F.J., A.S., D.C. and G.L.; supervision, A.S., D.C. and G.L.; funding acquisition, G.L. All authors have read and agreed to the published version of the manuscript.

Funding

This research was funded by the Ministry of Business, Innovation & Employment (MBIE) of New Zealand (Project: Low-carbon and seismically resilient solutions for 3D concrete printed homes, grant number: UOCX2204), and the University of Canterbury, Doctoral Scholarship from the Department of Civil and Environmental Engineering.

Data Availability Statement

All data required to evaluate the conclusions of this study appears in the paper. The datasets (raw data) generated during the current study are available from the corresponding author on reasonable request.

Conflicts of Interest

The authors declare no conflicts of interest.

References

  1. Ahmed, G.H.; Askandar, N.H.; Jumaa, G.B. A review of largescale 3DCP: Material characteristics, mix design, printing process, and reinforcement strategies. Structures 2022, 43, 508–532. [Google Scholar] [CrossRef]
  2. Ma, G.; Buswell, R.; da Silva, W.R.L.; Wang, L.; Xu, J.; Jones, S.Z. Technology readiness: A global snapshot of 3D concrete printing and the frontiers for development. Cem. Concr. Res. 2022, 156, 106774. [Google Scholar] [CrossRef]
  3. Reiter, L.; Wangler, T.; Roussel, N.; Flatt, R.J. The role of early age structural build-up in digital fabrication with concrete. Cem. Concr. Res. 2018, 112, 86–95. [Google Scholar] [CrossRef]
  4. Marchon, D.; Kawashima, S.; Bessaies-Bey, H.; Mantellato, S.; Ng, S. Hydration and rheology control of concrete for digital fabrication: Potential admixtures and cement chemistry. Cem. Concr. Res. 2018, 112, 96–110. [Google Scholar] [CrossRef]
  5. Ivanova, I.; Mechtcherine, V. Possibilities and challenges of constant shear rate test for evaluation of structural build-up rate of cementitious materials. Cem. Concr. Res. 2020, 130, 105974. [Google Scholar] [CrossRef]
  6. Jayathilakage, R.; Rajeev, P.; Sanjayan, J. Rheometry for Concrete 3D Printing: A Review and an Experimental Comparison. Buildings 2022, 12, 1190. [Google Scholar] [CrossRef]
  7. Nicolas, R.; Richard, B.; Nicolas, D.; Irina, I.; Temitope, K.J.; Dirk, L.; Viktor, M.; Romain, M.; Arnaud, P.; Ursula, P.; et al. Assessing the fresh properties of printable cement-based materials: High potential tests for quality control. Cem. Concr. Res. 2022, 158, 106836. [Google Scholar] [CrossRef]
  8. Siccardi, P.; Berger, X.; Jean, R.; Jolin, M.; Bissonnette, B.; Beaupré, D. Study of the Mixing Completion in Concrete Production by Means of an on-Board Sensor System; RILEM Bookseries; Springer: Dordrecht, The Netherlands, 2020; pp. 338–345. [Google Scholar] [CrossRef]
  9. Chen, Y.; Rodriguez, C.R.; Li, Z.; Chen, B.; Çopuroğlu, O.; Schlangen, E. Effect of different grade levels of calcined clays on fresh and hardened properties of ternary-blended cementitious materials for 3D printing. Cem. Concr. Compos. 2020, 114, 103708. [Google Scholar] [CrossRef]
  10. Roussel, N. Rheological requirements for printable concretes. Cem. Concr. Res. 2018, 112, 76–85. [Google Scholar] [CrossRef]
  11. Weng, Y.; Lu, B.; Li, M.; Liu, Z.; Tan, M.J.; Qian, S. Empirical models to predict rheological properties of fiber reinforced cementitious composites for 3D printing. Constr. Build. Mater. 2018, 189, 676–685. [Google Scholar] [CrossRef]
  12. Le, T.T.; Austin, S.A.; Lim, S.; Buswell, R.A.; Gibb, A.G.F.; Thorpe, T. Mix design and fresh properties for high-performance printing concrete. Mater. Struct. Mater. Constr. 2012, 45, 1221–1232. [Google Scholar] [CrossRef]
  13. Le, T.T.; Austin, S.A.; Lim, R.A.; Buswell, R.; Law, A.G.F.; Gibb, T. Hardened properties of high-performance printing concrete. Cem. Concr. Res. 2012, 42, 558–566. [Google Scholar] [CrossRef]
  14. Kruger, J.; Zeranka, S.; van Zijl, G. An ab initio approach for thixotropy characterisation of (nanoparticle-infused) 3D printable concrete. Constr. Build. Mater. 2019, 224, 372–386. [Google Scholar] [CrossRef]
  15. Qian, Y.; Kawashima, S. Distinguishing dynamic and static yield stress of fresh cement mortars through thixotropy. Cem. Concr. Compos. 2018, 86, 288–296. [Google Scholar] [CrossRef]
  16. RILEM, RILEM, Technical Committees. Available online: https://www.rilem.net/activetcs (accessed on 5 November 2024).
  17. Li, F.; Shen, W.; Qing, Y.; Hu, X.; Li, Z.; Shi, C. An overview on the effect of pumping on concrete properties. Cem. Concr. Compos. 2022, 129, 104501. [Google Scholar] [CrossRef]
  18. De Schutter, G.; Lesage, K. Active Rheology Control of Cementitious Materials; CRC: Boca Raton, FL, USA, 2023. [Google Scholar]
  19. Muthukrishnan, S.; Ramakrishnan, S.; Sanjayan, J. Technologies for improving buildability in 3D concrete printing. Cem. Concr. Compos. 2021, 122, 104144. [Google Scholar] [CrossRef]
  20. Demont, L.; Mesnil, R.; Ducoulombier, N.; Caron, J.F. Affordable inline structuration measurements of printable mortar with a pocket shear vane. Constr. Build. Mater. 2023, 408, 133602. [Google Scholar] [CrossRef]
  21. Rahul, A.V.; Santhanam, M.; Meena, H.; Ghani, Z. 3D printable concrete: Mixture design and test methods. Cem. Concr. Compos. 2019, 97, 13–23. [Google Scholar] [CrossRef]
  22. Banfill, P.F.G.; Sedran, T.; Wallevik, O. Comparison of Concrete Rheometers: International Tests at LCPC. 2000. Available online: https://www.researchgate.net/publication/242380320 (accessed on 7 January 2025).
  23. Alghamdi, H.; Nair, S.A.O.; Neithalath, N. Insights into material design, extrusion rheology, and properties of 3D-printable alkali-activated fly ash-based binders. Mater. Des. 2019, 167, 107634. [Google Scholar] [CrossRef]
  24. Arunothayan, A.R.; Nematollahi, B.; Khayat, K.H.; Ramesh, A.; Sanjayan, J.G. Rheological characterization of ultra-high performance concrete for 3D printing. Cem. Concr. Compos. 2023, 136, 104854. [Google Scholar] [CrossRef]
  25. Zhang, Y.; Zhang, Y.; She, W.; Yang, L.; Liu, G.; Yang, Y. Rheological and harden properties of the high-thixotropy 3D printing concrete. Constr. Build. Mater. 2019, 201, 278–285. [Google Scholar] [CrossRef]
  26. Ye, G.; van Breugel, K.; Fraaij, A.L.A. Experimental Study on Ultrasonic Pulse Velocity Evaluation of the Microstructure of Cementitious Material at Early Age; Heron: San Diego, CA, USA, 2001; Volume 46, ISSN 0046-7316. [Google Scholar]
  27. Serdar, M.; Gabrijel, I.; Schlicke, D.; Staquet, S.; Azenha, M. Springer Tracts in Civil Engineering Advanced Techniques for Testing of Cement-Based Materials; Springer: Berlin/Heidelberg, Germany, 2020; Available online: http://www.springer.com/series/15088 (accessed on 7 January 2025).
  28. Sharma, S.; Mukherjee, A. Monitoring freshly poured concrete using ultrasonic waves guided through reinforcing bars. Cem. Concr. Compos. 2015, 55, 337–347. [Google Scholar] [CrossRef]
  29. Reinhardt, H.W.; Grosse, C.U. Continuous monitoring of setting and hardening of mortar and concrete. Constr. Build. Mater. 2004, 18, 145–154. [Google Scholar] [CrossRef]
  30. Boumiz, A.; Vernet, C.; Tenoudjif, F.C. Mechanical Properties of Cement Pastes and Mortars at Early Ages Evolution with Time and Degree of Hydration. Adv. Cem. Based Mater. 1996, 3, 94–106. [Google Scholar] [CrossRef]
  31. Keating, J.; Hannant, D.J.; Hibbert, A.P. Comparison of shear modulus and pulse velocity techniques to measure the build-up of structure in fresh cement pastes used in oil well cementing. Cem. Concr. Res. 1989, 19, 554–566. [Google Scholar] [CrossRef]
  32. New Zealand Geotechnical Society (NZGS) and Ministry of Business Innovation & Employment (MBIE), Earthquake geotechnical engineering practice, New Zealand Geotechnical Society: Ministry of Business Innovation & Employment, 2016. Available online: https://fl-nzgs-media.s3.amazonaws.com/uploads/2016/11/Module-2-Geotech-investigate-EQ-engineer-final.pdf (accessed on 19 January 2025).
  33. Omran, A.F.; Naji, S.; Khayat, K.H. Portable Vane Test to Assess Structural Buildup at Rest of Self-Consolidating Concrete. 2009. Available online: https://www.researchgate.net/publication/258295923_Portable_Vane_Test_to_Assess_Structural_Buildup_at_Rest_of_Self-Consolidating_Concrete (accessed on 10 February 2025).
  34. de la Flor Juncal, L.; Loporcaro, G.; Scott, A.; Clucas, D. Exploring the Use of Zeolite, Calcined Clay and Mussel Shells Powder in 3d Concrete Printing (3dcp) Mixes. 2023. Available online: https://www.researchgate.net/publication/380465278_Exploring_the_use_of_Zeolite_Calcined_Clay_and_Mussel_Shells_powder_in_3D_Concrete_Printing (accessed on 16 December 2024).
  35. Northcoat, J.W.; Wemyss, J.M.; De La, L.; Juncal, F.; Loporcaro, G. Exploring the Feasibility of Zeolite-Modified Blended Cement for 3d Concrete Printing: A Sustainable Alternative for the Concrete Construction Industry. 2023. Available online: https://www.researchgate.net/publication/380465283_Exploring_the_feasibility_of_Zeolite-modified_blended_cement_for_3D_Concrete_Printing_a_sustainable_alternative_for_the_concrete_construction_industry (accessed on 16 December 2024).
  36. O’malley, E.S.; Wright, S.G. Review of Undrained Shear Strength Testing Methods Used by the Texas State Department of Highways and Public Transportation. 1987. Available online: https://library.ctr.utexas.edu/digitized/texasarchive/phase2/446-1f.pdf (accessed on 10 February 2025).
  37. ConTec user’s guide; ConTec-Viscometer2003.
  38. ASTM C230/C230M-23; Specification for Flow Table for Use in Tests of Hydraulic Cement. ASTM International: Montgomery, PA, USA, 2023. [CrossRef]
  39. ASTM C1437-20; Test Method for Flow of Hydraulic Cement Mortar. ASTM International: Montgomery, PA, USA, 2020. [CrossRef]
  40. Cho, S.; Kruger, J.; Bester, F.; van den Heever, M.; van Rooyen, A.; van Zijl, G. A Compendious Rheo-Mechanical Test for Printability Assessment of 3D Printable Concrete; RILEM Bookseries; Springer: Berlin/Heidelberg, Germany, 2020; pp. 196–205. [Google Scholar] [CrossRef]
  41. Tay, Y.W.D.; Qian, Y.; Tan, M.J. Printability region for 3D concrete printing using slump and slump flow test. Compos. B Eng. 2019, 174, 106968. [Google Scholar] [CrossRef]
  42. Papachristoforou, M.; Mitsopoulos, V.; Stefanidou, M. Evaluation of workability parameters in 3D printing concrete. Procedia Struct. Integr. 2018, 10, 155–162. [Google Scholar] [CrossRef]
  43. ASTM C1897-20; Standard Test Methods for Measuring the Reactivity of Supplementary Cementitious Materials by Isothermal Calorimetry and Bound Water Measurements. ASTM International: Montgomery, PA, USA, 2020. [CrossRef]
  44. Bjrn, A.; de La Monja, P.S.; Karlsson, A.; Ejlertsson, J.; Rheological, B.H. Rheological Characterization. In Biogas; InTech: Hong Kong, China, 2012. [Google Scholar] [CrossRef]
  45. Lertwattanaruk, P.; Makul, N.; Siripattarapravat, C. Utilization of ground waste seashells in cement mortars for masonry and plastering. J. Environ. Manag. 2012, 111, 133–141. [Google Scholar] [CrossRef]
  46. Souidi, A.; Maaloufa, Y.; Amazal, M.; Atigui, M.; Oubeddou, S.; Mounir, S.; Idoum, A.; Aharoune, A. The effect of mussel shell powder on the thermal and mechanical properties of plaster. Constr. Build. Mater. 2024, 416, 135142. [Google Scholar] [CrossRef]
  47. Juncal, L.d.l.F.; Scott, A.; Clucas, D.; Loporcaro, G. Permeability and electrical resistivity of 3D-printed mortars using local materials (zeolite, calcined clay, and mussel shell powder), Aotearoa—New Zealand. Case Stud. Constr. Mater. 2025, 22, e04448. [Google Scholar] [CrossRef]
  48. Avet, F.; Scrivener, K. Investigation of the calcined kaolinite content on the hydration of Limestone Calcined Clay Cement (LC3). Cem. Concr. Res. 2018, 107, 124–135. [Google Scholar] [CrossRef]
  49. Sabir, B.; Wild, S.; Bai, J. Metakaolin and calcined clays as pozzolans for concrete: A review. Cem. Concr. Compos. 2001, 23, 441–454. [Google Scholar] [CrossRef]
  50. Hu, J. Comparison between the effects of superfine steel slag and superfine phosphorus slag on the long-term performances and durability of concrete. J. Therm. Anal. Calorim. 2017, 128, 1251–1263. [Google Scholar] [CrossRef]
  51. Rehman, A.U.; Birru, B.M.; Kim, J.H. Set-on-demand 3D Concrete Printing (3DCP) construction and potential outcome of shotcrete accelerators on its hardened properties. Case Stud. Constr. Mater. 2023, 18, e01955. [Google Scholar] [CrossRef]
  52. Alexa-Stratulat, S.M.; Olteanu, I.; Toma, A.M.; Pastia, C.; Banu, O.M.; Corbu, O.C.; Toma, I.O. The Use of Natural Zeolites in Cement-Based Construction Materials—A State of the Art Review. Coatings 2024, 14, 18. [Google Scholar] [CrossRef]
  53. Radulović, D.; Terzić, A.; Pezo, L.; Andrić, L.; Grigorova, I. The chemometric study of limestone physico-chemical properties and thermal behavior for application in construction composites. Sci. Sinter. 2017, 49, 247–261. [Google Scholar] [CrossRef]
  54. Wallevik, J.E. Rheological properties of cement paste: Thixotropic behavior and structural breakdown. Cem. Concr. Res. 2009, 39, 14–29. [Google Scholar] [CrossRef]
  55. Tattersall, G.H. Workability and Quality Control of Concrete; CRC: Boca Raton, FL, USA, 2005. [Google Scholar]
  56. Shah, V.; Parashar, A.; Scott, A. Understanding the importance of carbonates on the performance of Portland metakaolin cement. Constr. Build. Mater. 2022, 319, 126155. [Google Scholar] [CrossRef]
  57. Scrivener, K.; Martirena, F.; Bishnoi, S.; Maity, S. Calcined clay limestone cements (LC3). Cem. Concr. Res. 2018, 114, 49–56. [Google Scholar] [CrossRef]
  58. Yang, Y.; Zhang, Q.; Shu, X.; Wang, X.; Ran, Q. Influence of Sulfates on Formation of Ettringite during Early C3A Hydration. Materials 2022, 15, 6934. [Google Scholar] [CrossRef]
  59. Ramachandran, V.S. Concrete Admixtures Handbook: Properties, Science, and Technology, 2nd ed.; Noyes Publications: Park Ridge, NJ, USA, 1995. [Google Scholar]
  60. Roussel, N.; Ovarlez, G.; Garrault, S.; Brumaud, C. The origins of thixotropy of fresh cement pastes. Cem. Concr. Res. 2012, 42, 148–157. [Google Scholar] [CrossRef]
  61. Jakob, C.; Jansen, D.; Ukrainczyk, N.; Koenders, E.; Pott, U.; Stephan, D.; Neubauer, J. Relating ettringite formation and rheological changes during the initial cement hydration: A comparative study applying XRD analysis, rheological measurements and modeling. Materials 2019, 12, 2957. [Google Scholar] [CrossRef]
Figure 1. Typical pulse velocity evolution with curing.
Buildings 15 02566 g001
Figure 2. Gantry system 3D printer built by the University of Canterbury.
Buildings 15 02566 g002
Figure 3. Examples of defects of 3DCP: (a) filament spread and (b) filament tearing.
Buildings 15 02566 g003
Figure 4. Shear vane test.
Buildings 15 02566 g004
Figure 5. ConTec-Viscometer 5.
Buildings 15 02566 g005
Figure 6. (a) UPV test diagram (direct transmission) and (b) 3D-printed plastic device for the UPV test.
Buildings 15 02566 g006
Figure 7. Flow table test: (a) mortar sample after lifting the cone, (b) spread of the mortar after test, and (c) diameter spread measurement to obtain the relative deformation.
Buildings 15 02566 g007
Figure 8. Phases during the hydration of cementitious materials—typical calorimetry test graph.
Buildings 15 02566 g008
Figure 9. Shear strength (static yield stress) with time: (a) zeolite-based mixes and (b) LC3-based.
Buildings 15 02566 g009
Figure 10. Evolution of dynamic yield stress and plastic viscosity with time: (a) LC3-based and (b) zeolite-based mixes.
Buildings 15 02566 g010
Figure 11. Pulse velocity evolution for different mix designs: (a) LC3-based and (b) zeolite-based mixes (red box shows zoomed-in region).
Buildings 15 02566 g011
Figure 12. Correlation of shear strength and pulse velocity: (a) LC3-based and (b) zeolite-based mixes (red box shows zoomed-in region).
Buildings 15 02566 g012
Figure 13. Correlation of relative deformation from flow table test vs. shear strength.
Buildings 15 02566 g013
Figure 14. Correlation of relative deformation from flow table test vs. (a) yield stress and (b) plastic viscosity.
Buildings 15 02566 g014
Figure 15. Correlation of relative deformation from flow table test vs. UPV.
Buildings 15 02566 g015
Figure 16. Heat evolution per gram of SCM using isothermal calorimetry—reactivity test.
Buildings 15 02566 g016
Figure 17. Initial mixing reaction (heat generation) of the mix designs.
Buildings 15 02566 g017
Figure 18. Initial heat released and pulse velocity correlation for the mix designs under study.
Buildings 15 02566 g018
Figure 19. Conceptual design: UPV set-up for the 3D printing process.
Buildings 15 02566 g019
Table 1. Chemical composition (%/100 g) of materials.
OxidesOPCMKLocal clayCaCO3Mussel shellsZeoliteGypsumFine Agg.
CaO70.340.030.1796.7198.23.5546.831.41
SiO216.9050.6860.31.350.1074.950.1974.5
Fe2O33.830.422.40.400.061.850.033.24
MgO0.76nd *0.830.580.051.350.111.04
SO33.230.050.070.020.250.0352.170.03
Al2O33.1946.2232.250.630.03314.870.0713.3
K2O0.540.132.350.100.0112.15nd *3.34
TiO20.392.011.35nd *nd *0.26nd *0.47
Na2O0.250.200.070.050.780.810.072.37
P2O50.110.100.030.010.110.0320.0050.13
MnO0.10nd *0.0150.03nd *0.047nd *0.05
Sum99.6499.8399.8499.8999.699.999.4899.88
* nd: non-detected.
Table 2. Mix designs tested in this research.
Binder (%)Sand, Water, PVA Fibres, and SP Mass Ratios
MixesOPCMKLCCCMS
(Powder)
ZGypsum S/BW/BPVA/BSP/B
LC3MK5530 12--31.50.420.2250.45
LC3LC55-3012--3
LC3LCMS55-30-12-3
Z4060----40-1.25
Z5050----50-1.5
Z40CC50--10-40-
Z40MS50---1040-
OPC: ordinary Portland cement; MK: metakaolin; LC: local clay; CC; calcium carbonate; MS: mussel shells; Z: zeolite. S/B: sand to binder ratio; W/B: water to binder ratio. SP/B: superplasticiser to binder ratio; PVA/B: PVA fibres to binder ratio.
Table 3. Open time of the mortars.
MixOpen Time (in min)
LC3MK25–30
LC3LC35–40
LC3LCMS40–45
Z5010–15
Z4015–20
Z40CC10–15
Z40MS20–25
Table 4. PSD (D50 and D90) of the SCMs under study.
D 50 (μm) D 90 (μm)
MK4.9714.8
Zeolite (75 psi)5.3915.6
CaCO320.970.4
Mussel shell powder6.4740.8
Kakahu clay9.25164.3
Disclaimer/Publisher’s Note: The statements, opinions and data contained in all publications are solely those of the individual author(s) and contributor(s) and not of MDPI and/or the editor(s). MDPI and/or the editor(s) disclaim responsibility for any injury to people or property resulting from any ideas, methods, instructions or products referred to in the content.

