Article

Spatial Differentiation in the Contribution of Innovation Influencing Factors: An Empirical Study in Nanjing from the Perspective of Nonlinear Relationships

College of Architecture, Nanjing Tech University, Nanjing 211816, China
*
Author to whom correspondence should be addressed.
Buildings 2025, 15(14), 2565; https://doi.org/10.3390/buildings15142565
Submission received: 17 June 2025 / Revised: 7 July 2025 / Accepted: 17 July 2025 / Published: 21 July 2025
(This article belongs to the Section Architectural Design, Urban Science, and Real Estate)

Abstract

The agglomeration characteristics of innovation spaces reflect the intrinsic mechanisms of regional resource integration and collaborative innovation. Investigating the contributions of influencing factors to innovation space agglomeration and their spatial differentiation has significant implications for improving urban innovation quality. Taking the Nanjing central urban area as a case study, this research applied gradient boosting regression trees (GBRT) and multiscale geographically weighted regression (MGWR) models to explore the contributions of influencing factors to innovation space agglomeration and its spatial differentiation. Findings demonstrated that (1) Innovation platforms and patents emerged as the most significant driving factors, collectively accounting for 54.8% of the relative contributions; (2) The contributions of influencing factors to innovation space agglomeration exhibited marked nonlinear characteristics, specifically categorized into five distinct patterns: Sustained Growth Pattern, Growth-Stabilization Pattern, Growth-Decline Pattern, Global Stabilization Pattern, and Global Decline Pattern. The inflection thresholds of marginal effects across factors ranged from approximately 12% to 55% (e.g., 40% for metro stations, 13% for integrated commercial hubs); (3) Each influence factor’s contribution mechanism showed pronounced spatial heterogeneity across different regions. Based on these discoveries, governments should optimize innovation resource allocation according to regional characteristics and enhance spatial quality to promote efficient resource integration and transformation. This research provides a novel perspective for understanding innovation space agglomeration mechanisms and offers actionable references for urban policymakers to implement context-specific innovation economic development strategies.

1. Introduction

In the 1980s, Romer and Lucas proposed that knowledge accumulation constitutes an endogenous and independent factor of economic growth, whereby they established innovation as the fundamental source of modern economic expansion [1,2,3]. The report of the 20th National Congress of the Communist Party of China (CPC) mandates: “Persist in making innovation the core position in China’s modernization drive” and “Accelerate the realization of high-level technological self-reliance”. The Decision of the Third Plenary Session of the 20th CPC Central Committee articulates the strategic directive to “Establish institutional mechanisms to underpin comprehensive innovation”, while the Central Economic Work Conference further underscores the necessity to “Promote integrated development of scientific-technological and industrial innovation”. These authoritative documents collectively establish innovation as the core engine driving high-quality socioeconomic development and the critical support for promoting the transitions between old and new growth drivers alongside economic structural transformation. Following decades of rapid post-reform economic growth, the innovation-driven economy has emerged as the new dynamic advancing China’s modernization path in the new era [4]. As critical spatial platforms for innovative activities, innovation spaces will play an increasingly crucial role in enhancing urban competitiveness and driving high-quality regional economic growth.
Tracing the developmental trajectory of innovation-driven economies demonstrates that innovation spatial configurations have undergone continuous restructuring and upgrading—from campus-style “Silicon Valley models” to urban district-based “Silicon Alley models”—progressively enhancing the optimization and prosperity of innovation ecosystems [5,6]. Theoretically, its evolutionary drivers stem from two core mechanisms dominated by geographic agglomeration effects: (1) the knowledge spillover and sharing mechanism within the Marshallian externality framework, where geographic proximity significantly reduces tacit knowledge transmission costs, accelerating technological diffusion and collective learning processes [1,7,8]; (2) the diversified collision mechanism arising from the synergy between Jacobs’ externality theory and Porter’s industrial cluster theory. Spatial agglomeration of cross-sector entities facilitates heterogeneous knowledge recombination, while complete supply chain networks, specialized innovation talent, and open cultural ecosystems collectively drive innovation iteration rates [9,10]. These theoretical mechanisms have been validated across global innovation hubs: Silicon Valley has leveraged university knowledge sources and venture capital networks to construct efficient knowledge spillover channels, enabling commercial breakthroughs in semiconductor and internet technologies; Tokyo’s Akihabara has catalyzed fusion between cultural creativity and technological innovation through hybrid-district agglomeration integrating electronics, anime, and digital entertainment industries; Shenzhen has established manufacturing ecosystems via vertical integration of electronics supply chains, achieving real-time resource sharing and skill complementarity that underpin its global leadership in consumer electronics innovation.
However, the full realization of innovation agglomeration effects is highly contingent upon regional spatial quality. This concept transcends mere physical environment superiority, instead denoting comprehensive environmental attributes within a specific territory that effectively stimulate, support, and continuously optimize innovation activities. It profoundly shapes interaction patterns among innovation entities, knowledge flow efficiency, creative output frequency, and the formation and intensity of collaborative networks, thereby constituting the fundamental substrate of innovation ecosystems [11,12,13]. The core dimensions of regional spatial quality are defined as follows: (1) Infrastructure and spatial accessibility: This dimension encompasses not only efficient transportation networks, reliable digital infrastructure, and high-quality built environments, but more critically ensures low-cost, high-efficiency spatial flow, contact, and convergence of innovation factors, establishing essential physical preconditions for innovation interactions [9]; (2) Functional mix and spatial vitality: Characterized by appropriate land-use integration (e.g., blending R&D, office, commercial, residential, and cultural functions) alongside high-quality, diversified public spaces (including plazas, green spaces, and cafes). Such configurations generate abundant third places that significantly facilitate serendipitous encounters, cross-disciplinary ideation, and informal exchanges among diverse populations [14]; (3) Socio-cultural inclusivity: Manifested through open, tolerant, and trust-based cultural atmospheres reinforced by formal and informal interaction mechanisms (such as community events and online forums). This inclusive environment strengthens social network resilience, attracts and retains diverse talent, lowers collaboration barriers, accelerates tacit knowledge transfer, and enhances innovation communities’ adaptive capacity [11,15]; (4) Institutional Environment and Collaborative Governance: Involving innovation-friendly policies, effective intellectual property protection, and multi-stakeholder governance mechanisms engaging government, enterprises, universities, and communities. Sound institutional frameworks reduce innovation transaction costs, enable resource integration, and provide sustainable institutional safeguards [16]. It is precisely such multidimensional synergy that cultivates, nourishes, and accelerates innovation agglomeration within high-quality regional spaces.
Subsequently, scholars in related fields have empirically deconstructed the driving factors of agglomeration mechanisms and validated the critical role of spatial quality dimensions, with principal findings summarized in three aspects: (1) Development of knowledge spillover carriers. As a key manifestation of institutional support and socio-cultural dimensions in regional spatial quality, regions with research-intensive universities and abundant venture capital resources within innovation support systems exhibit significantly stronger innovation-economic vitality than other cities (e.g., San Francisco, Boston, Denver) [17,18]; (2) Optimization of factor foundations reveals significant correlations between innovation space agglomeration efficacy and urban infrastructure metrics: walkability, transport accessibility, and availability of high-quality interactive space [19,20,21,22]; (3) Cultivation of diversified innovation ecosystems. Districts characterized by high-density innovator populations, rich cultural amenities, and vigorous economic vitality manifest more pronounced innovation advantages [23,24].
Building upon international theoretical research and practical explorations, Chinese scholars have integrated local innovation development needs to focus on regional spatial quality factors. Predominantly adopting spatial geography perspectives, their research prioritizes the evolutionary patterns, agglomeration characteristics, and driving mechanisms of innovation spaces across multiple scales: (1) Macro-scale analyses. Interdisciplinary studies combining geography, economics, and management science examine innovation disparities and spatial pattern evolution between eastern, central, and western China. Systematic evidence has confirmed the critical roles of R&D policies, technological innovation, and urban economic vitality in regional innovation development [25,26,27]; (2) Meso-scale investigations. Taking major city clusters such as the Yangtze River Delta, Pearl River Delta, and others as research objects, scholars explore driving models for innovation space development. Particular attention is given to resource sharing and policy guidance in regional collaborative innovation, exemplified by how functional diversity, land pricing, and infrastructure support propel innovation agglomeration [28,29,30,31]; (3) Micro-scale examinations. Research predominantly adopts intra-urban perspectives to investigate how built environment characteristics and infrastructure conditions influence urban innovation agglomeration. These studies reveal coupling mechanisms between innovation activities and spatial clustering [32,33,34].
In summary, existing studies have primarily focused on examining general correlations between influencing factors and innovation space agglomeration. However, universal principles of urban development demonstrate that the contributions of these factors may vary significantly across different stages of urban innovation development and among geographical regions at the same temporal cross-section. Therefore, further exploration is critically needed into the spatial heterogeneity of factor contributions to innovation activity agglomeration within distinct intra-urban zones.
Building on these foundations, this study targets the Nanjing central urban area, employing multi-sourced datasets that document spatial distributions of innovation entities, including research institutions, high-tech enterprises, and innovation incubators [35]. Taking marginal effects between influencing factors and innovation agglomeration intensity as the analytical entry point, we applied gradient boosting regression trees (GBRT) and multiscale geographically weighted regression (MGWR) to investigate the contribution intensity and spatial differentiation of urban innovation resources to innovation agglomeration under resource and environmental constraints. The findings are expected to provide actionable insights for municipal governments to advance innovation-driven economic development.

2. Materials and Methods

2.1. Study Area

As the provincial capital of Jiangsu Province and a pivotal central city in eastern China, Nanjing has concentrated critical innovation-enabling resources, including talent pools, research institutions, enterprise incubators, and high-tech industrial clusters. In recent years, the city has demonstrated substantial progress in fostering an innovation-driven economy, which has established a coordinated and comprehensive urban innovation ecosystem [36]. The study area was delineated according to Nanjing’s Main Urban Area and the Central Urban Area boundaries specified in the Nanjing Territorial and Spatial Master Plan (2021–2035). It comprises the Southern Yangtze Core Districts (Jiangnan) and Northern Yangtze Core Districts (Jiangbei), covering 775 km2 in total (Figure 1).

2.2. Materials

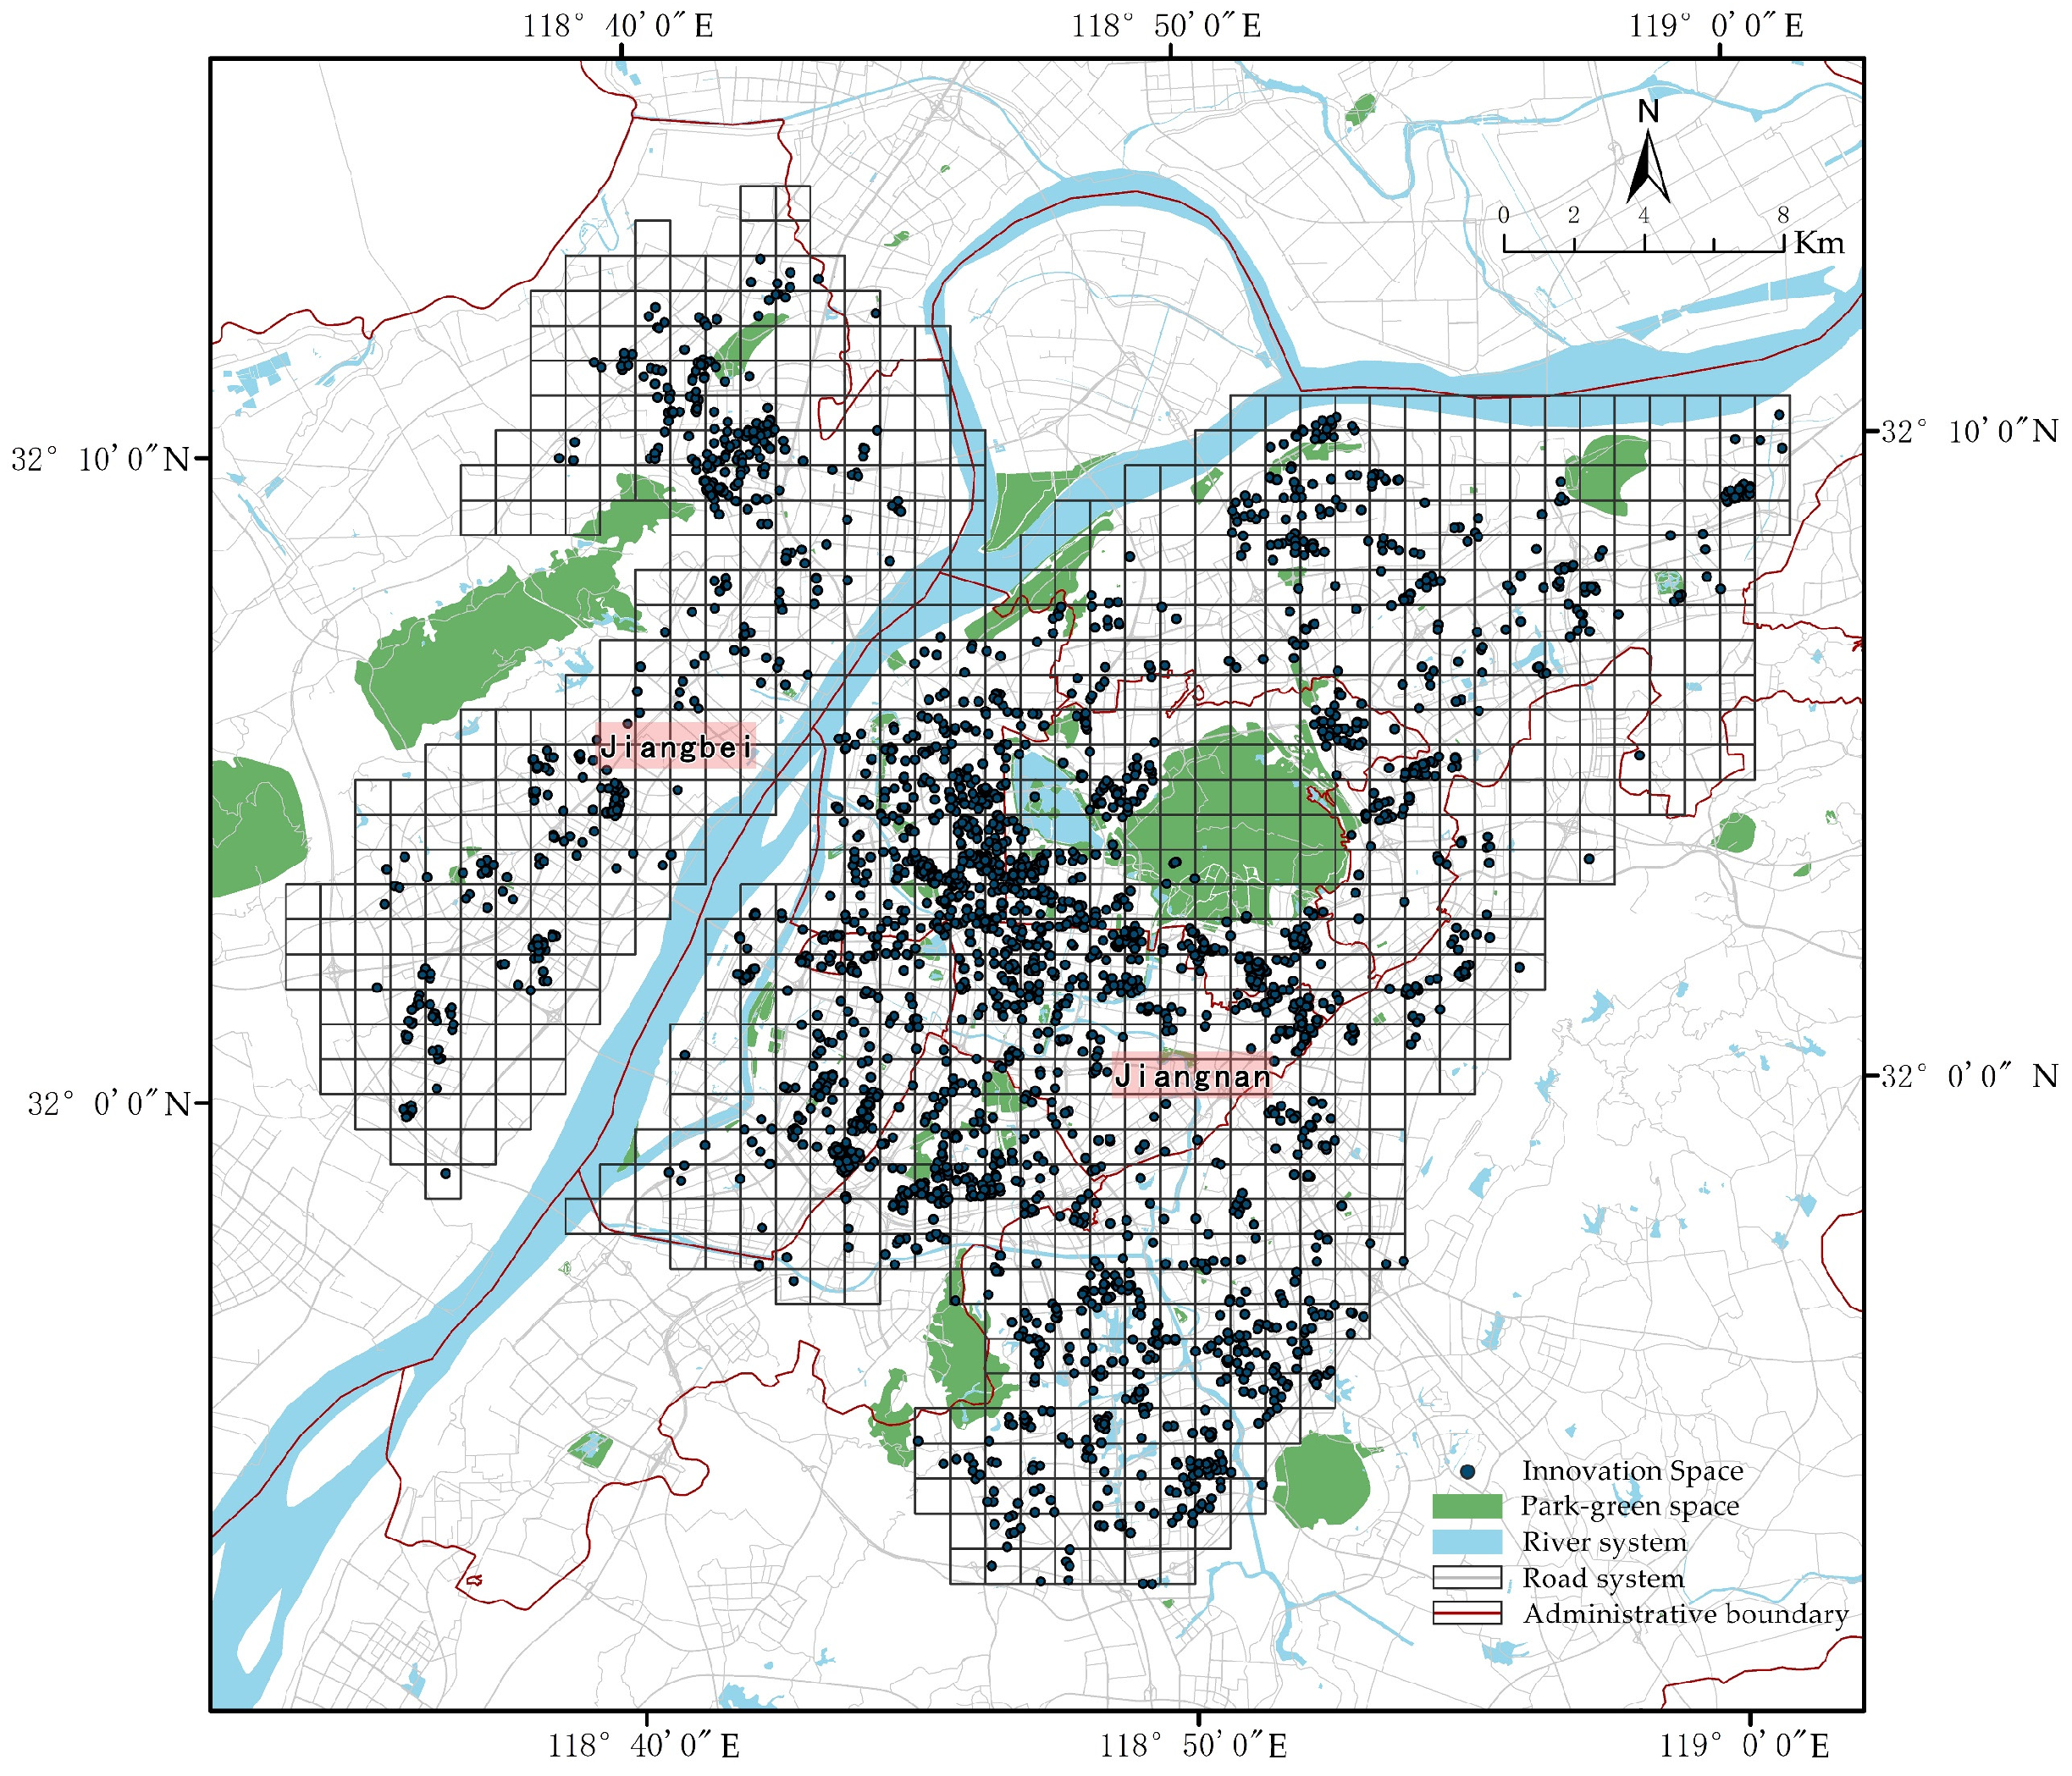
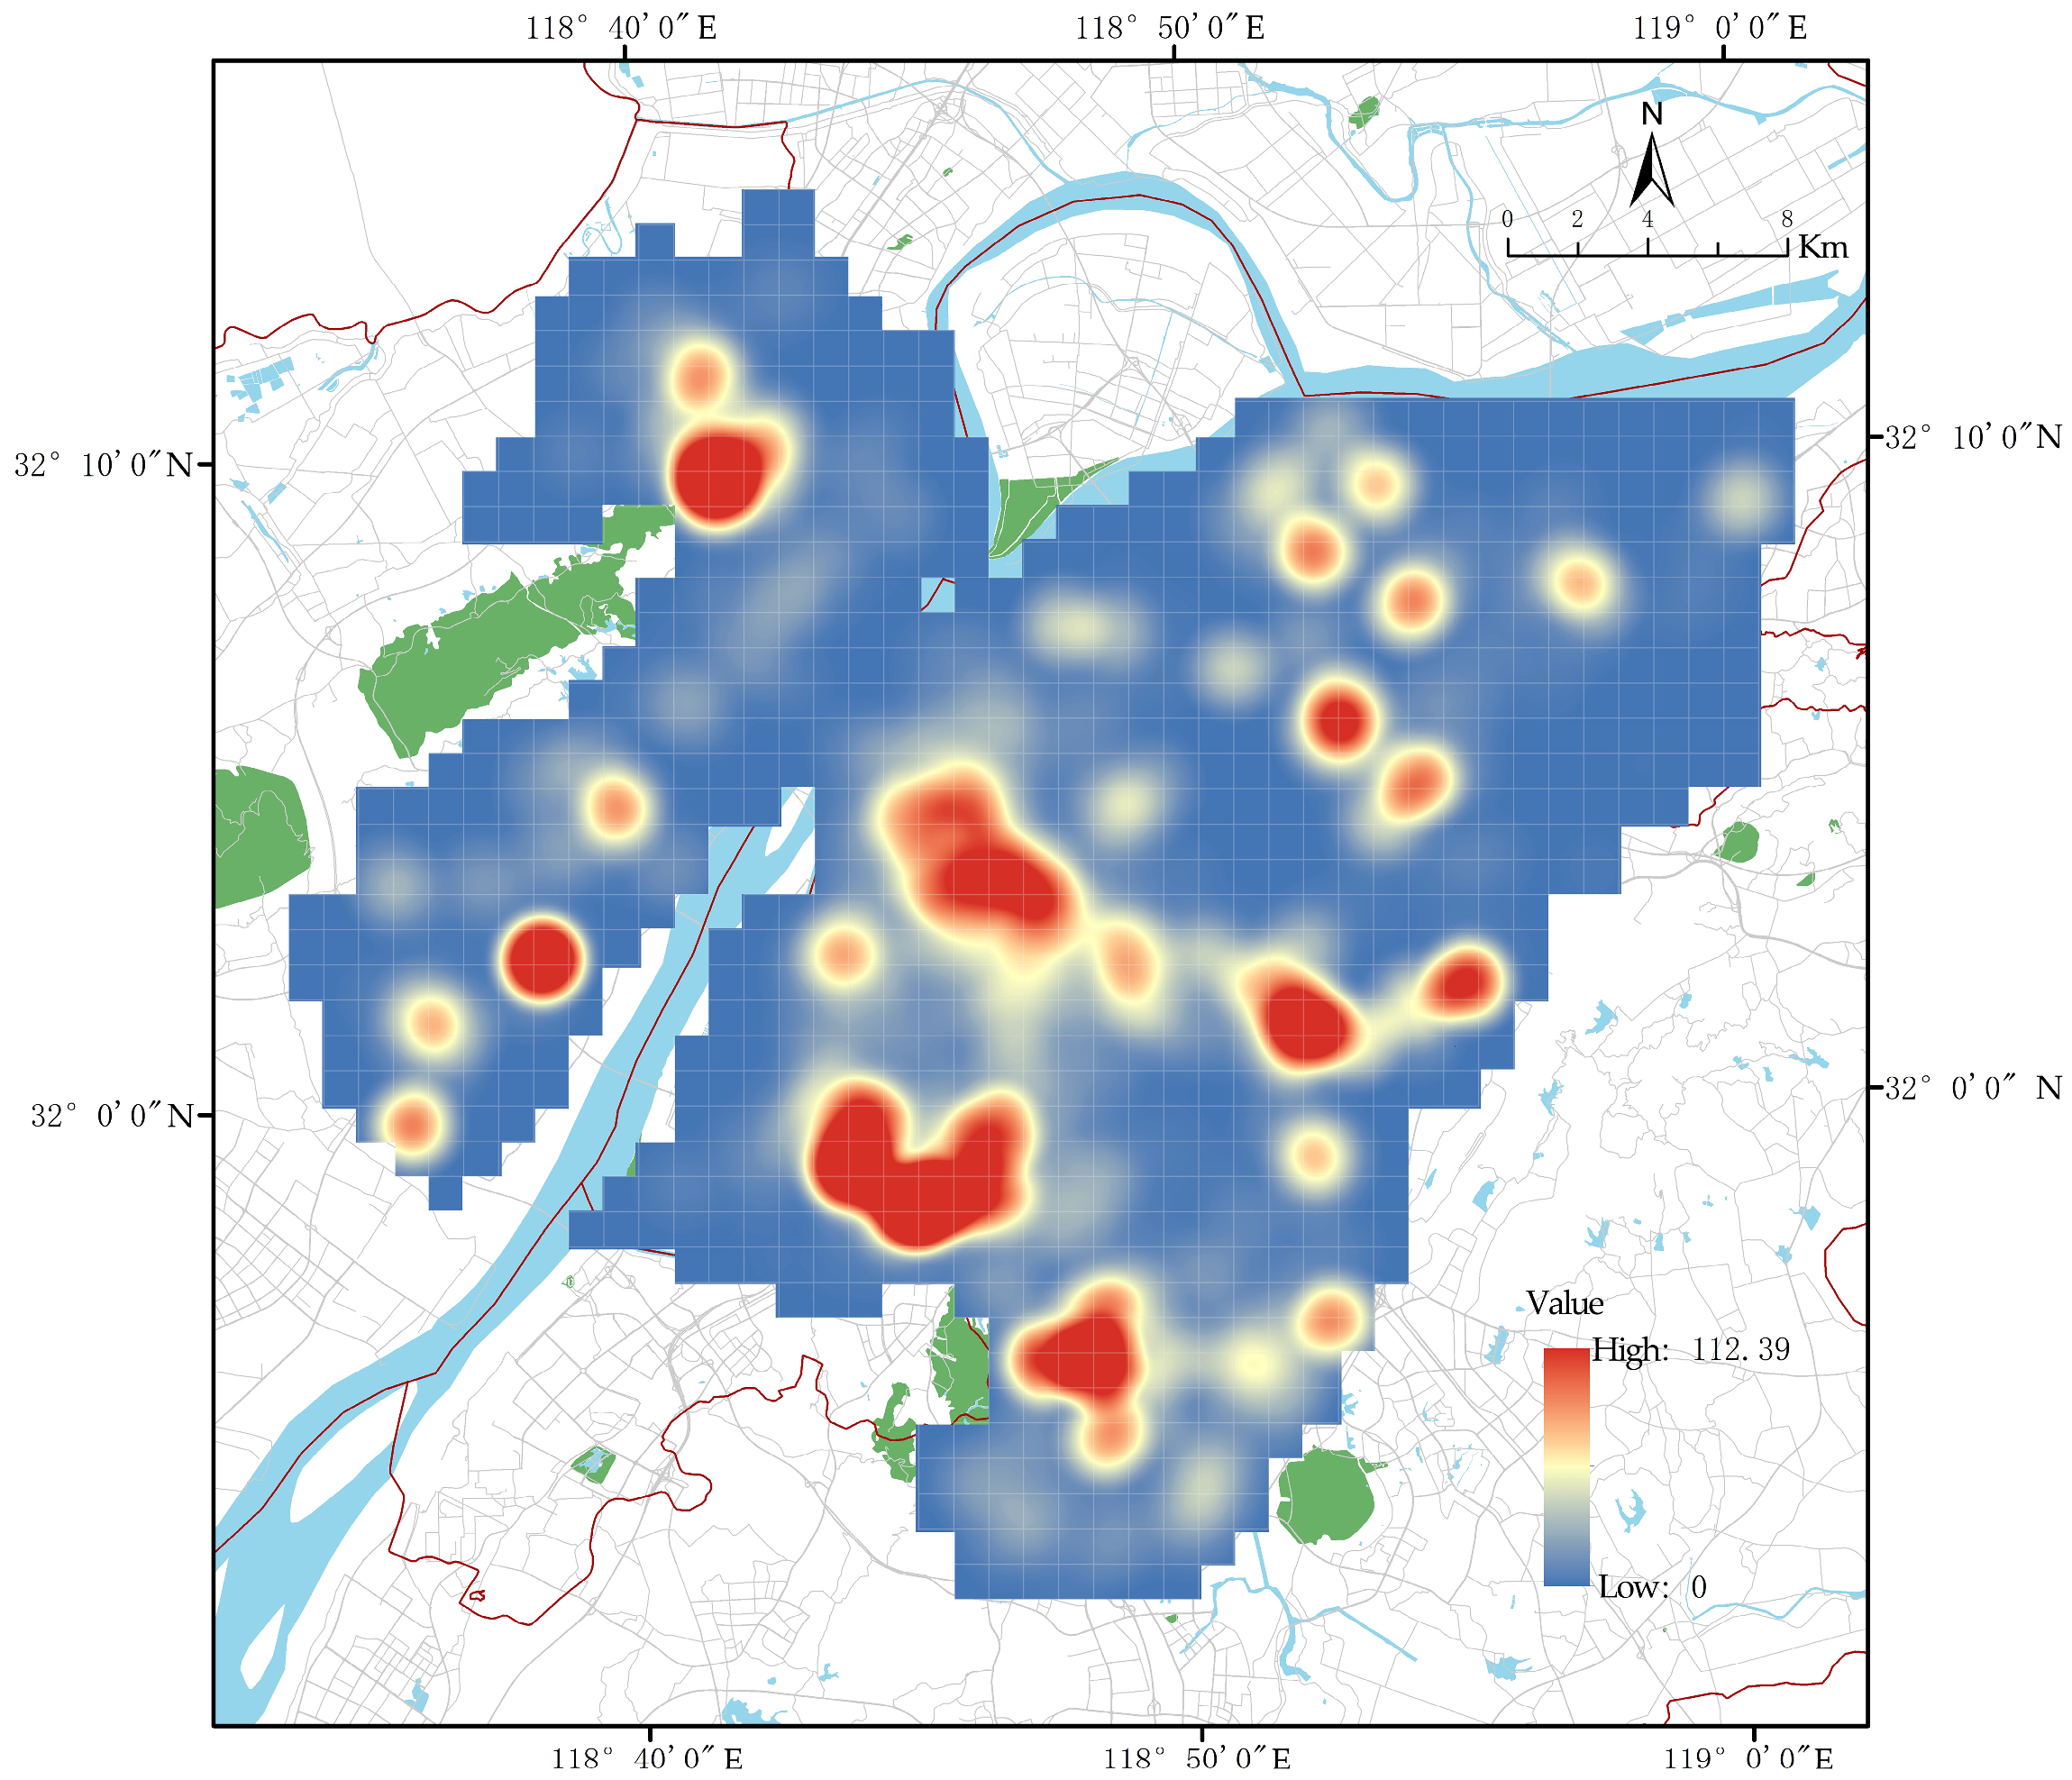
2.2.1. Innovation Space Agglomeration Measurement

The innovation entities’ data utilized in this study derive from two principal sources: government statistical panels and POI (Point of Interest) network data. Government statistics have been validated through the official registry of certified high-tech enterprises published by administrative authorities, while POI data were systematically collected from open-access platforms, including Qichacha and AutoNavi. The dataset was finalized with records up to December 2023. Through cross-validated verification against the science-technology sector in the 2023 Nanjing Statistical Bulletin on National Economic and Social Development, 7729 qualified entries were retained (Table 1). The study area was partitioned into 1000-m grid cells, totaling 917 units (Figure 1). All entities underwent geocoding via ArcGIS and were systematically mapped into the predefined square grid cells. Finally, KDE was executed to calculate innovation space agglomeration intensity values for each grid (Figure 2), which were defined as the dependent variable in the dataset.

2.2.2. Factor Selection

Empirical studies indicate that indicators for analyzing influencing factors of innovation space agglomeration encompass regional education levels, economic development status, geographical advantages, government fiscal support (e.g., FDI), corporate operational costs, public service accessibility, talent availability, and industrial ecosystem quality [37,38,39]. Given the efficacy of government regulation and the generalizability of research conclusions, this study selected influencing factors based on prior literature, applying the following screening principles: (1) Data accessibility: Indicators must be spatially distributed across all urban districts, with data obtainable at multiple scales; (2) Spatial explicitness: Variables require precise geolocation capabilities; (3) Variable independence: Selected factors must demonstrate non-overlapping causal mechanisms without direct covariance relationships. Considering that emerging factors driven by the digital era (e.g., network connectivity, digital infrastructure) lack systematic and standardized spatial data at the urban district scale, this research focused on drivers extensively validated in the literature with robust data foundations, thereby ensuring model reliability and reproducibility. Additionally, due to strong policy-induced influences on university locations and their long-term spatial stability, which renders them unsuitable as dynamic entities for innovation analysis, universities were categorized as regional innovation resource providers to evaluate their impact on agglomeration patterns.
Guided by these principles, the study selected 11 explanatory variables across five dimensions to quantify innovation space agglomeration:
  • Basic infrastructure (road accessibility, public transit networks, metro stations);
  • Research resources (universities, patents);
  • Industrial ecosystem (innovation platforms, top 100 enterprises);
  • Human capital (population distribution);
  • Cultural amenities (park-green spaces, art galleries, integrated commercial hubs).
The complete variable specifications are codified in Table 2.

2.3. Preprocessing

2.3.1. Normalization

To mitigate distortions caused by heterogeneous measurement scales across explanatory variables, a min–max normalization was applied to linearly transform all variables into the [0, 1] interval. The normalization procedure followed (Equation (1)):
z i = x i x i m i n x i m a x x i m i n
where
  • z i : Normalized value of the i -th indicator
  • x i : Original value of the i -th indicator
  • x i m i n : Minimum observed value of the i -th indicator
  • x i m a x : Maximum observed value of the i -th indicator
  • i : Index enumerating the 12 explanatory variables in this study

2.3.2. Global Spatial Autocorrelation Analysis

Global spatial autocorrelation is used to quantify the degree of spatial dependence among georeferenced observations, statistically assessing whether measured phenomena exhibit clustered, dispersed, or random distribution patterns across geographical space. As an essential preliminary diagnostic procedure prior to regression modeling, this analysis verifies the statistical significance of spatial dependency structures within the dependent variable [40,41]. This study employed Moran’s I index to evaluate spatial autocorrelation in innovation agglomeration intensity. The computation followed Equation (2):
I = n i = 1 n j = 1 n w i j ( x i X ¯ ) ( x j X ¯ ) S 2 i = 1 n j = 1 n w i j X ¯ = 1 n i = 1 n x i S 2 = 1 n i = 1 n ( x i X ¯ ) 2
where
  • I : Moran’s Index value (range: [−1, 1])
  • n : Total number of spatial observational units
  • x i , x j : Observed values at spatial units i and j , respectively
  • X ¯ : Global mean of all observed values
  • w i j : Spatial weight between units i and j
  • S 2 : Sample variance
  • Statistical inference
  • Z-score > 2.58 (equivalent to p < 0.01) indicates statistically significant spatial clustering at the 99% confidence level.
  • Interpretation: Observed spatial clustering of innovation activities rejects the null hypothesis of complete spatial randomness (CSR).

2.4. Model Selection Framework

2.4.1. Multiple Linear Regression (MLR) Model

The multiple linear regression (MLR) model, a widely utilized analytical and diagnostic tool in statistical methodologies, is used to establish predictive relationships between explanatory and dependent variables through parametric linear associations [42]. Serving as the foundational analytical framework, this study employed MLR to quantitatively assess multicollinearity among predictors, with the mathematical formulation defined as follows (Equation (3)):
y i = β 0 + β 1 x i 1 + β 2 x i 2 + + β 11 x i 11 + ε i
where
  • y i : Measured value of innovation space agglomeration intensity within the i -th spatial grid cell ( i = 1, 2)
  • β 0 : Global intercept term reflecting baseline agglomeration level
  • β 1 , β 2 , , β 11 : Partial regression coefficients quantifying the marginal effects of the 11 explanatory variables
  • ε i : Independently identically distributed (i.i.d.) error term capturing

2.4.2. Gradient Boosted Regression Tree (GBRT) Model

The gradient boosted regression trees (GBRT) model [43,44,45], an ensemble learning technique, is used to enhance regression precision through sequential training of decision trees (weak learners) and aggregating their predictions via weighted summation to model relationships between continuous dependent variables and explanatory predictors [46,47,48]. Each decision tree captures nonlinear associations through recursive binary splitting, while iteratively added trees correct residual errors from preceding stages. This error-correcting process enables precise characterization of marginal effect gradients between variables.
Within the Python 3.8 computational environment, we constructed a dataset integrating innovation agglomeration intensity with multiple explanatory variables and applied it to the GBRT framework. Optimal parameters were identified through grid search spanning training set ratios of 0.8, 0.75, and 0.7; learning rates of 0.01, 0.05, and 0.1; and maximum tree depths from 9 to 13. These parameter combinations underwent rigorous evaluation via nested cross-validation complemented by performance stability analysis. The results demonstrated that at a training set ratio of 0.7, learning rate of 0.1, and maximum tree depth of 11, the GBRT model achieved a mean R2 of 0.6974 across multiple independent splits (surpassing other depths) with the lowest coefficient of variation (0.0698). This configuration exhibited consistently sound performance, indicating relatively good predictive capability under these parameters.

2.4.3. Multiscale Geographically Weighted Regression (MGWR) Model

The multiscale geographically weighted regression (MGWR) model [49], an extension of traditional geographically weighted regression (GWR), is extensively applied in geographical sciences and spatial pattern analysis [50,51,52]. Unlike GWR, MGWR establishes localized regression equations at each spatial point by allowing explanatory variables to operate at their optimal bandwidths, thereby more accurately capturing the complexity of spatial processes. The resultant β coefficients represent spatially varying parameter estimates, whose heterogeneity quantifies non-stationarity in variable relationships across geographical space. This capability enables explicit identification of scale-dependent drivers in spatial systems. In this study, MGWR was implemented using MGWR 2.2 software with grid centroid coordinates used as spatial anchors. Model diagnostics were included using confidence intervals, adjusted R2, Akaike information criterion (AIC), and p-values. Spatially explicit β surfaces were generated by associating spatial association coefficients with grid centroids and visualized via adaptive kernel interpolation.

2.4.4. Methodology Framework

Building upon the technical strengths of the aforementioned models (MLR, GBRT, MGWR), this study adopted a three-phase analytical workflow:
  • Stage 1: Collinearity Diagnostics:
    The MLR model was employed for collinearity diagnostics among influencing factors, establishing prerequisite conditions for subsequent analyses [53].
  • Stage 2: Nonlinear Relationship Identification:
    The GBRT model was used to detect potential nonlinear associations between influencing factors and innovation space agglomeration intensity, while quantifying statistical significance and marginal effects.
  • Stage 3: Spatial Heterogeneity Analysis:
    The MGWR model was constructed with the dataset to investigate spatial differentiations in contributions from distinct influencing factors to innovation space agglomeration across geographical units.
The specific procedures implemented in this study, along with the software tools employed, were as follows (Figure 3):

3. Results

3.1. Collinearity Diagnostics of Influencing Factors

An ordinary least squares (OLS) regression model was developed in ArcGIS to examine relationships between influencing factors and innovation space agglomeration intensity. Key diagnostics showed the following (Table 3): (1) statistically significant associations (Koenker’s BP statistic and joint Wald statistic were significant with p-values < 0.01); (2) no critical multicollinearity (variance inflation factors were <7.5 across all influencing factors); (3) moderate explanatory capacity (adjusted R2 = 0.568), which demonstrated the necessity of integrating GBRT and MGWR models to reveal nonlinear dynamics and spatial heterogeneity.

3.2. Analysis of Influencing Factors, Contribution Significance, and Marginal Effects

The GBRT model effectively visualizes the continuous coupling dynamics between influencing factors and innovation space agglomeration. This study constructed a regression model using the GBRT algorithm in PyCharm 2024.2 to analyze the marginal effects of relevant factors. Computational results demonstrated optimal model performance with a test set ratio of 0.3, learning rate of 0.1, and maximum tree depth of 11, yielding an R2 of 0.679, mean squared error (MSE) of 37.851, explained variance (EV) of 0.682, and mean absolute error (MAE) of 3.929, indicating robust model fit. Figure 4 illustrates the relative influence curves derived from the GBRT model, where the horizontal axis represents standardized values of influencing factors and the vertical axis shows the relative change in predicted innovation space agglomeration intensity.
Additionally, to independently quantify the relative contribution weights of influencing factors, this study further applied the SHAP (Shapley additive explanations) model analysis to determine each factor’s influence weight on innovation space agglomeration. The results demonstrated that innovation platforms exhibited the highest contribution at 39.0%, followed by patent distribution at 15.8%, while park-green spaces showed the lowest contribution at only 2.1%. In terms of factor categories, the industrial ecosystem had a total contribution of 41.5%, research resources accounted for 24.7%, and both basic infrastructure and cultural amenities displayed similar contribution levels at 14.7% and 14.4% respectively.
Given the potential for algorithm overfitting, a comprehensive analysis using marginal effect curves and joint confidence intervals identified significant nonlinear effects of influencing factors on innovation space agglomeration. The influencing factors were categorized into five types according to their action trends, as follows:
  • First item: Sustained growth pattern
The fitted curve of the innovation platforms showed an overall fluctuating upward trajectory, indicating a significant facilitating effect on innovation space agglomeration with persistently increasing marginal effects. This phenomenon is primarily attributed to the scale effects, cost efficiencies, and abundant innovation resources inherent in the platform’s industrial clusters, which exhibit strong magnetic attraction for innovation actors. Driven by the gravitational pull of industrial clustering, heterogeneous innovation actors are drawn toward these hubs, resulting in hyper-concentration of innovation resources and intensive knowledge spillovers. Such agglomeration effects not only optimize the allocative and operational efficiency of resources but also catalyze the rapid commercialization and industrial scaling of innovation outputs. Meanwhile, the accelerated marketization of these outcomes revitalizes the platform’s sustainable development while reciprocally enhancing regional innovation capacity through positive feedback loops. This virtuous cycle is continuously reinforced between the innovation platforms and spatial actors, establishing a robust foundation for high-quality development of the innovation-driven economy [54].
2.
Second item: Growth-stabilization pattern
Patents, metro stations, road accessibility, and art galleries displayed similar impact trends on innovation space agglomeration. The fitted curves initially showed fluctuating upward trajectories, indicating progressive marginal effect enhancement. When their agglomeration levels reached critical thresholds (0.15, 0.4, 0.55, and 0.12, respectively), the promotive effects stabilized, with effect capacities achieving saturation or critical ranges, after which innovation space agglomeration intensity remained stable.
3.
Third item: Growth-decline pattern
Both integrated commercial hubs and top 100 enterprises exhibited impact curves on innovation space agglomeration intensity characterized by initial fluctuating upward trajectories, followed by gradual declines after surpassing critical thresholds. The fitted curve for integrated commercial hubs revealed that innovation space agglomeration intensity increased progressively with commercial agglomeration levels during the incubation period, peaking at a threshold of 0.13. The subsequent decline is attributed to sustained commercial density growth, escalating land prices and rents, which increased operational costs for innovation-intensive enterprises and ultimately manifested spatial displacement effects.
Analysis of the confidence intervals for the top 100 enterprises reveals bimodal peaks at agglomeration levels of approximately 0.05 and 0.13, beyond which marginal effects diminish. This pattern likely stems from industrial structure characteristics: High-tech enterprises constitute only 52.4% of Nanjing’s Top 100 Enterprises, notably lower than Shenzhen (68.3%), Hangzhou (63.7%), and Beijing (71.2%). The higher proportion of traditional industries attracts linked upstream and downstream sectors with relatively low innovation density. As agglomeration intensity increases, these structural constraints progressively limit contributions to innovation-driven economies, ultimately manifesting as significantly weakened promotive effects on innovation spatial clustering.
Universities initially displayed anomalous declines (potential artifacts from kernel density interpolation), which were excluded from primary analysis. Posterior data demonstrated that university-driven agglomeration effects on innovation space first increased, reaching maximal impact at an agglomeration intensity of 0.12 before attenuation. The influence of universities is fundamentally shaped by three determinants: institutional capacity, disciplinary configuration, and resource allocation efficiency. While certain university clusters achieve effective innovation resource agglomeration through robust industry–academia integration and industrial synergy mechanisms, thereby enhancing innovation space agglomeration, others fail to realize their potential due to ill-defined functional positioning or inadequate coordination frameworks. These disparities highlight the necessity for a systematic investigation into concrete spatial distribution patterns.
4.
Fourth item: Global stabilization pattern
In contrast to other determinants, park-green spaces exhibited a marginal effect curve characterized by global stability, indicating that increased investment in park infrastructure failed to induce significant fluctuations in the agglomeration effects of innovation spaces. This finding aligns with existing research conclusions, as central urban park green spaces primarily serve leisure provision and ecological regulation functions, exhibiting limited attractiveness to innovation entities [35,55]. Furthermore, the analysis confirms the relatively low contribution of Nanjing’s park systems to promoting the agglomeration of innovation-driven economic activities.
5.
Fifth item: Global fecline pattern
As the agglomeration levels of the public transit network and population density increased, their contribution to innovation spatial agglomeration manifested a trend of gradual decline in marginal effects. This finding contradicts conventional wisdom. On one hand, it may indicate that in Nanjing central urban area, the development level of the public transit network and population density had already reached relatively high values at the study’s baseline year, and their promoting effect on innovation spatial agglomeration had approached saturation. That is to say, enhancing public transit convenience or increasing population density in this region exerts a weak effect on innovation spatial agglomeration. On the other hand, further observation also reveals that high-density areas of the public transit network and population are highly overlapped in the central district, where high land prices and rents present a repelling effect on innovation spaces.

3.3. Spatial Differentiation Characteristics of Marginal Effects in Influencing Factors

3.3.1. Analysis of Model Computational Results

Investigating the spatial heterogeneity of influencing factors’ contributions to innovation space agglomeration provides foundational insights for municipal governments to implement context-specific policies and optimize innovation resource allocation. Building upon the preceding marginal effect analysis, this section constructed an MGWR model using MGWR 2.2 to further explore the geographic manifestation of contributions. The analytical results demonstrated an adjusted R2 = 0.874, a residual sum of squares (RSS) = 96.759, a log-likelihood = −270.052, and an Akaike information criterion (AIC) = 897.981, which collectively confirmed robust model fitting performance. Additionally, to verify the effectiveness of the MGWR model in handling spatial dependence, the study applied a spatial weight matrix to conduct a Moran’s I test on model residuals. Under an appropriately defined spatial weight (distance threshold = 0.02), the spatial autocorrelation test of residuals yielded Moran’s I = 0.0018 (p = 0.8526), indicating no significant spatial dependence. This demonstrated that the model effectively captured the spatial structural characteristics of the data.
Concurrently, the MGWR model passed the Monte Carlo test (MCT) for spatial variability [56], with coefficient statistics revealing three critical findings (Table 4): (1) Universities, art galleries, integrated commercial hubs, patents, and innovation platforms exhibited statistically significant spatial heterogeneity (p < 0.05) in their contributions to innovation space agglomeration; (2) Bandwidth values demonstrated an inverse relationship with spatial heterogeneity: smaller bandwidths indicated stronger spatial variation in explanatory variables’ impacts. Notably, the innovation platform showed the minimum bandwidth, reflecting the highest spatial heterogeneity in contribution; (3) Standard deviation (SD) quantified spatial divergence, where larger SD values corresponded to greater locational disparities in contributions. Art galleries displayed the maximum SD (highest spatial variability), while innovation platforms and integrated commercial hubs manifested relatively stable spatial patterns [52].

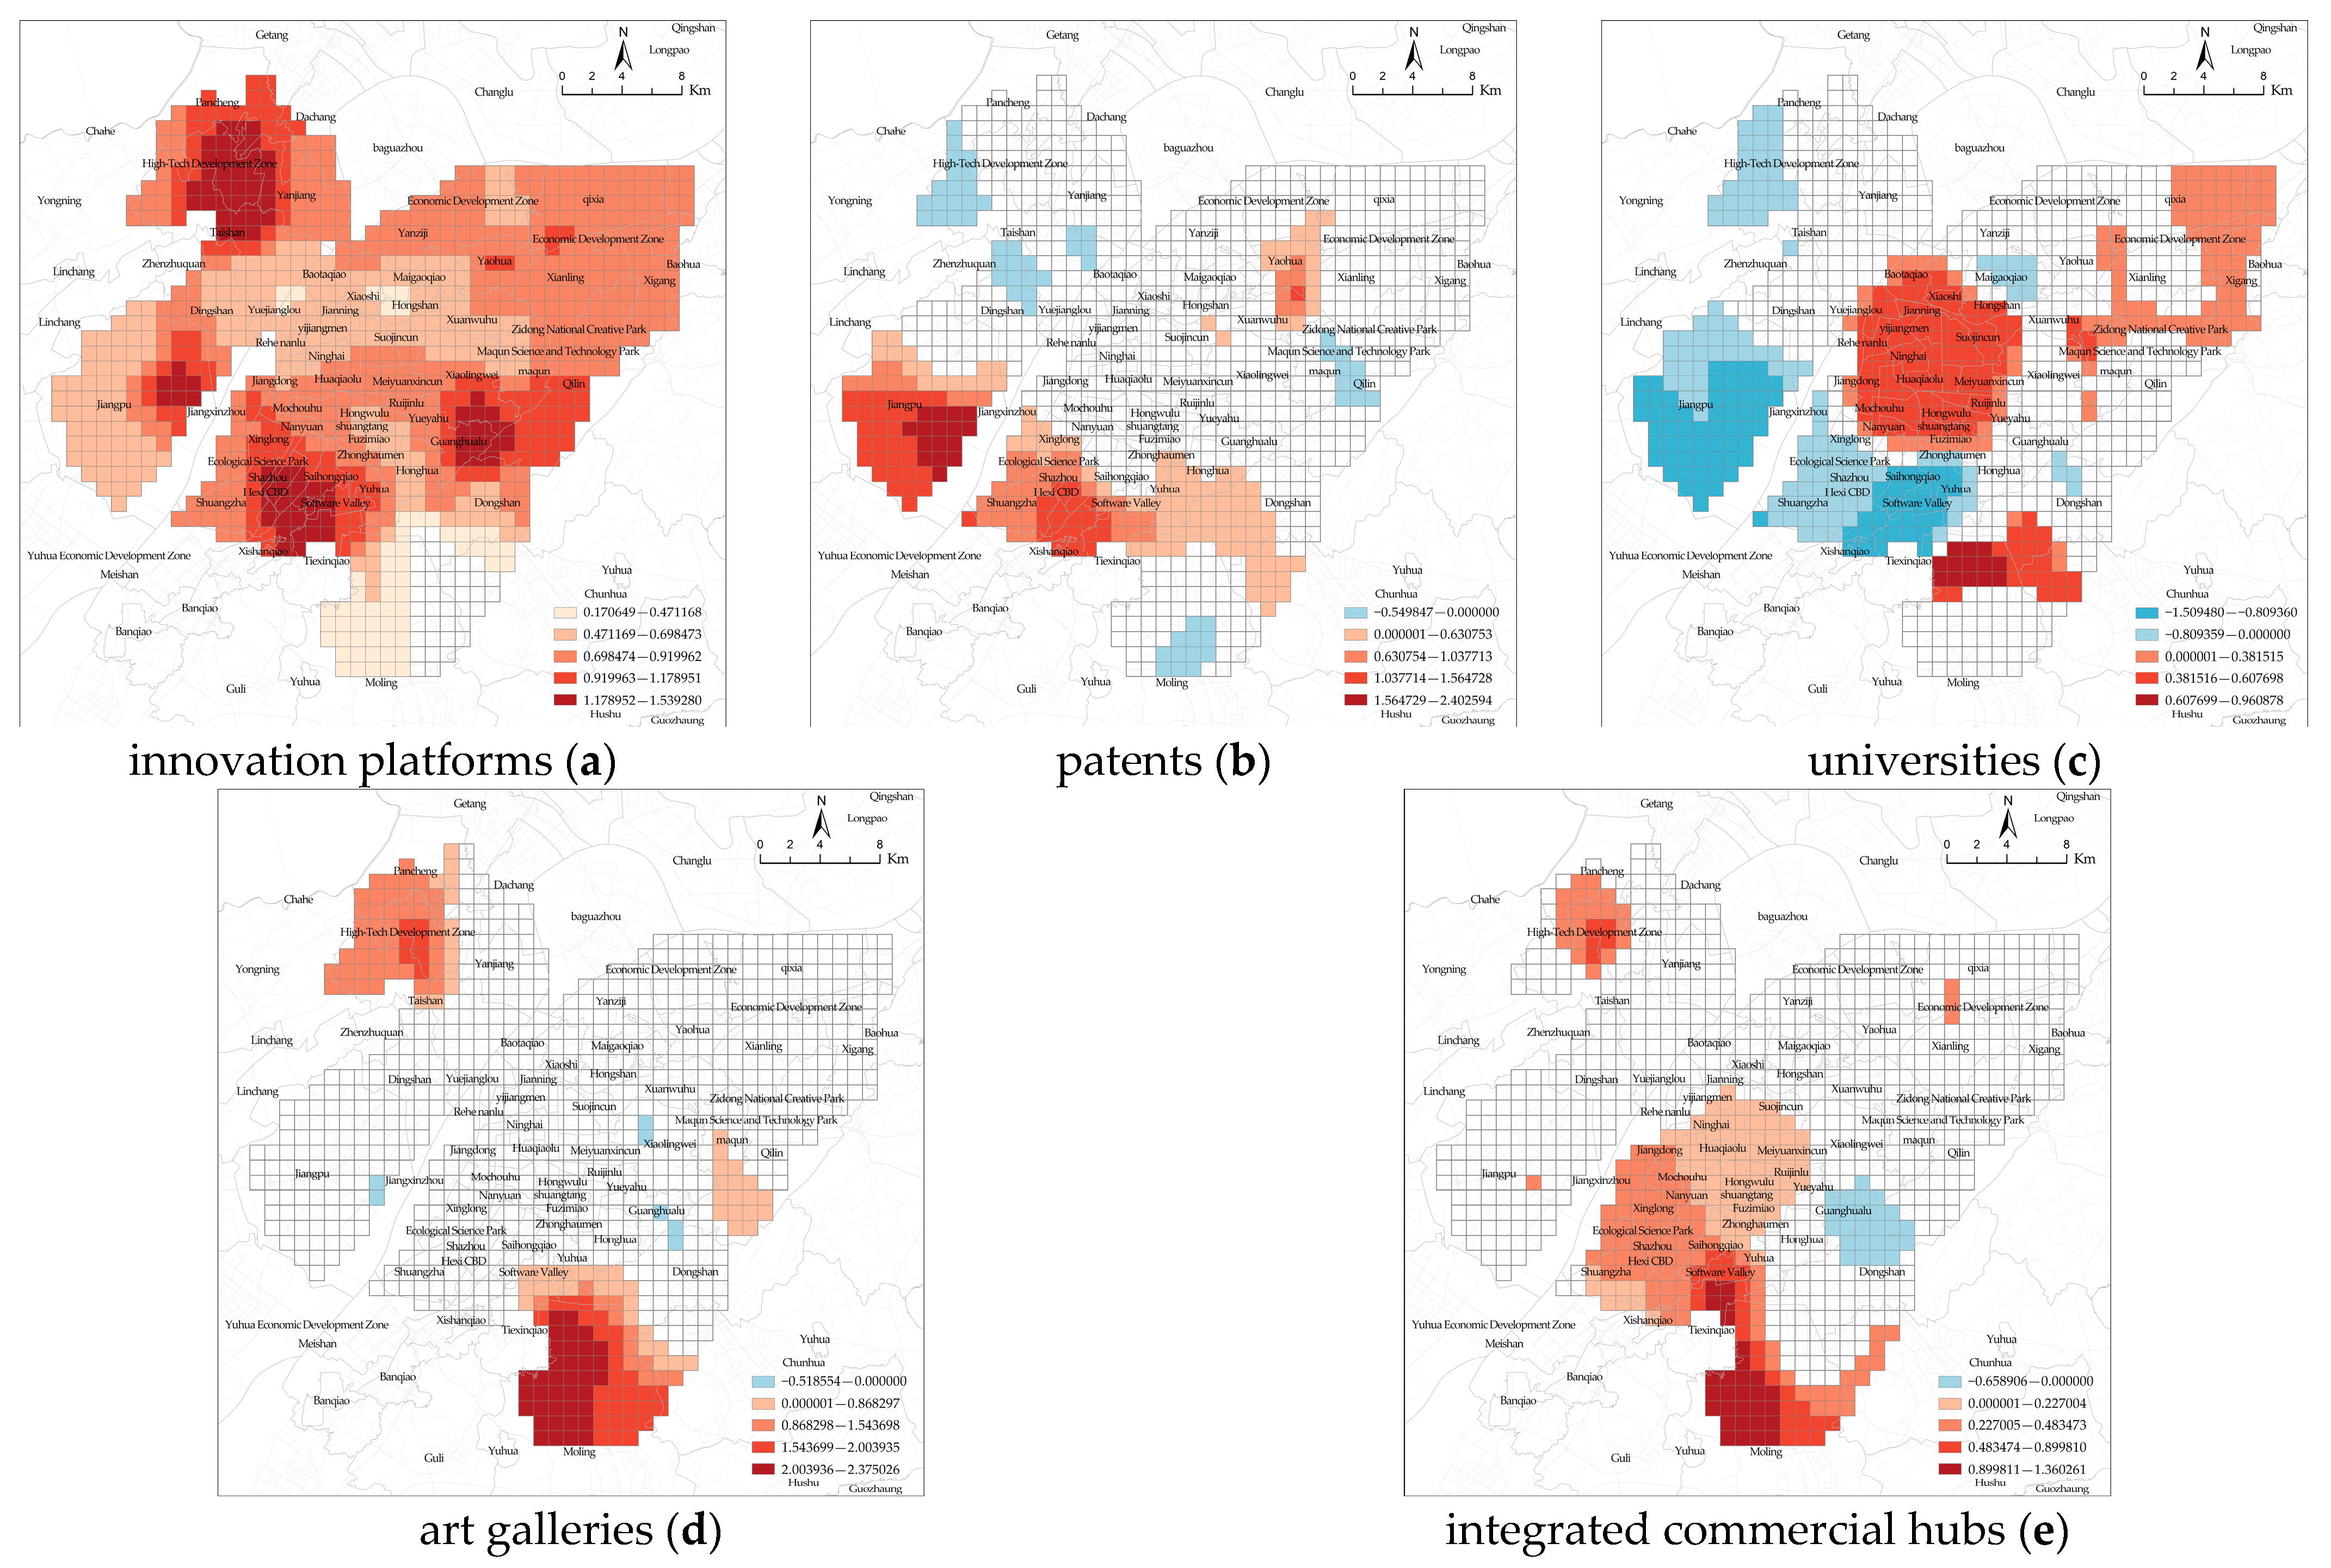
3.3.2. Spatial Differentiation in Contributions of Influencing Factors

Visualization was applied to statistically significant regression coefficients (beta values with p < 0.05) to analyze spatial variations across influencing factors. The absolute values of regression coefficients quantified the magnitude of explanatory variables’ effects on innovation space agglomeration, while the positive and negative signs of coefficients indicated the direction of impacts (Figure 5).
  • First item: Industrial ecosystem analysis
The spatial influence of the innovation platforms exhibited a polycentric distribution pattern, with high-impact zones concentrated in Hexi Central Business District (CBD), Jiangpu Subdistrict, High-Tech Development Zone, and the transitional zone between southern Xiaolingwei Subdistrict and eastern Guanghua Road Subdistrict, showing a gradual decline from core zones to peripheral areas. Notably, Qixia District exhibited elevated innovation platforms’ impact levels but did not form distinct spatial nuclei. This may be attributed to the region’s lack of effective agglomeration mechanisms and strategies, despite its abundance of innovation resources and solid industrial foundation. The absence of such mechanisms ultimately leads to the failure of the overall influence to manifest as polarized nuclei.
2.
Second item: Research resources analysis
The positive influence of patents was predominantly concentrated in Jiangpu Subdistrict, the northwestern belt extending from Hexi Central Business District to Chunhua Subdistrict, and the junction areas of Yaohua, Xuanwu Lake, and Xianlin Subdistricts. The high-impact zones of universities were located at the intersection of Dongshan and Moling Subdistricts. This stems from the dense clustering of universities adjacent to Jiangning University Town, which has established itself as a regional hub for educational resources. Jiangning University Town, specializing in science, engineering, and medical disciplines, emphasizes strong industry-academia-research integration and demonstrates robust capacity for innovation incubation and commercialization. This knowledge spillover mechanism enhances interdisciplinary collaboration and talent development, while attracting innovation entities to cluster around campuses to leverage academic research strengths for frontier knowledge acquisition and technological advancement. Consequently, innovation efficiency is elevated, and industrialization of research outcomes accelerates.
In contrast, Xianlin University Town, dominated by humanities, social sciences, and business disciplines, exhibits weaker agglomeration and diffusion capabilities due to low commercialization rates and limited resource openness. Its ring-shaped spatial distribution centered on the university town shows constrained radiation effects compared to Jiangning. Moreover, although older urban centers host dense university clusters, their outdated campuses exhibit a moderately lower capacity to attract innovation activities compared to Jiangning University Town, due to insufficient resource allocation.
3.
Third item: Cultural amenities analysis
High-impact zones of art galleries were primarily concentrated in the northern Moling Subdistrict, with influence intensity showing a gradual decline from the southwest to the northeast. Secondary influence clusters were observed in Qilin and Maqun Subdistricts, albeit with reduced magnitude. The influence centers of integrated commercial spaces partially overlapped with those of art galleries, peaking in northern Moling Subdistrict, and declining northwestward toward Jiangxinzhou Subdistrict.
In contrast, the older urban centers exhibited weaker influence on innovation agglomeration due to high land prices. Notably, both art galleries and integrated commercial spaces exerted significant influence on high-tech innovation centers and their surrounding areas.

4. Conclusions

Based on the aforementioned analytical framework, the key findings are delineated as follows:
(1) Influencing factors exhibited significant differences in contributions to innovation space agglomeration. Innovation platforms had the highest contribution (39.0%). Patents followed with 15.8%, while park-green spaces showed the lowest contribution (2.1%). Industrial environment (41.5%) and research resources (24.7%) together account for 66.2% of total contributions. This indicates their advantages in promoting regional innovation agglomeration.
(2) The relationships between influencing factors and innovation space agglomeration demonstrated nonlinear characteristics. These relationships were classified into five modes:
  • Sustained growth pattern (innovation platforms);
  • Growth-stabilization pattern (patents; metro stations; road accessibility; art galleries);
  • Growth-decline pattern (integrated commercial hubs; top 100 enterprises; universities);
  • Global stabilization pattern (park-green spaces);
  • Global decline pattern (public transit networks; population distribution).
The analysis indicates that when influencing factors reach spatial layout thresholds, their influence mechanisms on innovation space agglomeration shift. Different factors’ marginal effects stabilize or decline under these conditions.
(3) Contributions of influencing factors displayed spatial heterogeneity. Innovation platforms formed multi-core high-value zones in Hexi and Jiangbei New District. Research resources (patents; universities) showed strong contributions in the Jiangning surrounding areas but weaker effects in Qixia and older urban centers. Cultural facilities (art galleries; integrated commercial hubs) demonstrated significant promotion in the Muling area, whereas their contributions declined in older urban centers.

5. Discussion

5.1. Further Discussion

Through analyzing the contributions and marginal effects of different influencing factors to innovation space agglomeration, three critical insights emerge:
(1) Compared with traditional production elements, knowledge-based influencing factors (e.g., innovation platforms, patents, and art galleries) demonstrate stronger innovation-driving capabilities. Innovation platforms and art galleries enhance the carrying capacity of innovation spaces through resource agglomeration and synergy effects, while patents improve innovation efficiency via technology transfer and application. These knowledge-based elements possess high added value and renewability, enabling long-term sustainable development of the innovation economy by stimulating innovation potential and promoting knowledge accumulation.
(2) The GBRT model reveals nonlinear relationships between influencing factors and innovation space agglomeration. Unlike traditional regression models, the GBRT model does not directly provide significance tests. Instead, marginal effect curves visually illustrate dynamic changes in influence intensity across varying factor levels. This finding highlights the dynamicity and complexity of urban innovation ecosystems, offering a novel perspective for optimizing innovation resource allocation. It holds significant reference value for innovation policy formulation and improving the efficiency of urban innovation economic development.
(3) In both multivariate regression and MGWR model analyses, certain influencing factors (e.g., public transit network density, population density) manifested statistically significant negative effects. We posit that these factors do not inherently inhibit innovation in spatial agglomeration. The phenomenon essentially represents contribution attenuation under high-intensity agglomeration, where, beyond critical density thresholds, their marginal driving effects on innovation exhibit significant diminishing returns. This pattern may be interpreted through two potential mechanisms:
  • Saturation Effect Dominance:
    During the baseline period, the density levels of these factors had already reached elevated levels, resulting in minimal marginal innovation benefits from further density increases.
  • Cost Pressure Trigger:
    High-density zones of these factors demonstrate strong spatial coupling with central districts, where consequential high land prices and rental costs compress operational space for innovation agents (particularly startups).
The synergy of these mechanisms generates observed negative coefficients, revealing the complexity of innovation drivers: factor contributions dynamically reverse direction contingent on their intensity and regional development stage. This finding not only provides critical empirical evidence for structural constraints in high-density urban innovation systems (e.g., innovation momentum decay in central districts), but also establishes theoretical anchors for differentiated regional policies (environmental optimization in urban cores versus infrastructure reinforcement in new development areas).
Additionally, while the MGWR model can capture nonlinear relationships in local areas, some regions exhibit negative significance. This should not be simplistically interpreted as suppression effects. Since the selected influencing factors are inherently positive drivers, the negative impacts likely stem from kernel density interpolation artifacts during statistical processing. Specifically, in areas far from the center of influencing factors, interpolation results may directly generate negative effects in peripheral zones due to the inherent limitations of the method.

5.2. Policy Recommendations

5.2.1. Innovation Resource Integration Optimization

Empirical analysis of spatial heterogeneity among influencing factors reveals that innovation spatial agglomeration is subject to nonlinear dynamic effects and regional characteristics. Governments can leverage these findings to implement place-specific policies driving efficient integration and sharing of innovation resources, with strategic approaches differentiated according to regional development foundations and constraints.
For high-value zones in innovation platforms and patent influence (e.g., Hexi CBD, Jiangning Hi-Tech Park), policy focus should shift toward optimizing existing resource synergy and deepening industry-university-research collaboration networks. Enhanced spatial coordination around Jiangning University Town is critical, with particular emphasis on universities demonstrating science and engineering strengths, research institutes, and enterprises to accelerate technology transfer and diffusion, thereby consolidating regional innovation leadership while catalyzing developmental capacity escalation.
In areas possessing moderate innovation foundations yet fragmented agglomeration patterns (e.g., Qixia District), the core strategy involves establishing efficient horizontal linkage mechanisms to dismantle information barriers between key nodes such as Xianlin University Town and Heavy Industry Park. This facilitates the aggregation of scattered technological resources to form sustainable innovation nuclei. Concurrently, deliberate cultivation of emerging innovation platforms in urban fringe areas should be pursued, with tailored supporting facilities developed to accommodate growth-stage enterprises, capitalizing on distinctive regional advantages.
Regarding mature urban cores (e.g., older urban centers), rigorous cost-benefit analysis of new resource investments is warranted. Policy emphasis should prioritize optimizing utilization efficiency and service functions of existing spaces, strategically revitalizing current assets to enhance their attractiveness to innovation activities.

5.2.2. Regional Spatial Quality Enhancement

Enhancing regional spatial quality constitutes a critical mechanism for attracting and retaining innovation resources, necessitating coordinated optimization across physical environments, social networks, cultural assets, and institutional frameworks. Aligning with Florida’s 4T Theory, governments should prioritize interventions in Talent, Technology, Inclusivity, and Transportation to fulfill Nanjing’s strategic requirements for industrial transformation and upgrading [12].
Talent Development. In academic talent clusters (e.g., Jiangning University Town periphery), residential and commercial facilities require synchronous upgrading to enhance regional stickiness. Where land cost constraints prevail (e.g., older urban centers), implement multi-tiered talent policies—including research grants, targeted subsidies, and affordable housing—under the “prudent optimization” framework to alleviate living and entrepreneurial burdens.
Technology Dimension. Capitalize on Jiangning University Town’s industry-university-research collaboration and science and engineering strengths to establish regional innovation demonstration zones. In Xianlin University Town and comparable areas, strengthen technology transfer mechanisms, with particular attention to humanities and social sciences, while expanding resource accessibility to activate knowledge spillover potential. Concurrently, intensify intellectual property operations and market development in high-patent-impact zones (e.g., Jiangpu Subdistrict).
Inclusivity Cultivation. In areas where cultural and recreational facilities significantly boost innovation vitality (e.g., Hi-Tech Development Zone periphery, northern sector of Moling Subdistrict), focus on quality refinement and ecosystem cultivation through avant-garde events and creative community support. Where cultural impacts remain limited, stimulate diversified offerings leveraging local distinctiveness to foster pluralistic, open, and inclusive innovation environments.
Transportation Optimization. Augment infrastructure investment in urban fringe areas, prioritizing enhanced physical connectivity efficiency between fringe zones, industrial districts, and core resource clusters (encompassing universities, innovation platforms, and commercial-cultural hubs). Synchronously accelerate the deployment of digital infrastructure and smart service platforms to enable real-time data and knowledge sharing, partially overcoming constraints of physical distance and developmental disparities.

5.3. Future Outlook

This study systematically reveals statistical correlations and spatial heterogeneity in innovation agglomeration using cross-sectional data and classical variables, yet limitations persist in causal mechanism identification, variable comprehensiveness, conclusion generalizability, and dynamic evolution analysis. Future research should first employ panel data covering continuous years to construct fixed-effects or difference-in-differences models. Researchers should establish treatment and control groups through natural experiments such as new district establishment or major project initiation to rigorously identify causal effects on innovation agglomeration. To deepen understanding of agglomeration drivers, emerging indicators, including coworking space density, startup network connectivity, and digital infrastructure coverage, must be incorporated into classical variable frameworks. This expansion will capture spatial moderating effects while enabling investigation into contribution heterogeneity mechanisms within complex future scenarios, particularly innovation enclaves in transforming industrial zones and innovation spillovers in digital infrastructure-advanced areas.
Furthermore, given Nanjing’s unique status as a first-tier innovation hub, generalizing findings requires comparative validation across Chinese Tier-2 cities, less-developed western regions, and globally representative innovation hubs. Such validation will assess how industrial foundations, factor mobility efficiency, and policy environments influence agglomeration thresholds and contribution rankings, clarifying applicability boundaries and policy adaptation pathways. Future studies should also integrate economic activity metrics (innovation output growth rates, investment flows, and land values) within geographically and temporally weighted regression frameworks. This integration will dissect spatiotemporal evolution and interaction mechanisms, enhancing model predictive accuracy and theoretical explanatory power. These integrated strategies will provide robust theoretical and empirical foundations for advancing innovation agglomeration research, expanding driver perspectives, and optimizing urban innovation ecosystems.

Author Contributions

Conceptualization, C.W. and R.L.; methodology, C.W. and R.L.; software, C.W.; validation, C.W. and L.Z.; formal analysis, L.Z.; investigation, L.Z.; resources, C.W. and L.Z.; data curation, L.Z.; writing—original draft preparation, C.W.; writing—review and editing, R.L.; visualization, C.W.; supervision, R.L. All authors have read and agreed to the published version of the manuscript.

Funding

This research received no external funding.

Data Availability Statement

The data are not publicly available due to being part of an ongoing study.

Conflicts of Interest

The authors declare no conflicts of interest.

References

  1. Romer, P.M. Increasing Returns and Long-Run Growth. J. Political Econ. 1986, 94, 1002–1037. [Google Scholar] [CrossRef]
  2. Romer, P.M. Endogenous Technological Change. J. Political Econ. 1990, 98, 32–36. [Google Scholar] [CrossRef]
  3. Lucas, R.E. On the mechanics of economic development. Quant. Macroecon. Work. Pap. 1999, 22, 3–42. [Google Scholar] [CrossRef]
  4. Zhang, J.X.; He, H.M. Beyond Growth:Innovation of Spatial Planning to Address Innovative Economy. City Plan. Rev. 2019, 43, 18–25. [Google Scholar]
  5. Jing, J. Innovation Districts Driving Urban Regeneration: Components, Dynamics, and Development Strategies. Seeker 2022, 42, 111–121. [Google Scholar] [CrossRef]
  6. Ning, S. The Study of the Trends for the Development of Innovation Space in American Metropolitan Areas. Urban Dev. Stud. 2016, 23, 50–55. [Google Scholar]
  7. Marshall, A. Principles of Economics Macmillan, 8th ed.; Palgrave Macmillan: London, UK, 1890; Volume 3. [Google Scholar]
  8. Arrow, K.J. The Economic Implications of Learning by Doing. Rev. Econ. Stud. 1971, 29, 155–173. [Google Scholar] [CrossRef]
  9. Jacobs, J. The Economy of Cities; Vintage: New York, NY, USA, 1969. [Google Scholar]
  10. Porter, M.E. Clusters and the new economics of competition. Harv. Bus. Rev. 1998, 76, 77–90. [Google Scholar]
  11. Florida, R. The Rise of the Creative Class; Basic Books: New York, NY, USA, 2002; Volume 9. [Google Scholar]
  12. Florida, R. Who’s Your City? How the Creative Economy Is Making Where to Live the Most Important Decision of Your Life; Review of Culture & Economy; Basic Books: New York, NY, USA, 2008. [Google Scholar]
  13. Glaeser, E.L.; Kallal, H.D.; Scheinkman, J.A.; Shleifer, A. Growth in Cities. J. Political Econ. 1992, 100, 1126–1152. [Google Scholar] [CrossRef]
  14. Gehl, J. Life Between Buildings: Using Public Space; Van Nostrand Reinhold: New York, NY, USA, 2003. [Google Scholar]
  15. Putnam, R.D. Bowling Alone: The Collapse and Revival of American Community; Simon and Schuster: New York, NY, USA, 2000. [Google Scholar]
  16. Etzkowitz, H.; Leydesdorff, L. The dynamics of innovation: From National Systems and “Mode 2” to a Triple Helix of university–industry–government relations. Res. Policy 2000, 29, 109–123. [Google Scholar] [CrossRef]
  17. Rosenbloom, J.L. The Geography of Innovation Commercialization in the United States During the 1990s. Univ. Kans. Dep. Econ. 2007, 21, 3–16. [Google Scholar] [CrossRef]
  18. Malecki, E.J. Cities and Regions Competing in the Global Economy: Knowledge and Local Development Policies. Environ. Plan. C Gov. Policy 2007, 25, 638–654. [Google Scholar] [CrossRef]
  19. Bereitschaft, B. Exploring the Spatial Intersection of Small Firm Innovation, Urban Form, and Demographics in the Washington, DC, Metropolitan Area. Prof. Geogr. 2023, 75, 1006–1023. [Google Scholar] [CrossRef]
  20. Johnston, A.; Huggins, R. The Spatio-Relational Nature of Urban Innovation Systems: Universities, Knowledge Intensive Business Service Firms, and Collaborative Networks. J. Urban Technol. 2016, 23, 29–52. [Google Scholar] [CrossRef]
  21. Esmaeilpoorarabi, N.; Yigitcanlar, T.; Guaralda, M.; Kamruzzaman, M. Does place quality matter for innovation districts? Determining the essential place characteristics from Brisbane’s knowledge precincts. Land Use Poilcy 2018, 79, 734–747. [Google Scholar] [CrossRef]
  22. Herstad, S.J.; Ebersberger, B. Urban agglomerations, knowledge-intensive services and innovation: Establishing the core connections. Entrep. Reg. Dev. 2014, 26, 211–233. [Google Scholar] [CrossRef]
  23. Bradley, B. Do “creative” and “non-creative” workers exhibit similar preferences for urban amenities? An exploratory case study of Omaha, Nebraska. J. Urban. Int. Res. Placemaking Urban Sustain. 2016, 10, 198–216. [Google Scholar] [CrossRef]
  24. Katz, B.; Wagner, J. The Rise of Innovation Districts: A New Geography of Innovation in America; Metropolitan Policy Program at Brookings: Washington, DC, USA, 2014. [Google Scholar]
  25. Liu, C.L.; Li, C.Y.; Liu, X.J. Spatial evolution and factors of innovative urbanization in China. J. Cent. China Norm. Univ. (Nat. Sci.) 2021, 55, 706–716+740. [Google Scholar]
  26. Bo, G.; Zi-qi, W. Technological Innovation, Spatial Spillover and the Quality of Economic Growth—Evidence from 285 Cities in China. Hebei Acad. J. 2024, 44, 150–159. [Google Scholar]
  27. Wang, K.K.; Whang, K.Y. An Analysis of R&D Resource Growth and Its Regional Distribution Characteristics in China since Reform and Opening-up. Macroeconomics 2019, 9, 130–141+167. [Google Scholar]
  28. Huo, W.; Luan, F.; Zhang, Y.; He, D. Aggregation and Network: Pattern Evolution and Driving Mode of Innovation Space in the Yangtze River Delta Region. Urban Dev. Stud. 2023, 30, 72–80. [Google Scholar]
  29. Zhao, X.; Wang, L.H. Study on the Spatial Evolution Characteristics and Influencing Factors of Innovation Agglomeration of Cities in China. Economist 2020, 9, 75–84. [Google Scholar]
  30. Jiaquan, W.; Dixiang, X.; Yuanping, F. Spatial-Temporal Evolution Characteristics and Influencing Factors of Urban Innovation Space Development: Based on the Analysis of 50981 High-Tech Enterprises. Urban Dev. Stud. 2022, 29, 34–40. [Google Scholar]
  31. Zhan, W.; Yuan, Q.F.; Li, G.; Yuan, J.; Gu, J.X. From “World Factory” to “Bay Area of Innovation”: Evolution and Typology of Innovation Spatial Units of Innovation in the Pearl River Delta. Urban Plan. Forum. 2023, 4, 110–118. [Google Scholar]
  32. Wu, Q.B.; Wan, W.S.; Sun, W.X. Urban Spatial Development Pattern and Trend of Knowledge Innovation City in the Era of Ecological Civilization: A Case Study of Hangzhou. Urban Dev. Stud. 2022, 29, 72–83. [Google Scholar]
  33. Sun, Y.K.; Sun, T.S.; Xi, Q.M. Influence factors and spillover effect of the innovation agglomeration in Beijing. Geogr. Res. 2017, 36, 2419–2431. [Google Scholar]
  34. Yixing, D. From “Economic Benefits” to “Spatial Quality”:Build A New Innovation Space Evaluation System that Adapts to China’s Future Development. City Planning Review 2024, 48, 71–80. [Google Scholar]
  35. Manling, G.; Shijie, S. Agglomeration Characteristics and Influencing Factors of Urban Innovation Space:A Case Study of Nanjing Main City. City Plan. Rev. 2023, 47, 21–31. [Google Scholar]
  36. Zhang, F.F. Research on the Promotion Mechanisms of New R&D Institutions in Nanjing Under the Innovation-Driven Development Strategy. Chin. Univ. Sci. Technol. 2021, 6, 20–24. [Google Scholar] [CrossRef]
  37. Cai, L.R.; Du, Z.W.; Yuan, Q.F. Characteristics and influencing factors of tempo-spatial evolution of innovation platforms in China. World Reg. Stud. 2020, 29, 939–951. [Google Scholar]
  38. Chen, D.F.; Chen, Y.; Wang, W.P. Spatial Spillover of Urban Innovation and Its Impact Factors in Chinese Cities Based on the Perspective of Administrative Boundary Effect. J. Audit. Econ. 2021, 36, 118–127. [Google Scholar]
  39. Yong-cong, Y.; Ming-hao, S. The Impact of the Inclusive Growth of International Trade on the Regional Innovation Ability: Spatial Econometric Analysis on Provincial Panel Data. J. Int. Trade 2015, 41, 3–10. [Google Scholar]
  40. Xin-wei, M.; Yan-jie, J.; Yu-chuan, J.; Xue, J. Geographically and temporally weighted regression for modeling spatio-temporal variation in dockless bikeshare usage demand. J. Jilin Univ. (Eng. Technol. Ed.) 2020, 50, 1344–1354. [Google Scholar]
  41. Tang, S.; Zhang, J.; Niu, F. Spatial-Temporal Evolution Characteristics and Countermeasures of Urban Innovation Space Distribution: An Empirical Study Based on Data of Nanjing High-Tech Enterprises. Complexity 2020, 2020, 2905482. [Google Scholar] [CrossRef]
  42. Tao, L.; Jia-xin, T.; Miao-miao, Z.; Sheng-qiang, Y. Research on the Influencing Factors of Rural Development and Marginal Effects at Village Scale: A Comparative Analysis Based on Typical Counties of the Yangtze River. Resour. Environ. Yangtze Basin 2022, 31, 2768–2779. [Google Scholar]
  43. Friedman, J.H. Greedy function approximation: A gradient boosting machine. Ann. Stat. 2001, 29, 1189–1232. [Google Scholar] [CrossRef]
  44. Natekin, A.; Knoll, A. Gradient boosting machines, a tutorial. Front. Neurorobotics 2013, 7, 21. [Google Scholar] [CrossRef]
  45. Schonlau, M. Boosted regression (boosting): An introductory tutorial and a Stata plugin. Stata J. 2005, 5, 330–354. [Google Scholar] [CrossRef]
  46. Kang, C.L.; Gu, J.F.; Liu, Z.W. Analysis of Tourist Volume Forecasting Model Based on Gradient Boost Regression Tree. Math. Pract. Theory 2019, 49, 251–261. [Google Scholar]
  47. Gong, Y.; Luo, X.Q.; Wang, D.H.; Yang, S.H. Urban travel time prediction based on gradient boosting regression tress. J. Zhejiang Univ.(Eng. Sci.) 2018, 52, 453–460. [Google Scholar]
  48. Shen, X.J.; Zhang, J.T.; Han, D.J. Short-term Traffic Flow Prediction Model Based on Gradient Boosting Regression Tree. Comput. Sci. 2018, 45, 222–227+264. [Google Scholar]
  49. Fotheringham, A.S.; Yang, W.; Kang, W. Multiscale Geographically Weighted Regression (MGWR). Ann. Am. Assoc. Geogr. 2017, 107, 1247–1265. [Google Scholar] [CrossRef]
  50. Yong-jun, L.; Qing-chang, C.; He, F.; Jian, L. Spatial heterogeneity of vegetation evolution and its influencing factors in the Yangtze River Basin based on multi-scale geographical weighted regression. China Environ. Sci. 2023, 1–13. [Google Scholar]
  51. Haokun, J.; Heling, W.; Jian, H. Analyzing Housing Price Determinants Using a Multiscale Spatiotemporal Geographically Weighted Regression Model. Stat. Manag. 2022, 37, 101–107. [Google Scholar] [CrossRef]
  52. Fan, L.; Zhang, D.Y. Research on the Influence Mechanism and Spatial Heterogeneity Characteristics of Block Vitality in Beijing: Based on Multi-Scale Geographically Weighted Regression. City Plan. Rev. 2022, 46, 27–37. [Google Scholar]
  53. Congxin, C.; Ping, Z.; Xu, H. Research on the Influential Elements of Urban Innovation Space Evolution Based on Random Forest Model Algorithm:Taking Wuhan Main City as an Example. New Archit. 2024, 114–117. [Google Scholar]
  54. Liyan, W.; Ying, X.; Zhenpo, W. Urban Renewal, Innovative Neighborhoods and High Quality Urban Development. Urban Dev. Stud. 2020, 27, 67–74. [Google Scholar]
  55. Li, L.Y.; Luo, Y.; Zhang, X.H. Research on Urban Sci-tech Innovation Space Development, Influential Factors and Planning Countermeasures: A Case Study of Shanghai Science and Technology Innovation Center. Shanghai Urban Plan. Rev. 2021, 72–76. [Google Scholar]
  56. Yanhua, W.; Bingcan, W.; Yongzhong, X. Discussion on Hypothesis Testing Based on Monte Carlo Method. Stat. Decis. 2018, 34, 75–78. [Google Scholar]
Figure 1. Research scope.
Buildings 15 02565 g001
Figure 2. Distribution of innovation space kernel density.
Buildings 15 02565 g002
Figure 3. Methodology framework.
Buildings 15 02565 g003
Figure 4. Marginal Effect Analysis of Influencing Factors.
Buildings 15 02565 g004
Figure 5. Spatial distribution of marginal effects of influencing factors.
Buildings 15 02565 g005
Table 1. Statistics and sources of innovation space.
Innovation Entity TypesInnovation EntitySourcePOI Count (2023)
Research-orientedResearch InstitutionsAutoNavi914
Research CentersAutoNavi
Multi-tier LaboratoriesAutoNavi
Production-orientedHigh-Tech Enterpriseswww.innocom.gov.cn6658
Incubation-orientedNational Makerspaceswww.qcc.com35
National Technology Incubatorswww.qcc.com60
Provincial Technology Incubatorswww.qcc.com62
Total 7729
The classification of innovation entity types was adapted from prior innovation studies.
Table 2. Explanatory variables and statistical description.
TypesInfluencing FactorsStatistical DescriptionNote
Basic Infrastructureroad accessibilityRoad accessibility within the gridVector road network processed via AutoNavi Route Planning API, accessibility computed with OD cost matrix.
public transit networksKernel density of public transit network within the gridAverage kernel density of public transit networks within the grid across the study area.
metro stationsKernel density of metro stations within the gridAverage kernel density of metro stations within the grid across the study area.
Research ResourcesuniversitiesWeighted kernel density of universities within the gridKernel density of universities weighted by institutional ranking (assigned scores: 5 for top-tier, 4, 3, 2, 1 for lower tiers).
patentsKernel density of patents within the gridInvention and utility model patents with a value score >80 over the past decade (as of 31 December 2023).
Industrial Ecosysteminnovation platformsKernel density of innovation platforms within the gridRepresents regional innovation planning layout; independent of the dependent variable (incubation-type innovation entities).
top 100 enterprisesKernel density of top 100 enterprises within the gridTop 100 enterprises act as industrial anchors, attracting upstream and downstream innovation firms. Note: Partial overlap with dependent variable indicators, but impact on regression results is negligible due to limited sample size (<100 entries in the study area).
Human Capitalpopulation distributionPopulation density within the grid
Cultural Amenitiespark-green spacesScored proximity to parks from grid centroidsScoring based on shortest distance from grid centroid to park green spaces:
Parks with area > 100,000 m2: Score 5 if distance < 1500 m; score 3 if 1500–4000 m; score 1 if 4000–6000 m.
Parks with area 10,000–100,000 m2: Score 3 if distance < 1500 m; score 1 if 1500–3000 m.
Parks with area < 10,000 m2: Score 3 if distance < 750 m.
art galleriesKernel density of art galleries within the gridAverage kernel density of art galleries within the grid across the study area.
integrated commercial hubsKernel density of integrated commercial hubs within the gridAverage kernel density of integrated commercial hubs within the grid across the study area.
Table 3. Results of multiple linear regression analysis.
Influencing FactorsCoefficientRobust_Pr (p)VIF
road accessibility4.3573660.001298 *1.896368
public transit networks−17.7746580.000000 *4.40435
metro stations6.1344810.001901 *3.966856
universities3.5260290.4695664.714737
innovation platforms35.1453640.000000 *1.704641
top 100 enterprises10.4808510.017388 *3.059993
patents10.5735420.005728 *3.843127
population distribution−3.7985630.5130662.32027
park-green spaces0.0179230.9885791.239891
art galleries−1.2781760.7611032.630183
integrated commercial hubs14.9233160.001573 *3.15158
AdjR2AICcKoenker (BP) (p)Joint Wald Statistic (p)
0.5686412.1660.000000 *0.000000 *
Based on OLS model results, * indicates statistical significance of the variable.
Table 4. MGWR model analysis and Monte Carlo test results.
Influencing FactorsMCT (p)BandwidthSTD
road accessibility0.740916.0000.004
public transit networks0.794916.0000.004
metro stations0.582916.0000.005
universities0.00050.0000.463
innovation platforms0.00043.0000.295
top 100 enterprises0.997916.0000.001
patents0.00045.0000.452
population distribution1.000916.0000.001
park-green spaces0.976916.0000.002
art galleries0.00052.0000.639
integrated commercial hubs0.00052.0000.274
AdjR2AICcResidual sum of squaresLog-likelihood
0.874897.98196.759−270.052
Based on the statistical analysis of the MGWR model results.
Disclaimer/Publisher’s Note: The statements, opinions and data contained in all publications are solely those of the individual author(s) and contributor(s) and not of MDPI and/or the editor(s). MDPI and/or the editor(s) disclaim responsibility for any injury to people or property resulting from any ideas, methods, instructions or products referred to in the content.

