
Research on the Operating Performance of a Combined Heat and Power System Integrated with Solar PV/T and Air-Source Heat Pump in Residential Buildings

Abstract
1. Introduction
2. System Principles and Design
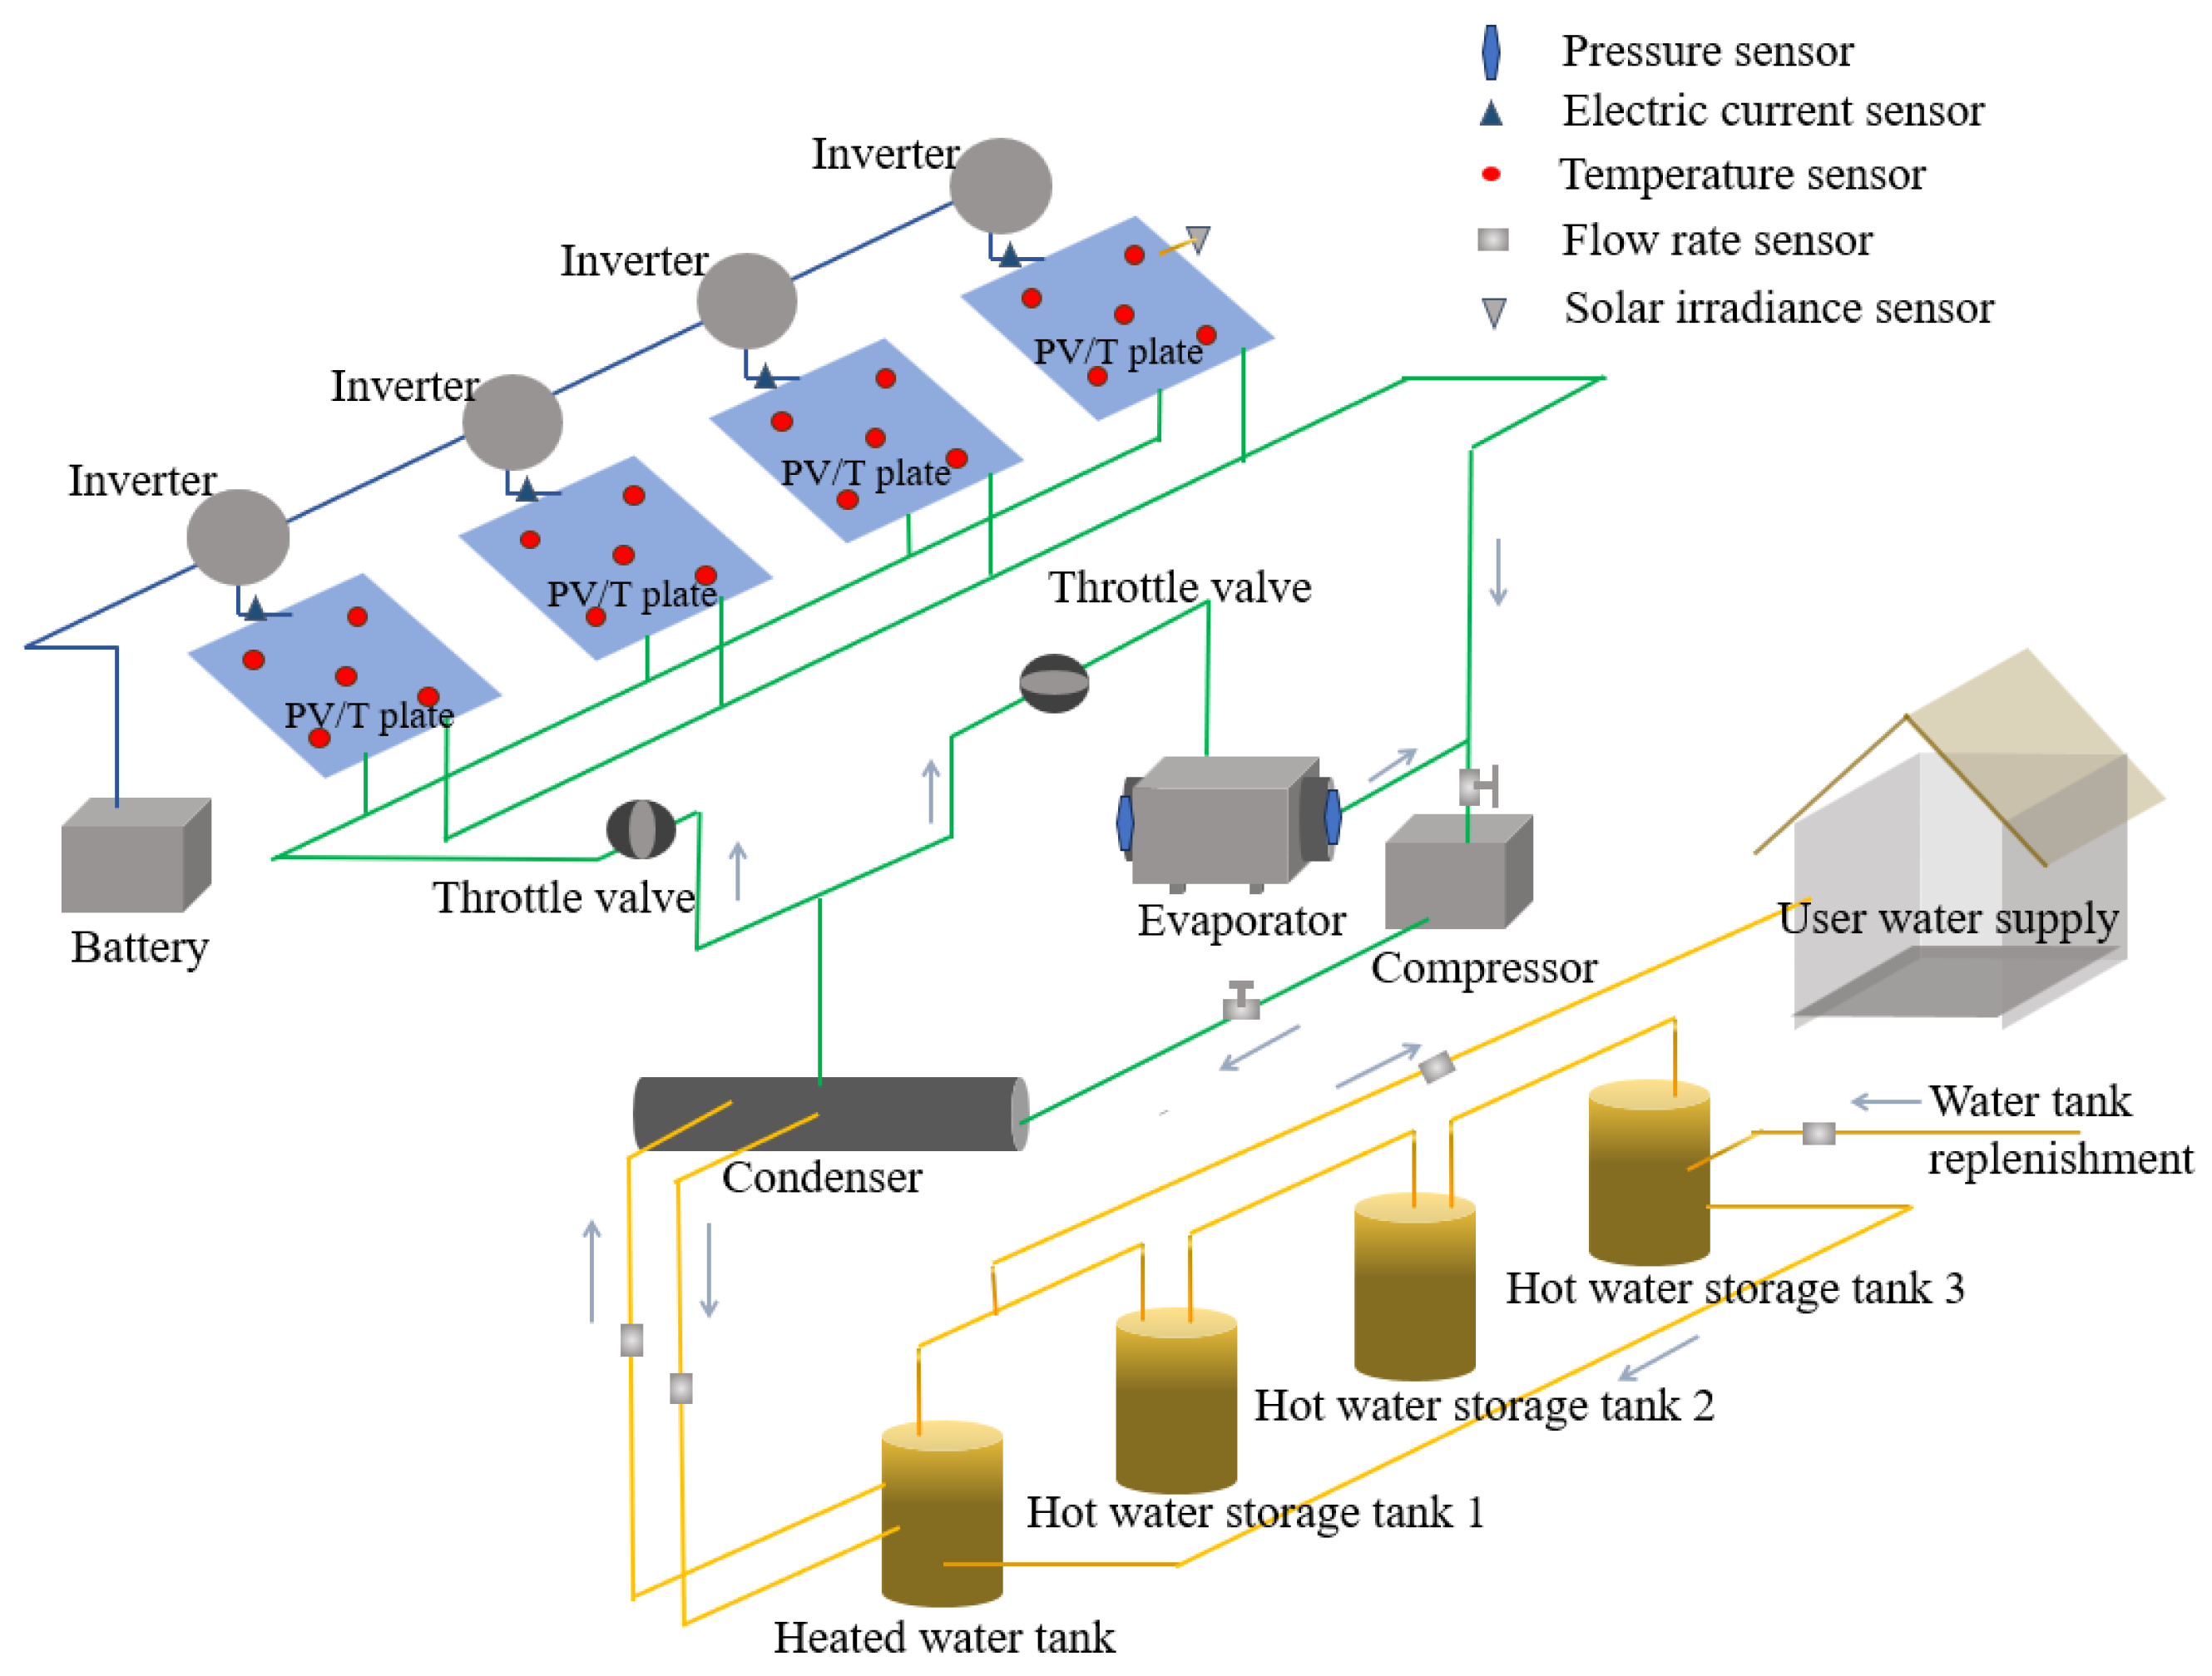
2.1. System Basic Principles
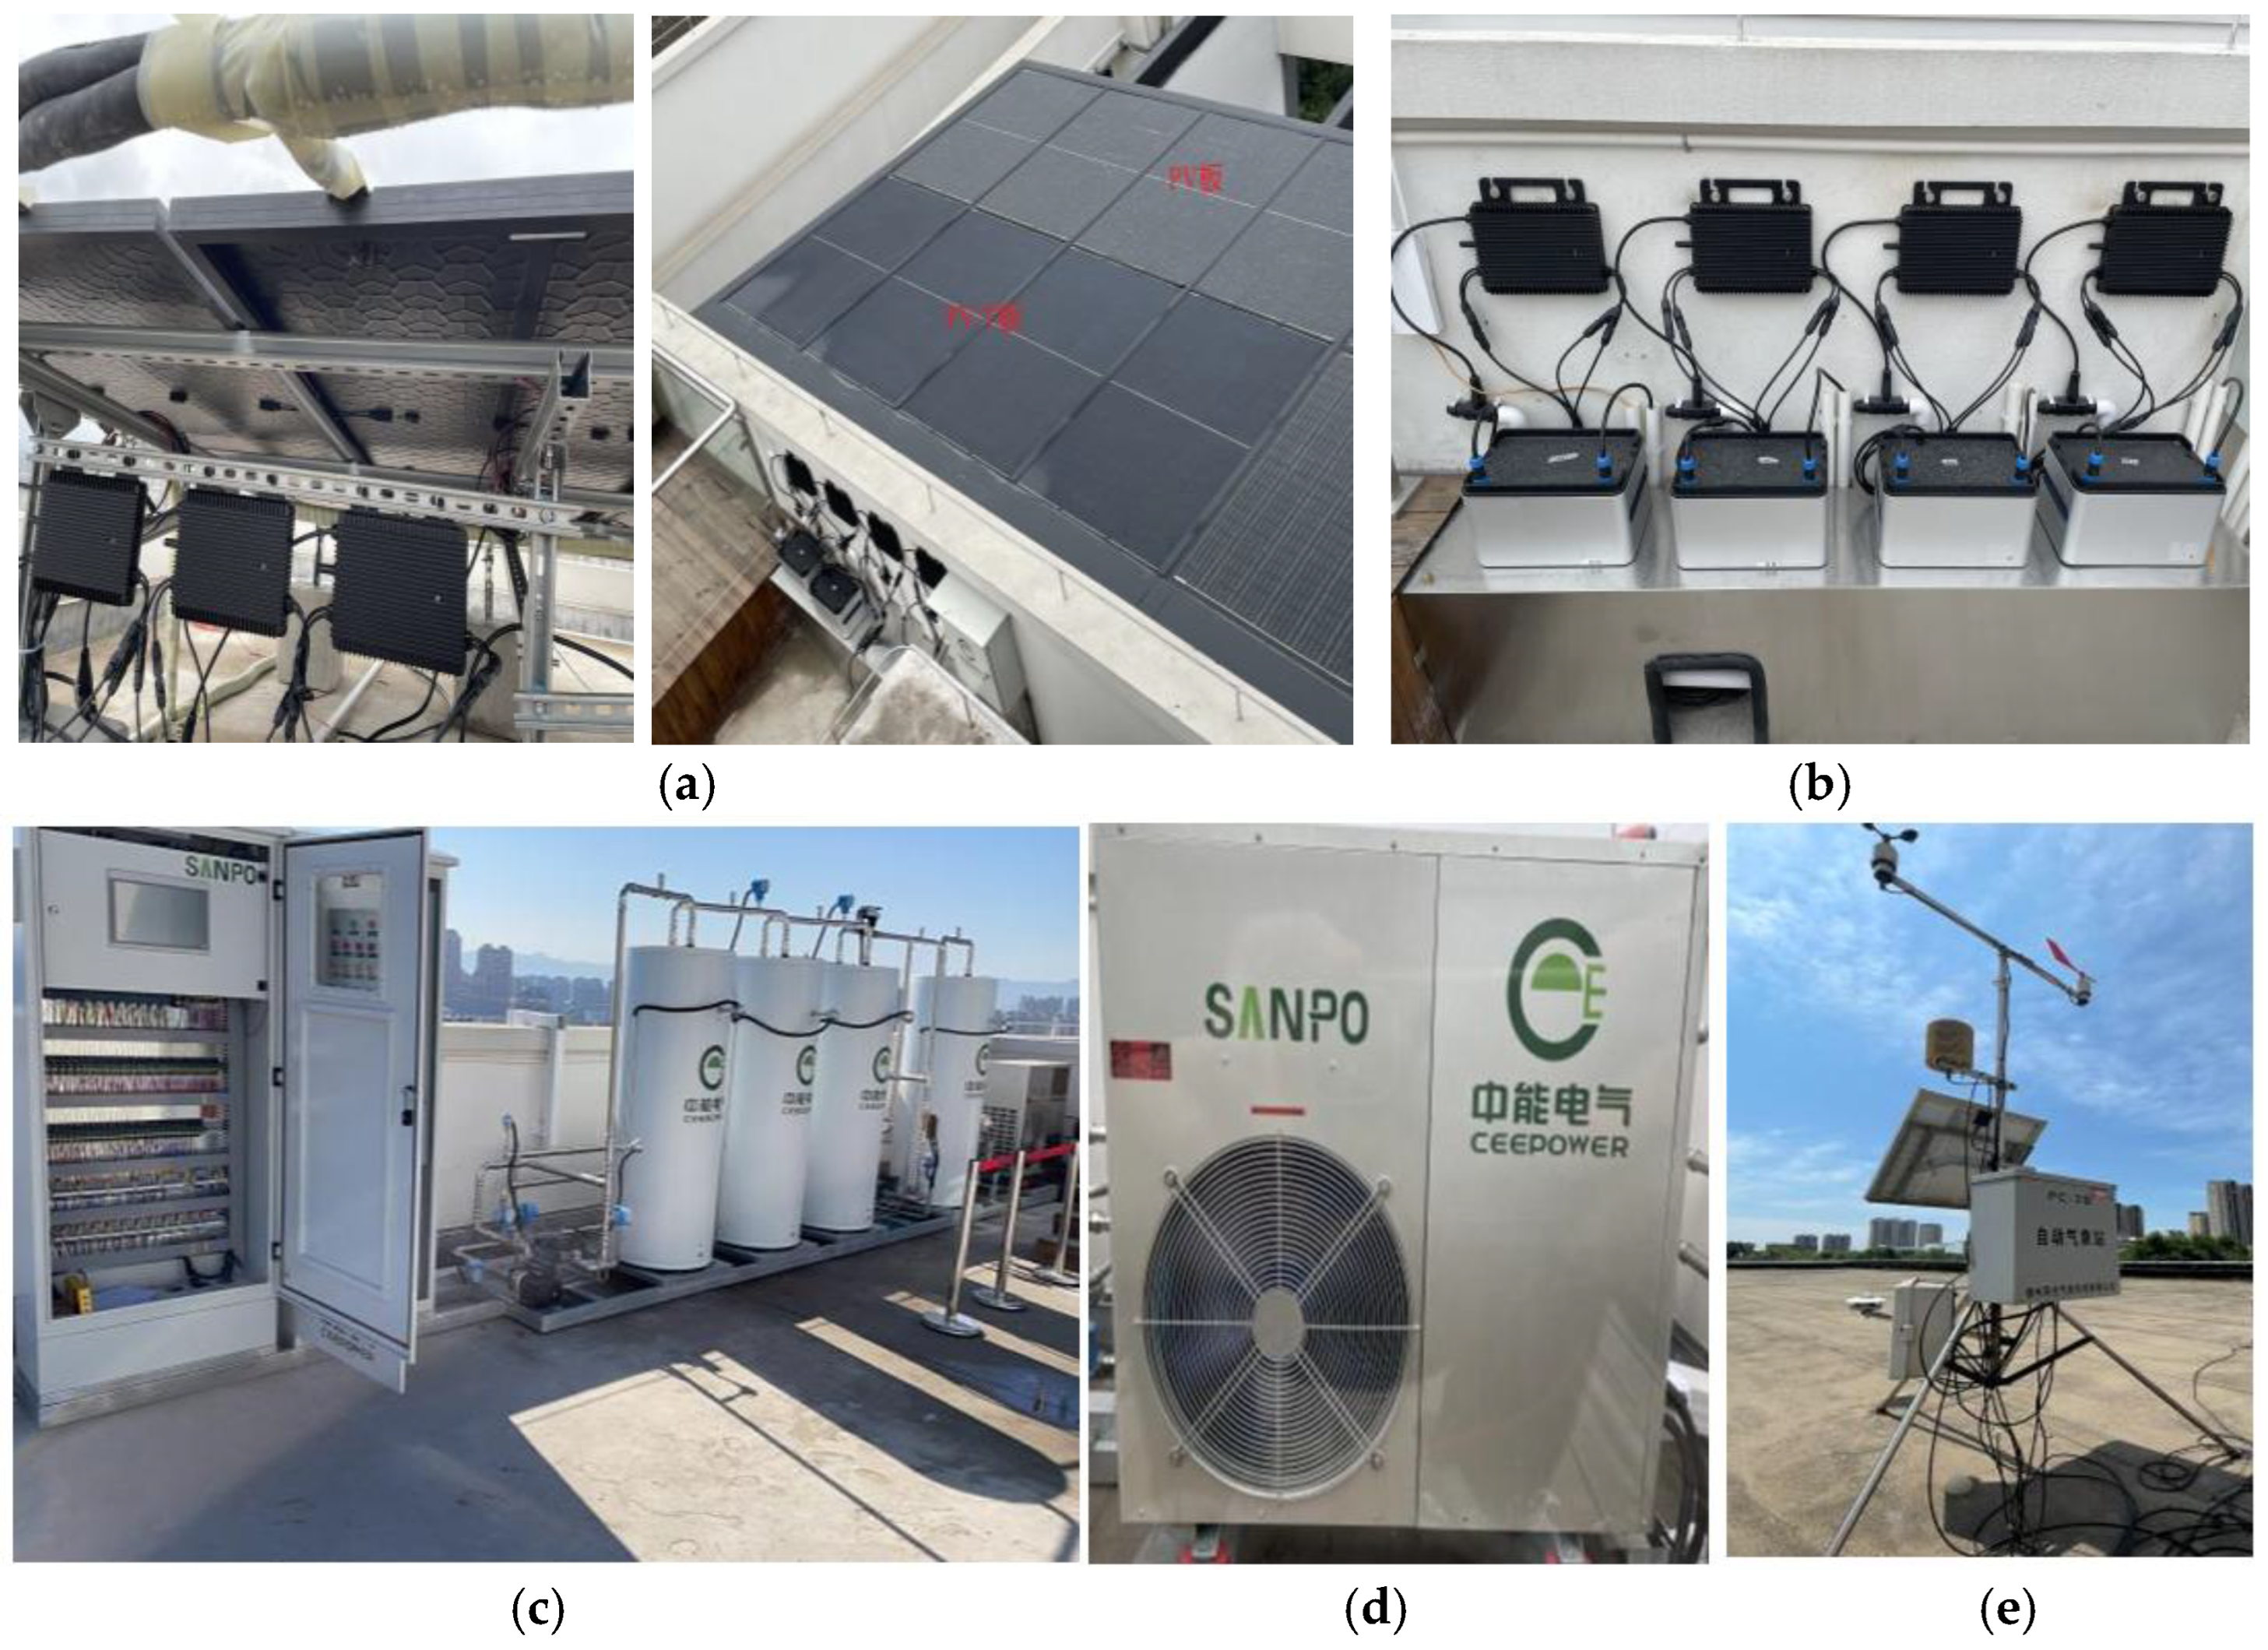
2.2. System Configuration
2.3. System Operation Mode and Control Strategy
- (1)
- Low-demand mode: The hot water tank prioritizes supplying water to users, with any excess hot water being stored in the reserve tank.
- (2)
- High-demand mode: The hot water tank works in conjunction with the reserve hot water tank to provide a continuous water supply.
- (3)
- Water temperature maintenance mechanism: When the water temperature in the reserve hot water tank falls below the lower threshold, the water is recirculated to the hot water tank via a pump for reheating.
3. System Performance Evaluation Indicators
3.1. Photothermal Efficiency
- The daily average photothermal efficiency of the collector [22] is
3.2. Electrical Efficiency
3.3. System Total Efficiency
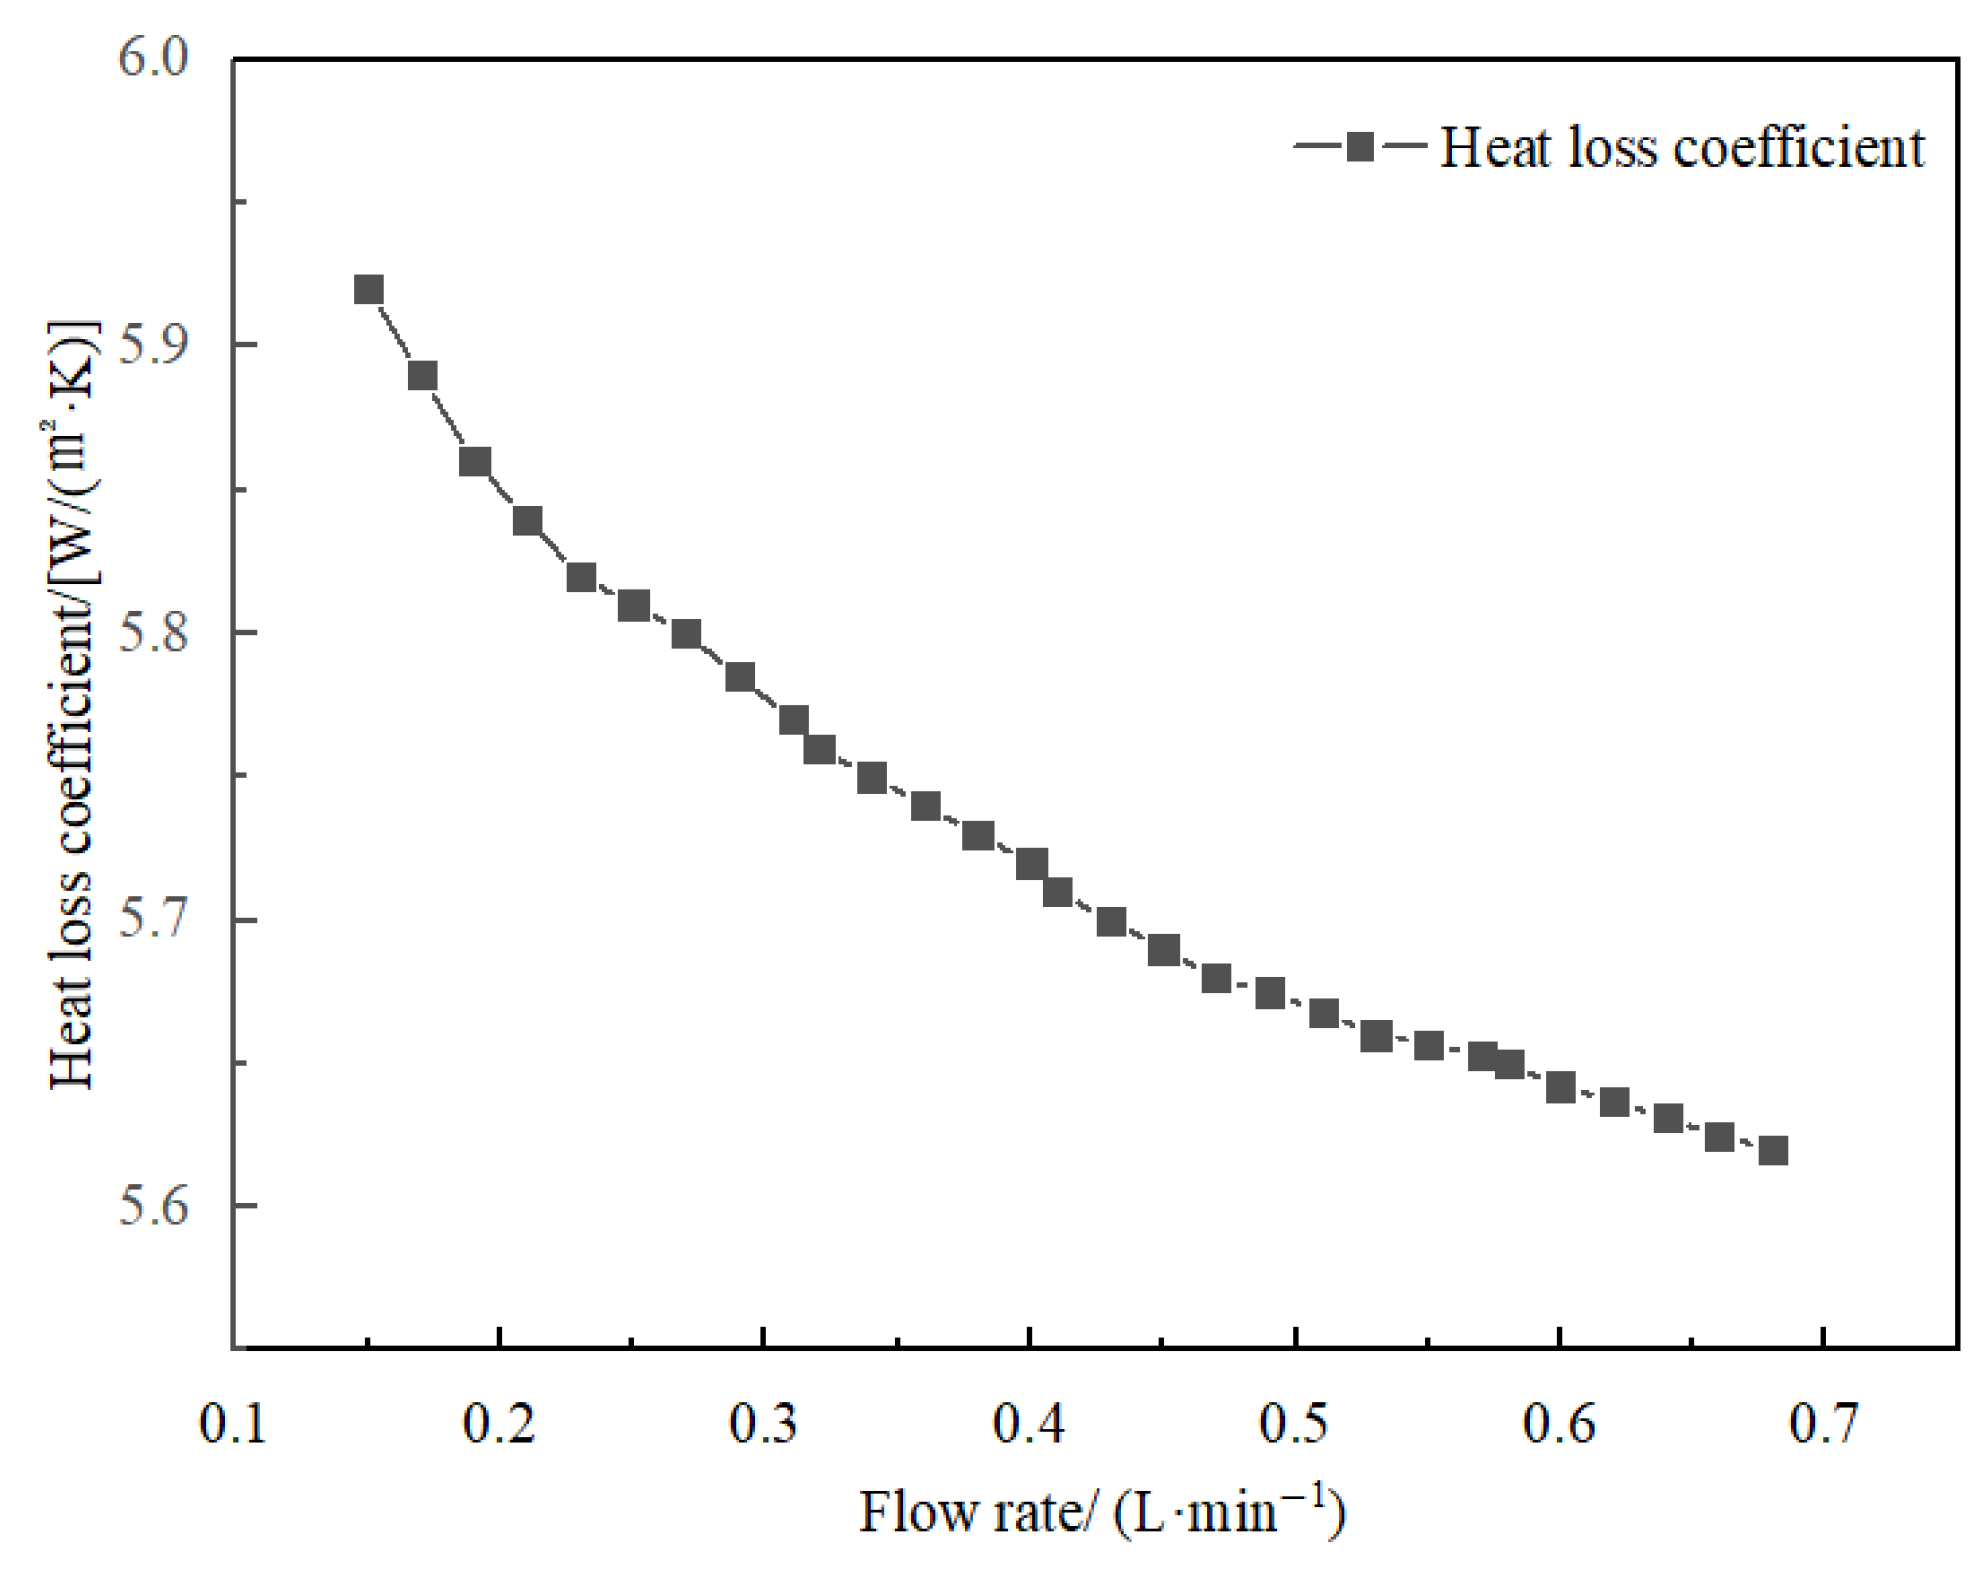
3.4. Heat Loss Coefficient
4. Results and Discussion
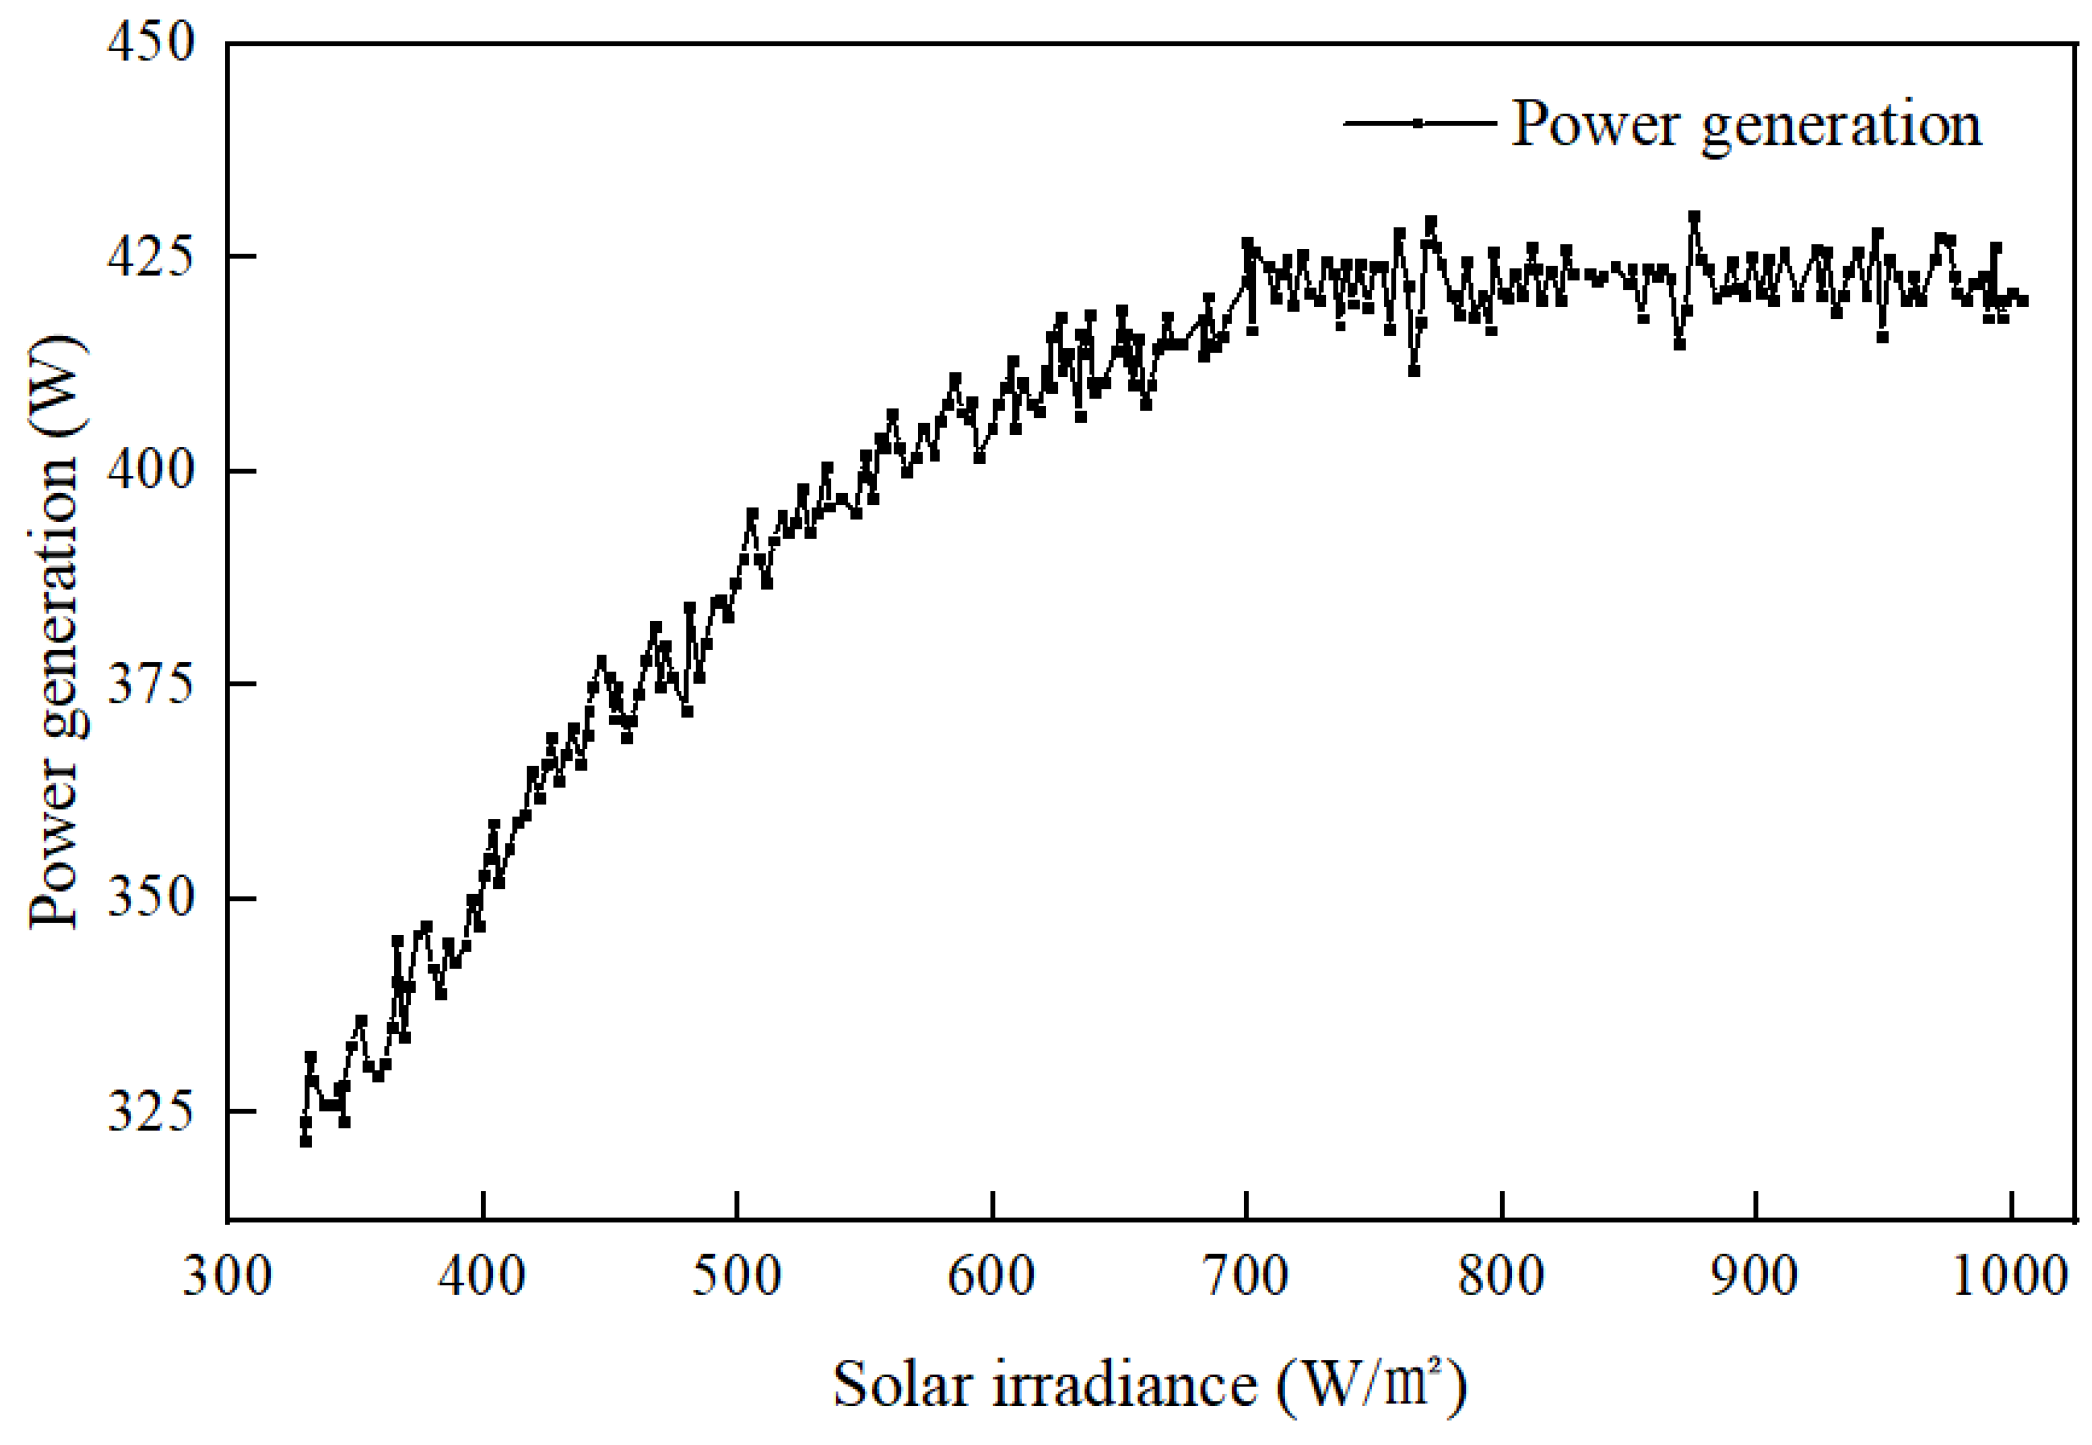
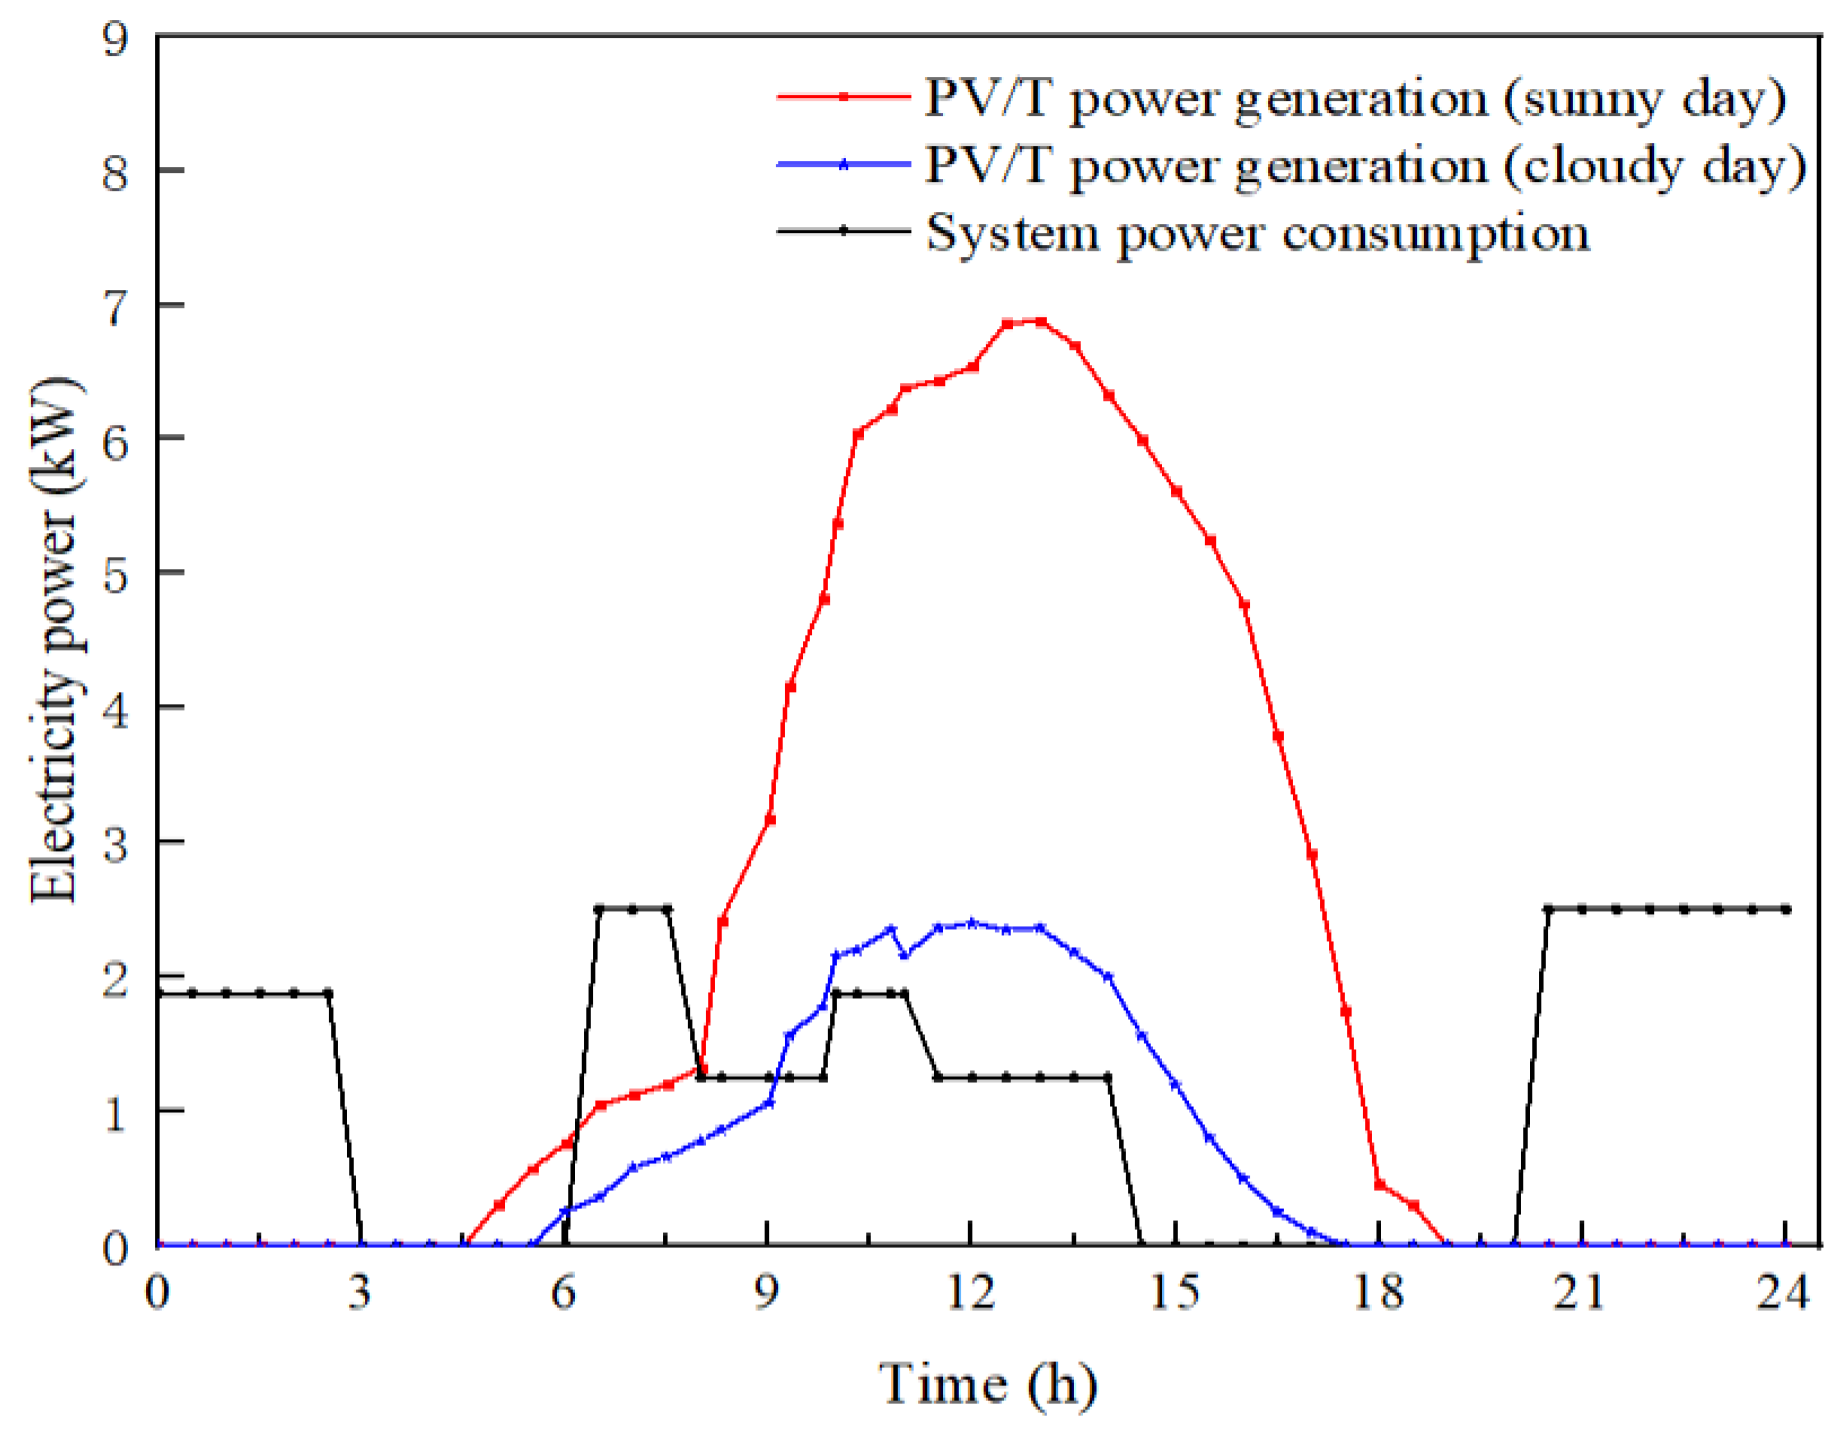
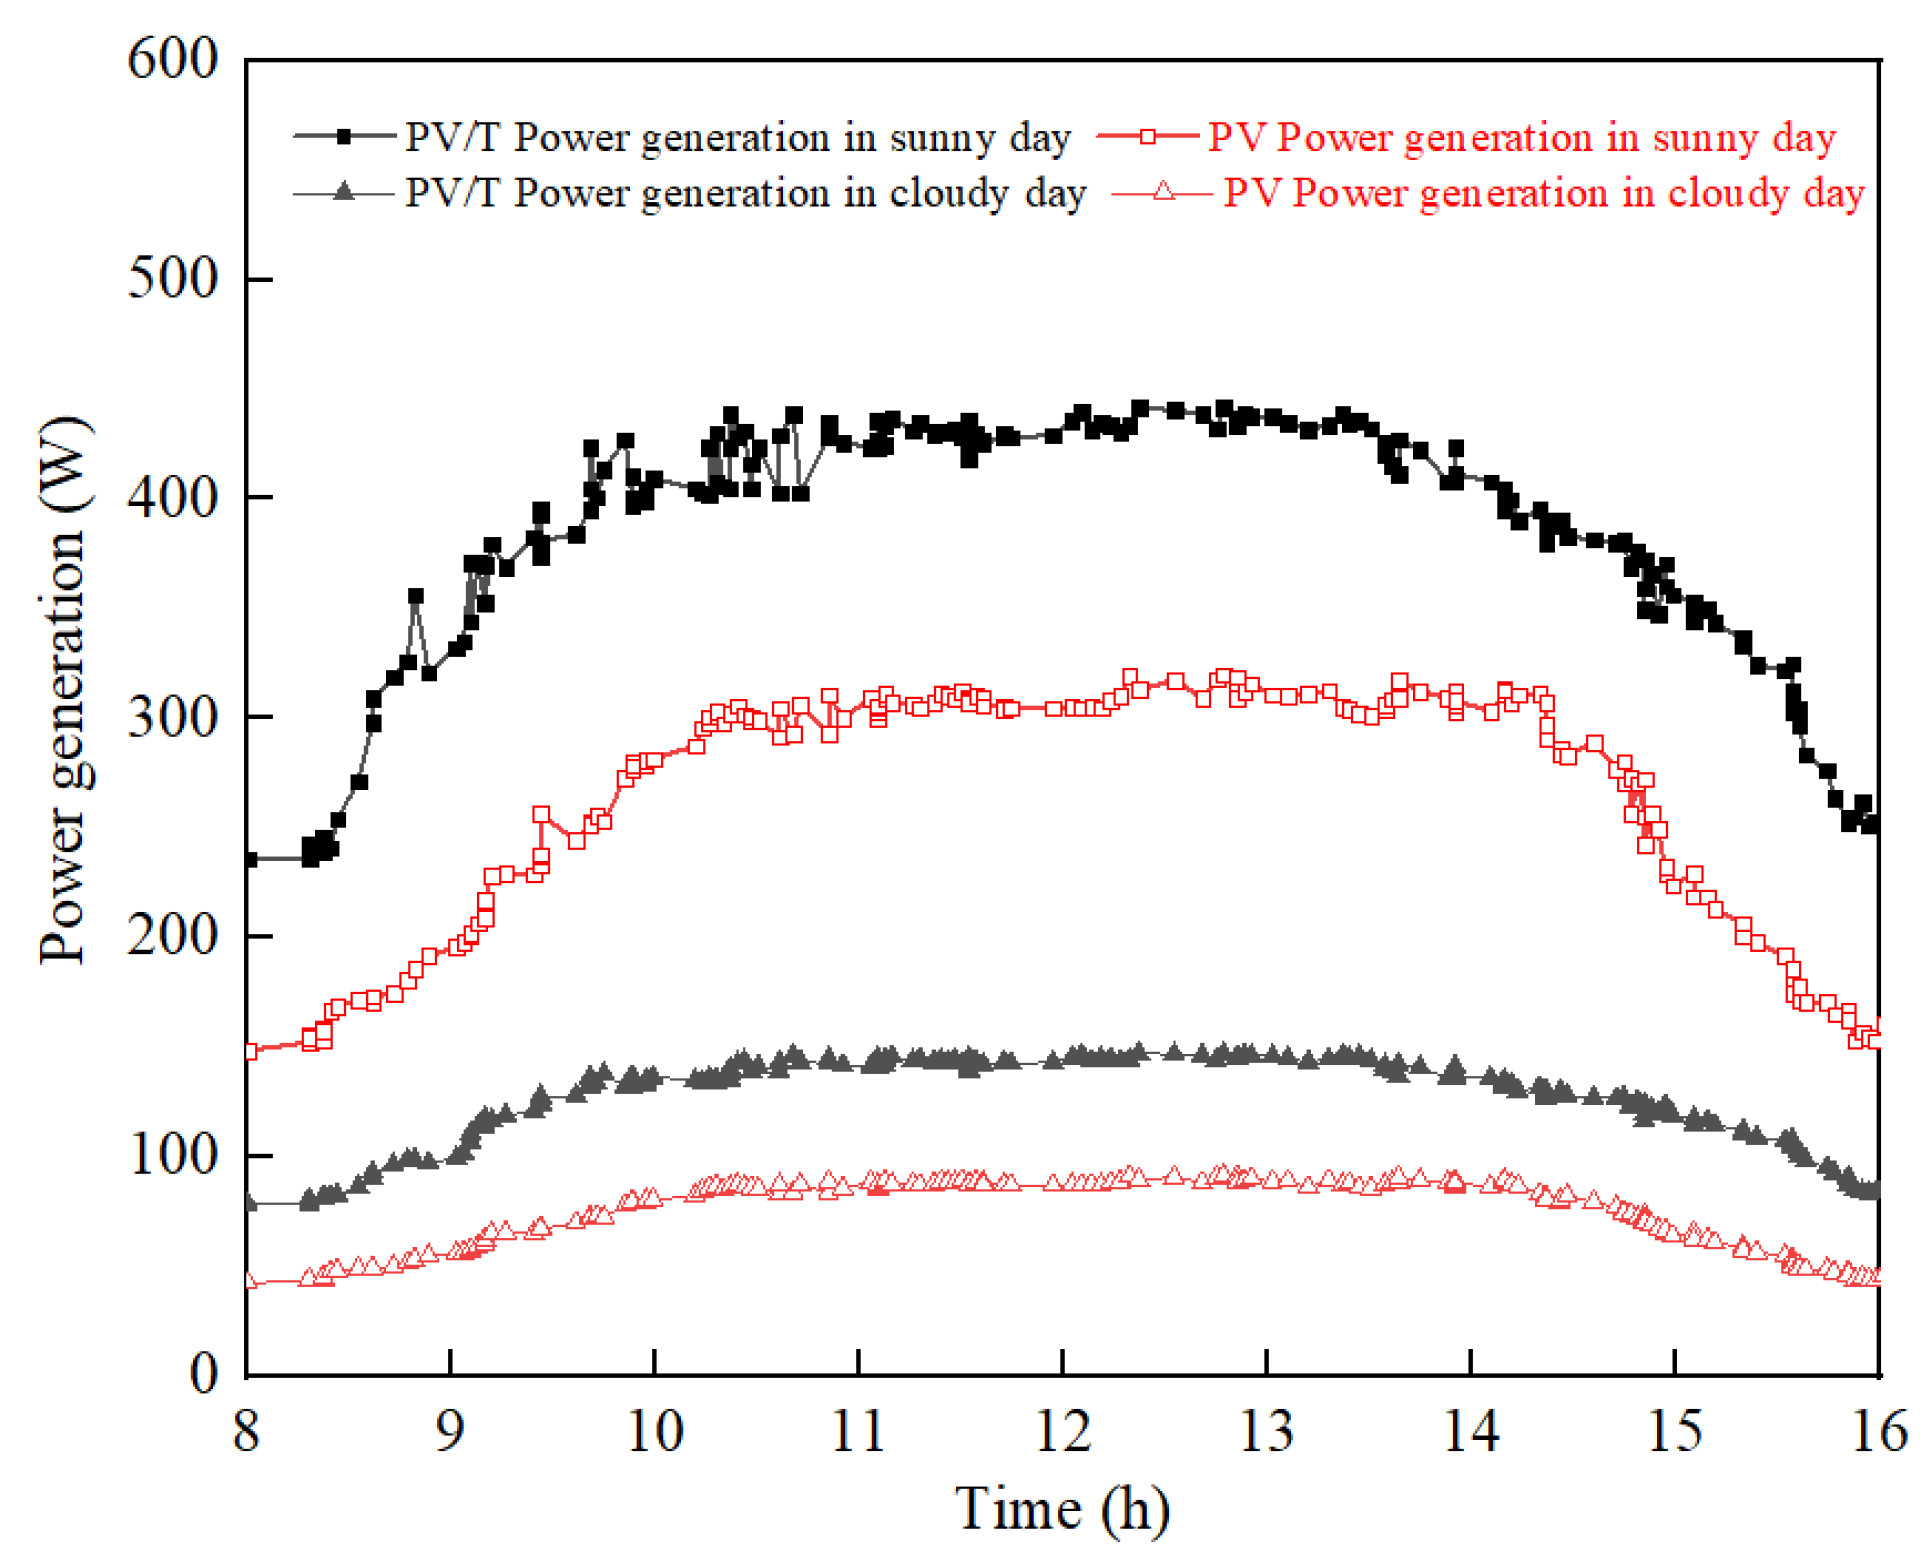
4.1. Power Generation Performance
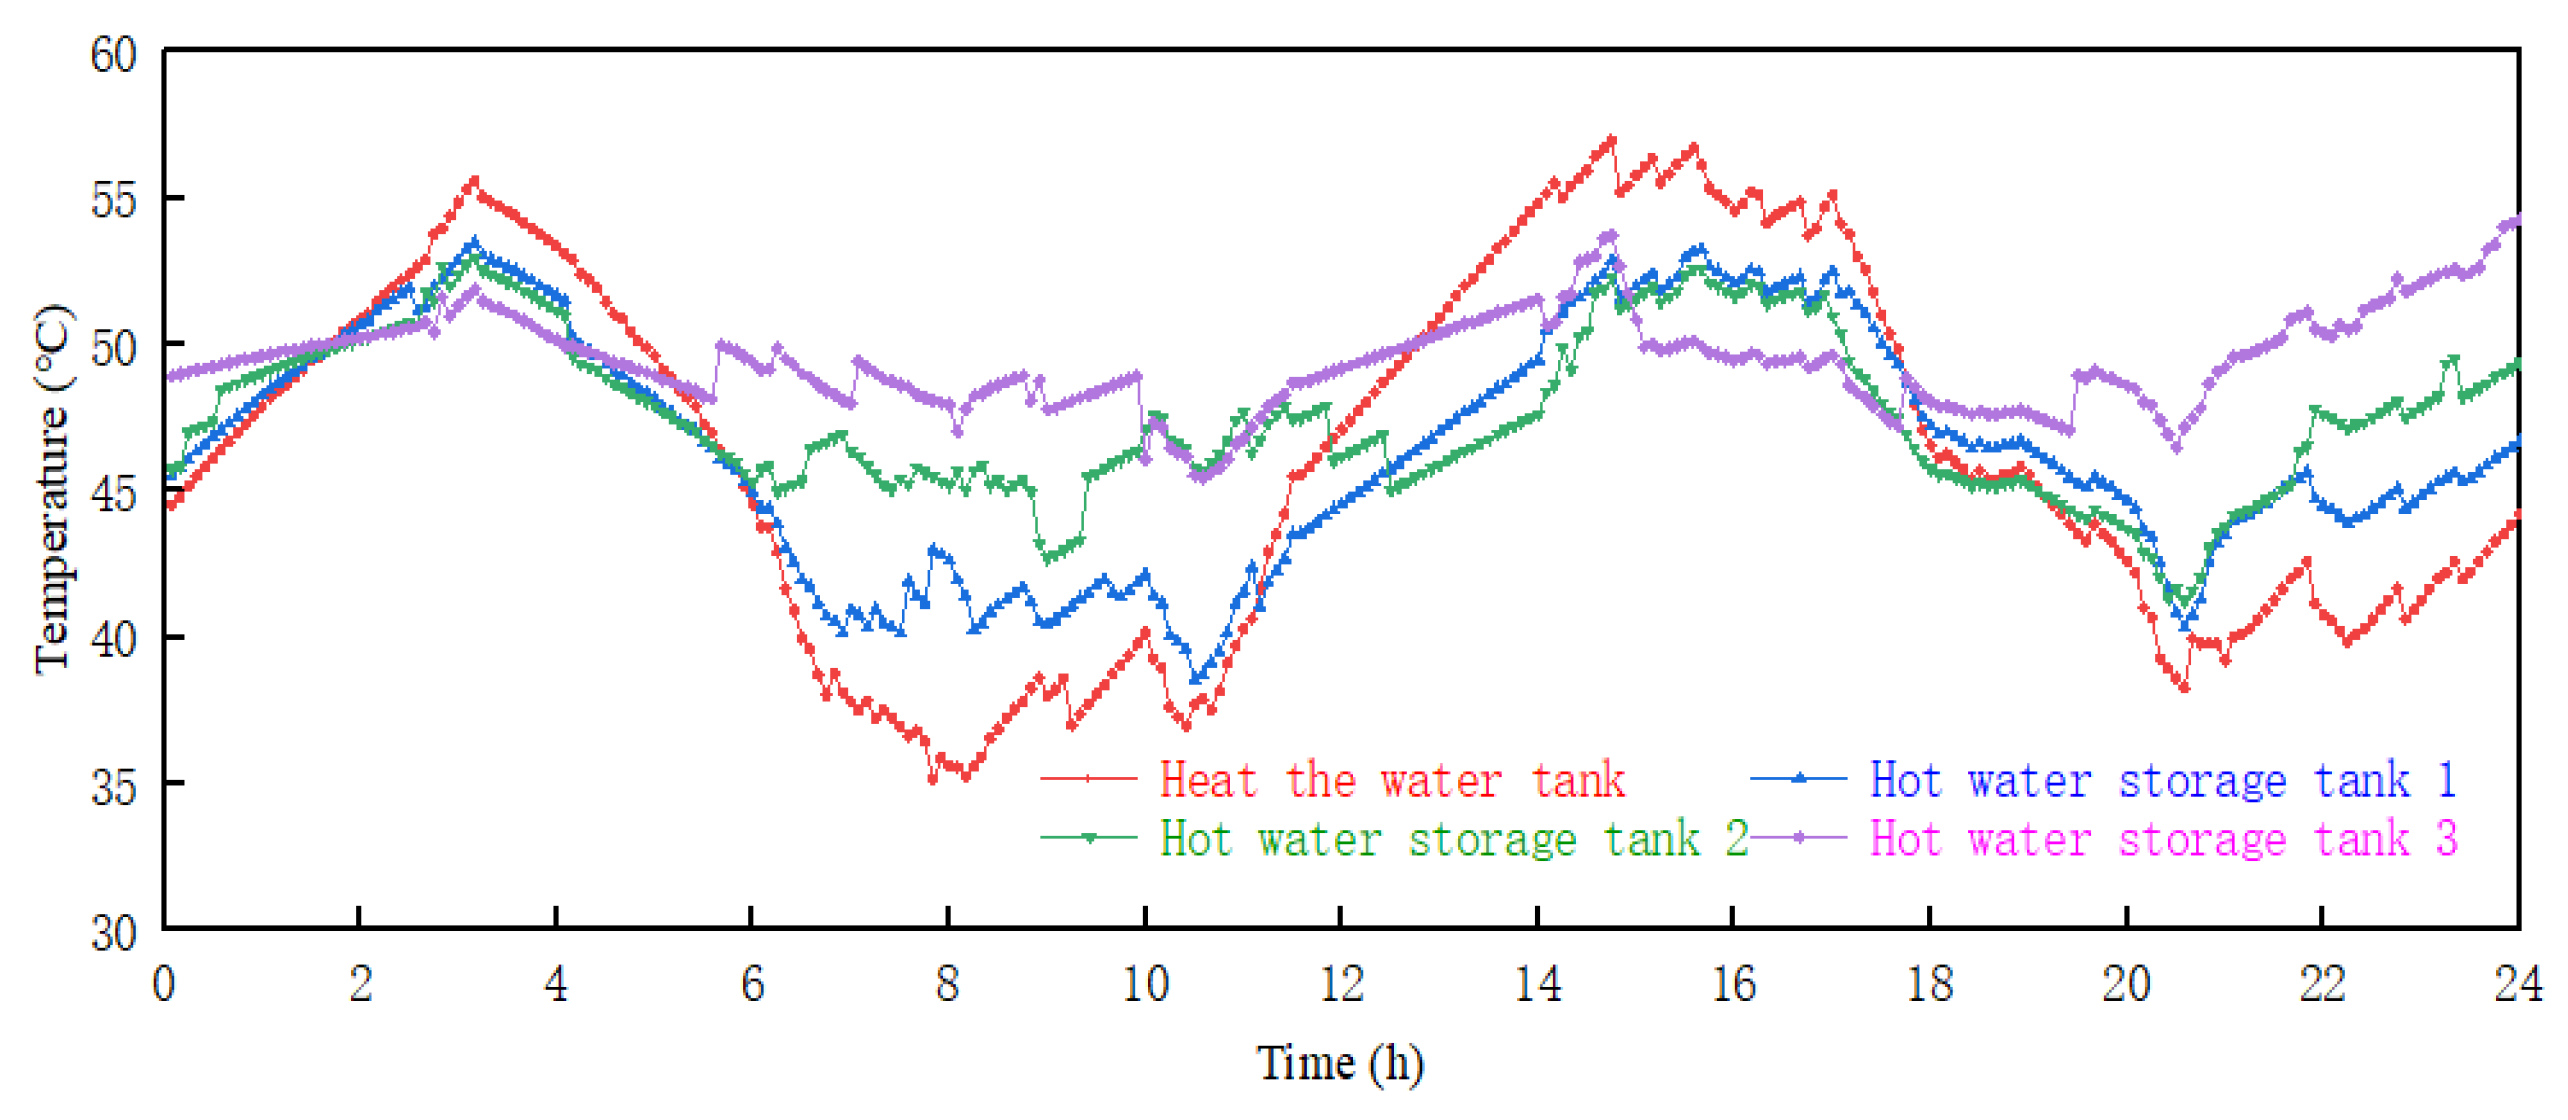
4.2. Thermal Performance
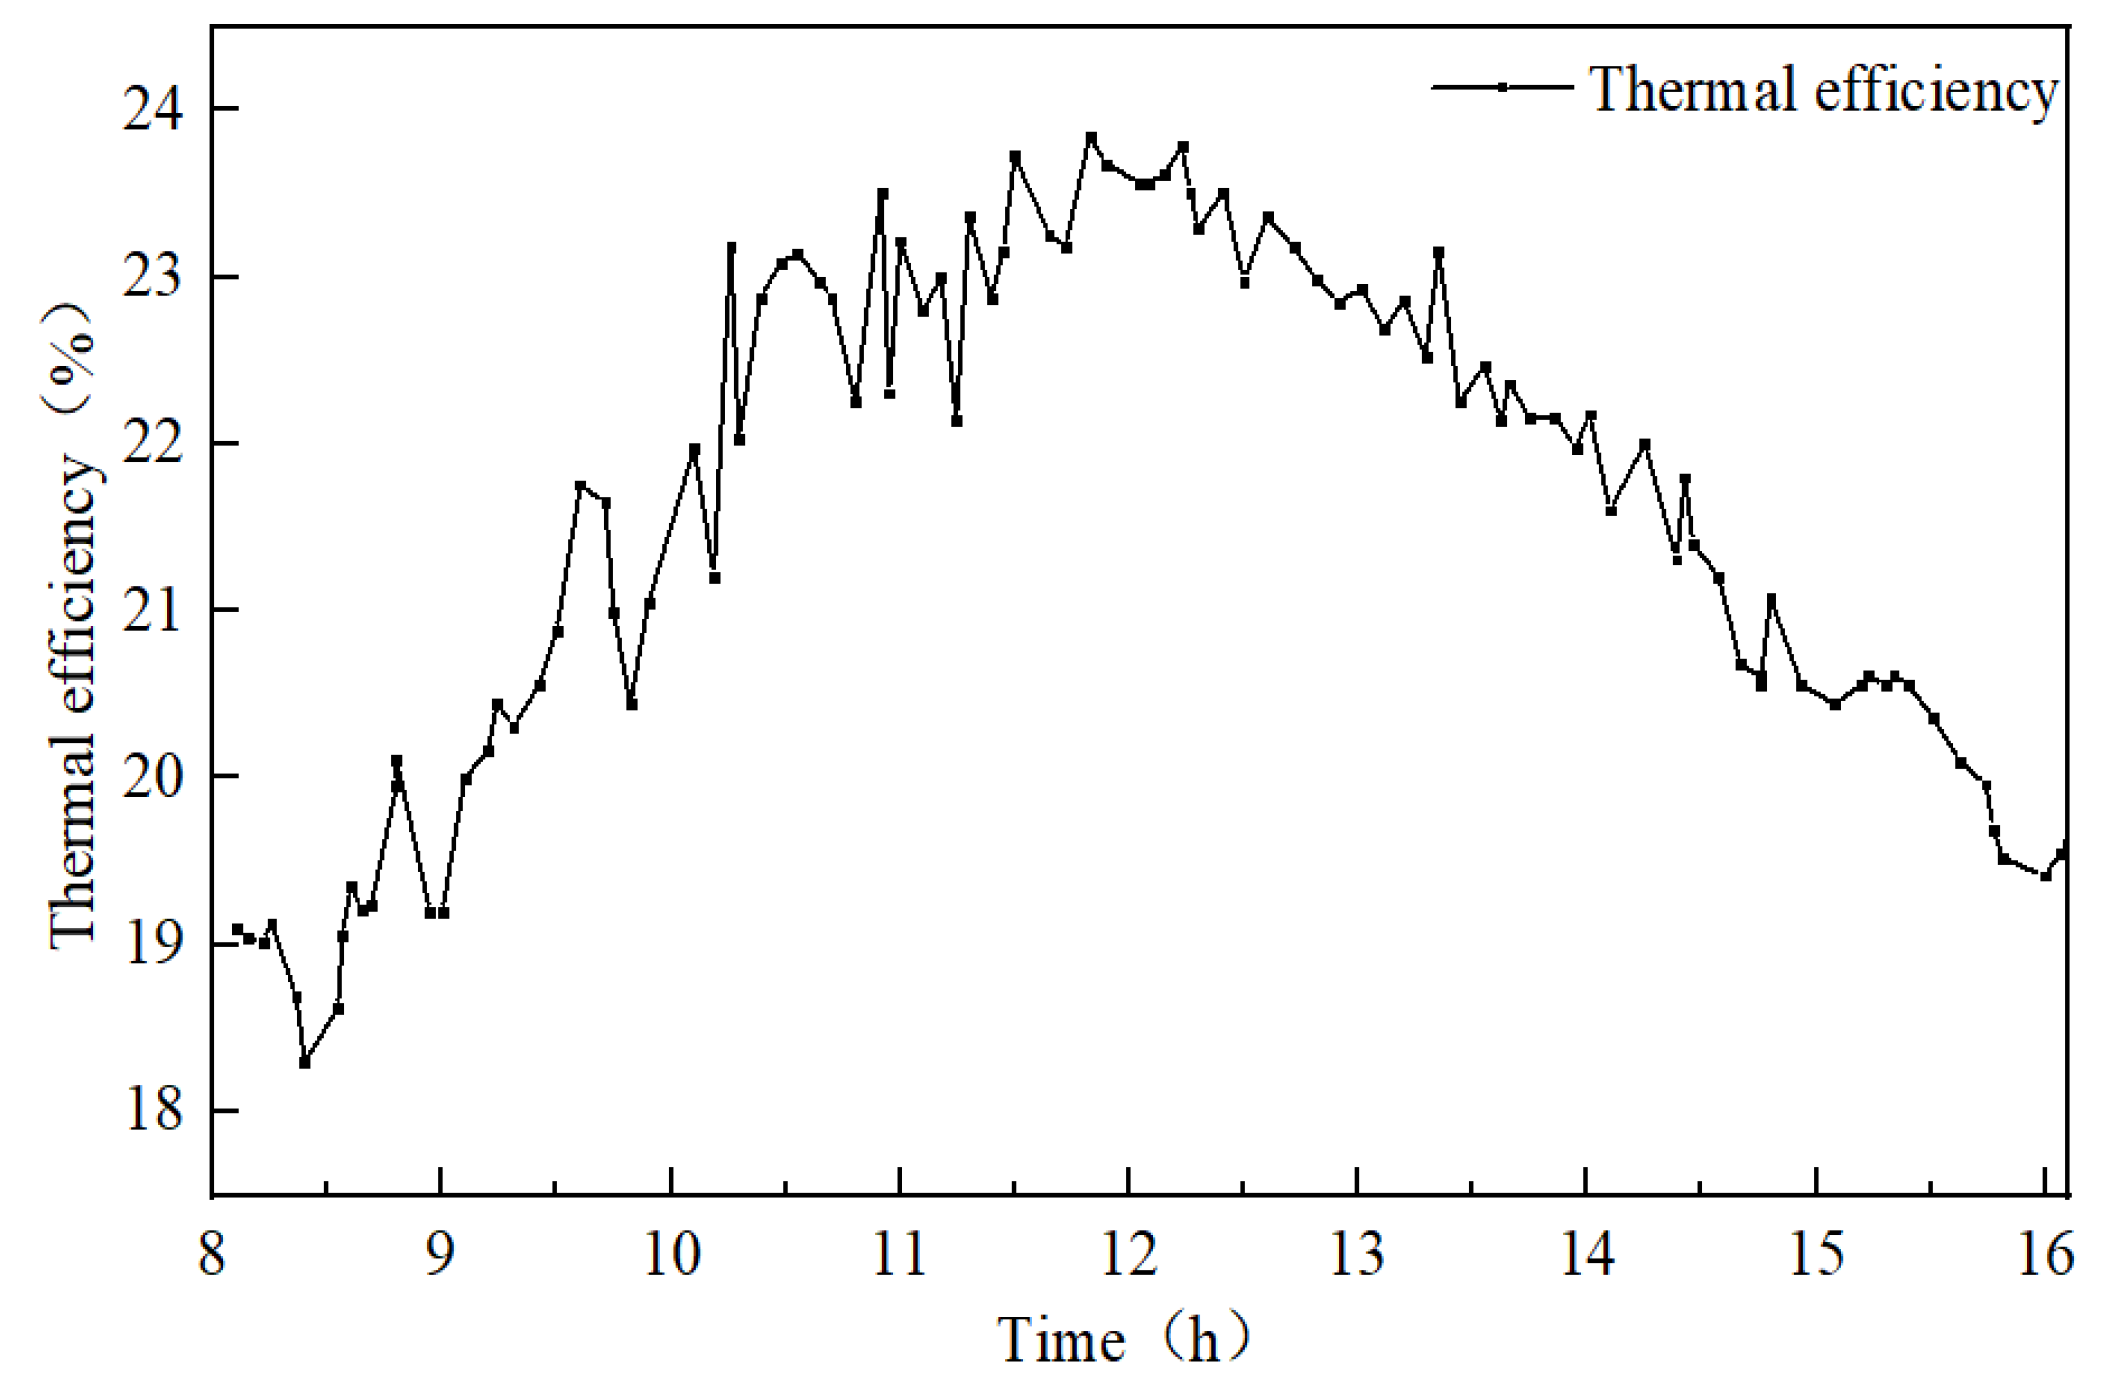
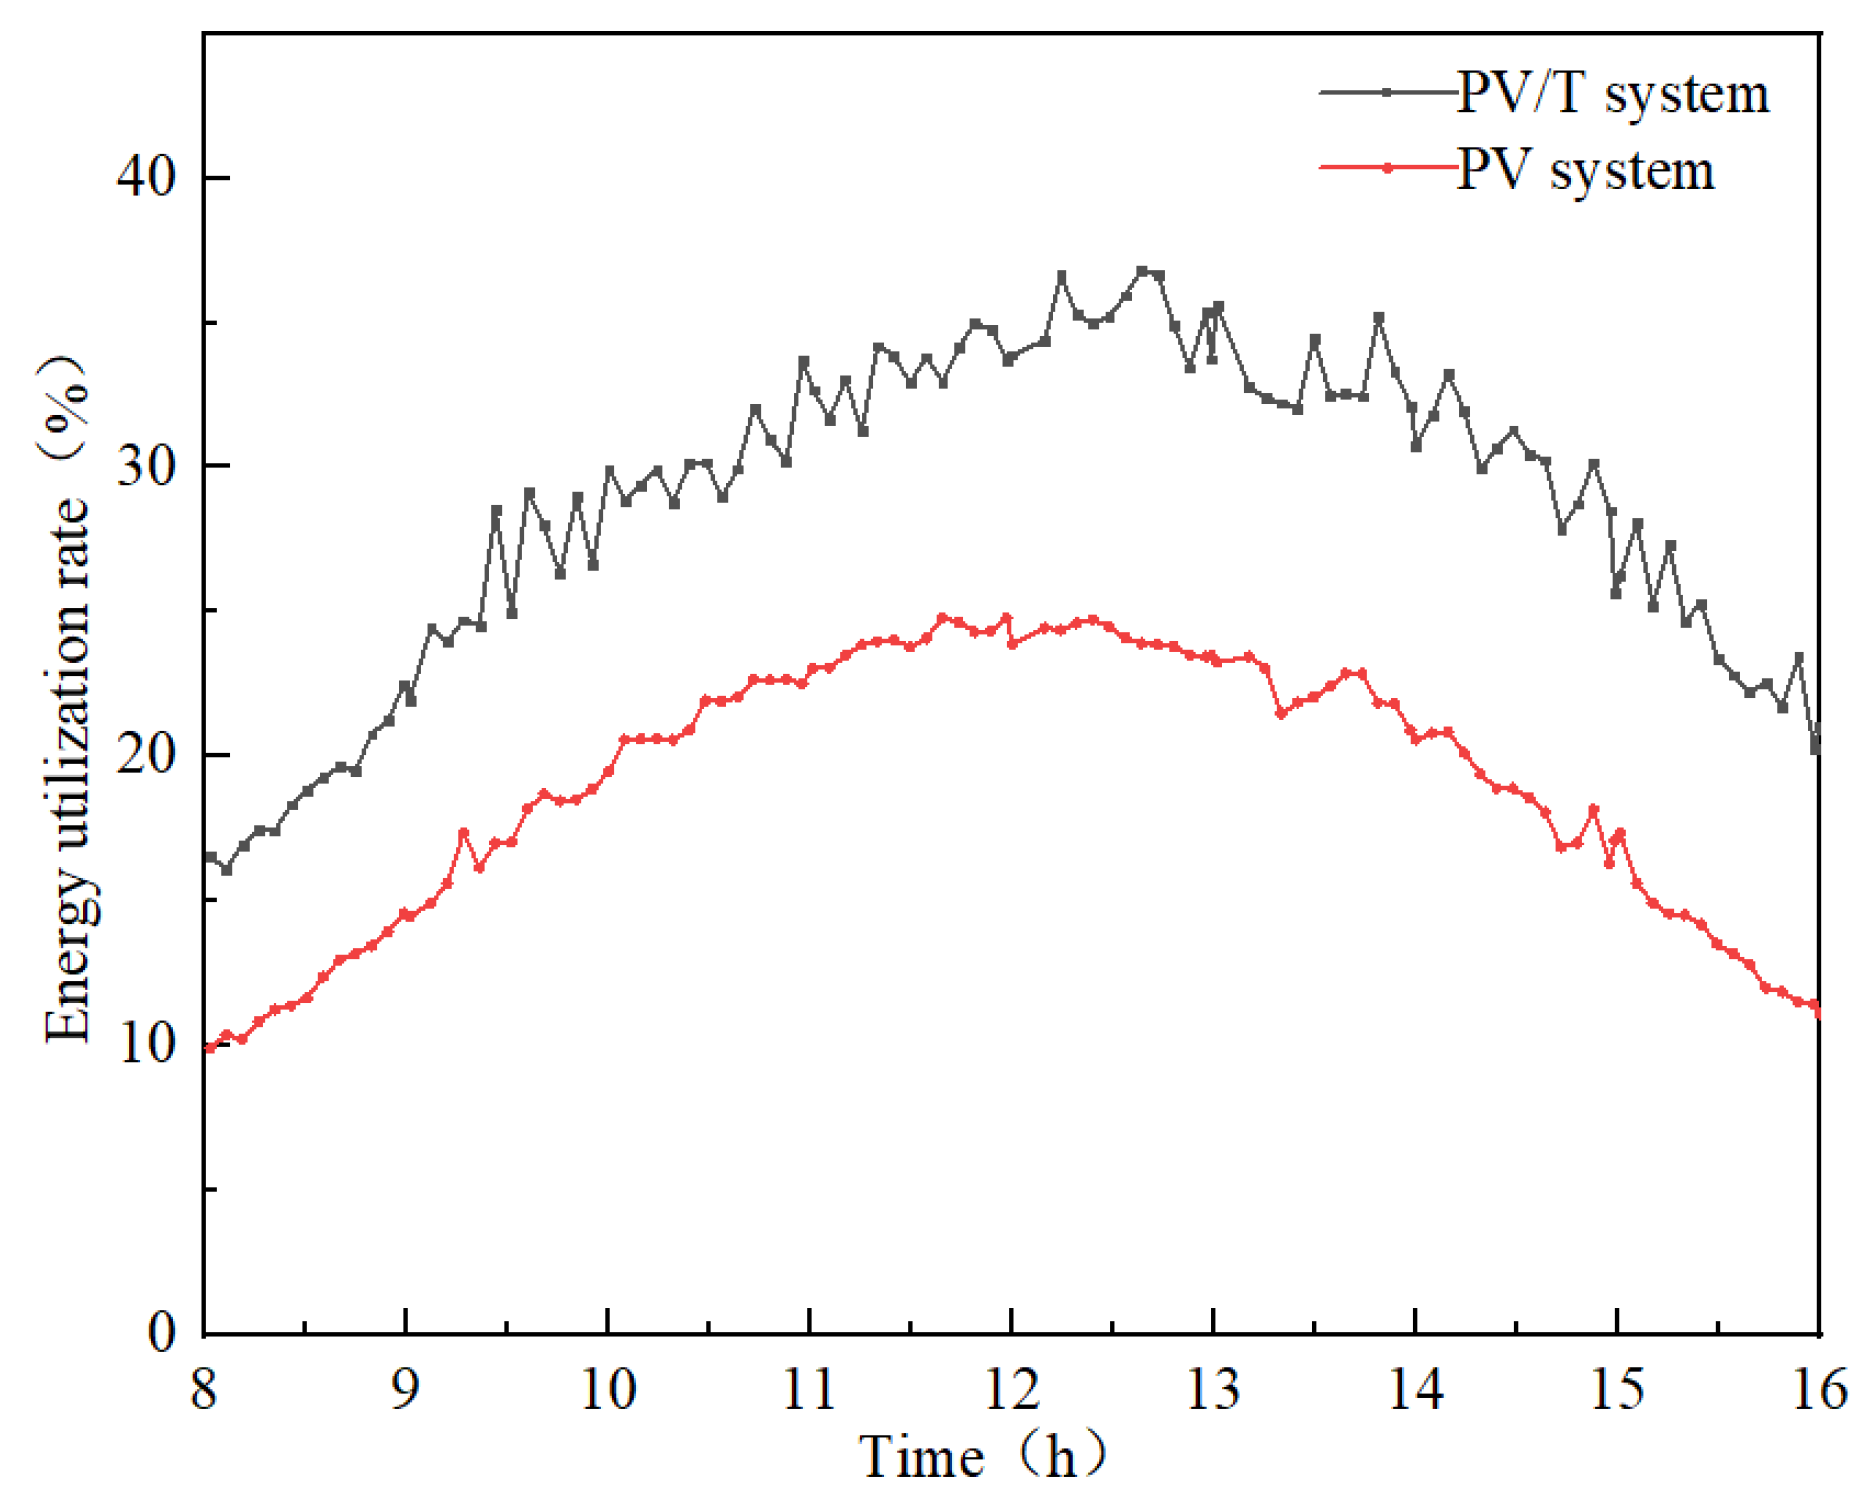
4.3. Energy Efficiency
4.4. PV/T vs. PV Comparison
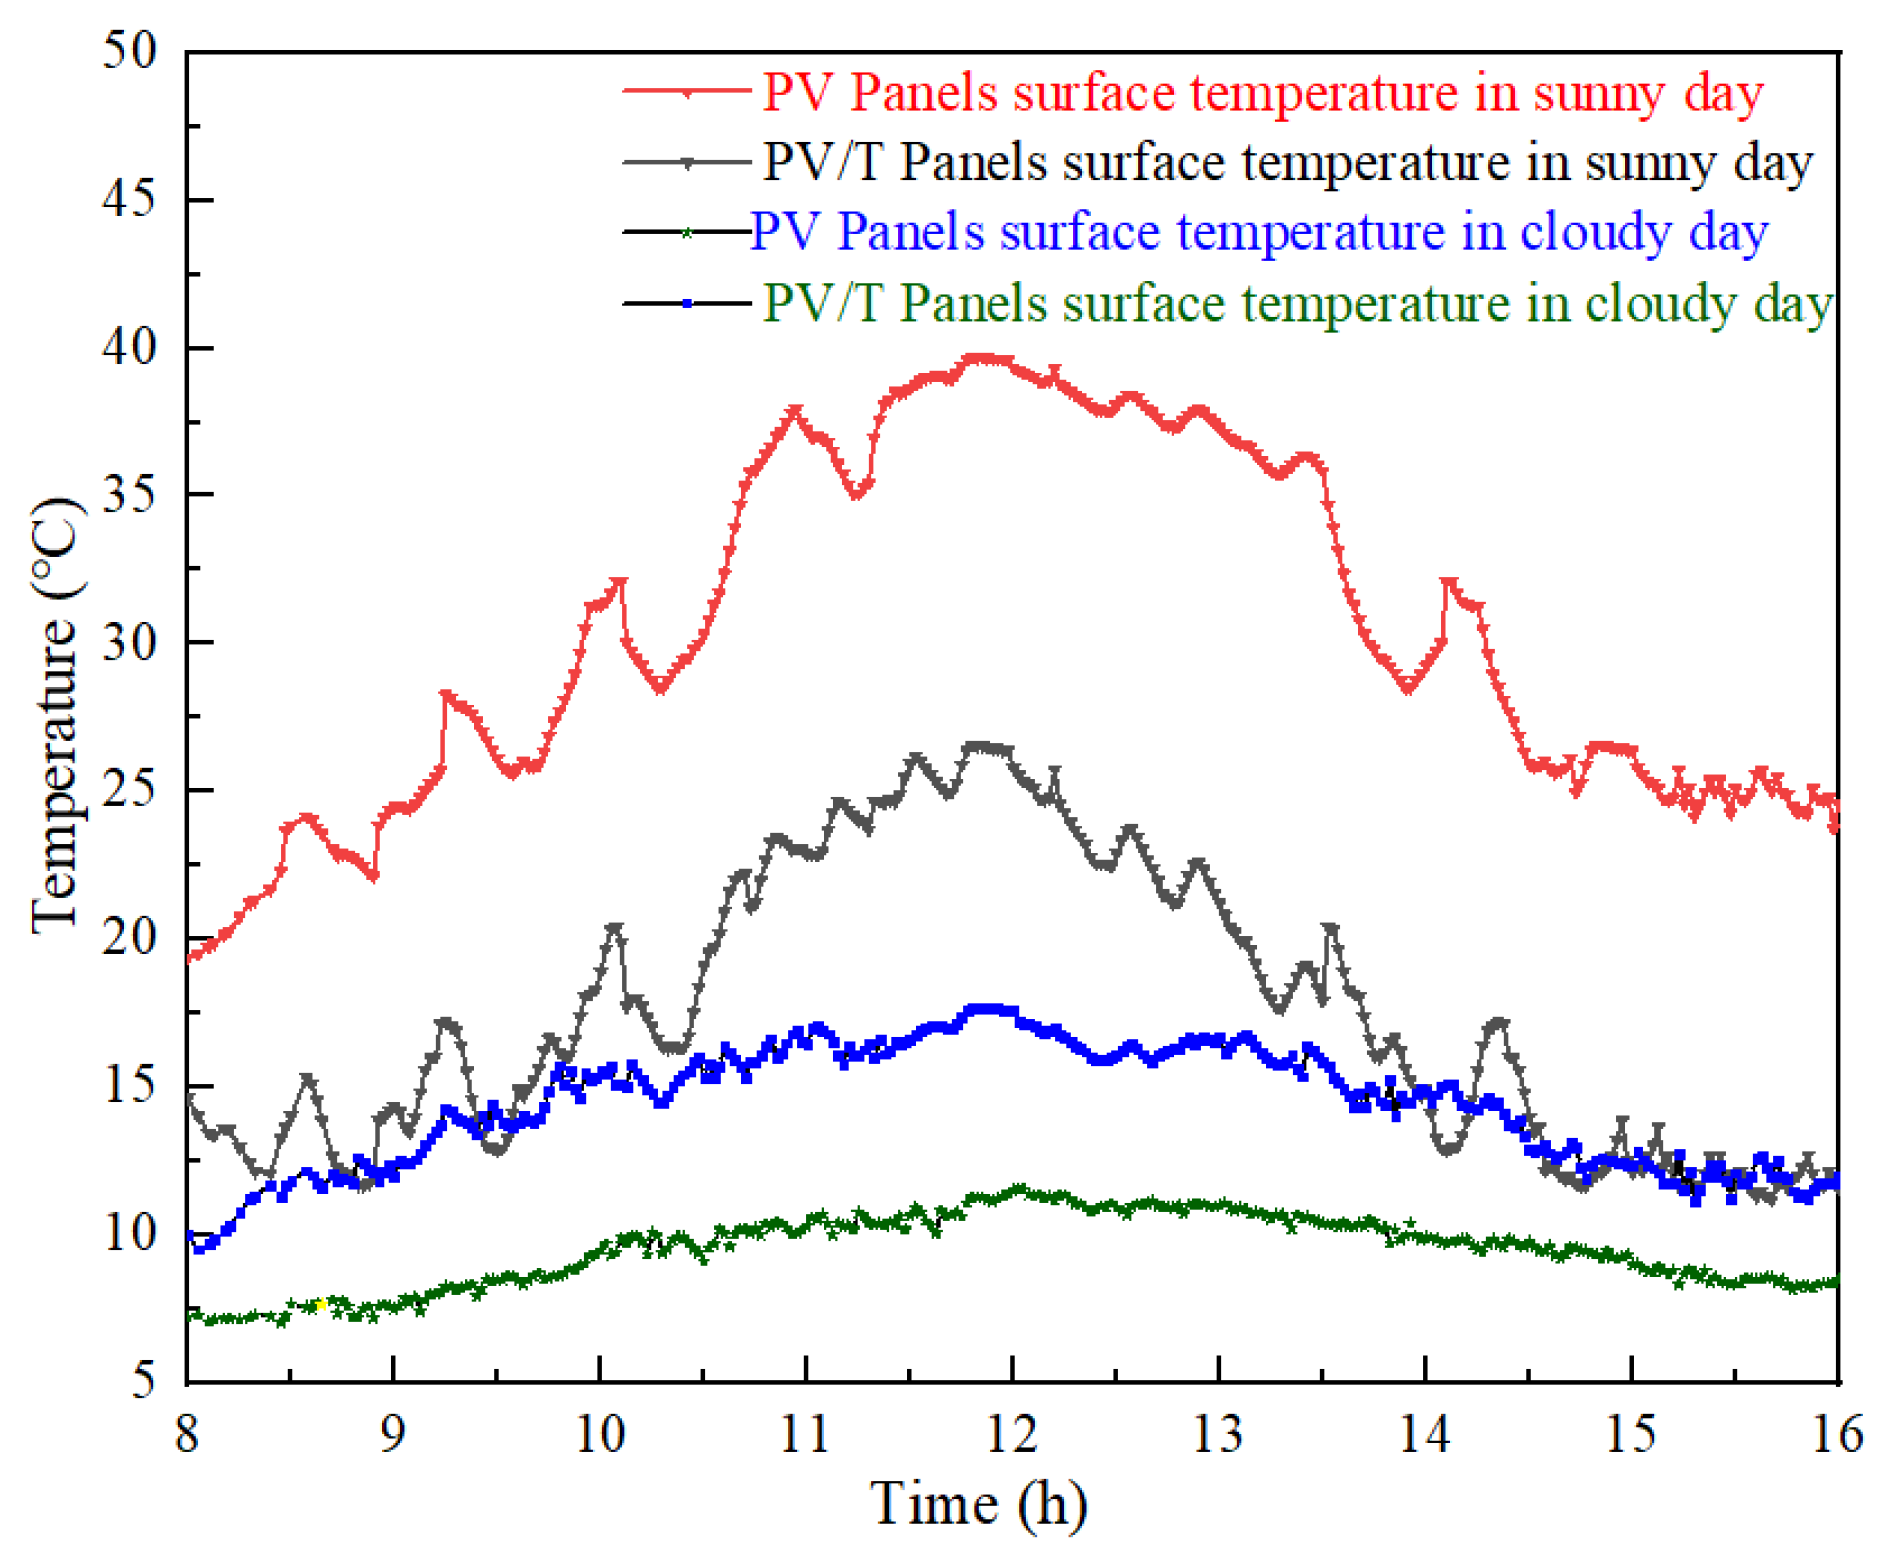
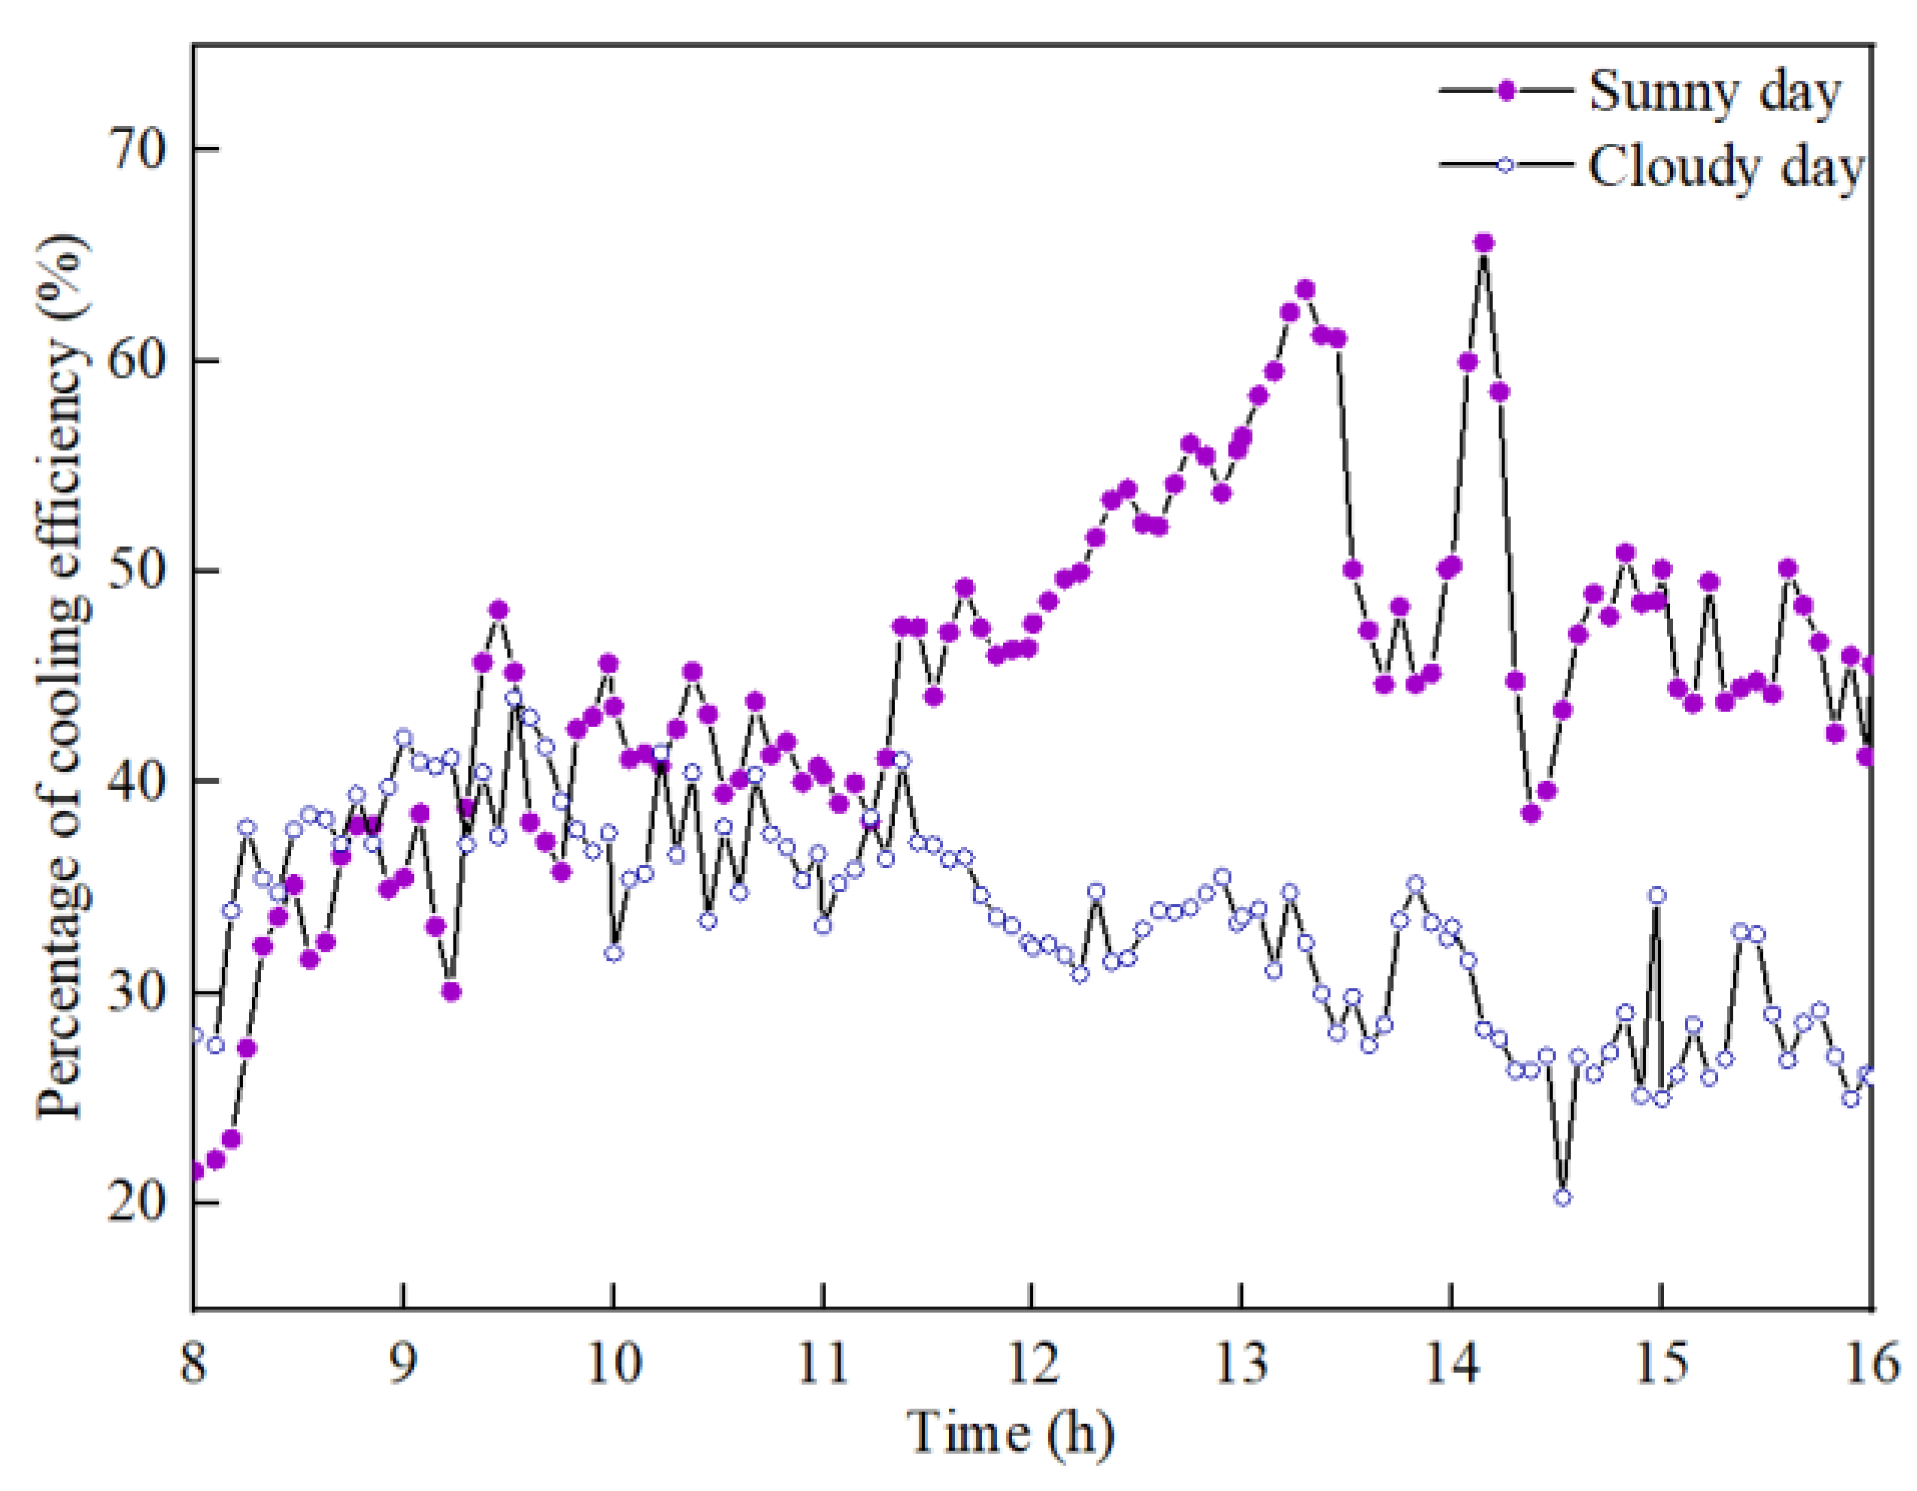
4.4.1. Panel Surface Temperature
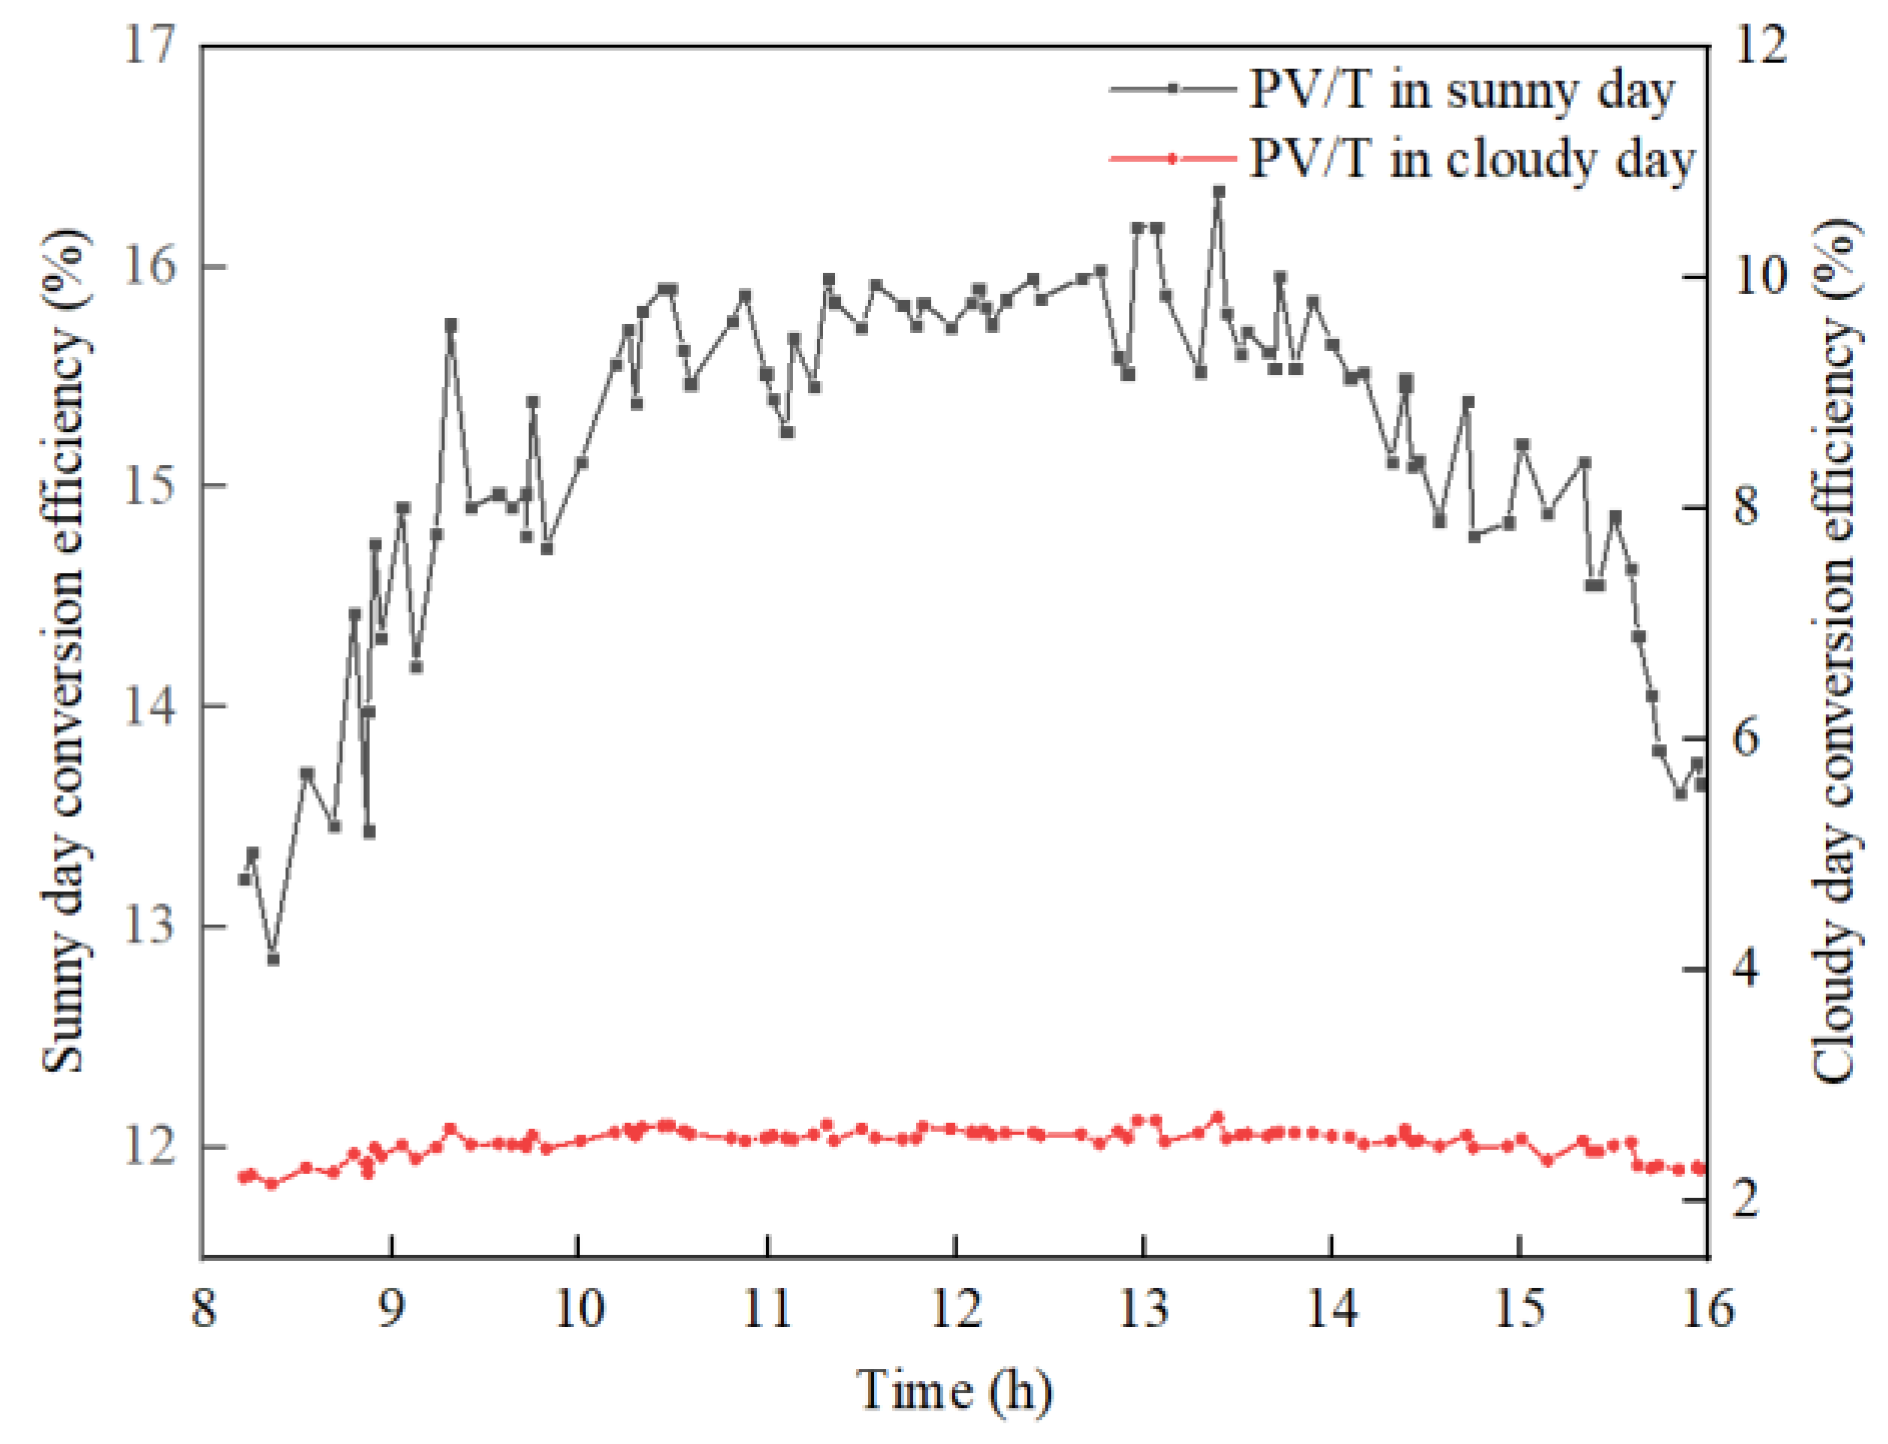
4.4.2. Power Generation Capacity and Efficiency
4.4.3. Total Efficiency Analysis
4.5. Impact of Water Injection Flow Rate on Thermal Power Efficiency
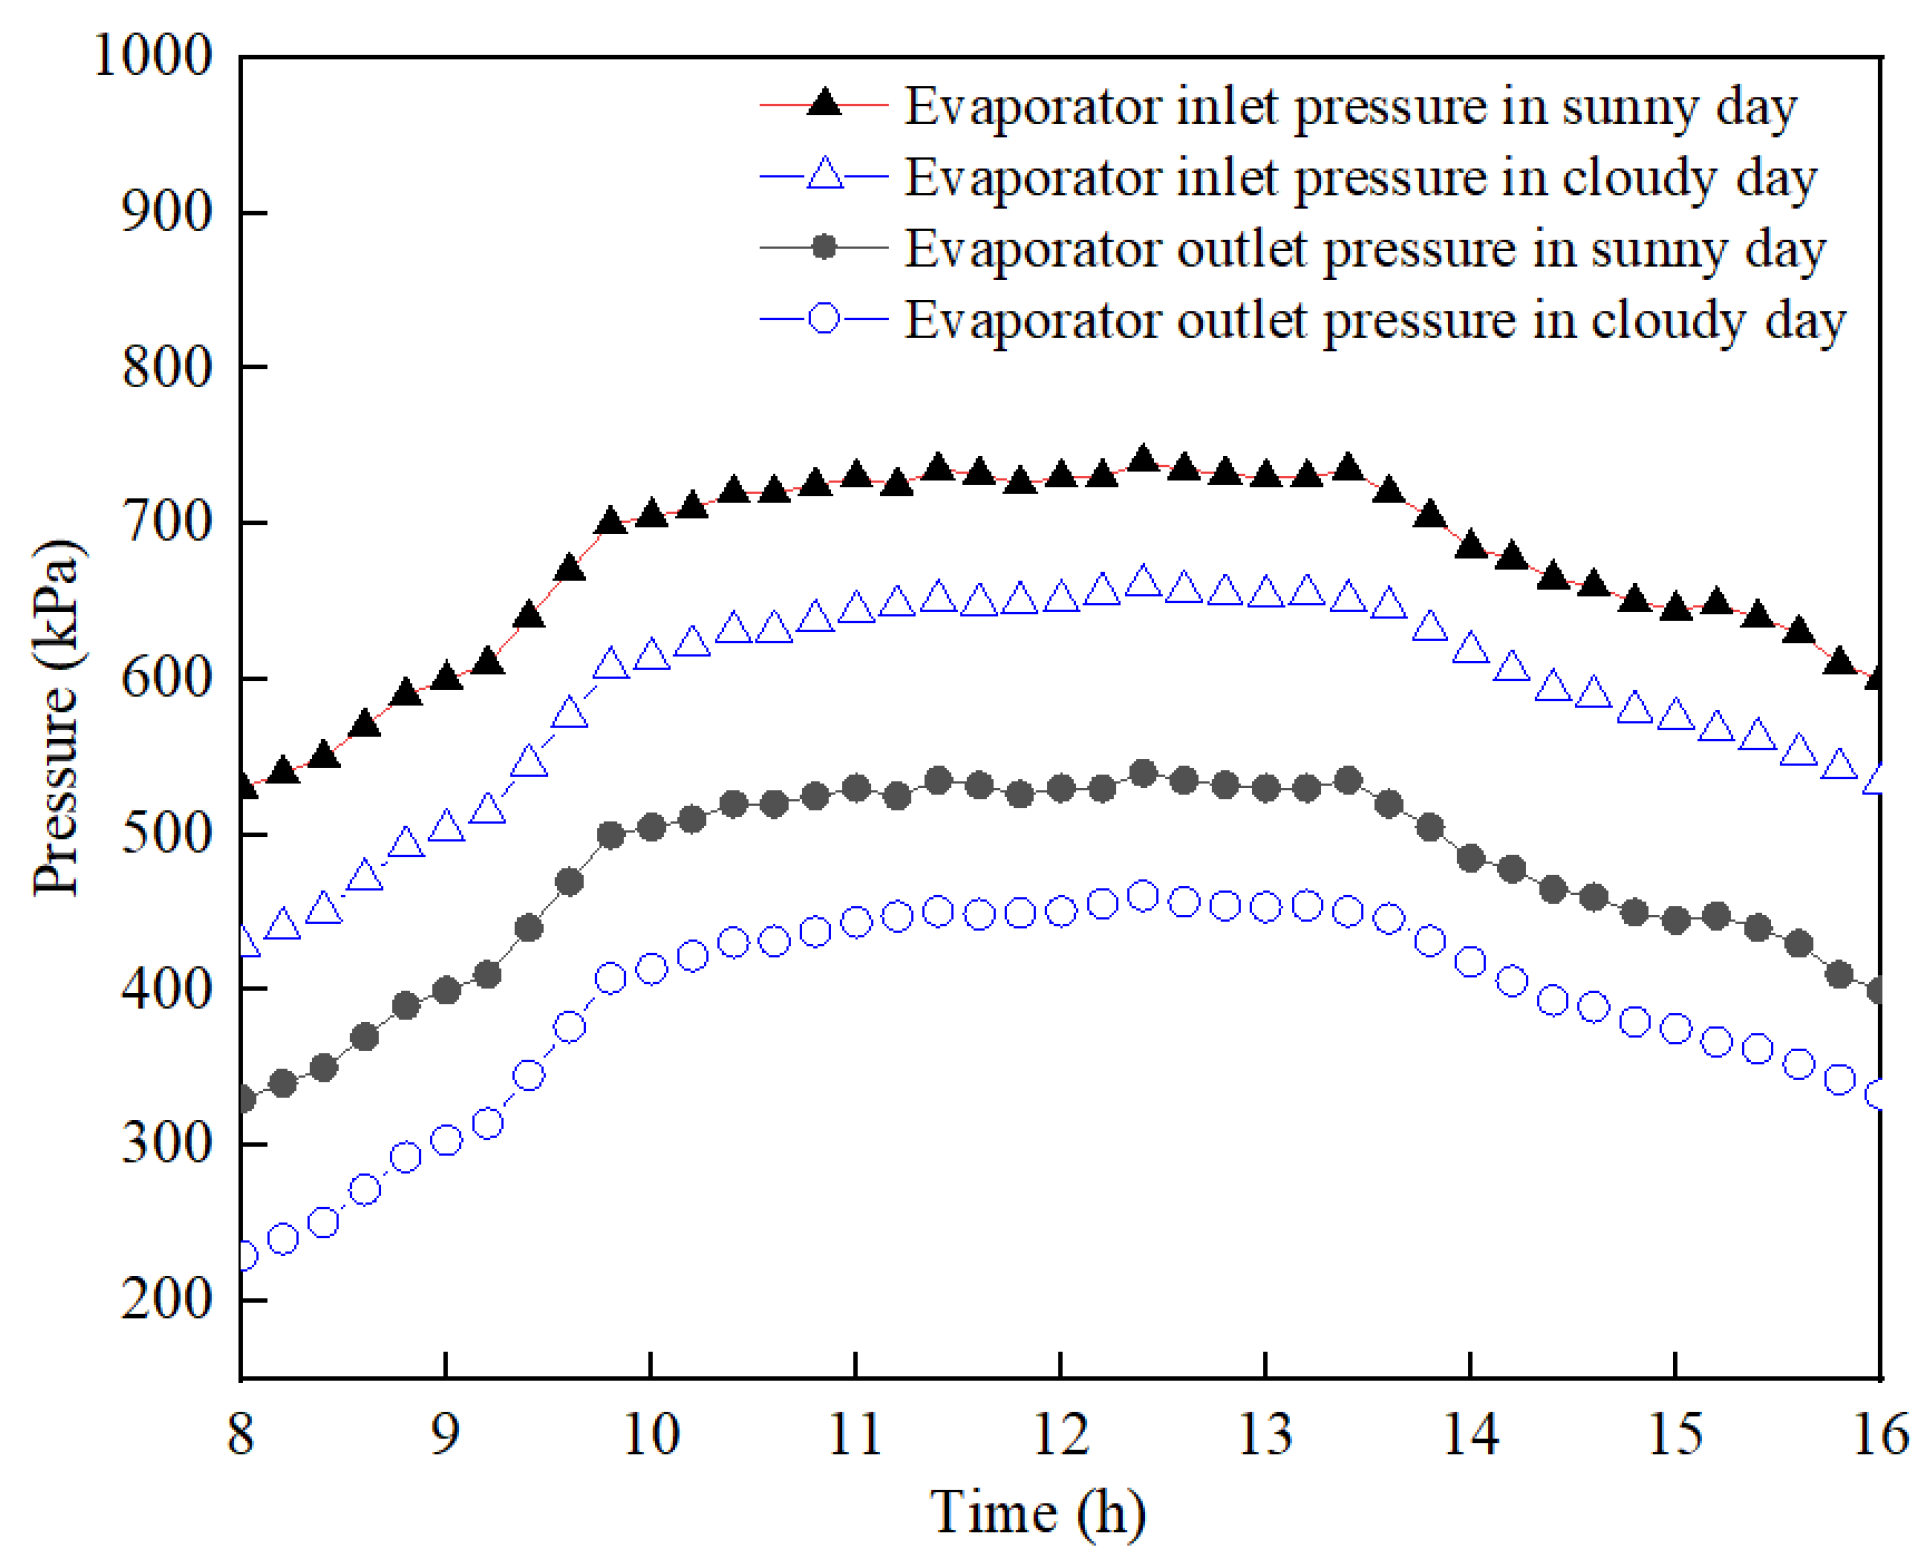
4.6. System Pressure Analysis
5. Conclusions
- (1)
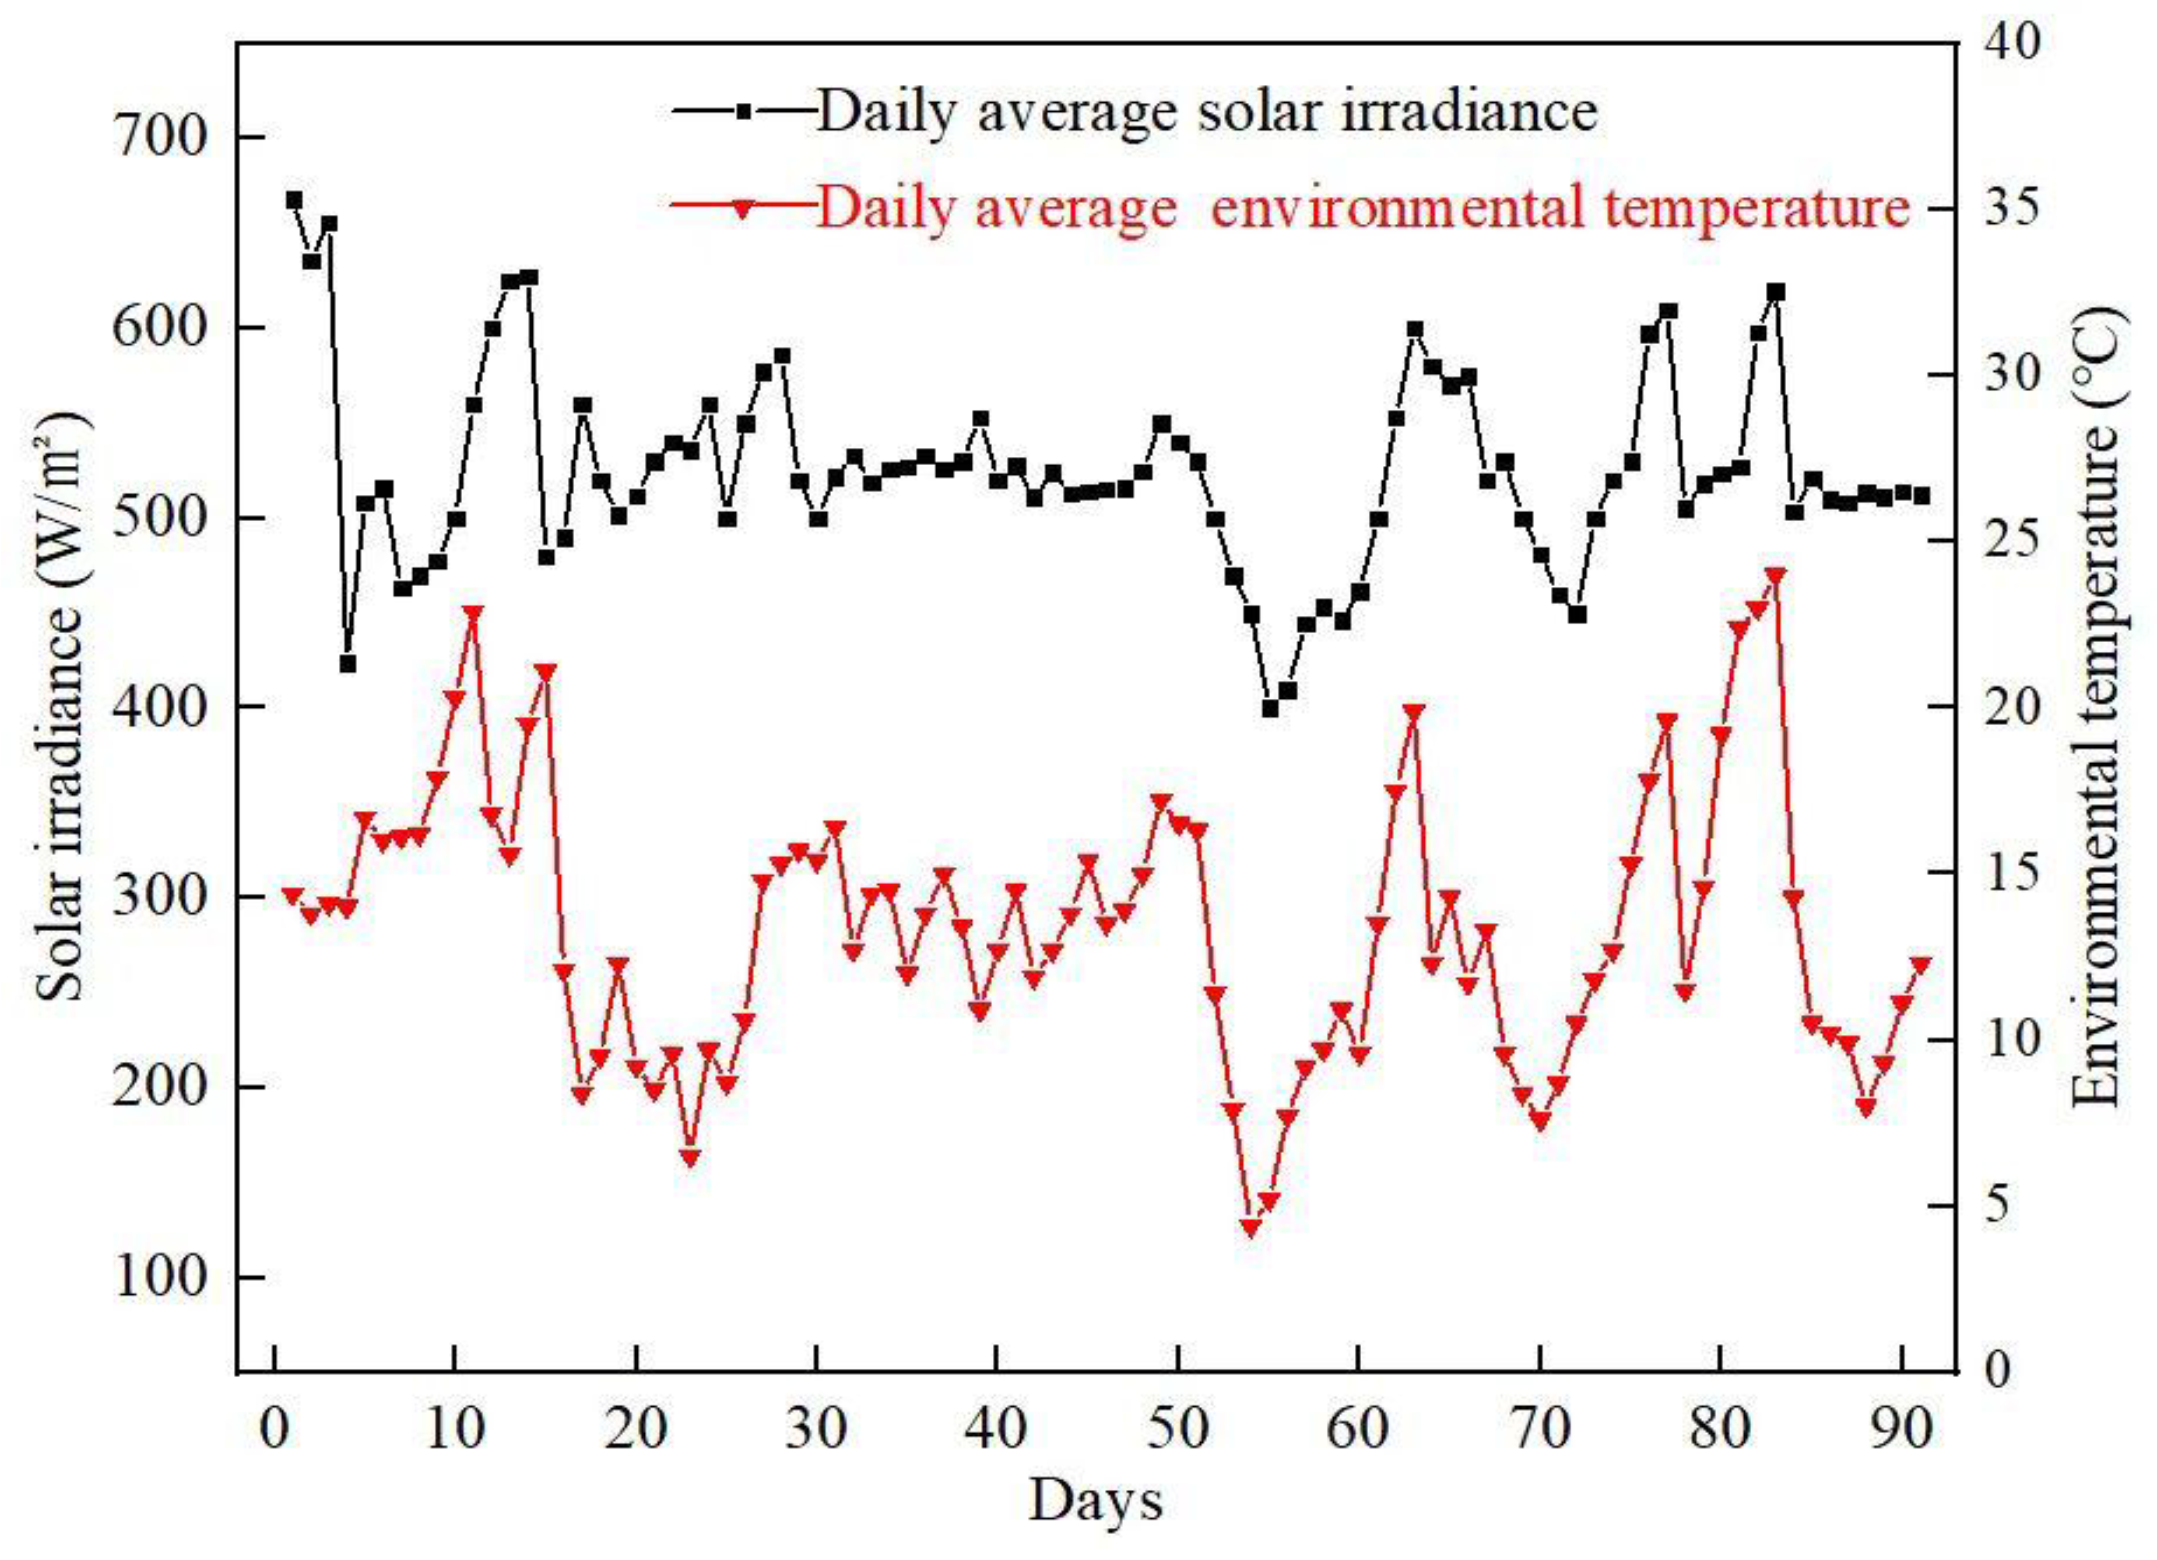
- Regarding the power generation performance, the PV/T system demonstrated superior thermal conductivity, effectively dissipating residual heat accumulated from solar radiation, thereby enhancing the power generation efficiency by an average of 4.73% compared to conventional PV panels. The PV/T-coupled ASHP system achieved an energy utilization rate 5.68–17.76% higher than traditional PV systems, confirming its high efficacy in real buildings in this climate zone. On cloudy days, although the average daily power generation was 15.6 kW·h, the residual power stored in the battery from the previous day could be utilized to ensure the energy demand in the system.
- (2)
- Regarding the heat collection performance, the system produced hot water without electrical reheating, and could maintain an average daily storage tank temperature of 46.8 °C, which satisfies domestic hot water demands. The coupled system presented a coefficient of performance (COP) of 5.68 on sunny days and 4.76 on cloudy days, with an average COP of 5.37. This indicates a 15.24% improvement in comprehensive performance compared to the standalone ASHP operation.
- (3)
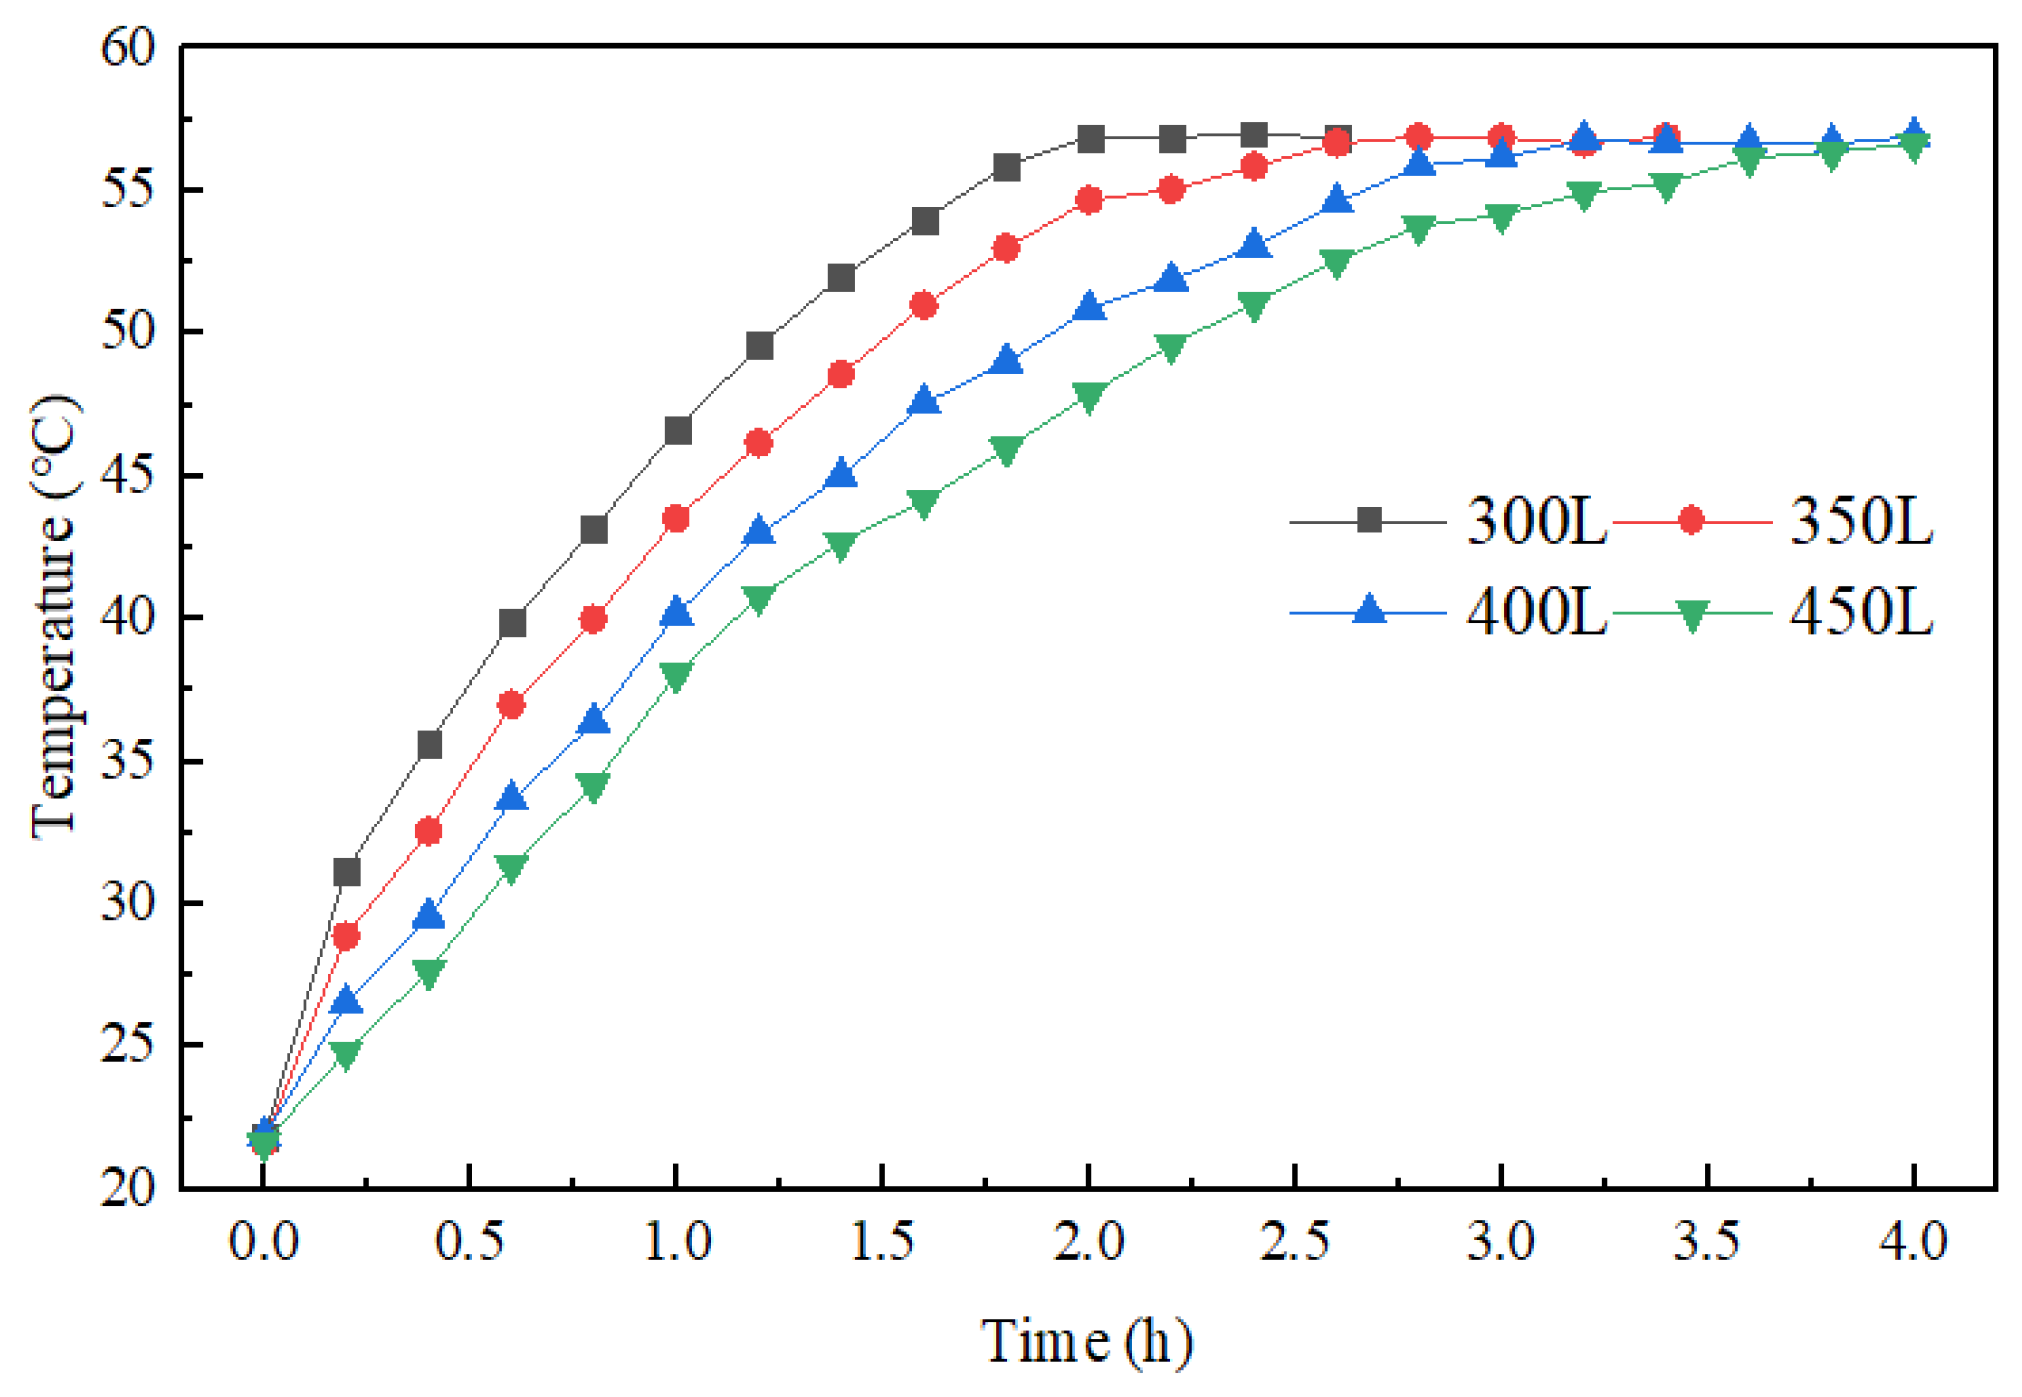
- For the test typical day, when the system water flow rate was 0.7 L/min, the system’s thermal and PV efficiency was the best. The rate of change in the system’s heat loss coefficient was 5.07%, which is relatively low. The best water volume for the system’s water tank was 450 L. The average pressure ratio of the system was 2.57, and the average dimensionless pressure loss coefficient was 0.039, which indicates the coolant uniformity of the PV/T back panel in most weather conditions.
- (4)
- The solar PV/T-coupled ASHP system outperformed traditional PV and ASHP systems in photothermal efficiency, photoelectric efficiency, and overall energy efficiency. These results highlight its promising application for future low-carbon building technologies. Currently, this coupled PV/T system performs well in winter buildings in the hot and humid climate zone of Fuzhou. However, its applicability in cold regions will be further studied.
Author Contributions
Funding
Data Availability Statement
Conflicts of Interest
Nomenclature
| PV/T | Photovoltaic/Thermal |
| PV | Photovoltaic |
| COP | Coefficient of Performance |
| ASHP | Air-Source Heat Pump |
References
- Wang, R. Research on Optimization of Solar Photovoltaic Comprehensive Utilization System. Master’s Thesis, North China Electric Power University, Beijing, China, 2021. [Google Scholar]
- Ji, J.; Pei, G.; He, W.; Sun, W.; Li, G.Q.; Li, J. Research Progress on Solar Photovoltaic/Thermal Systems Utilization, 1st ed.; Science Press: Beijing, China, 2017; pp. 1–2. [Google Scholar]
- Zhang, J. Application Prospect Analysis of PV/T Heat Pump Technology in Carbon Neutrality in Urban and Rural Construction in Northern China; Institute of Building Energy: Dalian, China, 2022. [Google Scholar]
- Li, J.Y.; Wu, J.; Xu, H. Effect of Photovoltaic Energy-Saving Window Factors on Building Heating Load Under Three Control Modes. Buildings 2025, 15, 238. [Google Scholar] [CrossRef]
- Li, S.; He, H.; Dong, K.; Sheng, L. Research on real-time integrated control method of PV-SHAPWH. Sol. Energy 2019, 182, 213–224. [Google Scholar] [CrossRef]
- Choi, Y. Increasing the Utilization of Solar Energy through the Performance Evaluation of Air-Based Photovoltaic Thermal Systems. Buildings 2024, 14, 1219. [Google Scholar] [CrossRef]
- Shao, N.; Ma, L.; Zhang, J. Experimental study on heat transfer performance of roof with PV/T evaporation. Acta Energiae Solaris Sin. 2021, 42, 480–486. [Google Scholar]
- Zhou, C.; Wang, J.; Zhang, J.; Chen, J. Experimental Study on Summer Cooling Characteristics of Single-stage compression PVT Heat pump System. J. Refrig. 2022, 43, 150–160. [Google Scholar]
- Wang, G.; Yang, Y.; Yu, W.; Hu, T.; Han, X. Simulation Analysis of Solar-air Combined heat source Heat Pump System. J. Refrig. 2023, 44, 150–158. [Google Scholar]
- Hou, L.S.; Quan, Z.H.; Du, B.Y.; Zhao, Y.H.; Wang, S.S. Study on the effect of water usage on the performance of photovoltaic solar thermal water system. Acta Energiae Solaris Sin. 2023, 44, 90–98. [Google Scholar]
- Zhang, B.; Lv, J.; Yang, H.; Li, T.; Ren, S. Performance analysis of a heat pipe PV/T system with different circulation tank capacities. Appl. Therm. Eng. 2015, 87, 89–97. [Google Scholar] [CrossRef]
- Zhou, W.; Zhang, X.; Liu, J.; Huang, Z. Experimental Characteristics of Solar-air photovoltaic/photothermal integrated heat pump hot water System. J. Refrig. 2016, 37, 10–16+25. [Google Scholar]
- Xiang, Y.; Chu, L.C.; Fang, Y.; Huang, S.; Liu, J. Experimental research of double-source heat pump hot water system based on PV/T. Acta Energ. Sol. Sin. 2019, 45, 171–178. [Google Scholar]
- Li, G.; Liu, Z.; Li, J.; Liao, H.; Zhu, X. Comparative Study on Electrical and Thermal Performance of a New PV/T Composite System. Mod. Power Eng. 2013, 30, 33–38. [Google Scholar]
- Wang, W.K.; Li, N.; Wei, W.; Ji, J.; Yu, B. The Comprehensive Energy and Exergy Analysis on Thermal-Catalytic-Type and Thermal-Catalytic–Photovoltaic-Type Trombe Walls. Buildings 2025, 15, 1683. [Google Scholar] [CrossRef]
- Li, J.P.; Dai, J.B.; Li, T.P.; Liu, M.; Li, C.; Novakovic, V. Study on the winter performance of HPP-PV/T at different cross sections in cold regions. Acta Energiae Solaris Sin. 2023, 44, 300–307. [Google Scholar]
- Aghakhani, S.; Pordanjani, A.H.; Khdair, A.I.; Afrand, M.; Daneh-Dezfuli, A. Experimental optimization of a PVT hybrid solar system with v-shaped porous plates and controlled airflow. Renew. Energy 2025, 256, 123830. [Google Scholar] [CrossRef]
- Aguilar, J.; Pavon, W.; Dehouche, Z. Experimental Characterization of a Commercial Photovoltaic Thermal (PVT) Hybrid Panel Under Variable Hydrodynamic and Thermal Conditions. Energies 2025, 18, 3373. [Google Scholar] [CrossRef]
- GB/T 51074-2015; Urban Heating Planning Code. Ministry of Housing and Urban-Rural Development of the People’s Republic of China: Beijing, China, 2015.
- GB/T 50293-2014; Urban Power Planning Code. Ministry of Housing and Urban-Rural Development of the People’s Republic of China: Beijing, China, 2014.
- GB/T 39857-2021; National Standardization Administration. Technical Specification for Photovoltaic Power Generation Efficiency. Standards Press of China: Beijing, China, 2021.
- Ren, X. Theoretical and Experimental Study of Photovoltaic Photothermal Comprehensive Utilization System Based on Amorphous Silicon Cells. Ph.D. Thesis, University of Science and Technology of China, Hefei, China, 2021. [Google Scholar]
- Ali, Y.M.; Artur, C.; Maciej, S. A cooling design for photovoltaic panels-water-based PV/T system. Energy 2022, 256, 124654. [Google Scholar]
- Chowt, T. A review on photovoltaic/thermal hybrid solar technology. Appl. Energy 2010, 87, 365–379. [Google Scholar] [CrossRef]
- Klein, S.A. Calculation of flat-plate collector loss coefficients. Sol. Energy 1975, 17, 79–80. [Google Scholar] [CrossRef]


| Component | Criteria | Value |
|---|---|---|
| PV module | PV module area, APV/m2 | 1.85 |
| PV module rated power, PPV/kW | 0.45 | |
| Number of PV modules/n | 4 | |
| PV/T module | PV/T module area, APV/T/m2 | 1.85 |
| PV/T-integrated module power, PPV/T/kW | 0.45 | |
| PV/T-integrated module thermal power, Ph/kW | 0.75 | |
| The number of PV/T components/n | 32 | |
| Type of battery cells | Single crystal | |
| PVT size/mm | ||
| Battery cell size/mm | 182 × 182 | |
| The voltage at the maximum power point, Vmpp/V | 42.11 | |
| The current at the maximum power point, Impp/A | 3.074 | |
| Compressor | Rated power, Pcomp/kW | 2.5 |
| Rated frequency, qcomp/Hz | 50 | |
| Rated voltage, Ucomp/V | 220 | |
| Maximum allowable pressure (Pmax/MPa) | 4.2 | |
| Allowable overpressure for inlet measurement (Pin/MPa) | 1.5 | |
| Water tank | Volume/L | 450 |
| Count/n | 4 | |
| Electronic expansion valve | Nominal cooling capacity, Pex/kW | 6.24 |
| Refrigerant | / | R134a |
| Test Instrument | Instrument Picture | Instrument Model | Environmental Parameter | Range | Precision |
|---|---|---|---|---|---|
| Agilent data acquisition instrument |  | Agilent 34972A/San Jose, CA, USA. | / | / | / |
| Flowmeter | 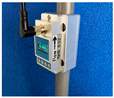 | T3-25/Wuhu, China | Water flow rate | 0~50 (L/min) | ±0.5% |
| Solar irradiance meter |  | YGC-TBQ/Wuhan, China. | Solar irradiance | 1–2000 W/m2 | ±1.0% |
| Thermocouple |  | WRN-230/Shanghai, China. | Measure the temperature of the PV panel | −20~350 (°C) | ±0.5% |
| Parameters | Value | Parameters | Value |
|---|---|---|---|
| Rated Voltage | 220 V | Rated Input Power | 2.5 kW |
| Rated Frequency | 50 Hz | Maximum Input Power | 3.6 kW |
| Rated Input Current | 11.4 A | Maximum Input Current | 16 A |
| Rated Pressure on Water Side | 0.7 MPa | Mass | 115 kg |
| Water Pressure Drop of Heat Exchanger | ≤30 kPa | Allowable Working Overpressure on Suction Side | 1.5 MPa |
| Maximum Allowable Pressure on High/Low-Pressure Side | 4.2 MPa | Allowable Working Overpressure on Discharge Side | 4.2 MPa |
| Noise | ≤53 dB (A) | Model Number | KSD95 EPA |
| Categories of Control | Determining Factors | Operating Conditions | Trigger Conditions | Numeric Parameters |
|---|---|---|---|---|
| Compressor start–stop control | Heat the water in the water tank/surface temperature of the PV/T plate | Compressor starts | The water temperature in the water tank is below the lower limit or the temperature of the PV/T panel is above the upper limit | ≤40 °C/≥35 °C |
| Compressor stops | The water temperature in the tank is above the upper limit and the temperature of the PV/T panel is below the lower limit | ≥55 °C/≤15 °C | ||
| System operation control | Solar irradiance | PV/T heat pump mode | Abundant sunlight | ≥200 W/m2 |
| ASHP mode | No sunlight | ≤50 W/m2 | ||
| Dual-source operation mode | Insufficient light | ≥50 W/m2 ≤200 W/m2 |
Disclaimer/Publisher’s Note: The statements, opinions and data contained in all publications are solely those of the individual author(s) and contributor(s) and not of MDPI and/or the editor(s). MDPI and/or the editor(s) disclaim responsibility for any injury to people or property resulting from any ideas, methods, instructions or products referred to in the content. |
© 2025 by the authors. Licensee MDPI, Basel, Switzerland. This article is an open access article distributed under the terms and conditions of the Creative Commons Attribution (CC BY) license (https://creativecommons.org/licenses/by/4.0/).
Share and Cite
Ning, H.; Liang, F.; Wu, H.; Qiu, Z.; Fan, Z.; Xu, B. Research on the Operating Performance of a Combined Heat and Power System Integrated with Solar PV/T and Air-Source Heat Pump in Residential Buildings. Buildings 2025, 15, 2564. https://doi.org/10.3390/buildings15142564
Ning H, Liang F, Wu H, Qiu Z, Fan Z, Xu B. Research on the Operating Performance of a Combined Heat and Power System Integrated with Solar PV/T and Air-Source Heat Pump in Residential Buildings. Buildings. 2025; 15(14):2564. https://doi.org/10.3390/buildings15142564
Chicago/Turabian StyleNing, Haoran, Fu Liang, Huaxin Wu, Zeguo Qiu, Zhipeng Fan, and Bingxin Xu. 2025. "Research on the Operating Performance of a Combined Heat and Power System Integrated with Solar PV/T and Air-Source Heat Pump in Residential Buildings" Buildings 15, no. 14: 2564. https://doi.org/10.3390/buildings15142564
APA StyleNing, H., Liang, F., Wu, H., Qiu, Z., Fan, Z., & Xu, B. (2025). Research on the Operating Performance of a Combined Heat and Power System Integrated with Solar PV/T and Air-Source Heat Pump in Residential Buildings. Buildings, 15(14), 2564. https://doi.org/10.3390/buildings15142564