Article

Cross-Modal Insights into Urban Green Spaces Preferences

College of Landscape Architecture, Nanjing Forestry University, Nanjing 210037, China
*
Author to whom correspondence should be addressed.
Buildings 2025, 15(14), 2563; https://doi.org/10.3390/buildings15142563
Submission received: 2 June 2025 / Revised: 16 July 2025 / Accepted: 18 July 2025 / Published: 20 July 2025
(This article belongs to the Section Architectural Design, Urban Science, and Real Estate)

Abstract

Urban green spaces (UGSs) and forests play a vital role in shaping sustainable and livable cities, offering not only ecological benefits but also spaces that are essential for human well-being, social interactions, and everyday life. Understanding the landscape features that resonate most with public preferences is essential for enhancing the appeal, accessibility, and functionality of these environments. However, traditional approaches—such as surveys or single-data analyses—often lack the nuance needed to capture the complex and multisensory nature of human responses to green spaces. This study explores a cross-modal methodology that integrates natural language processing (NLP) and deep learning techniques to analyze text and image data collected from public reviews of 19 urban parks in Nanjing. By capturing both subjective emotional expressions and objective visual impressions, this study reveals a consistent public preference for natural landscapes, particularly those featuring evergreen trees, shrubs, and floral elements. Text-based data reflect users’ lived experiences and nuanced perceptions, while image data offers insights into visual appeal and spatial composition. By bridging human-centered insights with data-driven analysis, this research provides a robust framework for evaluating landscape preferences. It also underscores the importance of designing green spaces that are not only ecologically sound but also emotionally resonant and socially inclusive. The findings offer valuable guidance for the planning, design, and adaptive management of urban green infrastructure in ways that support healthier, more responsive, and smarter urban environments.

1. Introduction

As society has evolved and residents’ needs have diversified, the quality of urban parks has received increasing attention. Urban parks have become the public spaces most closely related to citizens’ daily lives, helping to relieve life stress [1,2], improve physical [3] and mental health [4,5], and enhance social well-being [6]. Parks and urban forests provide recreational, aesthetic, and spiritual value to the public [7], promote exercise and social interaction [8,9], and increase residents’ overall sense of happiness [10] and belonging [11,12]. For a long time, the planning and design of urban parks have been dominated by professionals in a top-down manner, despite the fact that the actual users of parks are the public, whose perceptions and preferences of the landscape differ from those of professionals [13,14]. With the growing demand for high-quality urban parks, evaluating landscape quality and preferences from a human-centered perspective has become increasingly important. The public’s perceptions and preferences regarding these spaces have become key factors in enhancing park attractiveness and optimizing park design. Studies have shown that individual preferences and perceptions of green space have become important influences on well-being [15] and mental health [16]. This further reflects the practical significance of landscape-preference research.
Landscape preference refers to the degree of people’s preference for a given landscape based on their basic perceptions of the landscape; it is used as an evaluative judgment of fondness. Traditional methods used in landscape-preference research, such as photo-based questionnaire surveys [17,18] and interviewer-based visitor surveys, have limitations, including small sample sizes and susceptibility to personal bias. User-generated content (UGC), including videos, photos, and reviews, reveals visitors’ emotional responses, actual needs, and preferences with regard to park landscapes [19,20], and has gradually become a data source for research on landscape preferences. Social media platforms like Instagram, Twitter, and Weibo provide authentic and detailed information in forms such as comments, images, videos, and location data for urban green space (UGS) research [21], and such data have served as effective proxy indicators for landscape visits and landscape preference studies [22]. In recent years, metadata, text, and images from social media have become important sources of data for studying landscape preferences and park usage patterns [23,24]. The rapid development of deep learning and convolutional neural networks (CNNs) has significantly advanced computer-vision technology. Using computer vision to interpret UGC images not only reduces labor costs and improves data-processing efficiency but also overcomes the limitations of small sample sizes and manual analysis, and these advantages have caused this approach to increase in popularity. Object detection can be used to analyze visitors’ activities [25], facial expressions, and emotions [26,27]. At the same time, object detection is also applied to identify landscape elements; for example, Li and Qiu developed an object-detection model to identify landscape elements of ancient canals in China and found that the “Canal and Watercraft Remains” landscape is a locally distinctive feature that is highly favored by visitors [28]. Ma and Qiu conducted object detection on online images of seven lake parks in Wuhan and found that evergreen trees, lakes, background buildings, lawns, and reflections are the most favorably perceived elements in these lake parks [29].
Images can convey the photographer’s preferences only in visual terms, lacking other dimensions of sensory experience such as auditory, olfactory, and tactile information. In contrast, textual data can reflect visitor preferences across multiple dimensions of perception [30]. Natural language processing (NLP) can be used to mine deep information such as personal experience, perception, opinions, attitudes, and emotional responses. Sentiment analysis can evaluate large volumes of text and convert unstructured text into sentiment scores. It has been widely used to quantify perceptions of urban parks [31]. A study by Huang et al. demonstrated that deep learning-based NLP methods can enhance the value of social media data for sentiment analysis [32]. Luo et al. used ERNIE 2.0 to analyze online texts related to water parks and found that users expressed more positive sentiments about water and plant landscapes and more negative sentiments about service facilities and themed activities [33].
These tools have shown considerable advantages in revealing the characteristics of the public’s landscape preferences. However, existing studies have mainly focused on visual aspects of landscape perception, while research combining multimodal data such as textual reviews and images remains limited. The differences in preferences for landscape elements expressed across text and image modalities have not been fully explored, and there is a need for further systematic research on cross-modal analytical methods. In response to the above-described research, this study collected data from user-generated online reviews and used NLP, image object detection, and deep learning to identify the preferences of park users with regard to landscape features, as well as the characteristics of the public’s spatiotemporal preferences with regard to urban parks. We attempt to answer three questions: What are the potential public-preferred landscape elements represented in social media photos? What types of landscapes are more favored by the public? Are there differences in the landscape preferences reflected in different data types? To answer these questions, 19 urban parks in Nanjing were selected as the research objects. By collecting user-generated textual reviews and photos, this study explores the relationships among landscape types, element composition, and visitor preferences in 19 urban parks in the main urban area of Nanjing and introduces a cross-modal quantitative method to comprehensively assess the public’s landscape preferences. By bridging human-centered insights with data-driven analysis, this research provides a framework for evaluating landscape preferences and advances current research on urban green spaces.

2. Site and Data Collection

2.1. Site and Sample Selection

Nanjing is located in eastern China and is one of the four ancient capitals of the country. With a long history and a favorable geographical location, it serves as a key national gateway city that connects the development of the central and western regions through the Yangtze River Delta. As of 2024, the city had a forest-coverage area of over 2.97 million mu and a per capita park green space of 16.2 square meters, ranking highly in these regards among comparable Chinese cities. The main urban area of Nanjing is rich in natural and cultural resources such as mountains, lakes, rivers, and historical heritage, thus creating a rich and varied landscape of urban parks. Due to factors such as time since construction, management, and maintenance, the scenery presented by each park varies, and so do the evaluations from users. This study selected 19 urban parks with high visitation frequencies and large numbers of user reviews as research cases. These parks are distributed across six districts: Gulou, Xuanwu, Qinhuai, Yuhuatai, Jianye, and Qixia (Figure 1). These parks (Appendix A Table A1) vary in size from 9.5 to 504.4 hm2. The amount of user-generated data for these samples is sufficient in volume, and the selected parks cover a broad geographical area, providing detailed data support for the study of landscape preferences in urban parks.

2.2. Data Sources

This study selected Trip (https://www.ctrip.com/, accessed on 21 January 2024), Dianping (https://m.dianping.com/, accessed on 20 January 2024), and Sina Weibo (https://weibo.com/, accessed on 20 January 2024) as the data-collection platforms. Trip and Dianping are popular online travel-service platforms in China that have accumulated large amounts of UGC, including textual reviews, visual images, and geotagging information. Sina Weibo is the largest social media platform in China. Although it contains some redundant information, its user-generated data are closely related to everyday life and can be interpreted to reflect the public’s preferences in regard to landscapes encountered in daily leisure activities. By integrating data from these two platforms, this study reduced the potential selection bias and content limitations associated with using a single data source. A web-crawler tool was developed using Python 3.12.1 to extract and store textual review data and photo data published by visitors to 19 urban parks in Nanjing. The sampling period was from January 2019 to December 2023. A total of 27,343 textual reviews were collected, comprising approximately 2.4 million Chinese characters, including fields such as the username, posting time, rating, and location. A total of 110,762 visitor photos were also collected.

2.3. Data Cleaning

The text data were cleaned using Python 3.12.1 libraries such as langdetect and pandas, removing duplicate content, news information, advertisements, and explanatory text and retaining only original content published by individuals. We treated verbatim reviews as duplicate comments and used the “.drop_duplicates()” function to identify and remove identical comments. Comments unrelated to park landscapes were also deleted. The sampling period was set from January 2019 to December 2023, and the language was limited to Chinese. A total of 19,197 landscape-related comments from 19 urban parks were collected, amounting to over 2.2 million characters. The result was a text dataset centered on park landscapes.
In the collection of image data, low-resolution images were filtered out and duplicate images were removed using the Image Hash library in Python 3.12.1. Images unrelated to park landscapes, such as close-up portraits, maps, food, and indoor scenes, were manually deleted. Images were standardized by conversion to RGB format and were uniformly saved as JPG files. The image size was fixed at 1024 × 1024 pixels, maintaining the original aspect ratio during scaling, with gray padding added to fill any empty space. The final image dataset, focused on park landscapes, contained a total of 93,363 images.

2.4. Research Design

For the analysis of preferred park characteristics, SPSSAU 15.0 was used to conduct word-frequency analysis and term frequency–inverse document frequency (TF–IDF) keyword analysis in order to explore trends in the visitors’ preferences for landscape elements and types, as reflected in the textual reviews. Objects were detected in image content for analysis of the landscape elements and combinations thereof that were favored by visitors. The Baidu general object-recognition model was employed to analyze and assign multiple labels to customized landscape elements, and an image object-detection model was constructed using the Baidu Easy deep learning platform (EASY DL). The publishing dates and volumes of the text-based data were statistically analyzed and tested to examine trends in mean sentiment values and data volumes across different time dimensions. Cosine similarity was used to evaluate the similarity of landscape preferences between the text and image data modalities, analyzing the cross-modal characteristics of users’ landscape preferences. The research process is shown in Figure 2.

2.5. Research Methods

2.5.1. TF–IDF Keywords

TF–IDF is a statistical method commonly used in text mining and information retrieval to evaluate the importance of a particular word in a document set or corpus. A high TF–IDF value indicates that a term appears frequently in a particular document but is relatively rare across the entire dataset [34]. We used Python 3.12.1 to calculate the TF–IDF of landscape elements in the text of the comments. Word-frequency analysis was performed to identify high-frequency words and was followed by the calculation of TF–IDF weights for landscape-related terms. The calculation formula is as follows:
T F I D F ( t , d , f ) = T F t , d × I D F t , d = n t , d N t , d × log ( N D n t )
where T F t , d represents the term frequency of word t in document d , n t , d refers to the number of times word t appears in document d , and N t , d refers to the total number of words in document d . I D F t , d refers to the inverse document frequency of word t ; N D is the total number of documents in the document set D ; and n t is the number of documents containing the word t .

2.5.2. Image Object-Detection Model

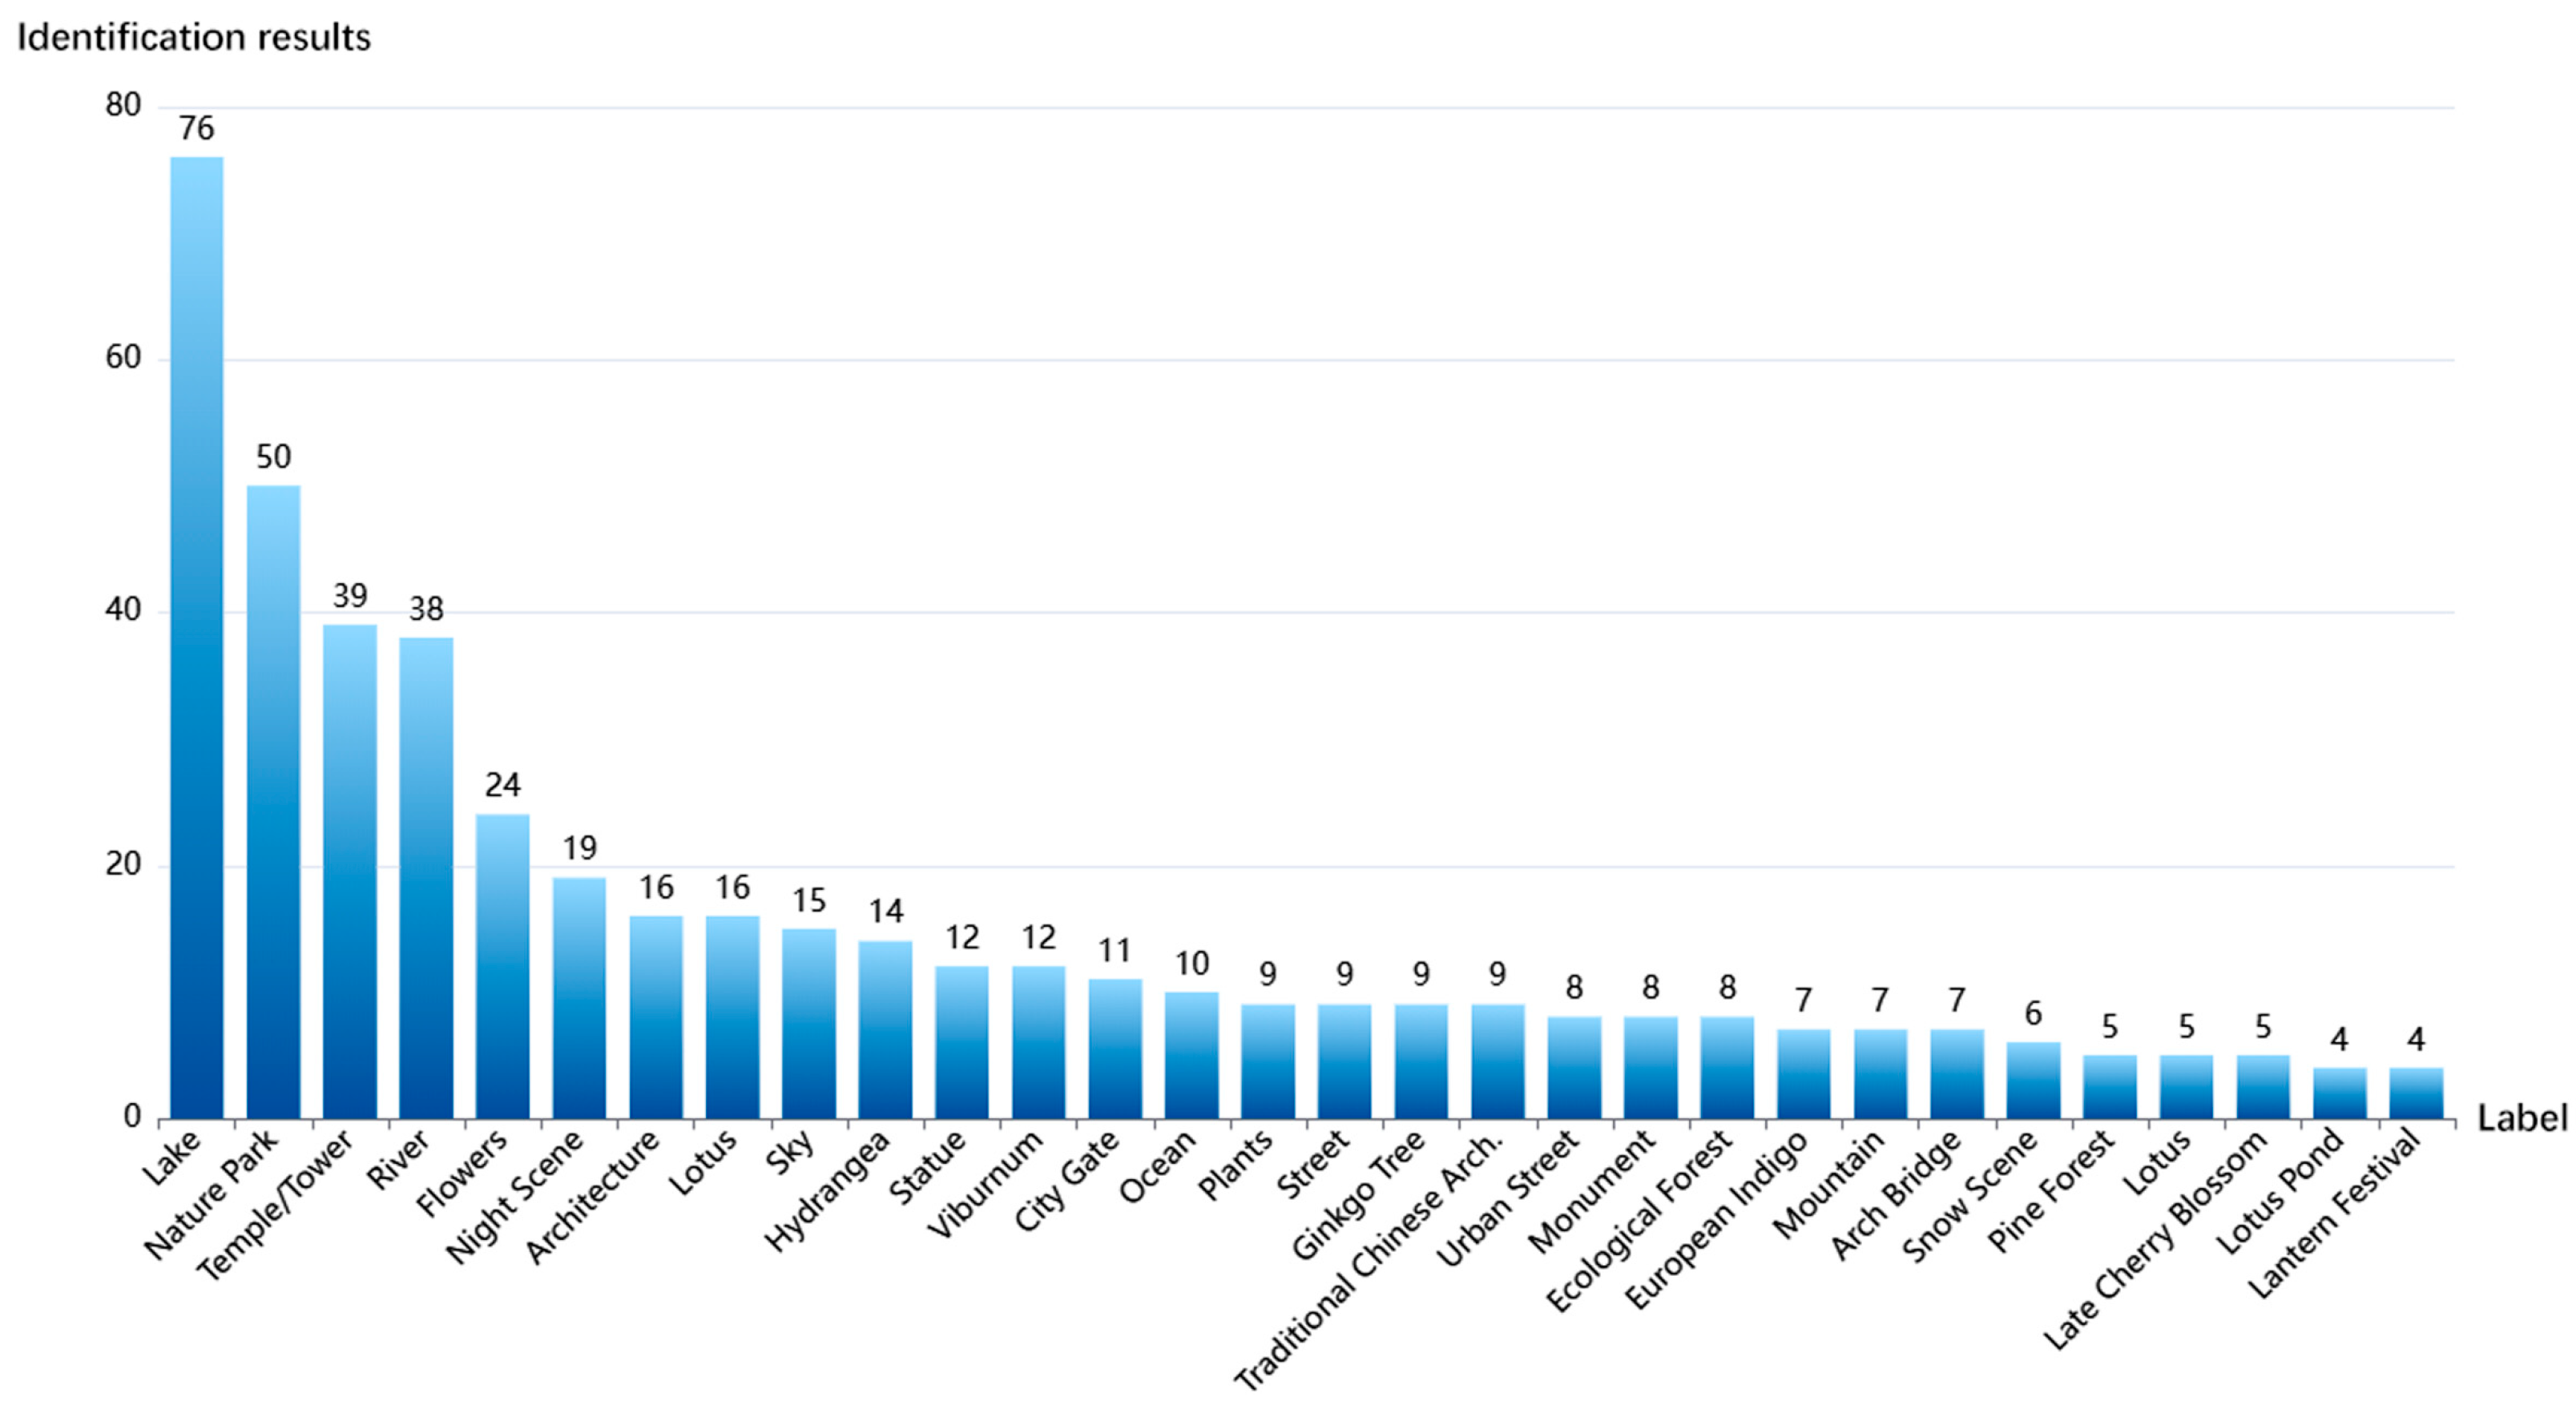
The sample photos were identified using the Baidu general object-recognition and scene-recognition model. Figure 3 visually shows the top 30 highest-frequency tags. Tags irrelevant to the research were removed; tags with similar meanings were merged; and tags with the same attributes (e.g., “night scene” and “night lighting”) were integrated. Ultimately, a total of 26 tags were used for the image object-detection model (Table 1).
The object-detection model was trained using the online machine learning algorithm provided by Baidu Cloud. Easy DL (ai.baidu.com) is a machine learning model-/development platform launched by Baidu. Its object-detection model can identify and locate multiple objects in images and is designed for users without algorithmic expertise. Easy DL uses a customizable object-detection framework based on deep CNNs, and the pre-trained models are based on Baidu’s large-scale datasets. In total, 2000 images were randomly selected from the landscape-photo dataset for model training. These were split into training, validation, and test sets at a 6:2:2 ratio for the training and evaluation of the Easy DL model. Each photo was manually annotated with labels using the LabelImg v1.8.1 annotation tool. In the training dataset, 1400 images contained 8323 feature labels, with an average of 5.9 bounding boxes per image. The hardware specifications were as follows: processor, Intel(R) Core (TM) i7-9750H CPU @ 2.60GHz (Intel, Santa Clara, CA, USA); onboard RAM, 16.0 GB. GPU, NVIDIA GeForce RTX 2060 (NVIDIA, Santa Clara, CA, USA). The model was deployed in the public cloud; the training algorithm used the VIMER-CAE large model (the general scene-accuracy-improvement pre-trained model); and the training environment used GPU P4. When the model’s confidence threshold was set to 0.5, it achieved optimal performance, with a precision of 90.6%, a recall of 86.6%, and a mean average precision (mAP) of 90.3% (Figure 4). Appendix B Figure A1 shows an example of LabelImg annotation and an example of pattern-recognition results.

2.5.3. Calculation of Cosine Similarity

The collected textual reviews were segmented and analyzed for word frequency, resulting in seven landscape types in this study (Table 1). Cosine similarity measures the similarity between two vectors by calculating the cosine of the angle between them, generating a value between −1 and 1. It can be used to assess the co-occurrence frequency across different data modalities [35]. Landscape elements from both text and image data were converted into vectors. The cosine similarity is calculated using Equation (2), as follows:
C o s i n e   S i m i l a r i t y ( T , I ) = T · I | T | · | I | = j = 1 n t j i j j = 1 n t j 2 j = 1 n i j 2
where T represents the textual vector of an element, I represents the image vector of an element, n is the number of elements in the vector, and j denotes the j-th component of the vector.

3. Results and Analysis

3.1. Landscape Preferences in Text

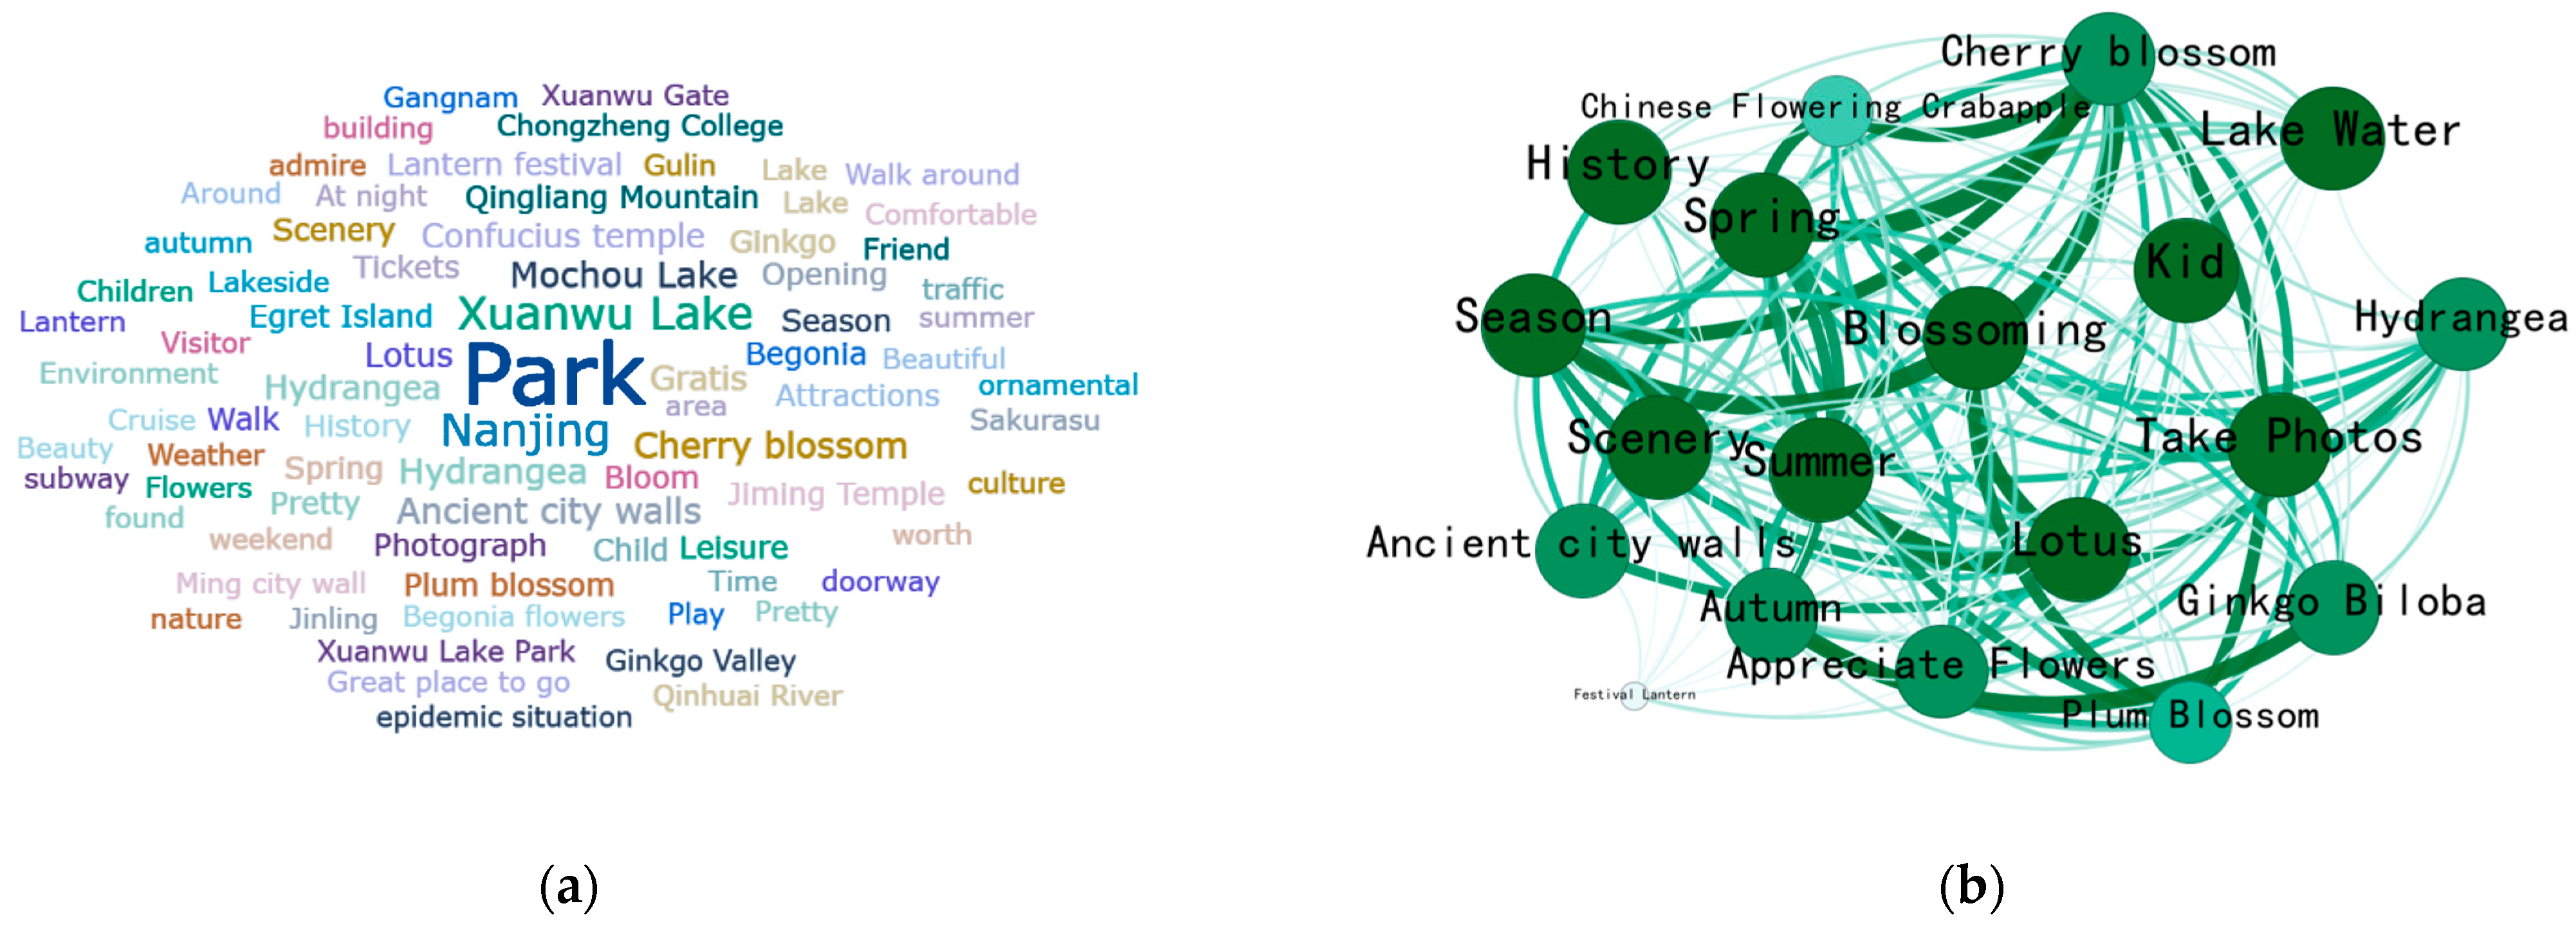
Using SPSSAU 15.0, words frequently mentioned in the collected and organized textual reviews were analyzed, and keywords were extracted using the TF–IDF algorithm (Table 2). A high TF–IDF value indicates that the term is particularly important in its category. Figure 5a displays the most frequently occurring words in the text data. “Park” appears as the central keyword, indicating that users show a high level of overall interest in urban parks. In terms of natural landscapes, plant-related terms such as “hydrangea”, “cherry blossom”, “crabapple”, “lotus”, and “plum blossom” are among the most frequent, suggesting that visitors pay significant attention to floral displays and are sensitive to seasonal changes. Locations like Xuanwu Lake, Qingliang Mountain, and Egret Island are mentioned repeatedly, showing that Nanjing’s natural water bodies and hilly landscapes are highly attractive to visitors. Regarding activity experiences, boating, photography, and walking are the most popular activities, allowing tourists to both exercise and enjoy the scenery. Visitors frequently mention the ancient city walls and the lantern festival. Though attractions like Confucius Temple and Jiming Temple are outside the parks’ boundaries, they are still mentioned often, indicating that visitors experience the city’s cultural depth while touring the parks.
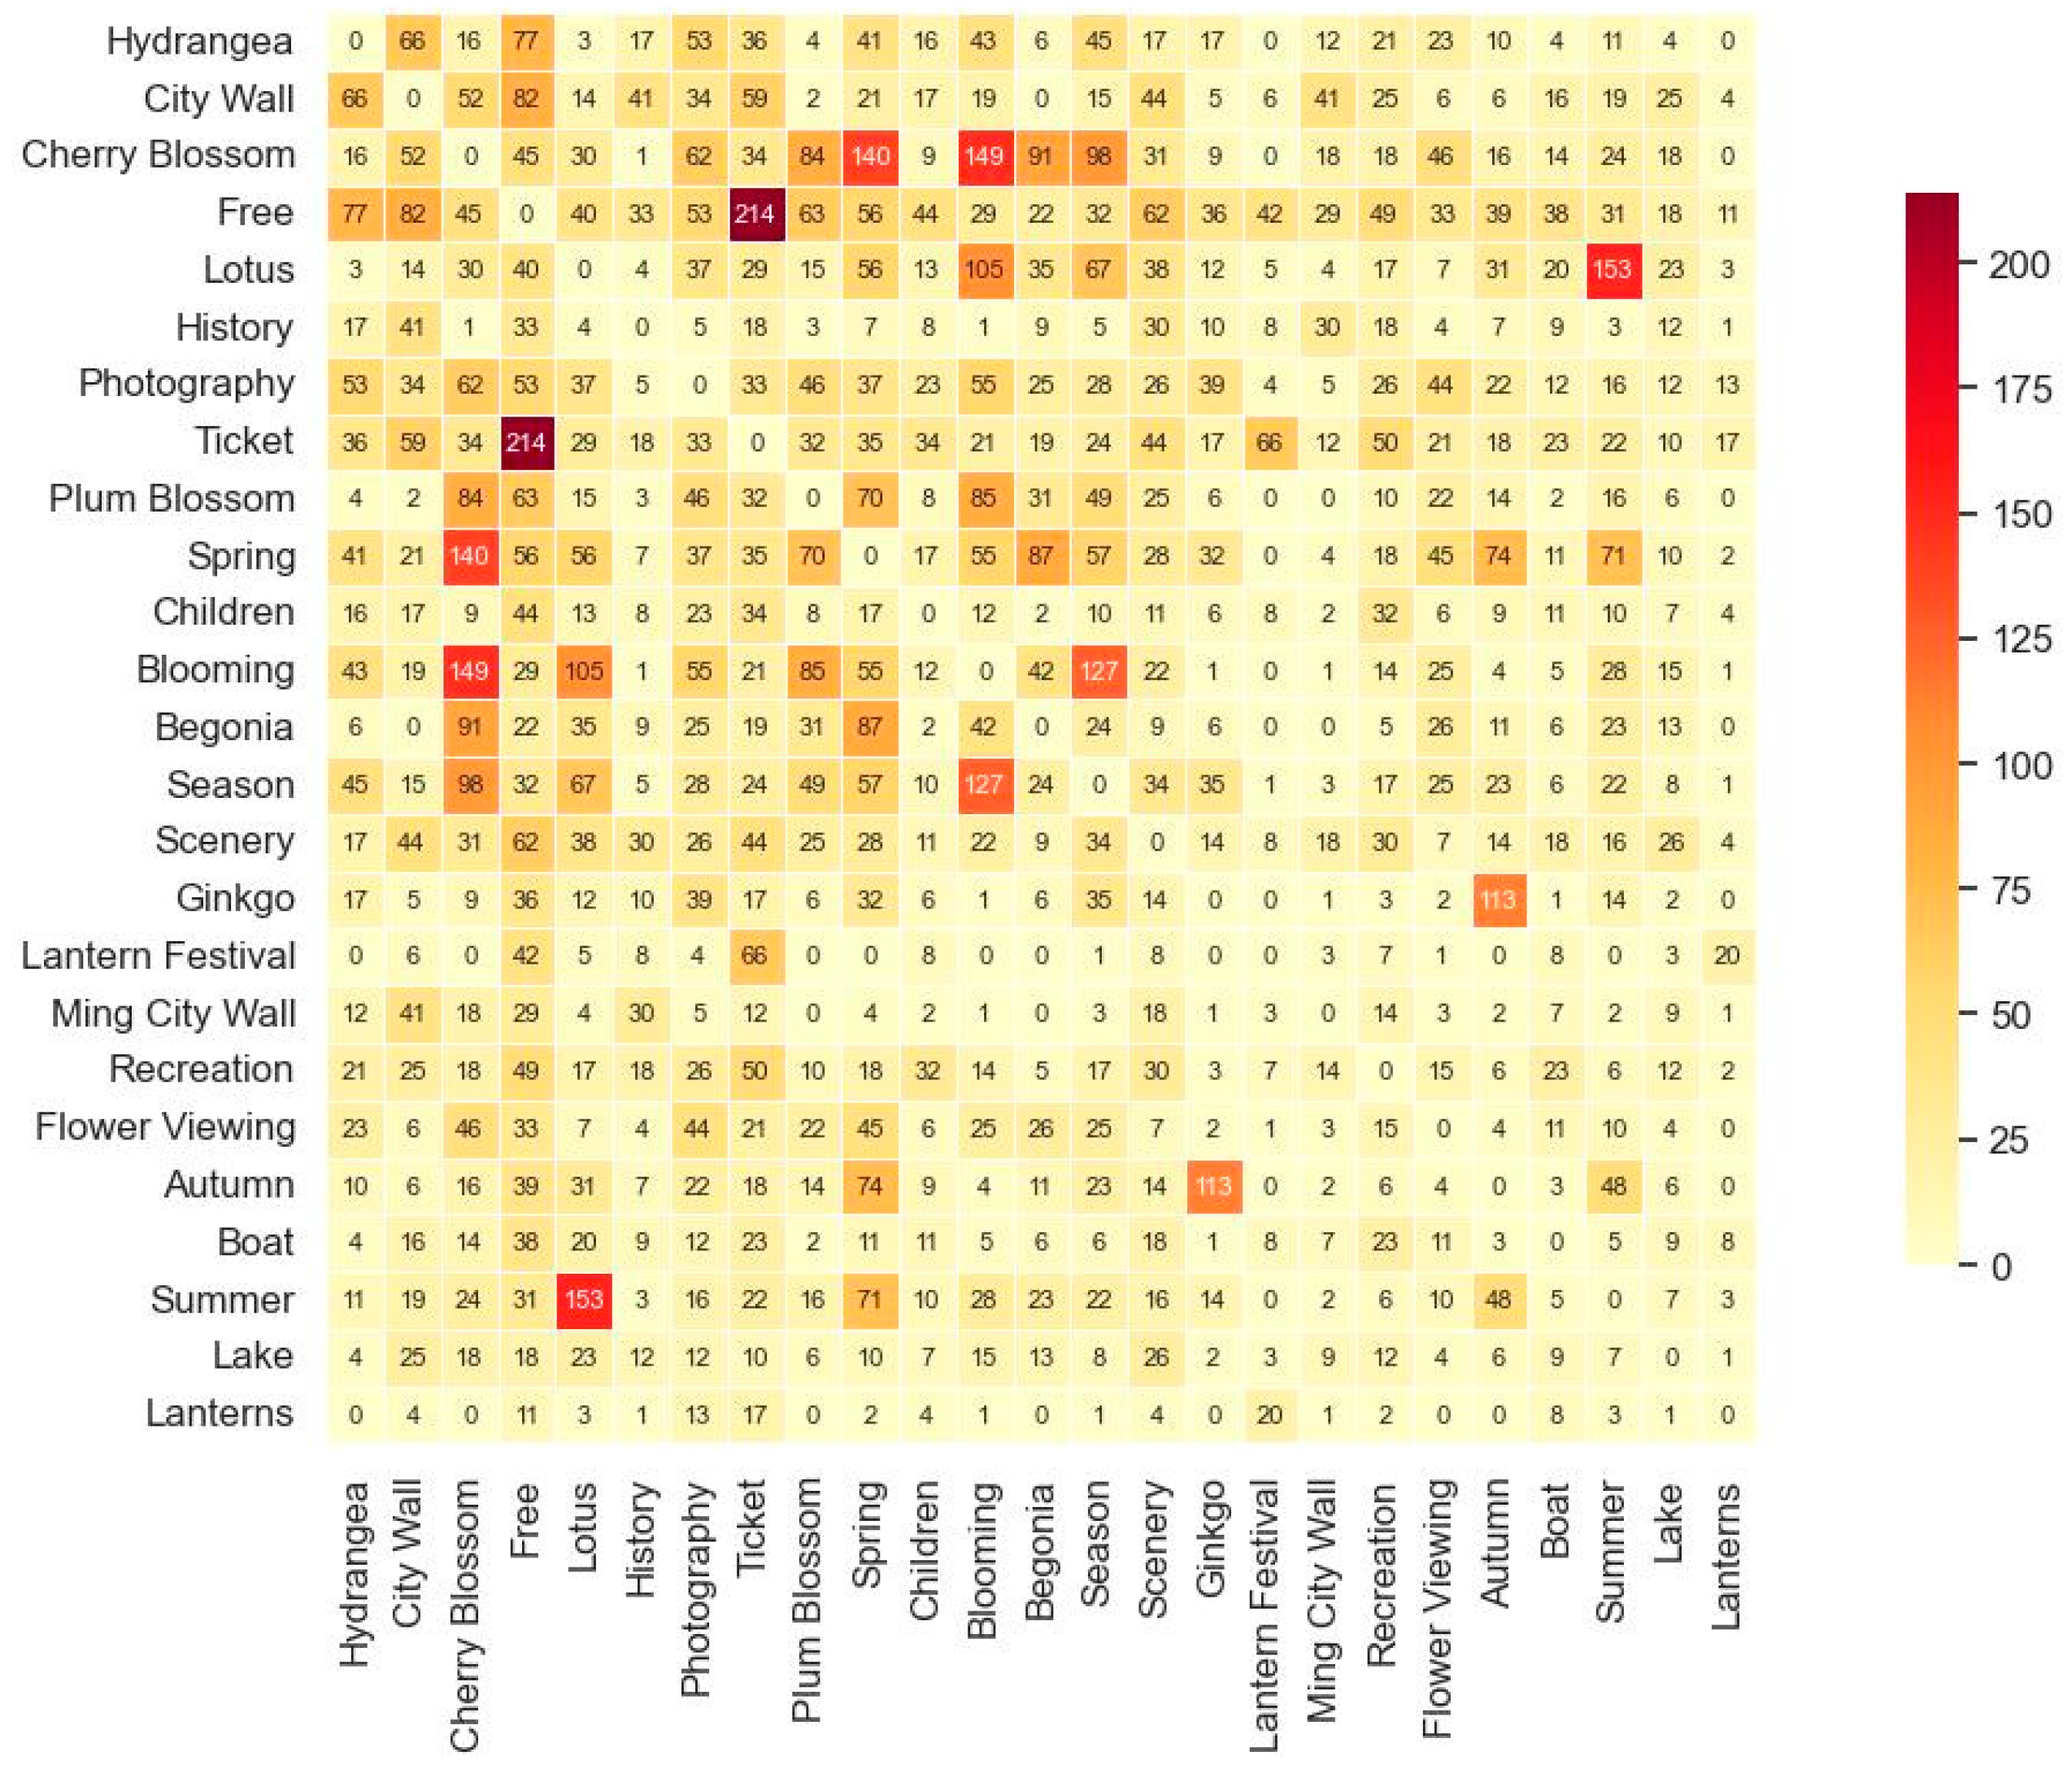
The co-word matrix was used to reveal the high-frequency word-association features of texts related to Nanjing’s urban parks (Figure 6) and visualize them using Gephi 0.1.0, as in Figure 5b. “Cherry blossoms” and “spring” (140 times),”blooming” (149 times), “lotus”, and “summer” (153 times), and “ginkgo biloba” and “fall” (113 times) show high co-occurrence rates, indicating that the seasonal characteristics of the floral landscape are an important highlight of the park. “Free” and “admission fee” (214 times) are closely correlated, indicating that the admission-ticket policy is an issue attracting attention.

3.2. Landscape Preferences in Images

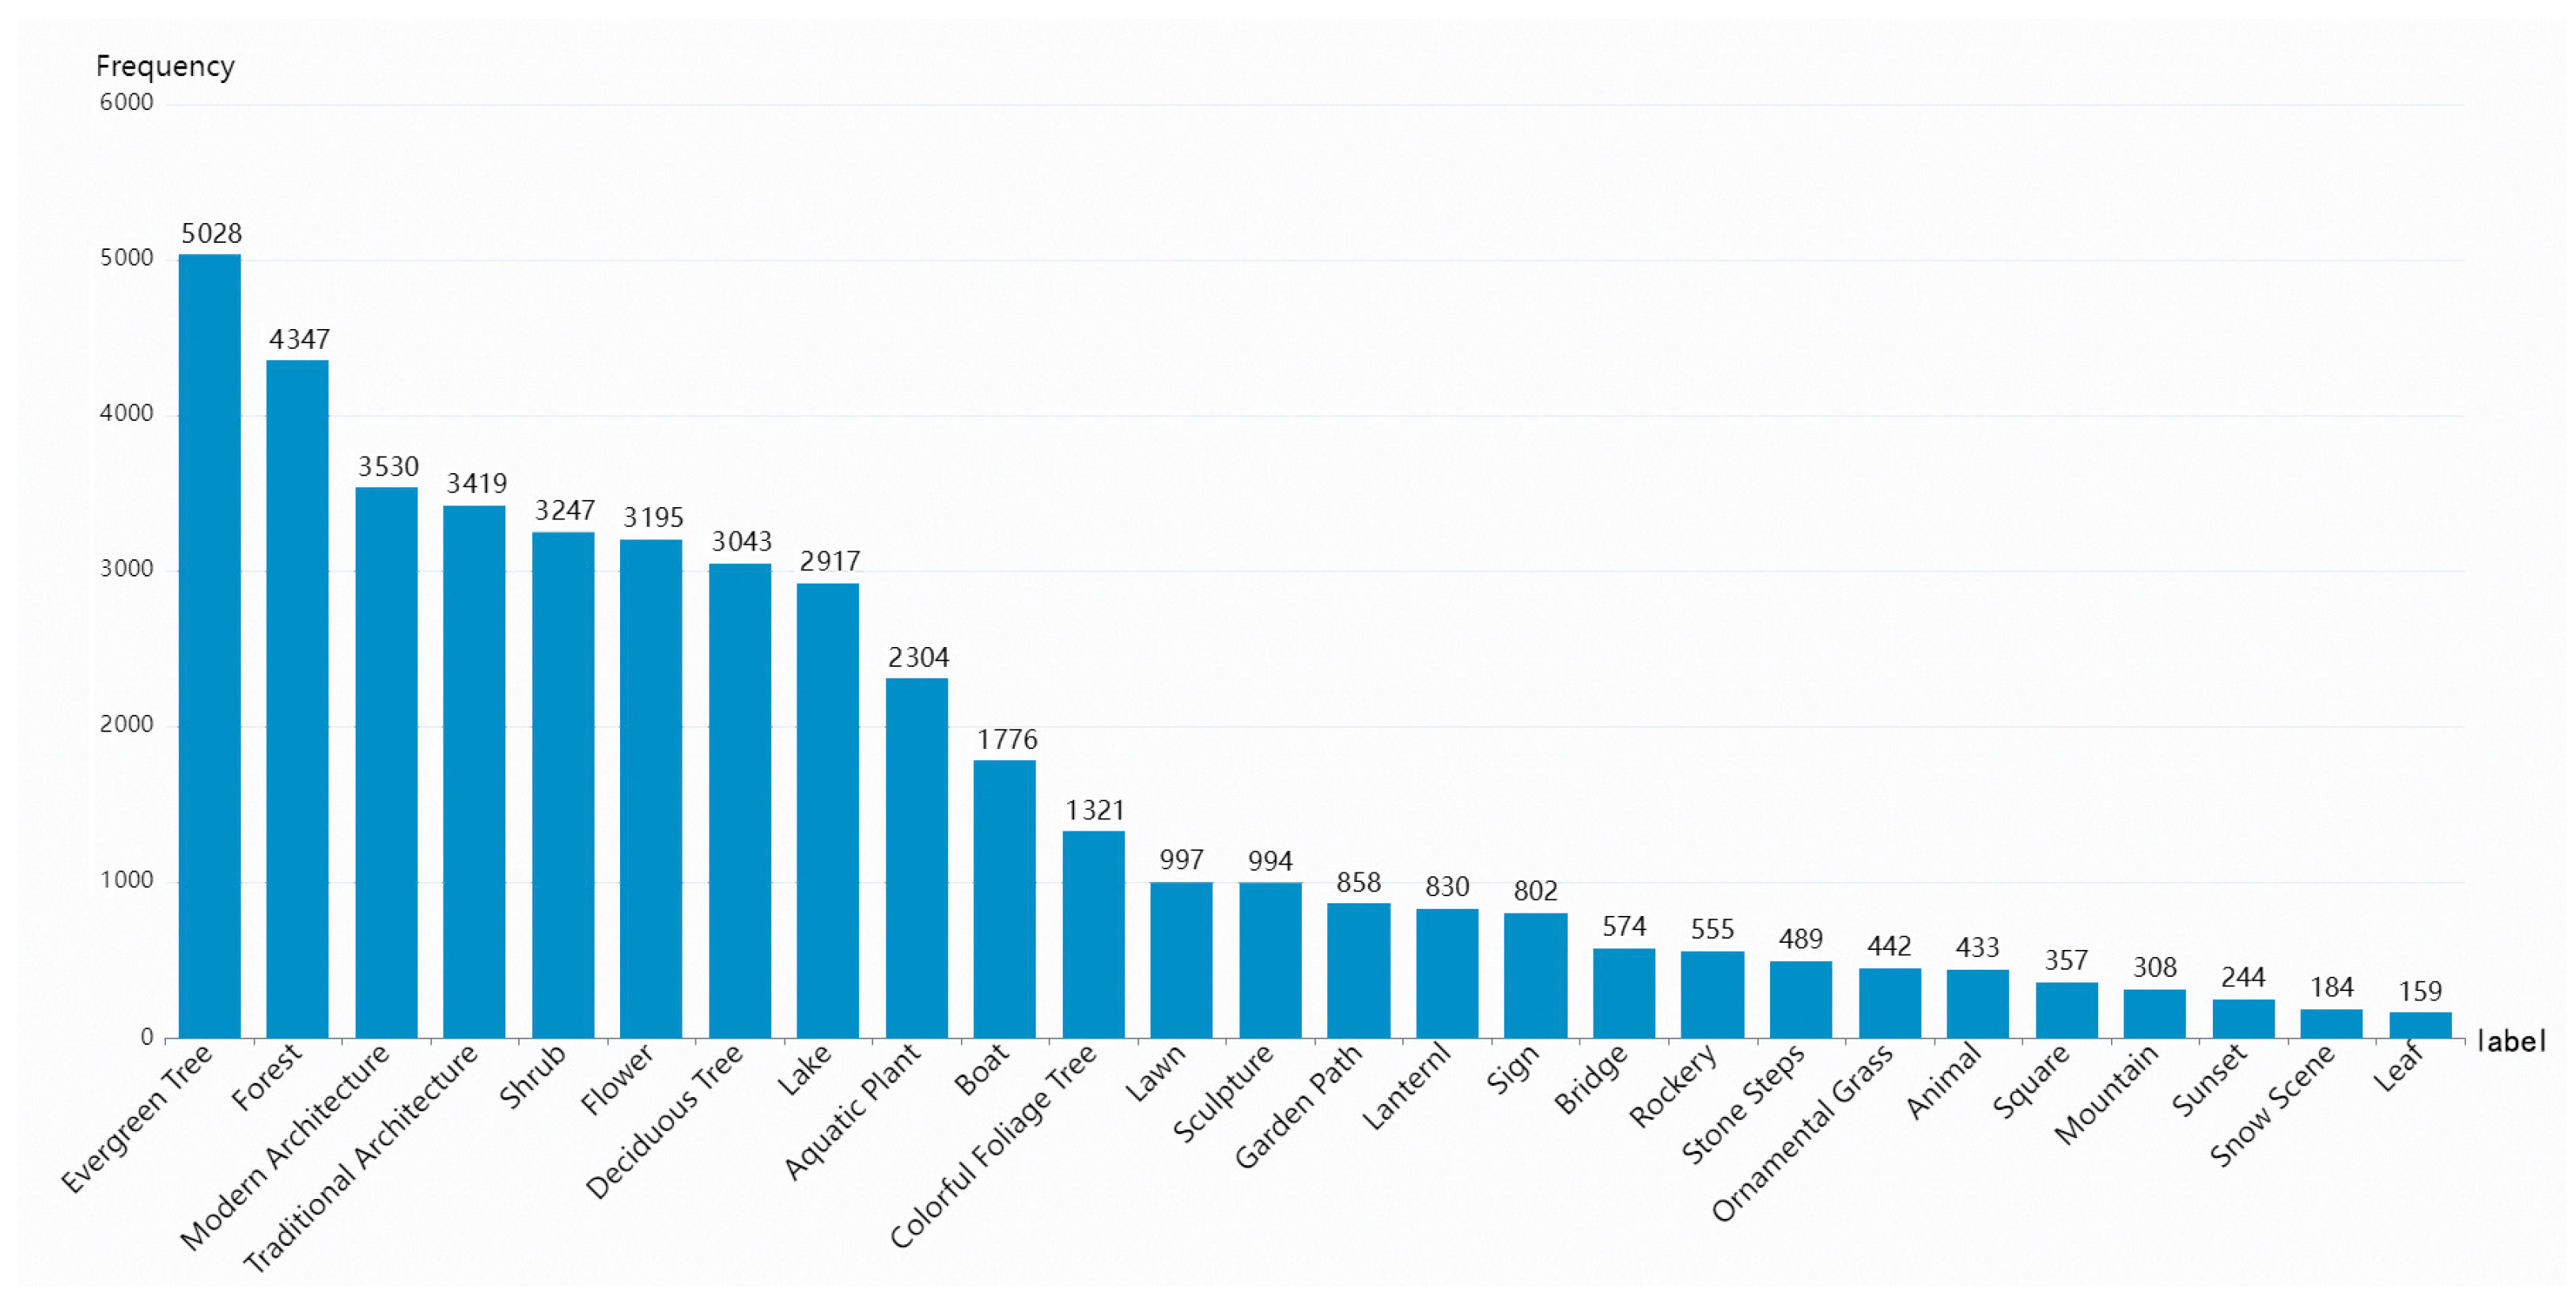
A visual-content-recognition model was used to identify symbolic landscape elements in the collected photos. Tags with a confidence score greater than 0.5 were selected, with one to six tags retained per photo. This process yielded a total of 42,353 tag entries, averaging 2.1 tags per image. Figure 7 shows the frequencies of landscape elements recognized in images. The data show that evergreen trees (11.87%), forests (10.26%), modern architecture (8.33%), traditional architecture (8.07%), and shrubs (7.67%) form the core perceptual elements of urban parks. Low-frequency landscape elements (<1%) include squares (0.84%), mountains (0.73%), sunsets (0.58%), snow scenes (0.43%), and leaves (0.38%).
According to the detection results, evergreen trees, forests, modern architecture, traditional architecture, and shrubs appeared with the highest frequency, indicating that plants and architectural landscapes are the core elements perceived by visitors. In contrast, features like sunsets and snow scenes were detected less frequently, likely because they occur only in specific seasons. Evergreen trees, deciduous trees, trees with colorful leaves, and forests accounted for a combined 32.43% of recognized objects. Nanjing’s humid subtropical climate is conducive to plant growth, with a forest-coverage rate of 31.96%, which explains the high frequency of plant elements. Other vegetation, such as shrubs and flowers, was also recognized at high rates. Previous studies have shown that flowers are associated with positive emotions [36]. In Japanese cities, among soil, hedges, grass, and flowers, flowers are the most favored type of street vegetation [37]. In Nanjing’s urban parks, seasonal flowers are available year-round for viewing, and people are enthusiastic about sharing visually appealing plants on social media. The frequency of flowers in images (7.54%) may also be related to organized events or intentional park designs [38]. However, lawns (2.35%) and ornamental grass (1.04%) were recognized at relatively low frequencies, indicating that visitors are less inclined to photograph herbaceous plants. On the other hand, lakes, aquatic plants, and boats attract considerable attention. Boating is a popular waterside activity, and the presence of facilities such as the Huanzhou Boating Wharf in Xuanwu Lake Park and the Shuiyuan Painted Boat in Mochou Lake is connected to the high frequency (4.19%) of boat-related elements. However, among water features, bridges were detected less frequently (1.36%).
Detection results for traditional buildings, bridges, and sculptures were notable, demonstrating a high degree of consistency between image content and text, and reflecting the public’s positive perceptions of and preference for cultural landscapes. Landmarks like Loushan Lansheng Tower in Xuanwu Lake Park and Yujin Hall in Mochou Lake Park are well-preserved and well-known. The construction of Nanjing’s urban parks is influenced by Chinese classic garden styles, which explains the prevalence of traditional architecture.
The high frequency of modern buildings in images is likely due to the presence of residential areas surrounding central urban parks, often appearing as background elements, although such structures are relatively rare within the parks themselves. Human-made features such as sculptures, lantern displays, signs, rockeries, bridges, and stone steps accounted for approximately 10% of detected elements. These features tend to have lower spatial density and smaller volumes, and their low frequency may be attributed to their limited presence and lack of visually prominent characteristics. While lantern displays are visually striking and often large in scale, they are temporary installations and available only during specific periods.
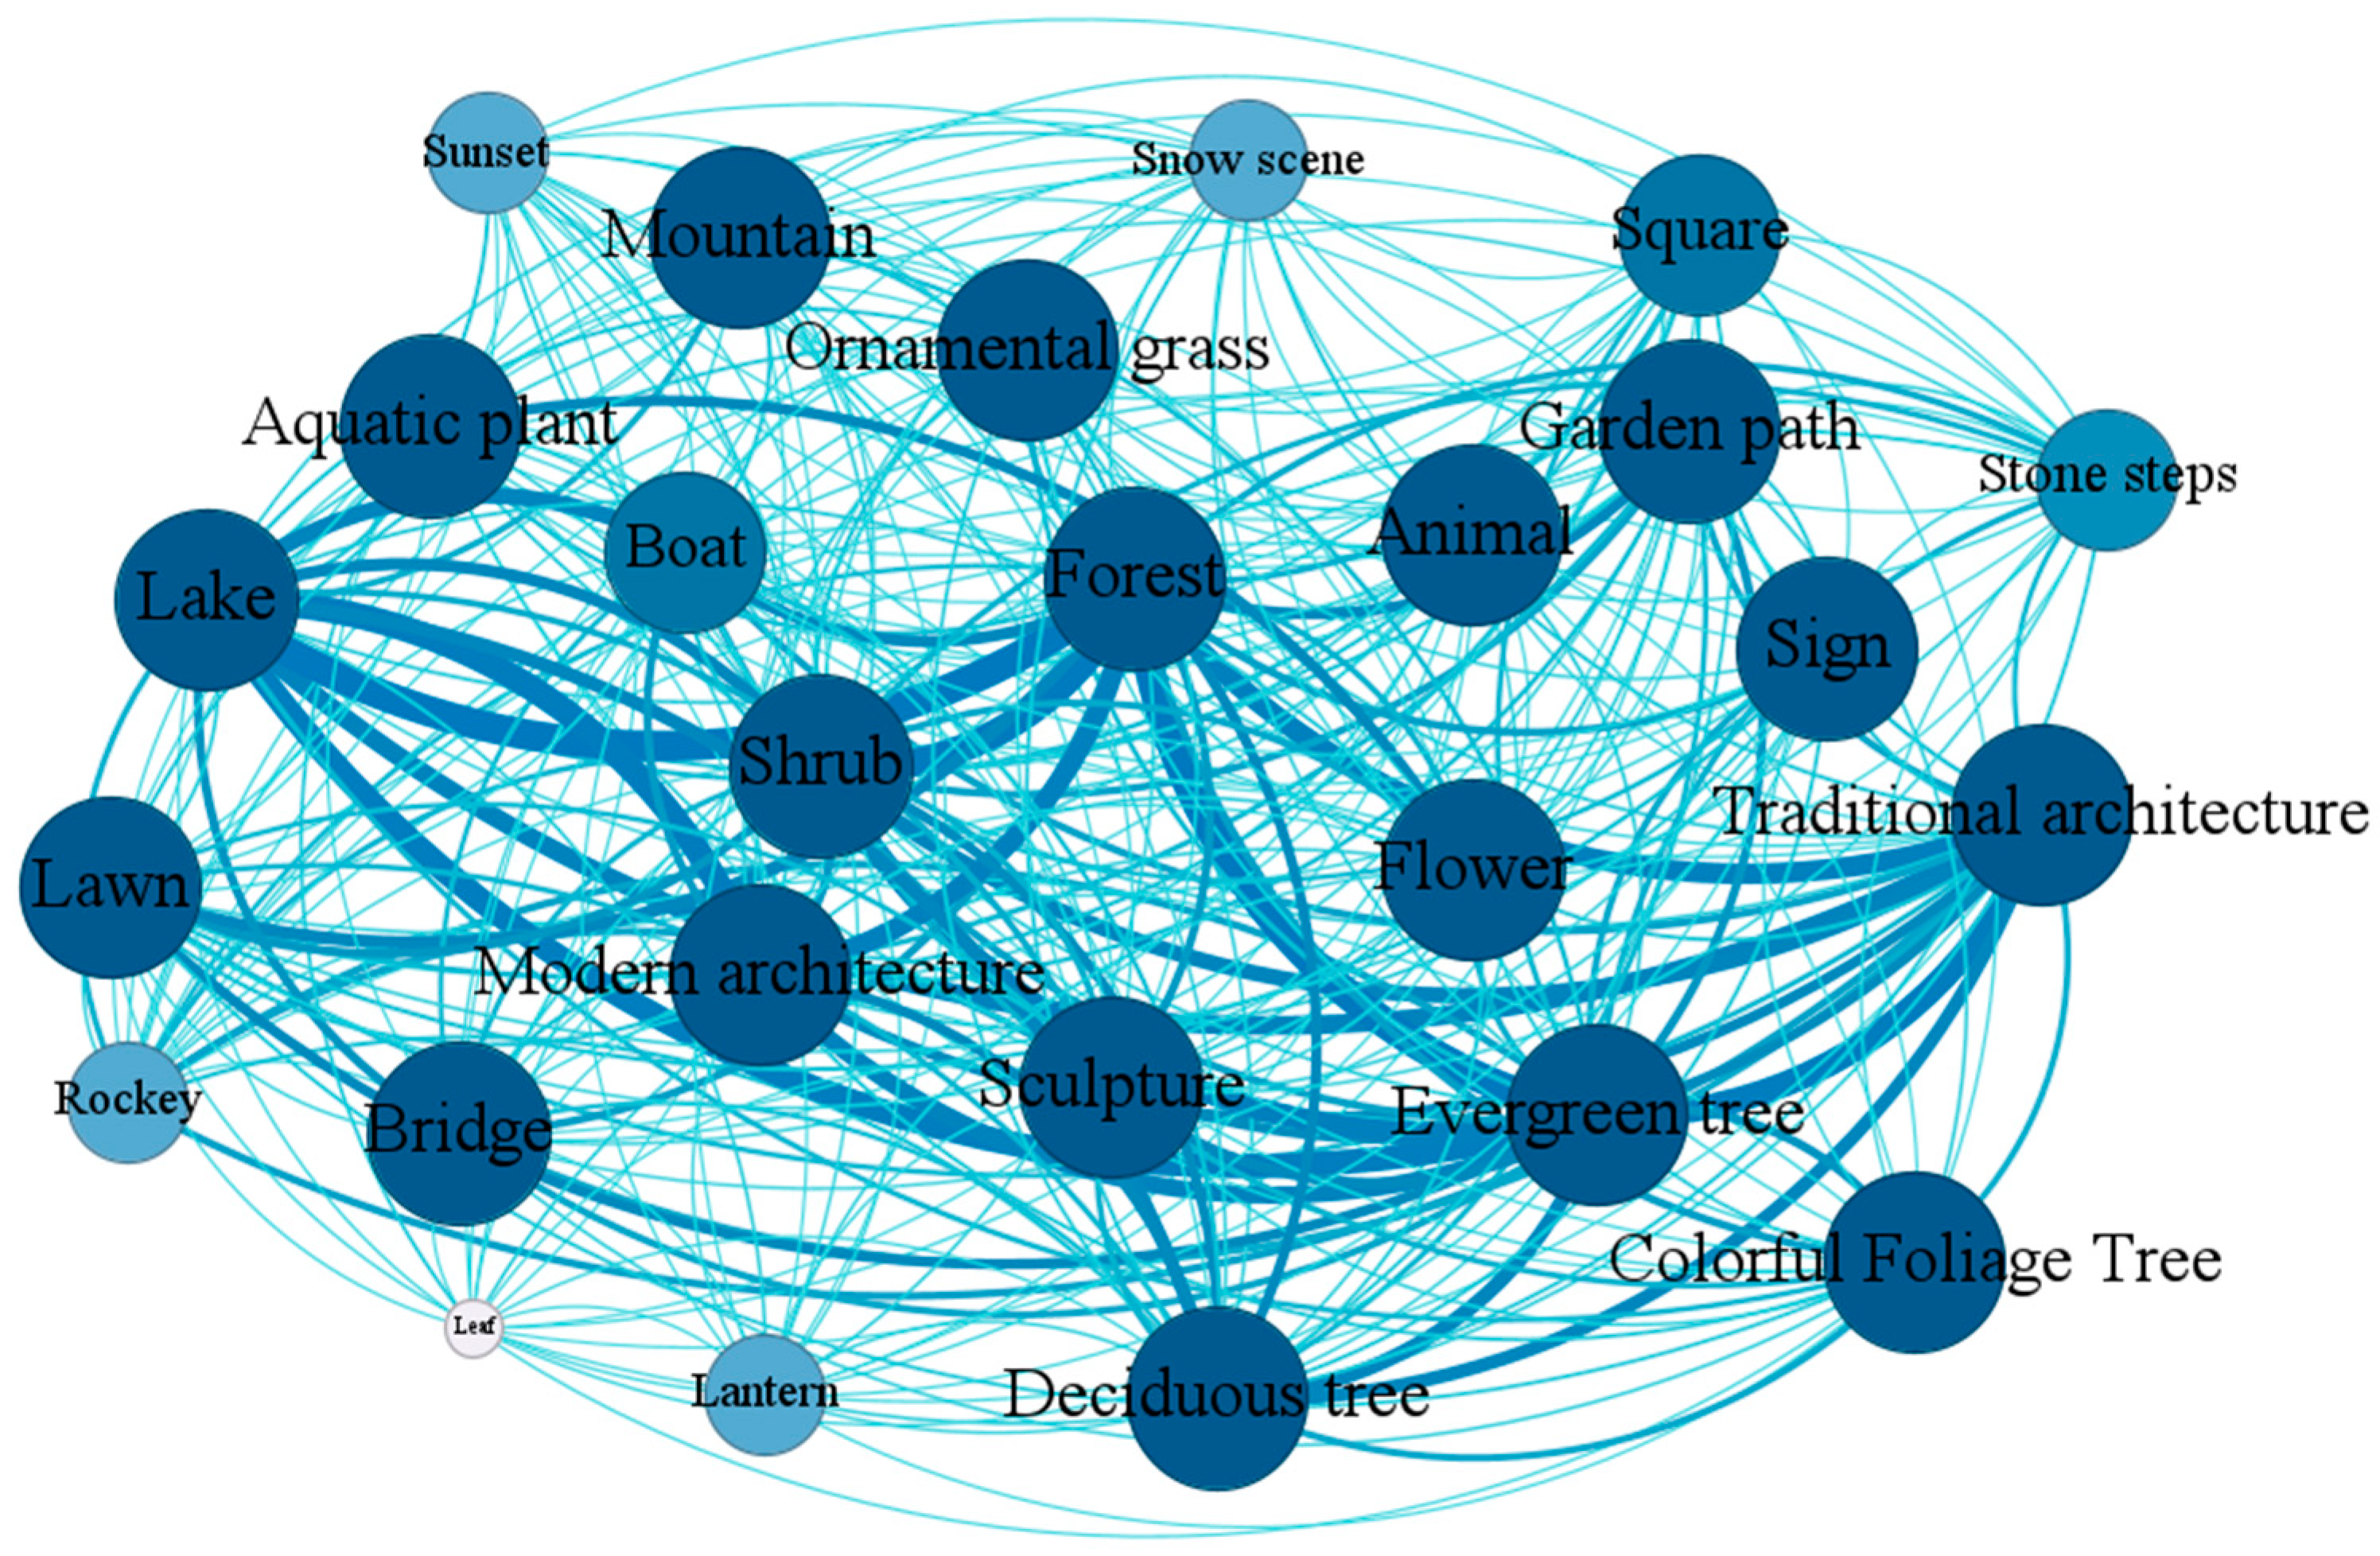
The co-occurrence matrix of landscape elements was generated by calculating the frequency with which landscape elements appeared together in images, and Figure 8 shows the combinations of elements that appeared often in the images. Evergreen trees co-occurred with forests, lakes, and shrubs a high number of times, and these were the main landscape combinations in major parks. Mountains were paired with evergreen trees, garden paths, and lakes to create a landscape pattern that displays natural features. Traditional and modern buildings were paired with evergreen trees, forests, and lakes to form landscape nodes with cultural heritage that are both functional and ornamental.

3.3. Sentiment Analysis

3.3.1. Overall Sentiment

The park-review data mainly consist of short, unstructured pieces of text, many of which contain feature words that determine the overall sentiment. ERNIE 2.0, based on deep learning mechanisms, enables the accurate classification of park reviews by sentiment polarity. In this study, sentiment analysis was conducted by using the ERNIE 2.0 API, inputting the cleaned text data. The sentiment-analysis results are presented in Appendix A, Table A2.
Sentiment polarity is categorized into three classes, negative, neutral, and positive, with each result accompanied by a corresponding confidence score (ranging from 0 to 1). A total of 48,530 cleaned review sentences were analyzed to determine their sentiment orientation. Overall, the visitor sentiments expressed in the reviews leaned toward the positive, with an average sentiment polarity of 1.909. Specifically, there were 31,755 positive comments, accounting for 95.02% of all comments; 287 neutral comments (0.86%); and 1378 negative comments (4.12%). These findings indicate that the public generally holds a positive attitude toward these parks (Figure 9).

3.3.2. Spatiotemporal Sentiment Preferences

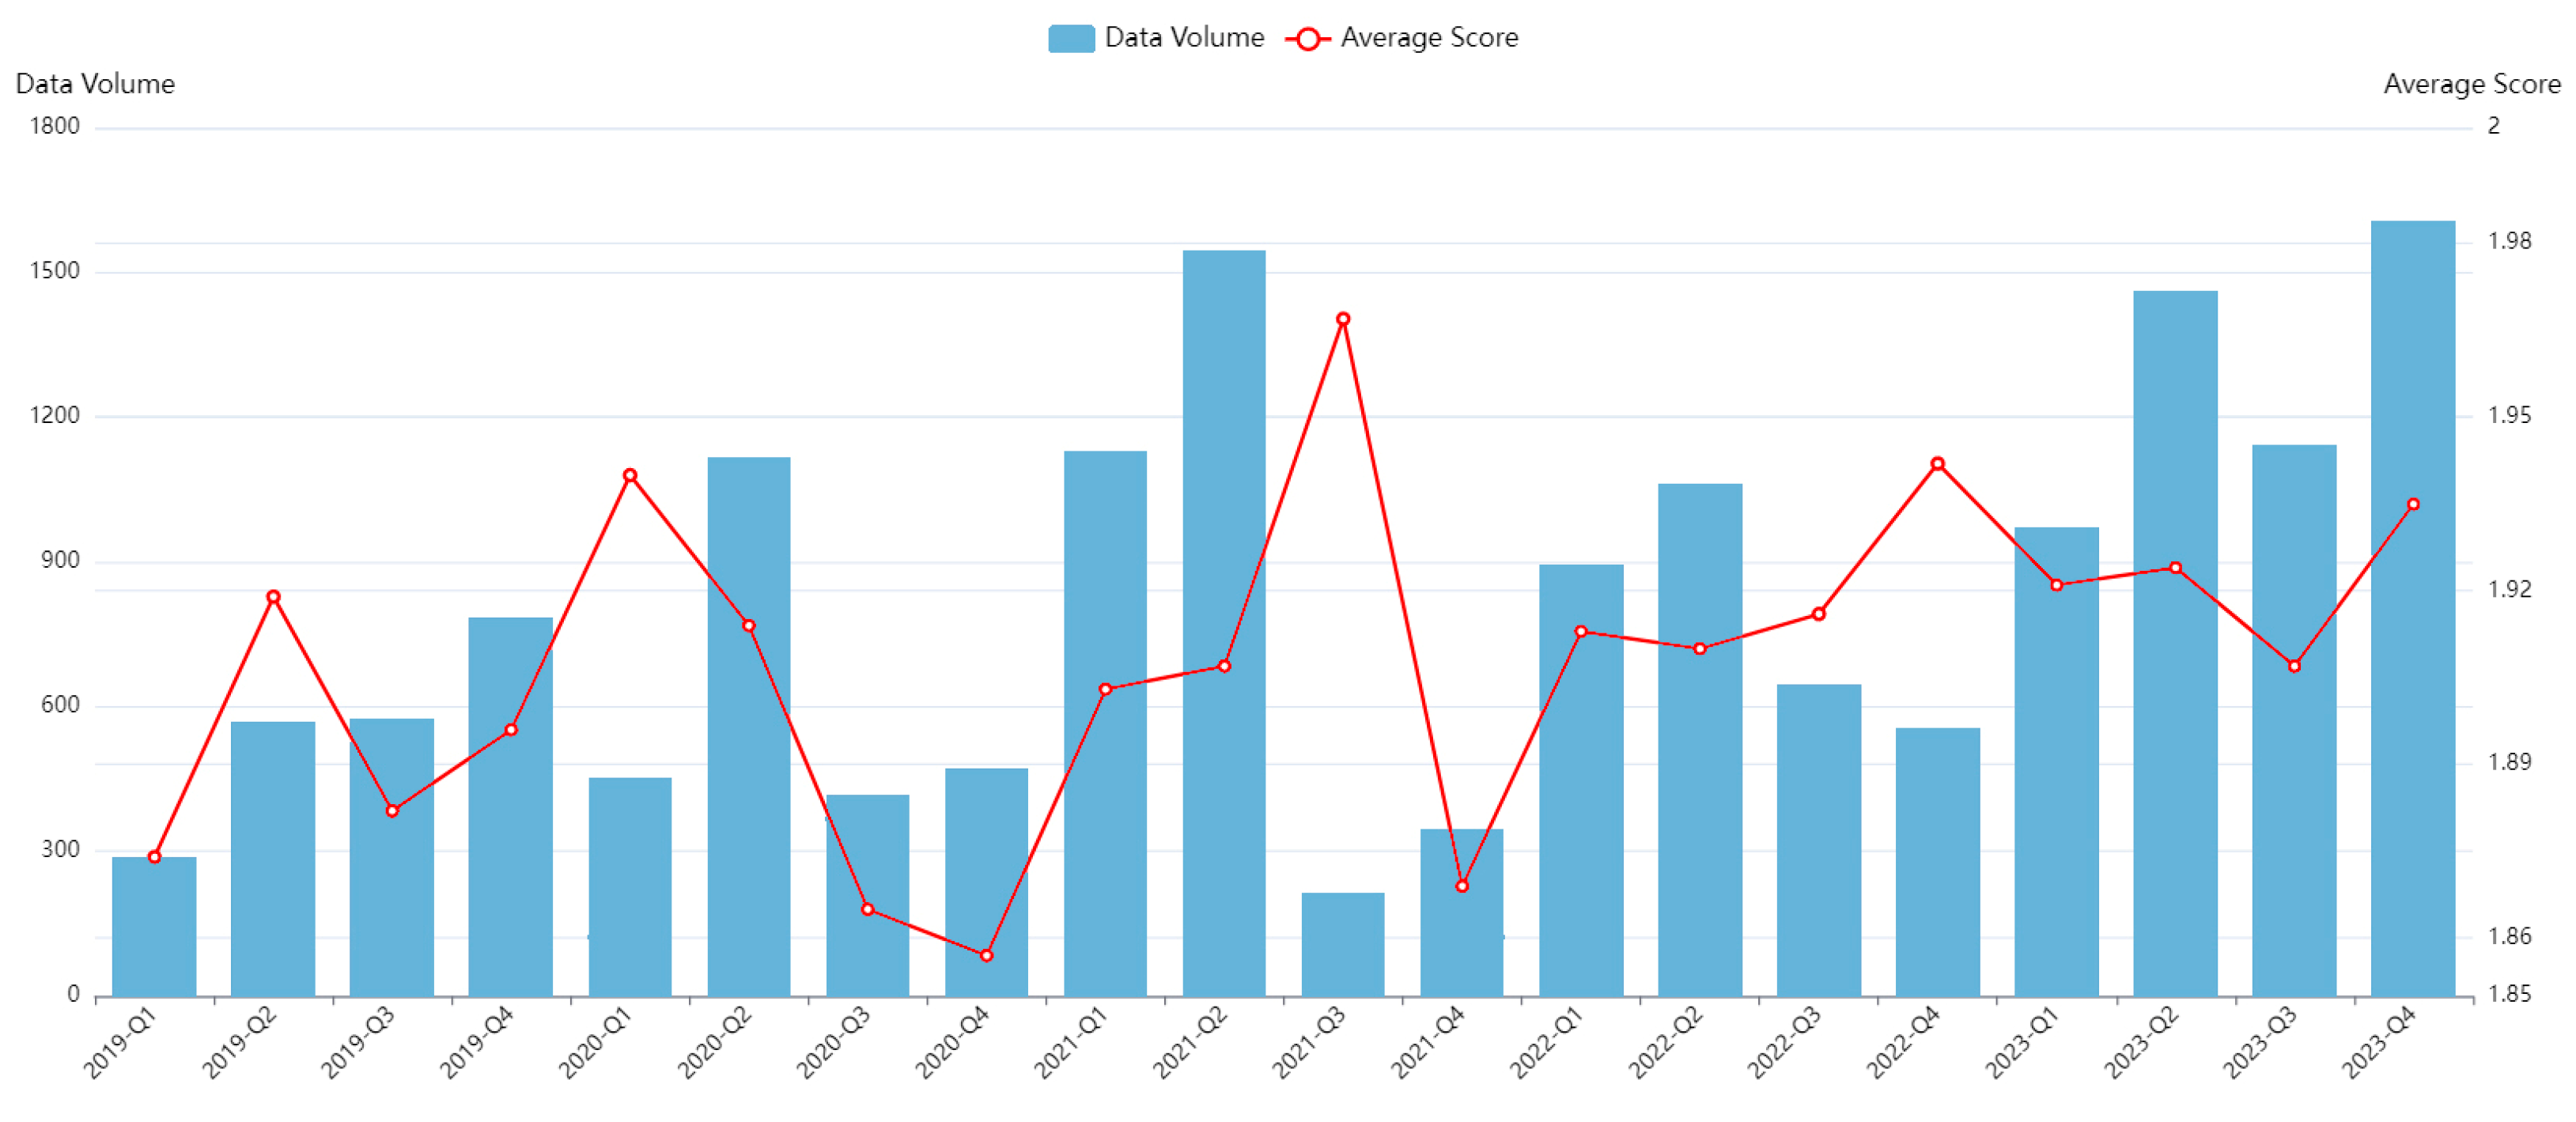
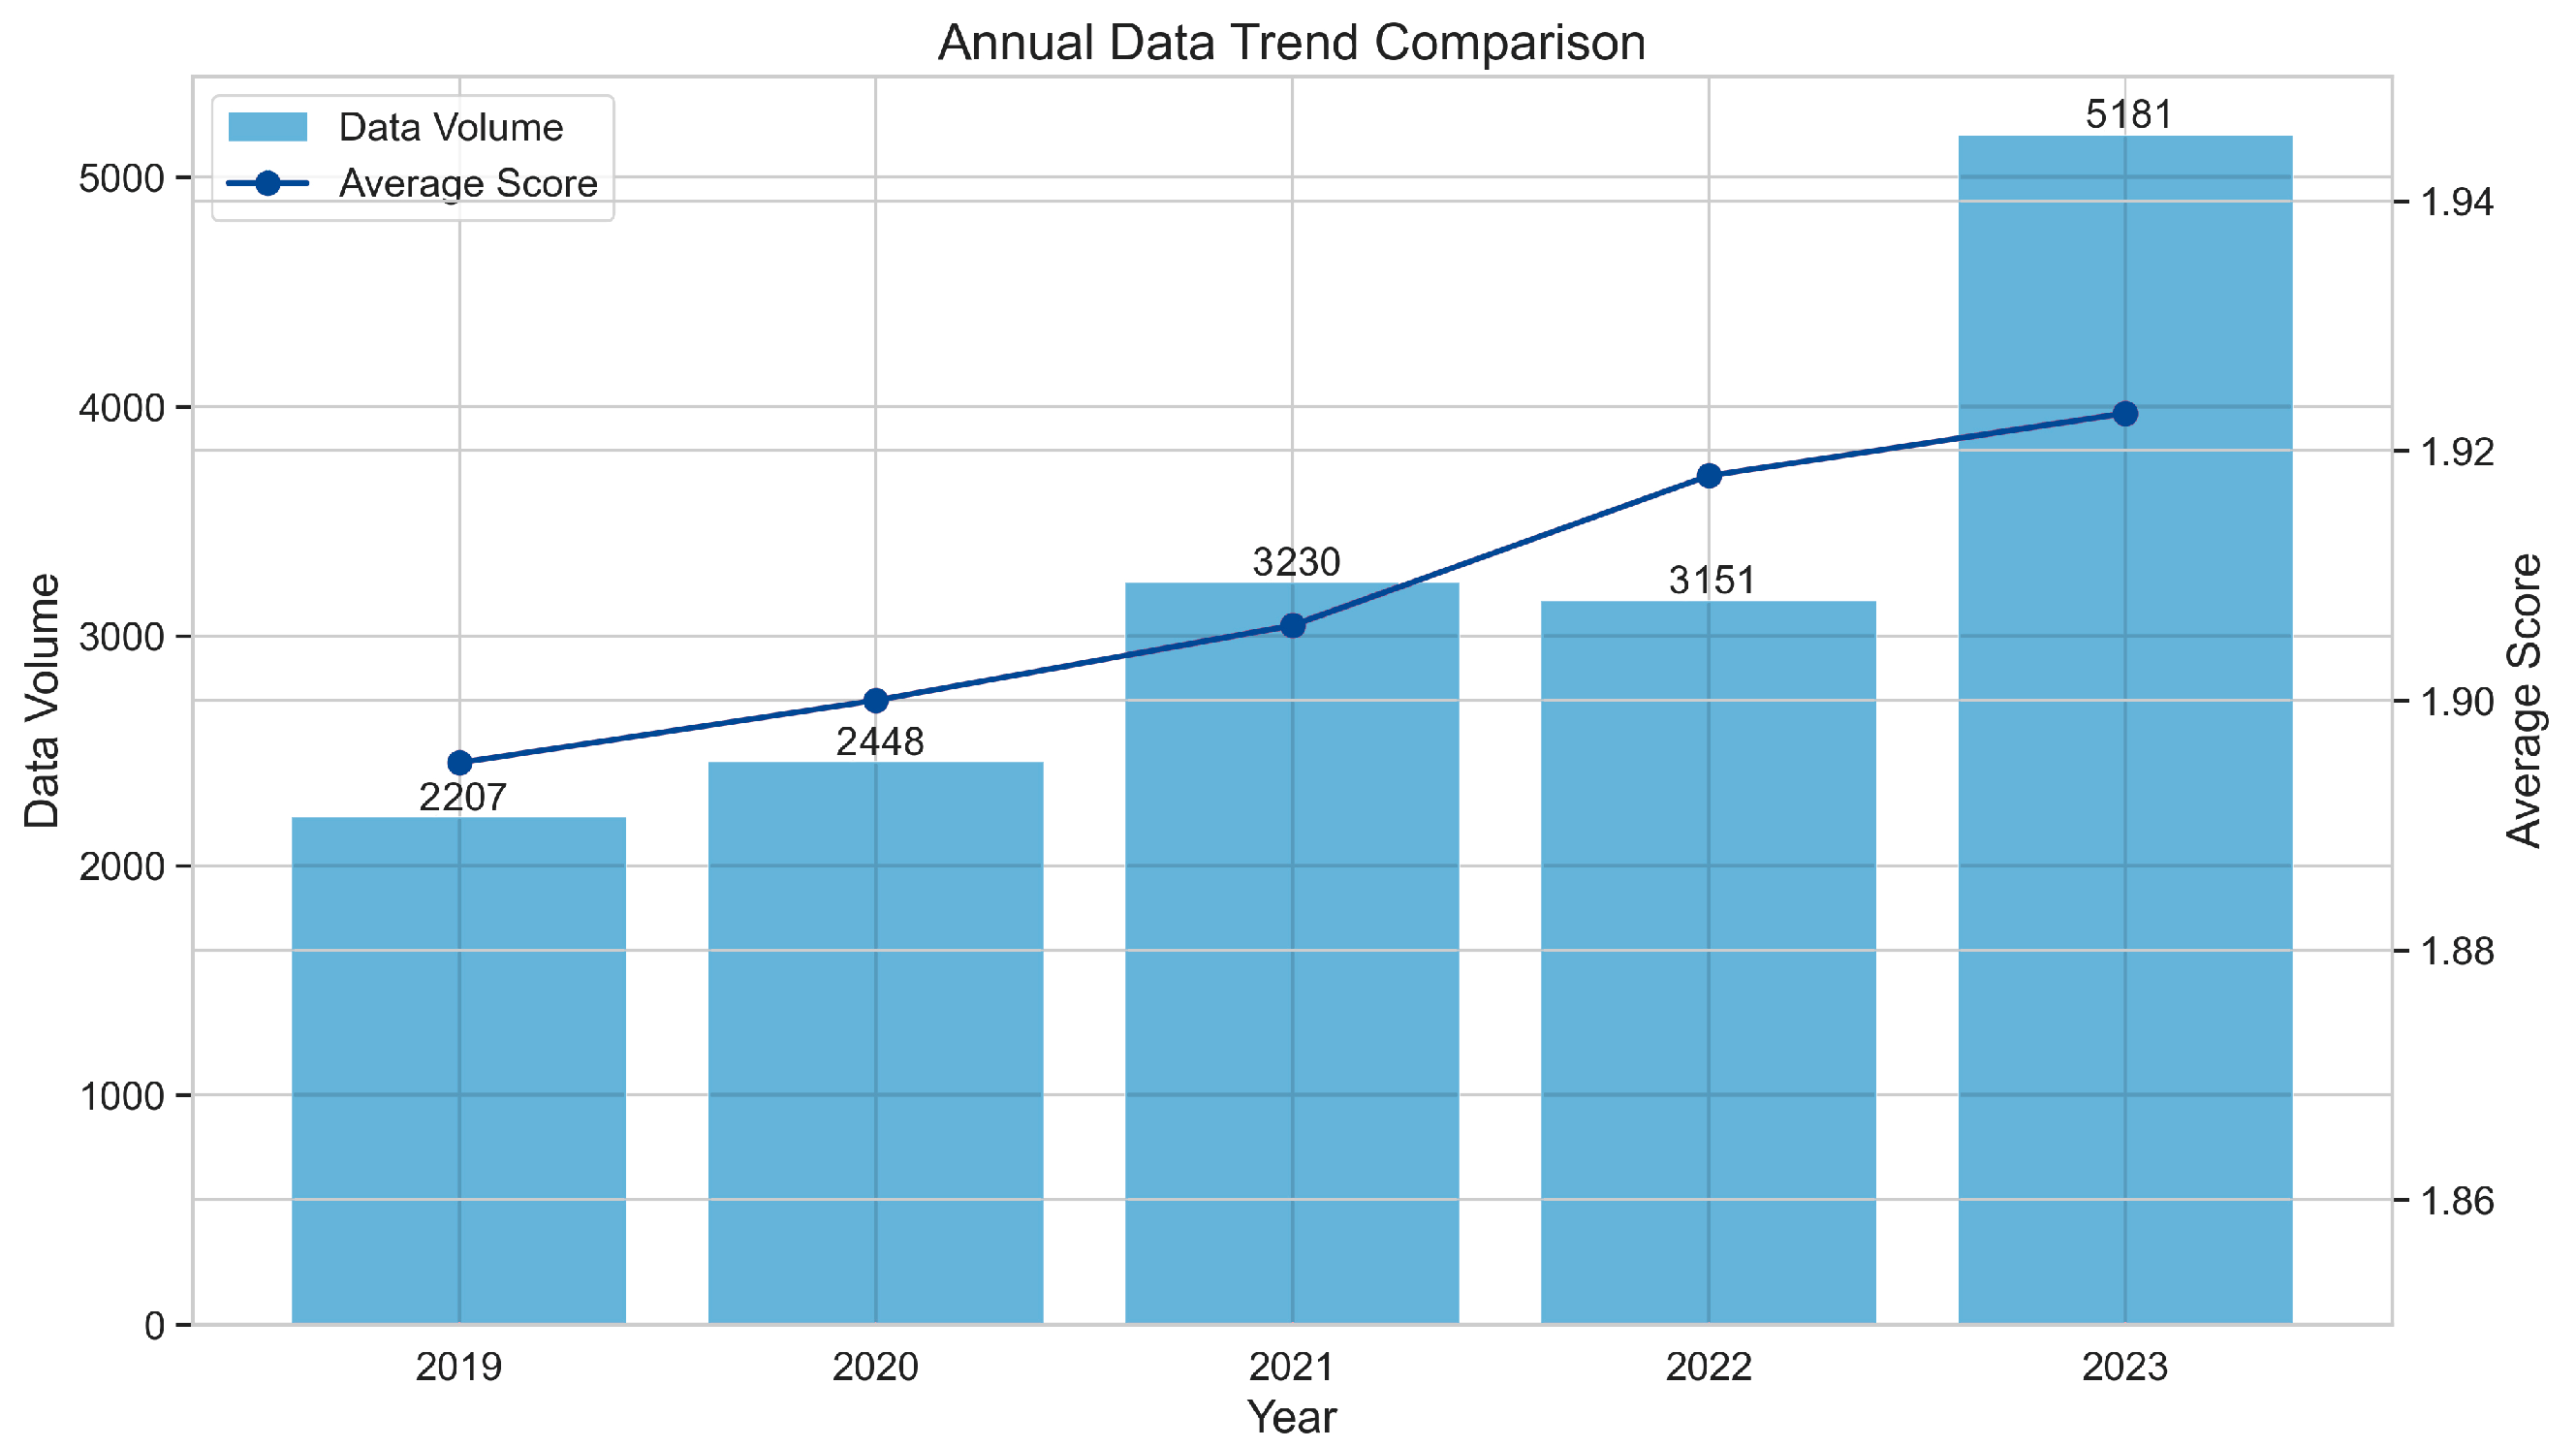
The number of comments and average sentiment values for Nanjing’s urban parks were analyzed, and ANOVA tests were used to examine changes in sentiment trends across different temporal scales. From 2019 to 2023, the number of park reviews in Nanjing’s main urban districts showed an overall upward trend (Figure 10). During the COVID-19 pandemic, the intensity of park usage decreased, while post-pandemic recovery in 2023 led to a sharp increase in both review volume and average sentiment score.
Using China’s traditional 24 solar terms to define the seasons, seasonal data were subjected to ANOVA tests (Appendix A Table A3, Appendix B Figure A2). The differences in the number of reviews across seasons were not statistically significant (F = 1.7103, p = 0.2050), nor were the differences in average sentiment scores (F = 0.2155, p = 0.8842). Review volume increased on weekends compared to weekdays. During major holidays such as National Day, Spring Festival, and Labor Day, the frequency of user comments was significantly higher than usual (Appendix A Table A4). The Chinese calendar library was used to identify statutory holidays and adjusted workdays in China. An independent-samples t-test was conducted to determine whether sentiment averages on holidays differed significantly from those on weekdays. The results showed no statistically significant difference between holiday and weekday sentiment scores (t = −1.0993, p = 0.2718). A one-way ANOVA was also conducted to assess whether sentiment averages varied across weekdays (Monday to Friday), which again revealed no significant difference (F = 0.4200, p = 0.7943). Thus, in terms of daily sentiment averages, no significant differences were found between holidays and weekdays or among the weekdays themselves.

3.4. Cosine Similarity

Text and image data were vectorized to compute cosine similarity, and permutation testing (n = 10,000) was used to evaluate the statistical significance of the similarity scores (Table 3). A higher cosine similarity value indicates greater similarity, while values near zero suggest a lack of significant similarity. A p-value < 0.05 indicates that the similarity between the text and image modalities is significantly higher than would be expected from random noise, indicating strong statistical significance.
Urban parks showed high text–image similarity in elements such as sunsets (cos = 0.62, p = 0), lanterns (cos = 0.57, p = 0), and lakes (cos = 0.54, p = 0). Visually striking elements such as sunsets, lanterns, snow scenes (cos = 0.39, p = 0), flowers (cos = 0.49, p = 0), boats (cos = 0.30, p = 0), and aquatic plants (cos = 0.38, p = 0) showed high consistency between text and image data, reflecting a public preference for elements with strong visual characteristics and high seasonality.
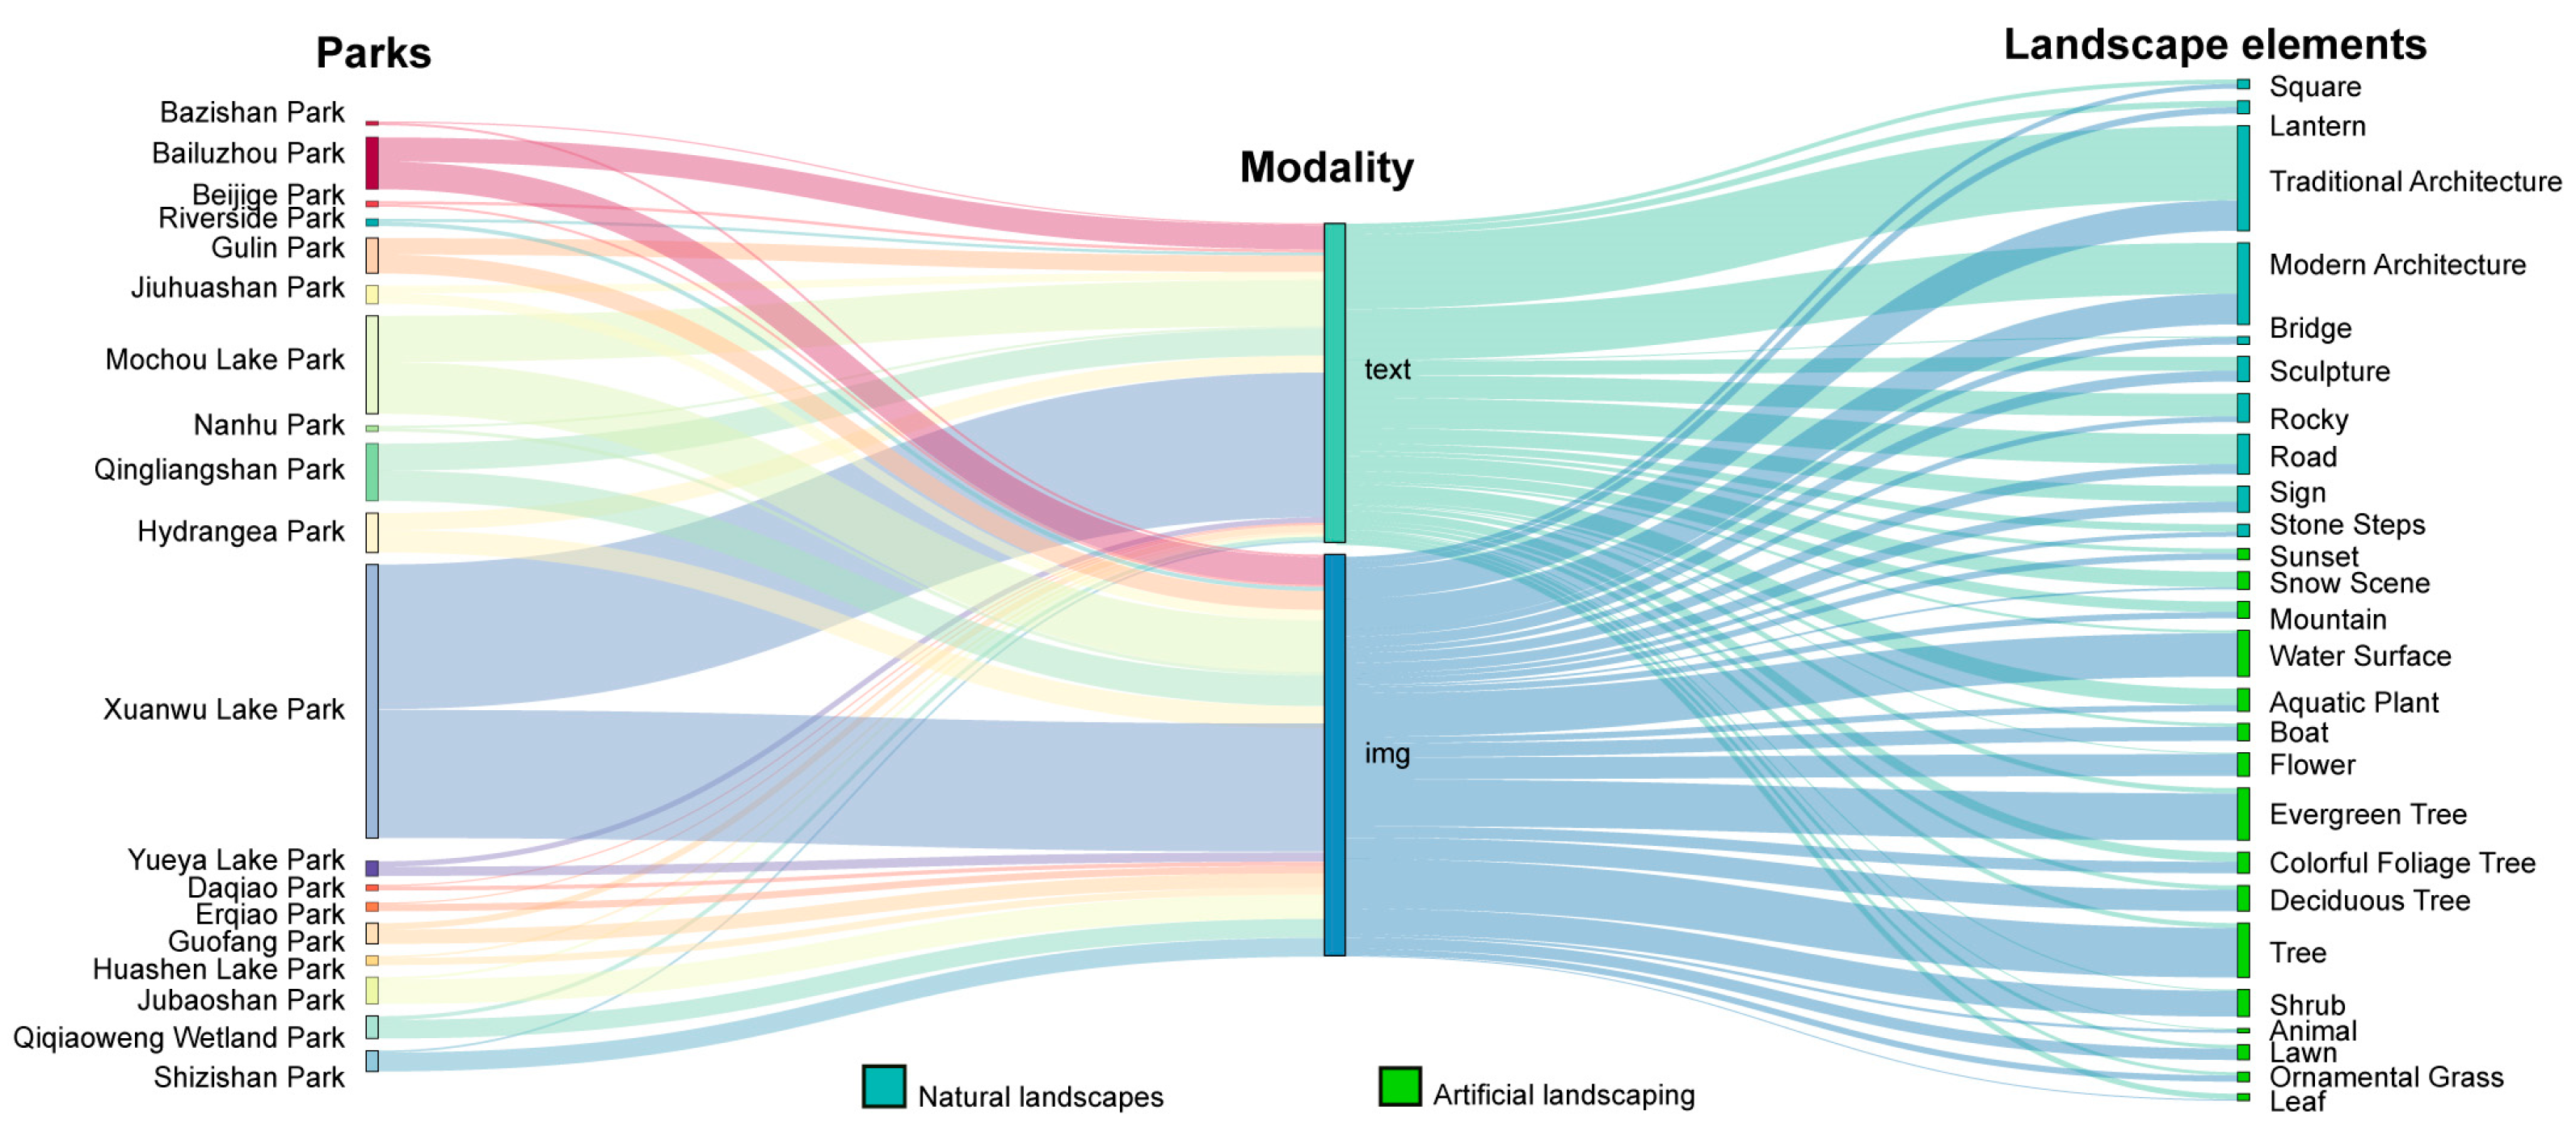
Low cosine values may be due to the small number of text vectors extracted for certain elements, such as signage, stone steps, ornamental grass, and forests, resulting in cosine values close to zero. The scarcity of text vectors also suggests that these features are not highly emphasized in the textual modality (Figure 11).
The image and text data highlighted a consistent preference for floral and aquatic landscapes. In the image data, plant landscape elements such as evergreen trees, forests, shrubs, flowers, and deciduous trees had high detection frequencies, which was corroborated by the text data. Sentiment analysis of the text revealed that the public tends to favor flowers, forests, and historical and cultural landscapes, aligning with the results of previous studies [39]. Cosine similarity calculations indicated high cross-modal similarity for landscape elements such as sunsets, lanterns, snow scenes, flowers, boats, aquatic plants, and lakes. High-frequency words in the text data, such as “boating”, “lotus”, and “Xuanwu Lake”, corresponded with frequently detected elements in the image data, including water surfaces, aquatic plants, and boats. The public demonstrated a preference for elements with strong visual characteristics and seasonal appeal, such as snow scenes, sunsets, and flowers, which exhibited high cross-modal similarity. A study in Tokyo also confirmed that the visual environment and experience contribute most significantly to overall perception [30]. Similarly, a study conducted in Hong Kong highlighted the role of visually driven landscape evaluation and aesthetic appreciation [40].
Due to differences in data modalities, the public’s landscape preferences also exhibit variability. Image data tend to focus on the direct visual presentation of physical landscapes, whereas textual data better reflect subjective experiences and nuanced perceptions. Natural landscape elements such as evergreen trees, shrubs, lawn, leaves, and ornamental grasses are common in urban parks and are usually not described in detail by visitors. Instead, they often appear as background features in photographs, which leads to weak cross-modal consistency. Artificial landscape elements like garden paths, stone steps, plazas, and signs may be less visually appealing and thus are not the primary focus of visitors’ photographs or textual descriptions. Additionally, the image modality provides limited detail for such elements. Due to model limitations, some features may have lower detection frequencies, which may partially explain the lack of significant multimodal consistency.
There are also cognitive and expressive differences among visitors in their responses to certain elements. For example, in the case of traditional and modern buildings, text descriptions may emphasize function over form, leading to lower matching accuracy. A “mountain”, as a topographical element, is more likely to appear as a distant background element, making mountains difficult to accurately identify using object-detection models. Text descriptions of mountains also tend to be generalized, and during the construction of text vectors, they may be confused with “rockery.” This indicates that the cross-modal similarity of functional or background landscape elements is not significant. Image data primarily present the macro-level landscape features of parks, while textual data provide a more detailed expression [41]. For example, natural mountains often appear as background elements in images or are photographed from the mountains themselves, such that the image content mainly consists of forest vegetation. This results in natural mountains appearing in the images at a lower frequency, whereas they are described in more detail in the text.

4. Discussion

4.1. Discussion of the Results

This study shows that positive evaluations account for 95% of public evaluations of parks, while negative evaluations make up only about 4%, indicating that users generally hold a positive view of urban parks. A study by Luo in Tianjin also reached similar conclusions [33]. Previous research has shown that the number of park visitors in Asia increases in April, May, June, and October [42,43]. Sports activities in London parks occur more frequently in summer than in winter [44].
In this study, sentiment scores were higher in April, May, and July, but the ANOVA test results showed a p-value greater than 0.05, indicating that there were no significant differences in emotional averages across seasons, a result that differs from those of earlier studies. Seasons influence landscape experiences, and both text and image modalities show that visitors pay attention to highly seasonal landscapes. However, the overall emotional tone in parks remains relatively stable, and the positivity bias in online reviews may lead to there being no significant seasonal differences in emotional averages. During holidays, users post comments more frequently than on weekdays. This is consistent with previous findings based on social media data [45,46]. A study of Bryant Park, New York, found that the greatest number of comments was posted on Wednesdays [47]. However, our UGC data from urban parks in Nanjing show that differences in data volume across weekdays were not significant, with similar findings observed in studies of green spaces in Shanghai [45]. Moreover, our study indicates that there was no significant difference in emotional averages among weekdays.
In urban parks, natural landscapes are favored, with people showing a preference for evergreen trees, shrubs, and flowers, while trees with colorful foliage, aquatic plants, and ornamental grasses are comparatively less popular. A similar finding was observed in a study conducted in Shanghai, where greenery, flowers, recreational and sports facilities, and water bodies received the most attention [48,49]. Trees undergo phenological changes with seasonal and environmental shifts, making image recognition of tree landscape elements challenging. In our study, to improve the accuracy of image recognition, “evergreen trees” were defined as trees with green foliage in images, “deciduous trees” as trees with fallen leaves, and “forest“ as tree clusters appearing in the images. However, the model’s mAP for identifying trees with colorful foliage was only 72%, possibly because aside from their color, their features (such as texture and shape) are similar to those of other tree species, making feature extraction difficult. Sun previously used bark images to train a green-tree-recognition model based on CAMP-MKNet, which improved accuracy in tree-species identification [50].
Earlier surveys in Shanghai found that water bodies had a positive influence on park visitation and user satisfaction [51]. Furthermore, we found that elements such as aquatic plants, boats, and bridges within lake landscapes demonstrated similarity between text and image modalities, indicating a visitor preference. This reflects the strong visual appeal of lake landscapes in Nanjing’s urban parks and their ability to meet the public’s recreational needs on the water.

4.2. Discussion of the Methodology and Innovation

In this study, 26 high-frequency landscape elements extracted from images were used as research subjects at the element level. Compared to word frequencies in the texts, the high-frequency landscape elements extracted from images more often represent visually salient scenes for visitors, which facilitates the implementation of object-detection models. This finding is consistent with those of previous studies by Li [28] and Ma [29] et al. Although these extracted landscape elements effectively cover common features in parks and possess a certain level of granularity, they do not include detailed descriptions of visitors’ subjective emotions and actual experiences.
In recent years, researchers have increasingly employed social media data or UGC to analyze preferences. Previous studies have recognized the limitations of single-modal data and proposed approaches such as combining questionnaire surveys with online data [41], integrating data from multiple platforms [52], and merging image and text data [53]. Common analytical perspectives include exploring temporal factors, spatial distribution, and user characteristics through multi-platform data. On the other hand, existing research has extracted emotional tendencies [48] and multi-sensory perceptions [30] from textual data and applied techniques such as image segmentation [54], landscape classification [55], and element detection [56] to image data. However, these studies often present results side by side, lacking methods for semantic-level quantitative integration. In our study, we apply deep learning techniques to image data and innovatively construct an object-detection model for landscape elements, enabling the quantification of their frequency in images. The novelty of this paper lies in the comprehensive use of both textual comments and photo images to identify landscape-preference characteristics of park visitors from multiple dimensions. Furthermore, we explore a cross-modal analytical approach by using cosine similarity to compare textual evaluation data with image-content features. This allows us to assess their differences in representing landscape elements and to validate the feasibility of data fusion in landscape-preference research, thereby offering a more comprehensive understanding of public perception of landscapes and preferences across multimodal data.

4.3. Limitations and Future Research

Although this study strives to ensure the objectivity and comprehensiveness of landscape-preference evaluation by combining public feedback from both images and texts, several noteworthy limitations remain. Online data cannot cover all user groups in parks, underrepresenting groups such as the elderly and children. Due to the limited disclosure of personal information by users on current platforms, it is difficult to rule out the influence of sociodemographic background on preference-related research. Some studies have also shown that online reviews may be positively biased [57].
In this study, although considerable manual effort was invested into processing the training dataset, confusion still occurred in the identification of trees with colorful foliage, forests, lawns, and ornamental grass. Since the training data consist of real photos taken by users, overlapping or visually similar landscape features are inevitable. Furthermore, the labels used for training often have overlapping or similar definitions, which complicates the learning process and reduces classification accuracy for certain elements. In the future, selective searches could be used to improve the accuracy of the model when using a fully customizable training environment.
In addition, the model’s ability to generalize to novel landscape types not represented in the training data is limited. Future research could obtain more comprehensive landscape-preference data for users, thereby reducing the impact of data bias, and further optimize computer-vision algorithms to improve the accuracy of image-recognition models or expand the training dataset to include more diverse landscape features. In the future, selective searches can be used to improve the accuracy of the model while using a fully customizable training environment.

5. Conclusions

To address the limitations of single-modality analysis in landscape-preference research, this study proposes an innovative multimodal method of landscape-preference analysis. Sentiment analysis was conducted on large-scale online textual data, while a content-recognition model was developed to extract landscape elements from images, and preferences were analyzed from both temporal and element-based dimensions. Cosine similarity was used to quantify the similarity of landscape elements represented by the two data modalities.
An empirical study in Nanjing led to the following conclusions: users generally hold positive emotional attitudes toward parks, and natural landscapes are favored, with evergreen trees, shrubs, and flowers being the most popular landscape elements in Nanjing’s urban parks. Cosine similarity results showed consistency between the text and image modalities in only 12 elements, such as sunsets, lanterns, flowers, boats, and aquatic plants. In contrast, elements like evergreen trees, shrubs, modern buildings, deciduous trees, and lawns exhibited no significant similarity, indicating that the two data modalities are complementary in landscape-preference research.
This empirical study of Nanjing shows that textual data can effectively reflect visitors’ emotional experiences and subjective evaluations, while image data directly presents the characteristics of physical landscapes. Integrated analysis of the two significantly enhances the comprehensiveness and accuracy of landscape-preference identification. This paper introduces a cross-modal quantitative method based on NLP and image object detection, achieving methodological integration of the two types of data. The global popularity of user-generated data and the cross-modal method can be taken advantage of in different regions to assess user-centered landscape preferences. The results of this study will help to inform decision-makers and thus allow them to respond better to the public’s needs, contributing to a more livable and sustainable urban environment.

Author Contributions

Conceptualization, J.Y., B.Q. and F.Z.; methodology, J.Y. and B.Q.; software, J.Y. and F.Z.; validation, J.Y. and F.Z.; formal analysis, J.Y.; investigation, J.Y.; resources, J.Y.; data curation, B.Q. and F.Z.; writing—original draft preparation, J.Y., B.Q. and F.Z.; writing—review and editing, J.Y., B.Q. and F.Z.; visualization, B.Q.; supervision, B.Q.; project administration, F.Z. and B.Q.; funding acquisition, B.Q. and F.Z. All authors have read and agreed to the published version of the manuscript.

Funding

This research was funded by the Social Science Foundation of Jiangsu Province, China (No. 21YSD009); the Seventh Jiangsu 333 High-level Talent Program Phase Third-tier Cultivation Candidates Project (2024); the General Program of the National Natural Science Foundation of China (No. 31971721); and the Priority Academic Program Development of Jiangsu Higher Education Institutions (PAPD).

Institutional Review Board Statement

The study was conducted in accordance with the Declaration of Helsinki and approved by the Ethics Committee of Nanjing Forestry University (protocol code 20240101, 1 January 2024).

Informed Consent Statement

This study analyzes publicly available user reviews and images from urban park platforms. By posting reviews/images publicly, users implicitly consent to their content being accessed and analyzed in an anonymized, aggregated manner for academic research. No direct interaction with individuals occurred, and no personally identifiable information was collected, used, or published. All data were anonymized and analyzed in aggregate form in accordance with platform terms of use and ethical research standards.

Data Availability Statement

The research data are available upon request from the corresponding author.

Acknowledgments

We express our gratitude to the Baidu AI platform for providing the API to provide technical support for sentiment analysis in this study. We also acknowledge the Baidu general object and scene recognition model for detecting landscape elements in images. Additionally, we thank the developers of LabelImg v1.8.1 for providing technical support for image annotation.

Conflicts of Interest

The authors declare no conflicts of interest.

Appendix A

Table A1. Basic information about sample parks.
NameLocationArea (m2)LongitudeLatitude
Bazishan ParkGulou District95,111118.7532.09
Binjiang ParkGulou District29,809118.7132.00
Gulin ParkGulou District202,074118.7532.07
Qingliangshan ParkGulou District186,118118.7632.05
Xiuqiu ParkGulou District125,611118.7532.09
Daqiao ParkGulou District140,699118.7532.11
National Defense ParkGulou District144,224118.7532.05
Shizishan ParkGulou District2,320,917118.7532.09
Mochou Lake ParkJianye District517,076118.7632.04
Nanhu ParkJianye District74,128118.7632.03
Erqiao ParkQixia District788,454118.8532.15
Bailuzhou ParkQinhuai District137,270118.8032.02
Qiqiaoweng Wetland ParkQinhuai District250,063118.8332.01
Beijige ParkXuanwu District147,095118.7932.06
Jiuhuashan ParkXuanwu District108,353118.8132.06
Xuanwu Lake ParkXuanwu District5,044,151118.8032.07
Crescent Lake ParkXuanwu District230,944118.8332.03
Jubao Mountain ParkXuanwu District549,856118.8732.10
Huashen Lake ParkYuhuatai District174,348118.7831.99
Table A2. Example of sentiment-analysis results.
TextSentimentConfidencePositive Prob
As the saying goes, it is easy to find a thousand plums, but hard to find a lotus.20.6770.855
To get to a scenic spot like the lotus pond, you have to walk another 20 min.10.3490.467
The water on the swan side is very dirty and has no aesthetic appeal.00.9970.002
Table A3. Mean sentiment scores, comment data volume, and ANOVA test results for each season.
SeasonMean Sentiment ScoreData VolumeF (Sentiment)p-Value (Sentiment)F (Volume)p-Value (Volume)
Spring
Summer
Autumn
1.9151149.40.21550.88421.71030.205
1.907597.0
1.900751.2
Winter1.910745.8
Table A4. Comparison of sentiment scores and data volume: holidays vs. weekdays and inter-weekday variation.
ComparisonStatistic TypeStatistic Valuep-Value
Sentiment Score (Holidays vs. Weekdays)t-statistic−1.10.2718
Sentiment Score (Mon to Fri)F-statistic0.420.7943
Data Volume (Holidays vs. Weekdays)t-statistic3.830.0001 ***
Data Volume (Mon to Fri)F-statistic0.670.6123
*** p < 0.01, indicates statistical significance.

Appendix B

Figure A1. (a) Labeling example using LabelImg; (b) example of pattern-recognition results.
Buildings 15 02563 g0a1
Figure A2. Quarterly data volume and sentiment averages from 2019 to 2023.
Buildings 15 02563 g0a2

References

  1. Liu, Y.; Wang, R.; Xiao, Y.; Huang, B.; Chen, H.; Li, Z. Exploring the Linkage between Greenness Exposure and Depression among Chinese People: Mediating Roles of Physical Activity, Stress and Social Cohesion and Moderating Role of Urbanicity. Health Place 2019, 58, 102168. [Google Scholar] [CrossRef] [PubMed]
  2. Noszczyk, T.; Gorzelany, J.; Kukulska-Kozie, A.; Hernik, J. The Impact of the COVID-19 Pandemic on the Importance of Urban Green Spaces to the Public. Land Use Policy 2022, 113, 105925. [Google Scholar] [CrossRef] [PubMed]
  3. Zhu, Q.; Yao, P.; Li, J. The Effect of Nature-Based Landscape Design on Human Health and Well-Being: A Thematic Synthesis. J. Environ. Eng. Landsc. Manag. 2025, 33, 55–71. [Google Scholar] [CrossRef]
  4. Ha, J.; Kim, H.J.; With, K.A. Urban Green Space Alone Is Not Enough: A Landscape Analysis Linking the Spatial Distribution of Urban Green Space to Mental Health in the City of Chicago. Landscape Urban Plann. 2022, 218, 104309. [Google Scholar] [CrossRef]
  5. Neale, C.; Lopez, S.; Roe, J. Psychological Restoration and the Effect of People in Nature and Urban Scenes: A Laboratory Experiment. Sustainability 2021, 13, 6464. [Google Scholar] [CrossRef]
  6. Reyes-Riveros, R.; Altamirano, A.; De la Barrera, F.; Rozas-Vasquez, D.; Vieli, L.; Meli, P. Linking Public Urban Green Spaces and Human Well-Being: A Systematic Review. Urban For. Urban Green. 2021, 61, 127105. [Google Scholar] [CrossRef]
  7. Crețan, R.; Chasciar, D.; Dragan, A. Forests and Their Related Ecosystem Services: Visitors’ Perceptions in the Urban and Peri-Urban Spaces of Timișoara, Romania. Forests 2024, 15, 2177. [Google Scholar] [CrossRef]
  8. Peters, K. Being Together in Urban Parks: Connecting Public Space, Leisure, and Diversity. Leis. Sci. 2010, 32, 418–433. [Google Scholar] [CrossRef]
  9. Enssle, F.; Kabisch, N. Urban Green Spaces for the Social Interaction, Health and Well-Being of Older People-an Integrated View of Urban Ecosystem Services and Socio-Environmental Justice. Environ. Sci. Policy 2020, 109, 36–44. [Google Scholar] [CrossRef]
  10. Lai, S.; Deal, B. Parks, Green Space, and Happiness: A Spatially Specific Sentiment Analysis Using Microblogs in Shanghai, China. Sustainability 2023, 15, 146. [Google Scholar] [CrossRef]
  11. Jundi, W.; Zhiqiang, L.; Dawei, S.; Hui, Y. Knowledge Mapping Analysis of Foreign Urban Green Space Research Based on CiteSpace. Chin. Landsc. Archit. 2018, 34, 5–11. [Google Scholar]
  12. Beatley, T. Biophilic Cities. In Encyclopedia of Sustainability Science and Technology; Springer: New York, NY, USA, 2020; pp. 1–19. ISBN 978-1-4939-2493-6. [Google Scholar]
  13. Hofmann, M.; Westermann, J.R.; Kowarik, I.; Van der Meer, E. Perceptions of Parks and Urban Derelict Land by Landscape Planners and Residents. Urban For. Urban Green. 2012, 11, 303–312. [Google Scholar] [CrossRef]
  14. Li, X.-P.; Fan, S.-X.; Kühn, N.; Dong, L.; Hao, P.-Y. Residents’ Ecological and Aesthetical Perceptions toward Spontaneous Vegetation in Urban Parks in China. Urban For. Urban Green. 2019, 44, 126397. [Google Scholar] [CrossRef]
  15. Liu, Q.; Zhu, Z.; Zeng, X.; Zhuo, Z.; Ye, B.; Fang, L.; Huang, Q.; Lai, P. The Impact of Landscape Complexity on Preference Ratings and Eye Fixation of Various Urban Green Space Settings. Urban For. Urban Green. 2021, 66, 127411. [Google Scholar] [CrossRef]
  16. Liu, W.; Tsao, C.; Lin, C. Tourists’ Preference for Colors of Forest Landscapes and Its Implications for Forest Landscape Planning Policies. For. Policy Econ. 2023, 147, 102887. [Google Scholar] [CrossRef]
  17. Tan, C.; Chen, W.Y.; Su, Y.; Fritsch, A.; Canu, P.; Cao, Y.; Vazhayil, A.M.; Wantzen, K.M. Wild or Neat? Personal Traits Affect Public Preference for Wildness of Urban Lakeshores in France and China. Landsc. Urban Plann. 2024, 252, 105190. [Google Scholar] [CrossRef]
  18. Zhang, G.; Wu, G. Interactive Influence of the Perceived Visual Richness, Greenness and Scenography on Landscape Preference of Urban Woodland. J. Environ. Psychol. 2025, 103, 102586. [Google Scholar] [CrossRef]
  19. Ren, W.; Zhan, K.; Chen, Z.; Hong, X.-C. Research on Landscape Perception of Urban Parks Based on User-Generated Data. Buildings 2024, 14, 2776. [Google Scholar] [CrossRef]
  20. Li, X.; Pang, W.; Han, L.; Yan, Y.; Pan, X.; Yang, D. Relationship between Landscape Character and Public Preferences in Urban Landscapes: A Case Study from the East–West Mountain Region in Wuhan, China. Land 2025, 14, 1228. [Google Scholar] [CrossRef]
  21. McKitrick, M.K.; Schuurman, N.; Crooks, V.A. Collecting, Analyzing, and Visualizing Location-Based Social Media Data: Review of Methods in GIS-Social Media Analysis. Geojournal 2023, 88, 1035–1057. [Google Scholar] [CrossRef]
  22. Hausmann, A.; Toivonen, T.; Slotow, R.; Tenkanen, H.; Moilanen, A.; Heikinheimo, V.; Di Minin, E. Social Media Data Can Be Used to Understand Tourists’ Preferences for Nature-Based Experiences in Protected Areas. Conserv. Lett. 2018, 11, e12343. [Google Scholar] [CrossRef]
  23. Grzyb, T.; Kulczyk, S. How Do Ephemeral Factors Shape Recreation along the Urban River? A Social Media Perspective. Landsc. Urban Plann. 2023, 230, 104638. [Google Scholar] [CrossRef]
  24. Liu, S.; Su, C.; Zhang, J.; Takeda, S.; Liu, J.; Yang, R. Cross-Cultural Comparison of Urban Green Space through Crowdsourced Big Data: A Natural Language Processing and Image Recognition Approach. Land 2023, 12, 767. [Google Scholar] [CrossRef]
  25. Helbich, M.; Yao, Y.; Liu, Y.; Zhang, J.; Liu, P.; Wang, R. Using Deep Learning to Examine Street View Green and Blue Spaces and Their Associations with Geriatric Depression in Beijing, China. Environ. Int. 2019, 126, 107–117. [Google Scholar] [CrossRef] [PubMed]
  26. Zheng, Y.; Zhu, J.; Wang, S.; Guo, P. Perceived Economic Values of Cultural Ecosystem Services in Green and Blue Spaces of 98 Urban Wetland Parks in Jiangxi, China. Forests 2023, 14, 273. [Google Scholar] [CrossRef]
  27. Song, Y.; Ning, H.; Ye, X.; Chandana, D.; Wang, S. Analyze the Usage of Urban Greenways through Social Media Images and Computer Vision. Environ. Plann. B Urban Anal. City Sci. 2022, 49, 1682–1696. [Google Scholar] [CrossRef]
  28. Li, Y.; Qiu, B. Using Deep Learning Approaches to Quantify Landscape Preference of the Chinese Grand Canal: An Empirical Case Study of the Yangzhou Ancient Canal. Sustainability 2024, 16, 3602. [Google Scholar] [CrossRef]
  29. Ma, X.; Qiu, H. A Study on Landscape Image and Public Perception and Preferences of Lake Parks Based on Internet Photo Data and Auto ML Model. Chin. Landsc. Archit. 2022, 38, 86–91. [Google Scholar] [CrossRef]
  30. Zhang, J.; Li, D.; Ning, S.; Furuya, K. Sustainable Urban Green Blue Space (UGBS) and Public Participation: Integrating Multisensory Landscape Perception from Online Reviews. Land 2023, 12, 1360. [Google Scholar] [CrossRef]
  31. Zhou, C.; Zhang, S.; Zhao, M.; Wang, L.; Chen, J.; Liu, B. Investigating the Dynamicity of Sentiment Predictors in Urban Green Spaces: A Machine Learning-Based Approach. Urban For. Urban Green. 2023, 89, 128130. [Google Scholar] [CrossRef]
  32. Huang, W.; Zhao, X.; Lin, G.; Wang, Z.; Chen, M. How to Quantify Multidimensional Perception of Urban Parks? Integrating Deep Learning-Based Social Media Data Analysis with Questionnaire Survey Methods. Urban For. Urban Green. 2025, 107, 128754. [Google Scholar] [CrossRef]
  33. Luo, J.; Lei, Z.; Hu, Y.; Wang, M.; Cao, L. Analysis of Tourists’ Sentiment Tendency in Urban Parks Based on Deep Learning: A Case Study of Tianjin Water Park. Chin. Landsc. Archit. 2021, 37, 65–70. [Google Scholar] [CrossRef]
  34. Zhang, W.; Yoshida, T.; Tang, X. A Comparative Study of TF* IDF, LSI and Multi-Words for Text Classification. Expert Syst. Appl. 2011, 38, 2758–2765. [Google Scholar] [CrossRef]
  35. Salton, G.; McGill, M.J. Modern Information Retrieval; McGraw-Hill Book Company: New York, NY, USA, 1983. [Google Scholar]
  36. Haviland-Jones, J.; Rosario, H.H.; Wilson, P.; McGuire, T.R. An Environmental Approach to Positive Emotion: Flowers. Evol. Psychol. 2005, 3, 147470490500300109. [Google Scholar] [CrossRef]
  37. Todorova, A.; Asakawa, S.; Aikoh, T. Preferences for and Attitudes towards Street Flowers and Trees in Sapporo, Japan. Landscape Urban Plann. 2004, 69, 403–416. [Google Scholar] [CrossRef]
  38. Li, J.; Dai, G.; Tang, J.; Chen, Y. Conceptualizing Festival Attractiveness and Its Impact on Festival Hosting Destination Loyalty: A Mixed Method Approach. Sustainability 2020, 12, 3082. [Google Scholar] [CrossRef]
  39. Liu, C.; Wang, T.-Y.; Yuizono, T. Assessing the Landscape Visual Quality of Urban Green Spaces with Multidimensional Visual Indicators. Urban For. Urban Green. 2025, 106, 128727. [Google Scholar] [CrossRef]
  40. Wan, C.; Shen, G.Q.; Choi, S. Eliciting Users’ Preferences and Values in Urban Parks: Evidence from Analyzing Social Media Data from Hong Kong. Urban For. Urban Green. 2021, 62, 127172. [Google Scholar] [CrossRef]
  41. Komossa, F.; Wartmann, F.M.; Kienast, F.; Verburg, P.H. Comparing Outdoor Recreation Preferences in Peri-Urban Landscapes Using Different Data Gathering Methods. Landsc. Urban Plan. 2020, 199, 103796. [Google Scholar] [CrossRef]
  42. Guan, C.; Song, J.; Keith, M.; Zhang, B.; Akiyama, Y.; Da, L.; Shibasaki, R.; Sato, T. Seasonal Variations of Park Visitor Volume and Park Service Area in Tokyo: A Mixed-Method Approach Combining Big Data and Field Observations. Urban For. Urban Green. 2021, 58, 126973. [Google Scholar] [CrossRef]
  43. Liang, H.; Zhang, Q. Temporal and Spatial Assessment of Urban Park Visits from Multiple Social Media Data Sets: A Case Study of Shanghai, China. J. Clean. Prod. 2021, 297, 126682. [Google Scholar] [CrossRef]
  44. Roberts, H.; Sadler, J.; Chapman, L. Using Twitter to Investigate Seasonal Variation in Physical Activity in Urban Green Space. Geo Geogr. Environ. 2017, 4, e00041. [Google Scholar] [CrossRef]
  45. Kovacs-Györi, A.; Ristea, A.; Kolcsar, R.; Resch, B.; Crivellari, A.; Blaschke, T. Beyond Spatial Proximity—Classifying Parks and Their Visitors in London Based on Spatiotemporal and Sentiment Analysis of Twitter Data. ISPRS Int. J. Geo Inf. 2018, 7, 378. [Google Scholar] [CrossRef]
  46. Ullah, H.; Wan, W.; Haidery, S.A.; Khan, N.U.; Ebrahimpour, Z.; Muzahid, A.A.M. Spatiotemporal Patterns of Visitors in Urban Green Parks by Mining Social Media Big Data Based upon WHO Reports. IEEE Access 2020, 8, 39197–39211. [Google Scholar] [CrossRef]
  47. Song, Y.; Fernandez, J.; Wang, T. Understanding Perceived Site Qualities and Experiences of Urban Public Spaces: A Case Study of Social Media Reviews in Bryant Park, New York City. Sustainability 2020, 12, 8036. [Google Scholar] [CrossRef]
  48. Huai, S.; Van de Voorde, T. Which Environmental Features Contribute to Positive and Negative Perceptions of Urban Parks? A Cross-Cultural Comparison Using Online Reviews and Natural Language Processing Methods. Landsc. Urban Plan. 2022, 218, 104307. [Google Scholar] [CrossRef]
  49. Nakarmi, G.; Strager, M.P.; Yuill, C.; Moreira, J.C.; Burns, R.C.; Butler, P. Assessing Public Preferences of Landscape and Landscape Attributes: A Case Study of the Proposed Appalachian Geopark Project in West Virginia, USA. Geoheritage 2023, 15, 85. [Google Scholar] [CrossRef]
  50. Sun, X.; Shi, Y. The Image Recognition of Urban Greening Tree Species Based on Deep Learning and CAMP-MKNet Model. Urban For. Urban Green. 2023, 85, 127970. [Google Scholar] [CrossRef]
  51. Huai, S.; Liu, S.; Zheng, T.; Van de Voorde, T. Are Social Media Data and Survey Data Consistent in Measuring Park Visitation, Park Satisfaction, and Their Influencing Factors? A Case Study in Shanghai. Urban For. Urban Green. 2023, 81, 127869. [Google Scholar] [CrossRef]
  52. Chen, Y.; Liu, X.; Gao, W.; Wang, R.Y.; Li, Y.; Tu, W. Emerging Social Media Data on Measuring Urban Park Use. Urban For. Urban Green. 2018, 31, 130–141. [Google Scholar] [CrossRef]
  53. Dao, C.; Qi, J. Seeing and Thinking about Urban Blue–Green Space: Monitoring Public Landscape Preferences Using Bimodal Data. Buildings 2024, 14, 1426. [Google Scholar] [CrossRef]
  54. Qi, Z.; Duan, J.; Su, H.; Fan, Z.; Lan, W. Using Crowdsourcing Images to Assess Visual Quality of Urban Landscapes: A Case Study of Xiamen Island. Ecol. Indic. 2023, 154, 110793. [Google Scholar] [CrossRef]
  55. Richards, D.R.; Tuncer, B. Using Image Recognition to Automate Assessment of Cultural Ecosystem Services from Social Media Photographs. Ecosyst. Serv. 2018, 31, 318–325. [Google Scholar] [CrossRef]
  56. Zhu, X.; Gao, M.; Zhang, R.; Zhang, B. Quantifying Emotional Differences in Urban Green Spaces Extracted from Photos on Social Networking Sites: A Study of 34 Parks in Three Cities in Northern China. Urban For. Urban Green. 2021, 62, 127133. [Google Scholar] [CrossRef]
  57. Waterloo, S.F.; Baumgartner, S.E.; Peter, J.; Valkenburg, P.M. Norms of Online Expressions of Emotion: Comparing Facebook, Twitter, Instagram, and WhatsApp. New Media Soc. 2018, 20, 1813–1831. [Google Scholar] [CrossRef] [PubMed]
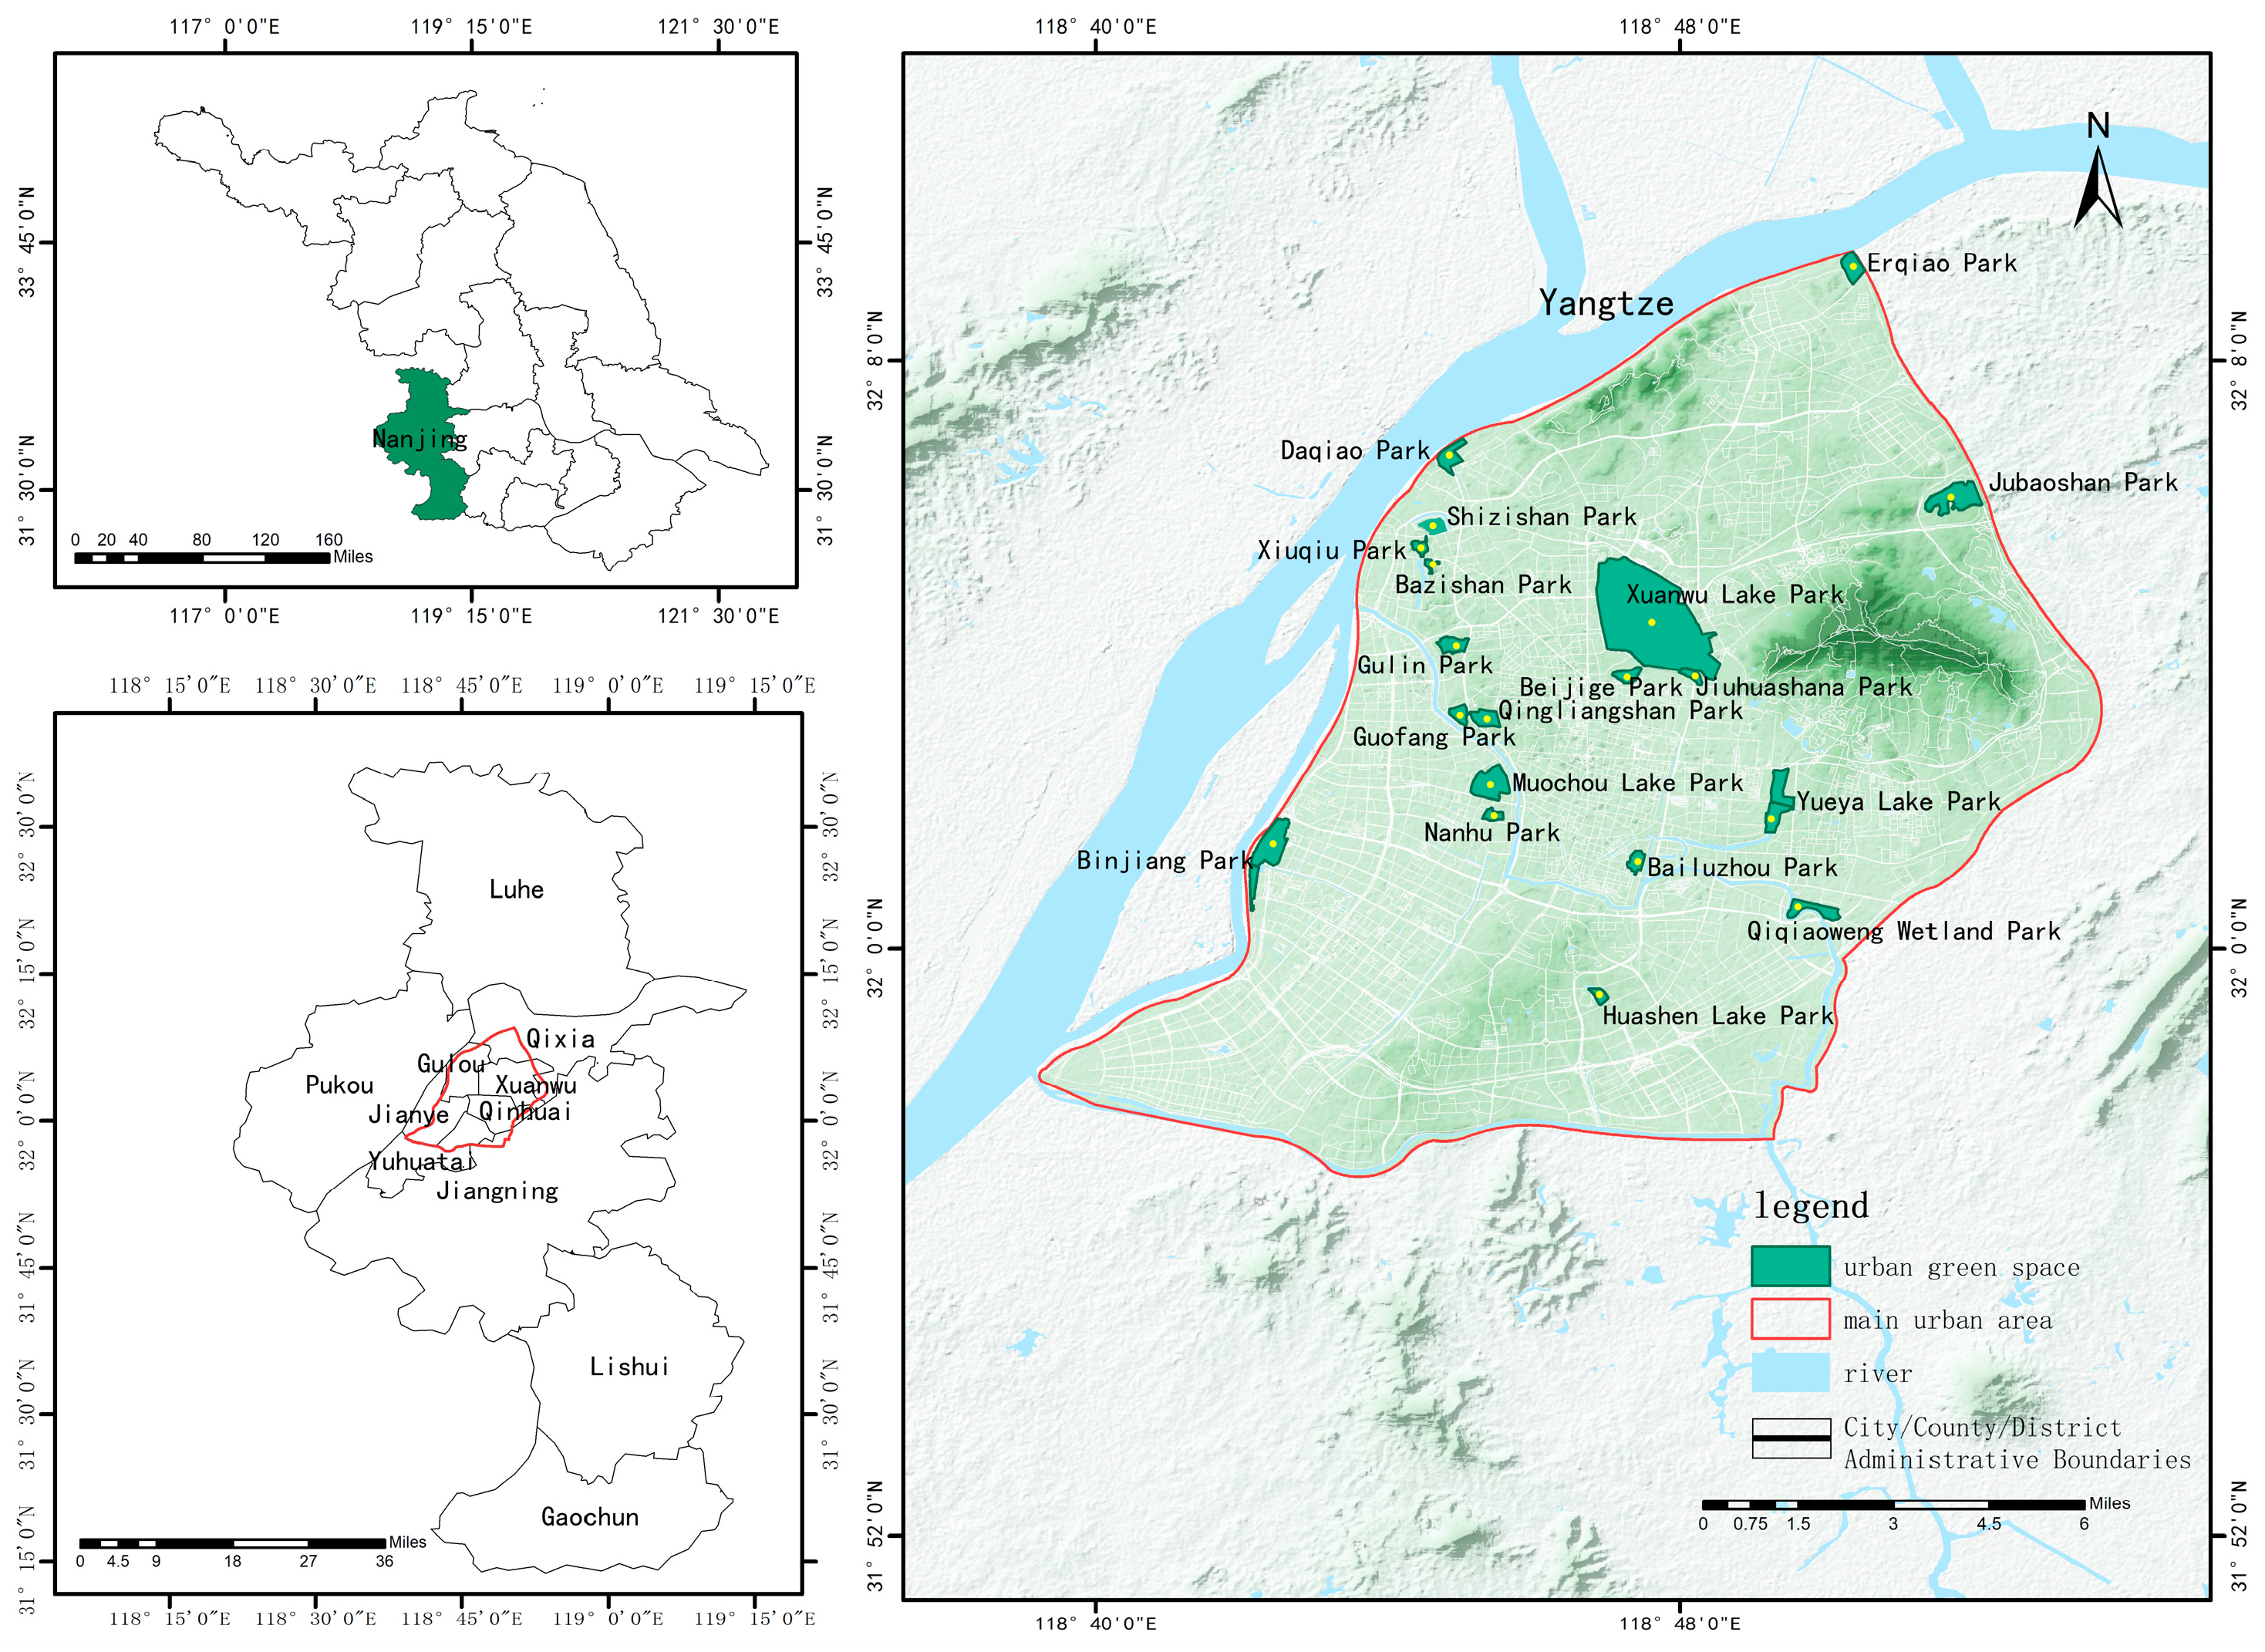
Figure 1. Overview of the study area.
Buildings 15 02563 g001
Figure 2. Research steps.
Buildings 15 02563 g002
Figure 3. Generic object and scene recognition results (top 30 items).
Buildings 15 02563 g003
Figure 4. (a) Results of object-detection model training; (b) mAP values for each element. F1-score: For a given category, the F1-score is the harmonic mean of precision and recall. Here, it is the average of the F1 scores for each category. Precision: The ratio of correctly predicted objects (under the threshold) to the total number of predicted objects. Recall: The ratio of correctly predicted objects (under the threshold) to the total number of actual objects. mAP: For object-detection tasks, each class of object is associated with a calculated precision (Precision) and recall (Recall). After multiple calculations/tests at different thresholds, each class is assigned a P–R curve, and the area under the curve is the average.
Buildings 15 02563 g004
Figure 5. (a) Example high-frequency words from the text; (b) co-occurrence relationships of high-frequency words.
Buildings 15 02563 g005
Figure 6. Co-occurrence matrix got high-frequency-words from the text dataset.
Buildings 15 02563 g006
Figure 7. Landscape elements recognized in images, by frequency.
Buildings 15 02563 g007
Figure 8. Co-occurrence relationships among landscape elements in images.
Buildings 15 02563 g008
Figure 9. Sentiment orientation by landscape type.
Buildings 15 02563 g009
Figure 10. Annual data volume and sentiment averages from 2019 to 2023.
Buildings 15 02563 g010
Figure 11. Data distribution.
Buildings 15 02563 g011
Table 1. Nanjing urban park landscape classification.
Landscape TypeLandscape Elements
Buildings and structuresSquare
Sculpture
Stone steps
Sign
Modern architecture
Garden path
Historical and cultural landscapeTraditional architecture
Rockery
Lantern
LakeLake
Aquatic plant
Boat
Bridge
TreesDeciduous tree
Evergreen tree
Tree with colorful foliage
Forest
Shrubs and ground coverShrub
Lawn
Ornamental grass
Ecology and natural elementsAnimal
Flower
Leaf
Snow scene
Mountain
Sunset
Table 2. Analysis of landscape high-frequency words and keywords.
Landscape TypeHigh-Frequency WordsTF–IDF Keywords
Buildings and structuresCity Wall (1516), Fuzimiao (878), Evening (353), Jiming Temple (354)Sunrise (0.41), Traditional Architecture (0.38), Annual Event (0.40), Ticket Price (0.40)
Historical and cultural landscapeCity Wall (1516), Lantern Festival (1027), Fuzimiao (878), Chongzheng Academy (470)Lantern Viewing (0.42), Traces (0.38), Biaoying Gate (0.37), City Wall (0.37)
LakeXuanwu Lake (2472), Lotus (1274), Boat Ride (771), Lake Surface (825)Wild Duck (0.42), Temple (0.40), White Goose (0.40), Animals (0.39)
TreesCherry Blossom (1414), Xuanwu Lake (1051), Ginkgo (788), Ginkgo Valley (417)Lush (0.50), Cherry Blossom (0.44), Bare (0.37), Clustered (0.37), Withered (0.37)
Shrubs and ground coverLeisure (645), Picnic (226), Lawn (179), Stroll (158)Leisure Activities (0.49), Entertainment Activities (0.46), Spring Scenery (0.43), Sightseeing (0.42), Spacious (0.42)
Ecology and natural elementsHydrangea (3134), Cherry Blossom (1420), Lotus (1274), Plum Blossom (1005)Cherry Blossom (0.46), Large Bloom (0.40), Fully Bloomed (0.39), Annual Event (0.38), Very Beautiful (0.38)
Table 3. Cosine similarities of landscape elements.
Landscape ElementText-Image Cosine SimilarityPermutation Test p-Value
Sunset0.6214529360.0000 ***
Lantern0.5715476070.0000 ***
Lake0.5444876470.0000 ***
Flower0.4949474970.0000 ***
Snow scene0.3850770230.0000 ***
Hydrophyte0.3791511780.0000 ***
Boat0.3059304670.0000 ***
Traditional architecture0.2964630790.0035 ***
Evergreen tree0.230940340.4748
Bridge0.1851150440.0000 ***
Sculpture0.1742479530.0000 ***
Shrub0.1634015990.6577
Modern architecture0.1608531510.3083
Tree with colorful foliage0.1508696940.0000 ***
Animal0.147676230.0000 ***
Deciduous tree0.1004532010.0634 *
Forest0.09616960.0196 **
Lawn0.0915227580.1015
Mountain0.0743196970.3561
Garden path0.0655431290.3860
Sign0.0564932680.6219
Stone0.0550667320.1002
Ornamental grass0.0526802440.1165
Rockery0.0388075260.5656
Square0.0331133090.6007
Leaf0.0328266080.4056
Concentrate: *** p < 0.01, ** p < 0.05, * p < 0.1.
Disclaimer/Publisher’s Note: The statements, opinions and data contained in all publications are solely those of the individual author(s) and contributor(s) and not of MDPI and/or the editor(s). MDPI and/or the editor(s) disclaim responsibility for any injury to people or property resulting from any ideas, methods, instructions or products referred to in the content.