Article

Displacement Response Characteristics and Instability Risk Assessment of Excavation Face in Deep-Buried Shield Tunnel

1
School of Civil Engineering, Henan Polytechnic University, Jiaozuo 454003, China
2
Key Laboratory of Intelligent Construction and Safety Operation and Maintenance of Underground Engineering in Henan Province, Jiaozuo 454003, China
3
China Railway First Survey and Design Institute Group Co., Ltd., Xi’an 710043, China
*
Author to whom correspondence should be addressed.
Buildings 2025, 15(14), 2561; https://doi.org/10.3390/buildings15142561
Submission received: 5 June 2025 / Revised: 13 July 2025 / Accepted: 15 July 2025 / Published: 20 July 2025
(This article belongs to the Section Building Structures)

Abstract

To prevent the occurrence of excavation face instability incidents during shield tunneling, this study takes the Bailuyuan tunnel of the ‘Hanjiang-to-Weihe River Water Diversion Project’ as the engineering background. A three-dimensional discrete element method simulation was employed to analyze the tunneling process, revealing the displacement response of the excavation face to various tunneling parameters. This led to the development of a risk assessment method that considers both tunneling parameters and geological conditions for deep-buried shield tunnels. The above method effectively overcomes the limitations of finite element method (FEM) studies on shield tunneling parameters and, combined with the Analytic Hierarchy Process (AHP), enables rapid tunnel analysis and assessment. The results demonstrate that the displacement of the excavation face in shield tunnel engineering is significantly influenced by factors such as the chamber earth pressure ratio, cutterhead opening rate, cutterhead rotation speed, and tunneling speed. Specifically, variations in the chamber earth pressure ratio have the greatest impact on horizontal displacement, occurring predominantly near the upper center of the tunnel. As the chamber earth pressure ratio decreases, horizontal displacement increases sharply from 12.9 mm to 267.3 mm. Conversely, an increase in the cutterhead opening rate leads to displacement that first rises gradually and then rapidly, from 32.1 mm to 121.1 mm. A weighted index assessment model based on AHP yields a risk level of Grade II, whereas methods from other scholars result in Grade III. By implementing measures such as adjusting the grouting range, cutterhead rotation speed, and tunneling speed, field applications confirm that the risk level remains within acceptable limits, thereby verifying the feasibility of the constructed assessment method. Construction site strategies are proposed, including maintaining a chamber earth pressure ratio greater than 1, tunneling speed not exceeding 30 mm/min, cutterhead rotation speed not exceeding 1.5 rpm, and a synchronous grouting range of 0.15 m. Following implementation, the tunnel construction successfully passed the high-risk section without any incidents. This research offers a decision-making framework for shield TBM operation safety in complex geological environments.

1. Introduction

In recent years, significant improvements have been made in transportation infrastructure in western China, driven by the latest phase of the Western Development Strategy and the Transportation Power Strategy. Tunnels constructed in high-altitude areas of the west often exhibit characteristics of considerable length, deep burial, and complex geological conditions. Although the application of shield tunneling technology is well-established, employing this method under such intricate conditions presents inherent safety risks, such as instability at the excavation face [1,2,3]. This can potentially result in substantial property damage and loss of life. Therefore, to mitigate the risks associated with excavation face instability, including equipment damage, casualties, and project delays, it is essential to study the displacement behavior of the excavation face and conduct a risk assessment before construction to ensure the safety of tunnel operations.
Currently, a wide range of scholars, both at home and abroad, have carried out in-depth research on the displacement response characteristics of shield tunnel excavation face. For instance, Fu Helin et al. [4] proposed a model to describe the distribution of the displacement field in shallow-buried shield tunnels situated in composite strata. Wang Chao et al. [5] established a calculation method for soil displacement induced by construction under non-horizontal arrangements of shield tunnels. Gao Kun et al. [6] investigated the effects of nearby newly constructed tunnels on existing shield tunnels, formulating a solution for the longitudinal displacement deformation of shield tunnels. Yang et al. [7] identified factors influencing soil displacement around shield excavations through finite element numerical analysis. Wang et al. [8] examined the variations in soil displacement at the excavation face, surrounding rock stress, and surface displacement during the instability process through model testing. Zhu et al. [9] performed a comparative analysis of soil displacement responses under non-uniform convergence patterns using the discrete element method (DEM). Ma et al. [10] conducted large-scale physical model experiments to examine the displacement responses of excavation face at different tunnel buried depths. Yin et al. [11] investigated how various soil particle shapes influence the instability process of the excavation faces, revealing patterns in soil displacement, surface settlement, and support forces during tunnel excavation. Finally, Feng et al. [12] investigated the patterns of soil displacement during tunnel construction through model experimentation, while Hu et al. [13] analyzed the displacement response of twin overlapping tunnels using finite element analysis in conjunction with field monitoring techniques.
In the field of risk assessment for shield tunnel excavation faces, Broms et al. [14] first introduced the concept of the excavation face stability coefficient. Attelwell [15] proposed evaluation criteria for the stability coefficient and used it to classify tunnel stability. Ihm et al. [16] analyzed geological factors for tunneling risk assessment in Korea, encompassing seven categories and 38 factors. Ou et al. [17] created a risk assessment method for tunnel collapse that relies on case analysis and advanced geological predictions, thereby establishing a theoretical and technical framework for effective risk management. Zhang et al. [18] constructed a risk evaluation index system for dynamically assessing instability risks associated with large-section excavations in composite strata. Xue et al. [19] employed the (AHP) along with entropy weighting methods to develop a stability assessment model for excavation faces in cross-river shield tunneling. Hernández et al. [20] used finite element analysis to investigate the stress conditions of excavation faces in shallow tunnels, assessing the necessary support and stability pressure requirements. Zhang et al. [21] summarized engineering risks under adverse geological conditions, such as composite strata of varying hardness. Xu et al. [22] developed a shield tunneling construction safety risk assessment model based on dynamic Bayesian networks. Guo et al. [23] introduced an innovative risk assessment model for adjacent shield construction, incorporating nonlinear operators to conduct a thorough analysis of weights and fuzzy relational matrices. Wang et al. [24] developed a novel risk evaluation model for earth pressure balance shield tunneling by utilizing the nonlinear fuzzy AHP method. Lyu et al. [25] introduced an enhanced SPA method that integrates interval-based fuzzy numbers to evaluate safety status. Wang et al. [26] utilized gray relational analysis and entropy weighting methods to analyze deformation data, effectively tackling the issue of insufficient representativeness in data selection for operational tunnel risk assessments. Chen et al. [27] developed a comprehensive approach to evaluate ground settlement risks induced by slurry shield tunneling, proposing a classification framework for risk levels. Nezarat et al. [28] considered multiple categories of shield tunneling risks, discussing uncertainties in assessments and risk manageability. Li et al. [29] derived an analytical formula to determine the ultimate support pressure of excavation face and created a simplified index system for stability evaluation. Huang et al. [30] proposed a method based on conditional probability theory to calculate the coupling effects of tunnel construction risk factors for specific events. Li et al. [31] established indicators for various risks, including tunnel collapse and substantial deformation of surrounding rock. Wu Xianguo [32] identified and analyzed key risk factors in the unique geological context of cross-river tunnels, determining the probability and impact of each factor. Wang Xiang et al. [33] applied the AHP method to develop a risk assessment model for karst tunnel construction, assessing shield tunneling risks. Zhan Jinwu et al. [34] identified critical factors influencing tunnel construction risks, using AHP to assign indicator weights and constructing a tunnel collapse risk grading model. Ma Gang et al. [35] analyzed the fundamental causes of risks in saturated soft loess strata and proposed control measures. Zhao Yan [36] developed a stability assessment model for shield tunneling based on normal distribution theory. Yan Xianglin [37] established a risk evaluation model for shield tunneling, providing guidance for risk assessments of earth pressure balance shields in complex strata.
In recent years, the rise of artificial intelligence has indeed brought us convenience. Based on this, Lu et al. [3] employed deep learning techniques for disaster management and risk assessment in shield tunnel construction, demonstrating that the WLD-STC strategy based on long short-term memory (LSTM) and generative adversarial network (GAN) outperforms other methods in identifying and analyzing water leakage incidents during construction. Li et al. [29] established a simplified evaluation index system for the stability of the excavation face, trained the learning data using a backpropagation (BP) neural network, and validated the performance of BP in intelligent decision-making for stability assessment of shield tunnels through comparison with a technique for order preference by similarity to ideal solution (TOPSIS) prediction model. Zhao et al. [38] used ensemble learning methods to study the influence of shield tunneling parameters on ground settlement, identifying an intelligent prediction method for settlement that better aligns with construction characteristics and achieves higher accuracy. Hou et al. [39] proposed a shield clogging risk prediction approach based on numerical samples and random forest (RF) classification, and the RF classification method exhibits stronger predictive accuracy and generalization capability. Hu et al. [40] developed a tunnel segment uplift prediction model based on extreme gradient boosting (XGBoost) and employed SHapley Additive exPlanations (SHAP) to interpret the factors affecting uplift. Wang et al. [41] established a prediction model for key tunneling parameters in earth pressure balance shields, utilizing light gradient boosting machine (LGBM) algorithm and Bayesian optimization methods, and concluded that the LGBM algorithm can serve as an effective prediction method for tunneling parameters in construction.
Finally, at present, domestic and foreign scholars through the finite element method (FEM) on the shield tunnel excavation surface displacement change law research more, but, compared with the FEM, the DEM can be a real simulation of the soil particle movement characteristics and shield excavation dynamic change process; most researchers focusing on the destabilization risk factors of shield tunnels primarily concentrate on geological aspects. However, there is limited investigation into how excavation parameters affect the stability of shallow-buried tunnels. Additionally, studies examining the stability of the excavated face are scarce. Unlike previous studies that focus primarily on FEM simulations or geological risks, this study integrates excavation parameters using DEM modeling and a weighted risk model validated in real projects, and finally proposes mitigation measures.
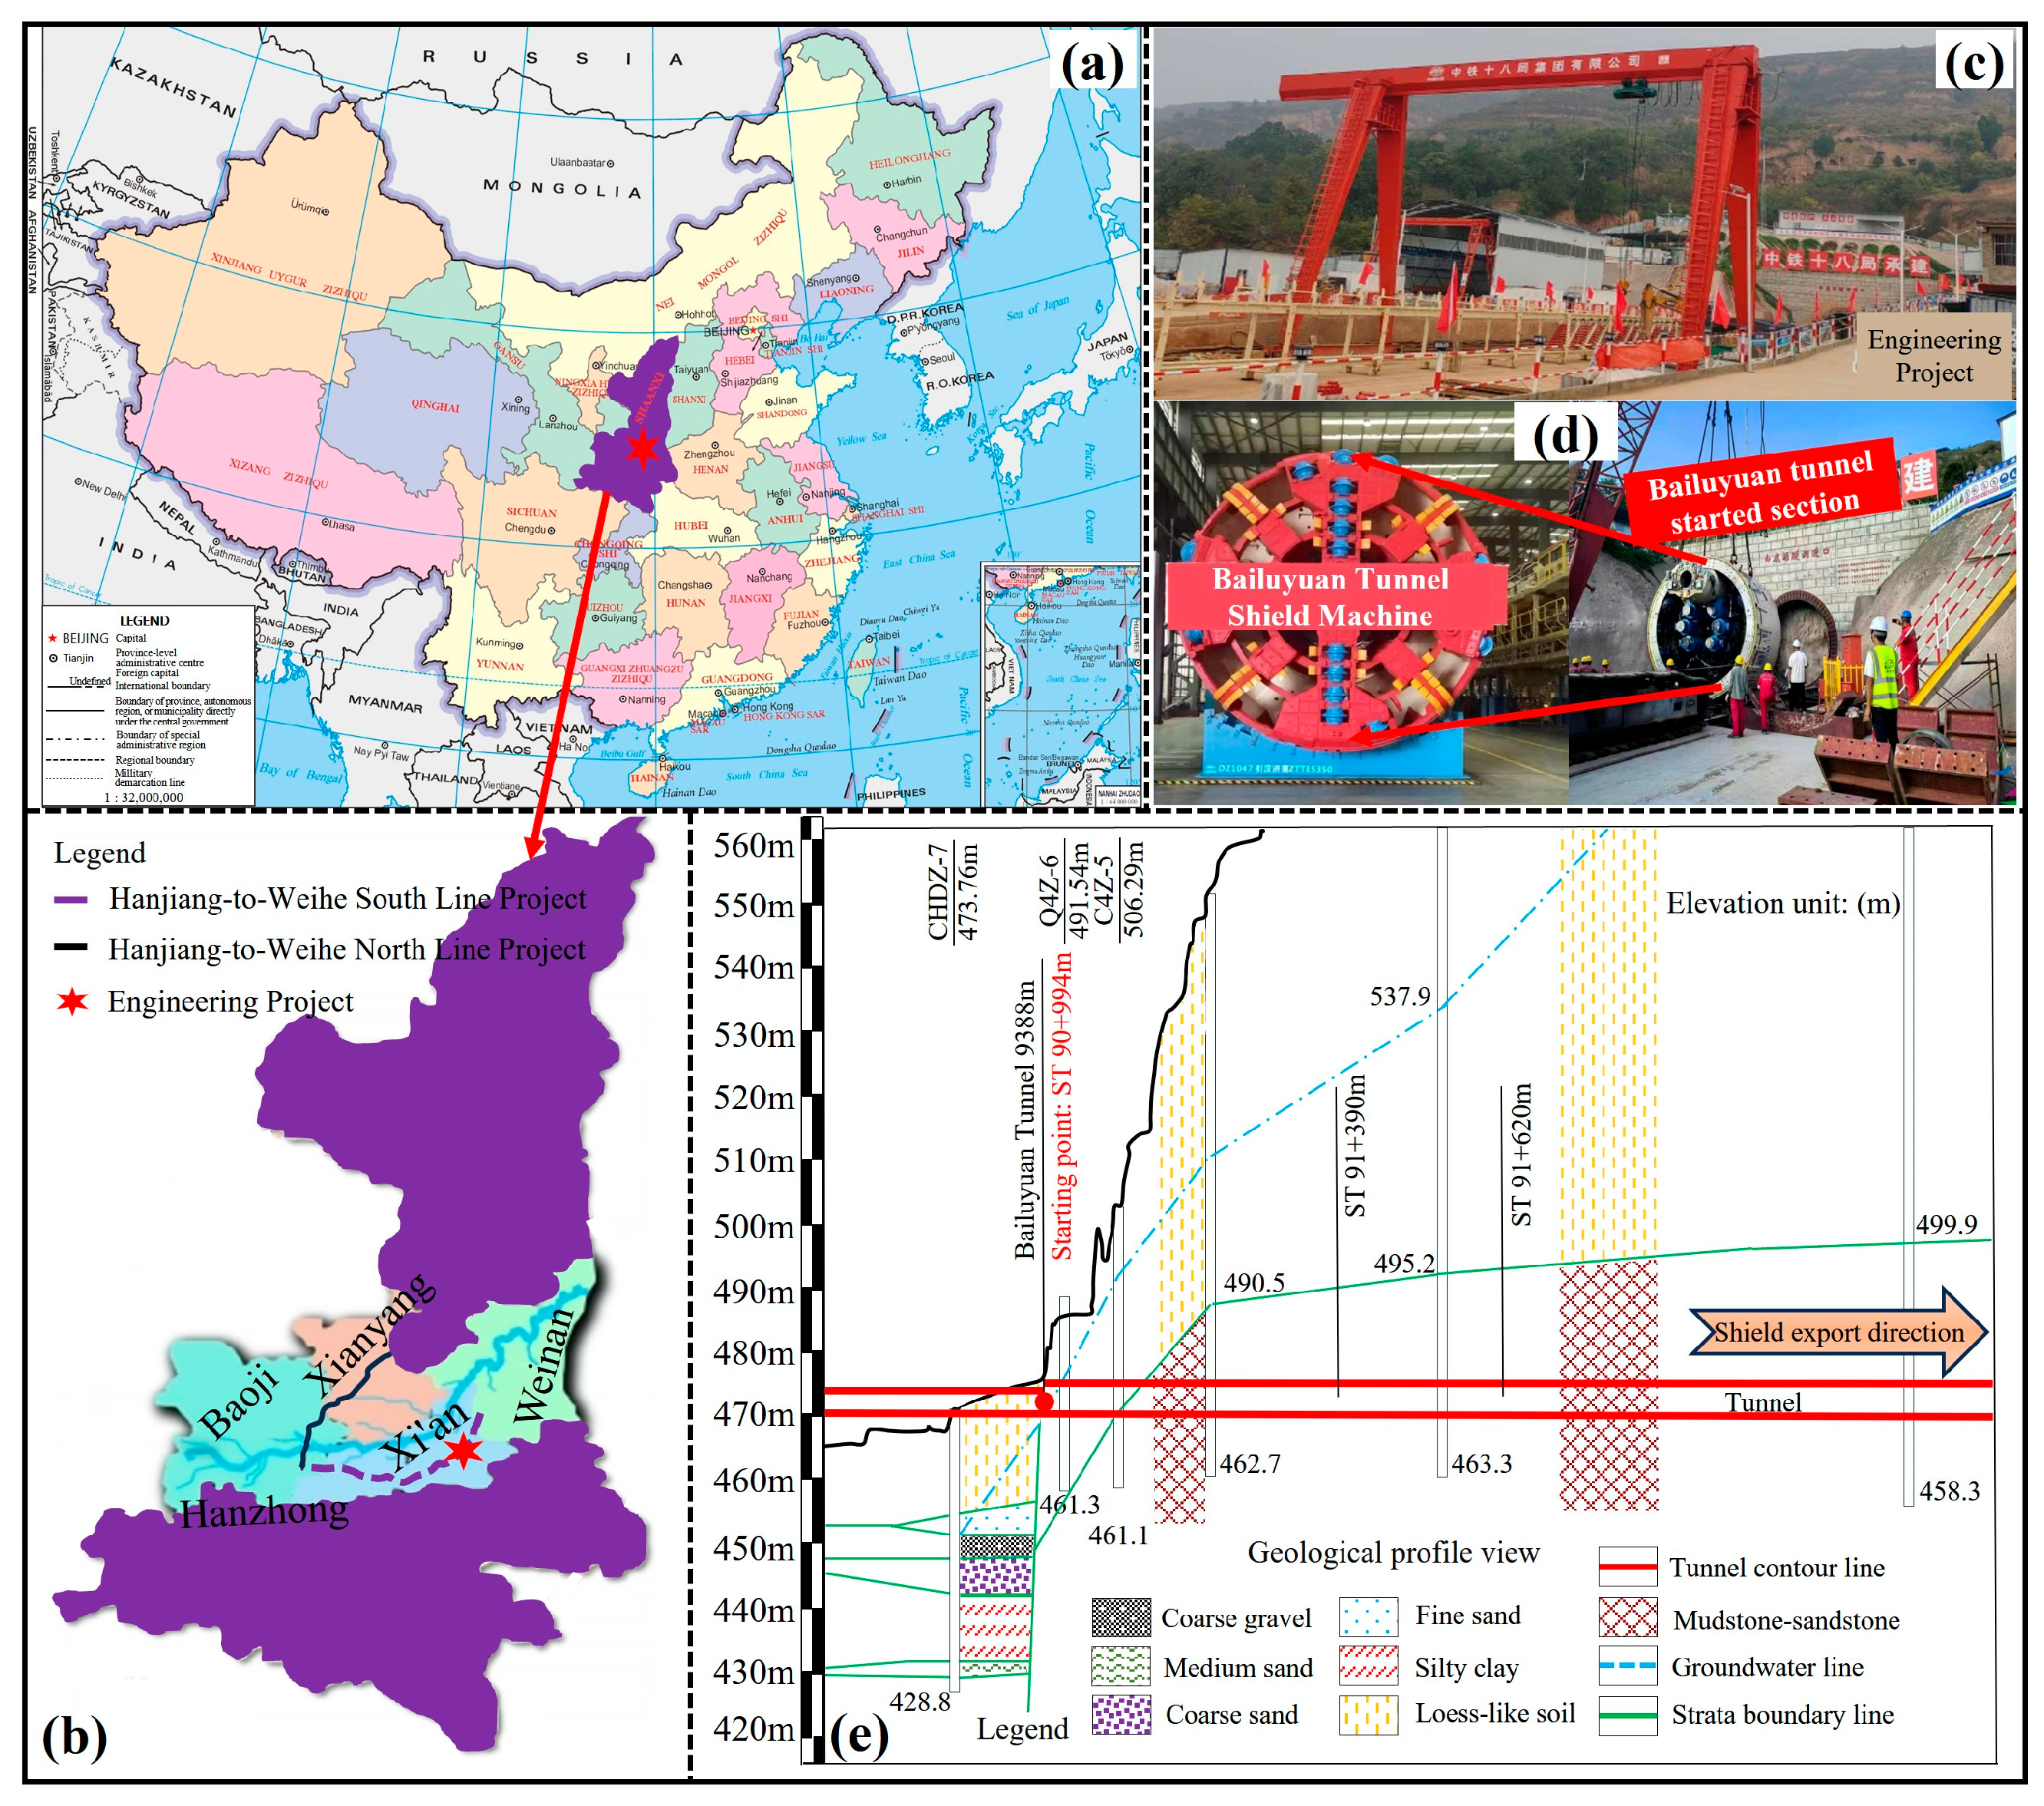
Studying the displacement response characteristics of the excavation face in shield tunnels can reveal the variation patterns of horizontal displacement under different factors, helping to identify the most critical influencing factors on tunnel stability, the secondary important ones, and those that may be insignificant, thereby facilitating the prevention of safety hazards at the source. Subsequently, risk assessment for deep-buried shield tunnels aims to reduce the probability of engineering accidents, primarily by adjusting construction measures in advance based on assessment results to avoid unnecessary casualties, property losses, and project delays. Therefore, this study focuses on the BaiLuYuan tunnel project within the ‘Hanjiang-to-Weihe River Water Diversion Project’ and employs the DEM to numerically simulate and analyze the shield tunneling process. The research aims to investigate how various tunneling parameters affect the stability of shield tunneling surface. Additionally, a model is developed to evaluate the risk of instability in the tunneling surface by considering tunneling parameters, geological conditions, design factors, and construction factors, followed by engineering validation and application. The resulting risk assessment model for shield tunnel instability plays a crucial role.

2. Discrete Element Analysis of Displacement Response Characteristics of Shield Tunnel Excavation Face Under Different Tunneling Parameters

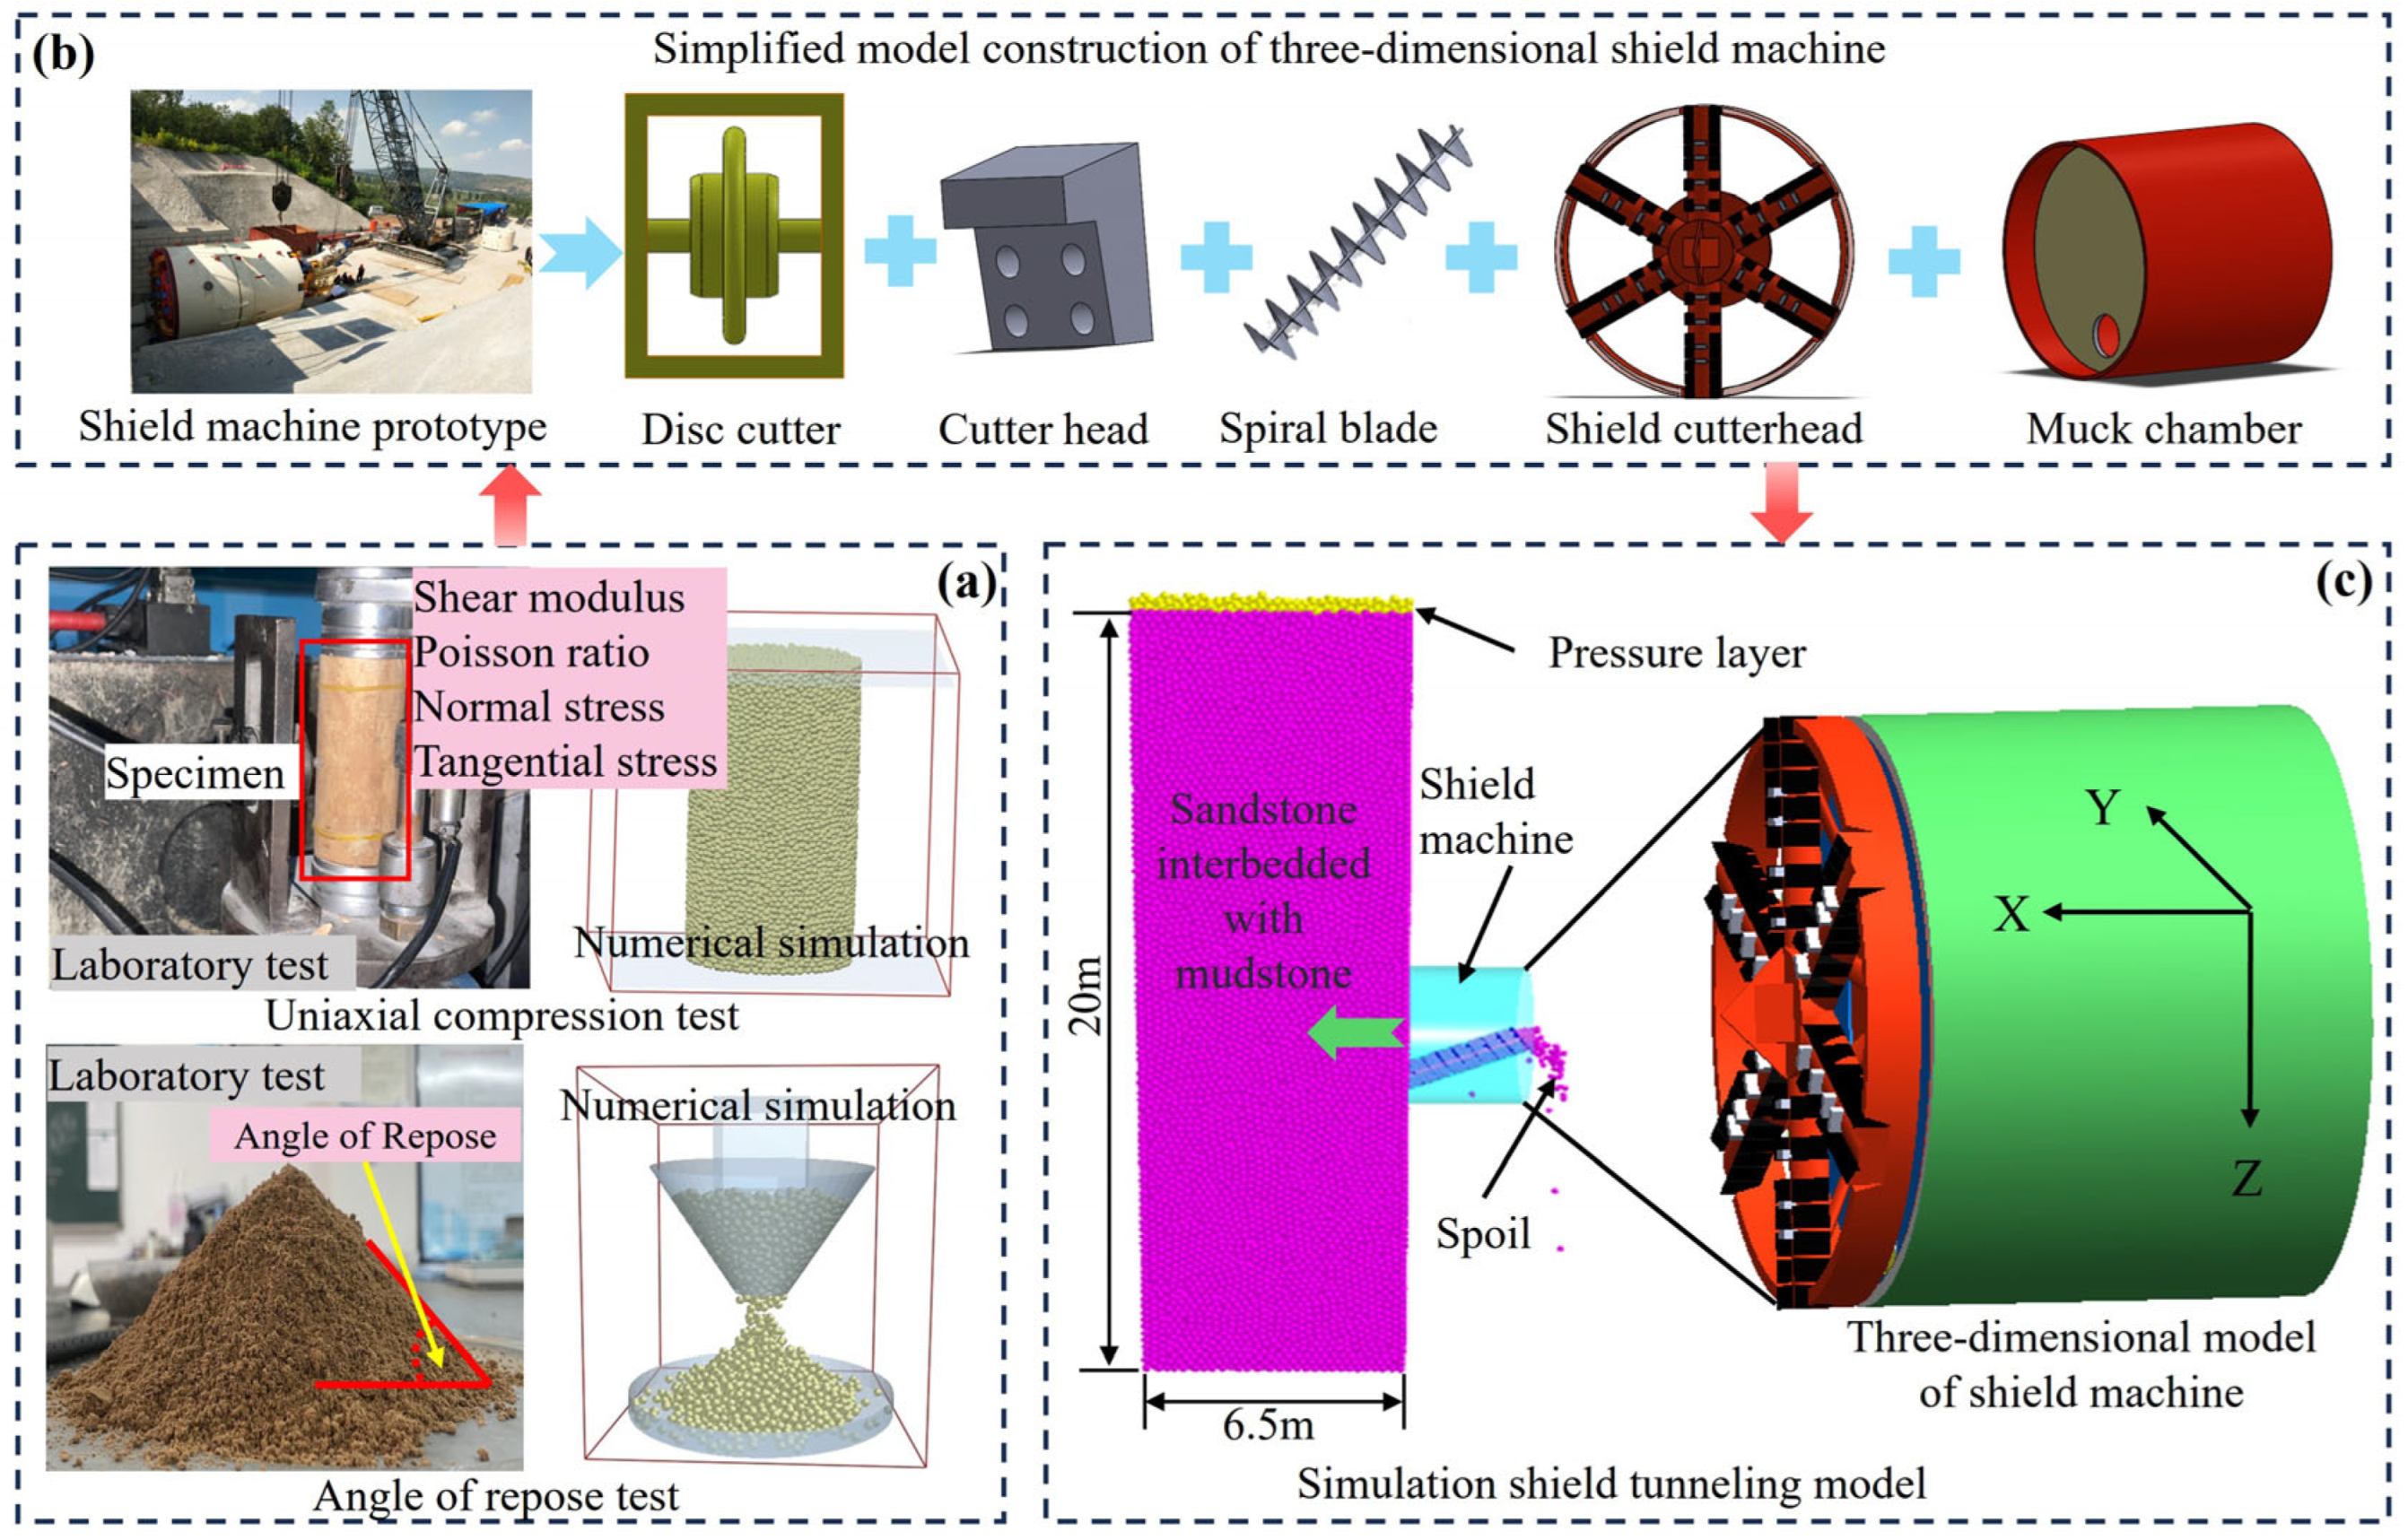
2.1. Numerical Simulation Using the Three-Dimensional DEM

A three-dimensional numerical simulation of the shield tunneling process was conducted using the DEM. Firstly, in situ surrounding rock parameters were calibrated through uniaxial compression and repose angle tests, with all materials sourced from on-site sampling, specifically sandy mudstone and loess. Since the simulation requires interactions between particles and geometry, the properties of the particle materials—such as shear modulus, density, and Poisson’s ratio—were established, along with contact parameters like the static and rolling friction coefficients. The relevant mechanical index parameters include normal contact stiffness, tangential contact stiffness, critical normal stress, and critical tangential stress. When calibrating the DEM model, the verification index is the key factor to ensure the performance and accuracy of the model. Generally, the verification indexes of DEM model are density, friction coefficient, elastic modulus, stacking angle deviation, stacking density, porosity, and peak impact force. Through the evaluation and verification of the above indicators, the accuracy and reliability of the particle simulation are ensured.
Secondly, a simplified three-dimensional shield machine model was created using SolidWorks (v2021) software. The simplified model encompassed essential tunneling components, including the screw conveyor, shield body, soil chamber, and cutterhead [42]. The cutterhead diameter was 5.1 m, the total machine length was 6.5 m, and the screw conveyor had an inclination angle of 36°.
Thirdly, when converting on-site conditions to DEM model dimensions, the Buckingham π theorem for dimensional scaling was first considered, and the calculated similarity ratio was 14. Then, a scaled ground model was constructed, in which soil particles were created to represent the strata. High in situ stress conditions typical of deep burial were simulated by generating dense particles above the soil layer. The X-axis was oriented along the tunnel axis, while the Z-axis was aligned with the direction of gravity. The longitudinal length of the model was 6.5 m, the shield tunneling layer height was 20 m, and the dense particle loading layer had a height of 0.5 m. The distance from the shield machine’s top to the model’s surface was 7.7 m. The Y-axis indicated the lateral direction, with the shield’s boundary positioned 7.95 m from both the left and right sides of the model. The distance from the shield machine’s lower edge to the model’s bottom boundary was 7.7 m. In the DEM, the contact model adopted was Hertz–Mindlin with JKR cohesion, with soil particle diameters ranging from 80 to 100 mm, and the grid size was set to 3R mm.
Finally, the shield machine model was imported into event driven execution manager EDEM (v2023) software, where its motion states were configured. Drawing from the geological features of the related project and the calibration outcomes, the parameters for the numerical model were established within the EDEM environment. The three-dimensional shield tunneling model enabled the numerical simulation of the earth pressure balance shield tunneling process. 
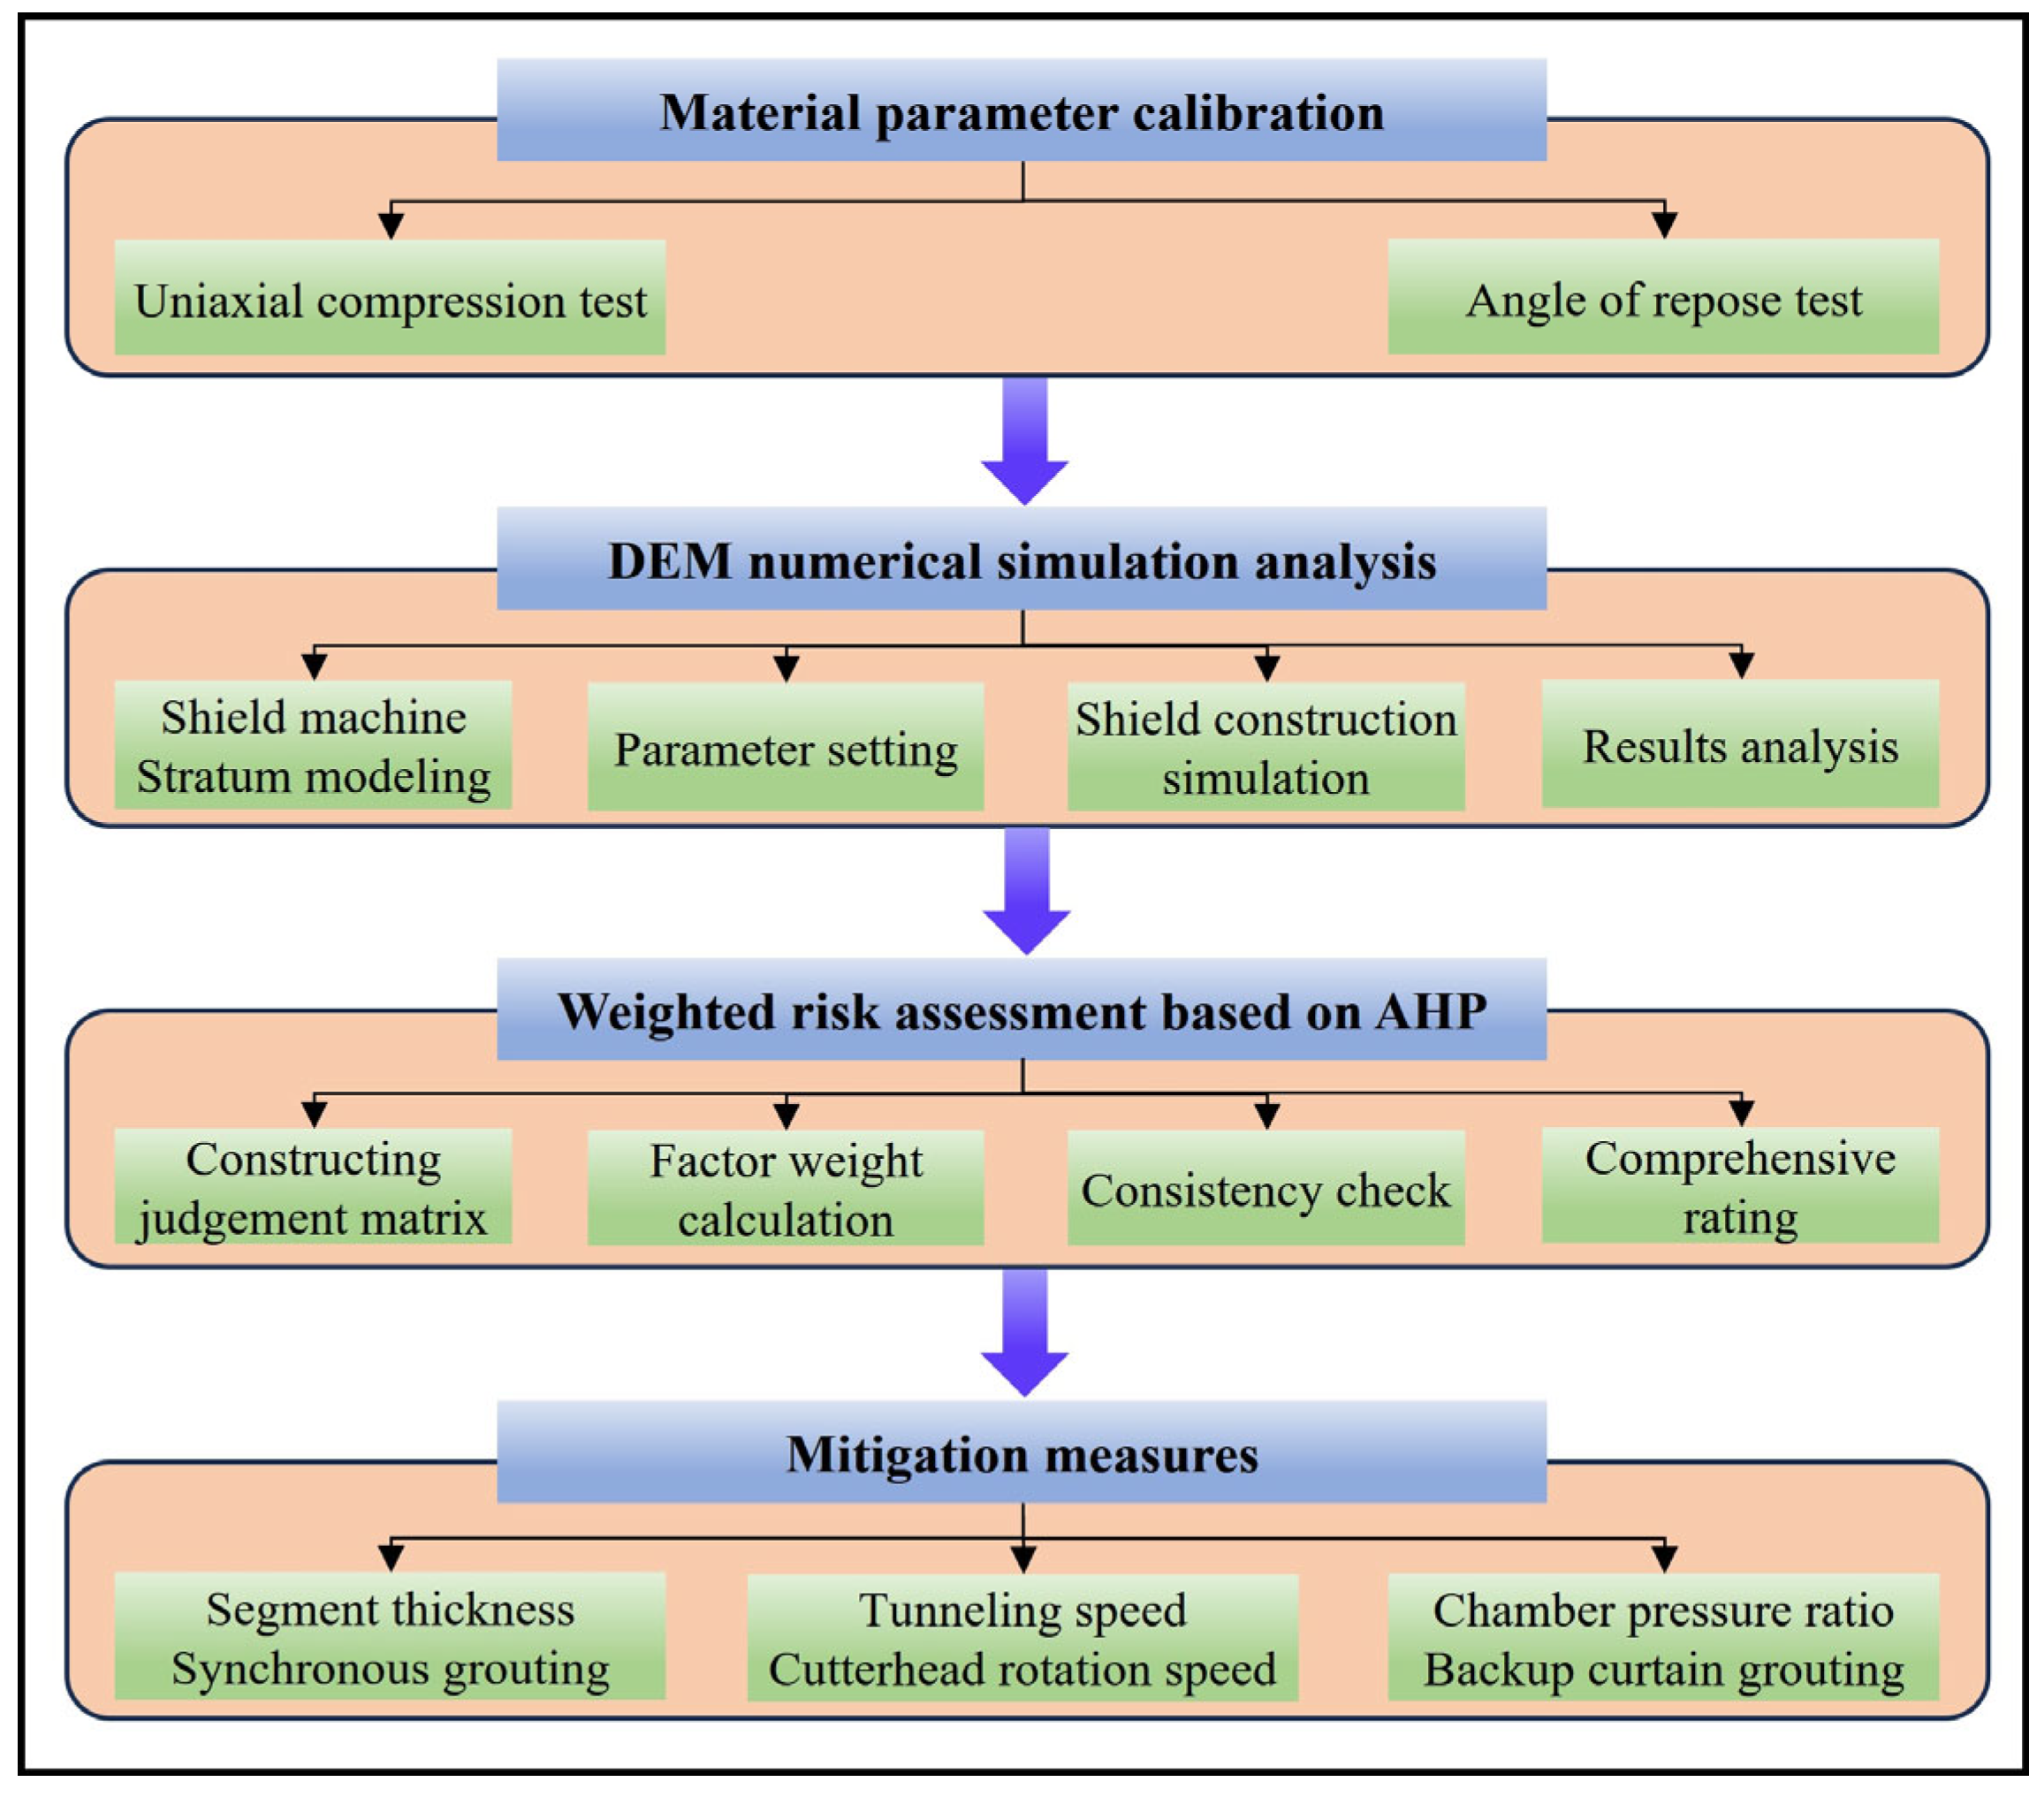
Figure 1 illustrates the outcomes of the 3D DEM simulation. The model time step was set to 3.62 × 10⁻⁶ s, with a total simulation time of 20 s. The model input parameters are as shown in Table 1, the contact parameters as shown in Table 2, and the relevant mechanical index parameters as shown in Table 3. After selecting the time step, we conducted a specific verification using the Courant condition.
According to the above steps, the control variable method is used to study the influence of different tunnel buried depths, cutterhead opening rates, cutterhead rotation speeds, tunneling speeds, and chamber earth pressure ratios on displacement of excavation face.
Following the aforementioned steps and using the control variable method, the influence patterns of various factors—such as different tunnel burial depths, cutterhead opening ratio, cutterhead rotation speed, advancement speed, and chamber earth pressure ratio (defined as the ratio of actual chamber earth pressure to excavation face soil pressure)—on excavation face displacement were investigated. The flow diagram of the modeling phase is depicted in Figure 1.

2.2. Analysis of Displacement Response Characteristics of the Shield Tunnel Excavation Face

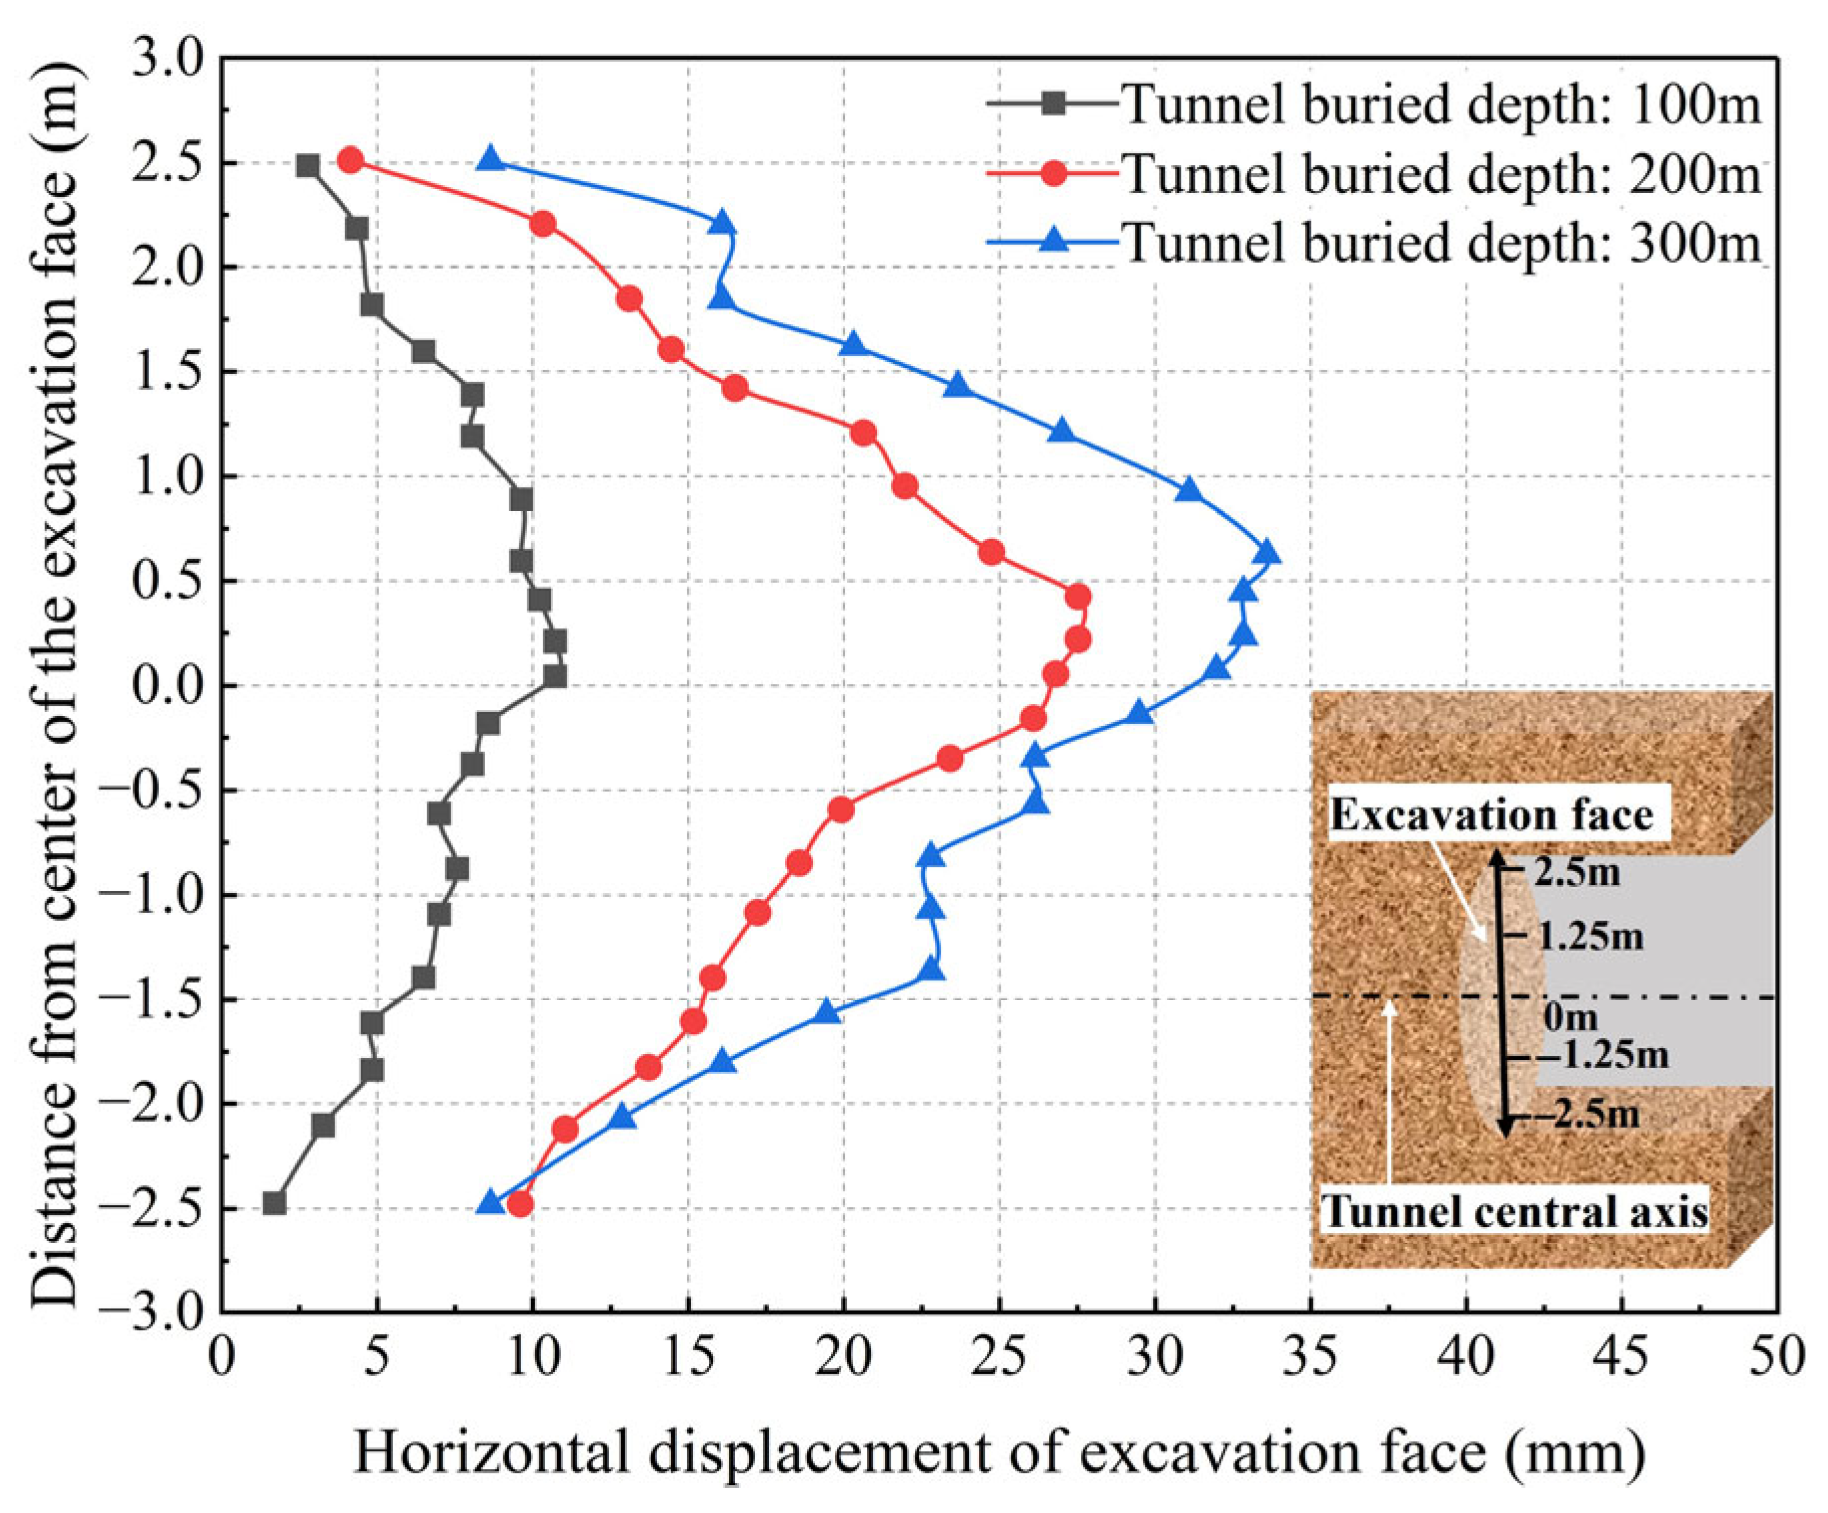
When the chamber earth pressure ratio is set to 1, the displacement response characteristics of the shield tunnel’s excavation face are analyzed for tunnel burial depths of 100 m, 200 m, and 300 m. Figure 2 illustrates the variation curves of horizontal displacement for the excavation face at different tunnel burial depths [3]. The horizontal displacement behavior of the excavation face is consistent across the three burial depths, indicating that the maximum displacement occurs at the center of the excavation face, with values gradually decreasing as the distance from the center increases. At burial depths of 100 m, 200 m, and 300 m, the maximum horizontal displacements of the excavation face are recorded as 10.7 mm, 27.6 mm, and 34 mm, respectively. This indicates that as the burial depth increases, the earth pressure on the tunnel excavation face rises, leading to a significant increase in the extrusion deformation of the excavation face, although the rate of increase becomes less pronounced.
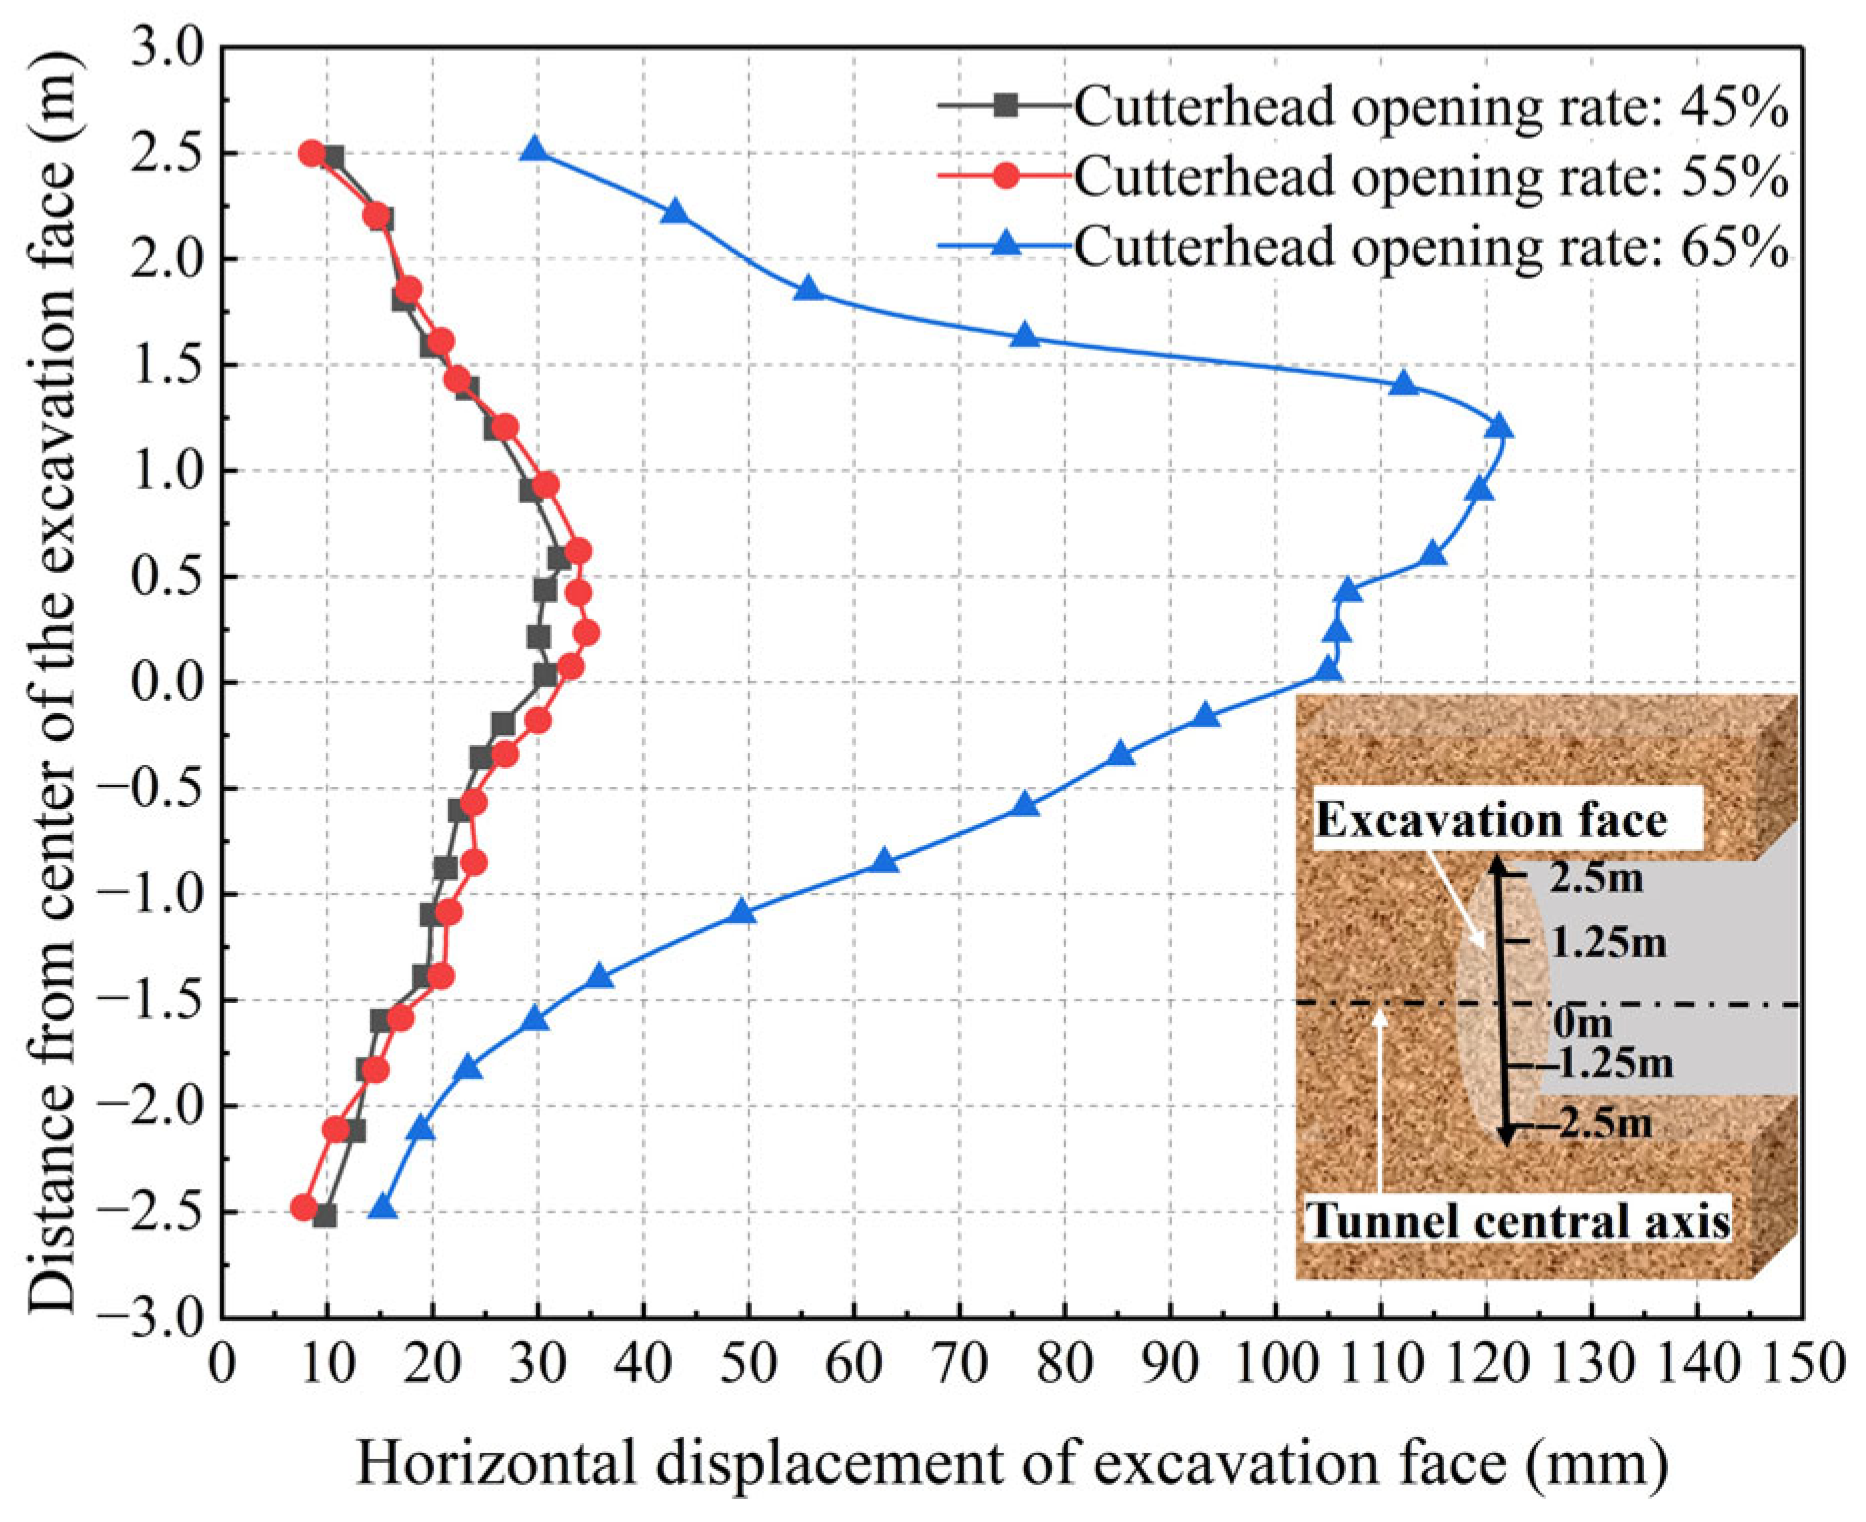
With other factors held constant, the impact of cutterhead opening rates of 45%, 55%, and 65% on the stability of the excavation face is evaluated. Figure 3 illustrates the variation curves of horizontal displacement for the excavation surface under these different opening rates. The displacement patterns observed for the three different cutterhead opening rates are generally consistent, with all exhibiting significant displacements at the upper center of the excavation face and minimal displacements farther from the center. At a cutterhead opening rate of 45%, the maximum horizontal displacement recorded for the excavation face is 32.1 mm. At a cutterhead opening rate of 55%, the horizontal displacement of the excavation face shows only a slight increase compared to the previous rate. In contrast, when the opening rate reaches 65%, there is a marked increase in horizontal displacement, with a maximum value of 121.1 mm recorded. It shows that the reduction in the cutterhead opening rate will significantly increase the supporting effect on the front soil, which can effectively reduce the horizontal displacement of excavation face.
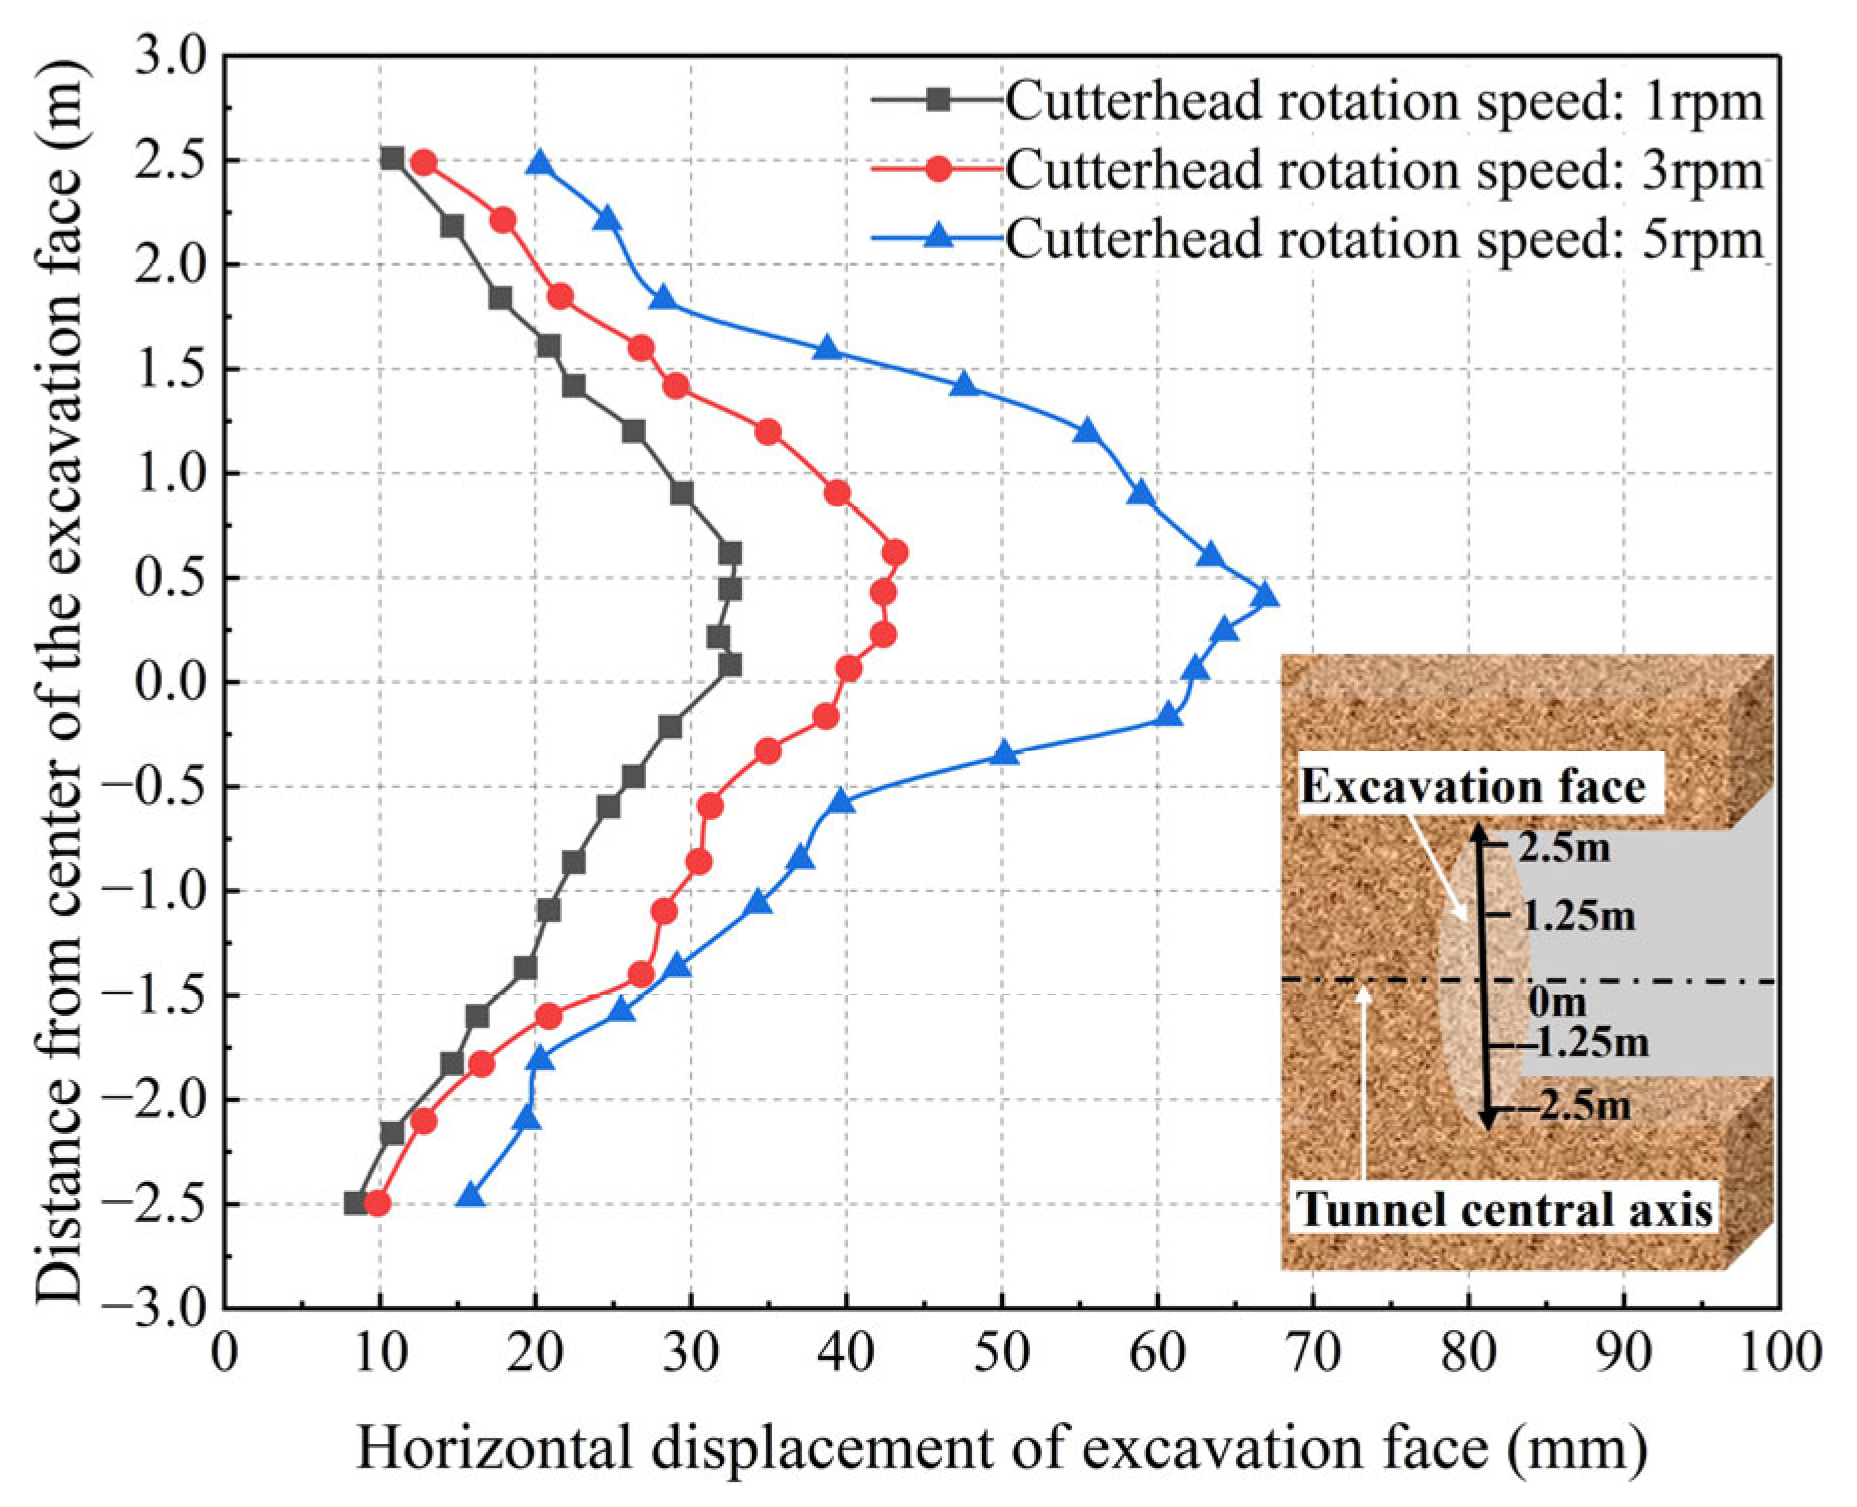
In this analysis, the impact of cutterhead rotation speed on the displacement of the excavation faces is examined while keeping other factors constant. The rotation speeds analyzed are 1 rpm, 3 rpm, and 5 rpm. Figure 4 illustrates the change curves of the horizontal displacement of the excavation face at these different rotation speeds. At a rotation speed of 1 rpm, the maximum displacement of the excavation surface measures 32.5 mm. In contrast, at 5 rpm, this maximum displacement increases to 66.9 mm, indicating approximately a twofold increase. The intensity of disturbance caused by varying cutterhead rotation speeds affects the excavation surface differently. As the cutterhead rotation speed rises, the horizontal displacement of the excavation surface accelerates significantly, highlighting the substantial impact of cutterhead rotation speed on the surrounding soil of the excavation surface.
This analysis examines the effect of varying tunneling speeds on the stability of the excavation face, while keeping other factors constant. The tunneling speeds considered are 30 mm/min, 60 mm/min, and 90 mm/min. Figure 5 presents the change curves for the horizontal displacement of the excavation face at these different speeds. The impact of varying tunneling speeds on excavation face stability is largely consistent: slower tunneling speeds result in less disturbance and reduced horizontal displacement of the excavation face. Conversely, as tunneling speeds increase, the horizontal displacement also rises, with the maximum displacement reaching 41.4 mm at the highest speed.
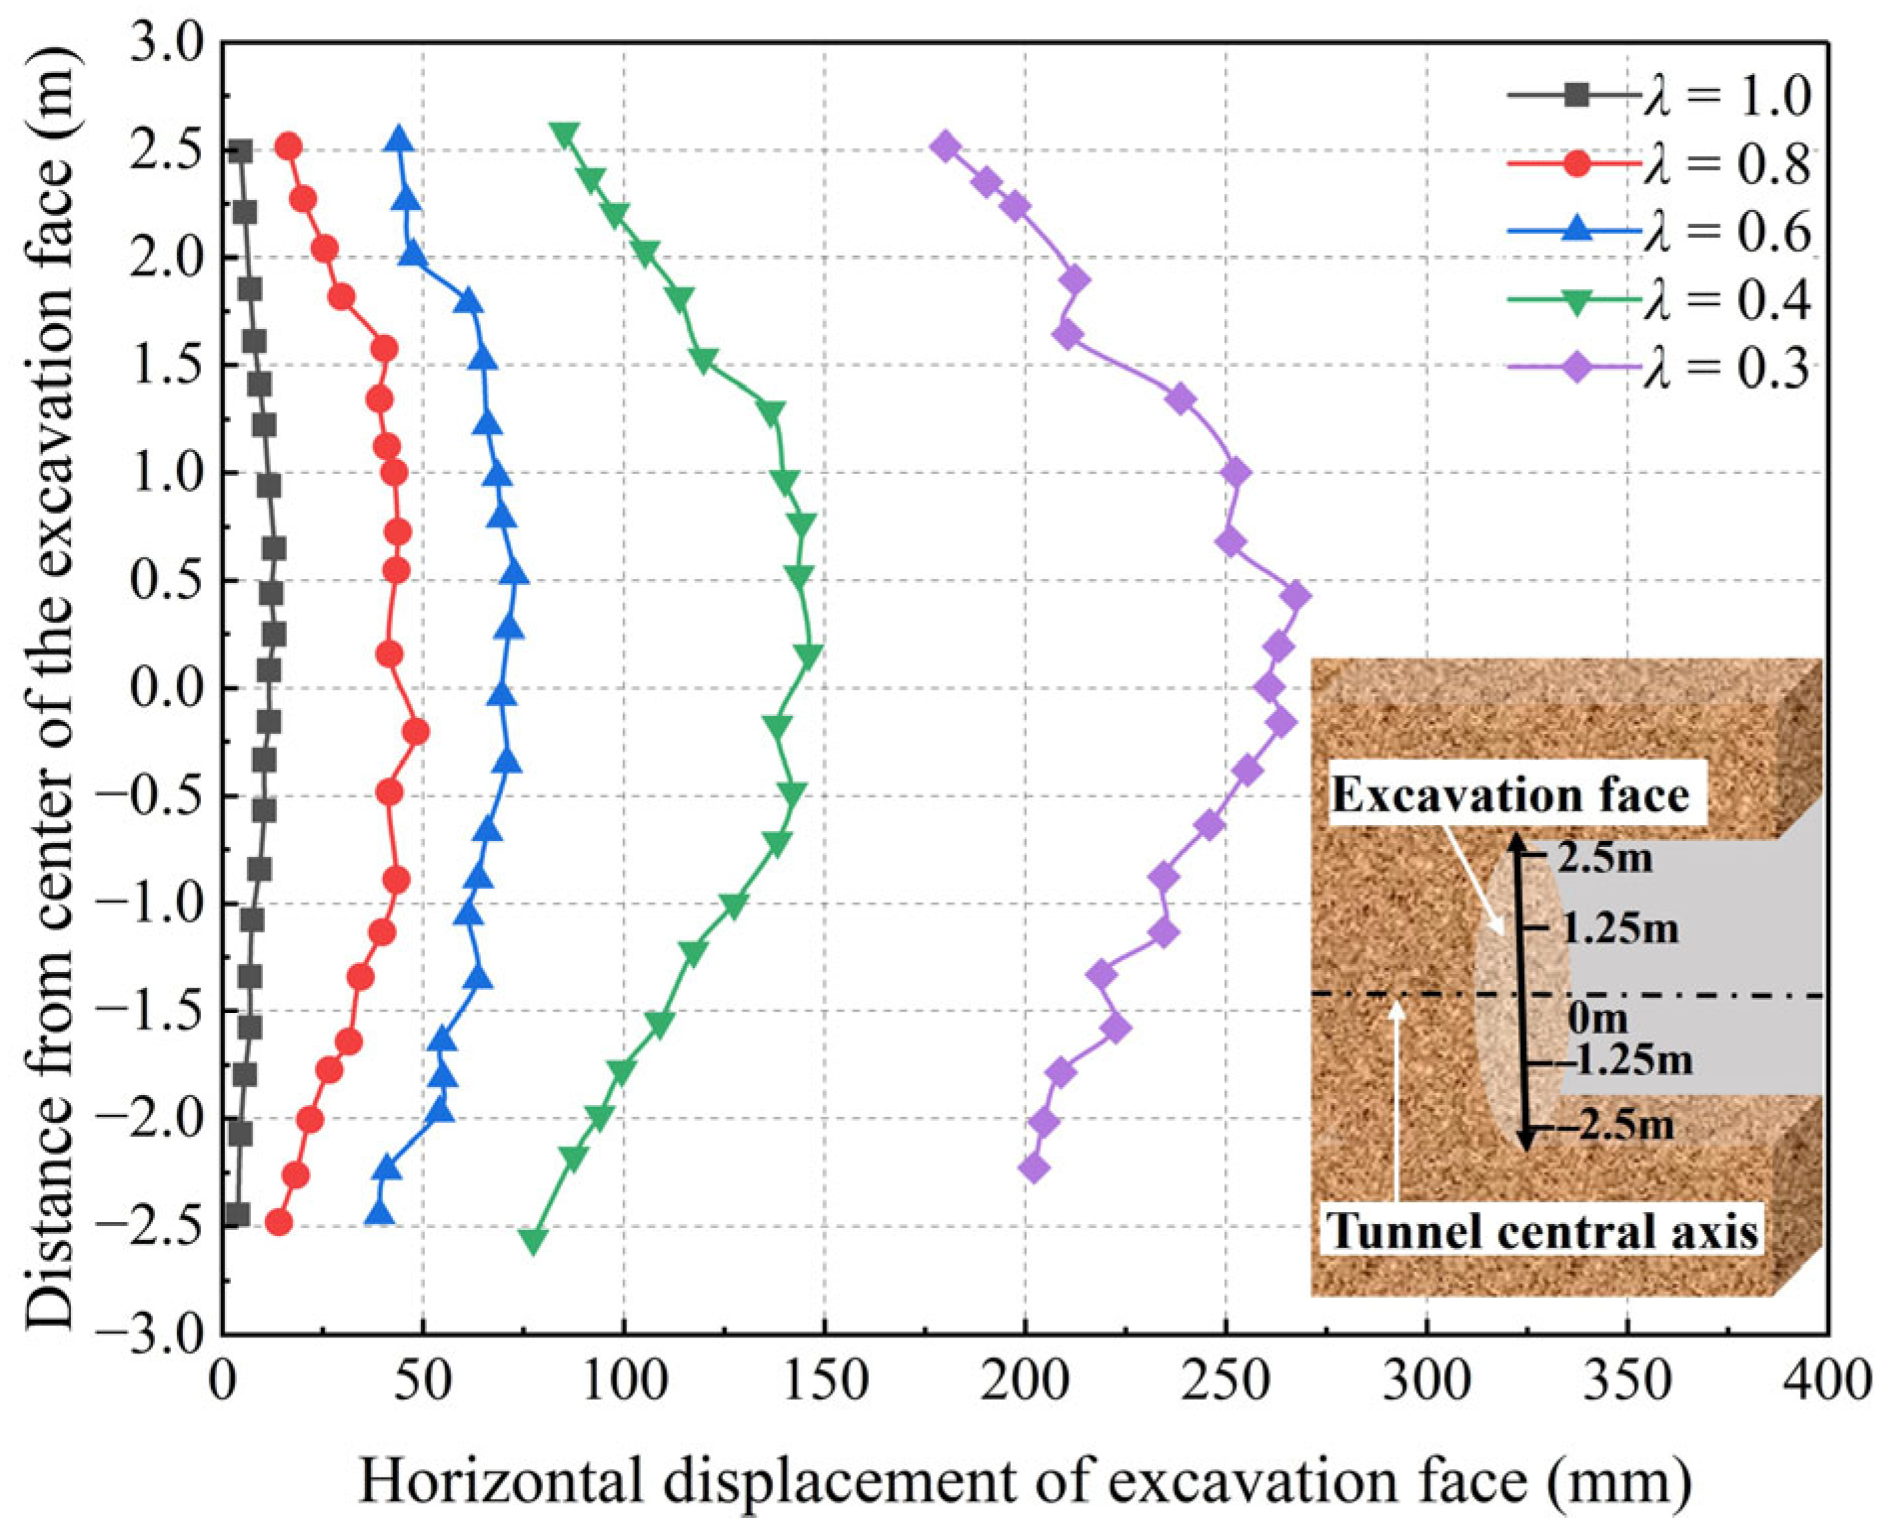
This analysis investigates the effect of the chamber earth pressure ratio (λ) on the stability of the excavation face, considering ratios of 1.0, 0.8, 0.6, 0.4, and 0.3 while keeping other factors constant. Figure 6 illustrates the change curves for the horizontal displacement of the excavation face corresponding to these different pressure ratios. At a chamber earth pressure ratio of 1.0, the horizontal displacement of the excavation surface is measured at 12.9 mm. As the chamber earth pressure ratio decreases, the displacement increases markedly, indicating a decline in the stability of the excavation surface. When the chamber earth pressure ratio reaches a lower limit, the displacement of the excavation surface can soar to 267.3 mm. This demonstrates that variations in the chamber earth pressure ratio significantly affect the horizontal displacement of the excavation surface. Consequently, the chamber earth pressure ratio is crucial for maintaining the stability of the shield excavation face.
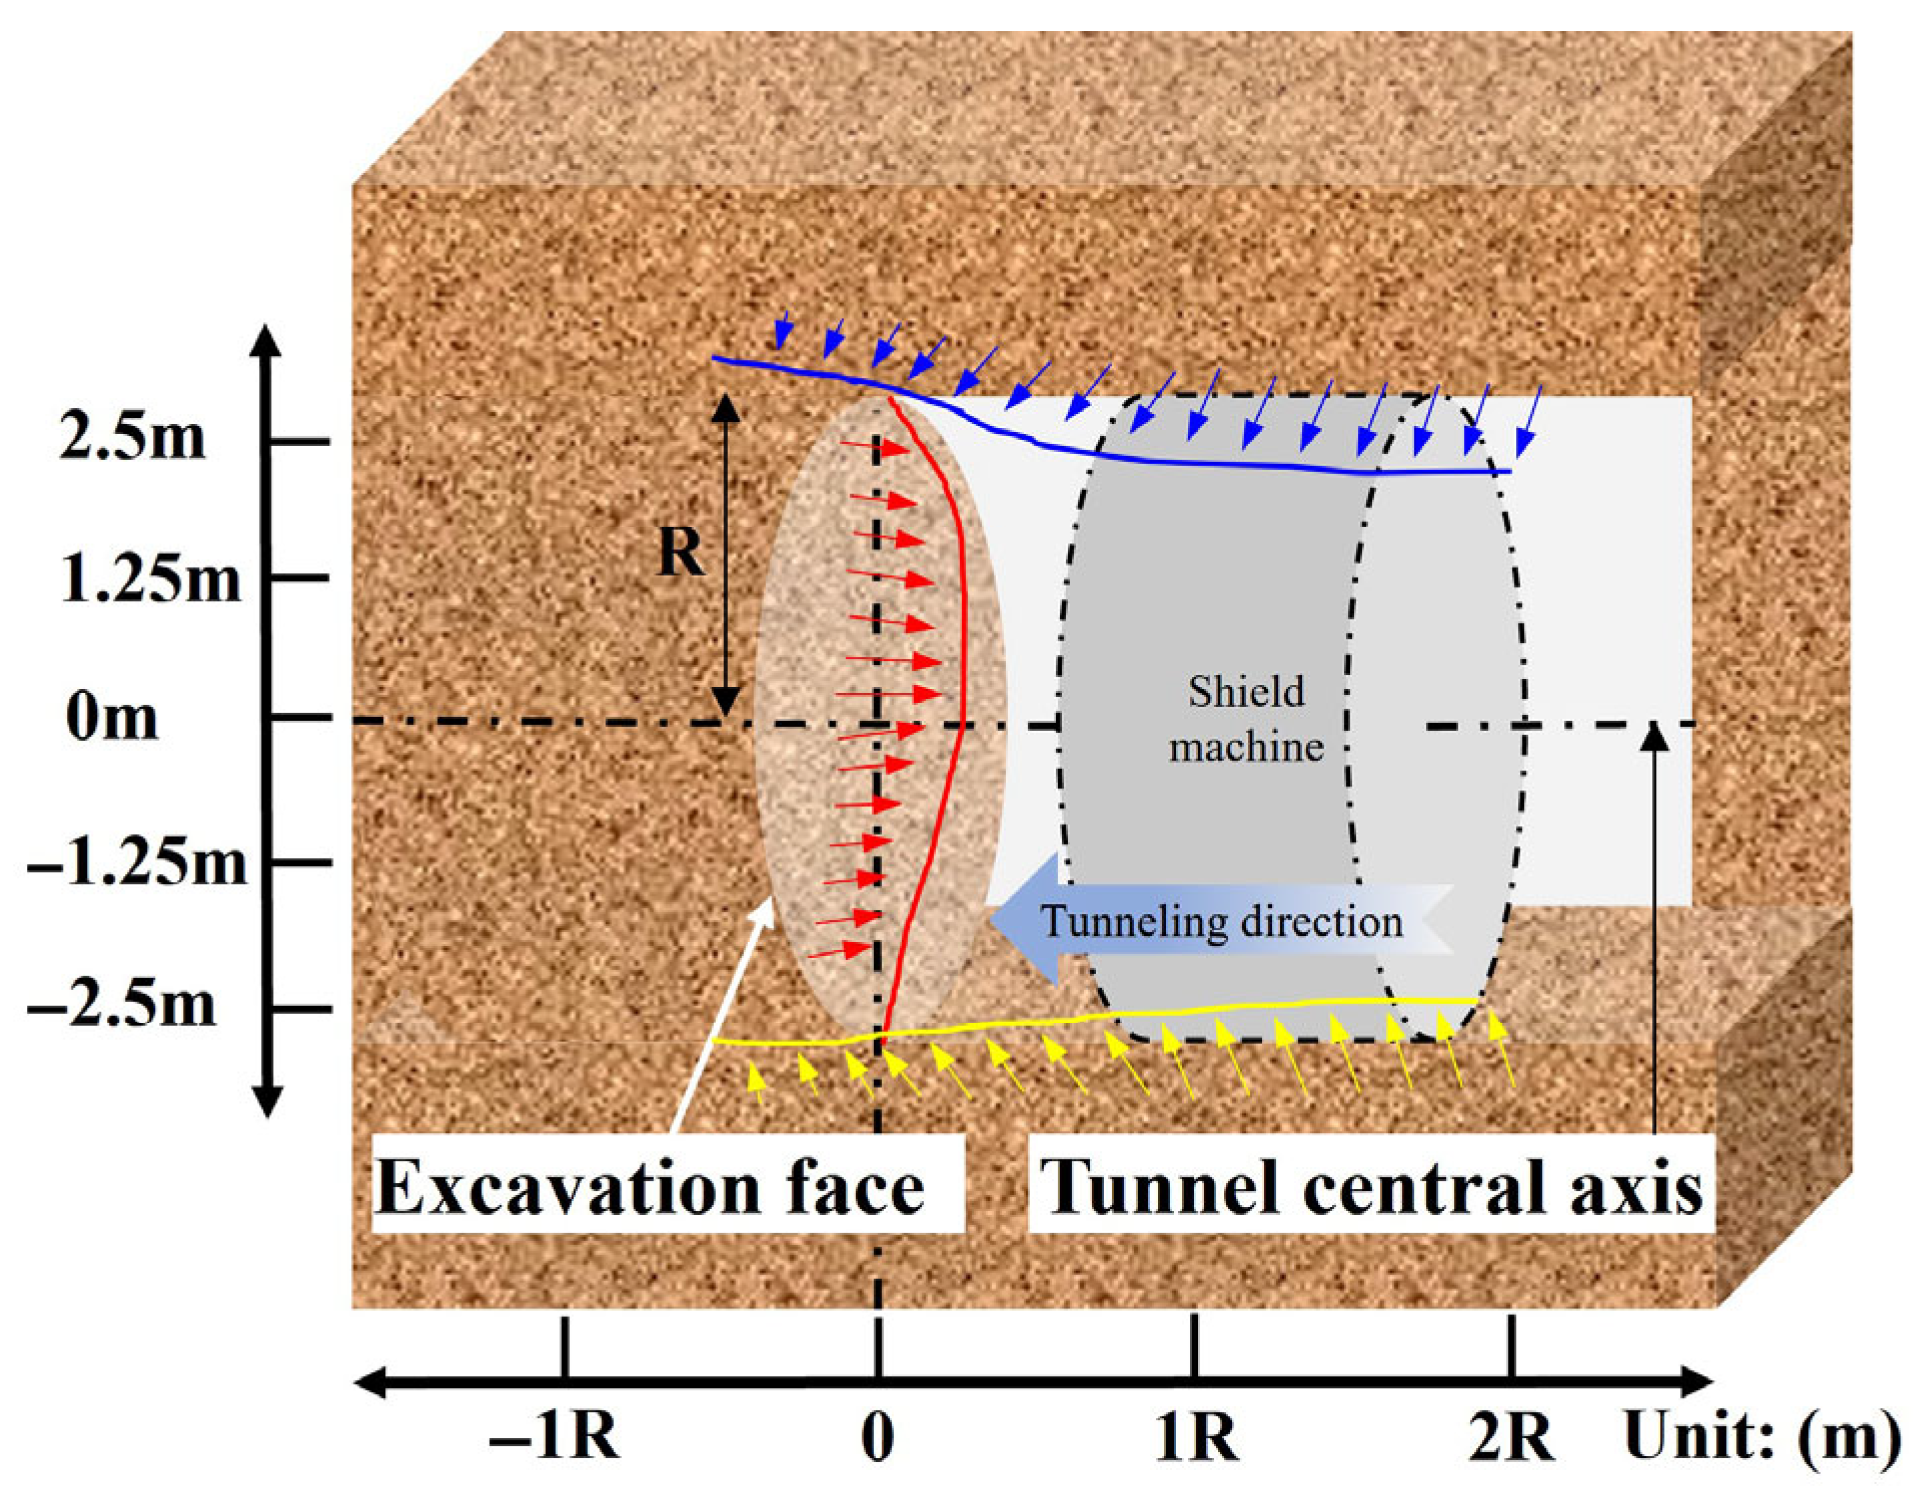
The failure modes of shield tunnels typically manifest as longitudinal cracks and localized bulging in the soil at the excavation face surface, and in severe cases, lead to a sudden increase in shield machine thrust resistance or even machine jamming. Subsidence cracks appear on the ground surface above the excavation face, while soil inside the tunnel collapses in a “quicksand-like” manner, accompanied by the inflow of water–sand mixtures into the tunnel. A schematic diagram of the deformation around the excavation face and surrounding area is shown in Figure 7.
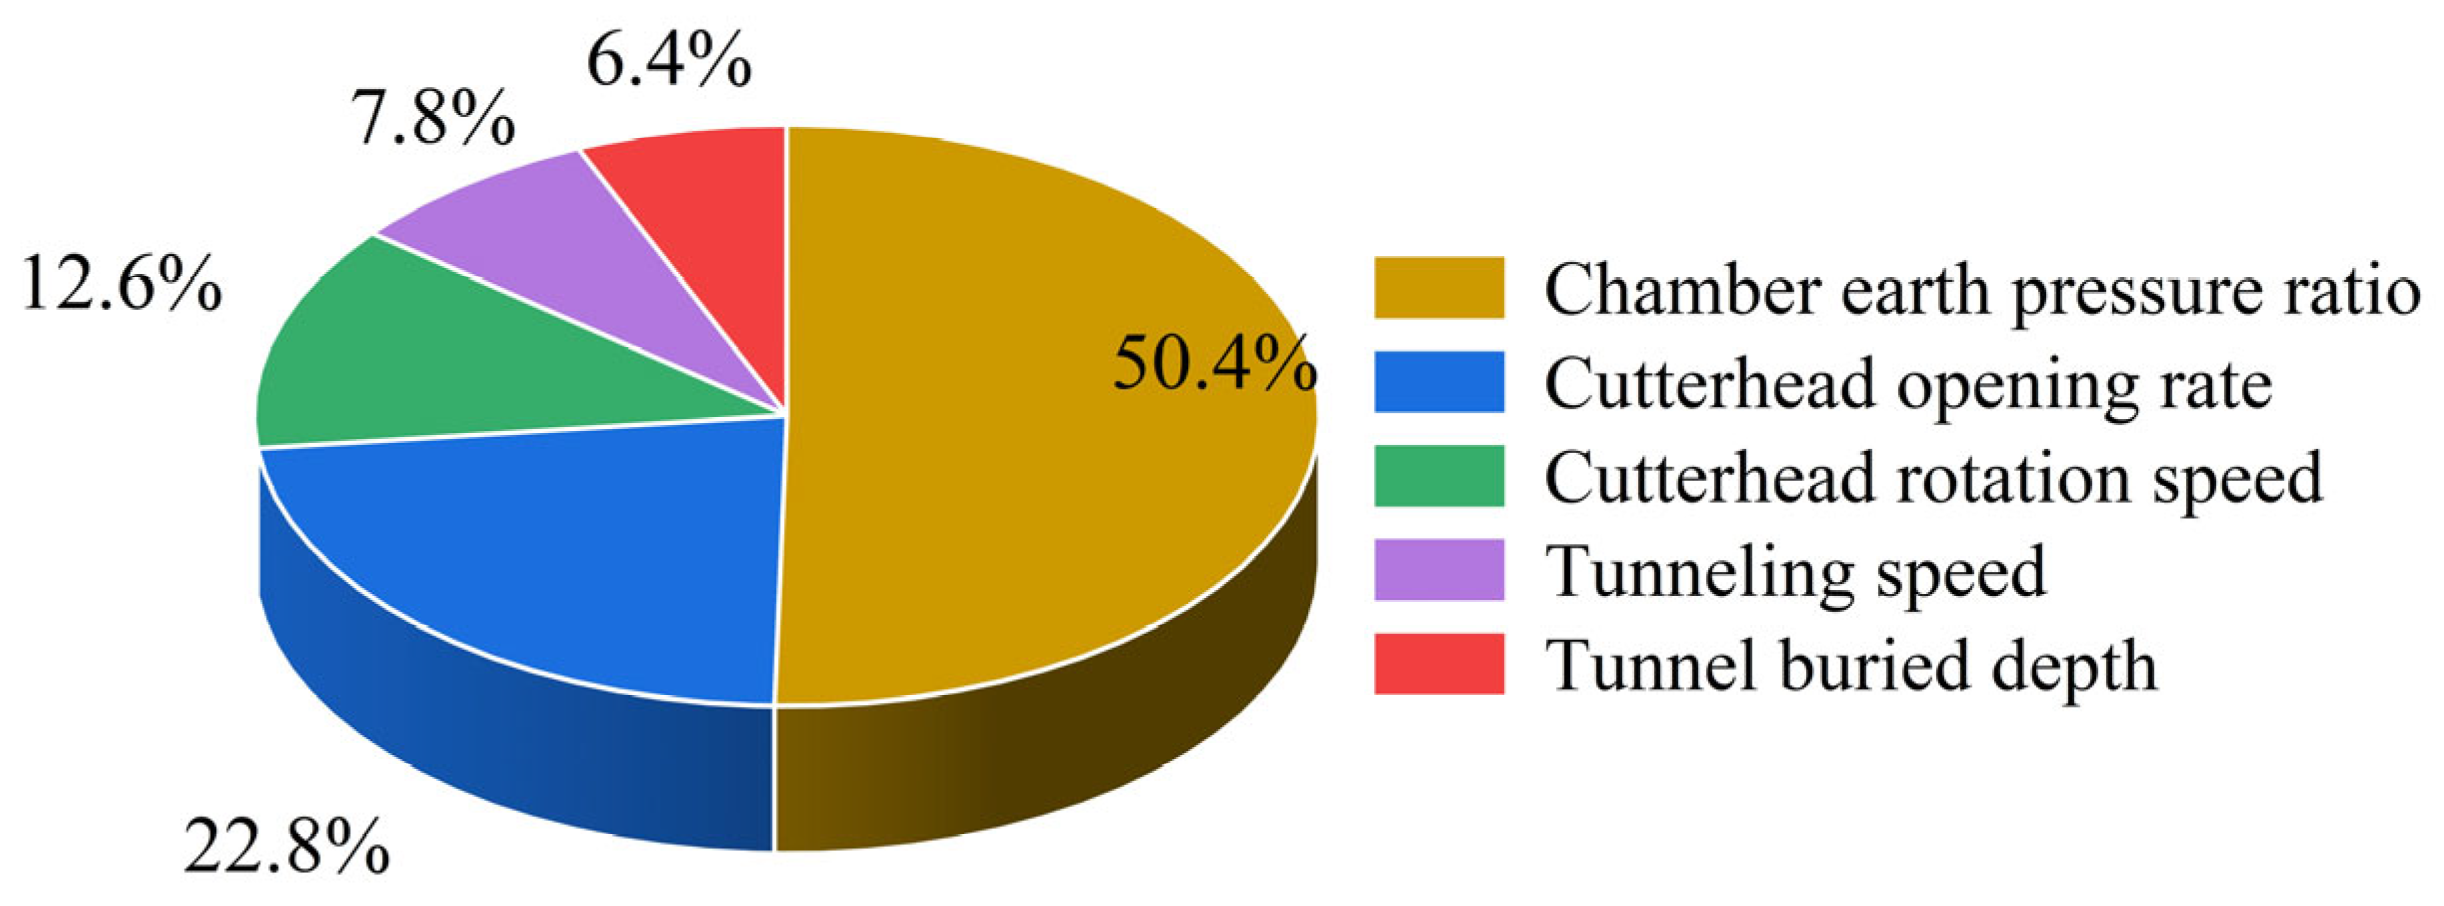
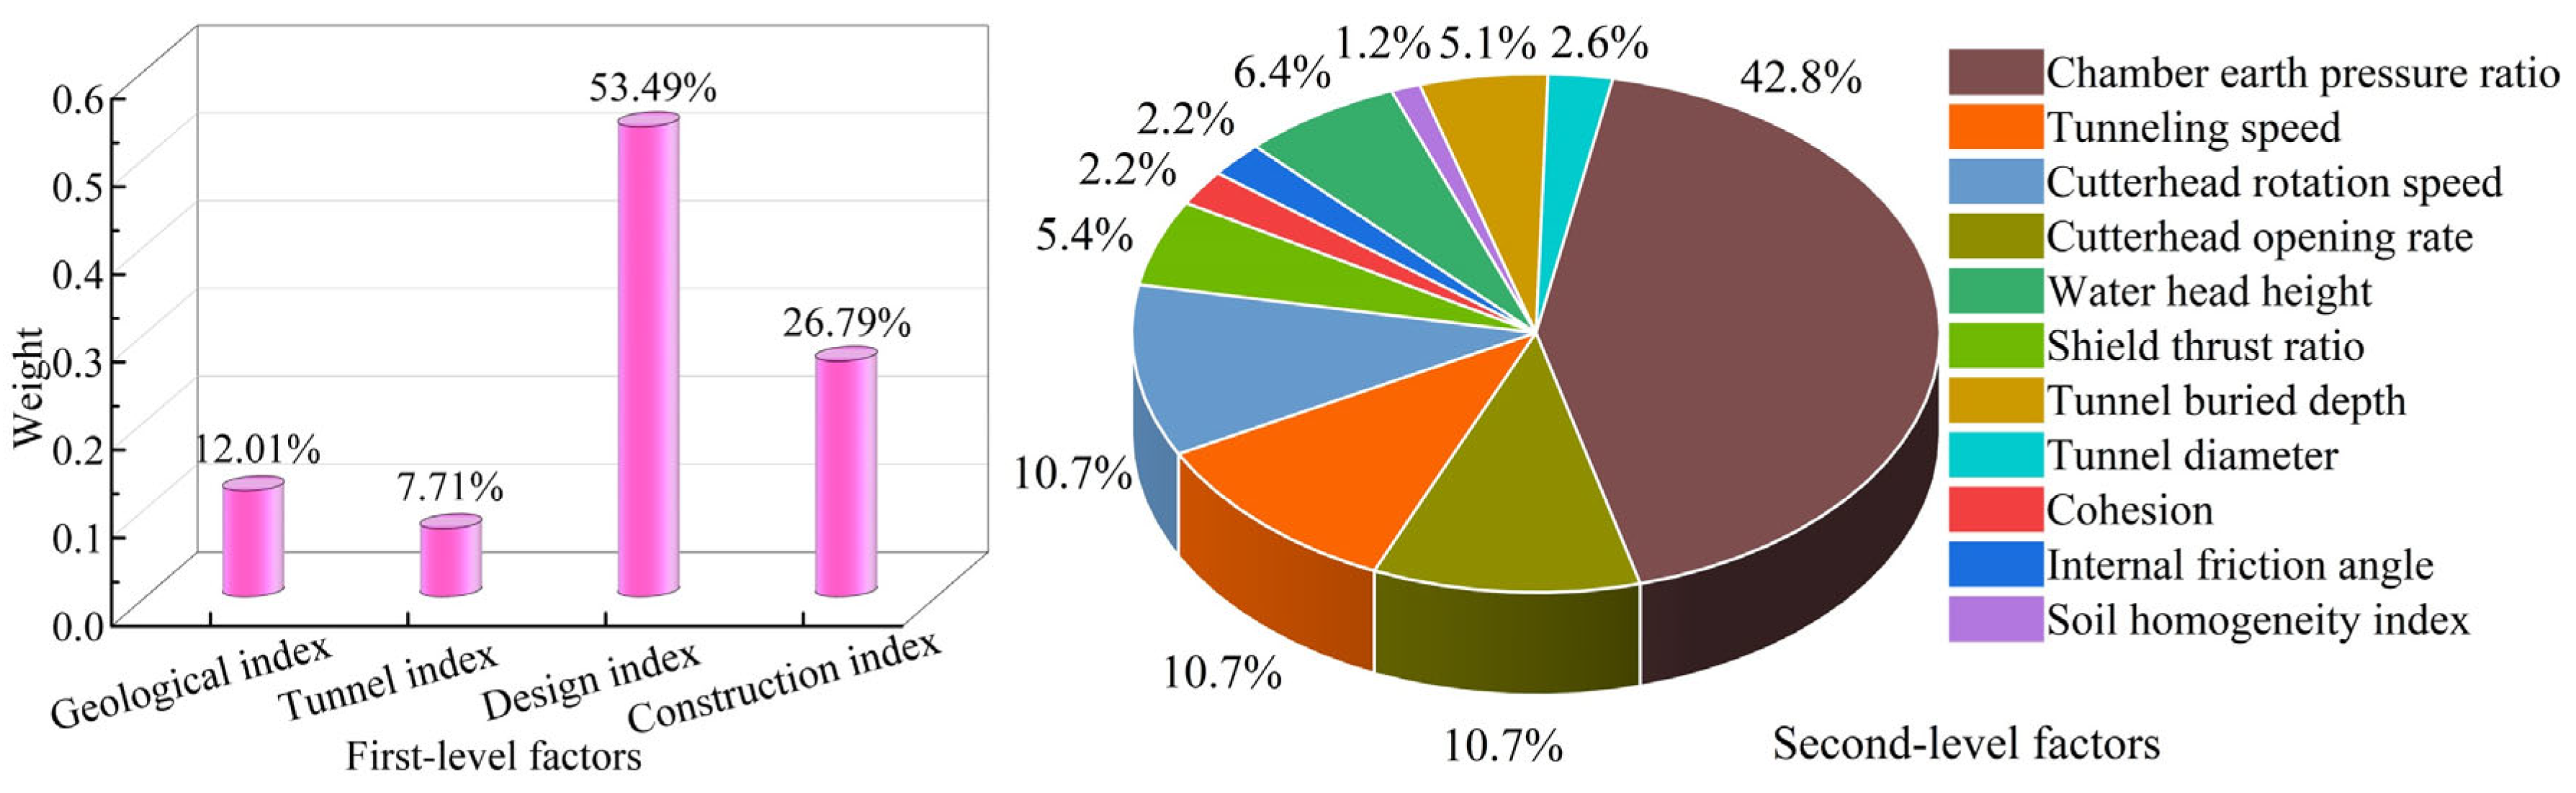
In summary, as parameters such as tunneling speed, cutterhead opening rate, tunnel burial depth, and cutterhead rotation speed increase, the horizontal displacement of the excavation face rises correspondingly. Conversely, a decrease in the chamber earth pressure ratio leads to a significant increase in the horizontal displacement of the excavation surface. λ < 0.5 triggers a sudden displacement spike. When the cutterhead opening ratio exceeds 55%, failure of the muck support system causes a sharp increase in horizontal displacement. At cutterhead rotation speeds above 3 rpm, the formation disturbance effect induces rapid growth of horizontal displacement. When the advance rate surpasses 30 mm/min, delayed support response results in uniform augmentation of horizontal displacement. For tunnel burial depths exceeding 200 m, the amplification effect of high geostress and water pressure leads to gradual enlargement of horizontal displacement. The proportional contributions of different parameters to displacement are illustrated in Figure 8, while Table 4 ranks the influence degrees of various factors.
The tunnel burial depth, cutterhead opening rate, cutterhead rotation speed, tunneling speed, and chamber earth pressure ratio are all critical factors affecting the stability of the shield tunnel excavation face. Current risk assessment models for shield tunnel excavation face stability tend to place greater emphasis on geological conditions and shallow tunnel scenarios, while underestimating the impact of excavation parameters. This oversight presents certain limitations. To address these issues, this study proposes a weighted index risk assessment method that holistically considers geological, design, tunnel, and construction factors, thereby enhancing the accuracy of risk evaluations.

3. A Risk Assessment Method for Excavation Face Instability in Shield Tunnels Based on Displacement Response Characteristics

3.1. Methods for Determining Influencing Factors and Their Weights

To illustrate the impact of shield tunneling parameters on the stability of the excavation face in tunnels, a risk assessment index system of shield tunnel stability considering geological conditions, tunnel characteristics, design parameters, and construction parameters should be constructed on the basis of existing research. This study focuses on establishing a clear and reproducible weighting system. All judgment matrices in the investigation passed consistency checks, indicating that decision-makers can provide unambiguous preference information. Incorporating fuzzy sets or probability distributions (for example, entropy-based methods, fuzzy AHP, Monte Carlo AHP, or dynamic Bayesian models) may increase model complexity. Given that the prevailing data exhibits high certainty, such extensions yield limited impacts on outcomes. According to recent research by domestic and international scholars [43,44,45,46,47], these methods have been extensively applied to assess diverse disaster risks in tunnels, demonstrating that classical AHP has been widely validated and implemented in tunnel risk assessment. Consequently, the risk assessment value R is established as the focal point, while the geological index, tunnel index, design index, and construction index are identified as primary factors. Additionally, 11 secondary factors significantly affecting the stability of the shield tunnel excavation face are selected. A nine-level scale method is employed to assess the relative importance and sensitivity of each index within the evaluation framework. Through the construction of a judgment matrix, the weight of each index is determined, and the score for each factor is assessed. Subsequently, the risk index for each factor is calculated and weighted before being summed, then multiplied by the disaster loss coefficient. This process culminates in the establishment of a risk assessment model based on the weighted index method. A higher evaluation score indicates a greater relative risk level. The evaluation model for the weighted index method is illustrated in Figure 9; the specific approach for determining weights is outlined as follows.
(1)
Construct judgment matrix
When establishing the weights among the various factors at all levels, it is assumed that A k represents the k -th factor in first-level factor and B K 1 , , B K n represents the secondary factor in k -th factor in first-level factor. From the perspective of A k , the importance of the factor to the element A k is determined by comparing the factors between B K 1 , , B K n , in which the element a i j in the judgment matrix, the value assigned to factor a k i , reflects its importance in relation to factor a k j .
(2)
Factor weight calculation
The eigenvector associated with the largest eigenvalue (λmax) of the judgment matrix is referred to as W after normalization. The elements of W represent the weights of relative importance for factors at the same level with respect to factors at the higher level. The calculation process is as follows.
Compute the product of the elements in each row of the judgment matrix M i :
M i = j = 1 n a i j ( i = 1 , 2 , , n )
Compute the n-th root W i of M i .
W = ( W 1 , W 2 , , W n ) T
Among them, W i = M i 1 n ( i = 1 , 2 , , n ) .
The vector W = ( W 1 , W 2 , , W n ) T is normalized to obtain the desired eigenvector ω = ( ω 1 , ω 2 , , ω n ) T , where ω i = W i / j = 1 n W i ( i = 1 , 2 , , n ) .
(3)
Consistency check
The largest characteristic root, referred to as λ m a x , of the judgment matrix is determined according to Equation (3).
λ max = 1 n i = 1 n ( A W ) i W i
In the equation, ( A W ) i represents the i -th element of vector A W . The consistency ratio (CR) of the judgment matrix is then calculated as follows:
C R = λ m a x n ( n 1 ) R I
In Equation (4), RI represents the random consistency index of the judgment matrix, and the value is shown in Table 5. When the consistency test index CR ≤ 0.1, it is assumed that the constructed judgment matrix meets the consistency test; if not, the element values of the matrix must be adjusted until an optimal level of consistency is achieved.

3.2. Determination of Factor Weight Calculation and Scoring Criteria at Each Level

3.2.1. Weight Calculation of First-Level Factors

Following the calculation procedure outlined above, the weight calculation for the primary factors was performed. The judgment matrix for the elements of the primary factors is presented in Equation (5). After normalization, the weight vector ω = 0.1201 0.0771 0.5349 0.2679 of the elements was obtained. The largest eigenvalue of the judgment matrix is denoted as λ m a x = 4.114 , with R I = 0.89 , C I = 0.038 , and C R = 0.043 < 0.1 indicating that the constructed judgment matrix for the primary factors passed the consistency test. The weight ranking of the indices within the primary factors is as follows: ω 3 > ω 4 > ω 1 > ω 2 . This finding indicates that, when compared to variations in the physical properties of both the soil and the tunnel structure, inadequate design and inappropriate selection of construction parameters exert a greater influence on the stability of tunnel excavation face.
A = 1 2 1 / 4 1 / 3 1 / 2 1 1 / 5 1 / 4 4 5 1 3 3 4 1 / 3 1

3.2.2. Weight Calculation of Secondary Factors

(a)
Geological index
The geological index accounts for 12.01% of the primary factors and is primarily composed of four influencing factors: cohesion, internal friction angle, water head height, and soil homogeneity index. The element judgment matrix B 1 for the secondary factors in the construction of the geological index is shown in Equation (6). After normalization, the weight vector ω 1 = 0.1854 0.1854 0.5321 0.0791 of each element in the geological index is obtained. The largest eigenvalue of the judgment matrix is denoted as λ m a x = 4.004 , R I = 0.89 , C I = 0.001 , and C R = 0.001 < 0.1 , satisfying the consistency condition.
B 1 = 1 1 2 1 / 3 1 1 2 1 / 3 1 / 2 1 / 2 1 1 / 5 3 3 5 1
The factors affecting cohesion and the internal friction angle each contribute 18.54%. The internal friction angle of the soil positively influences the stability of the excavation face, with higher angles of internal friction further increasing stability. The water head height is calculated to the center of the shield tunnel and represents the largest proportion, accounting for 53.21%. The soil homogeneity index has the smallest proportion, at 9.71%. Cohesion and the internal friction angle are both crucial components of the geological index. However, the impact of water head height on the stability of the excavation face surpasses that of the other three factors. The soil homogeneity index is the least significant factor.
  • (b) Tunnel index
The tunnel index represents 7.71% of the primary influencing factors and is primarily influenced by two main parameters: the burial depth of the tunnel and its diameter. The element judgment matrix B 2 for the secondary factors within the tunnel index is provided in Equation (7). After normalization, the weight vector of the secondary factors is ω 2 = 0.6667 0.3333 , and the largest eigenvalue of the judgment matrix is denoted as λ m a x = 2 , with R I = 0 , C I = 0 , and C R = 0 < 0.1 , thereby meeting the consistency condition.
B 2 = 1 2 1 / 2 1
The factors influencing tunnel burial depth contribute 66.67% to the overall assessment. Under consistent conditions, a deeper tunnel leads to an increase in soil pressure at the excavation face, heightening the risk of instability in that area. Conversely, the impact of tunnel diameter accounts for 33.33%. As the diameter of the tunnel increases, the disturbance to the surrounding rock and soil during shield construction expands, further elevating the risk of excavation face instability. Thus, tunnel diameter negatively affects the stability of the excavation face. In terms of tunnel stability, the effect of burial depth is more significant than that of the diameter.
  • (c) Design index
The design index accounts for 53.49% of the primary influencing factors and is primarily determined by two key factors: the chamber earth pressure ratio and the cutterhead opening ratio. The element judgment matrix B 3 for the secondary factors within the design index is presented in Equation (8). After normalization, the weight vector of the secondary factors is ω 3 = 0.8 0.2 , and the largest eigenvalue of the judgment matrix is denoted as λ m a x = 2 , with R I = 0 , C I = 0 , and C R = 0 < 0.1 , thereby satisfying the consistency condition.
B 3 = 1 4 1 / 4 1
The chamber earth pressure ratio is a significant influence factor, accounting for 80% of the overall impact. This ratio is defined as the actual earth pressure in the chamber compared to the designed earth pressure. To ensure the stability of the excavation face during the design phase, the actual earth pressure must exceed the designed value, meaning the ratio should be greater than 1. Meanwhile, the cutterhead opening rate contributes 20% to the overall influence. When examining the effect of the cutterhead opening rate alone, it is observed that the horizontal displacement of the excavation face increases as the opening rate rises within a certain range. Therefore, there is a negative correlation between the cutterhead opening rate and the stability of the excavation face. An excessively high opening rate heightens the risk of instability. Overall, the chamber earth pressure ratio has a more pronounced effect on the stability of the excavation face than the cutterhead opening rate.
  • (d) Construction index
Inadequate adjustments of construction parameters can negatively impact the stability of tunnel excavation face. Construction index accounts for 26.79% of the primary influencing factors and is mainly composed of three key parameters: tunneling speed, cutterhead rotation speed, and the shield thrust ratio (the ratio of actual shield thrust to the designed shield thrust). The element judgment matrix B 4 for the secondary factors within the construction index is shown in Equation (9). After normalization, the weight vector of the secondary factors in the tunnel index is ω 4 = 0.4 0.4 0.2 , and the maximum eigenvalue of the judgment matrix is λ m a x = 3 , with R I = 0.058 , C I = 0 , and   C R = 0 < 0.1 , satisfying the consistency condition.
B 4 = 1 1 2 1 1 2 1 / 2 1 / 2 1
From a construction perspective, the tunneling speed factor constitutes 40% of the overall impact, negatively influencing the stability of the excavation face. As the tunneling speed increases, the disturbance caused by the shield system to the surrounding rock becomes more pronounced, thereby compromising the stability of the excavation face. Similarly, the cutterhead rotation speed also contributes 40% to this impact. If the cutterhead rotation speed is set too high, it not only accelerates tool wear but also diminishes the stability of the excavation surface. Finally, the shield thrust ratio factor accounts for 20%. If the thrust is too large, the tool wear will be aggravated, the shield attitude will be out of control, the segment will be damaged or the fault will be caused, and the ground disturbance will be too large.
In summary, Figure 10 illustrates the weight distribution of each influencing factor. The factors, ranked from highest to lowest in terms of their respective weights, are as follows: ω 31 > ω 41 = ω 42 = ω 32 > ω 13 > ω 43 > ω 21 > ω 22 > ω 11 = ω 12 > ω 14 . Consequently, the influence of each risk factor on the stability of the excavation face is ranked from highest to lowest as follows: chamber earth pressure ratio > tunneling speed = cutterhead rotation speed = cutterhead opening rate > water head height > shield thrust ratio > tunnel buried depth > tunnel diameter > cohesion = internal friction angle > soil homogeneity index.

3.2.3. Influencing Factors Score Table

A scoring system based on a scale of 100 is employed, whereby each factor is graded out of a maximum of 100 points. A higher score signifies a more significant negative effect on the stability of the excavation face. A portion of the secondary factors score table is presented in Table 6, and the soil uniformity index score is listed separately.
In this context, soil uniformity refers to the consistency index of the soil within the excavation section of the shield tunnel. Poor uniformity of soil will lead to uneven force of the shield machine, difficult operation, and shield attitude deviation, which will aggravate the disturbance to the surrounding strata. At the same time, this will cause over-excavation of the soft strata, which will increase the risk of excavation surface instability. The score of the soil homogeneity index is shown in Table 7.
Integrated with the BIM-IoT monitoring system (10 Hz sampling frequency) of the Hanjiang-to-Weihe River Diversion Project, a four-tier dynamic scoring model based on real-time monitoring is established: (1) Data layer: Continuously collects 11 critical indicators including chamber earth pressure. (2) Warning layer: Implements threshold-based alerts (for example, triggers yellow warning when chamber earth pressure ratio < 0.9) and employs LSTM neural networks to predict trend variations over the subsequent 12 h. (3) Scoring layer: Dynamically updates AHP judgment matrices using a sliding time window (covering data from six tunneling rings). For instance, when chamber earth pressure ratio < 0.5 persists for 3 consecutive hours, the indicator score automatically elevates from 80 to 95 points, concurrently adjusting its design weight from 42% to 48%. (4) Decision layer: Generates adaptive construction recommendations (for example, increasing chamber earth pressure ratio or reducing cutterhead rotation speed) and pushes them to the on-site PLC control systems.

3.3. Classification of Disaster Loss Coefficient and Risk Levels

The disaster loss coefficient Ci represents the degree of loss that may be caused by the instability of the excavation face. The results of the accident are divided into five grades according to the severity, namely mild, moderate, severe, significant, and catastrophic. Each grade is assigned to facilitate quantitative evaluation. The degree of loss should take into account the importance of the project, the impact on the surrounding environment of the project, and the difficulty of rescue and repair after the accident. The level and coefficient of disaster loss after the occurrence of risk are shown in Table 8.
Firstly, the relative risk index is determined by the score and weight of the influencing factors, and then multiplied by the disaster loss coefficient to obtain the relative risk assessment value. The risk level of tunnel excavation face instability is divided into I to V according to the relative risk assessment value, as shown in Table 9. In the actual construction process, the evaluation method can be used to dynamically evaluate the risk of excavation surface instability by setting the parameter values of different factors, which is of great significance to ensure the safety of shield tunnel construction.

4. Application and Validation of the Weighted Index Risk Assessment Method

4.1. Project Overview

The ‘Hanjiang-to-Weihe River Water Diversion Project’ is part of the ‘South-to-North Water Diversion’ initiative located in Shaanxi Province. It ranks among the 150 key water conservancy projects highlighted during the ‘14th Five-Year Plan’ period. Upon its completion, the project is expected to benefit a population of approximately 14.11 million people. The second phase traverses the Qinling Mountains, often referred to as the ‘National Geological Museum’. This region presents significant challenges for construction due to its intricate geological conditions, including substantial burial depths and adverse geological features. The tunnel’s entrance is situated on the east bank of the Chanhe River, adjacent to the three villages in Shicun Village, Mingdu Town, and Chang’an District, while the exit is positioned on the west bank of the Bahe River, to the north of Baling Village in the Baqiao District. Within the tunnel, five curved sections are incorporated, with the remainder of the alignment being straight. The location of the project and the distribution of geological conditions are shown in Figure 11.
Bailuyuan tunnel is the key project of the south main line. The tunnel extends for 9388 m, with 1980 m of Grade IV surrounding rock, which constitutes 21.09% of the overall length. In contrast, Grade V surrounding rock spans 7408 m, making up 78.91% of the total. The tunnel features a burial depth of 270–300 m, with an excavation diameter of 5.38 m and segment diameter of 5.1 m. The water table is situated 120–200 m above the tunnel crown. Joint orientations parallel the tunnel axis with shallow dip angles (<20°). Stratigraphy primarily comprises the following: Quaternary Holocene landslide-accumulated loess-like soils; Upper Pleistocene aeolian loess-like soils; Middle and Lower Pleistocene aeolian–fluvial loess-like soils. The tunnel traverses extensive siltstone–sandstone interbedded formations with localized conglomerate sections, where siltstone/sandstone content reaches 78.91%. This constitutes challenging soft siltstone–sandstone geology. The interbedded siltstone–sandstone exhibits swelling properties—expanding upon water absorption and disintegrating when dehydrated.
The ‘Earth Pressure Balance and Shield TBM’ dual-mode shield machine is used in tunnel shield construction. The whole machine is about 173.5 m long and the total weight is about 500 tons. The entrance is constructed using the shield method, while the exit employs conventional construction techniques. A branch tunnel has been incorporated into the middle section to facilitate shield maintenance and ensure adequate ventilation [49]. Taking into account the geological conditions, the initial excavation section of the shield measures 4055 m in length. After reaching the intersection of the main and branch tunnels for equipment maintenance, the construction of the second excavation section of 3745 m is carried out, and then the shield machine is removed from the exit. The sensors used in field monitoring include a fiber grating sensor, displacement convergence meter, soil chamber earth pressure sensor, water level meter, and thermometer.

4.2. Application of Weighted Index Risk Assessment Methodology

Using the risk assessment method proposed above, the risk assessment of the ST91+390~ST91+620 section of the Bailuyuan tunnel is carried out. According to the previous factor score table, the scores of influencing factors at all levels of the Bailuyuan tunnel are determined as shown in Table 10.
The calculation process takes the geological index as an example, and the calculation score is
S 1 = i = 1 4 S 1 i · ω 1 i = 10 × 18.54 % + 45 × 18.54 % + 80 × 53.21 % + 30 × 9.71 % = 55.678
Similarly, the score values of tunnel index, design index, and construction index are calculated in turn, S 2 = 45 ,   S 3 = 51 ,   S 4 = 46 . The decomposition of the weighted risk score is shown in Figure 12.
The Bailuyuan tunnel passes through the Qinling Mountains, mainly through the sparsely populated and inaccessible area. It is under the complex geological conditions of high water pressure and high buried depth. In the event of an accident, rescue is difficult to implement in time. Considering all factors, the disaster loss coefficient value of the Bailuyuan tunnel is set to 4. The validation metrics for risk score and weight matrix consistency are aggregated in Table 11. Finally, the risk assessment value of the excavation face of the Bailuyuan tunnel under normal excavation state is as follows.
R = i = 1 4 W · C 4 199
The cohesion parameter reflects the bonding strength between soil particles. Lower values indicate looser soil, increasing the risk of excavation face instability and collapse. With a measured cohesion of 65 kPa for this project, the cohesion factor scored 10 points. The internal friction angle represents the soil’s shear resistance. Insufficient angles reduce soil self-stability. The sandy mudstone exhibits an internal friction angle of approximately 25°, indicating moderate slip resistance. Consequently, thrust control during tunneling is necessary to prevent ground displacement, yielding a 45-point score for this parameter. Water head height reflects groundwater pressure. As the Bailuyuan tunnel traverses water-rich strata (for example, Weihe alluvial layers) with a water head of 200 m, this factor scored 80 points. Given the sandy mudstone formation in this project (refer to Table 3), the homogeneity index scored 30 points. Historical incidents in Xi’an metro construction—where heterogeneous strata caused shield machine jamming—highlight the relevance of this metric. Scores were cross-referenced with Table 2.
Tunnel buried depth ranges from 270 to 300 m. Increased depth elevates ground stress, posing risks of rockburst or significant deformation. Classified as moderate depth, this parameter scored 60 points. With a shield diameter of 5.38 m (categorized as large-scale), excavation face area and soil disturbance increase substantially. Higher machine weight and thrust requirements complicate settlement control, resulting in a 15-point score.
Chamber earth pressure equilibrium is critical; improper control may cause face instability or surface settlement. Limited data availability for pressure ratio led to a provisional score of 50 points. Cutterhead opening ratios below optimal may cause muck clogging, while excessive ratios reduce pressure maintenance capability. For the sandy mudstone formation with a 55% opening ratio, this factor scored 55 points.
Advance rate was controlled at 30 mm/min. Excess speed risks pressure imbalance, whereas slower rates prolong surrounding rock exposure, warranting a 50-point score. A cutterhead rotation speed of 1.5 rpm was maintained. Hard rock formations typically require higher speeds; low rotation exacerbates tool wear and may cause cutterhead stagnation, justifying a 40-point score.
Thrust imbalance—insufficient force halting progress or excessive force fracturing strata—was avoided. Integrated analysis with cutterhead torque and advance rate confirmed no operational issues, resulting in a thrust ratio score of 50 points. Contribution scores for each factor are illustrated in Figure 13.
The risk assessment level of excavation face instability of the Bailuyuan tunnel is Grade two, and the risk degree is slight risk, which is completely within the controllable range. Among them, the chamber earth pressure ratio, tunneling speed, cutterhead rotation speed, and water head height are the main risk sources of excavation face instability. It is suggested that simple reinforcement measures can be made while adjusting the tunneling parameters to meet the disposal requirements of the instability risk of tunnel excavation face. Firstly, the tunneling parameters need to be optimized by ensuring that the chamber earth pressure ratio exceeds 1, maintaining the tunneling speed at or below 30 mm/min, and keeping the cutterhead rotation speed under 1.5 rpm. Secondly, given that the groundwater level is 200 m above the top of the cave, it is essential to monitor the associated risks and implement protective measures to prevent the infiltration of external water. Therefore, synchronous grouting anti-seepage reinforcement should be carried out in shield construction, and the reinforcement range should be 0.15 m from the edge of the structure to the outside. After the reinforcement is completed, the reinforcement site is tested, and the unqualified area is supplemented by grouting again. At the same time, the monitoring frequency of the tunnel excavation surface and its effects on the surrounding environment are consistently upheld. In the simulation of the mitigation measures proposed in this study, using the original shield tunneling parameters, the numerical simulation of the horizontal displacement of the excavation surface is about 167 mm, and after the adoption of the mitigation measures proposed in the paper, the numerical simulation of the horizontal displacement of the excavation surface is about 32.4 mm, which is a reduction in the displacement value of about 80.6%, and this shows that the displacement control effect is significant. Therefore, the effectiveness of the mitigation measures is proved. The comparison of numerical simulation displacements under different factors before and after mitigation measures is shown in Figure 14. The research flow chart is shown in Figure 15.

4.3. Validation of Risk Assessment Methods

The ‘R = P × C’ evaluation method in reference [50] is to calculate the weight of each layer of factors, define the probability of risk occurrence and the probability of loss, create a risk level probability combination table, and then assign the probability of each risk source in the factor layer, set the risk level index, and finally obtain the result through the weight relationship between the factors. When employing this method to assess the risk of instability at the excavation face of the Bailuyuan tunnel, it is essential to adjust the influencing factors in accordance with the literature, due to modifications in the evaluation method and model. Therefore, five significant factors—namely, tunnel burial depth, tunneling speed, cutterhead rotation speed, cutterhead opening rate, and chamber earth pressure ratio—have been analyzed through numerical simulation and designated as secondary factors. In contrast, tunnel index, design index, and construction index are categorized as primary factors.
The probability assignment of the selected factors is consistent with the previous method. Through calculation, the risk assessment value R is located between the three-level risk range. It can be concluded that the risk assessment level for instability at the excavation face of the shield tunnel, as determined by this method, is rated at three, indicating a moderate level of risk. However, this assessment is higher than the results obtained using the weighted index method described in the previous article.
This study quantitatively classified risk levels through analysis of true positives (TP) and false positives (FP), constructing a confusion matrix and ROC curve. Based on prediction probabilities from 10 samples, the area under the curve (AUC) reached 0.8. As shown in Figure 16, the ROC curve’s close alignment with the upper-left corner demonstrates the model’s strong capability to discriminate between high- and low-risk conditions.
To mitigate the risk of instability accidents at the excavation face, a three-level risk assessment indicates that reinforcement measures are essential [49]. It is crucial to enhance these reinforcement strategies while also adjusting the tunneling parameters to address the instability risks associated with the tunnel excavation surface. The first is to adjust the tunneling parameters, adjust the chamber earth pressure ratio to be greater than 1, control the tunneling speed to be within 6.5 mm/min, and the cutterhead rotation speed is not greater than 1 rpm. Secondly, strengthen the protective measures of external water infiltration, and take measures such as advanced curtain grouting water stop and precipitation in front of the shield machine. Synchronous grouting reinforcement should be carried out in shield construction, and the reinforcement range is 0.3 m from the edge of the structure to the outside. At the same time, it is important to increase the monitoring frequency of the tunnel excavation surface and assess its effects on the surrounding environment.
In summary, the risk assessment results derived from the method proposed in this paper are classified as second-level, whereas the third-level risk assessment results are based on the approach outlined in the existing literature. However, taking into account the actual site conditions, the field application measures are depicted in Figure 17. For example, the shield machine can operate smoothly when appropriate reinforcement measures are implemented, effectively avoiding incidents of instability at the shield excavation surface and significant water leakage within the tunnel. Therefore, it is considered that the risk assessment result of the mileage shield tunnel is more suitable for the second level. The ‘R = P × C’ method is too conservative to set the risk level of the tunnel as three, which will lead to more waste of materials, manpower, and financial resources in taking measures to deal with risks during construction, and will also delay the construction progress. The factors selected in this risk assessment model are more comprehensive, the parameters are relatively easy to obtain, and the assessment process is relatively simple. Therefore, the risk assessment method of shield tunnel excavation face instability proposed in this paper has certain rationality and reliability.

5. Discussion

Given that tunnel collapse poses significant risks to lives and economic stability, this study employed discrete element modeling to investigate horizontal displacement responses at excavation faces under key influencing factors. The revealed displacement patterns informed an (AHP)-based risk assessment for the target project, enabling optimized construction protocols to enhance both safety and cost-efficiency in shield tunneling.

5.1. Comparative Analysis of Findings

While horizontal displacement patterns at the excavation face align with tunnel mechanics theory, parameter variations across different factors induce distinct displacement relationships. For example, increasing advancement speed yields relatively stable trends. Higher cutterhead opening ratios trigger sharp displacement increases. This divergence likely results from multi-factor coupling effects in complex geotechnical environments.
Our analysis identifies the chamber earth pressure ratio as the dominant influence, followed by cutterhead rotation speed, opening ratio, and advancement speed. This prioritization diverges from shallow-tunnel studies that emphasize construction factors (for example, grouting support) for face stability. It should be noted that such discrepancy is reconcilable: collapse mechanisms (for example, tunnel face failure) fundamentally involve energy-driven non-equilibrium evolution of rock masses, encompassing kinetic–potential energy conversion and frictional dissipation. In deep tunnels, elevated in situ stress and groundwater levels endow surrounding rock with substantial inherent energy, making intrinsic rock stability critical. Conversely, shallow-tunnel safety primarily relies on external support measures.

5.2. Factor Significance and Methodological Constraints

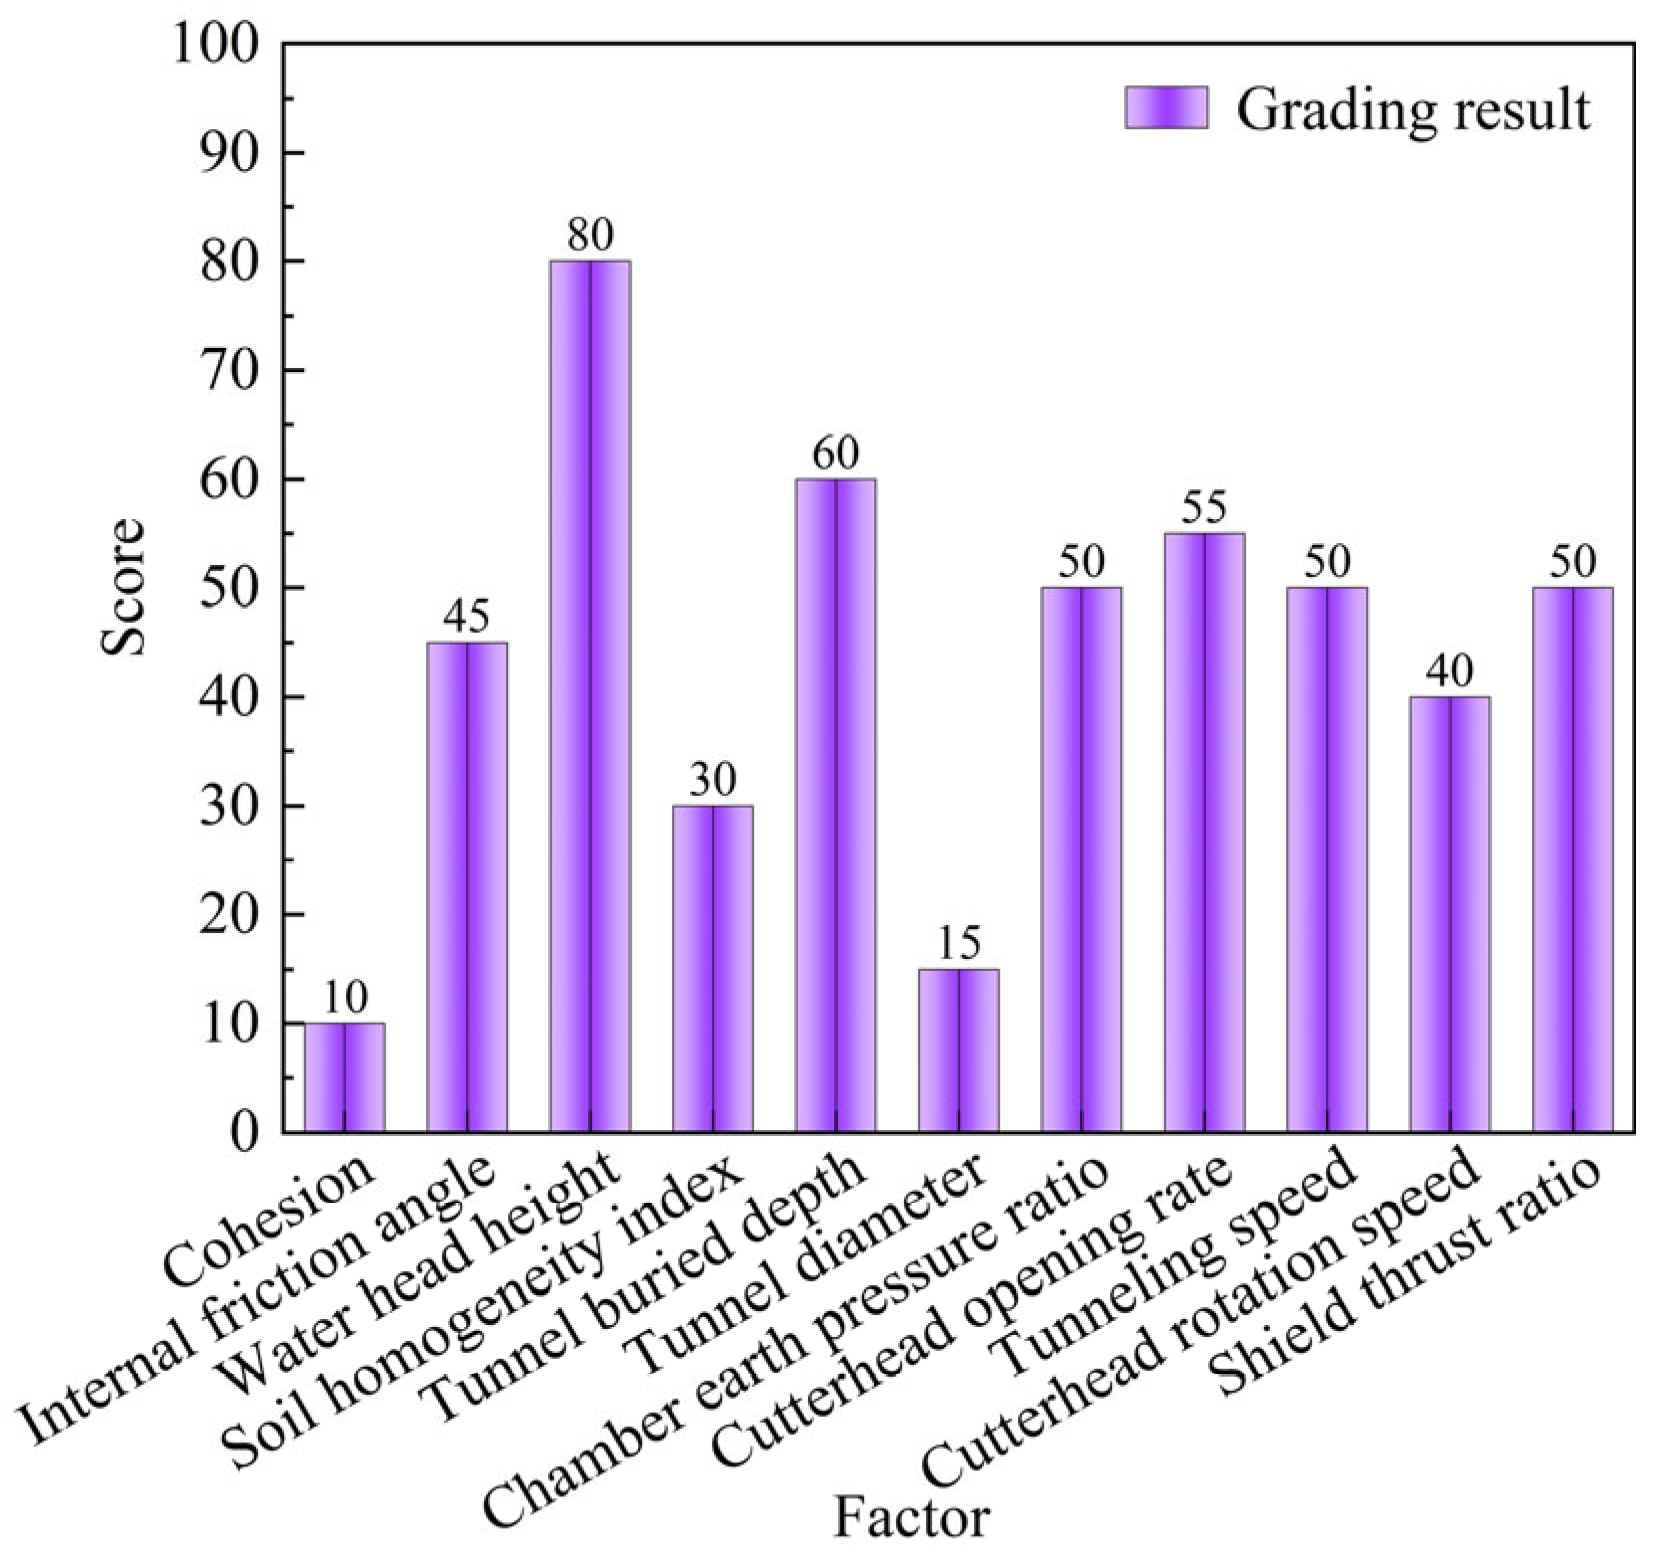
This study specifically analyzes factors including tunnel buried depth, cutterhead opening ratio, cutterhead rotation speed, advancement speed, and chamber earth pressure ratio. Combining the AHP method, weight calculations were conducted on 11 factors. As seen in Figure 5, the shield chamber earth pressure ratio is the most critical factor; chamber earth pressure directly affects the balance between excavation face support force and surface settlement, and its dynamic fluctuations can trigger chain instability risks. Following these, advancement speed, cutterhead rotation speed, and cutterhead opening rate hold secondary importance. Since these factors exhibit mutual synergistic effects, their significance differences are minor. Conversely, the tunnel buried depth factor has relatively low weight compared to the former. This is because tunnel buried depth undergoes rigorous investigation and design to finalize the construction scheme; thus, for tunnel buried depth alone, the probability of causing collapse accidents is small. Additionally, based on actual cases of excavation face collapse accidents during shield construction in recent years in Guangzhou, Nanjing, Foshan, and other locations, the majority are caused by improper control of chamber earth pressure balance. This indirectly reflects the reliability of our results.
The limitations of the numerical simulation method in this study are as follows: The finite element method has inherent defects in simulating granular materials, contact interactions, and collapse mechanisms. If used alone, it cannot fully meet the demands of engineering simulation. The limitations in collecting and organizing monitoring data during on-site construction are as follows: In the tunnel construction process, most monitoring points typically have monitoring devices deployed after excavation completion. This results in the inability to collect data promptly during excavation. In the AHP method, different experts may be influenced by personal subjectivity when scoring factors. A comparison between past models and the current research is shown in Table 12.

5.3. Future Research and Challenges

Although we have conducted risk prediction, numerous risks persist during actual construction. In addition to disturbances caused by construction to surrounding rock, on-site environmental conditions may also trigger engineering accidents. In deep-buried environments, the elastic strain energy stored in surrounding rock is released during excavation, potentially leading to sudden rockbursts that cause brittle failure of surrounding rock. Water pressure not only increases the loading on support structures but can also induce water inrush and sand gushing accidents under seepage forces. This necessitates identifying geological structures through advanced geological prediction and combining with solutions such as grouting for water sealing or high-pressure waterproof curtains. Therefore, future research could broaden risk factors and investigate the coupling of finite element and discrete element methods in numerical simulations while considering the impacts of different environments. This will enhance the reliability and universal applicability of engineering models. Future studies could also explore the integration of methods like fuzzy AHP and machine learning techniques, which may improve the accuracy and applicability of tunnel risk assessment.
The methodology in this study provides technical support for enhancing the intelligence level and decision-making efficiency of TBM construction, demonstrating potential for integration into existing industrial systems. The excavation face stability obtained through risk assessment can directly serve as key input data for the decision support module of TBM intelligent decision systems. By connecting the output of this study to decision systems in real-time via API interfaces or middleware, operators or automated decision modules can receive more precise and timely condition assessments and operational suggestions (for example, adjusting thrust force, cutterhead rotation speed, advancement speed, support grouting, etc.), thereby facilitating superior excavation efficiency and safety control. This approach can be designed as a relatively independent software module that easily embeds into existing TBM-integrated decision platforms through clearly defined input and output interfaces. Such integration can significantly improve the “perception–analysis–decision–execution” closed-loop capability of TBM construction, promoting tunnel engineering toward smarter, reduced-manning, efficient, and safer development.
In conclusion, this research provides foundational theoretical support for assessing excavation face stability in deep-buried shield tunnels, particularly regarding deformation patterns of horizontal displacement under different parameters and the optimization of mitigation measures during shield construction.

6. Conclusions

Through the risk assessment in advance, we can help prevent the occurrence of collapse accidents in the process of shield construction. Based on practical engineering, the three-dimensional DEM is used to study the displacement response characteristics of the excavation face position of the shield tunnel under different factors. The risk assessment index system integrating geological index, tunnel index, design index, and construction index is constructed, and the weighted index method is proposed. The risk assessment method has been applied and validated in evaluating the risk of excavation face instability in the Bailuyuan tunnel, leading to the following conclusions.
The tunnel buried depth, cutterhead opening rate, tunneling speed, cutterhead rotation speed, and chamber earth pressure ratio each exert varying degrees of influence on the deformation of the shield tunnel’s excavation surface. As the cutterhead opening rate rises, the displacement of the excavation surface initially increases gradually before accelerating significantly. In contrast, a reduction in the chamber earth pressure ratio results in a sharp increase in horizontal displacement. When considering the extent of their impact, the chamber earth pressure ratio has the most substantial effect on excavation face displacement, while the tunnel’s buried depth is the least influential factor. The weight proportion is approximately 42.8%, while the tunnel burial depth demonstrates limited impact on the horizontal displacement of the excavation face.
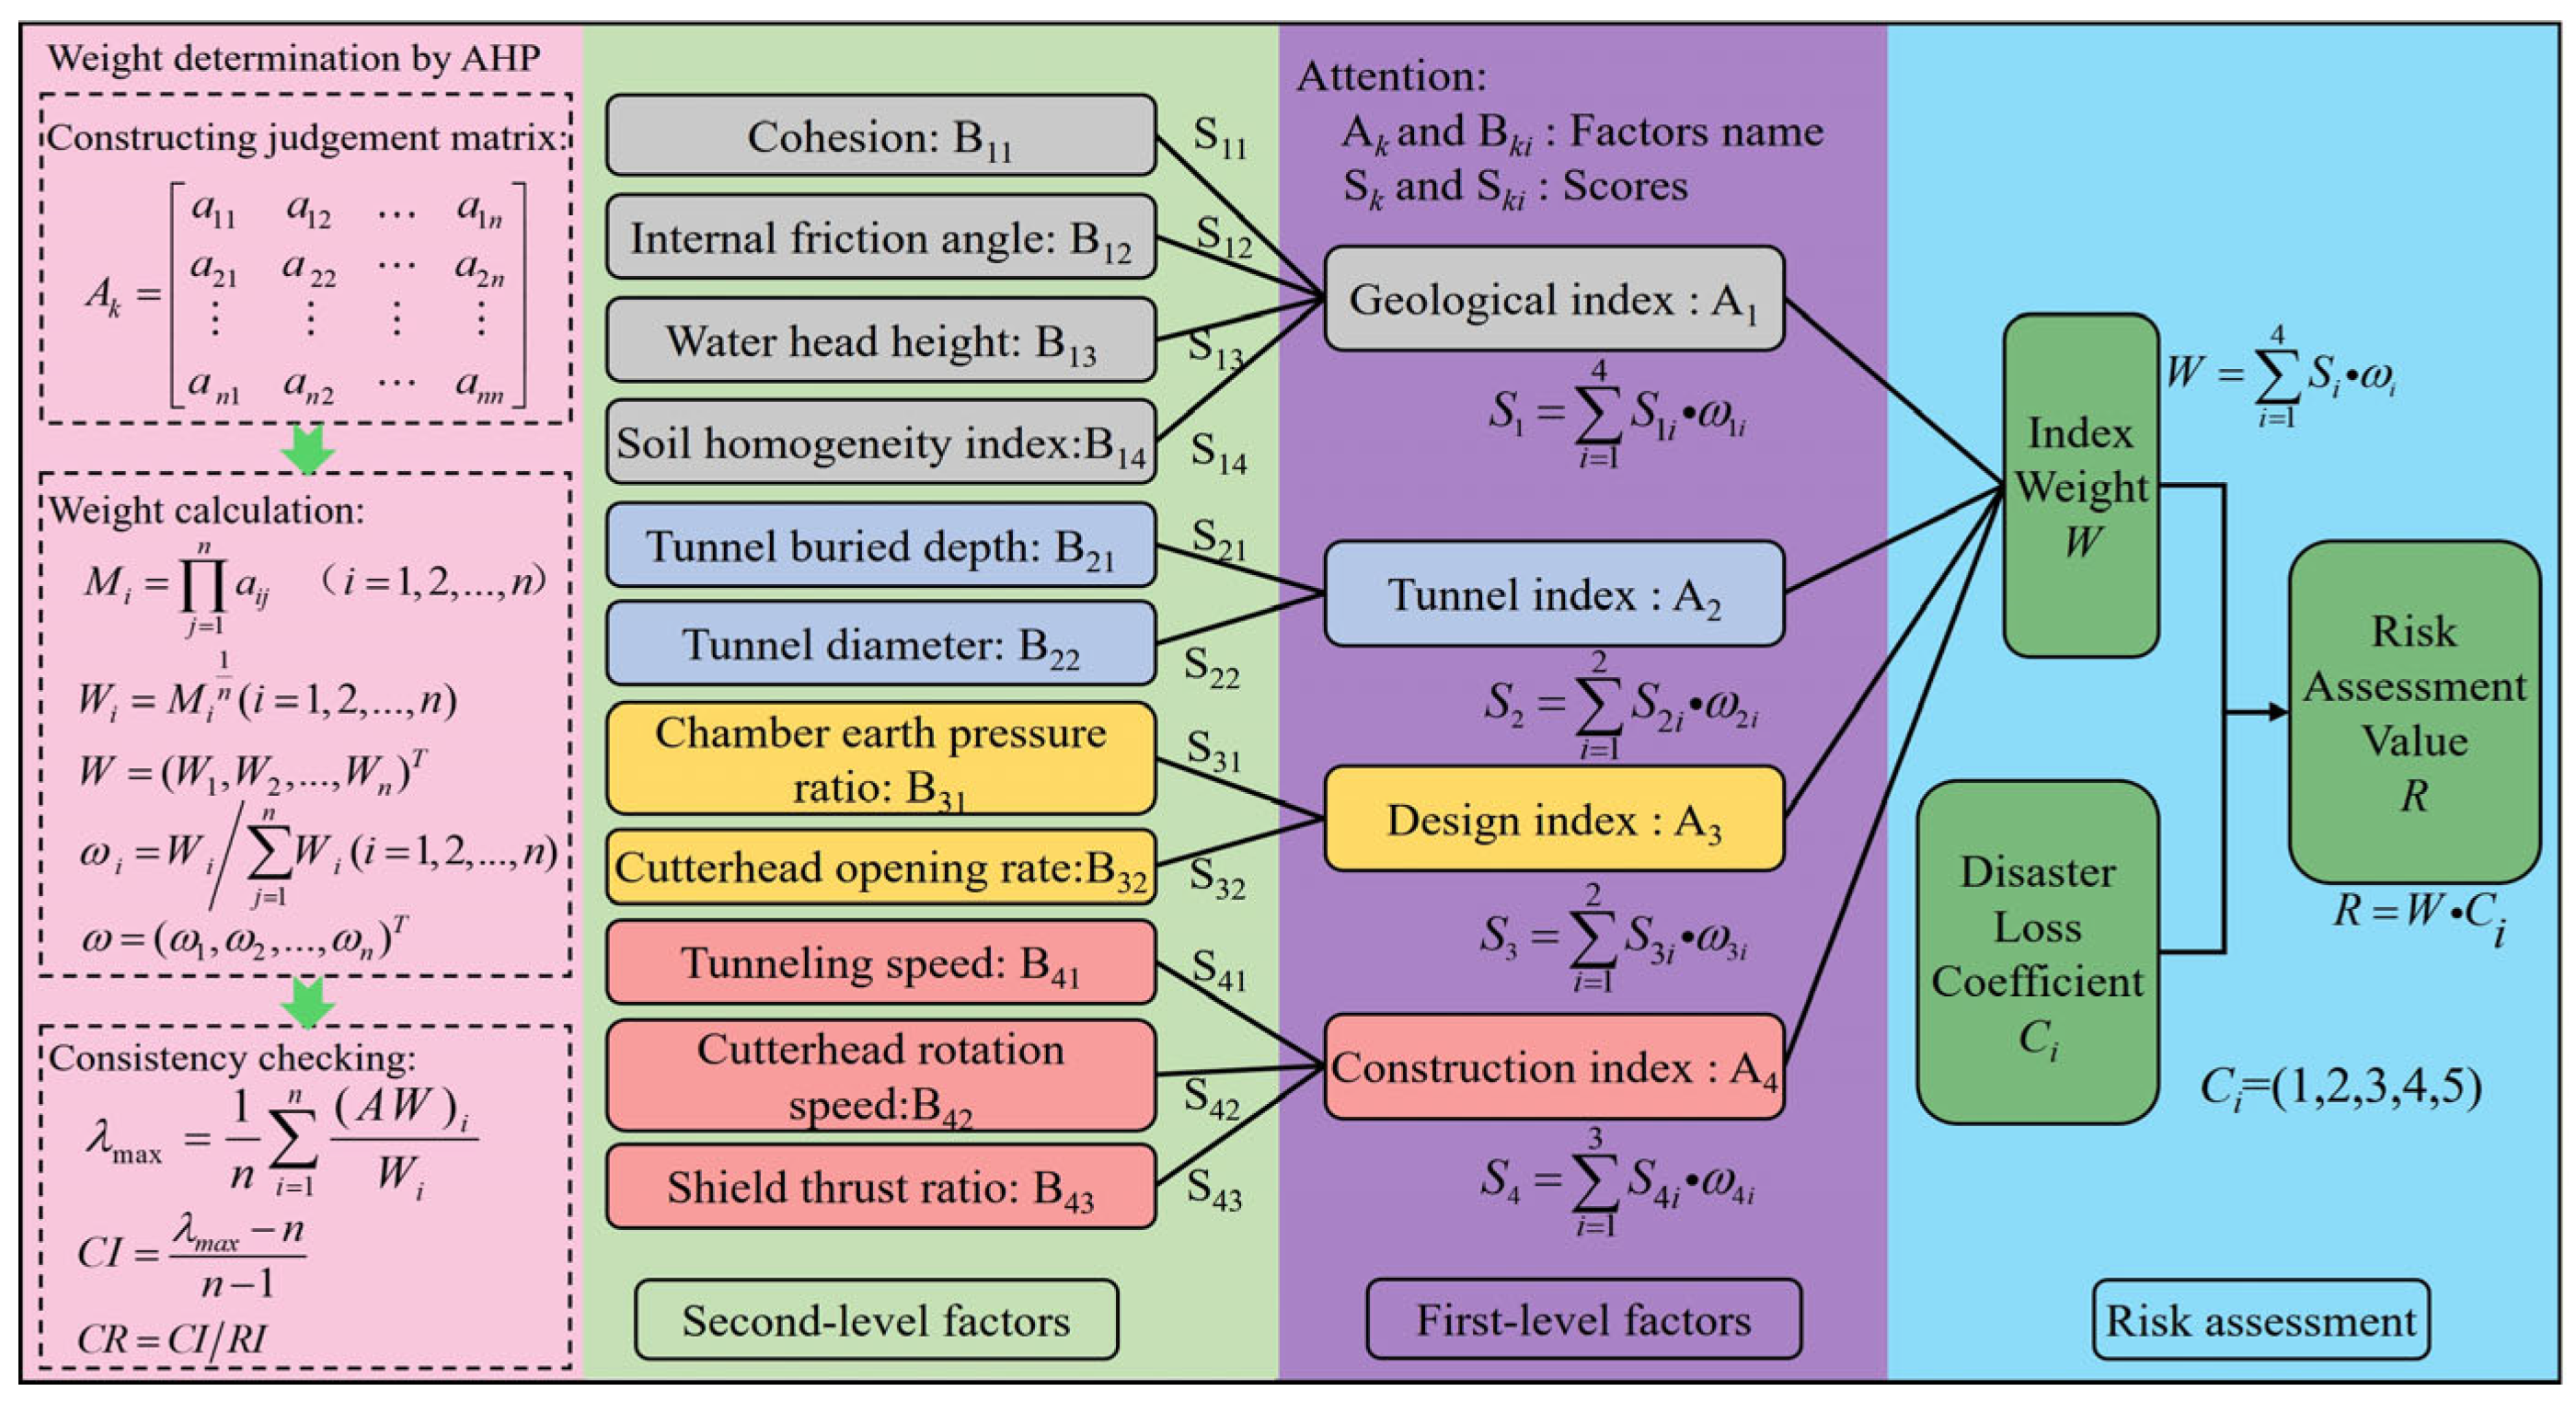
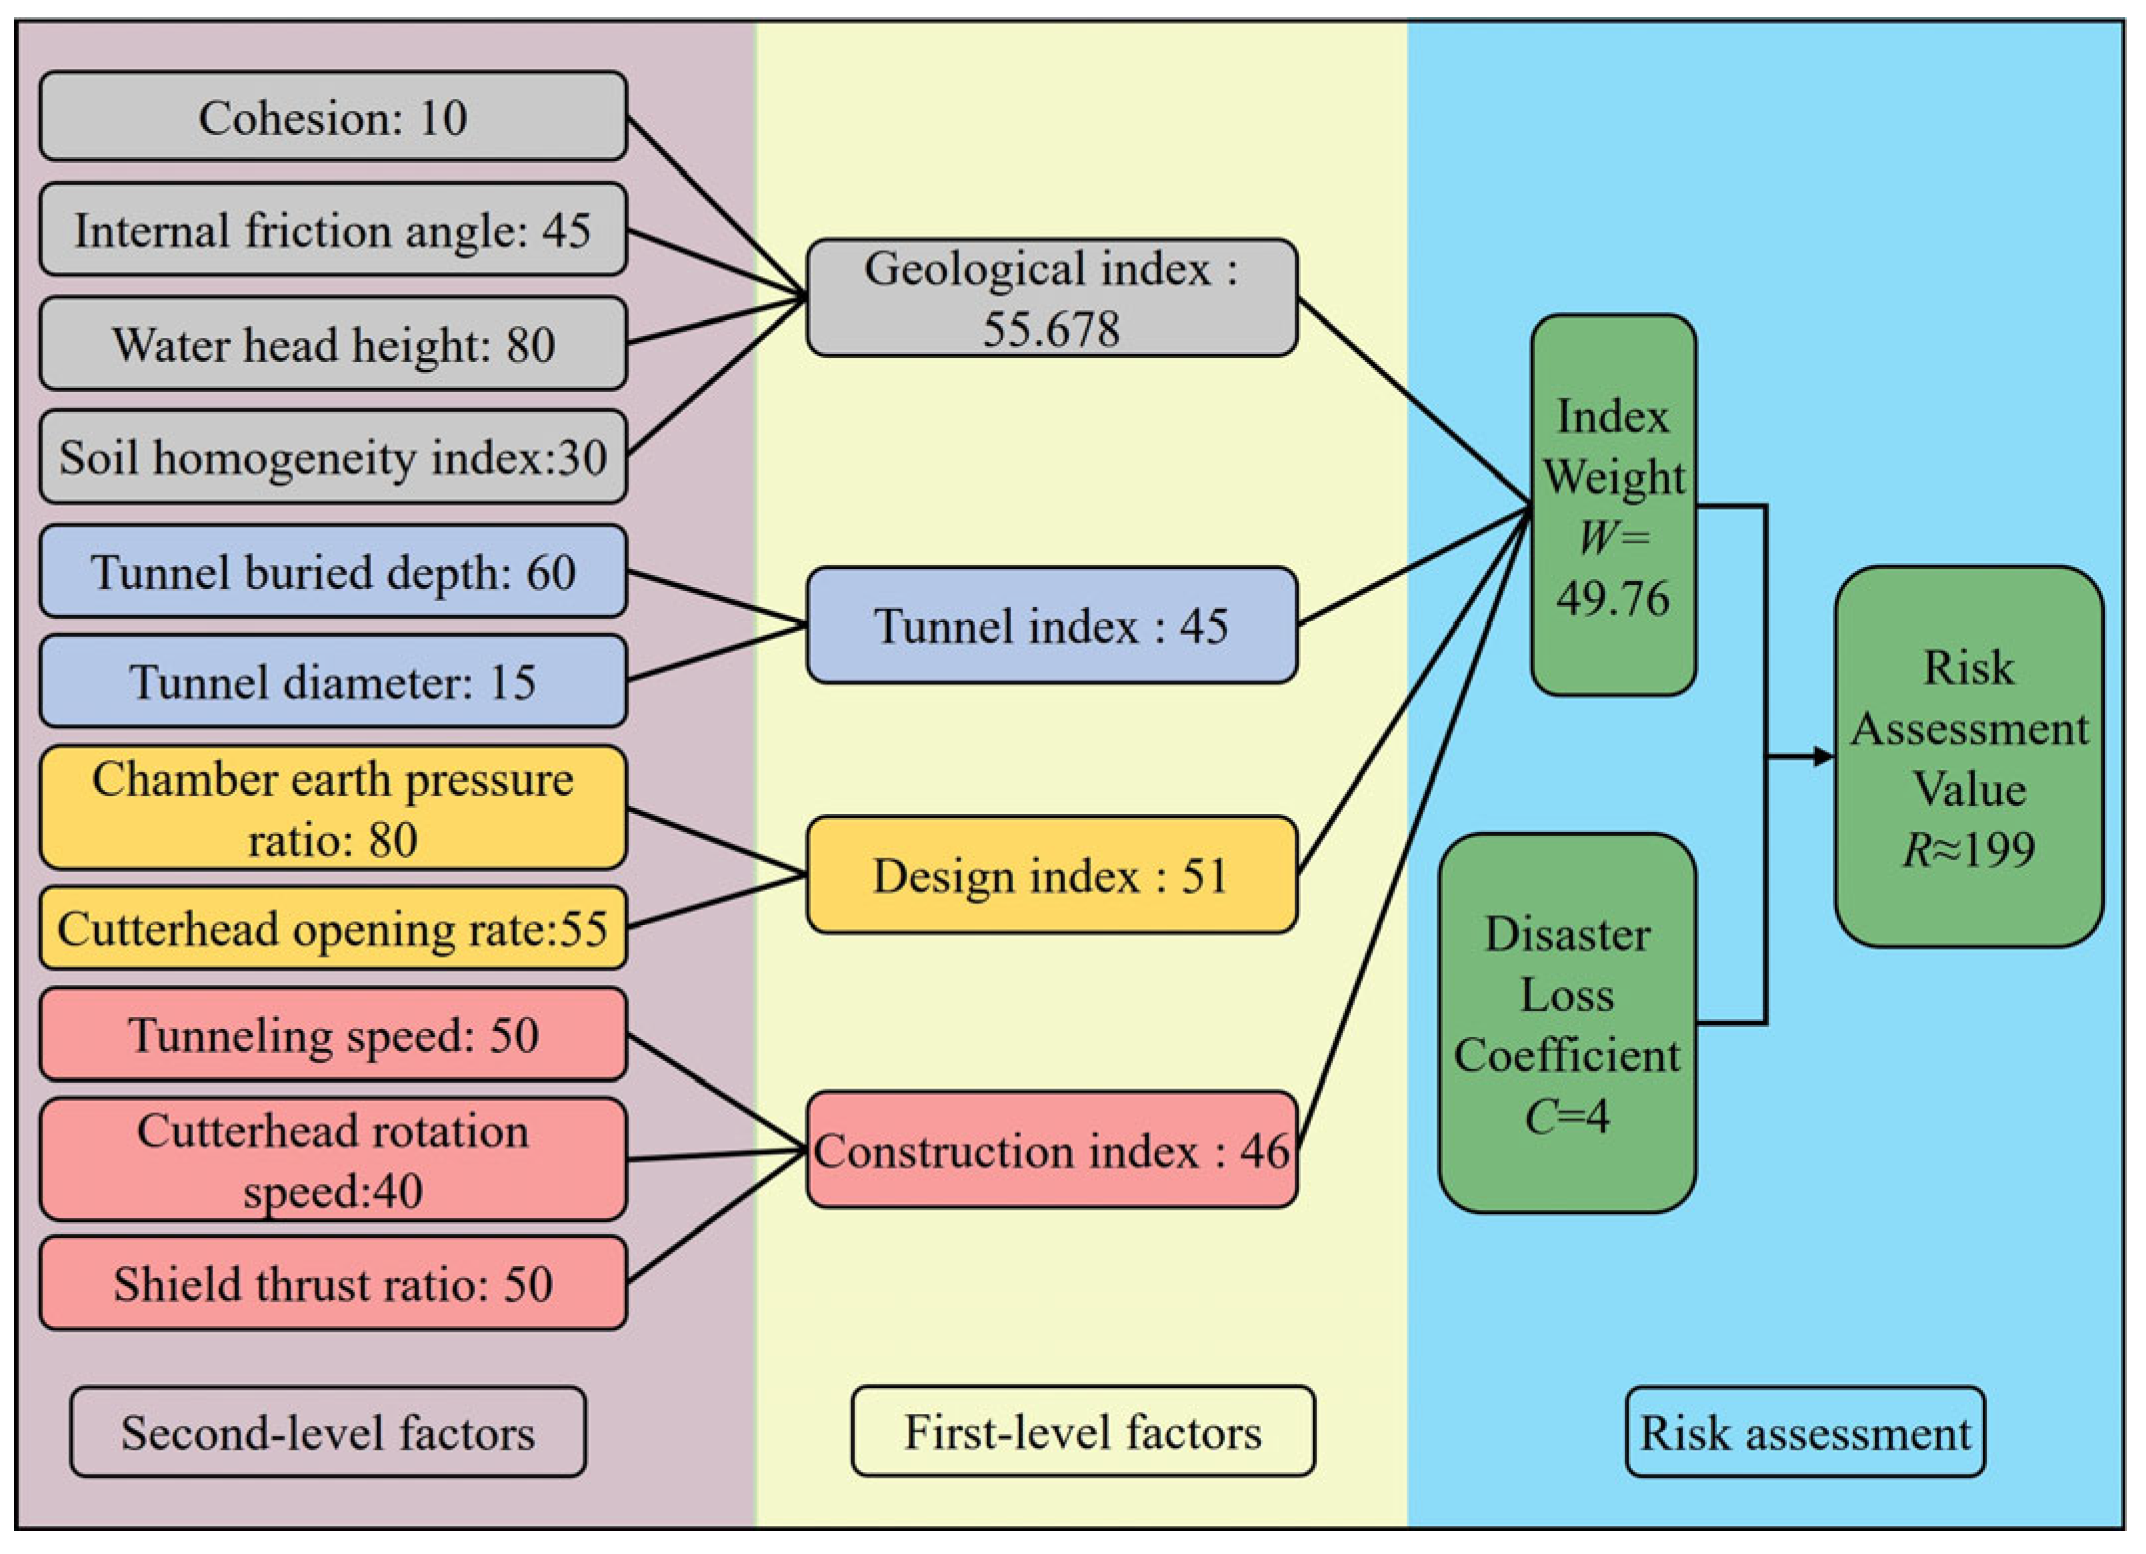
A risk assessment index system considering geological index, tunnel index, design index, and construction index is constructed, in which various factors are independently affected. A weighted index risk assessment method is introduced, which utilizes the AHP to establish the weight of each risk source. Subsequently, the identified risk factors are evaluated and assigned appropriate weights. Finally, the risk assessment value is obtained by using the risk loss coefficient. This method has the characteristics of comprehensive risk factors and a simple calculation process. The reliability and validity of the proposed method were confirmed through its application in practical engineering scenarios.
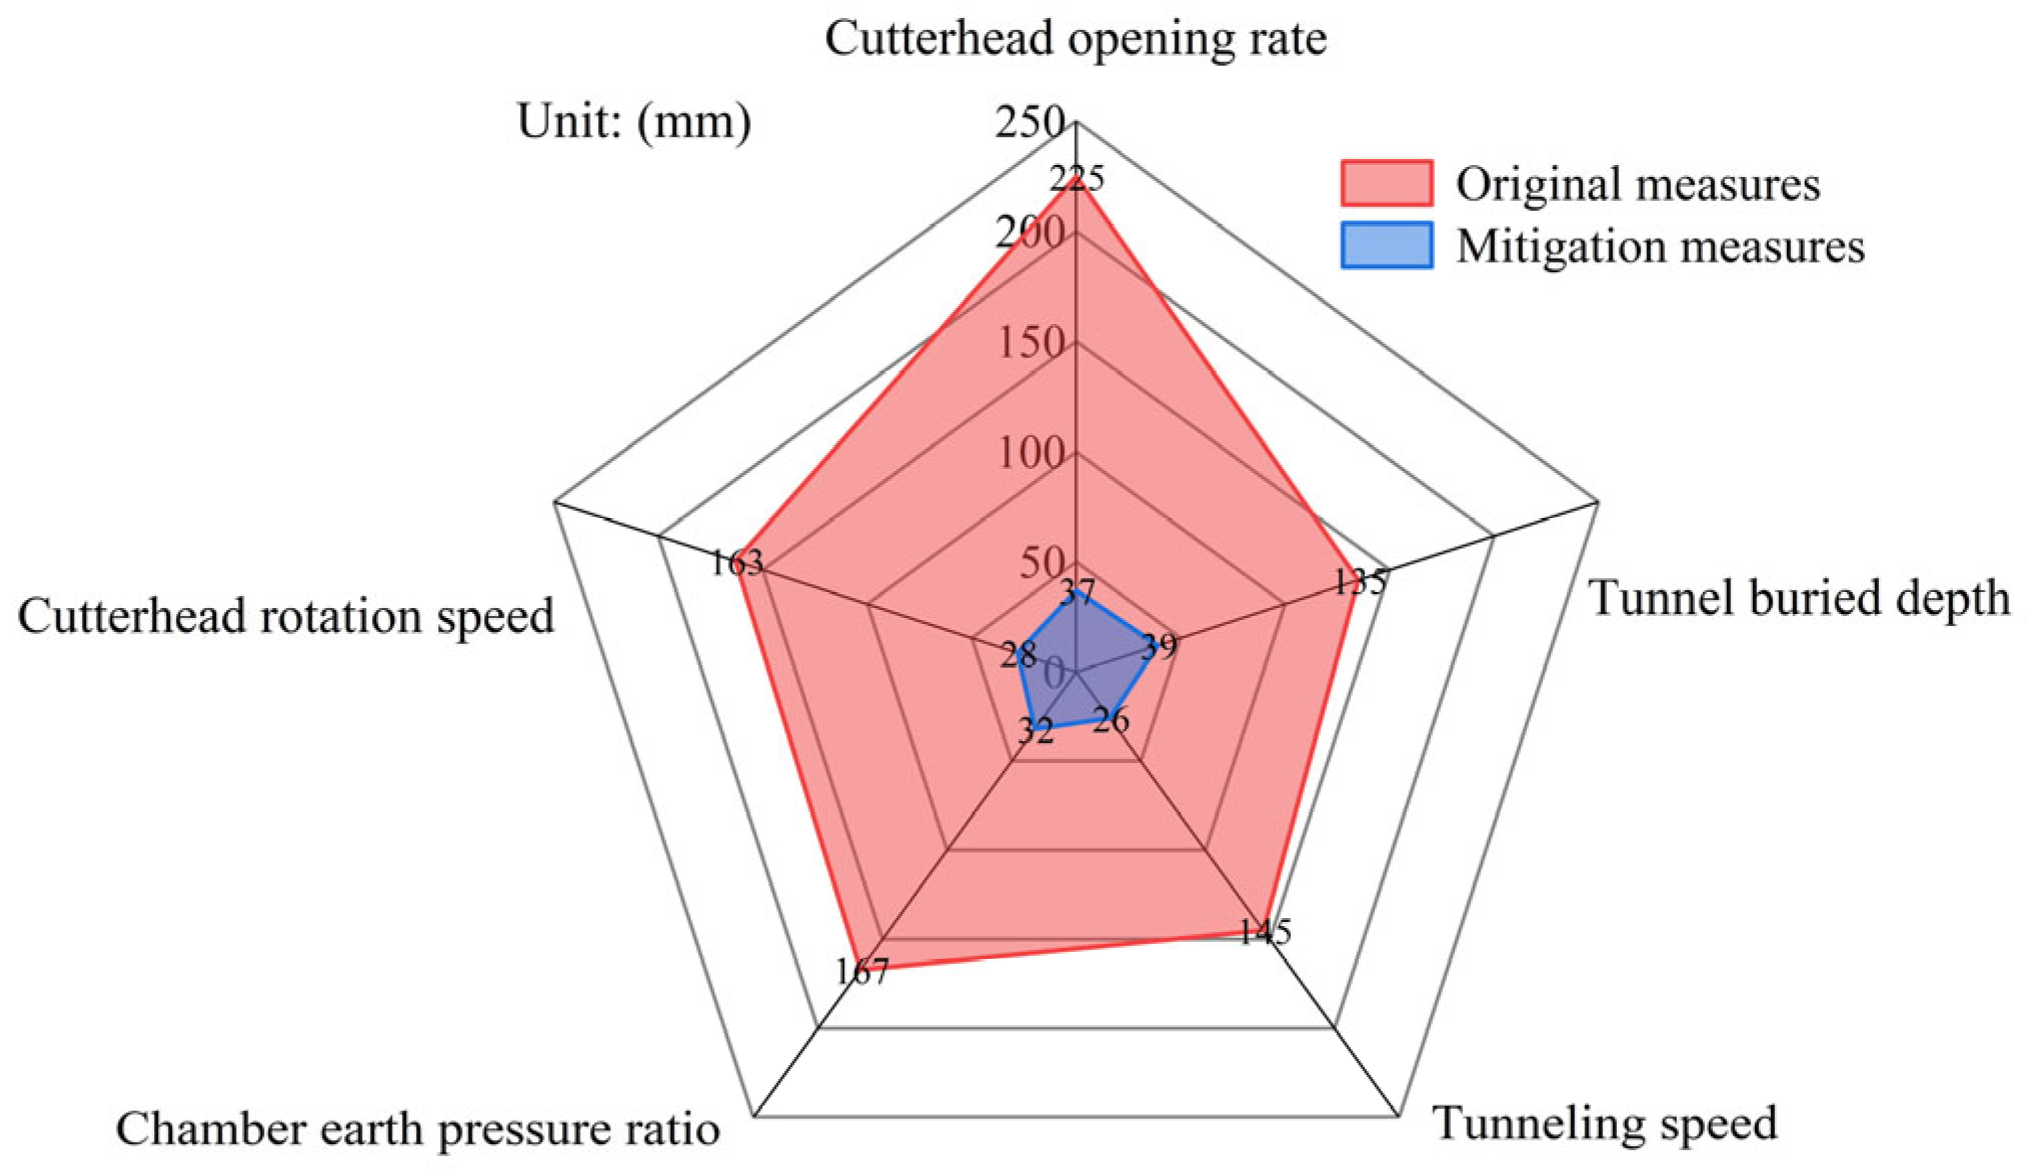
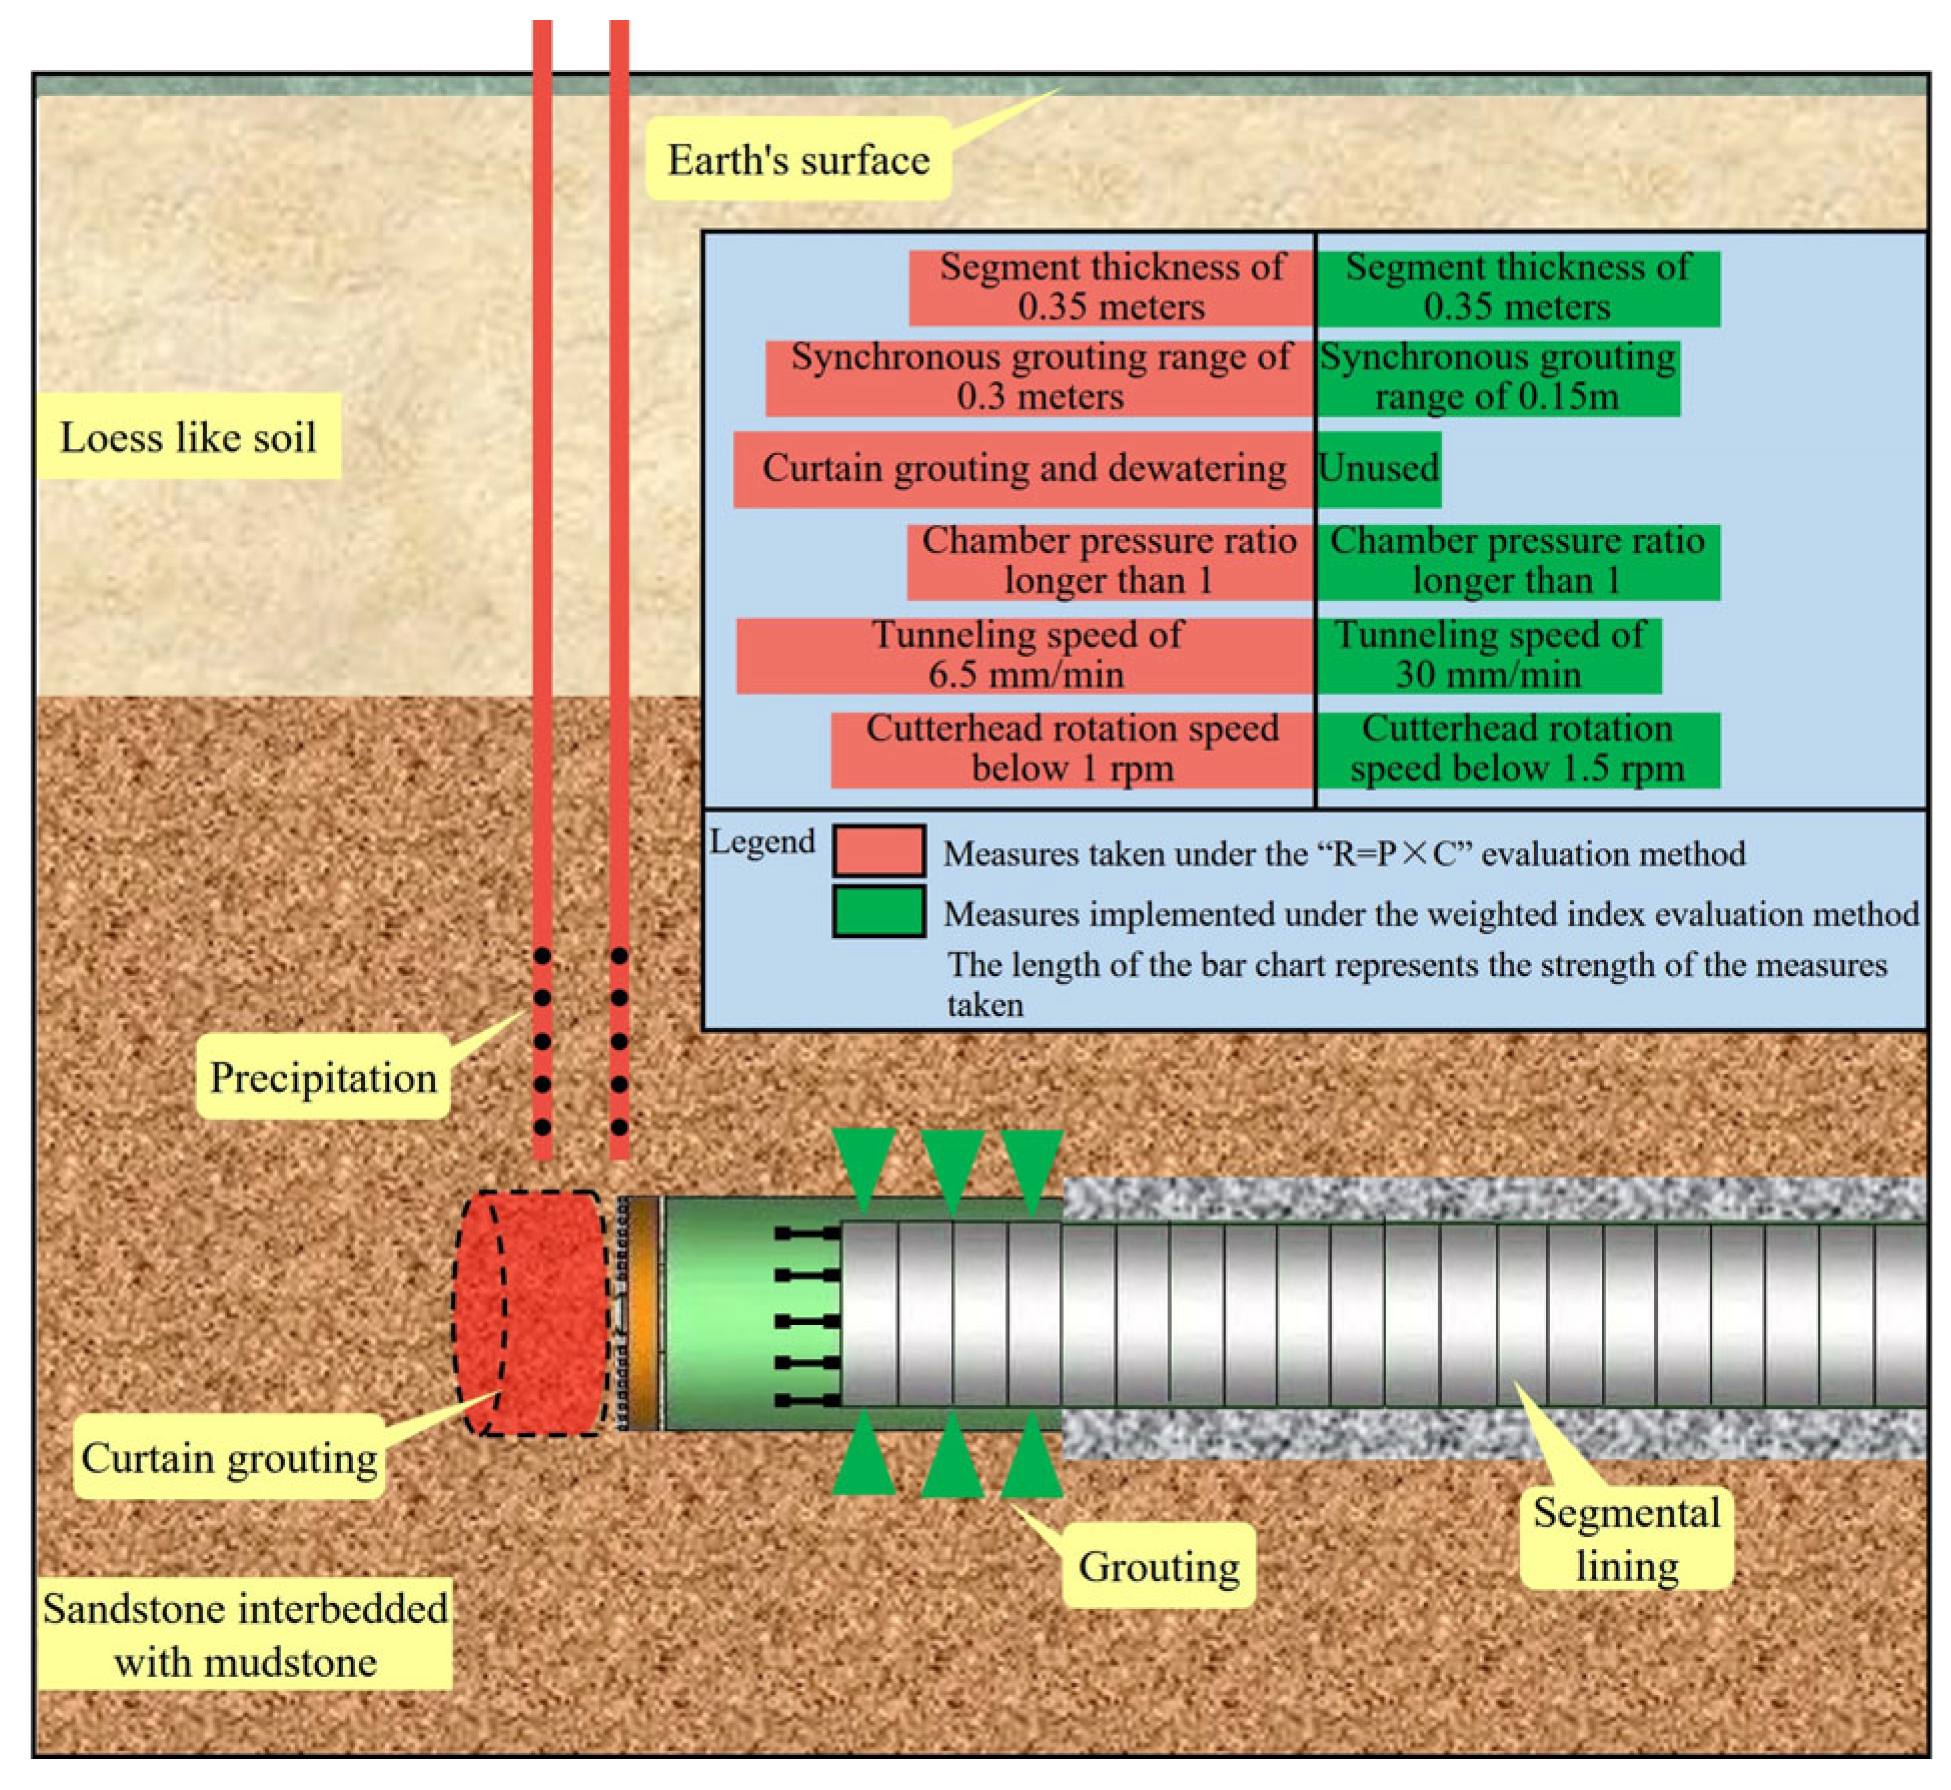
During normal shield tunneling operations, the soil chamber earth pressure ratio constitutes the most critical influencing factor. Additionally, advancement speed, cutterhead rotation speed, and hydraulic head height represent primary risk factors for excavation face instability. The reinforcement measures under the evaluation results of the weighted index method (risk level: Grade II), the soil pressure ratio is greater than 1, the shield tunneling speed does not exceed 30 mm/min, the cutterhead rotation speed does not exceed 1.5 rpm, and the grouting range is 0.15 m. Finally, combined with the on-site implementation, it is shown that the shield machine successfully passed the risk assessment section without any accidents.
The limitation of this study is that the simplified linear weighting method and model are only applied in a single project. The linear weighting assumption assumes that the contribution of each influencing factor to the instability of the excavation face is independent and linearly superimposed, but in actual geotechnical engineering, there is a significant nonlinear coupling effect between multiple factors. Secondly, the geological conditions and engineering parameters of the project are specific, and the model parameters are based on the project, which may lead to insufficient adaptability to different geological types. In future studies, the applicability of the model can be tested under other geological conditions (for example, water-rich sand stratum, composite stratum), and the working conditions can be analyzed and the model can be improved. It may also be integrated into the real-time tunnel control system to improve the practicability of the model. In addition, the research on tunnel safety risk assessment based on artificial intelligence algorithms can be carried out, and the theoretical depth of the model can be further improved on the basis of multi-scenario verification and engineering application.

Author Contributions

Conceptualization, C.Z. and J.G.; Methodology, X.H., J.G. and Q.L.; Software, C.Z., C.X. and Q.L.; Validation, J.G. and G.Y.; Formal Analysis, C.X.; Investigation, X.H. and C.Z.; Resources, J.G., G.Y. and Q.L.; Data Curation, C.Z.; Writing—Original Draft Preparation, C.Z. and X.H.; Writing—Review and Editing, C.X., G.Y. and J.G.; Visualization, C.X. and Q.L.; Supervision, C.X. and J.G.; Project Administration, J.G. All authors have read and agreed to the published version of the manuscript.

Funding

The authors acknowledge the University Science and Technology Innovation Team of Henan (No. 25IRTSTHN006), Cultivation project of “Double first-class” creation of safety discipline (No. AQ20240725), Distinguished Young Scientists of Henan Polytechnic University (No. J2025-8), and Enterprise Commissioned Project (No. YK20-36-01) for financial support.

Data Availability Statement

The data that support the findings of this study are available from the corresponding author upon reasonable request.

Acknowledgments

The author is very grateful to the teachers for their help, to the financial support of the funding agencies, and to the reviewers for their valuable comments and suggestions to improve the quality of the papers.

Conflicts of Interest

Authors Chong Xu and Guangyi Yan were employed by China Railway First Survey and Design Institute Group Co., Ltd. The remaining authors declare that the research was conducted in the absence of any commercial or financial relationships that could be construed as a potential conflict of interest.

References

  1. Su, C.S.; Hu, Q.J.; Yang, Z.F.; Huo, R.K. A Review of Deep Learning Applications in Tunneling and Underground Engineering in China. Appl. Sci. 2024, 14, 1720. [Google Scholar] [CrossRef]
  2. Liu, L.P.; Wang, X.G.; Li, C.B.; Tian, Z.H. Jamming of the double-shield tunnel boring machine in a deep tunnel in Nyingchi, Tibet Autonomous Region, China. Tunn. Undergr. Space Technol. 2023, 131, 104819. [Google Scholar] [CrossRef]
  3. Lu, L.Y.; Ji, M.L.; Wen, X.; Xiang, Y. An empirical study on construction emergency disaster management and risk assessment in shield tunnel construction project with big data analysis. Int. J. Data Min. Bioinform. 2024, 28, 406–425. [Google Scholar] [CrossRef]
  4. Fu, H.L.; Zhang, J.B.; Huang, Z.; Shi, Y.; Wang, J.; Xing, X.S. Predictive analysis of ground displacement and stress induced by shallow-buried shield tunnel excavation in composite strata. Mod. Tunn. Technol. 2017, 54, 97–106. [Google Scholar] [CrossRef]
  5. Wang, C.; Zou, J.F.; Li, F.; Liu, B.; Rao, B.S.; Shu, D. A calculation method for soil displacement induced by non-horizontal twin parallel shield tunnelling based on the modified Loganathan formula. Urban Rail Transit Res. 2024, 42, 1–8+15. [Google Scholar] [CrossRef]
  6. Gao, K.; Zhang, Z.W.; Liang, R.Z.; Li, Z.C.; Tian, H.F. Impact of newly constructed tunnels passing closely above existing shield tunnels on their longitudinal deformation. Saf. Environ. Eng. 2024, 31, 110–119+136. [Google Scholar] [CrossRef]
  7. Yang, B.; Zhang, C.Y.; Su, N.; Xiao, Z.R. Influence of small radius curved shield tunneling excavation on displacement of surrounding soil. Buildings 2023, 13, 803. [Google Scholar] [CrossRef]
  8. Wang, X.; Li, Y.J.; Wei, G.; Wei, X.J.; Yan, Z.H.; Yan, J.J.; Li, B.J. Model Design and Application for Excavation Face Stability in Upward Shield Tunneling. Buildings 2024, 14, 2514. [Google Scholar] [CrossRef]
  9. Zhu, Y.C.; Zeng, B.Z.; Ye, S.Q.; He, L.H.; Zheng, Y.; Ma, R. Physical model tests and discrete-element simulation of pile and soil displacement response induced by DOT shield tunneling based on transparent soil technology. Int. J. Geomech. 2023, 23, 04023124. [Google Scholar] [CrossRef]
  10. Ma, S.K.; Duan, Z.B.; Huang, Z.; Liu, Y.; Shao, Y. Study on the stability of shield tunnel face in clay and clay-gravel stratum through large-scale physical model tests with transparent soil. Tunn. Undergr. Space Technol. 2022, 119, 104199. [Google Scholar] [CrossRef]
  11. Yin, Z.Y.; Wang, P.; Zhang, F.S. Effect of particle shape on the progressive failure of shield tunnel face in granular soils by coupled FDM-DEM method. Tunn. Undergr. Space Technol. 2020, 100, 103394. [Google Scholar] [CrossRef]
  12. Feng, H.L.; Ye, F.; Han, X.B.; Wang, P.Y.; Chen, Z.M.; Liang, X.M. Displacement and pressure of surrounding rock during shield tunnelling and supporting in low water content loess. Eng. Geol. 2024, 338, 107612. [Google Scholar] [CrossRef]
  13. Hu, Y.; Lei, H.Y.; Zheng, G.; Shi, L.; Zhang, T.Q.; Shen, Z.C.; Jia, R. Assessing the deformation response of double-track overlapped tunnels using numerical simulation and field monitoring. J. Rock Mech. Geotech. Eng. 2022, 14, 436–447. [Google Scholar] [CrossRef]
  14. Broms, B.B.; Bennermark, H. Stability of clay at vertical opening. J. Soil Mech. Found. Div. 1967, 93, 71–94. [Google Scholar] [CrossRef]
  15. Attewell, P.B.; Boden, J.B. Development of stability ratios for tunnels driven in clay. Tunn. Tunn. Int. 1971, 3, 195–198. [Google Scholar]
  16. Ihm, M.H.; Lee, H. Analysis of Geological Factors for Risk Assessment in Deep Rock Excavation in South Korea. Tunn. Undergr. Space 2021, 31, 211–220. [Google Scholar] [CrossRef]
  17. Ou, G.Z.; Jiao, Y.Y.; Zhang, G.H.; Zou, J.P.; Tan, F.; Zhang, W.S. Collapse risk assessment of deep-buried tunnel during construction and its application. Tunn. Undergr. Space Technol. 2021, 115, 104019. [Google Scholar] [CrossRef]
  18. Zhang, L.W.; Zhang, W.G.; Wang, Z.Q.; Liu, S.J.; Liu, K. Instability Risk Assessment for Deep Excavation of Soil–Rock Combinations Containing Groundwater. Appl. Sci. 2023, 13, 12887. [Google Scholar] [CrossRef]
  19. Xue, Y.G.; Li, X.; Qiu, D.H.; Ma, X.M.; Kong, F.M.; Qu, C.Q.; Zhao, Y. Stability evaluation for the excavation face of shield tunnel across the Yangtze River by multi-factor analysis. Geomech. Eng. 2019, 19, 283–293. [Google Scholar] [CrossRef]
  20. Hernández, Y.Z.; Farfán, A.D.; de Assis, A.P. Three-dimensional analysis of excavation face stability of shallow tunnels. Tunn. Undergr. Space Technol. 2019, 92, 103062. [Google Scholar] [CrossRef]
  21. Zhang, W.; Tang, X.; Yang, W.; Jiang, J.; Zhang, H.; Li, P. Review of tunnels and tunnelling under unfavourable geological conditions. Geol. J. 2024, 59, 2668–2689. [Google Scholar] [CrossRef]
  22. Xu, N.; Guo, C.R.; Wang, L.; Zhou, X.Q.; Xie, Y. A three-stage dynamic risk model for metro shield tunnel construction. KSCE J. Civ. Eng. 2024, 28, 503–516. [Google Scholar] [CrossRef]
  23. Guo, D.; Meng, F.; Wu, H.; Yang, X.; Chen, R. Risk assessment of shield construction adjacent to the existing shield tunnel based on improved nonlinear FAHP. Tunn. Undergr. Space Technol. 2025, 155, 106154. [Google Scholar] [CrossRef]
  24. Wang, X.Y.; Gong, H.; Song, Q.Y.; Yan, X.; Luo, Z. Risk Assessment of EPB Shield Construction Based on the Nonlinear FAHP Method. Adv. Civ. Eng. 2022, 2022, 9233833. [Google Scholar] [CrossRef]
  25. Lyu, H.M.; Shen, S.L.; Zhou, A.; Yin, Z.Y. Assessment of safety status of shield tunnelling using operational parameters with enhanced SPA. Tunn. Undergr. Space Technol. 2022, 123, 104428. [Google Scholar] [CrossRef]
  26. Wang, Y.C.; Jiang, W.; Wang, M.T.; Li, Y.H. Risk assessment and implementation of deformation disaster for operation tunnel based on entropy weight-grey relational analysis. Geomat. Nat. Hazards Risk 2022, 13, 1831–1848. [Google Scholar] [CrossRef]
  27. Chen, Y.L.; Shen, S.L.; Zhou, A.; Zeng, Y. Novel model for evaluating ground settlement risk in slurry balance shield tunnel construction. Tunn. Undergr. Space Technol. 2024, 150, 105853. [Google Scholar] [CrossRef]
  28. Nezarat, H.; Sereshki, F.; Ataei, M. Ranking of geological risks in mechanized tunneling by using Fuzzy Analytical Hierarchy Process (FAHP). Tunn. Undergr. Space Technol. 2015, 50, 358–364. [Google Scholar] [CrossRef]
  29. Li, X.; Xue, Y.G.; Li, Z.Q.; Kong, F.M.; Zhou, B.H. Intelligent decision method for stability assessment of shield tunnel based on multi-objective data mining. Philos. Trans. R. Soc. A 2023, 381, 20220303. [Google Scholar] [CrossRef]
  30. Huang, M.L.; Zhang, Z.E.; Song, Y.; Gao, S.; Yu, C.B. Risk Assessment of Tunnel Face Instability under Multi Factor Coupling Based on Conditional Probability and Tunnel Construction Mechanics. Appl. Sci. 2022, 12, 7881. [Google Scholar] [CrossRef]
  31. Li, S.C.; Wu, J. A multi-factor comprehensive risk assessment method of karst tunnels and its engineering application. Bull. Eng. Geol. Environ. 2019, 78, 1761–1776. [Google Scholar] [CrossRef]
  32. Wu, X.G.; Wu, G.; Luo, H.B. Risk analysis of shield tunnelling in the Wuhan Yangtze River Tunnel project. China Munic. Eng. 2007, 23, 51–53+99. [Google Scholar]
  33. Wang, X.; Xu, T.; Ran, J.; Guo, D.S.; Su, W.Y. Risk identification and assessment of shield tunnelling in karst regions for metro tunnels. Railw. Investig. 2023, 49, 5–11. [Google Scholar] [CrossRef]
  34. Zhan, J.W.; Liu, G.; Huang, M.; Luo, C.S.; Chen, J.H. Risk assessment model and systematic study of landslide in mountainous tunnels. J. Undergr. Space Eng. 2022, 8, 1338–1346+1362. [Google Scholar]
  35. Ma, G.; Kang, Z.; Gao, H.Y.; Yu, W.L.; Kang, J.W. Safety risk analysis and countermeasures for urban metro tunnels in saturated soft loess. Tunn. Constr. 2023, 43, 425–433. [Google Scholar]
  36. Zhao, Y. Stability assessment of loess tunnel construction based on principal component analysis and cloud model. Tunn. Constr. 2022, 43, 1529–1536. [Google Scholar]
  37. Yan, X.L. Risk assessment model for shield tunnelling. J. Railw. Sci. Eng. 2022, 12, 2453–2460. [Google Scholar] [CrossRef]
  38. Zhao, D.; Sun, Z.; He, Y.; Chen, X.; Liu, R. Prediction of ground subsidence by shield tunneling using ensemble learning. Tunn. Undergr. Space Technol. 2023, 141, 105343. [Google Scholar] [CrossRef]
  39. Hou, S.; Liu, Y.; Zhuang, W.; Zhang, K.; Zhang, R.; Yang, Q. Prediction of shield jamming risk for double-shield TBM tunnels based on numerical samples and random forest classifier. Acta Geotech. 2023, 18, 495–517. [Google Scholar] [CrossRef]
  40. Hu, M.; Sun, J.; Wu, B.; Wu, H.; Xu, Z. Shield tunnel (Segment) uplift prediction and control based on interpretable machine learning. Sustainability 2024, 16, 910. [Google Scholar] [CrossRef]
  41. Wang, W.; Feng, H.; Li, Y.; You, Q.; Zhou, X. Research on Prediction of EPB Shield Tunneling Parameters Based on LGBM. Buildings 2024, 14, 820. [Google Scholar] [CrossRef]
  42. Huang, X.; Zhang, Z.H.; Yan, G.Y.; Guo, J.Q.; Xu, C.; Liang, Q. Three-dimensional discrete element analysis of the excavation face stability of deep-buried shield tunnels. Electron. J. Struct. Eng. 2025, 25, 6–14. [Google Scholar] [CrossRef]
  43. Byun, Y.S.; Seong, J.H.; Cho, G.C. Developments of performance-based evaluation criteria of utility tunnel. J. Korean Tunn. Undergr. Space Assoc. 2022, 24, 715–724. [Google Scholar] [CrossRef]
  44. Zhou, P.; Feng, Y.; Zhou, F.; Wei, Z.; Gou, S.; Xu, H.; Wang, Z. Evaluation system of worker comfort for high geothermal tunnel during construction: A case study on the highway tunnel with the highest temperature in China. Tunn. Undergr. Space Technol. 2023, 135, 105028. [Google Scholar] [CrossRef]
  45. Lee, Y.; Yoon, Y.; Oh, T. A Study on Disaster Influencing Factors and Importance for Safety Management in NATM Tunnel Drilling. J. Converg. Cult. Technol. 2022, 8, 757–763. [Google Scholar] [CrossRef]
  46. Kim, J.; Kim, C.; Kim, G.; Kim, I.; Abbas, Q.; Lee, J. Probabilistic tunnel collapse risk evaluation model using analytical hierarchy process (AHP) and Delphi survey technique. Tunn. Undergr. Space Technol. 2022, 120, 104262. [Google Scholar] [CrossRef]
  47. Yang, X.; You, D.; Gao, X.; Li, Q.; Hu, X.; Zeng, S.; Kang, L. Evolution of runoff discharge patterns and risk assessment of water inrush in mountainous railroad tunnels. Nat. Hazards 2024, 120, 8851–8870. [Google Scholar] [CrossRef]
  48. Chen, M.Q. Mechanism of Face Instability and Risk Assessment in Slurry Shield Tunnelling Through High-Pressure Sandy Soils. Ph.D. Dissertation, Beijing Jiaotong University, Beijing, China, 2014. [Google Scholar]
  49. Yang, J.C.; Shao, B.T.; Lv, Y.M. Comparison of construction plans for the Bailuyuan tunnel in the second phase of the Hanjiang to Weihe Water Diversion Project. Shaanxi Water Resour. 2022, 11, 118–121. [Google Scholar] [CrossRef]
  50. Meng, W.L. Prediction of Surface Settlement and Risk Assessment of Excavation Faces During Shield Tunnelling in Weathered Granite Formations. Master’s Thesis, Shanghai Jiao Tong University, Shanghai, China, 2019. [Google Scholar] [CrossRef]
Figure 1. Flow diagram of modeling phase: (a) parameter calibration test; (b) construction of a simplified 3D shield machine model; (c) 3D simulation analysis of stratum modeling and shield tunneling process.
Buildings 15 02561 g001
Figure 2. Curves illustrating the variation in horizontal displacement of the excavation face at different tunnel burial depths.
Buildings 15 02561 g002
Figure 3. Curves showing the horizontal displacement changes in the excavation face for various cutterhead opening rates.
Buildings 15 02561 g003
Figure 4. Curves representing the changes in horizontal displacement of the excavation face under different cutterhead rotation speeds.
Buildings 15 02561 g004
Figure 5. Curves depicting the horizontal displacement variations in the excavation face at various tunneling speeds.
Buildings 15 02561 g005
Figure 6. Curves reflecting the changes in horizontal displacement of the excavation face as influenced by different chamber earth pressure ratios.
Buildings 15 02561 g006
Figure 7. Schematic diagram of deformation around the excavation face and surrounding area.
Buildings 15 02561 g007
Figure 8. Proportional contributions of different parameters to displacement.
Buildings 15 02561 g008
Figure 9. Weighted index method risk assessment model.
Buildings 15 02561 g009
Figure 10. The weight proportion of influencing factors at all levels.
Buildings 15 02561 g010
Figure 11. Engineering location and geological distribution: (a,b) engineering geographical location; (c) location of the project department; (d) shield machine launched; (e) geological profile map.
Buildings 15 02561 g011
Figure 12. Schematic decomposition of weighted risk assessment scoring components.
Buildings 15 02561 g012
Figure 13. Contribution scores of key factors.
Buildings 15 02561 g013
Figure 14. Comparison of numerical simulation displacement under different factors before and after mitigation measures.
Buildings 15 02561 g014
Figure 15. Research flow chart.
Buildings 15 02561 g015
Figure 16. ROC curve for risk classification.
Buildings 15 02561 g016
Figure 17. Comparison of engineering application measures.
Buildings 15 02561 g017
Table 1. Input parameters for DEM model.
Model Input ParametersDensity (kg/m3)Shear Modulus (GPa)Poisson Ratio
Shield machine78001000.25
Boundary wall78001000.25
Grain25104.30.17
Table 2. Model contact parameters.
Contact ParametersParticle–ParticleParticle–Boundary WallShield Machine–Particles
Static friction coefficient0.50.50.5
Rolling friction coefficient0.80.80.8
Collision restitution coefficient0.010.010.01
Table 3. Relevant mechanical index parameters.
Particle ContactNormal Stiffness
(kN/m3)
Tangential Stiffness
(kN/m3)
Critical Normal Stress
(MPa)
Critical Tangential Stress (MPa)JKR-Surface Energy
(J/m2)
Numerical value1 × 1057 × 1055 × 1025 × 1027
Table 4. Ranking of influence degrees for various factors.
FactorsChamber Earth Pressure RatioCutterhead Opening RateCutterhead Rotation SpeedTunneling SpeedTunnel Buried Depth
Ranking of influence degree12345
Table 5. Value of the random consistency indicator RI.
Order (n)1234567
RI000.580.891.121.241.32
Table 6. Scoring table for secondary factors.
Range IRange IIRange IIIRange IVRange V
Cohesion (kPa)<1515~2525~3535~45>45
Score Ranges80~10060~8040~6020~400~20
Internal friction angle (°)<1010~1818~2626~34>34
Score Ranges90~10065~9040~6515~400~15
Water head height (m)<5050~100100~150150~200>200
Score Ranges0~2020~4040~6060~8080~100
Tunnel buried depth (m)<100100~200200~300300~400>400
Score Ranges0~1010~3030~6060~9090~100
Tunnel diameter (m)<44~77~1010~13>13
Score Ranges0~1010~3535~6060~8585~100
Chamber earth pressure ratio<0.30.3~0.50.5~0.70.7~0.9>0.9
Score Ranges100100~7070~4040~1010~0
Cutterhead opening rate (%)<3030~4545~6060~75>75
Score Ranges0~1010~3535~6060~8585~100
Tunneling speed (mm/min)<1515~3030~4545~60>60
Score Ranges0~250~5050~7575~9090~100
Cutterhead rotation speed (rpm)<11~1.51.5~22~2.5>3
Score Ranges0~2020~4040~6060~8080~100
Table 7. Soil homogeneity index scores [48].
ClaySiltSandGravelSoft RockMedium Hard RockHard Rock
Clay0~55~2020~3535~5050~6565~8080~100
Silt 05~2020~3535~5050~6565~80
Sand 05~2020~3535~5050~65
Gravel 05~2020~3535~50
Soft rock 05~2020~35
Medium hard rock 05~20
Hard rock 0
Table 8. Disaster loss grades and coefficients.
Disaster Loss GradesDescriptionCoefficientDamage Class
C1Almost negligible1No damage occurred
C2Needs consideration2Elastic failure
C3Serious consequences3Elastic-plastic failure
C4Very serious consequences4Plastic failure
C5Catastrophic consequences5Instability failure
Table 9. Risk classification table.
Risk Assessment ValueNumber RangeRisk LevelEvaluation
R0~100IIdeal safety state
100~200IIMinor risk
200~300IIIModerate risk
300~400IVSevere risk
400~500VCatastrophic risk
Table 10. Excavation face risk assessment index weight and score results.
The First Level FactorsWeight (%)Secondary FactorsWeight (%)ScoresRemarks
Geological Index12.01Cohesion18.541065 kPa
Internal friction angle18.544525°
Water head height53.2180200 m
Soil homogeneity index9.7130Mudstone interbedded with sandstone
Tunnel Index7.71Tunnel buried depth66.760270~300 m
Tunnel diameter33.3155.38 m
Design Index53.49Chamber earth pressure ratio80.0050Data lost, mean imputation
Cutterhead opening rate20.005555%
Construction Index26.79Tunneling speed40.005030 mm/min
Cutterhead rotation speed40.00401.5 rpm
Shield thrust ratio20.0050Data lost, mean imputation
Table 11. Summary of validation metrics for risk scoring and weight matrix consistency.
ProjectIndexRICICRWeightScore
Goal layer/0.890.0380.043//
First-level factorsGeological index0.890.0010.00112.01%55.678
Tunnel index0007.71%45
Design index00053.49%51
Construction index0.580026.79%46
Table 12. Comparison between past models and current research.
ProjectPast ModelsCurrent StudyComparative Advantage
Core basisFuzzy AHP, Monte Carlo AHPDEM + Simplified AHPnon-traditional
Main advantagesStructured clear, mature theoryFusion data, improve efficiencyThe computational efficiency is better.
Input informationMainly rely on expert judgment, qualitative or semi-quantitative questionnaire.Simulation data, expert evaluation, or real-time monitoring dataMake full use of multi-source information
Main challengesThe results are sensitive to the judgment matrix and have static limitations.More extensive generalization verification requirementsThe future direction is clear
Disclaimer/Publisher’s Note: The statements, opinions and data contained in all publications are solely those of the individual author(s) and contributor(s) and not of MDPI and/or the editor(s). MDPI and/or the editor(s) disclaim responsibility for any injury to people or property resulting from any ideas, methods, instructions or products referred to in the content.

