Article

Mechanical Characterization and Theoretical Study of Friction Pile Groups in Coastal Areas Based on Finite Element Analysis

1
School of Transportation and Geomatics Engineering, Shenyang Jianzhu University, Shenyang 110168, China
2
Dalian Branch of China Railway Ninth Bureau Group Co., Ltd., Dalian 116600, China
3
Key Laboratory of Ministry of Education on Safe Mining of Deep Metal Mines, Northeastern University, Shenyang 110819, China
4
School of Resources and Civil Engineering, Northeastern University, Shenyang 110819, China
5
School of Civil Engineering, Liaoning Technical University, Fuxin 123000, China
*
Author to whom correspondence should be addressed.
Buildings 2025, 15(14), 2556; https://doi.org/10.3390/buildings15142556
Submission received: 30 June 2025 / Revised: 16 July 2025 / Accepted: 18 July 2025 / Published: 20 July 2025
(This article belongs to the Section Building Energy, Physics, Environment, and Systems)

Abstract

Field foundation pile loading tests were conducted in the context of an actual bridge pile foundation project. The test data were analyzed to determine the reasons for the variation in the complex geological conditions of the seashore. Moreover, finite element analysis was conducted to evaluate the influence of pile length and diameter on the settlement of coastal friction foundation piles. Increasing the pile length from 65 m to 75 m reduced the settlement by 25.7%, while increasing the diameter from 1.5 m to 2.0 m led to a 35.9% reduction. Increasing the pile spacing reduced the amount of structural settlement. Group pile foundation pile spacings should be 2.5–3.0 D. Pile group superposition reduced the most obvious effects and the settlement reduction rate was the fastest. Under seismic conditions, the pile group foundation exhibited 5.60 times greater horizontal displacement, 3.57 times higher bending moment, and 5.30 times increased shear force relative to static loading. The formula for predicting the settlement of oversized friction pile group foundations was modified based on settlement values calculated using finite elements. The revised formula is suitable for calculating the settlement of friction pile group foundations in coastal areas.

1. Introduction

More stringent requirements have been proposed for the design of building foundations in the construction of large-span bridges and tall buildings. Currently, in coastal areas, the sedimentary layer comprises thicker, mostly silty soil with a lower bearing capacity compared with the holding layer. Moreover, it is more difficult to find a hard rock layer in the sedimentary layer than in the holding layer. Therefore, friction piles are typically utilized to reinforce the foundation. The principle of such reinforcement is to utilize friction between the piles and soil body to provide bearing capacity. Researchers have also conducted numerous theoretical analyses, field tests, numerical modeling test studies, and seismic studies on friction group piles in coastal areas [1,2,3,4]. Fei and H modeled the flexibility matrix of layered foundations more accurately by considering the effect of different soil layers based on the Mindlin solution [5]. Yang and Zhan demonstrated that the pile foundation does not conform to the Mindlin solution in certain soil conditions and derived the generalized Mindlin solution using lamination theory [6]. Zhang analyzed the monopile according to the load transfer function proposed by Hedinger and O’Neill and then used the matrix displacement method to calculate the internal forces and nodal displacements of the pile structure, which was coded into a calculation program and compared with engineering examples; they also calculated the distribution forms of the lateral friction resistance and axial force [7]. Liu and Zheng conducted immersion tests on pile foundations in unique geological conditions, measuring the stress distribution of prefabricated pipe piles [8]. Yang and Dai used fiber-optic sensors to monitor field tests of pile foundations and analyzed the distribution of lateral resistance along the pile body in the soil [9]. Fang studied the characteristics of the distribution of the negative friction resistance of pile foundations in coastal areas, combined with on-site inspection test data; analyzed the main influencing factors of the negative friction resistance of pile foundations using MI three-dimensional finite element numerical simulations; and summarized the distribution law of the negative friction resistance of pile foundations in coastal areas [10]. Fellenius analyzed the effect of soil properties on pile resistance [11]. Endo Minou et al. investigated the effect of time on pile lateral friction resistance in a coastal foundation treatment project in Japan [12]. Sheil and McCabe used the IFM method to simplify the analysis of pile groups and provided formulas for calculating the relative settlement of pile-soil for single and group piles [13]. Liu Wan et al. investigated the interaction between extra-long friction piles and coastal soft soil, summarizing the trends of pile nodes and internal force distribution in these extra-long friction piles within thick soft soil layers [14]. Yuan Liang et al. conducted an analysis of the bearing capacity of extra-long pile foundations using MIDAS-GTS NX. Their study revealed that the bearing capacity of these pile foundations is primarily influenced by lateral friction resistance. Additionally, it was found that the lateral friction resistance of the pile body is diminished in silty soil [15]. Guo, Yuan et al. calculated the distribution law of the negative friction resistance of pile foundations in a coastal chalk soil area. This study also calculated the pile top load settlement curve based on the principle of equivalent conversion. Moreover, this study discussed the ultimate bearing capacity problem of extra-long piles in offshore silt areas [16]. Jiang and Yang proposed a structural seismic design method based on pile-based bending moment control [17]. Guixuan Rui et al. analyzed the seismic bearing capacity of pile foundations in coastal soft ground and determined the internal force distribution of these foundations during earthquakes [18]. Xu Song et al. addressed the settlement problem caused by the liquefaction of group piles under the action of vertical and horizontal ground vibrations [19]. Zana Karimi et al. identified the key predictive factors for foundation settlement and provided a comprehensive, mechanistically sound dataset for future predictive models [20]. Wang et al. conducted experiments using the slow maintained load method, calculating pile axial forces and shaft resistance based on measured strains [21]. Hussein A.F. et al. investigated the axial load transfer mechanisms in liquefiable and non-liquefiable soil conditions using the finite element method [22]. Mohsen Bagheri et al. evaluated the rationale for selecting the soil behavior model (e.g., Mohr–Coulomb model versus more advanced models such as the Hardening Soil model) based on soil–pile interaction analysis results obtained from ABAQUS software [23]. Ali Asgari et al. investigated the effect of pile spacing on pile group efficiency and settlement in loose coastal soils, determining the optimal spacing for minimizing settlement and maximizing bearing capacity [24].
In summary, substantial research has been conducted on the mechanical properties of pile foundations, yielding remarkable achievements. However, significant gaps remain in the mechanical analysis of long friction pile group foundations in coastal areas for practical engineering design. Currently, such group pile foundations are designed based on single-pile theory, where blindly increasing the pile length or diameter not only leads to material waste but may also compromise structural efficiency. Therefore, further research on the mechanical behavior of pile group foundations is imperative. Additionally, field test studies on friction pile group foundations under complex coastal geological conditions remain scarce. Given that soil conditions in coastal regions differ markedly from those inland, a more thorough analysis of the mechanical characteristics of pile foundations in marine environments is essential. Furthermore, investigating the mechanical properties and seismic performance of pile group foundations in coastal areas holds significant engineering implications.
In this study, based on the actual background of the project, a finite element model of a pile group foundation was established, and the influence of pile spacing on the settlement of the pile group foundation was studied. Under seismic action, the influences of factors such as the length and diameter of the pile group foundation on the settlement of the pile group foundation were analyzed, and the force characteristics of the pile group under seismic action were compared with those under static loading. According to the settlement value of the finite element calculation, the predicted settlement formula of the oversized friction pile group foundation was corrected, and the corrected settlement formula of friction pile group foundation was obtained.

2. Field Test of Foundation Pile

2.1. Geological Conditions Overview

This project was conducted in a representative coastal saline soil zone, characterized by predominant saline alkali soils and brackish aquatic environments. The geological stratification consists principally of marine sedimentary formations. Based on comprehensive analysis of the investigation data, the following determinations were made: The saturated silt lenses embedded within the Holocene medium-series marine sedimentary silty clay layers at depths < 20 m were classified as non-liquefiable strata. The saturated silt lenses occurring in the muddy clay layers demonstrate slight liquefaction potential, with liquefaction indices ranging from 1.02 to 4.60. Engineering conclusion: The site is categorized as having slight liquefaction susceptibility, as shown in Table 1.
Based on field investigation data, the calculated soil parameters are presented in Table 2.
In this study, the bearing size of the field test pile foundation is 12 m × 12 m × 3.5 m, the pile diameter is 1.8 m, and the length is 65 m (Figure 1 and Figure 2).

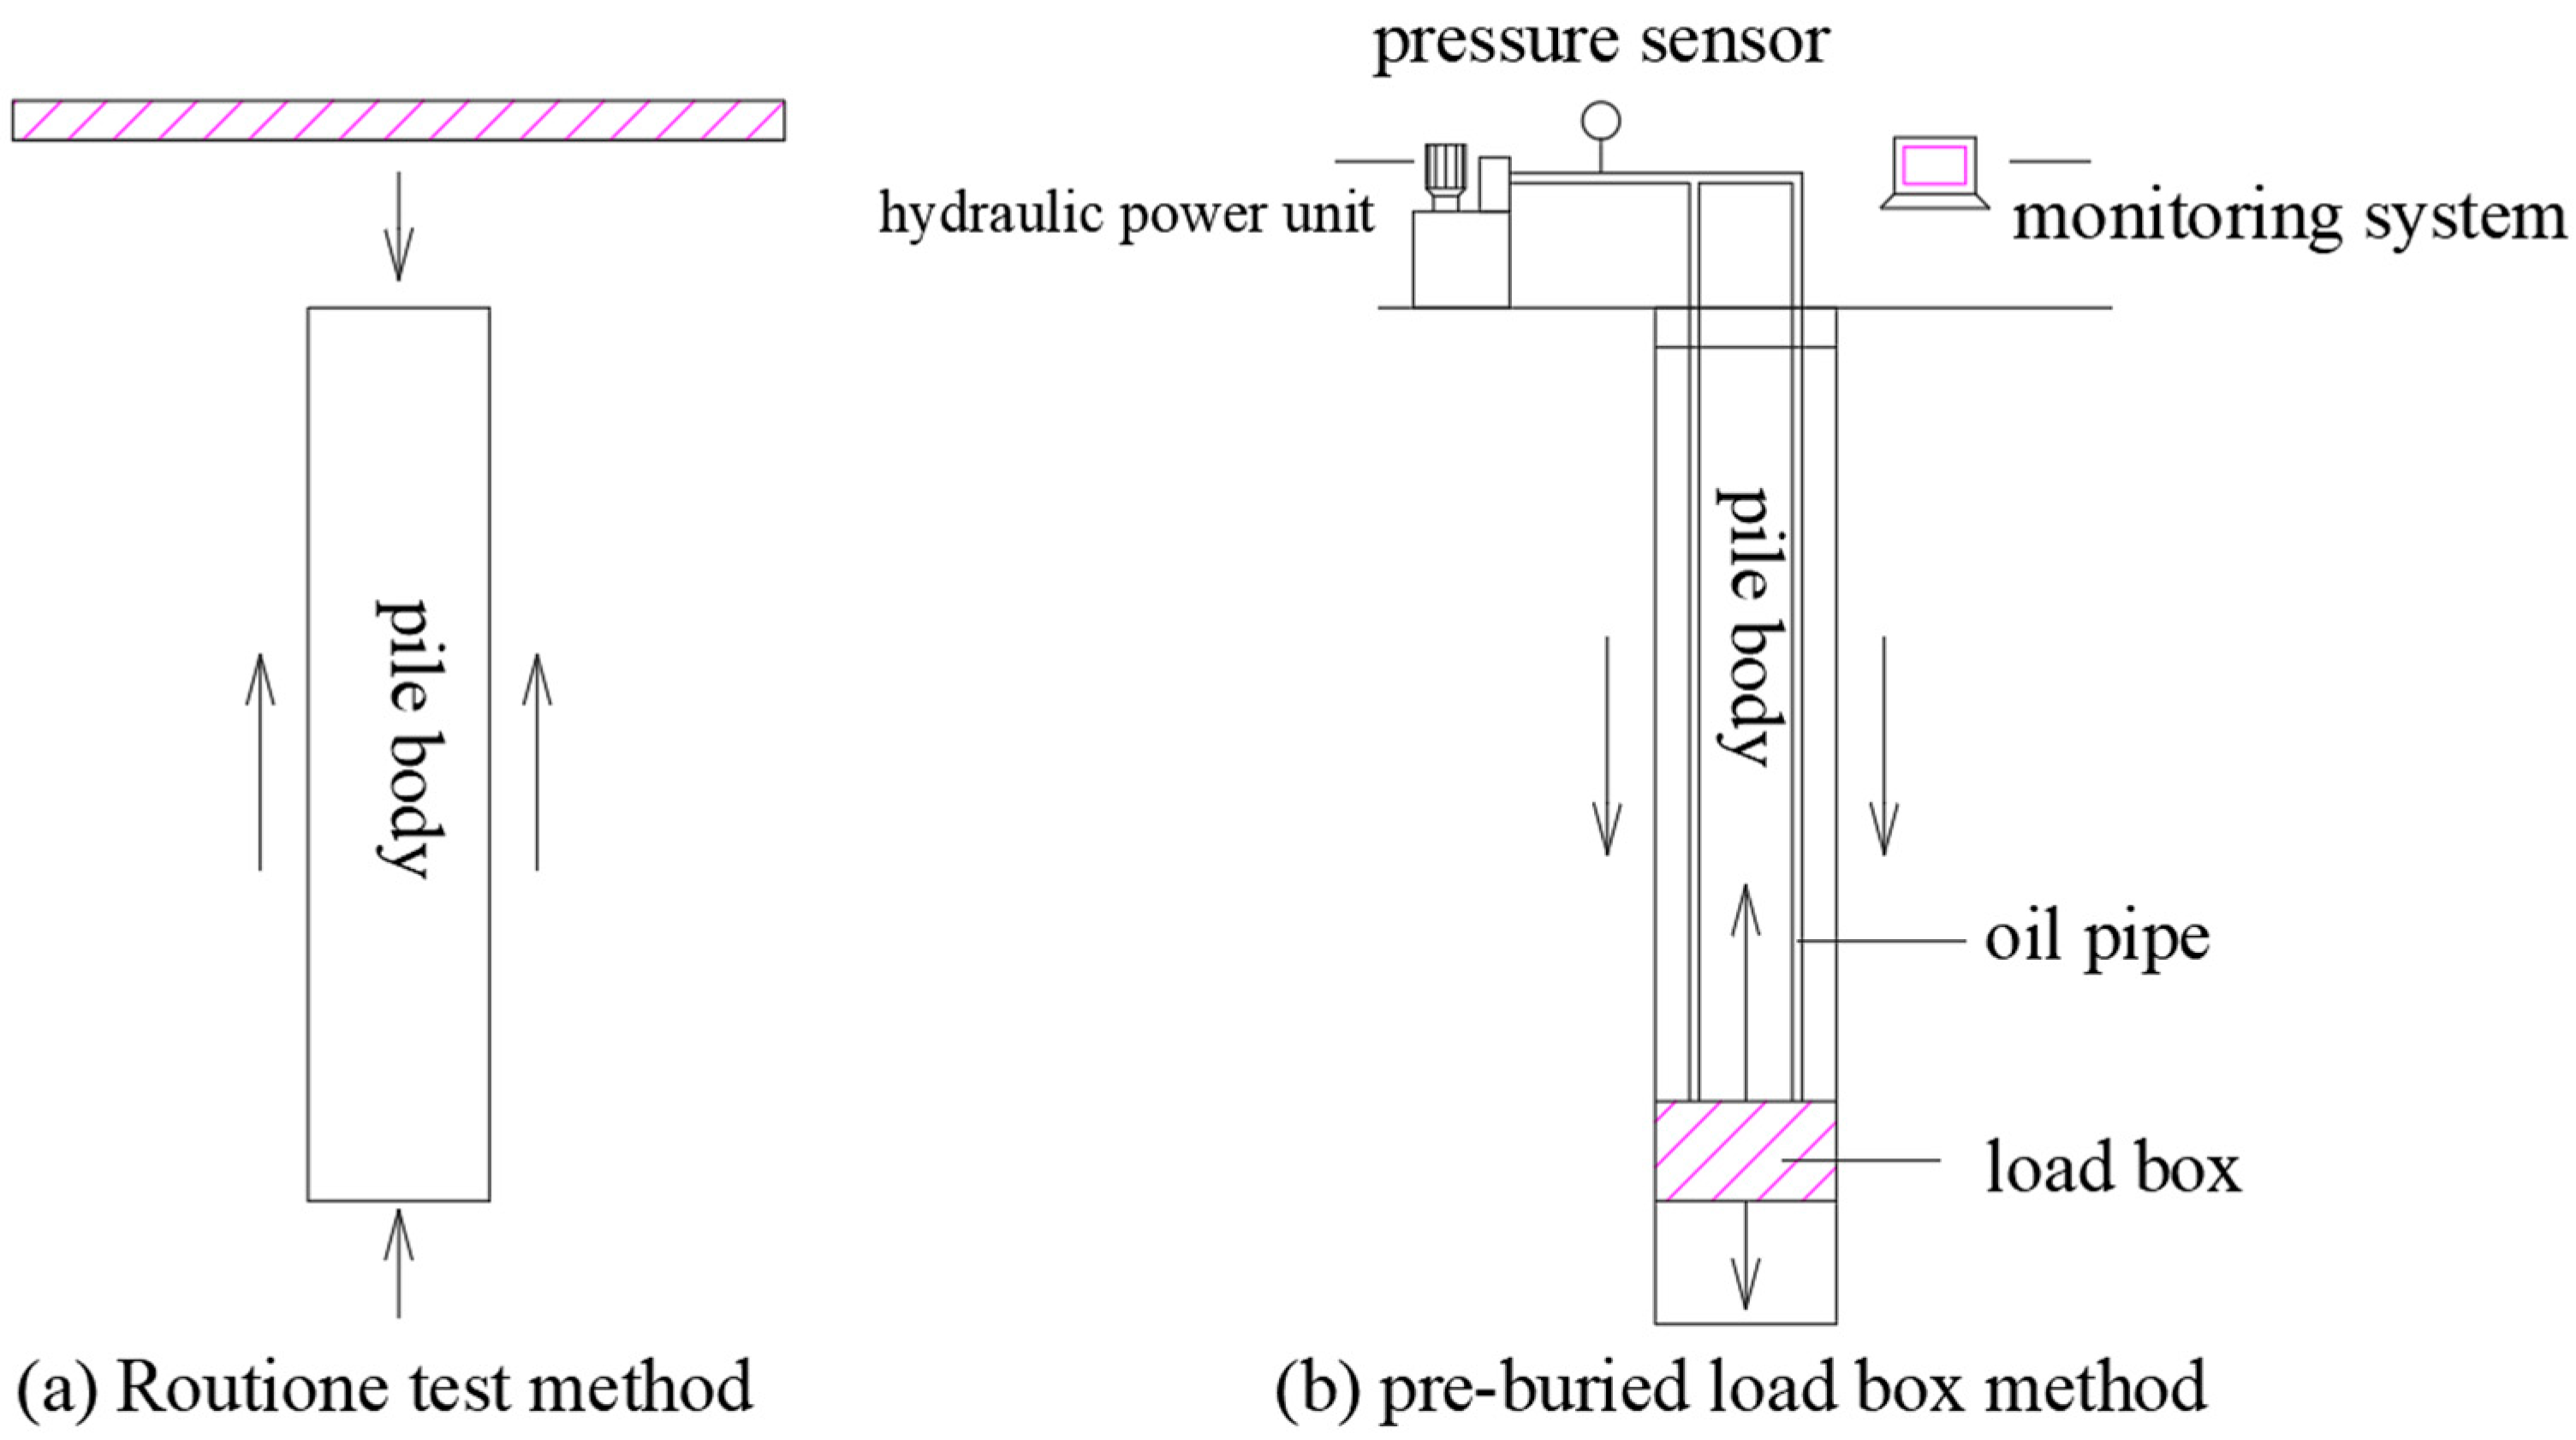
2.2. Choice of Experimental Methods
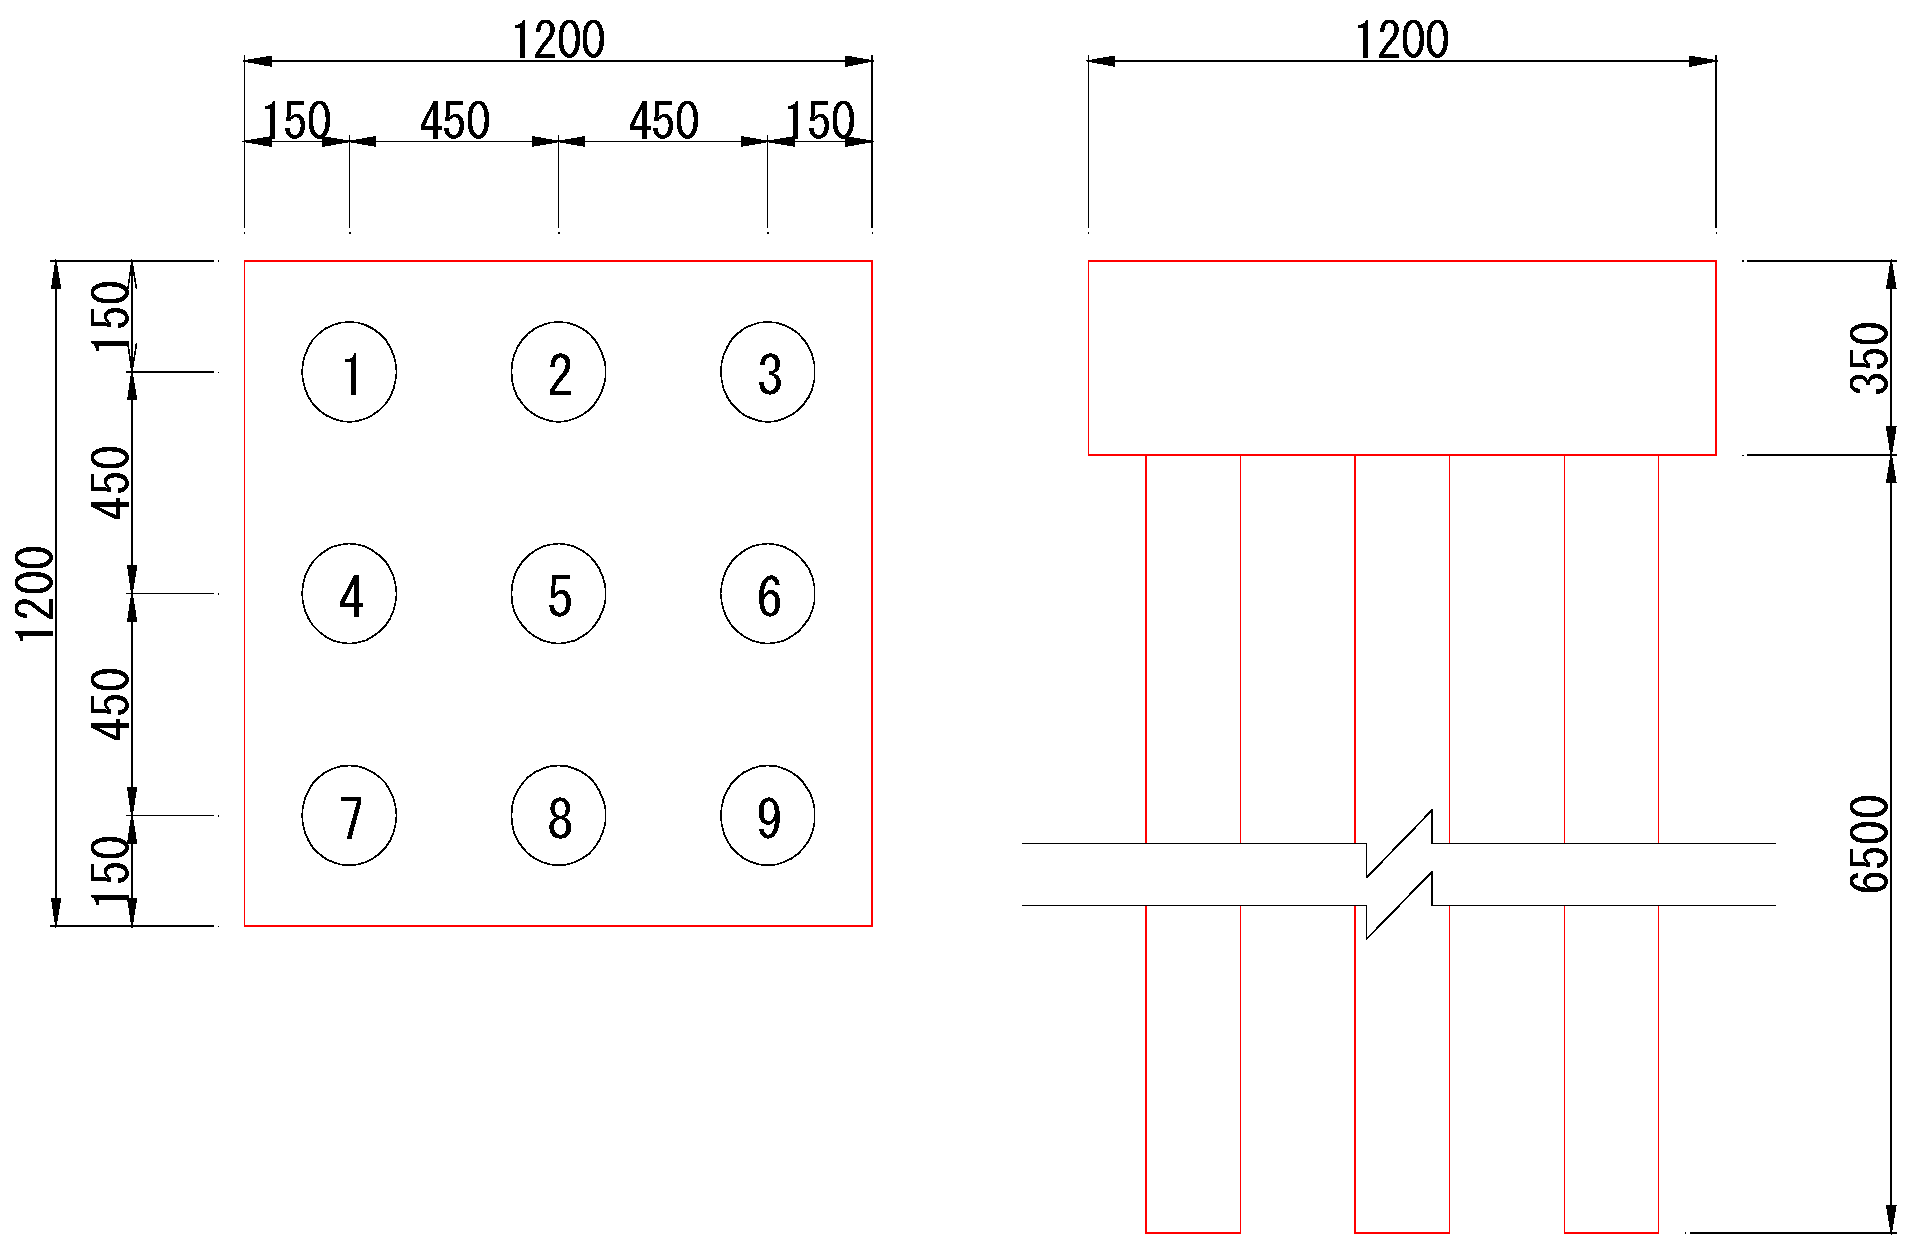
In coastal areas, the soil layers have undergone long-term deposition, resulting in a thick sedimentation layer with poor bearing capacity. Due to on-site environmental constraints and the need to minimize the impact of pile load tests on the construction schedule, the conventional stacked heavy-load method was not used for the pile test, thereby saving on personnel and material resources. This approach prevents potential ground instability caused by a weak foundation bearing capacity, which could otherwise lead to engineering accidents.
The pre-embedded load box method is better suited for special geological conditions such as those in coastal regions. This method shortens the construction period, eliminates the need for transporting large quantities of materials, reduces labor and material costs, and allows for more precise control over the loading process. Considering these factors, the embedded load cell method was selected for this test, as shown in Figure 3.

2.3. Test Program

2.3.1. Loading Method

The field test employed a graded, incremental loading approach. The next loading stage was applied only after the dial gauge readings at the pile top stabilized, repeating this process until all test loading conditions were satisfied. After full loading, the stepwise unloading phase commenced.

2.3.2. Unloading-Stage Settlement Monitoring

During unloading, the slow-maintained load method was adopted, with each unloading step set to twice the magnitude of its corresponding loading step. Following each unloading step, readings were recorded every 15 min. After two consecutive readings, the interval was extended to 30 min before proceeding to the next unloading step. Upon complete unloading (to zero load), readings were taken at 3–4 h intervals.

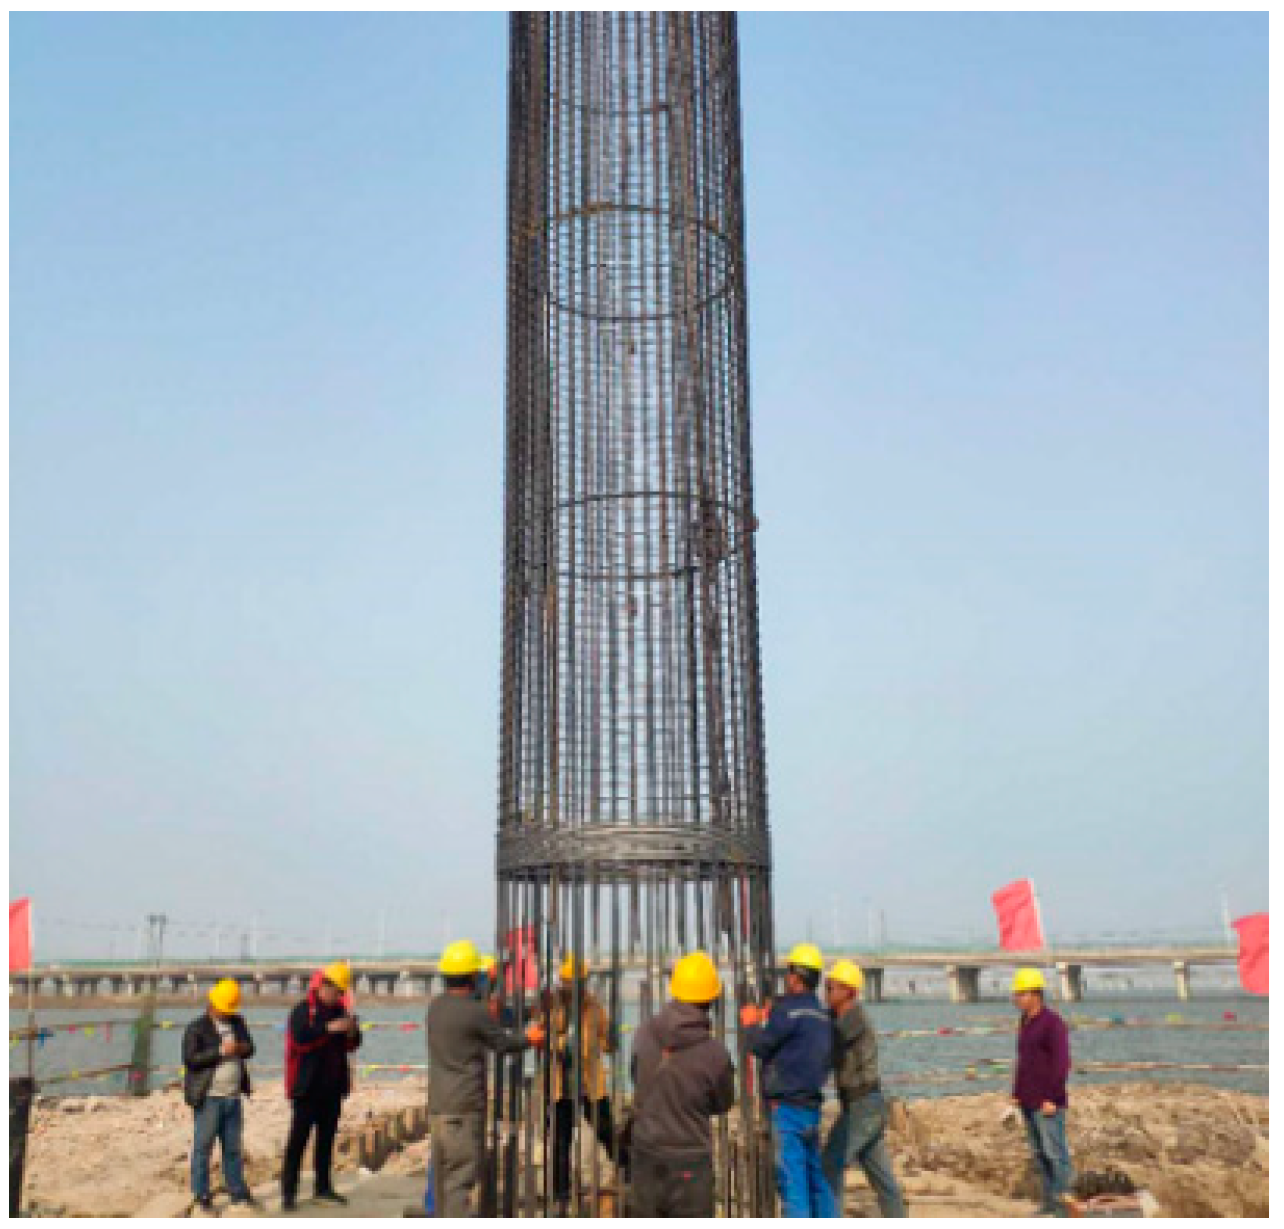
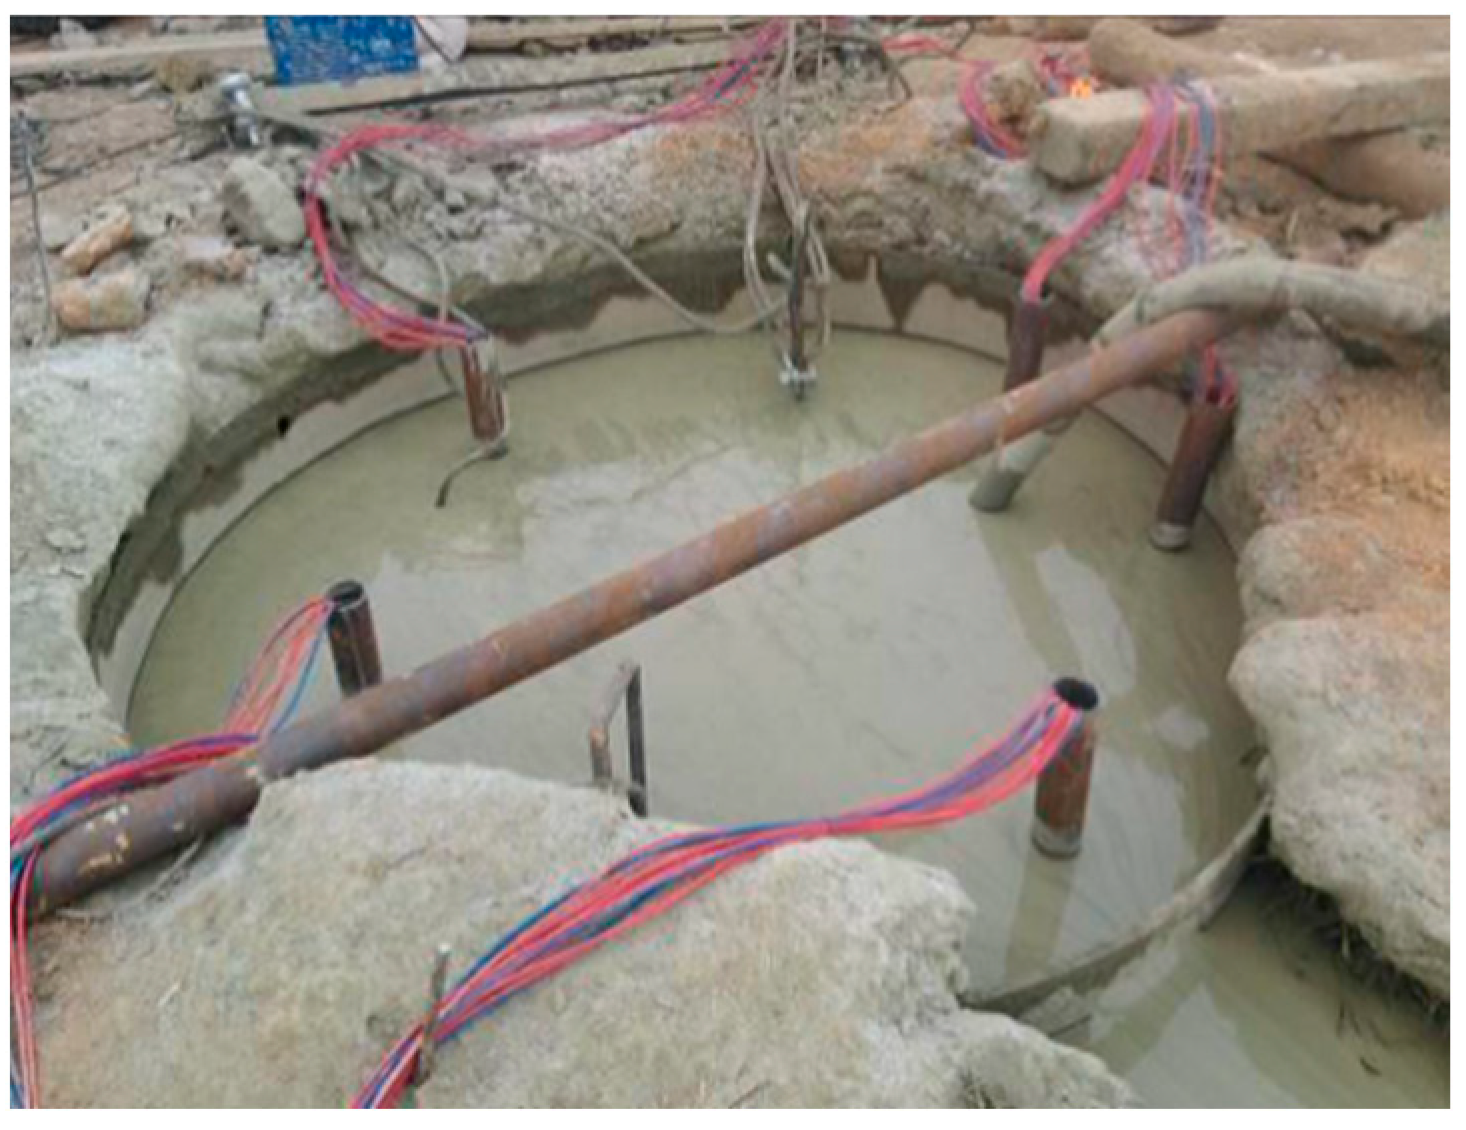
2.3.3. Install Monitoring Instruments

According to the design drawings and monitoring plan, earth pressure cells were embedded in the soil adjacent to the exterior side of the retaining structure, while pre-embedded inclinometer tubes and steel reinforcement strain gauges inside the retaining piles were used as monitoring elements as shown in Figure 4 and Figure 5.

2.3.4. Data Collection

In this test, the loading process of the on-site foundation pile test was monitored in real time using an industrial camera connected to the shooting software supplied by the camera, and the shooting frequency was set to 5000 ms/sheet. Horizontal and normal displacements were measured on the pictures, and the data obtained during the test loading were recorded by transducers to study the magnitude of soil disturbance around the piles via the deformation of pile–soil friction reinforcements at different depths.

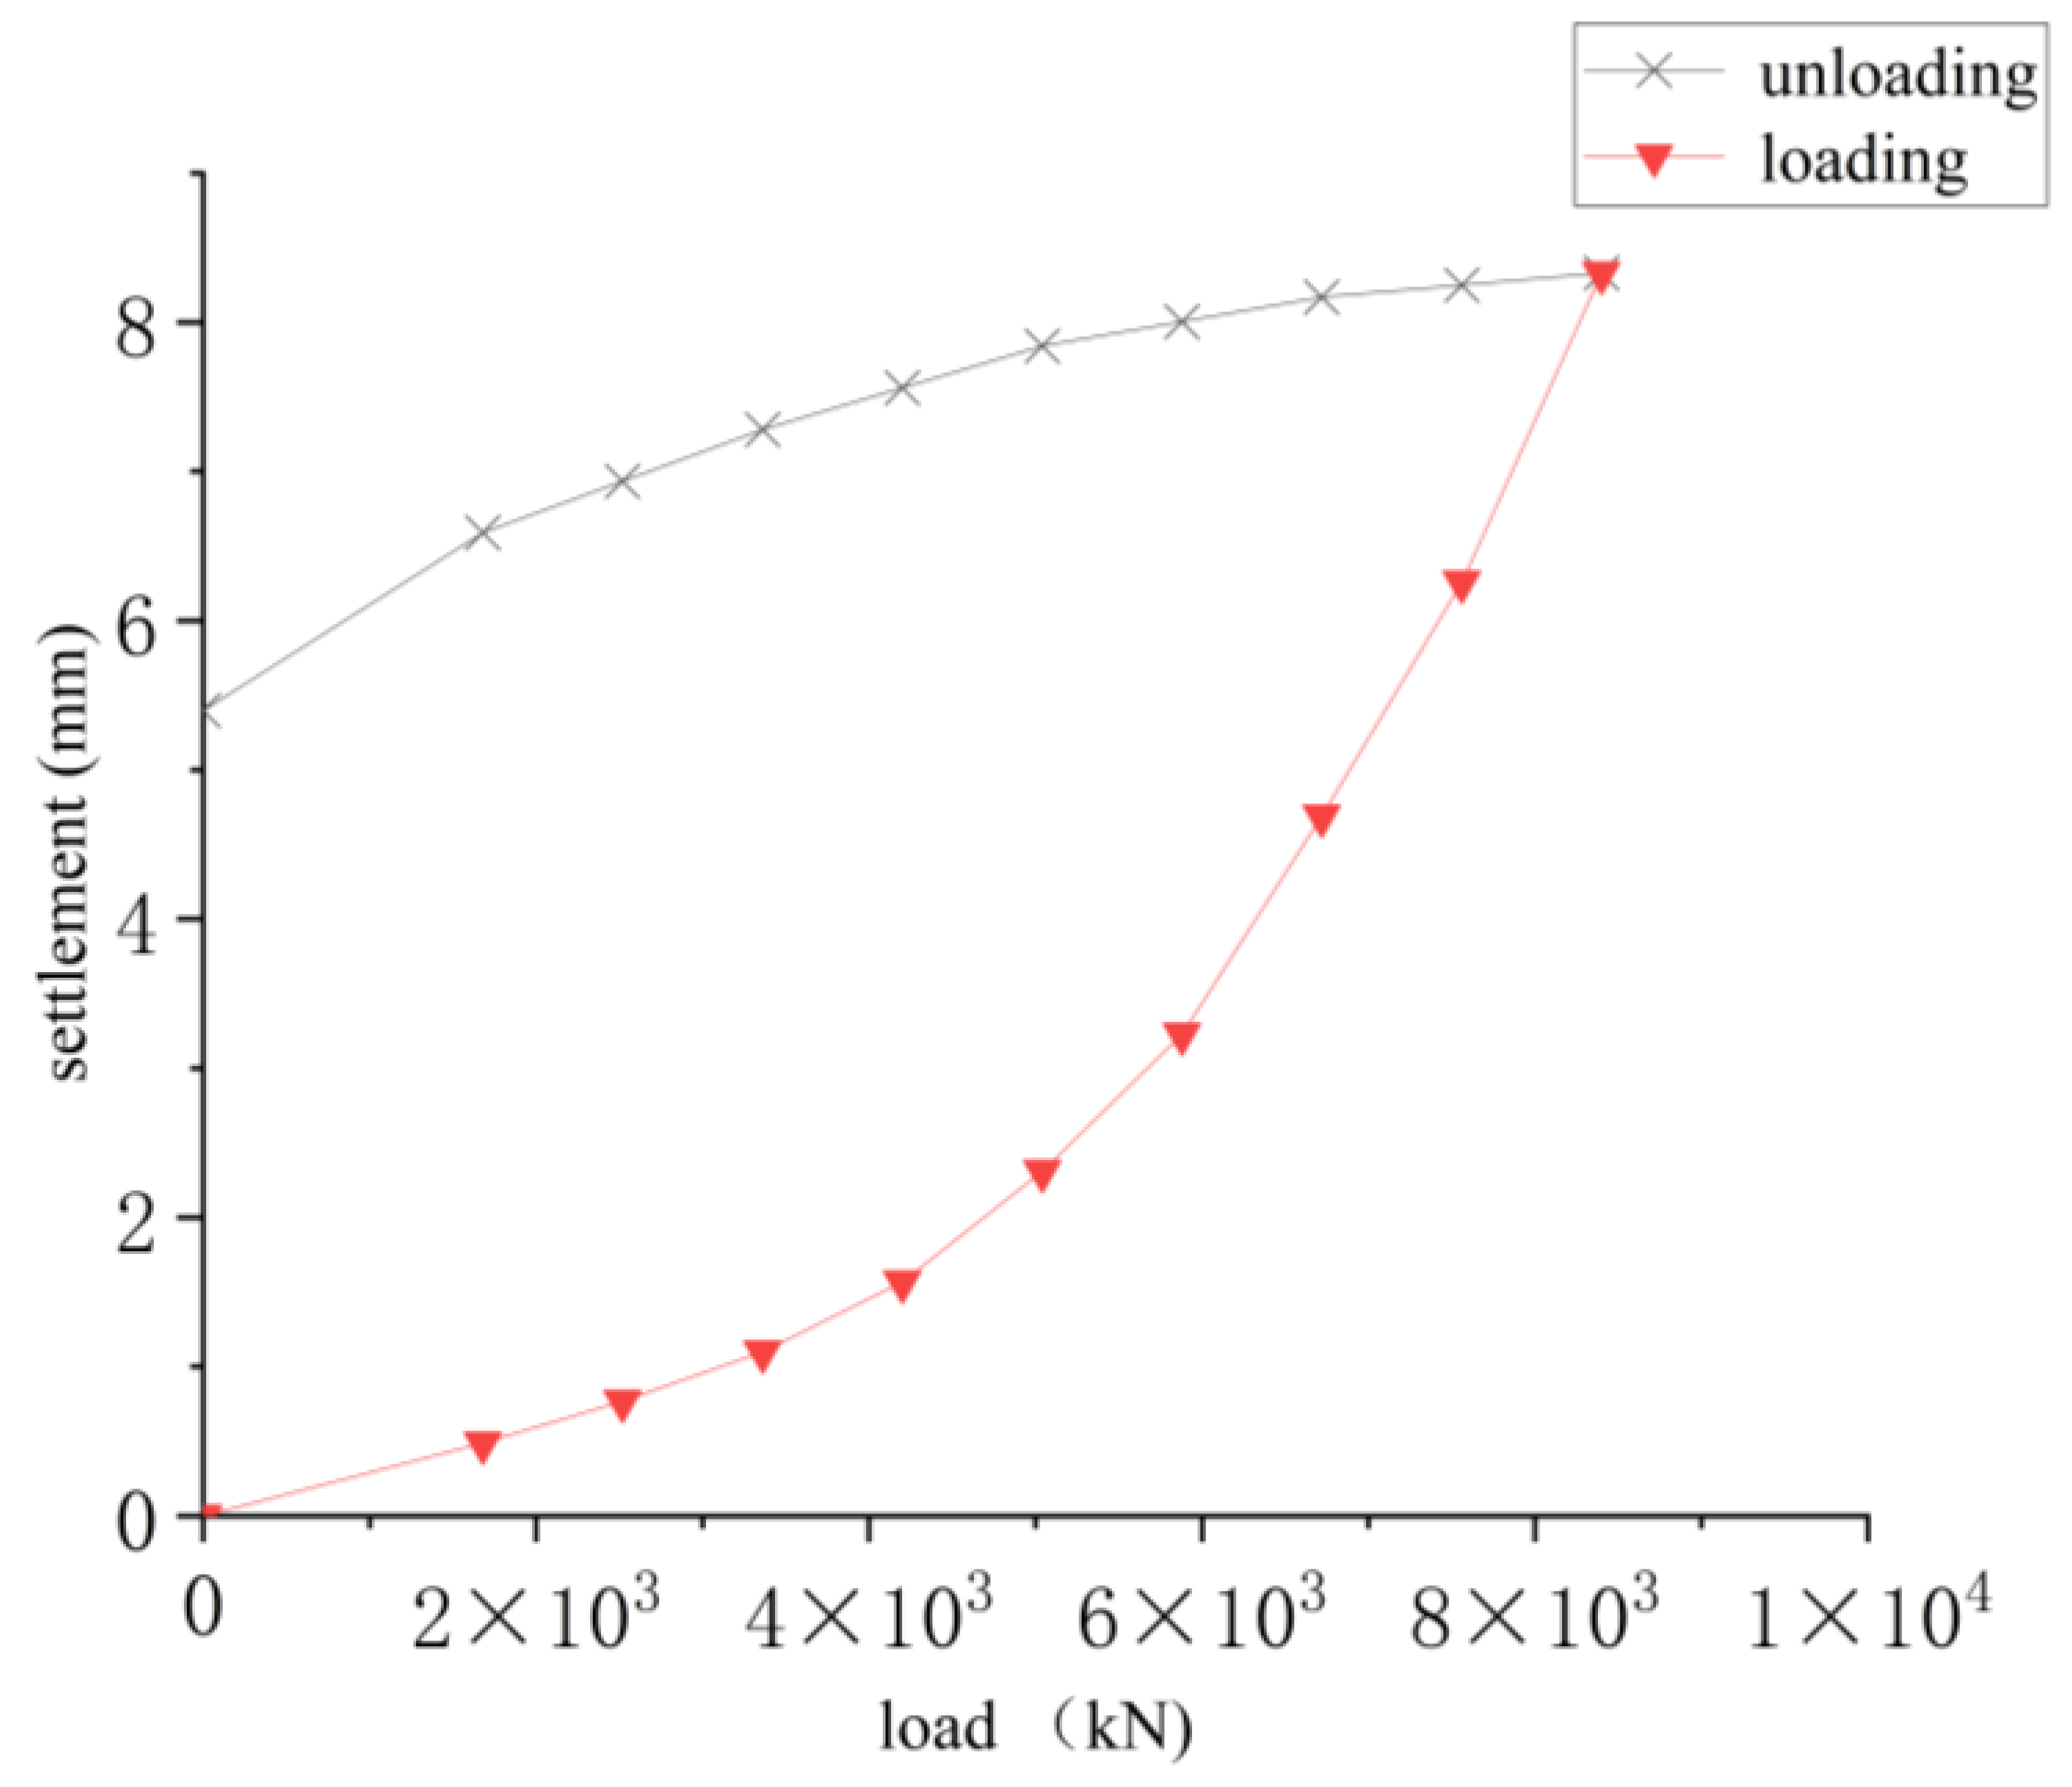
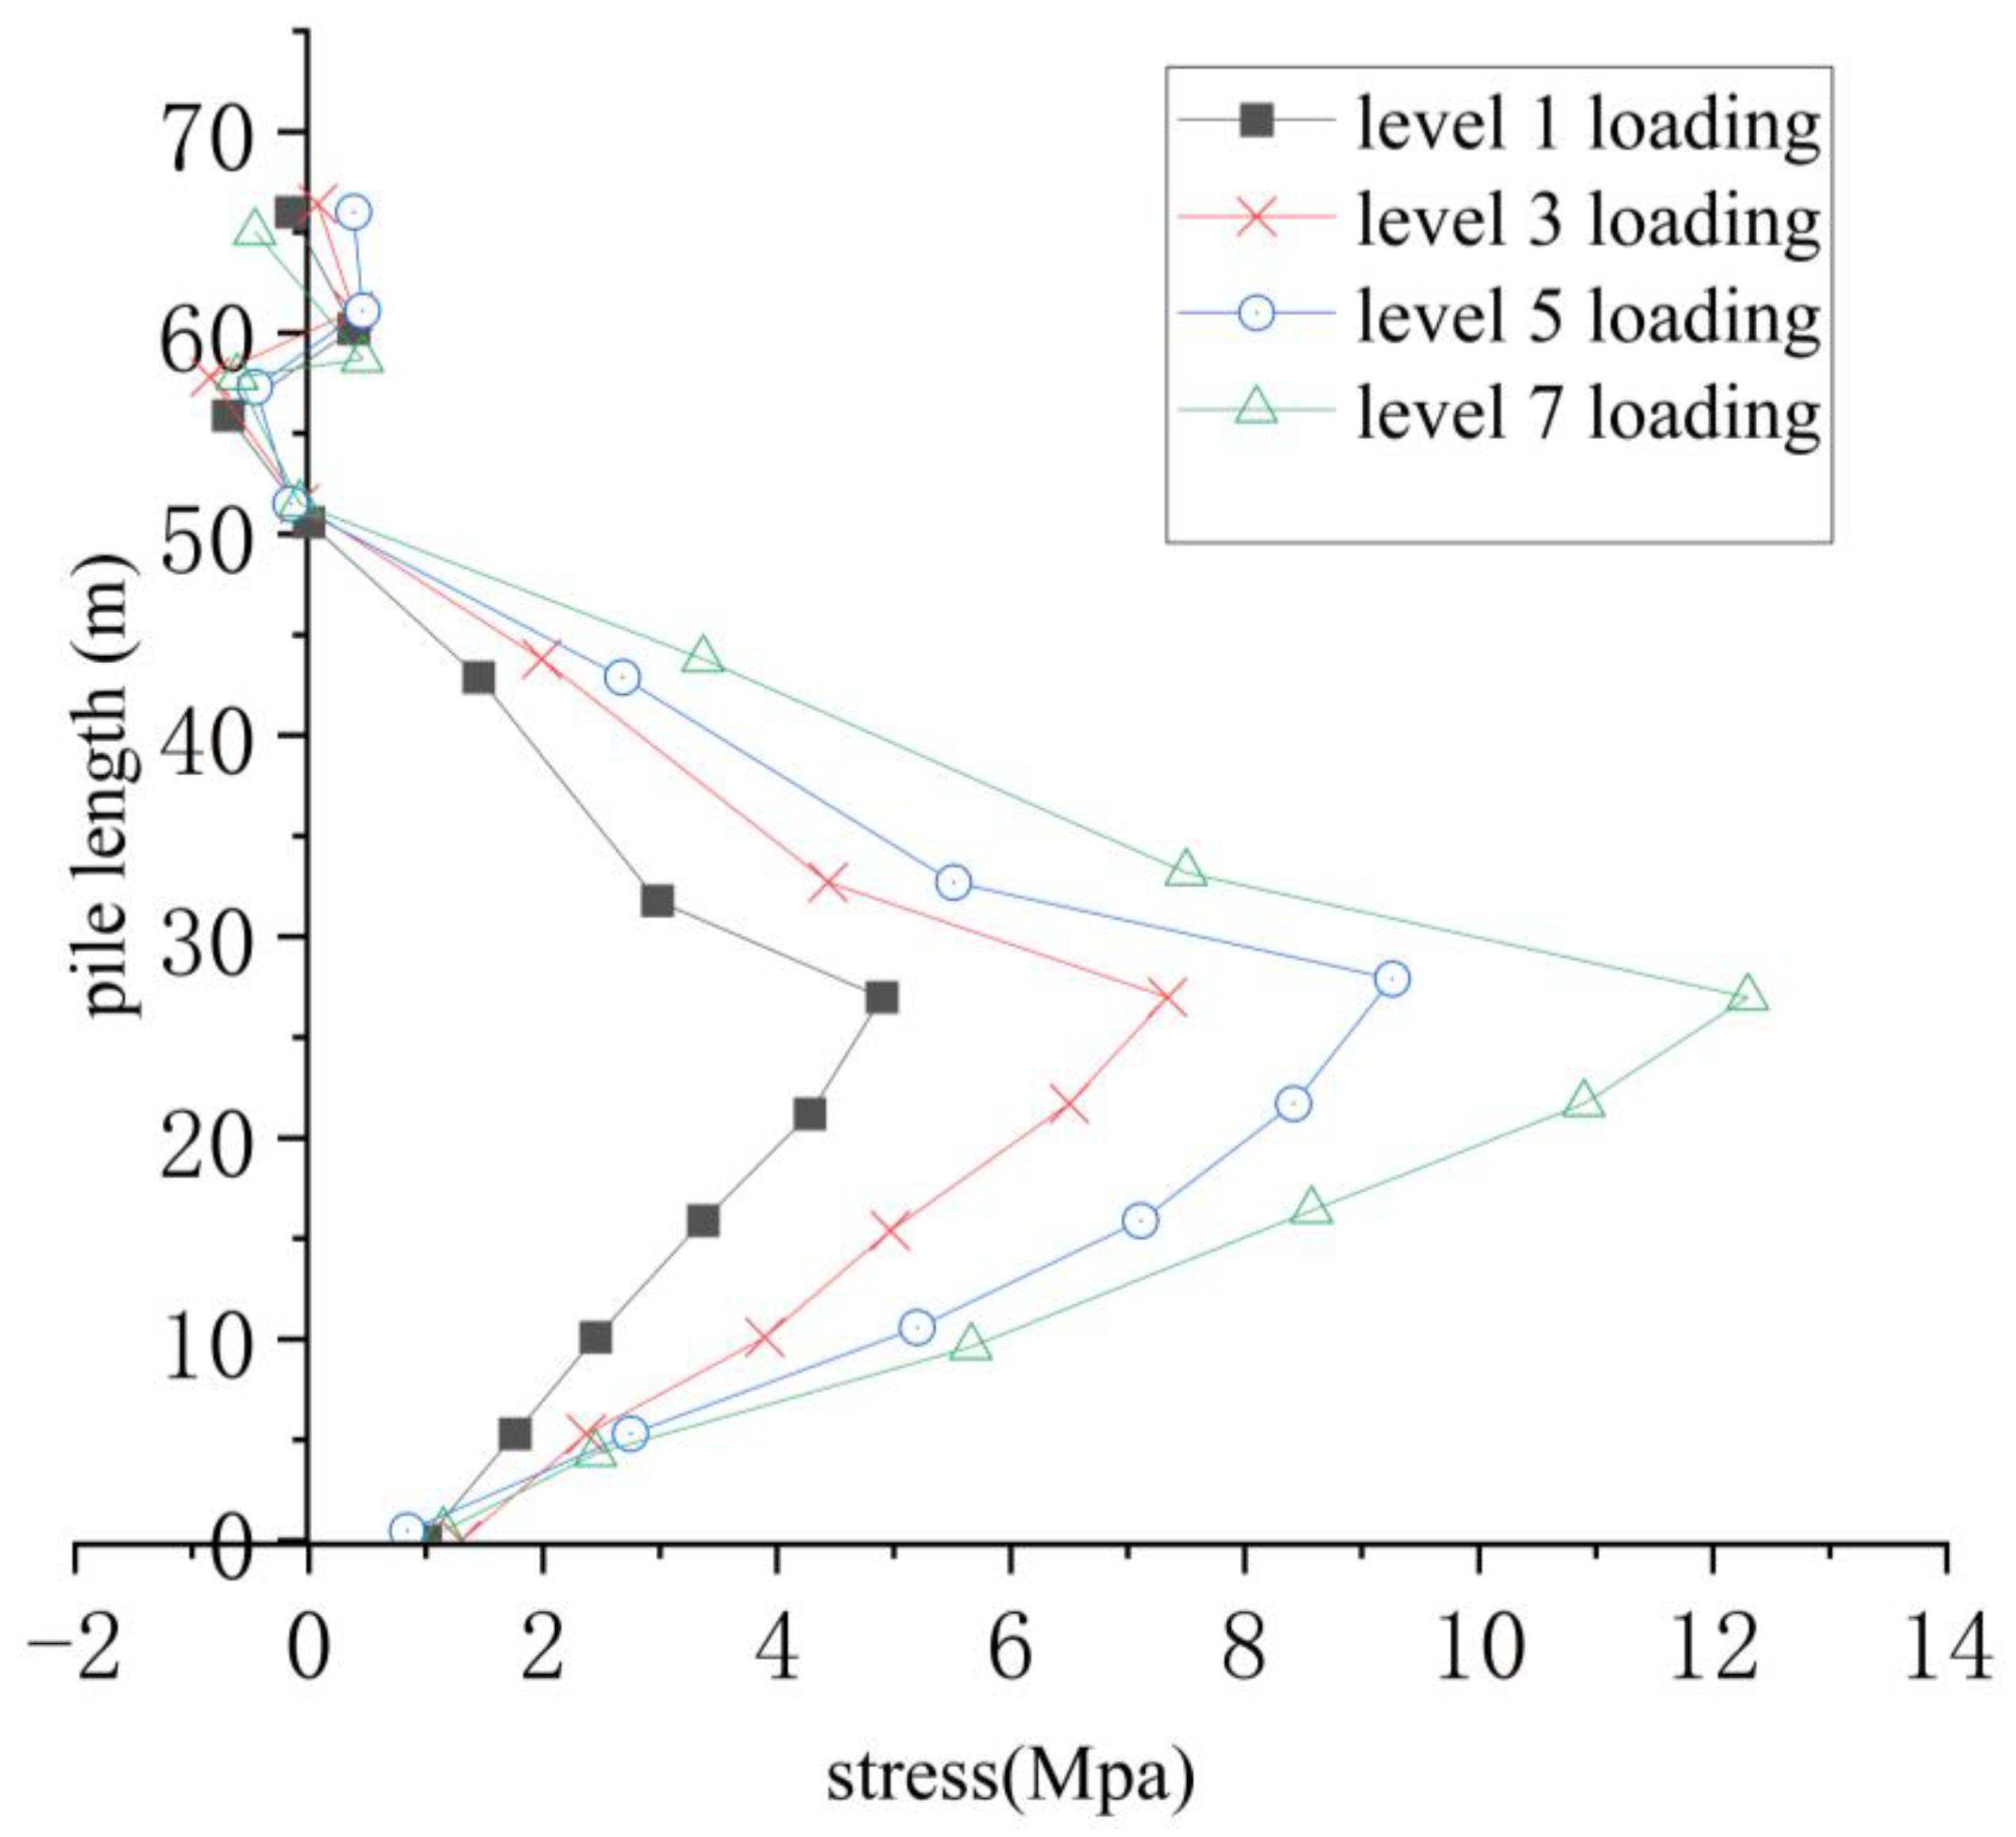
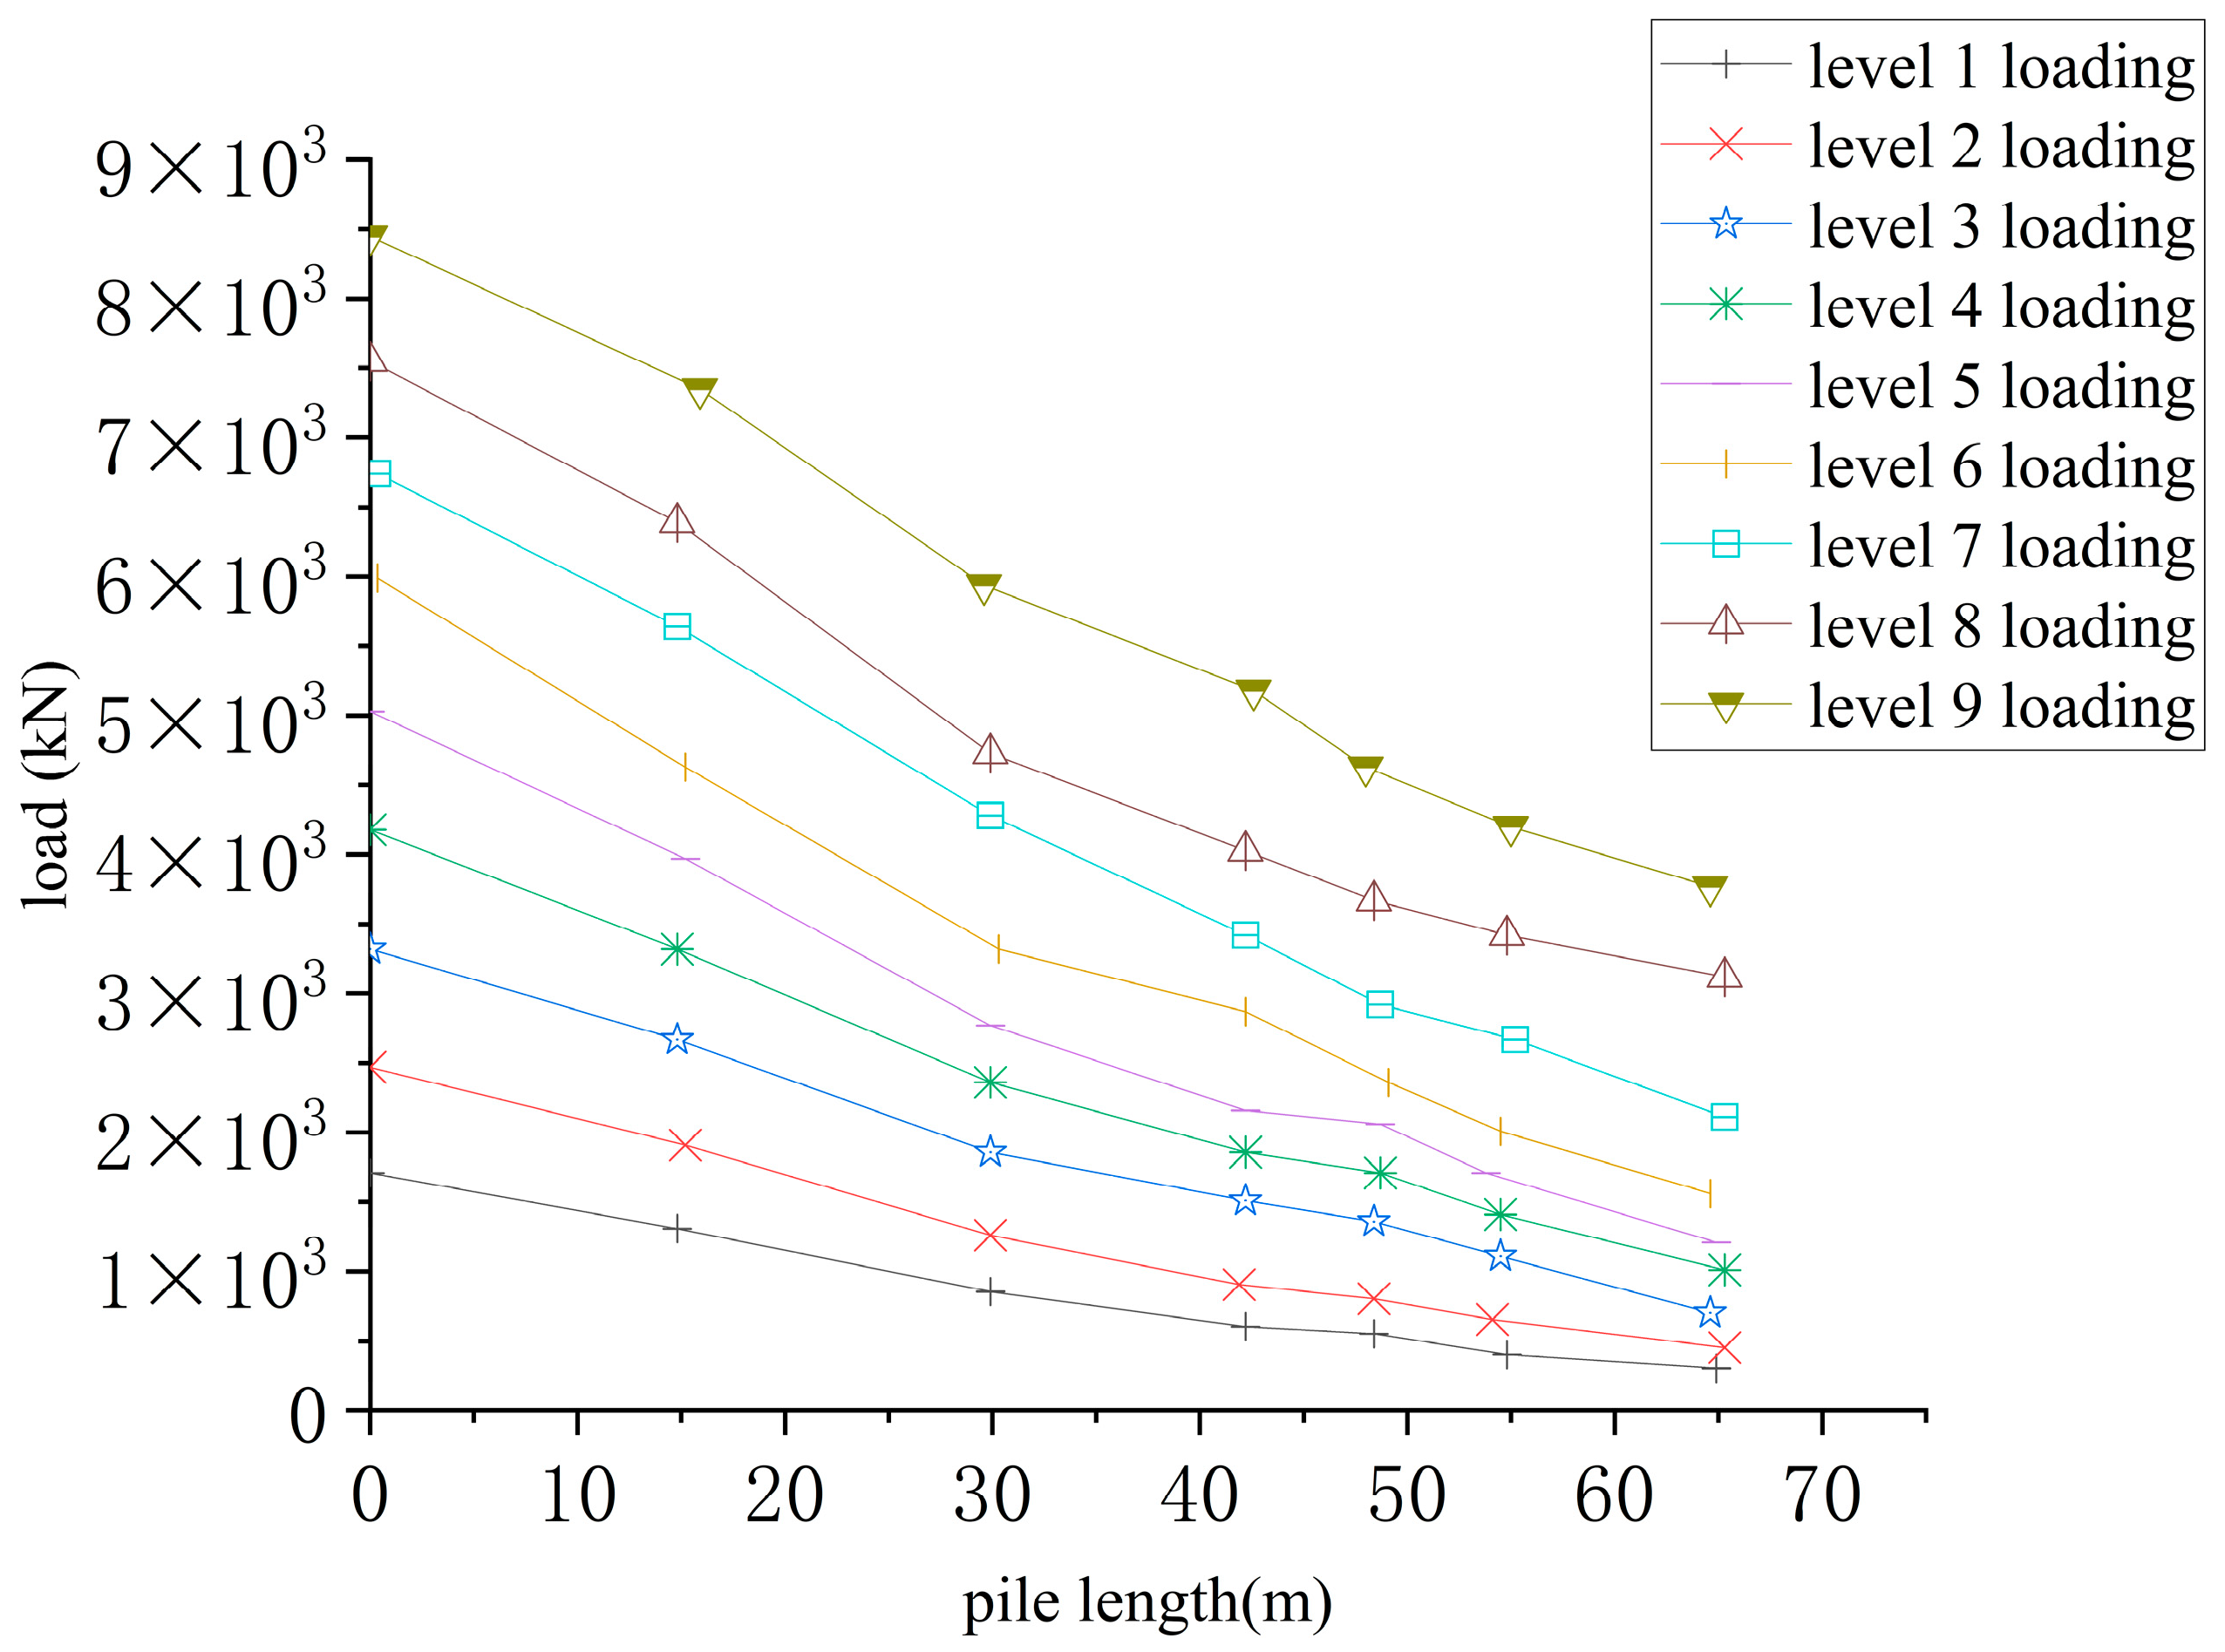
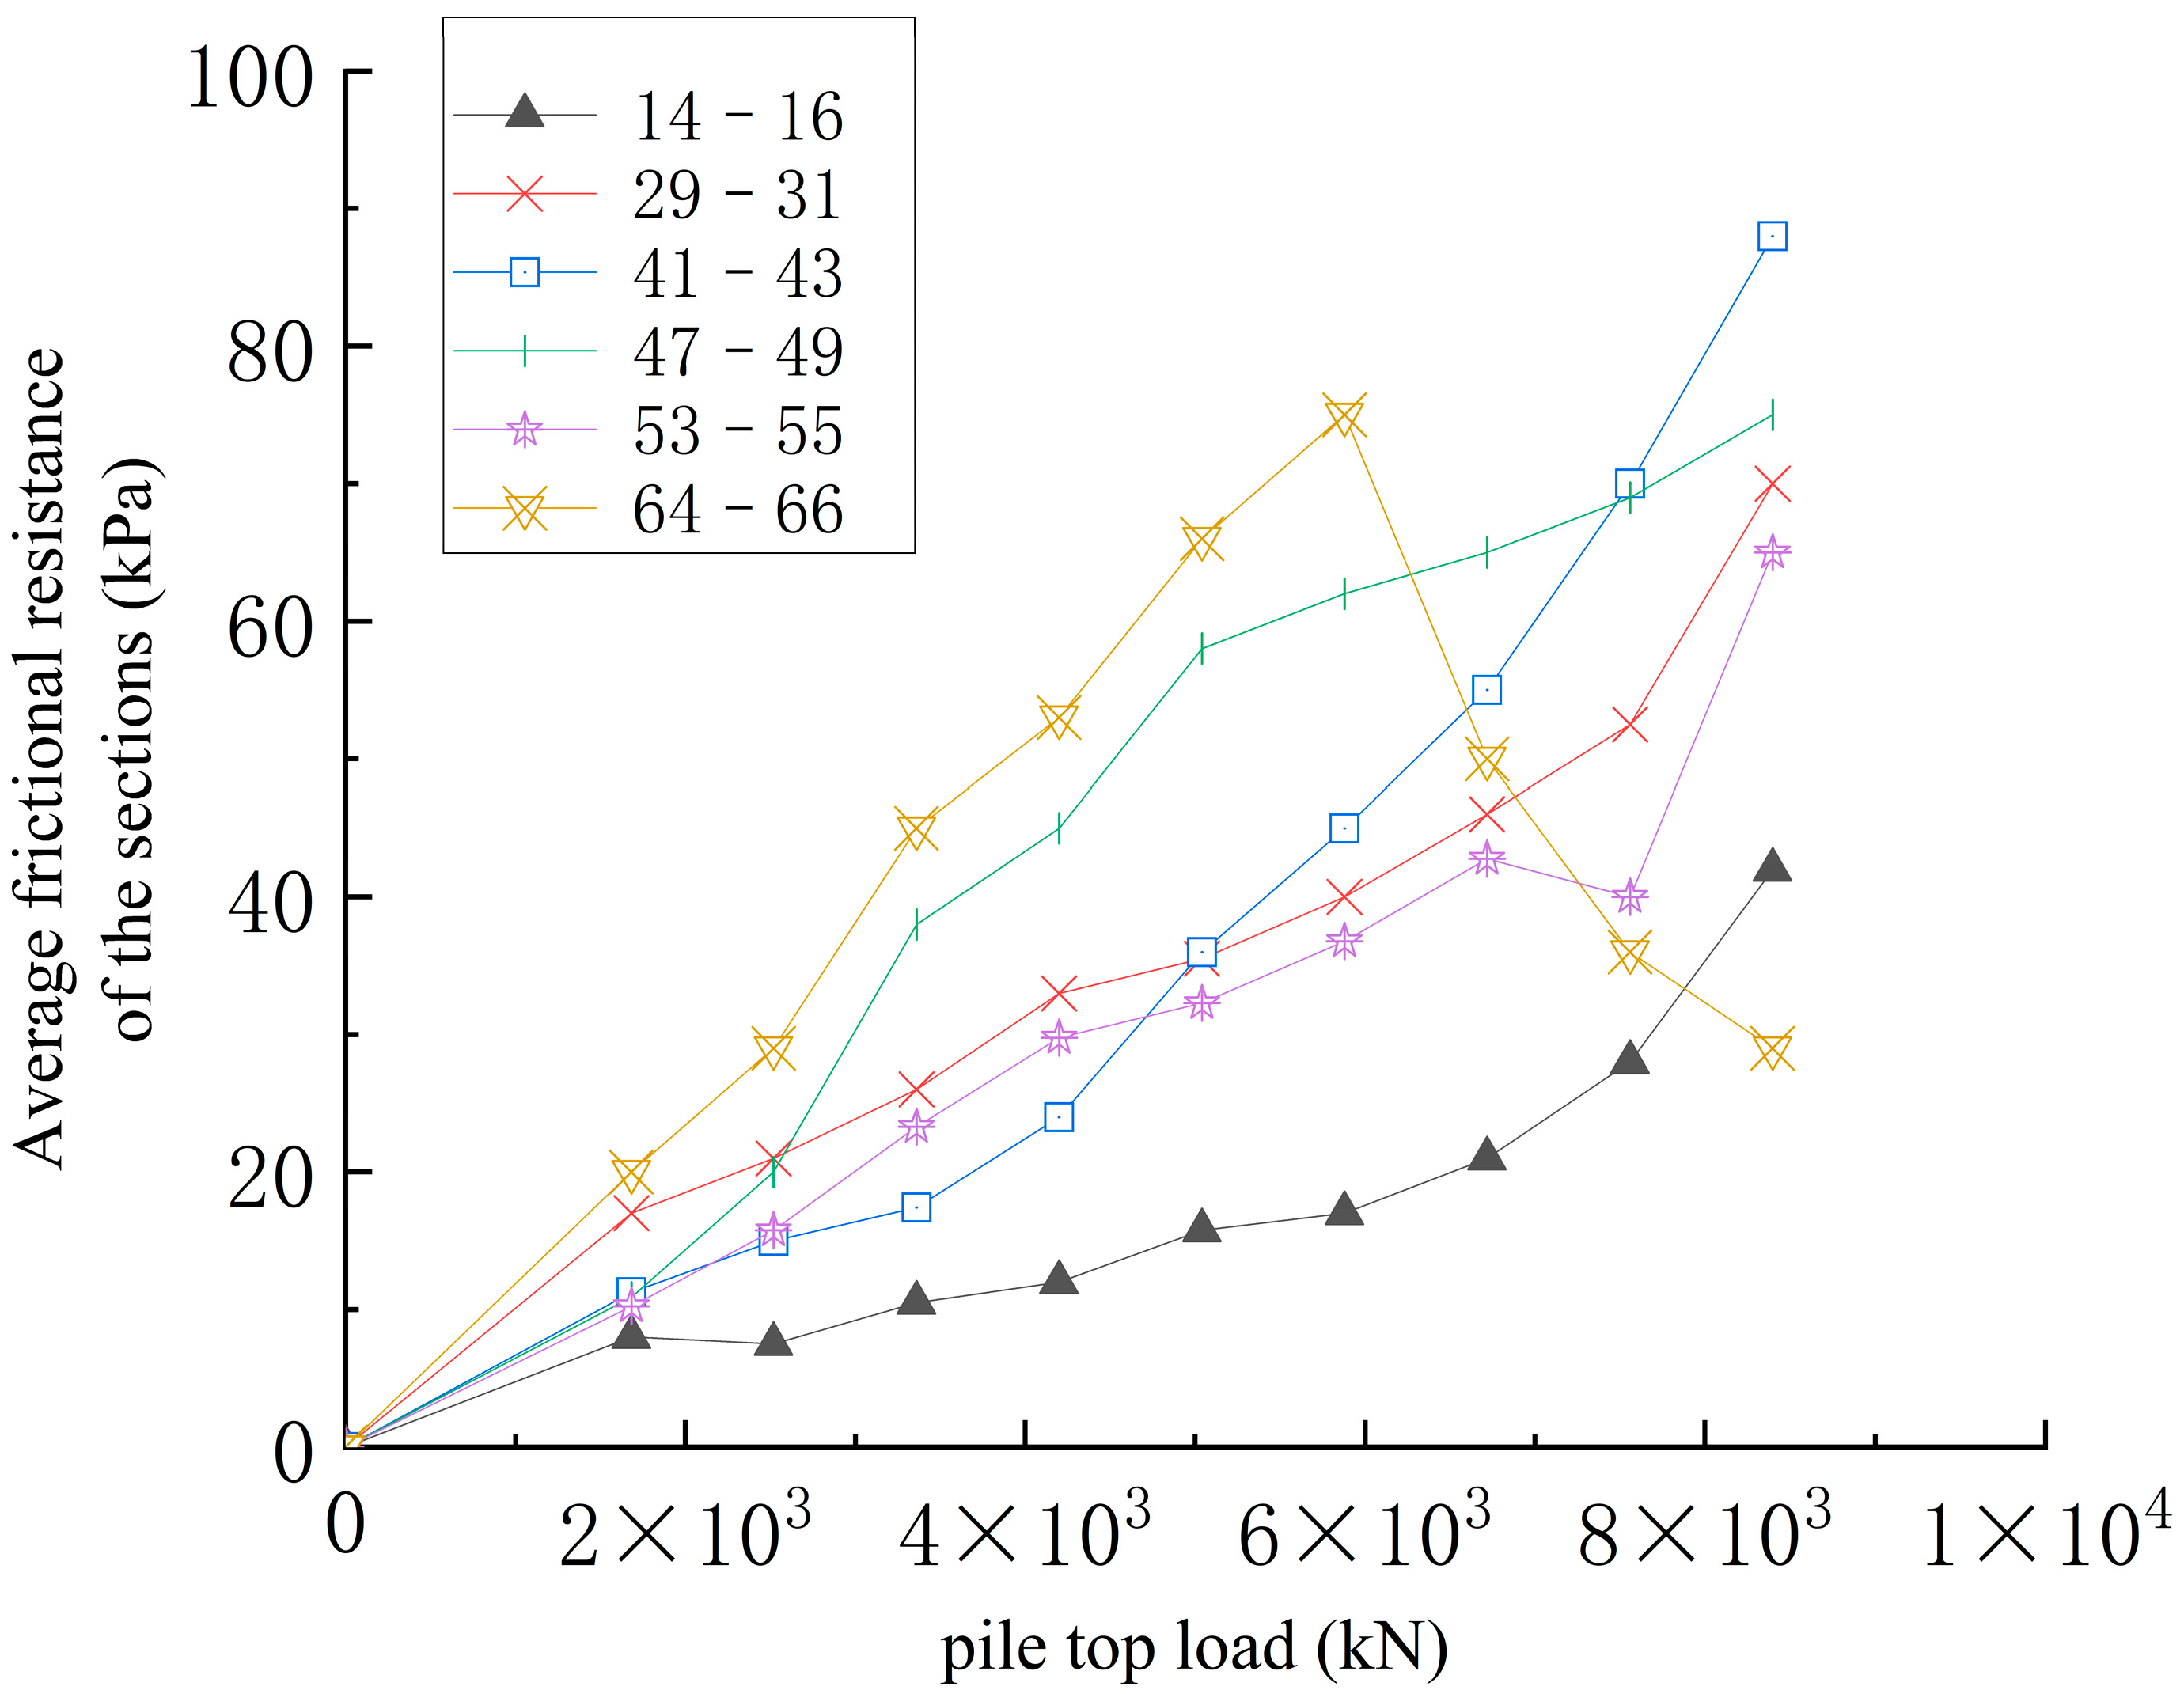
2.4. Analysis of Test Results

According to the load at each level, the measured value of the pile top displacement was obtained from the percentage meter placed on the top of the pile. The curve in Figure 6 shows the relationship between the pile top displacement and vertical load.
As shown in Figure 6, the maximum upward displacement was 8.33 mm, the remaining displacement after unloading was 2.93 mm, and the rebound rate was 35.2%. According to the trend of the load settlement curve, the settlement value gradually increases with an increase in load. In the coastal area, there is no hard rock as the holding layer, and the friction provided by the soil around the pile is dominant. Moreover, the pile foundation does not have puncture damage to the soil body after the application of load, and the soil body is always in the stage of elastic plastic deformation. Hence, the loading and unloading curves are of the rounded and smooth type, and there is no obvious sudden change point.
The stress values were extrapolated based on the strain gauges pre-embedded in the reinforcement and concrete strain gauges, and the stress distribution curve along the pile length was plotted.
Figure 7 shows that the stress value peaks 25–35 m from the pile body. Moreover, the pile body is located in fully weathered mudstone. The fully weathered mudstone is deposited for a long time, and the soil resistance is stronger than that of the upper layer of the soil. With an increase in the depth of the soil layer, the pile foundation is at the end and head of the pile, and the stress value of the reinforcement is smaller. The stress at the pile head is smaller because the pile cap restricts the displacement of the pile head, and the stress at the pile end alternates between positive and negative values. Under better soil conditions at the end of the pile, the programmed reinforcement was subjected to a smaller load than at the top of the pile, and the fully weathered mudstone restricted the displacement of the pile end. After the reinforcement was loaded, it yielded in the strata above the mudstone. Therefore, the stress values of the reinforcement were higher in the soil strata above the mudstone.
The distribution of the axial force and lateral friction resistance along the length of the pile can be deduced from the readings of the concrete and reinforcement strain gauges mounted on the inner side of the pile using a formula.
According to the distribution curve of the axial force along the length of the pile, the axial force gradually decreased after the application of the load. In the coastal area, the soil deposit layer is thicker, and there is no hard rock as the holding layer. With the increase in the soil thickness, the friction pile begins producing the working performance. Moreover, the axial force is transferred to the surrounding soil via interaction between the pile and soil. At this time, the bottom end of the friction pile is subjected to a small portion of the load, and the top end of the pile is subjected to a much greater load. In friction pile structures, piles can uniformly distribute the load into the foundation via pile–soil interactions as shown in Figure 8.
By establishing the equilibrium equations for the vertical differential cell and taking dZ at depth Z of the soil layer, the relationship between the lateral friction resistance and axial force was obtained from the equilibrium condition of the force as follows:
N y q sy μ d y ( N y + d N y ) = 0
q sy = 1 μ d N y d y 1 μ Δ N y Δ y
where µ represents the perimeter of the foundation pile; N y represents the axial force, and q s y represents the lateral friction resistance.
As shown in Figure 9, the different nature of the soil on the pile side, which results in the distribution of the resistance of each soil layer, also produces differences in the soil depth of 30–55 m, which is where the junction of the coarse sand and strongly weathered mudstone layers is located. The two types of soil layer hardness are different. Thus, the resistance produces different degrees of mutation, and the overall trend of the pile side of the resistance to the pile causes an increase in the deformation of the pile of the vertical settlement with the increase in the load. Hence, the resistance by the soil body gradually increases. The deformation of the fully differentiated mudstone layer is smaller than that of the coarse sand layer, which results in a steep drop in the value of the frictional resistance. Moreover, when the vertical settlement deformation of the pile increases to the limit value, the frictional resistance of the pile in part of the soil layer still fails to be fully utilized to the limit value.
From the curve of the load transfer law shown in Figure 10, the load gradually increases, the deformation produced by the pile body to the soil increases, the soil hinders the pile body from moving downward, and the friction force plays a role. The value of the friction force increases gradually with the increase in the load value, and the trends of change of all levels of the load are similar. For the last level of the load test, the trend of change in the load is different; however, the sensor in this part may be damaged and lose functionality.

3. Finite Element Analysis of Friction Base Pile Force Characteristics

3.1. Establishment of a Base Pile Finite Element Model

In the foundation pile loading test, the side piles were loaded. The diameters of the loaded foundation piles were 1.8 m, and the length of the pile was 65 m. The same dimensions were used for the ABAQUS finite element simulations. The Mohr–Coulomb model was selected for the soil body. The contact surface between the foundation pile and soil was set up as a face-to-face contact unit. It was assumed that there was a relative sliding displacement at the pile–soil interface as shown in Figure 11. Table 3 lists the soil layer parameters.

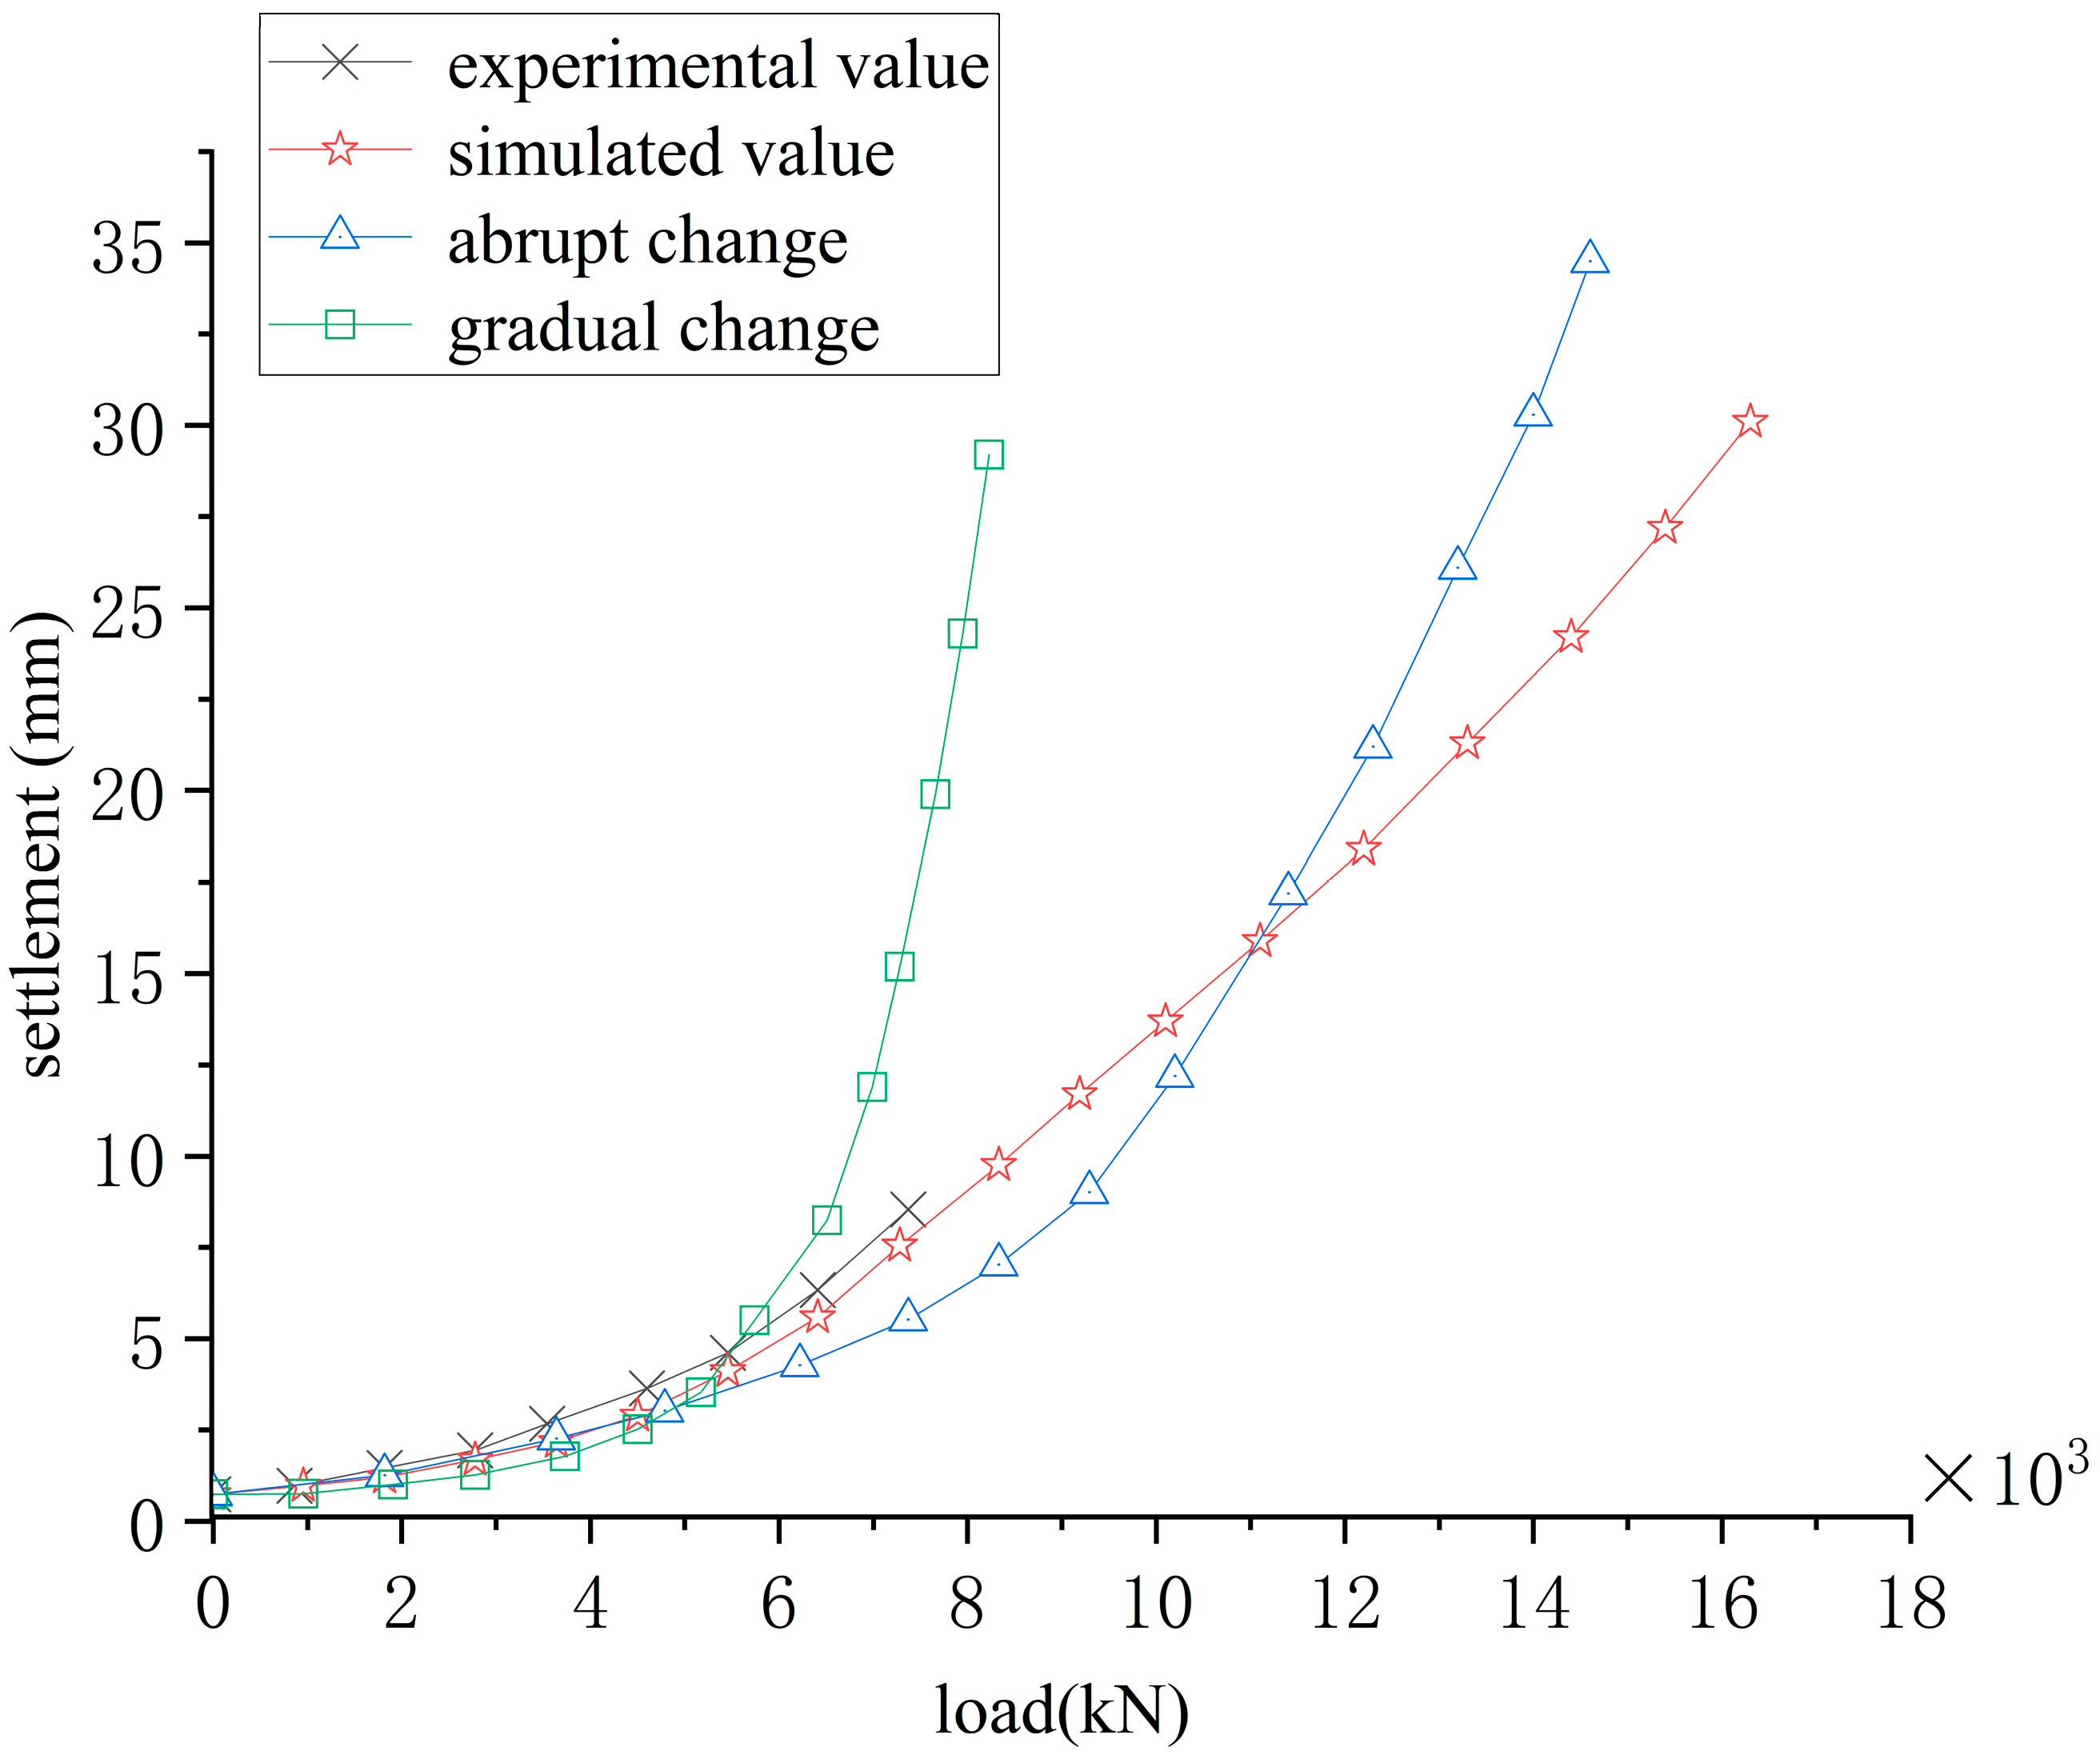
3.2. Analysis of Finite Element Calculation Results

The values of the stresses and bending moments were deduced from these equations as shown in Figure 12. Two common types of slow change and steep drop load settlement curves were introduced for pile settlement in foundation engineering [25].

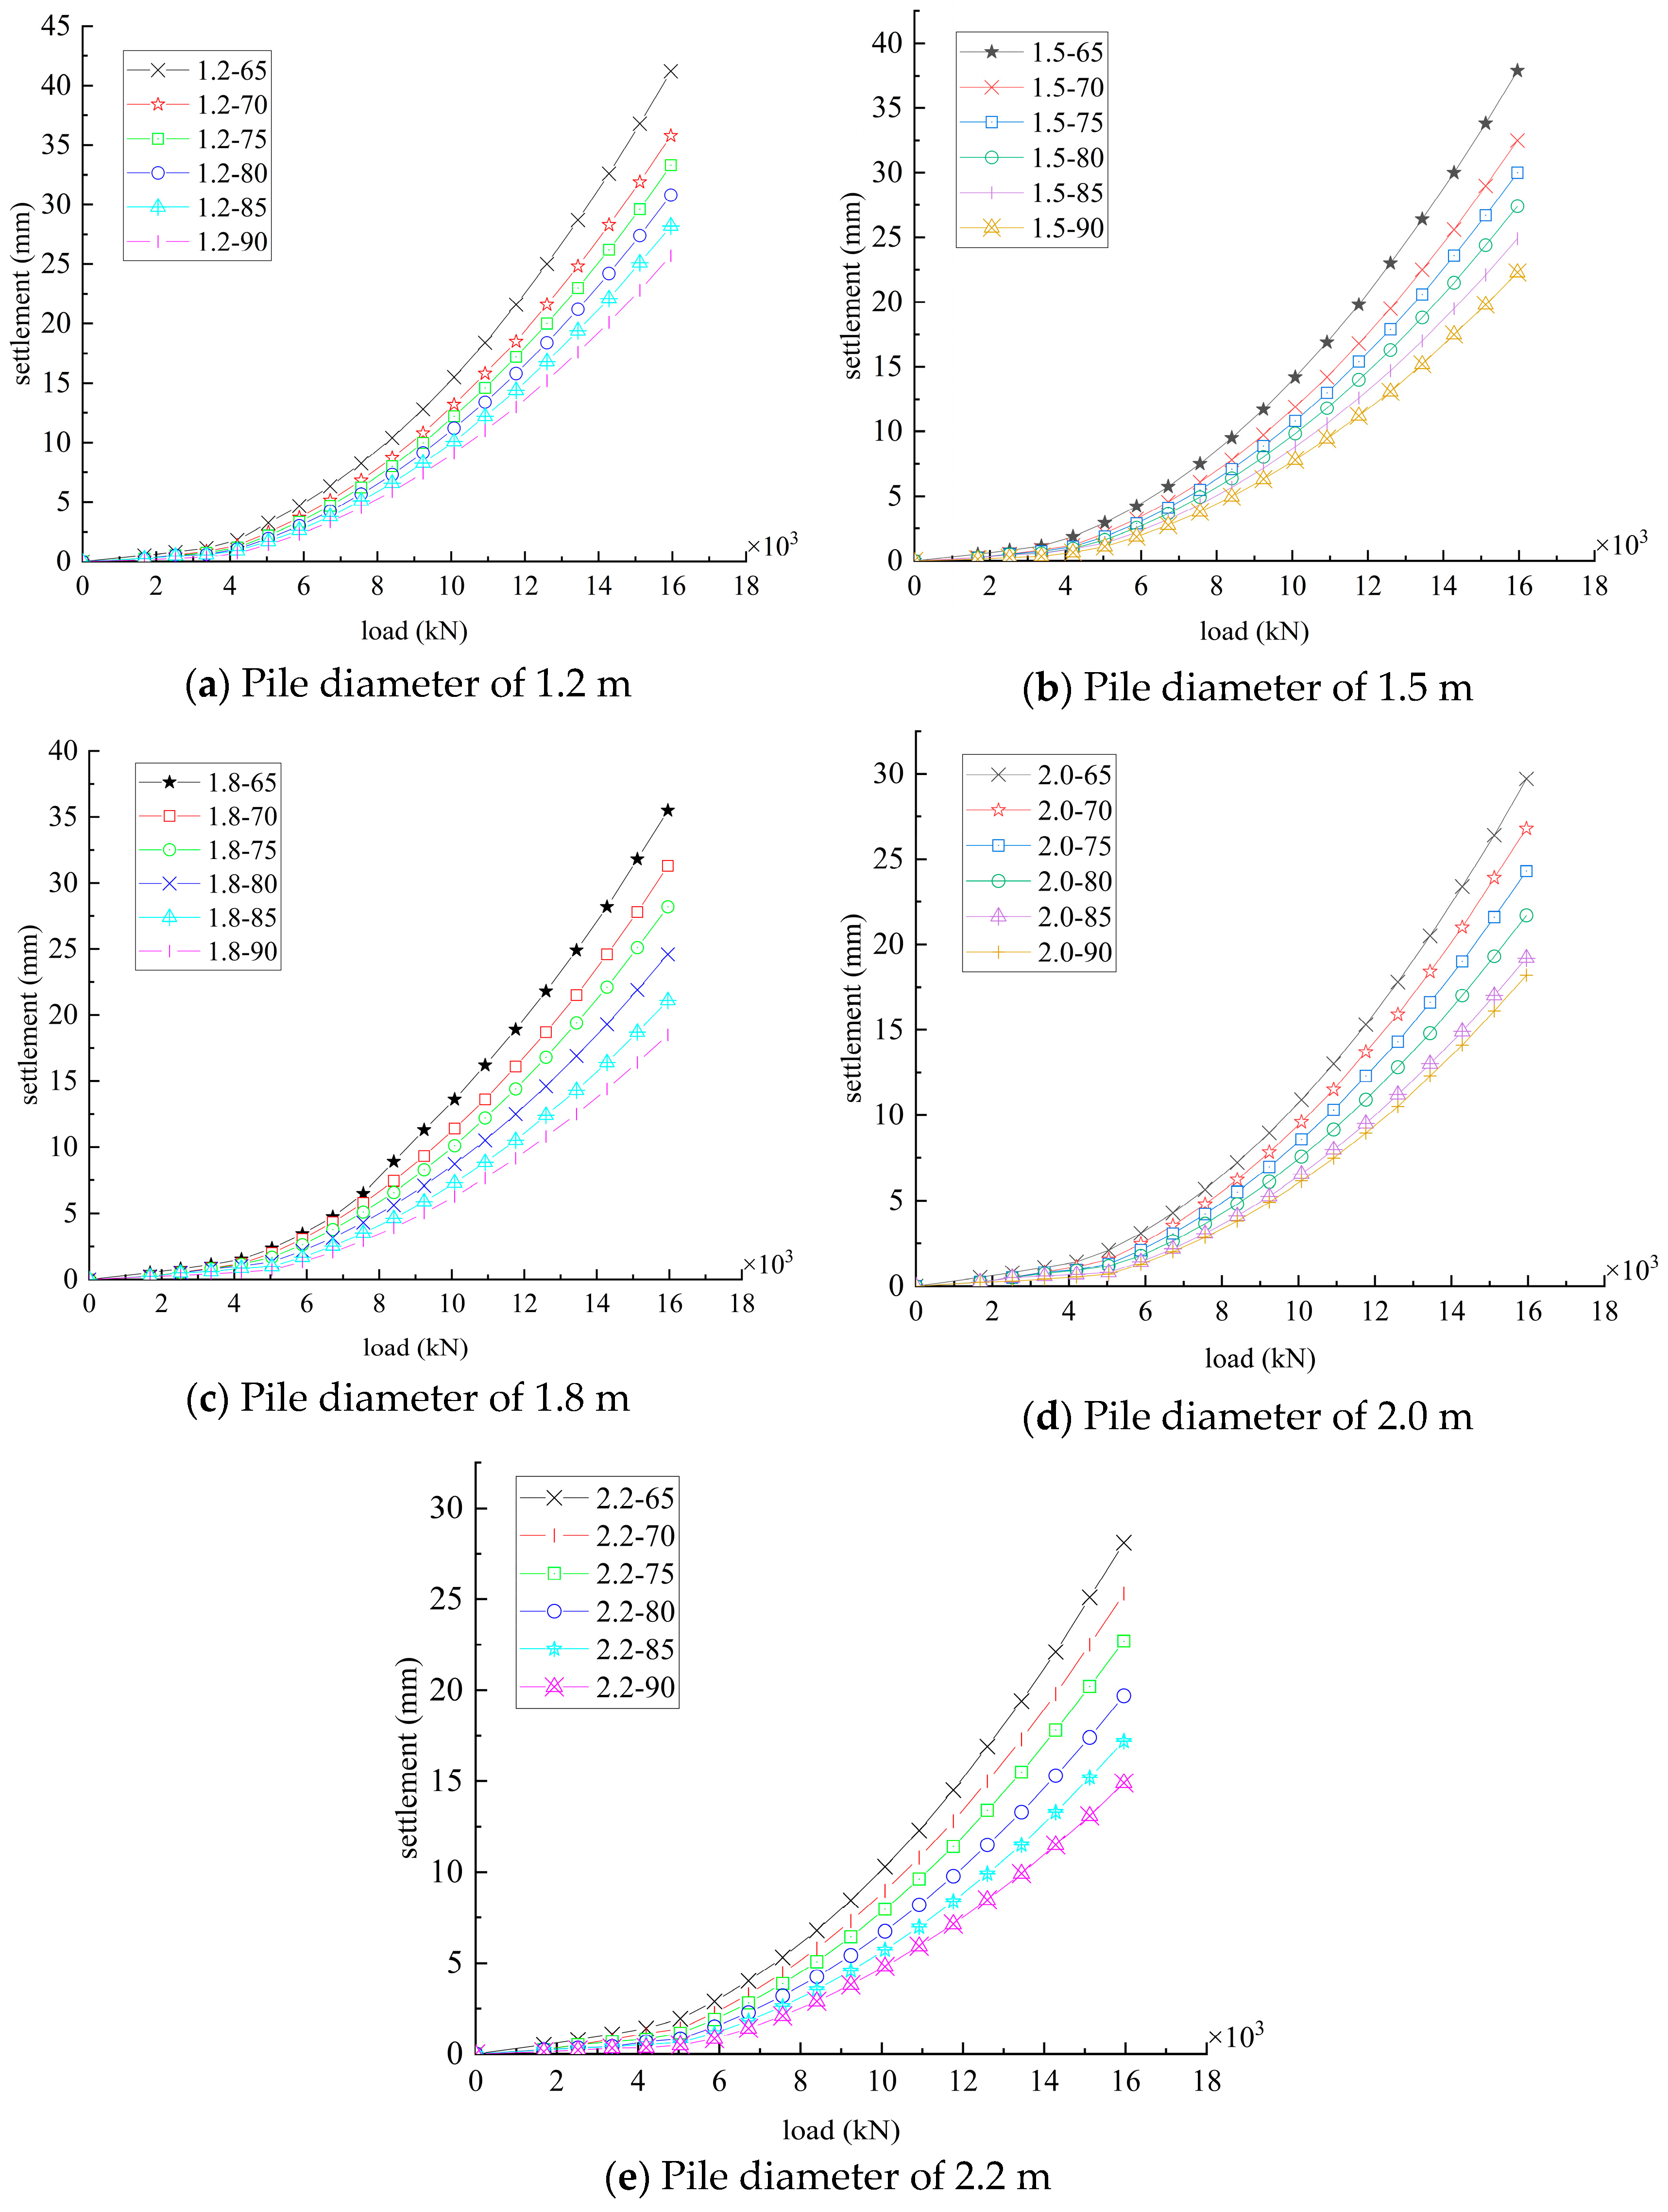
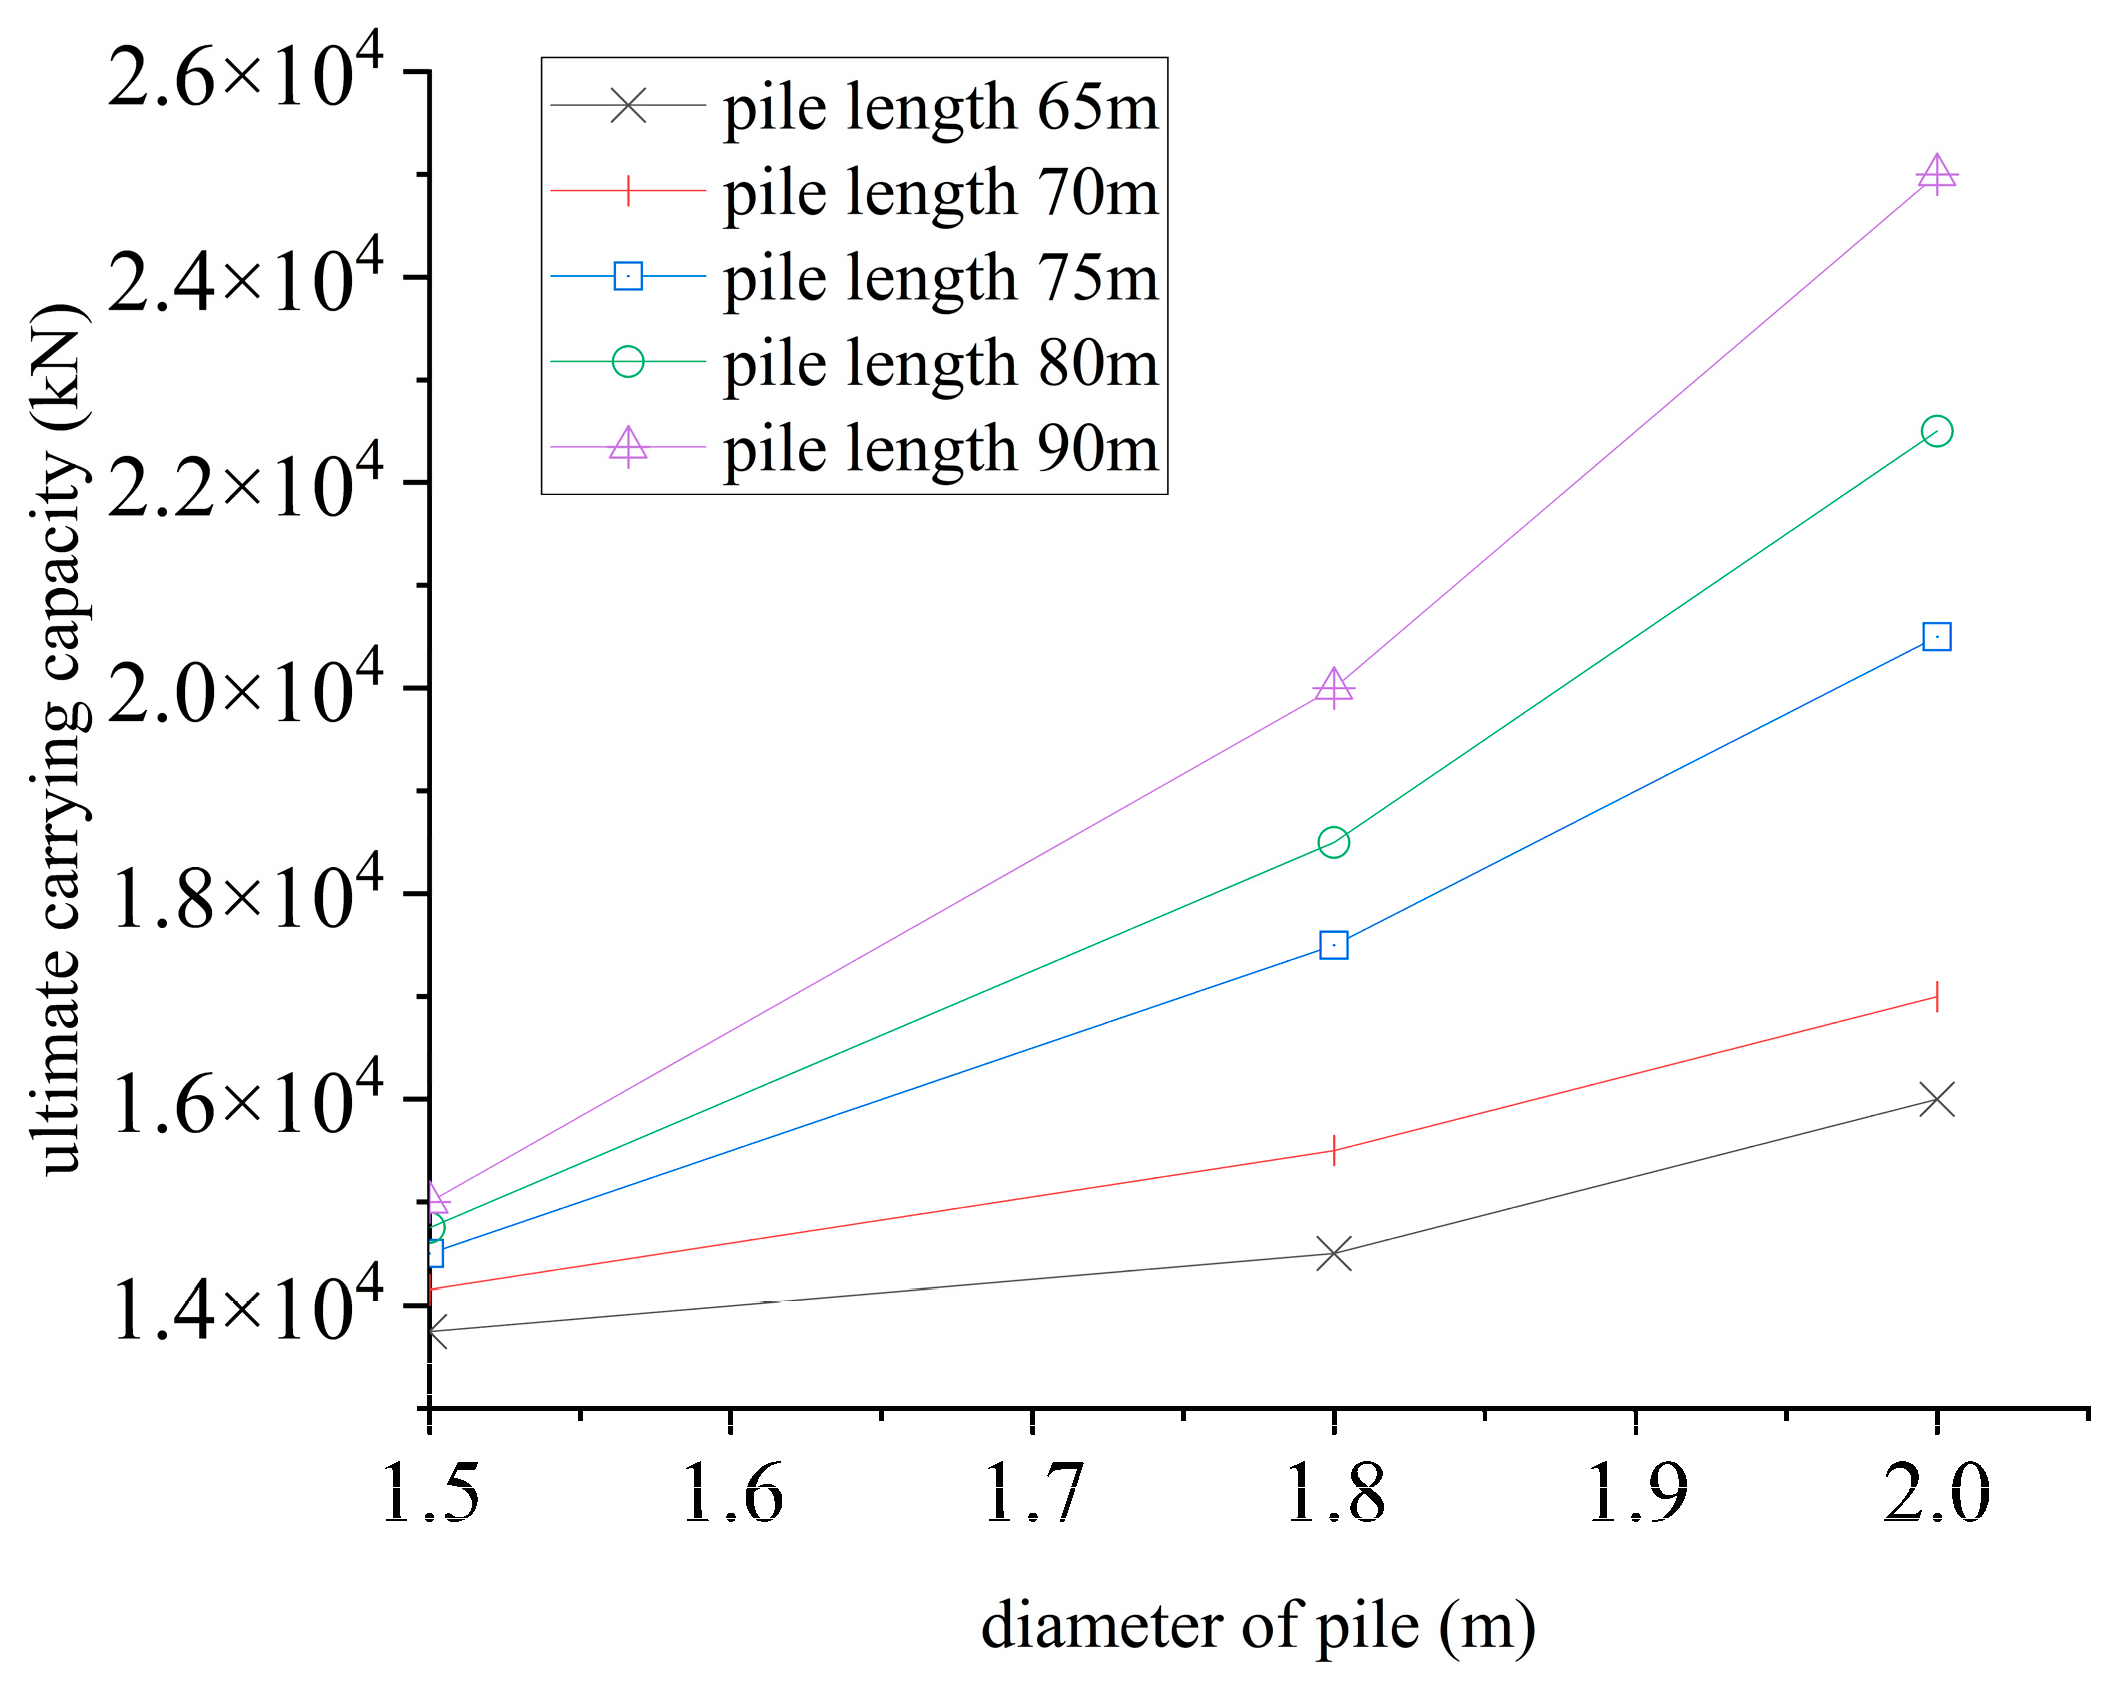
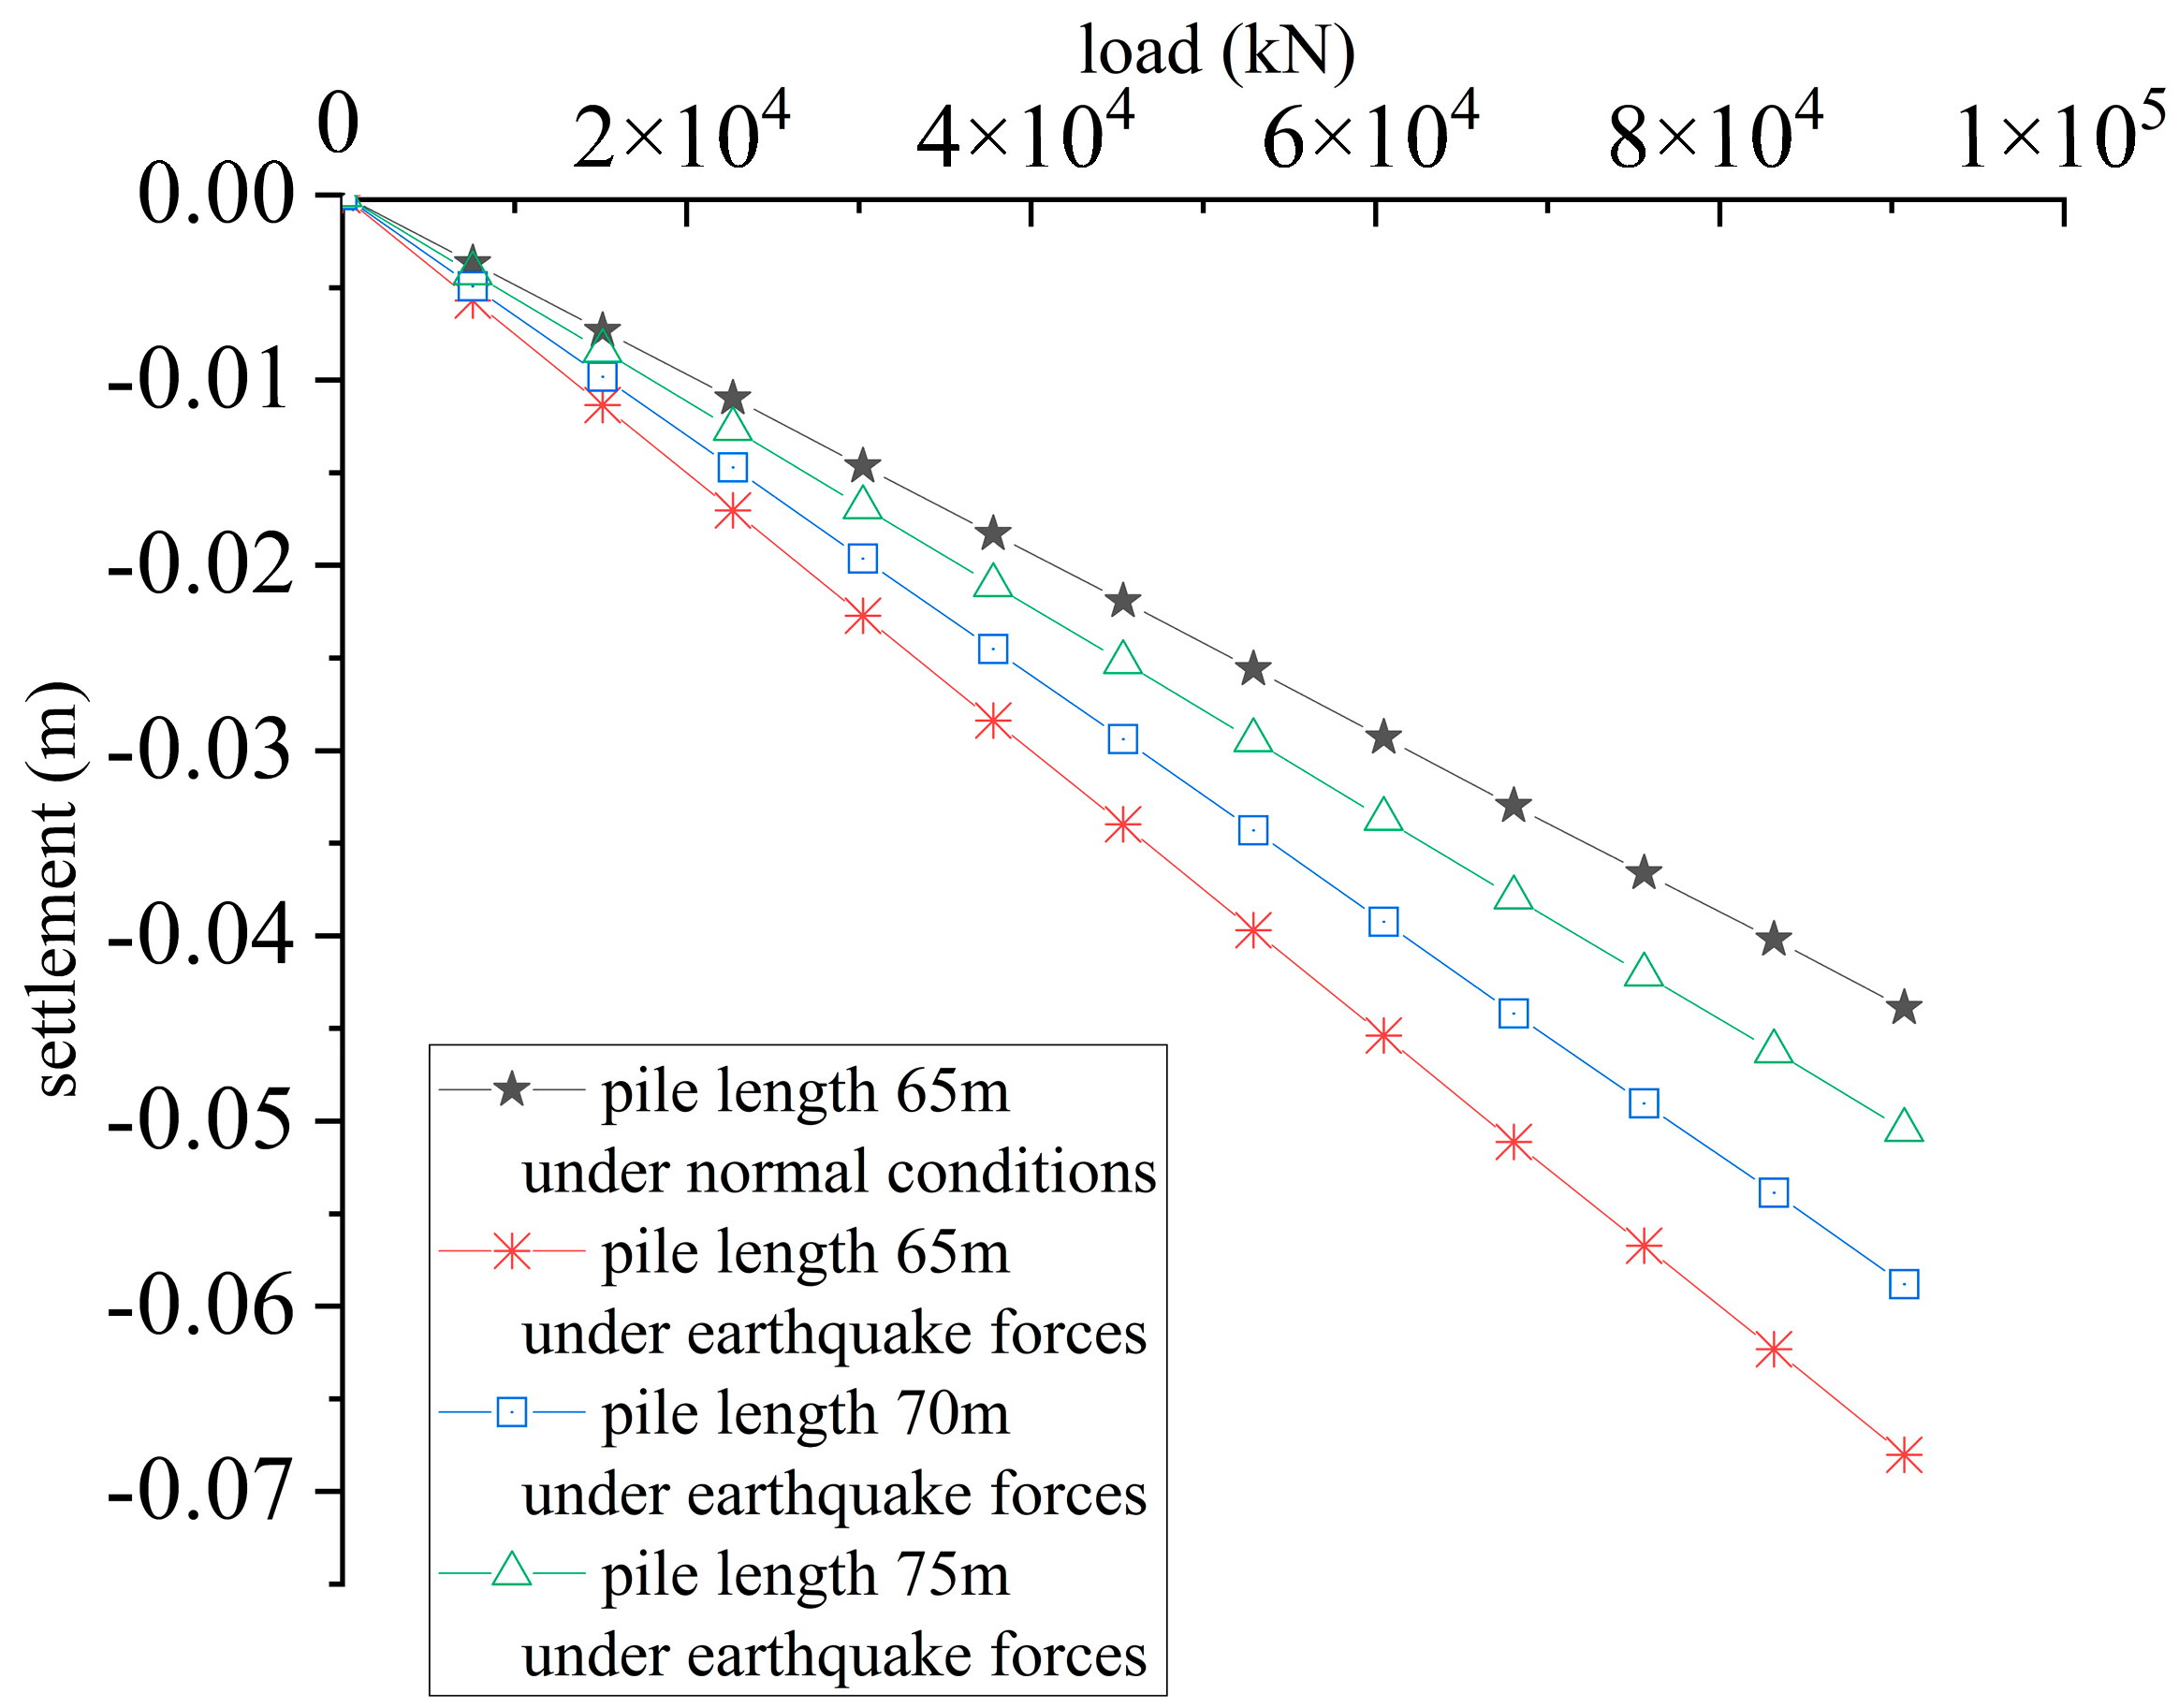
3.3. Analysis of Influencing Factors of Foundation Pile Settlement

The results presented in this section are based on dimensions that are frequently used in projects. Pile diameters of 1.2, 1.5, 1.8, 2.0, and 2.2 m were selected. Pile lengths of 65, 70, 75, 85 and 90 m were selected.
Figure 13 shows that for the same diameter pile foundation, the settlement gradually decreases with an increase in pile length. These results occur because the increase in pile length causes the length of the pile body to extend into the fully weathered mudstone. The deeper the soil layer is, the longer the time of mudstone deposition is, and the lower the degree of weathering of the mudstone is. Moreover, as the bearing capacity of the soil at the end of the pile increases, the pile is gradually transformed from friction to friction end-bearing, the soil layer shares the main load, the load transferred to the pile end gradually decreases, the deformation of the soil layer at the pile end is also relatively reduced, and the corresponding settlement of the pile top is also reduced. Analysis of on-site monitoring data revealed that as the pile depth increased from 10 m to 65 m, the axial force decreased to 26.7% of its initial value, while the side friction resistance increased to approximately three times the original magnitude. These observations align well with the finite element analysis results presented earlier.
There were no evident mutation points for the base pile model with the same pile length. When the pile length was the same, with an increase in the pile diameter, the contact area between the pile body and soil layer increased, the number of soil particles in contact with the pile body increased, and the friction effect between the soil particles and pile body hampered the downward movement of the pile body. Macroscopically, these results manifested via the load settlement curve of the foundation pile becoming increasingly gentle with an increase in the pile diameter, and the calculated settlement value gradually decreasing accordingly.
Figure 14 shows that the pile diameter is positively correlated with the bearing capacity and that the ultimate bearing capacity of the foundation pile gradually increases with an increase in the pile diameter. Taking the calculation result of the pile length of 80 m as an example, as the pile diameter increases from 1.5 to 2.0 m, the ultimate bearing capacity increases from 14,450 kN to 21,565 kN, with an increase of 49.24%, which indicates that increasing the pile diameter can significantly improve the ultimate bearing capacity of the foundation pile.

4. Example Analysis of a Coastal Area Friction Pile Group Foundation Project

The coastal area is geologically complex and mostly dominated by siltstone chondrites. Soil particles are susceptible to liquefaction under seismic forces, leading to loss of bearing capacity. Friction group piles have become more commonly used in coastal areas. In the previous section, we confirmed the validity of the finite element software analysis, which serves as a valuable reference in engineering and can thus be used as a foundation for theoretical calculations. The next research will focus on finite element software simulations to study the force characteristics of group pile foundations in coastal areas with unique geological conditions.

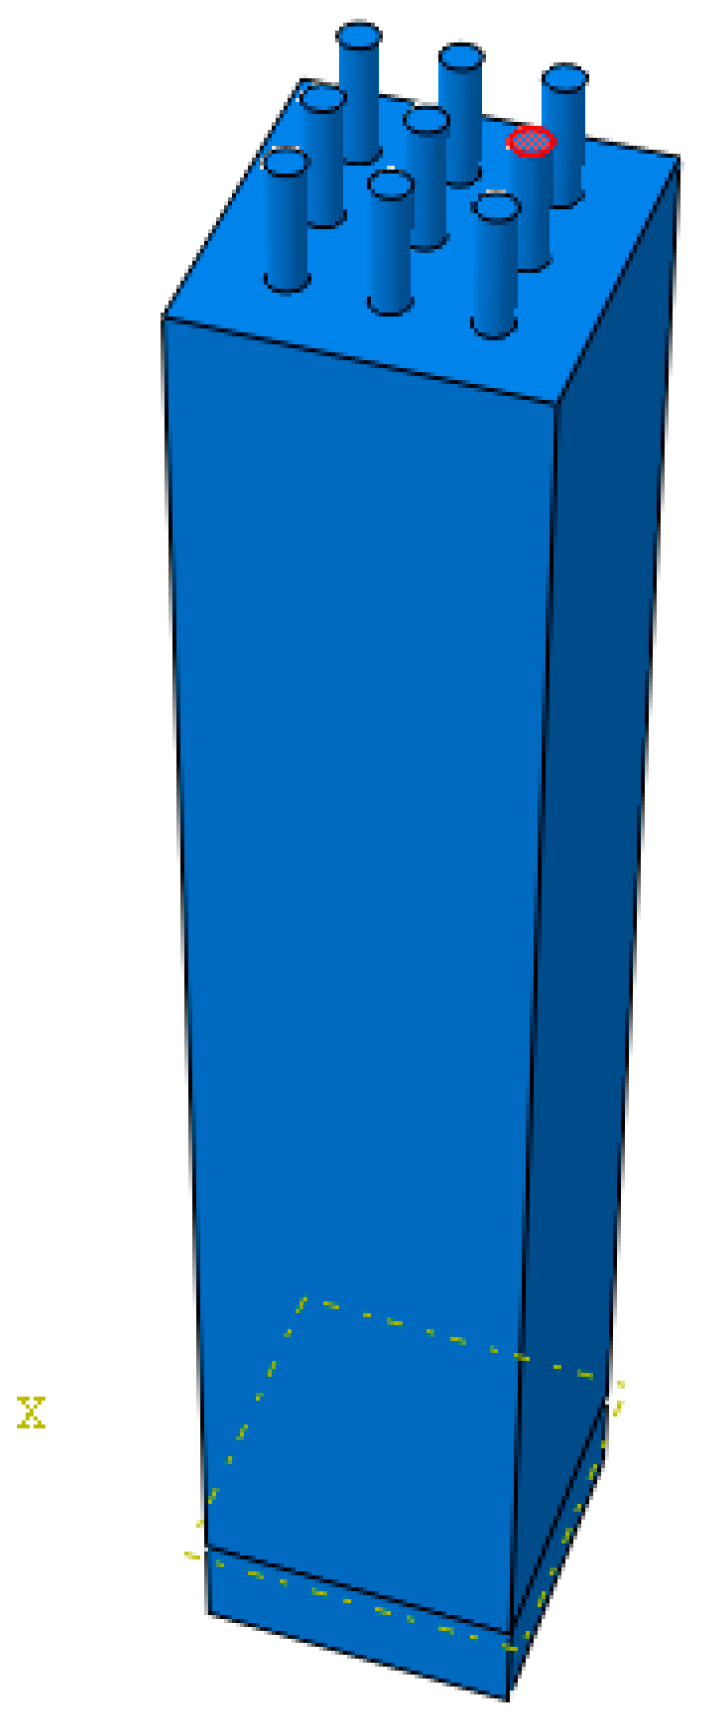
4.1. Finite Element Model of a Pile Group

4.1.1. Model Dimensions and Parameter Selection

Based on the stress diffusion effect at the pile tip plane of the pile group foundation, a soil domain of 25 m × 25 m × 80 m was initially modeled, followed by the positioning of individual piles. To ensure computational accuracy and facilitate observation, the soil mesh was generated with single-precision dimension-based seeding, with refined elements at the pile–soil interfaces compared to surrounding regions. Components with identical properties were grouped into sets.
For the reinforced concrete members, the ABAQUS rebar discretization tool was utilized to assign material properties, embedding reinforcement bars into the pile caps and piles. The interactions were simulated using Multi-Point Constraints (MPC), enforcing kinematic compatibility between master and slave nodes. The soil base was fully constrained for load application.
For a Class II site with 7-degree seismic fortification intensity and 0.10 g design basic acceleration, the target peak acceleration for time-history analysis under frequent earthquakes was 0.35 m/s2. When the El Centro wave (applicable to Class II sites) was adopted, its peak acceleration of 3.417 m/s2 required a scaling factor of 0.35/3.417 ≈ 0.1024.

4.1.2. Boundary Conditions

The boundary conditions for various structural components of the completed bridge are specified as follows (Table 4).

4.1.3. Finite Element Modeling

Due to their high load-bearing capacity, pile foundations find extensive application in bridge engineering. In developing the three-dimensional finite element model for computational analysis, incorporation of pile–soil interactions enables more precise evaluation of the foundation’s bearing behavior.
The pile cap and individual piles were modeled using 3D beam elements, with the pile foundation system represented through mass-consistent soil springs. The solution was derived by formulating a set of coupled differential equations. The modeling incorporates the following key assumptions: The surrounding soil is modeled as a Winkler elastic continuum; the horizontal stiffness coefficient governing dynamic soil–structure interactions is explicitly defined; the mass distribution within the pile–soil system is discretized into a series of lumped mass points with assigned thickness parameters; the complete system is represented through an idealized parametric discretization scheme.
This methodology provides enhanced intuitive comprehension of the system’s mechanical response.

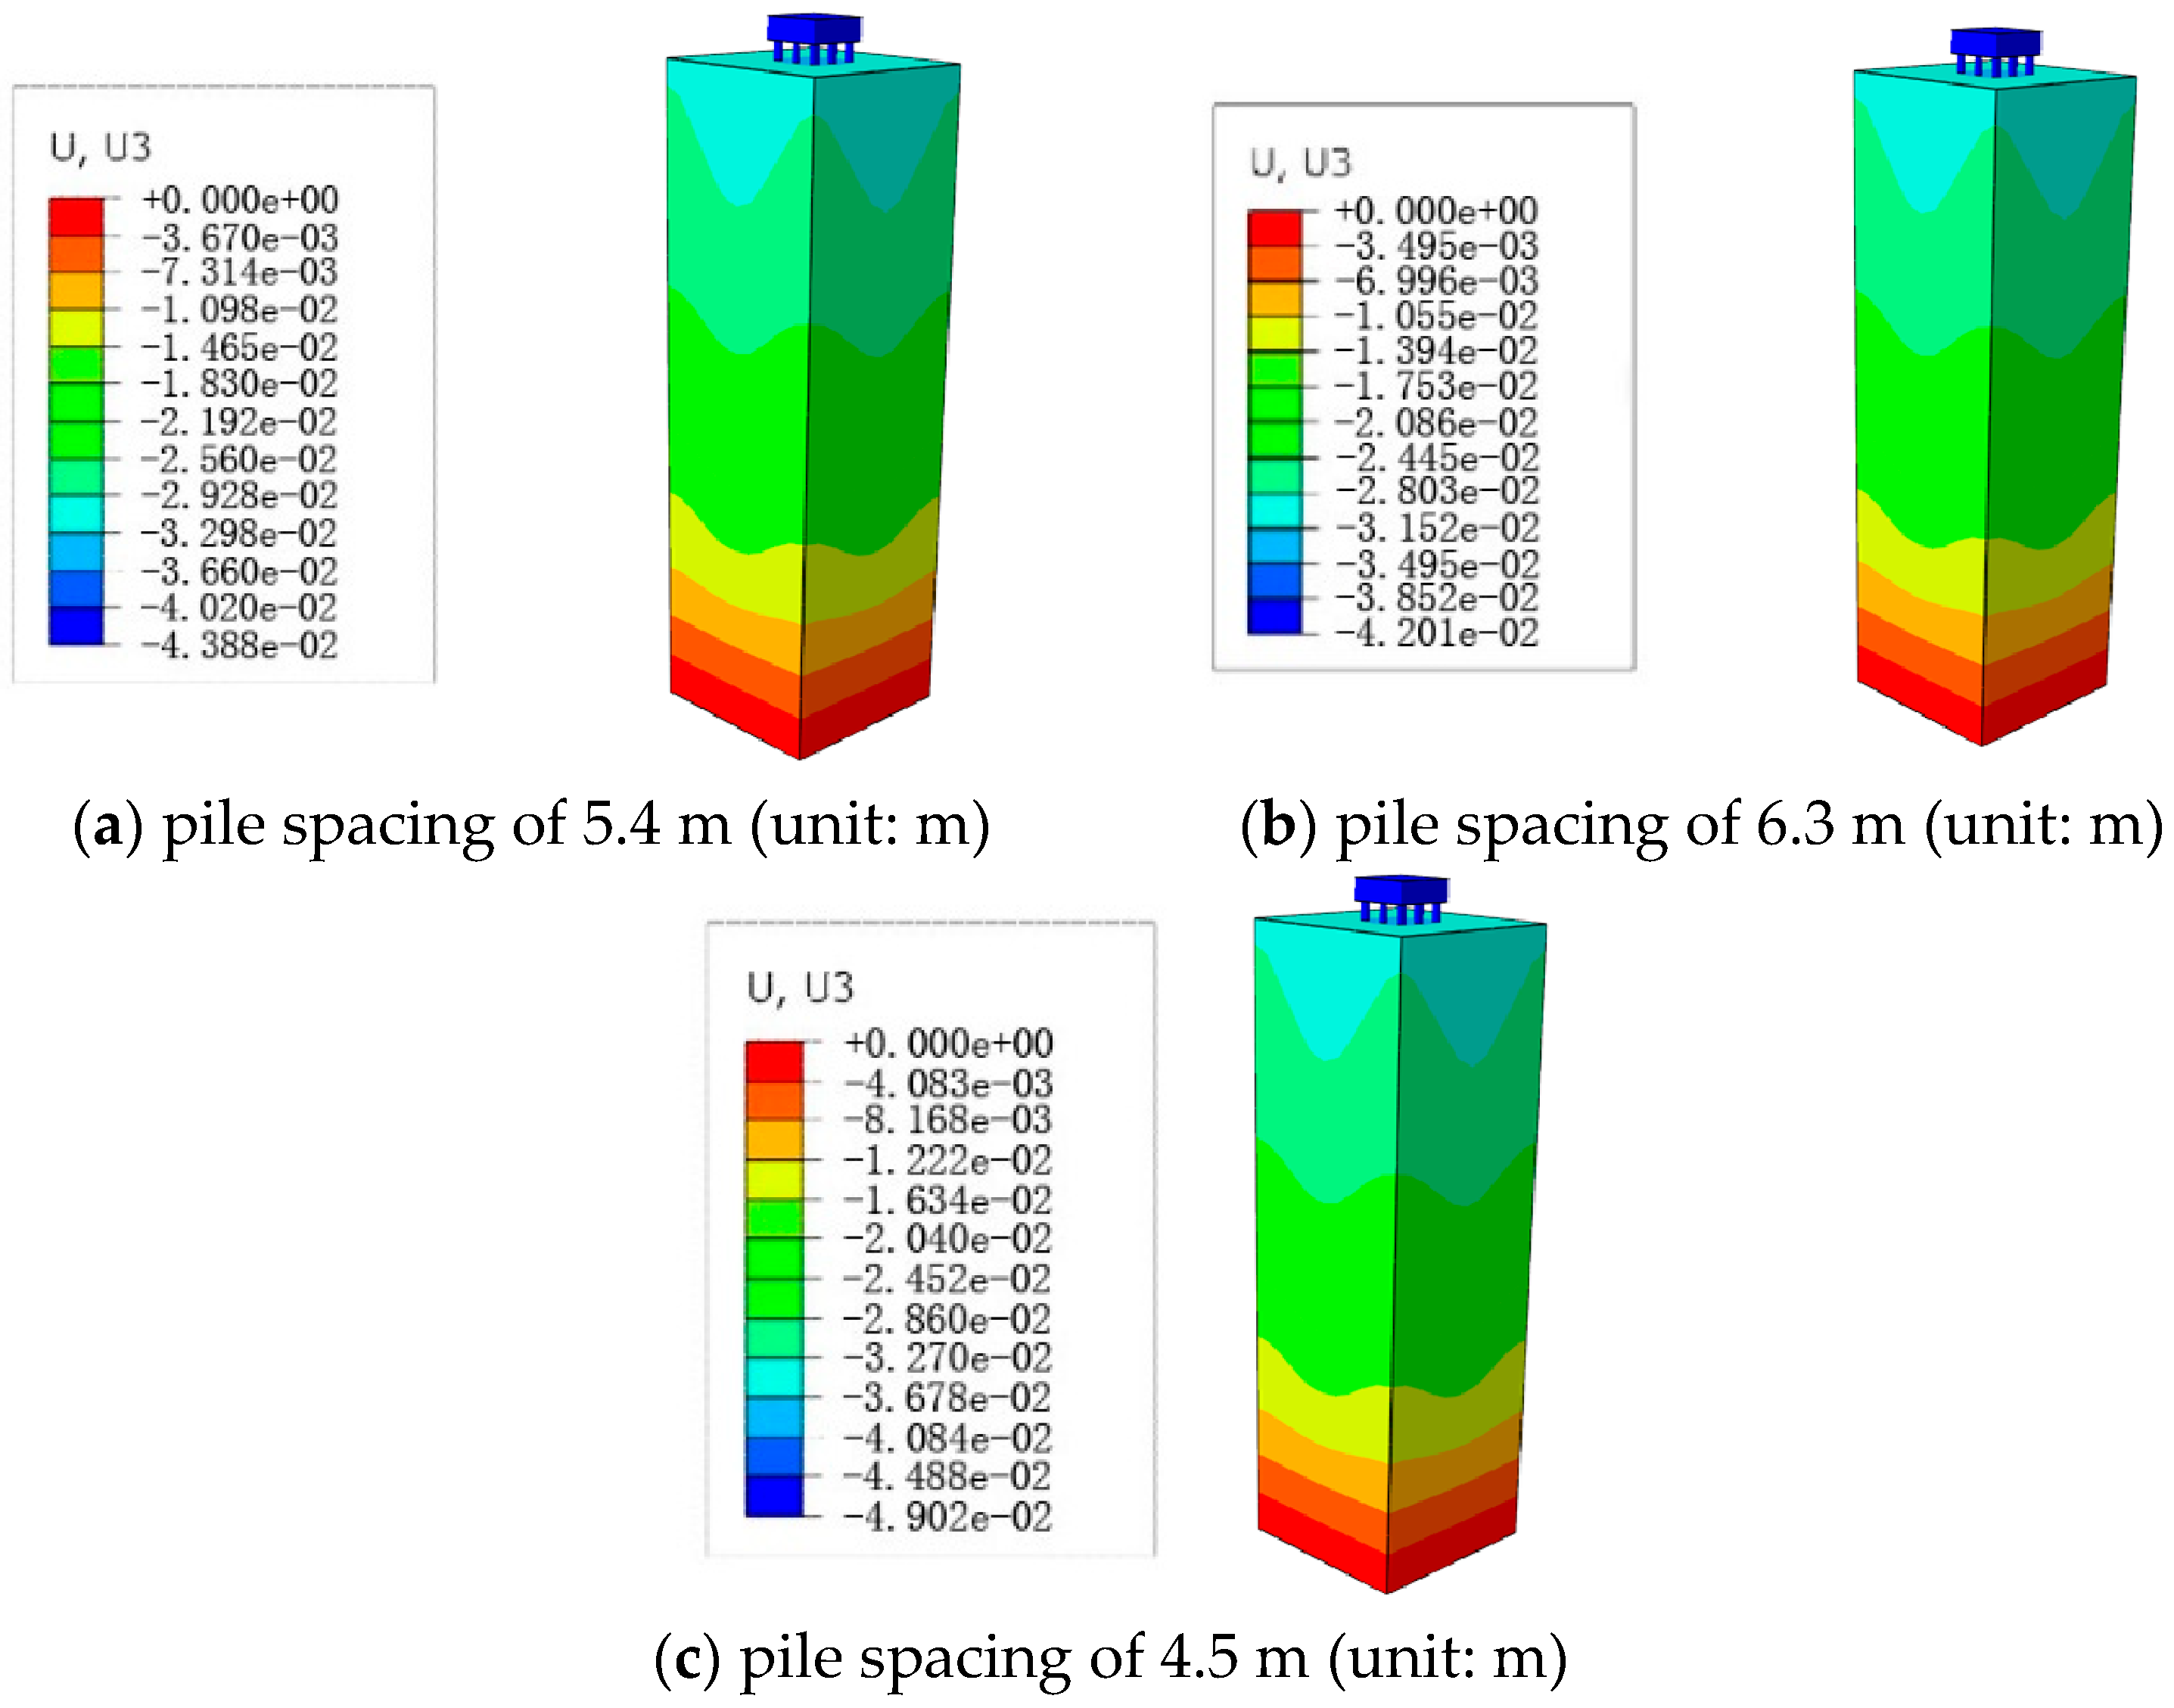
4.2. Comparative Analysis of Models with Different Pile Spacing

A finite-element analysis of the structure was conducted considering three pile spacing conditions: 4.5, 5.4, and 6.3 m, as shown in Figure 15.
As shown in Figure 16, the maximum settlement of the pile group foundation is 49 mm when the pile spacing is 4.5 m, 43.9 mm when the pile spacing is 5.4 m, and 41.98 mm when the pile spacing is 6.3 m. Additionally, the pile spacing increases from 4.5 to 5.3 m, (2.5D–3D, where D is the pile diameter), and the rate of settlement reduction is the fastest, with a reduction rate of 11.6%. With the increase in pile spacing, the settlement of the pile group foundation decreases gradually because the bearing capacity of the soil layer in the coastal deposition area is poor. Moreover, friction foundation piles cause puncture damage to the foundation soil layer. The pile group foundation is the superposition of the damaging effect of more than one base pile, and the increase in pile spacing weakens this superposition effect. The pile group foundation disperses the main load such that a smaller pile spacing results in the damage superposition effect being more likely to produce stress concentration piercing damage phenomenon in the soil layer.

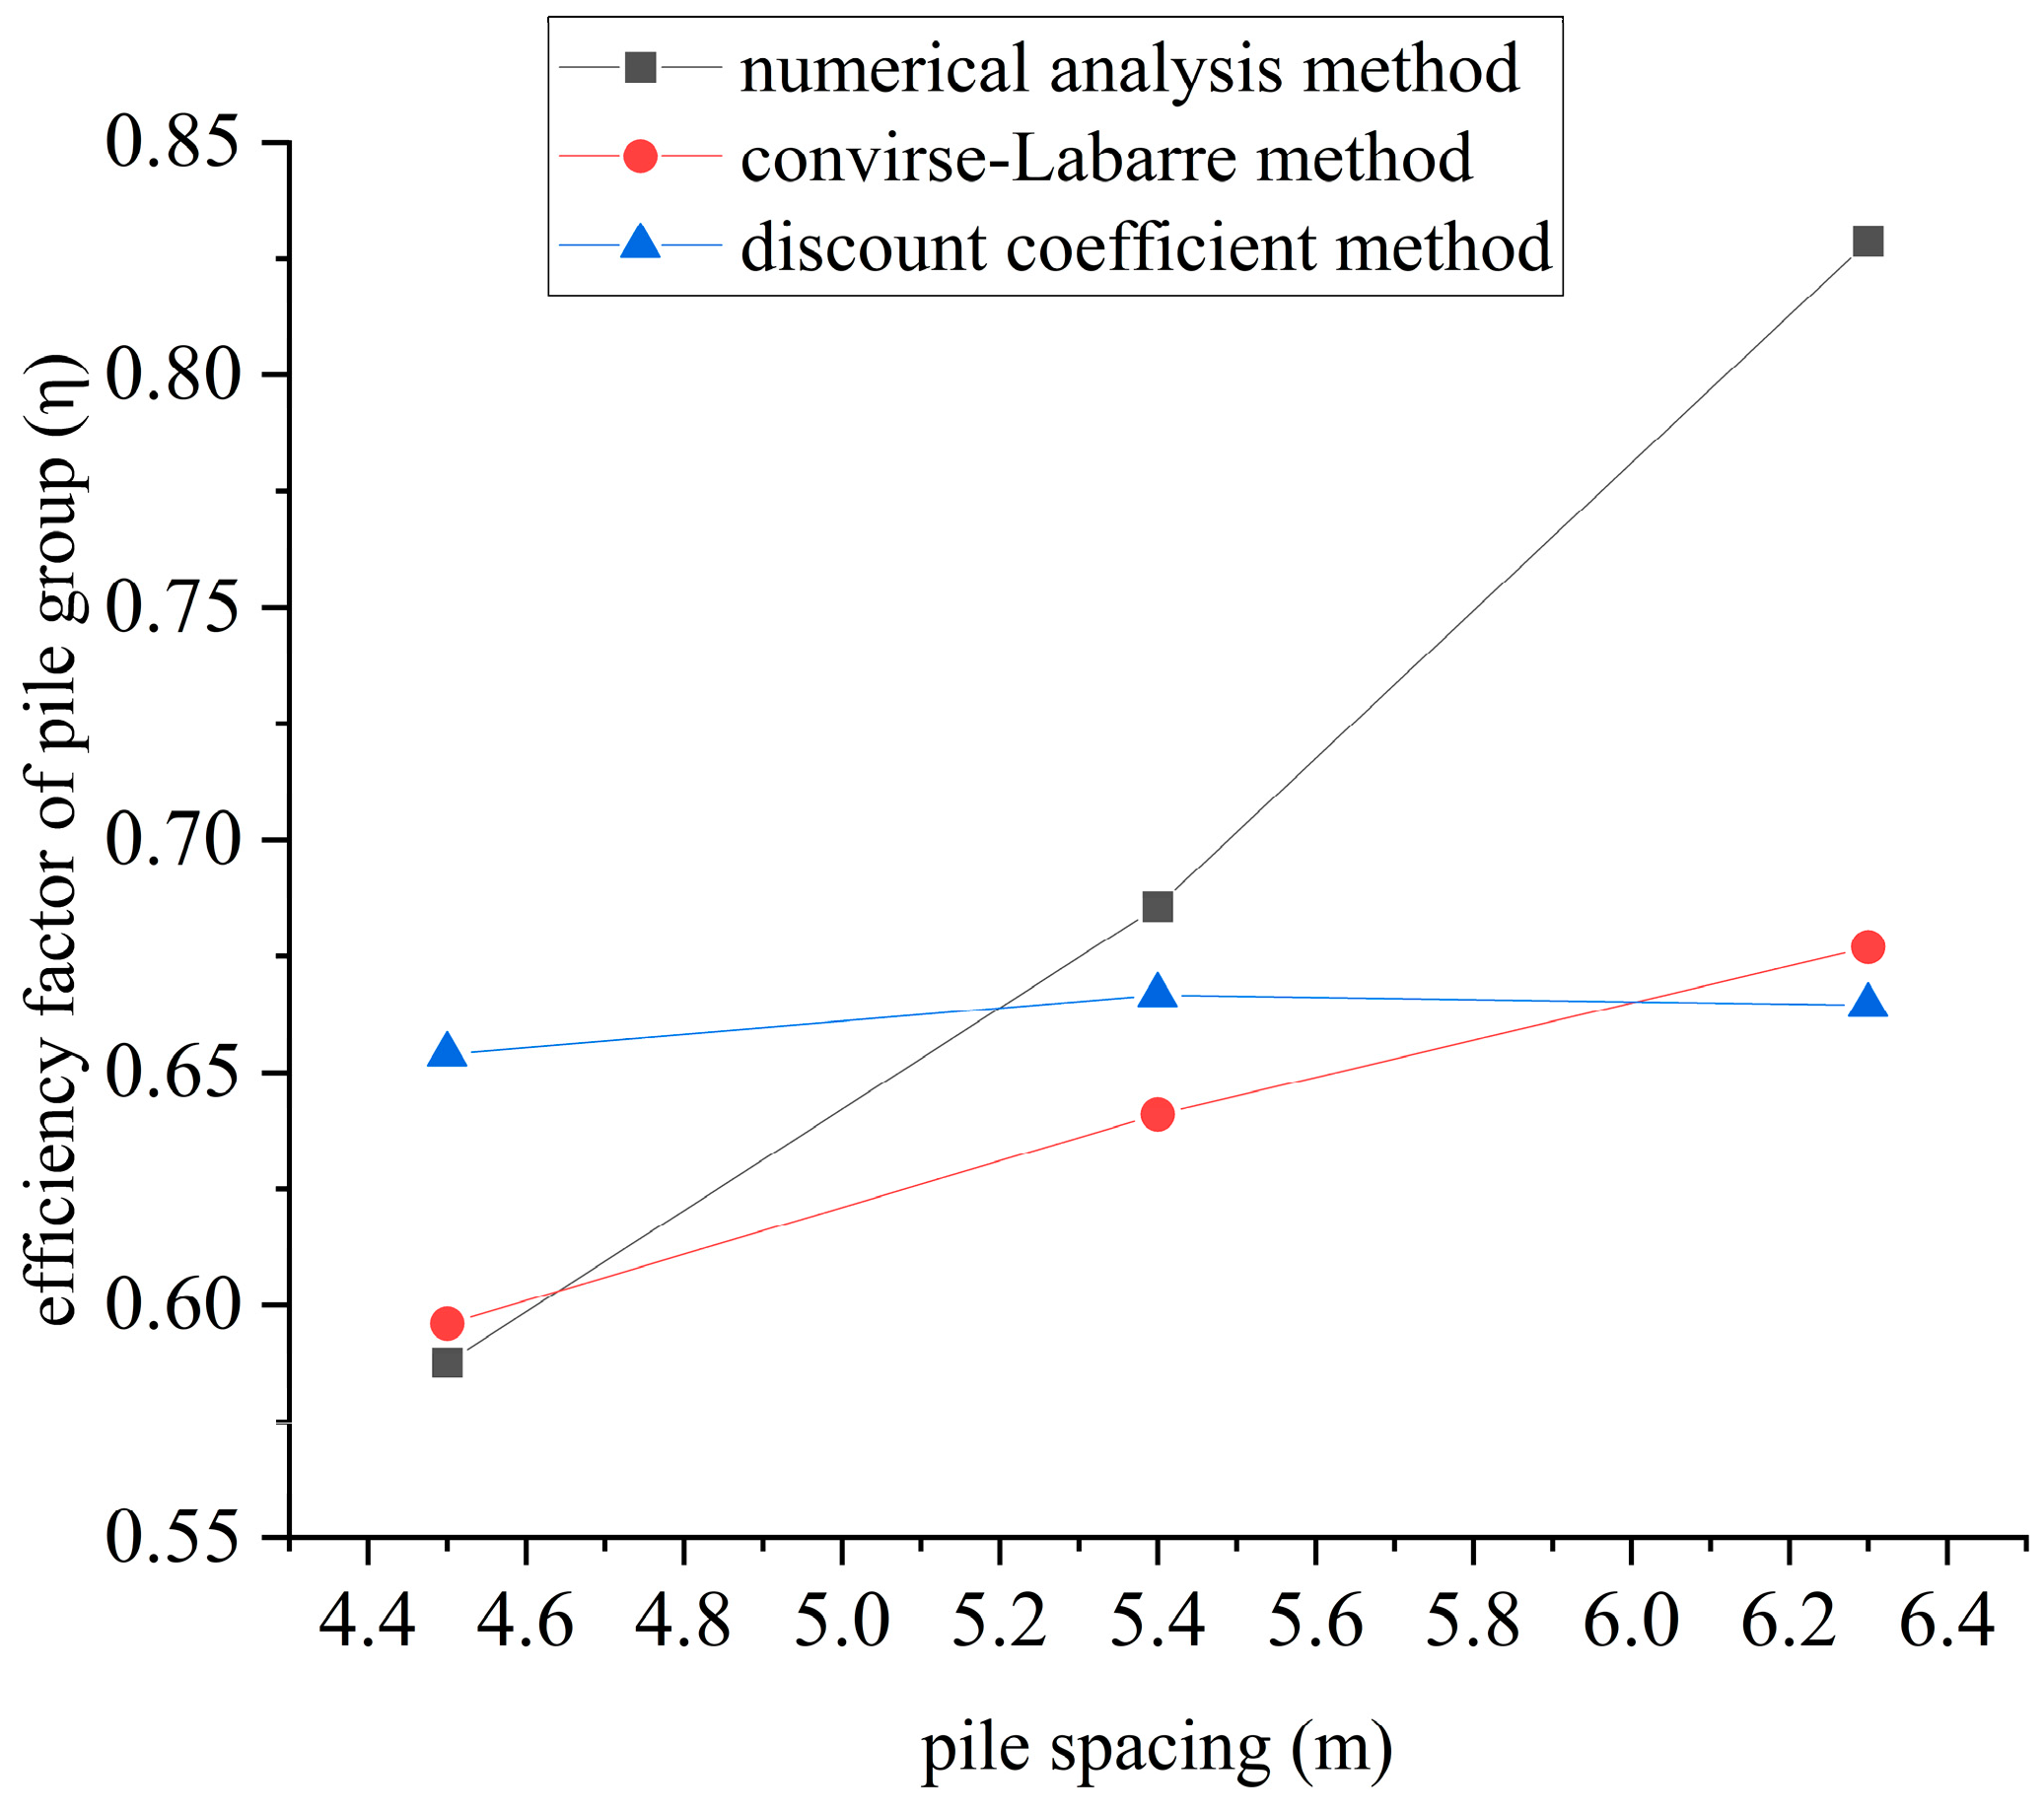
4.3. Calculating the Efficiency Factor of Pile Group Bridges

(1) Numerical analysis method as shown in Table 5.
(2) Convirse–Labarre method.
η = 1 tan 1 d S n 2 π ( n 1 ) m + ( m + 1 ) n m n
The efficiency factor of the pile group is calculated based on the Convirse–Labarre method [26,27,28] as shown in Table 6.
(3) Discount coefficient method
As shown in Table 7, the discount coefficient method combines the superposition of additional stresses caused by multiple influencing factors and introduces the formula for the efficiency factor of the pile group:
η = 1 λ + 1
λ = 2 A S 1 m 1 m + 2 A S 2 n 1 n + 4 A S 3 ( m 1 ) ( n 1 ) m n
A S 1 = ( 1 3 S 1 1 2 l tan ϕ ) D
A S 2 = ( 1 3 S 2 1 2 l tan ϕ ) D
A S 3 = ( 1 3 S 1 2 + S 2 2 1 2 l tan ϕ ) D
where λ is the average reduction rate; S 1   is the longitudinal spacing of the pile group; S 2 is the transverse spacing of the pile group; A S 3   is the coefficient considering the influence of overlapping stresses along the diagonal between piles; m , n is the number of piles in the longitudinal and transverse directions of the group, respectively; φ is the internal friction angle; l is the pile length; and D is the pile diameter.
(4) Analysis of results
Figure 17 shows that the group pile effect coefficient tends to become gradually larger as the pile spacing increases. The closer the pile spacing, the greater the stress concentration on the foundation soil. The efficiency factor of the pile group calculated using the Convirse–Labarre method and the discount coefficient method show similar fluctuations, but some errors exist in the numerical analysis method.

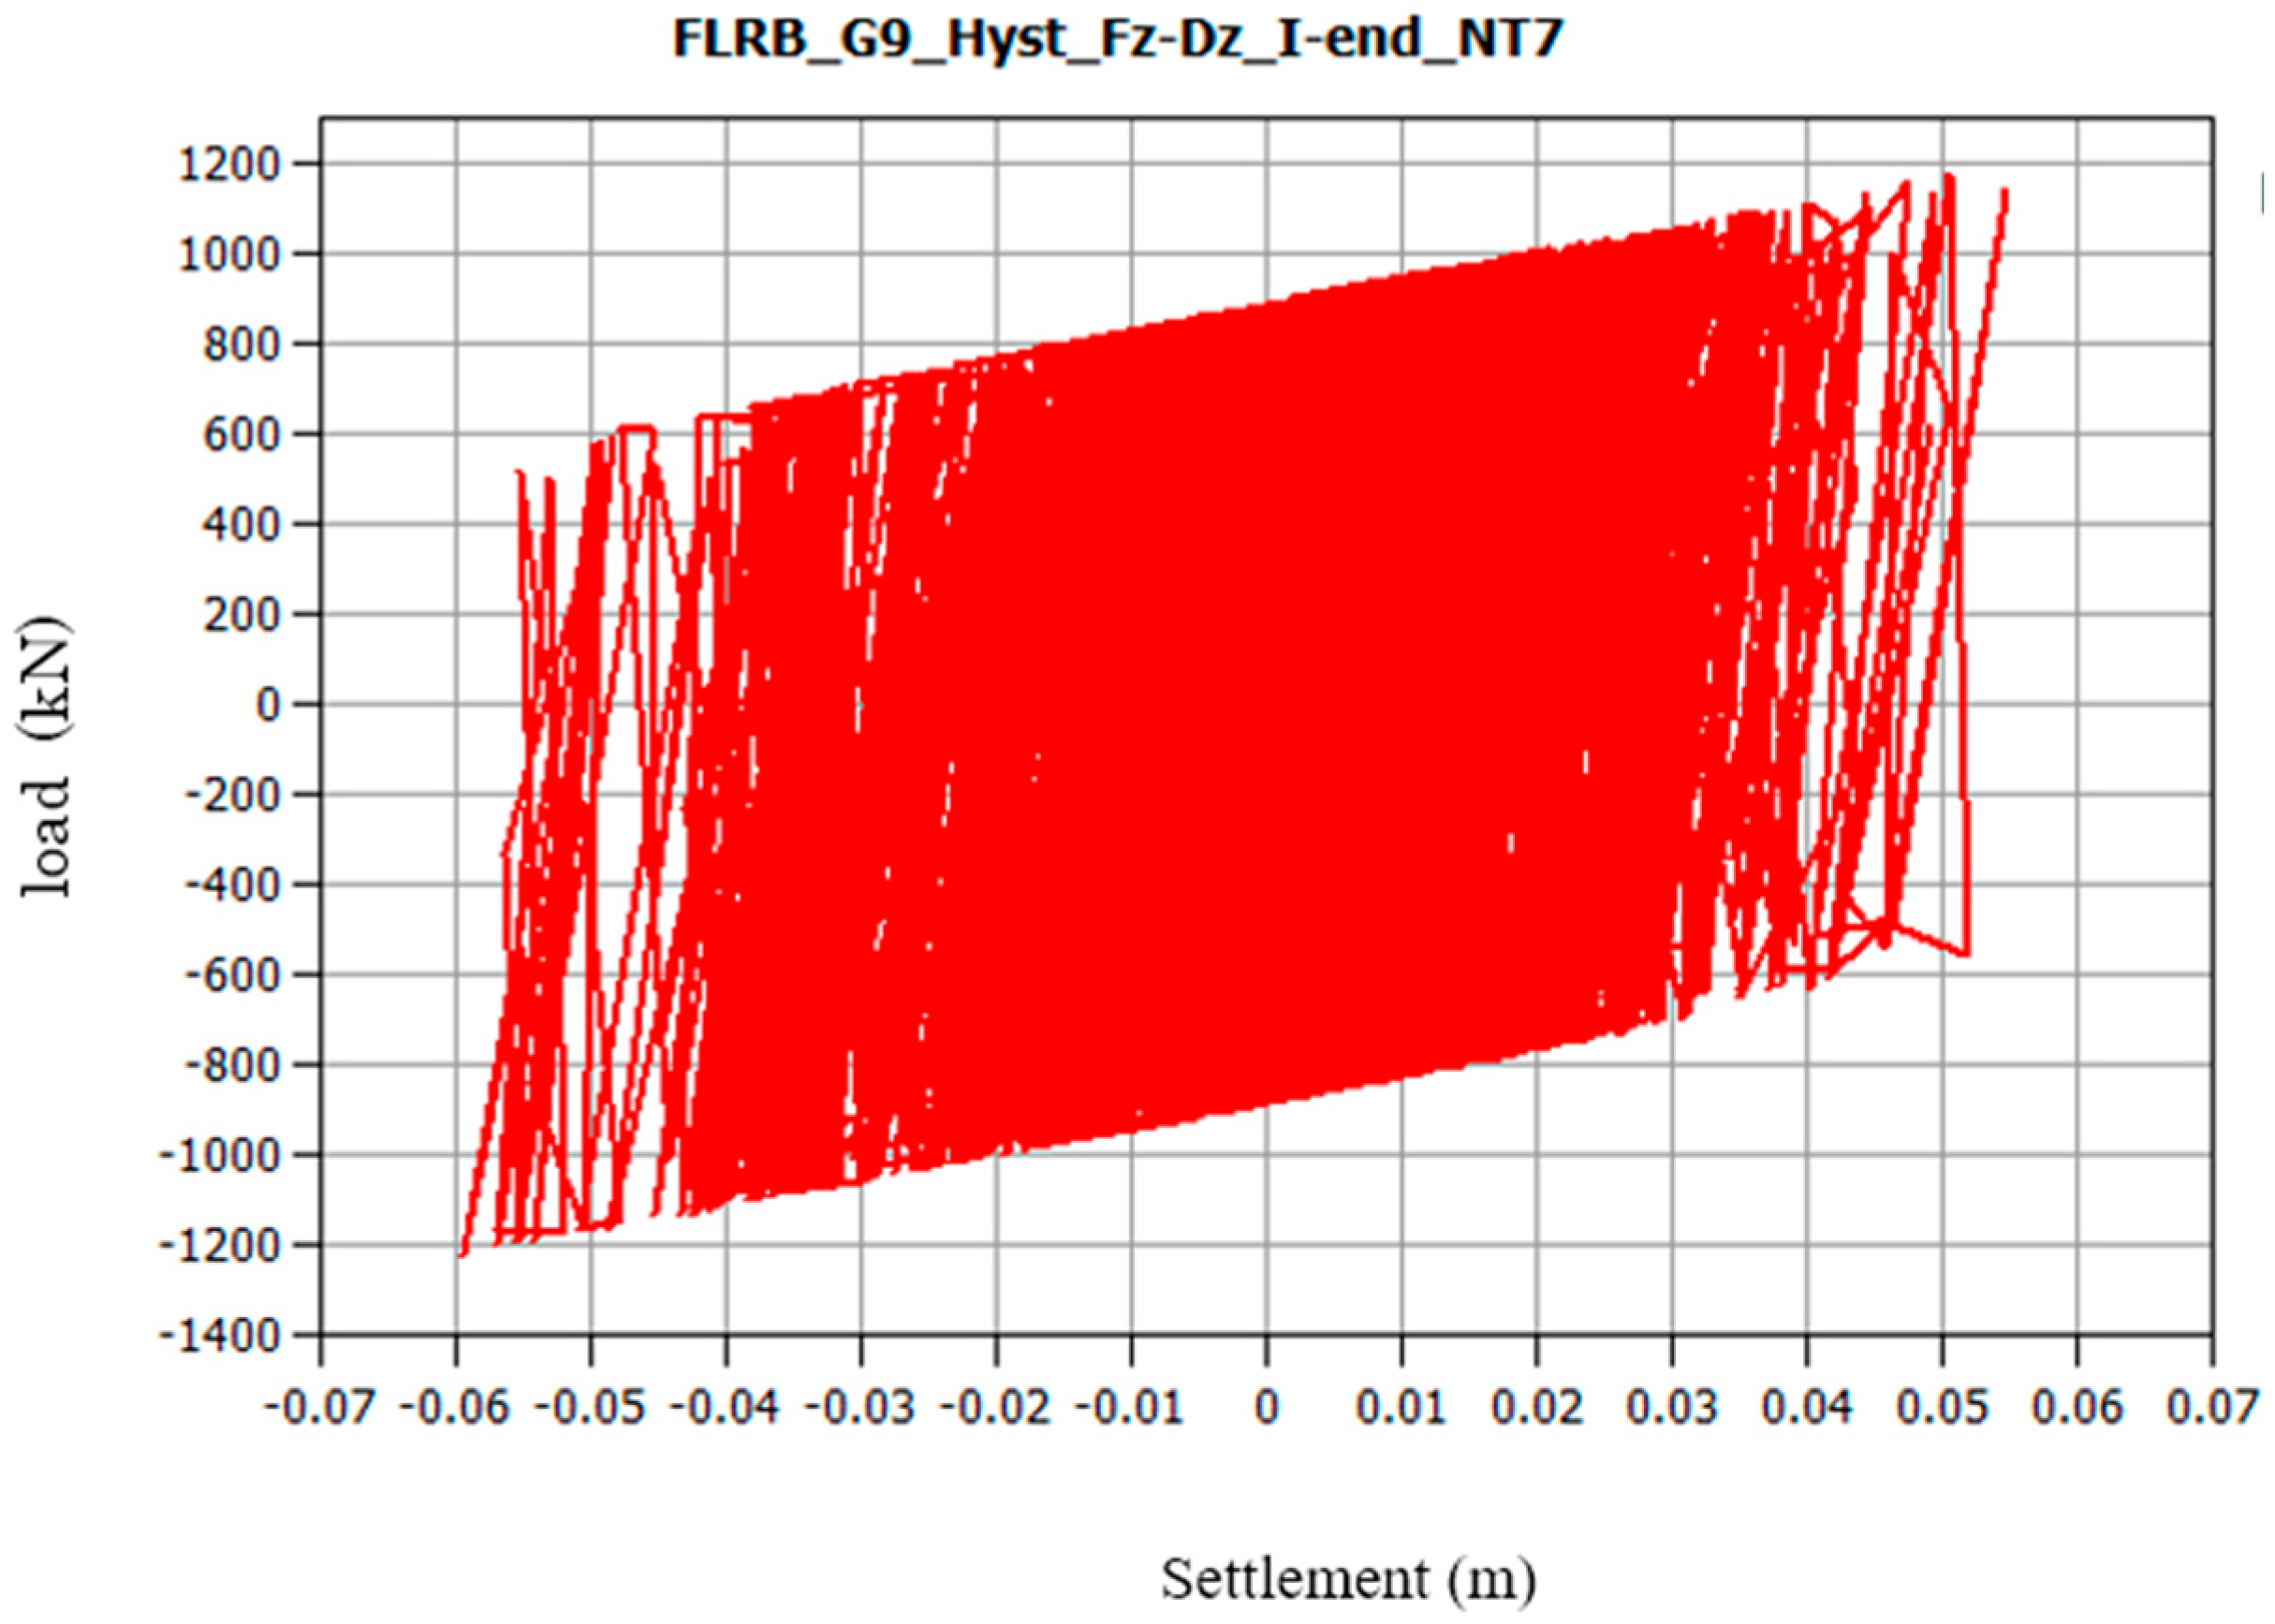
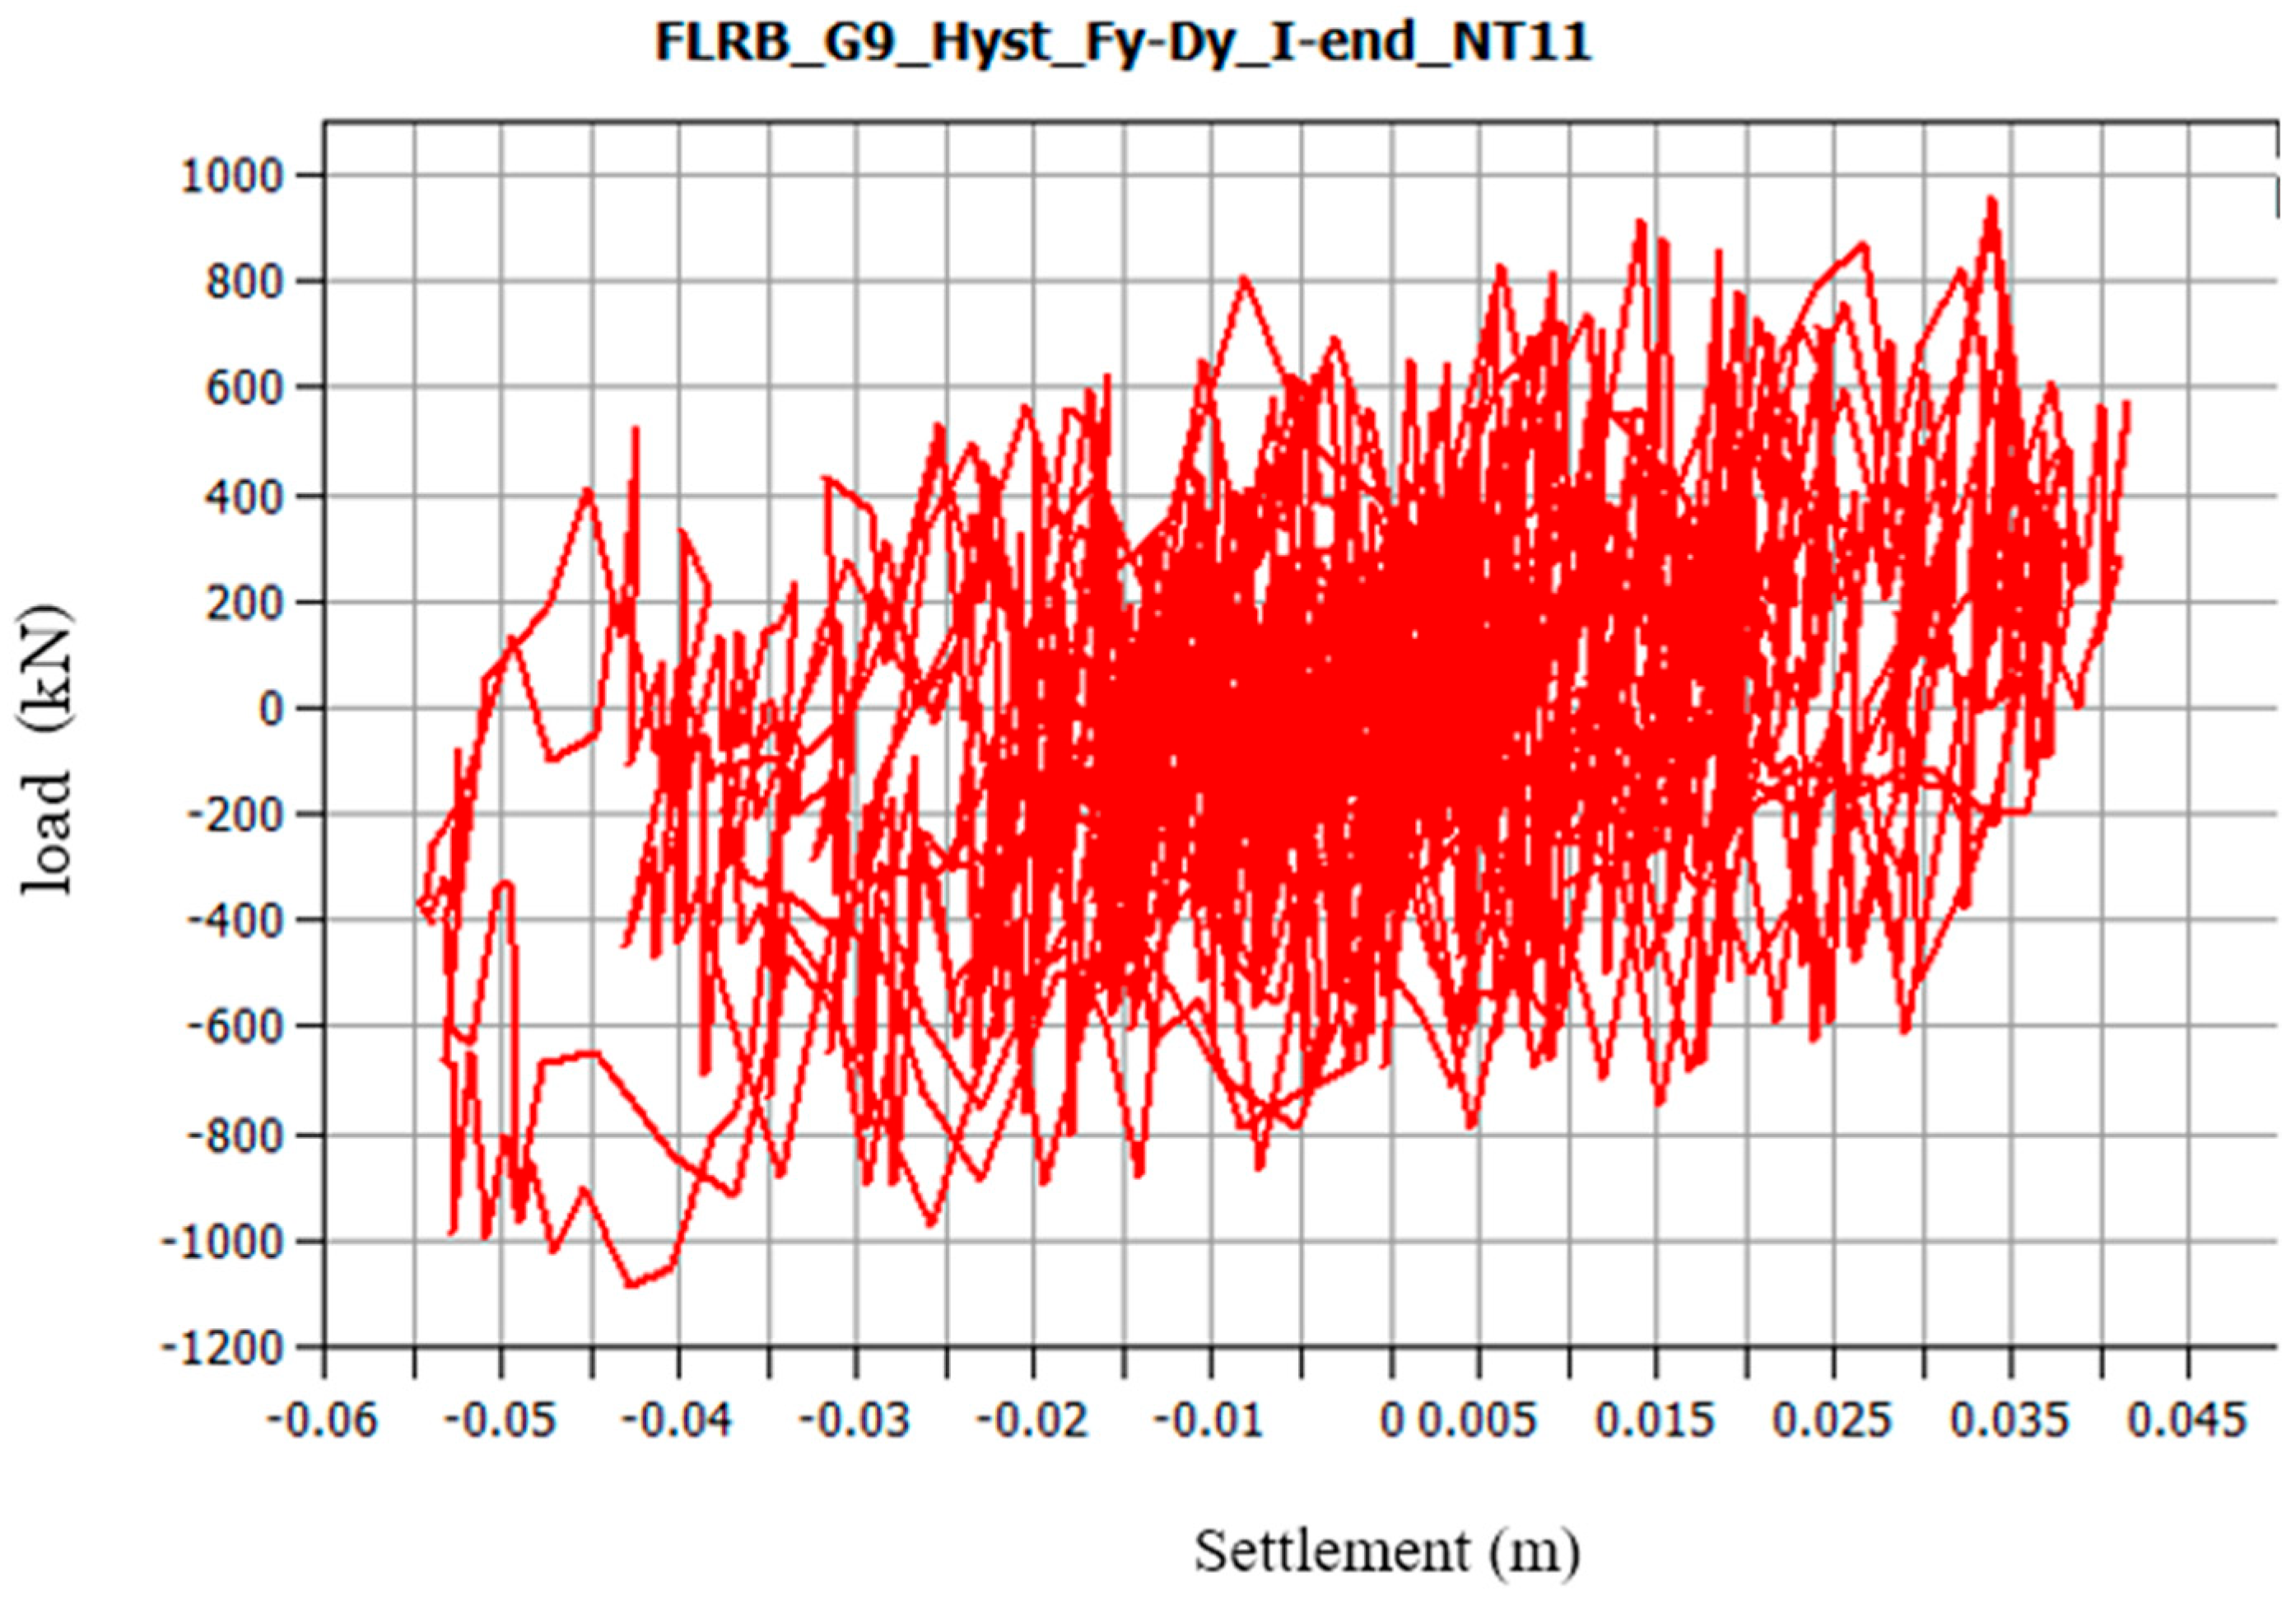
4.4. Structural Dynamic Characterization

To investigate the effect of the pile length on the settlement of the structure under seismic force, the pile diameter was maintained at a constant value. A finite element model with a pile diameter of 1.8 m and pile lengths of 65 m, 70 m, and 75 m were established for comparison.
As shown in Figure 18, the maximum settlement of a pile group foundation with a pile length of 65 m is 43.9 mm under normal conditions. The maximum settlement of a pile group foundation with a pile length of 65 m was 68.0 mm under the seismic effect, and the maximum settlement of a pile group foundation with a pile length of 75 m was 50.5 mm. When the diameter of the pile group foundation is certain, under the action of a seismic force, the settlement gradually decreases with an increase in pile length. This is because in coastal areas, with an increase in pile length, the length of the pile increases deep into the holding layer, the bearing capacity of the holding layer increases gradually with the increase in depth, the extrusion deformation of the soil is relatively small, and the settlement of the pile foundation decreases accordingly.
To investigate the effect of the pile diameter on the settlement of the pile group foundation under seismic action, pile lengths were controlled to a constant value, and three types of working condition models with a pile length of 65 m and pile diameters of 1.5 m, 1.8 m, and 2.0 m were established for a comparative analysis as shown in Figure 18.
As shown in Figure 19, at a certain pile length, as the pile diameter of the pile group foundation increased, the settlement of the pile group foundation decreased. For a friction pile group foundation in a coastal area, the pile foundation mainly relies on the friction of soil to pile foundation to provide the bearing capacity. With an increase in the diameter of the pile group foundation, the contact area between the pile body and soil body increases, and the friction resistance of the soil body to the pile body increases. As the pile diameter increases, the tendency of the pile group foundation to move downward under load decreases. Thus, the settlement becomes smaller.

4.5. Comparative Analysis of Structures Under Static and Seismic Actions

Two aspects were considered for the static force, the buoyancy and non-buoyancy conditions of the structure under a constant load, which are expressed as D (without buoyancy) and D (with buoyancy), respectively. The two adverse effects of buoyancy and soil liquefaction under seismic action are expressed by D + EQ (with buoyancy) (with liquefaction).

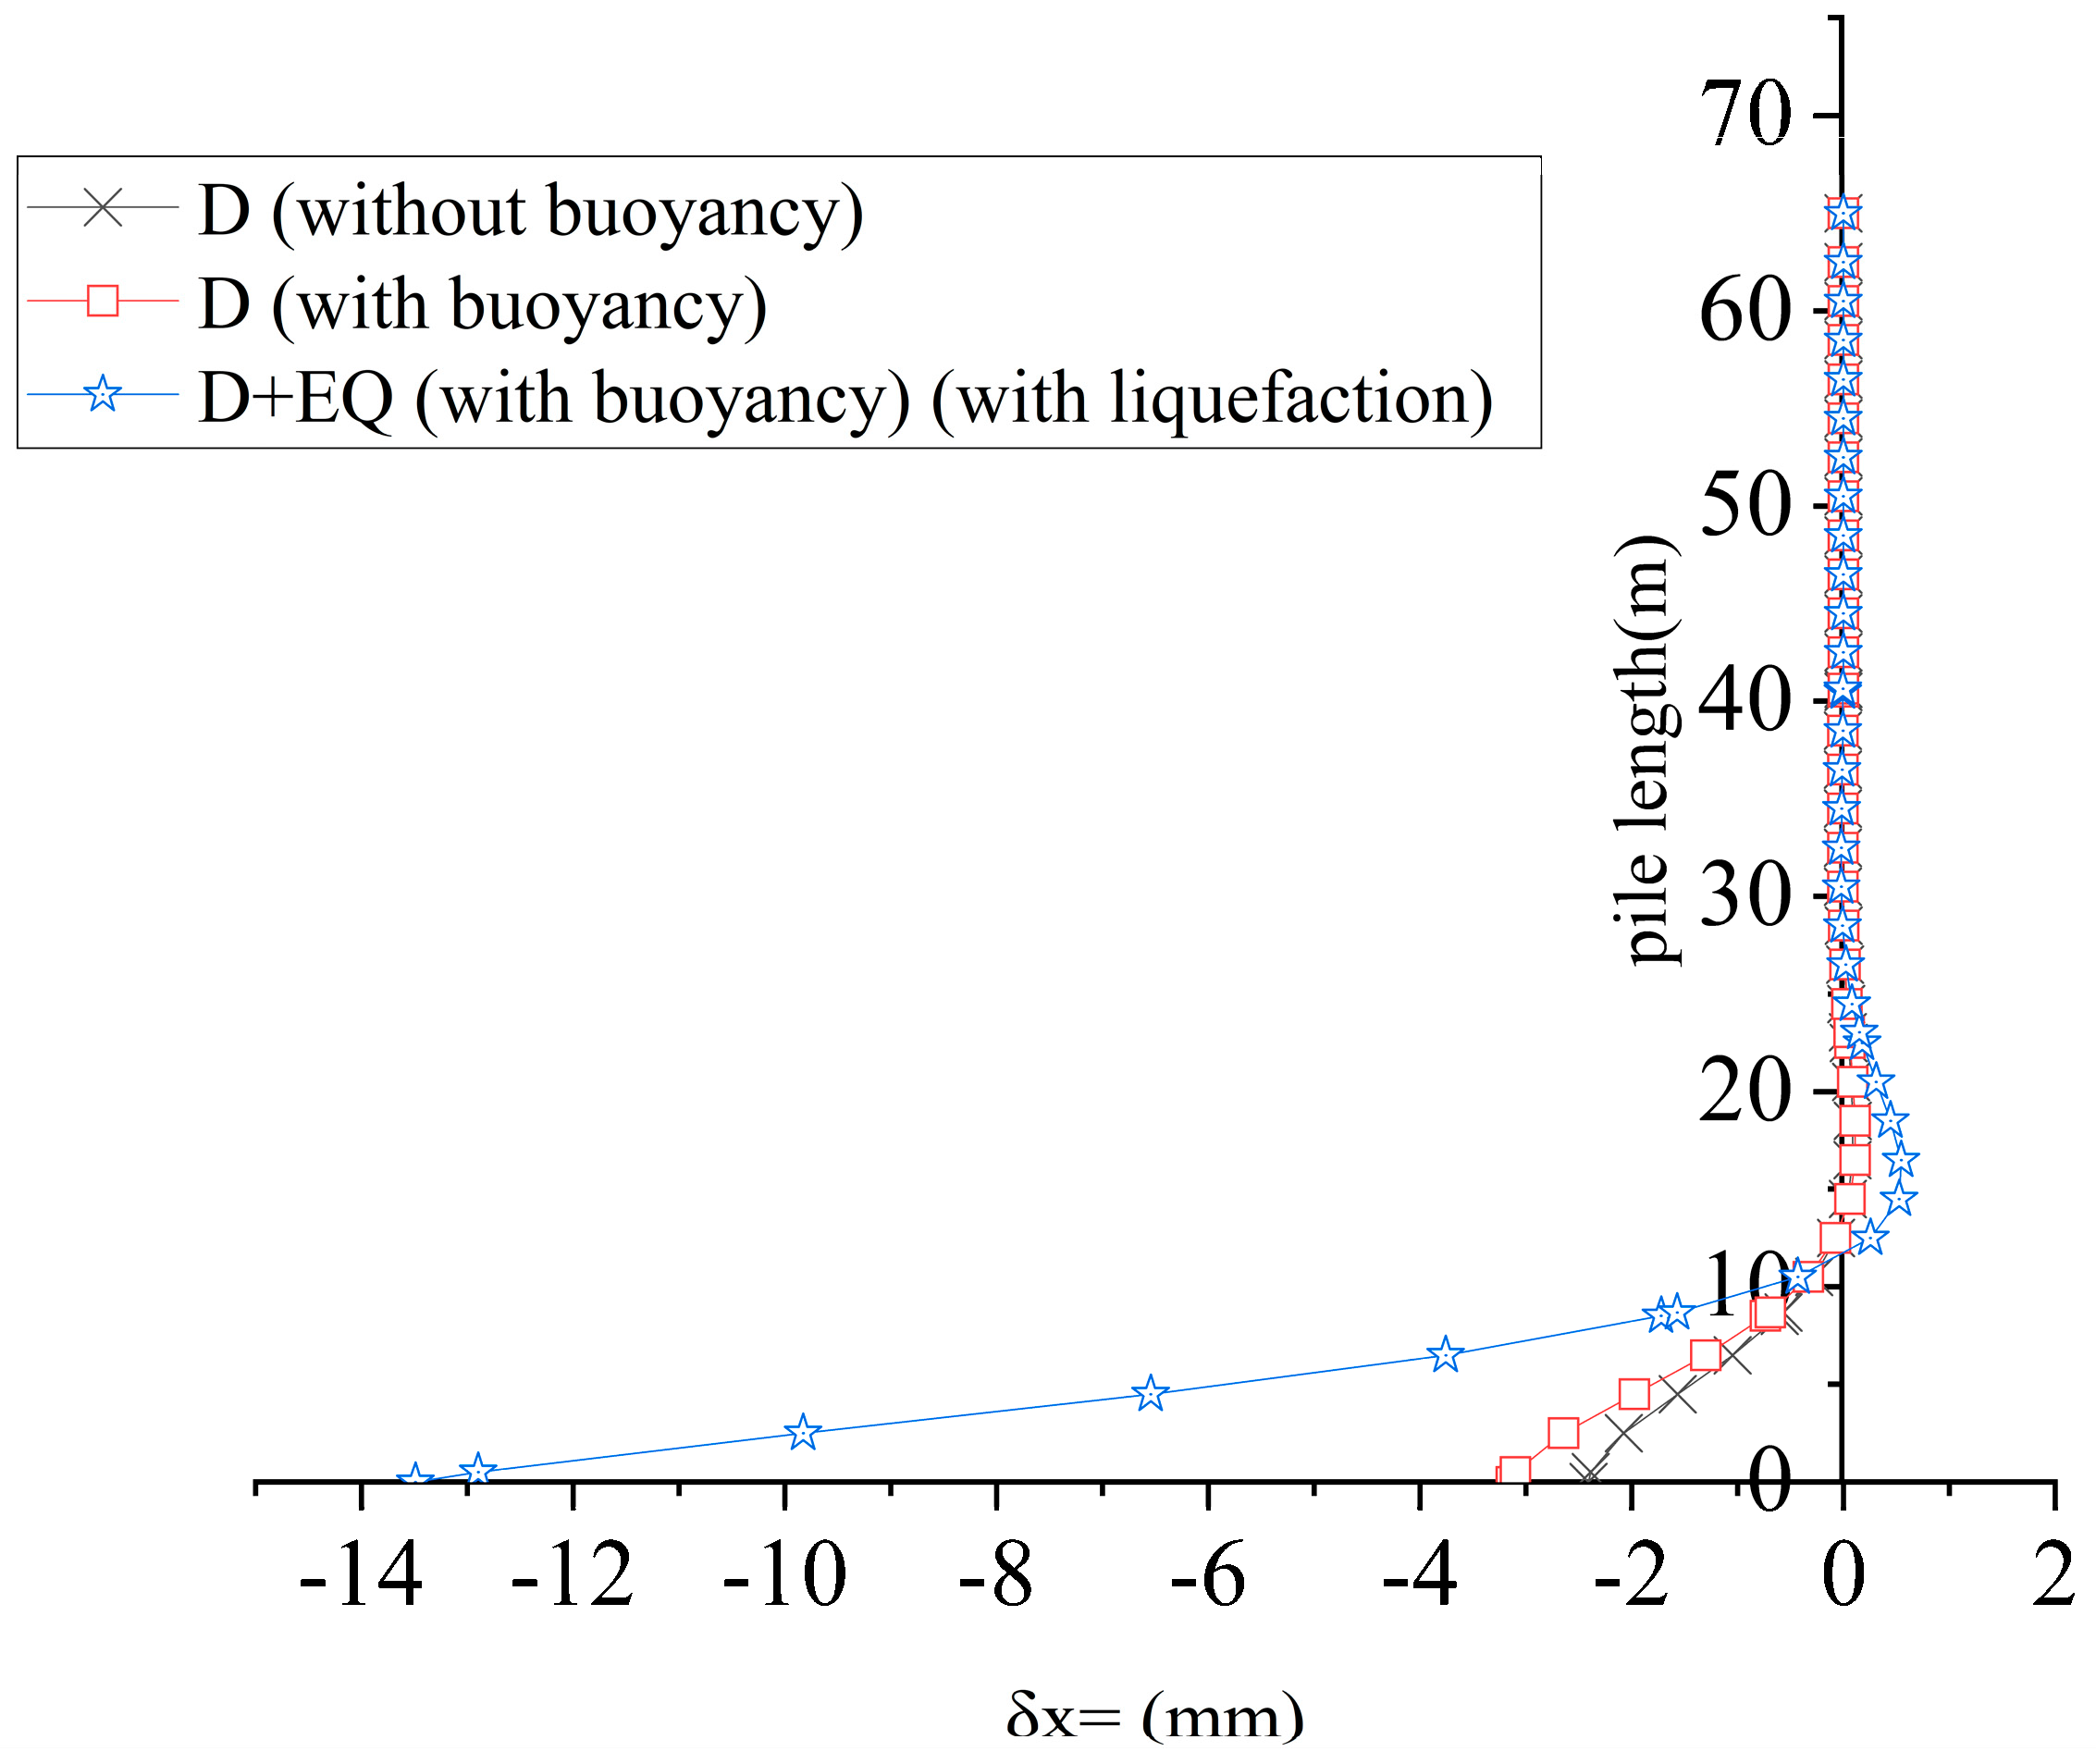
4.5.1. Comparison of Horizontal Displacement Distributions

The comparison of curves in Figure 20 shows that the horizontal displacement produced by considering soil liquefaction under seismic action is −13.487 mm and that the horizontal displacement produced when the effect of buoyancy is not considered under a constant load is −2.407 mm. Moreover, the horizontal displacement generated when considering the impact of buoyancy under a constant load is −3.315 mm, the horizontal displacement is larger at the top of the pile, and the horizontal displacement at the bottom of the pile is 0. The difference between the horizontal displacements produced by the static load and seismic actions was 11.08 mm. Sandy, chalky, soft rocks predominate in coastal depositional areas, and groundwater is more abundant there than in inland areas. When an earthquake occurs, it is easy for pore water to rise and fill the pores of the soil particles, which results in the suspension of the soil particles and the loss of the ability to squeeze the pile body during horizontal movement. The horizontal displacement at the top of the pile is large where the pile body is located in the deep soil layer, which is sedimentary mudstone. Soil liquefaction cannot occur more easily than in the upper layer of coarser sand, which better limits the horizontal movement of the pile body.
As shown in Figure 21 and Figure 22, the hysteretic curve of the bridge substructure’s pile cap under longitudinal-vertical seismic excitation exhibits fuller central loops with gradual strength and stiffness degradation, confirming the excellent ductility of the reinforced concrete. In contrast, the pinched hysteresis loops at large displacements indicate reduced energy dissipation capacity during peak seismic loading, reaching a maximum force of 1223.47 kN. Under transverse-vertical seismic action, horizontal forces cause yielding of the main reinforcement, transitioning RC members into the elastoplastic phase. This results in progressively expanding hysteresis loops with increasing lateral displacements, peaking at 1085.19 kN. The maximum displacements reach 42.7 mm and 59.5 mm, respectively. Seismic analysis of the pile–soil–pile cap system indicates that the pile group exhibits axisymmetric behavior, with nearly identical displacements and horizontal forces under seismic loading in both the transverse and longitudinal directions. To prevent shear failure due to excessive displacement in high-seismic regions, the rebar diameter should be increased and the spacing reduced in the 1/6 to 1/5 zones at both pile cap ends. This improves the reinforcement ratio and reduces seismic-induced displacements.

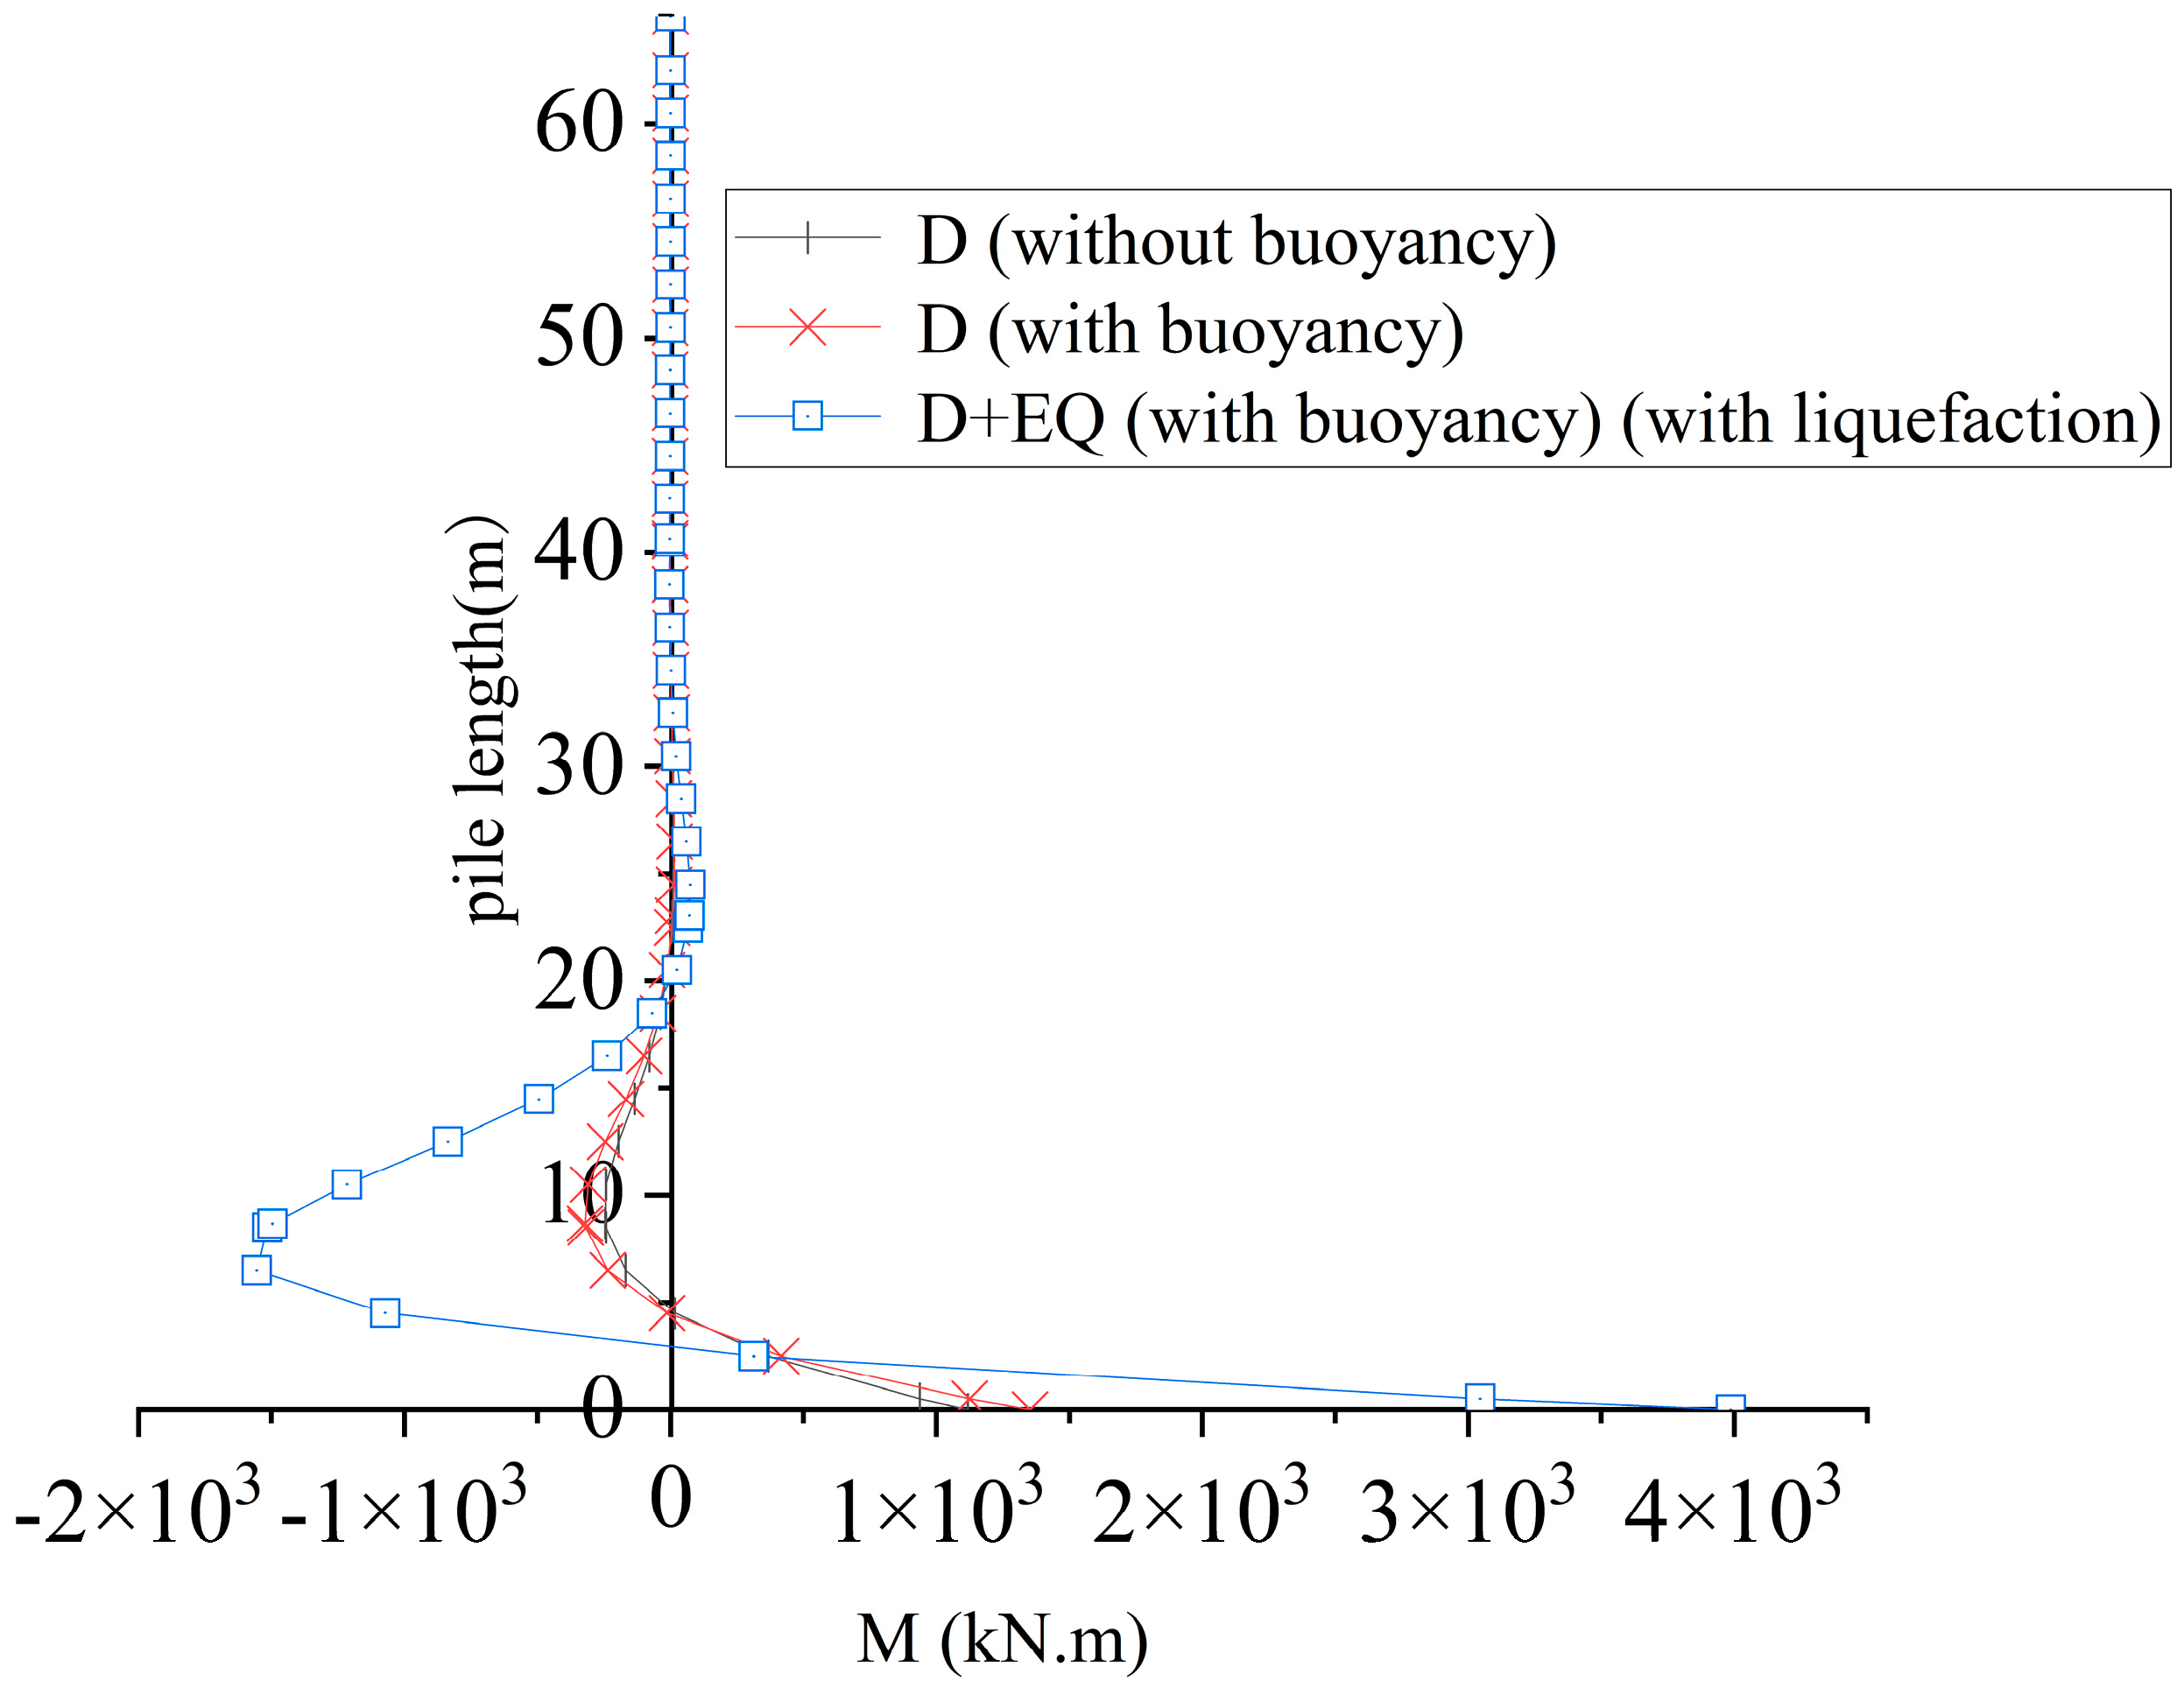
4.5.2. Comparison of Bending Moment Distribution

The comparison of curves in Figure 23 shows that the maximum bending moment of 3987.72 kN/m was generated by the liquefaction of the soil under the considered seismic action. The maximum bending moment was 1117.9 kN/m under a constant load, without considering the effect of buoyancy. Considering the effect of buoyancy, a maximum bending moment of 1352.54 kN/m was produced under a constant load. The liquefaction of the upper soil occurred during the seismic action, but soil liquefaction did not occur in the sedimentary mudstone at the end of the pile. The horizontal displacement at the top of the pile exceeded that at the bottom. The bending moment generated at the top of the pile was greater than that generated at the bottom of the pile under seismic forces.

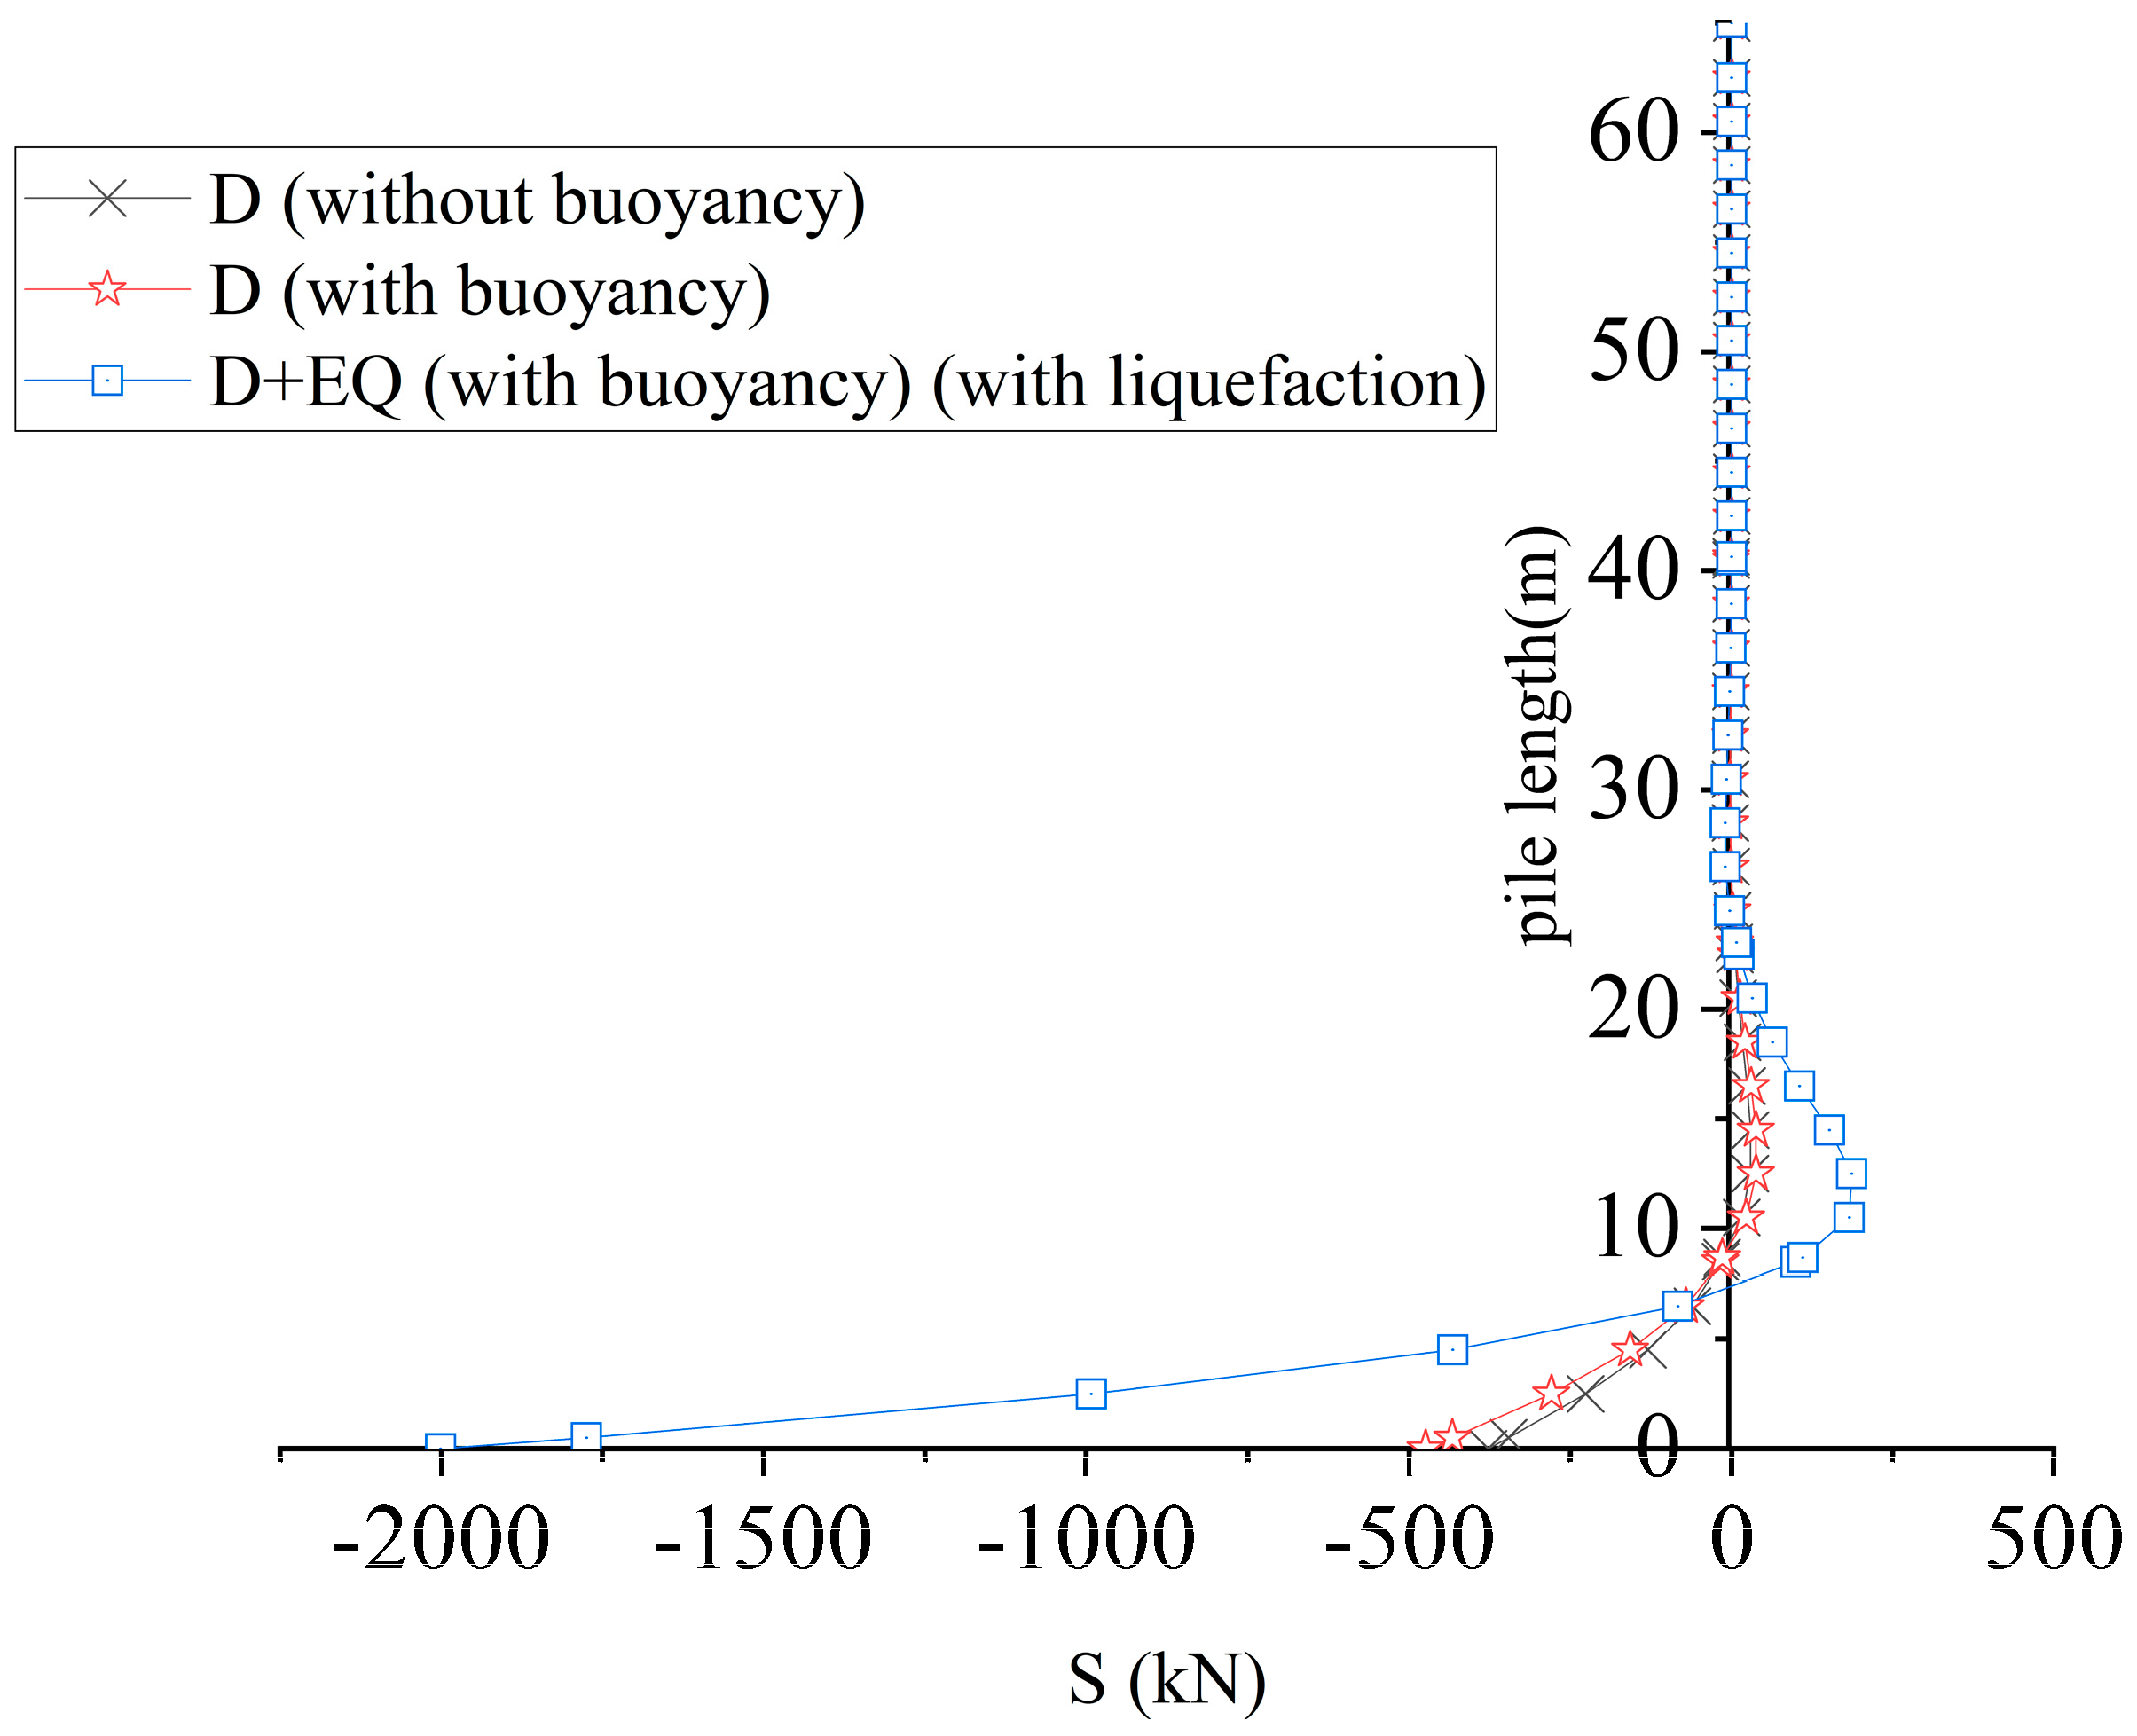
4.5.3. Comparison of Shear Distributions

Figure 24 shows the maximum shear force generated by the liquefaction of the soil under seismic action to be −2000.82 kN. The maximum bending moment generated under a constant load without considering the effect of buoyancy is −377.37 kN. The maximum bending moment generated under a constant load, considering the effect of buoyancy, is −474.07 kN. Under seismic action, the upper layer of soil liquefaction, comprising soil particles in suspension, do not resist seismic forces. Hence, seismic forces act directly on the pile, the pile end sedimentary mudstone does not undergo liquefaction, and the mudstone and pile body share the seismic force. Thus, the bottom end of the pile was subjected to less seismic force than was the pile top, and the top end of the pile was subjected to a shear force that was greater than that generated at the bottom end of the pile.
The pile lateral friction resistance generated via soil liquefaction on the pile foundation during an earthquake was calculated based on the displacements generated by the pile group foundation under seismic action and soil layer parameters.
Under seismic forces, Hyperbl nonlinear fitting was applied to the friction force distribution points along the length of the pile. Figure 25 shows that the relationship between the shear stress and displacement functions is similar to the hyperbolic equation. Hence, this relation was fitted to the hyperbolic relationship, and the fitted equations were set as τ = a l b + c l , a = 57.49505 ± 1.13445, b = 0.59108 ± 0.19074, and c = 1.0 via Hyperbl nonlinear fitting.
Figure 25 shows the distribution of the soil layer friction force of the pile group foundation. When the pile group foundation is simultaneously subjected to vertical load action and seismic force, the pile group foundation tends to move downward, and the surrounding soil body produces upward friction force on the pile body owing to the interaction between the pile and soil. In the initial stage after the load was applied, the friction increased linearly. As the load continued to increase, the compression and displacement of the pile body of the pile group foundation increased, and the frictional resistance of the lower part of the pile body was slowly mobilized, thus transferring the load to the soil at the end of the pile to compress it and generate resistance at the end of the pile. The compression of the soil at the pile end led to an increase in the relative displacement of the pile and soil, and the pile friction resistance was further exerted. When all the pile-side friction resistances were exerted to reach the limit, the displacement continued to increase, and the pile-side friction resistance no longer increased and remained unchanged.
As shown in Figure 26, based on the relationship between the displacement of the structure under seismic force and the distribution of shear stress on the pile–soil contact surface, the displacement δ has a good linear correlation coefficient with the contact surface shear stress τu. Hence, it is feasible to fit the two. The fitting expression is τ u = m δ + n , where m is the slope of the line and n is the intercept of the line. Then, m = 1.64421 ± 0.17583, n = 54.9905 ± 1.19564, and the linear goodness of fit is R2 = 0.90668.
To compare the value of the soil layer liquefaction during the earthquake with that of the soil resistance to the pile body in the normal state, the same position as that used for the test value was selected and plotted in a bar graph for analysis, as shown in Figure 24.
Figure 27 shows that the liquefaction of the soil layers occurred during the earthquake, with a reduction of 23.64% in the friction resistance of the vegetative fill layer, 47.1% in the coarse sand layer, and an average reduction of 27.9% in the fully weathered mudstone layer. According to a comparative analysis of earthquakes and static loads, in coastal areas, groundwater is abundant, and the soil layer is prone to liquefaction. Thus, the foundation soil loses its bearing capacity, resulting in horizontal forces on piles near the ground surface during earthquakes, and the shear force and bending moment are much larger than the static load. For pile foundations in coastal areas prone to liquefaction, the reinforcement of pile foundations should be conducted to increase the diameter of the steel reinforcements and reduce the spiral hoop spacing to resist seismic forces.

4.6. Settlement Correction Formula for Pile Group Foundations

Jiang Yin et al. explored the settlement method of oversized friction pile group foundations using computer modeling based on field test data and statistics to obtain friction pile group settlement equations [29]. These formulas have some limitations in calculating the settlement of pile group foundations. Although these formulas are applicable to the Sutong Special Bridge project example, consider the formula relating D piles to the thickness of the rock layer. Because the soft sedimentary layer soil is thicker in these areas, the ground investigation data did not explore the specific depth of the rock layer and could not obtain the value of D. Thus, this formula is not applicable here. The effect of pile spacing on the settlement of the pile group foundation is not reflected in the formula, and the effect of the seismic force on the settlement of the pile group foundation when the seismic force acts together with the load is not considered. Based on several deficiencies of the formula combined with the background of this project, the settlement formula of the pile group foundation was corrected.
h = λ Q T V J γ MJ ε N P MJ S MJ tan ϕ MJ η / E M β
where Q T is the total load borne by the pile group foundation (kN); V J is the volume of the excavated soil body for pile foundation construction drilling (m3); γ MJ is the average gravity of the excavated soil body (kN·m−3); ε is the discount factor of the lateral friction resistance of the pile group foundation; N is the total number of pile foundations; S MJ is the area of the pile side of foundation piles (m2); P MJ is the average soil pressure exerted on the in-ground portion of the foundation, P = 1690 × γ MJ ( e H / 1000 1 ) ; ϕ is the average value of the internal friction angle of each soil layer (°); η is the pile group correction coefficient; E M is the weighted average value of the soil compression modulus below the base of the foundation pile (kPa); and β is the seismic correction coefficient. Hence, β is taken as 1.0 in the normal state, λ is taken as 0.1 when the pile spacing of the friction pile group foundation is 2.5D, and β is taken as 1.3–1.4 under rare seismic actions.
Based on the settlement data of the pile group foundation calculated in this study, the revised equation for the settlement of the pile group foundation was verified. The results of the finite element calculations were compared with the corrected formula for the pile group foundation.
The comparison in Table 8 shows that the results of the modified formula and finite element simulation calculations coincide, thus indicating the practicality of the modified formula.

5. Conclusions

(1) The distribution curve of the friction force in the coastal area differed from that in the general area, as did the friction pile force characteristics in the two regions. Frictional resistance gradually increased with soil depth in the coastal region. Owing to the different deposition times of the soil layers and the different properties of each layer at the junction of two adjacent layers of soil, the friction distribution curves showed different degrees of abrupt changes with changes in the properties of the soil layers.
(2) An analysis of the foundation pile model revealed that increasing the pile length and diameter can also reduce the foundation settlement. For the pile group foundation model, when the pile length increased from 65 to 75 m, the settlement of the pile group foundation was reduced by 25.7%. When the pile diameter increased from 1.5 to 2.0 m, the settlement of the pile group foundation decreased by 35.9%. For the 80 m long pile case, diameter expansion from 1.5 m to 2.0 m elevated the ultimate bearing capacity from 14,450 kN to 21,565 kN, corresponding to a 49.24% improvement.
(3) Sedimentary soils in coastal areas are mostly sandy and soft. Increasing the pile spacing can reduce the pile group effect coefficient and minimize the settlement of the pile group foundation. Group pile foundation pile spacings should be 2.5–3.0D. Pile group superposition reduces the most obvious effects and the settlement reduction rate is the fastest.
(4) Per the results of finite element software, the horizontal displacement generated by the pile group foundation during an earthquake is 5.60 times the static load, the bending moment generated by the pile group foundation during an earthquake is 3.57 times the static load, and the shear force generated by the pile group foundation during an earthquake is 5.30 times the static load.
(5) The formula for predicting the settlement of oversized friction pile group foundations was modified based on settlement values calculated using finite elements. The revised formula is suitable for calculating the settlement of friction pile group foundations in coastal areas.

Author Contributions

Conceptualization, Y.L. (Yuanhui Li) and J.L.; methodology, J.W.; software, J.W.; validation, G.F. and J.L.; formal analysis, Y.L. (Yanfeng Li); investigation, J.Z.; resources, J.Z.; data curation, Y.L. (Yanfeng Li); writing—original draft preparation, J.W.; writing—review and editing, J.J.; visualization, J.J.; supervision, Y.L. (Yanfeng Li); project administration, G.F.; funding acquisition, Y.L. (Yanfeng Li). All authors have read and agreed to the published version of the manuscript.

Funding

This research received no external funding.

Data Availability Statement

The data presented in this study are available upon request from the corresponding author.

Conflicts of Interest

Authors Jia Zhao and Guangzuo Feng were employed by Dalian Branch of China Railway Ninth Bureau Group Co., Ltd. The remaining authors declare that the research was conducted in the absence of any commercial or financial relationships that could be construed as a potential conflict of interest.

References

  1. Gao, W.; Li, W.; Zhang, F. Parsing and application of the tri-linear model of single pile load transfer method. Build. Struct. 2017, 47, 1059–1066. [Google Scholar]
  2. Wang, F.; Miao, L.; Shi, M. Analysis of Single Pile’s Load Transfer Improvement Method. J. Highw. Transp. Res. Dev. 2007, 24, 53–57. [Google Scholar]
  3. Coyle, H.M.; Reese, L.C. Load transfer for axially loaded piles in clay. J. Soil Mech. Found. Div. 1966, 92, 1–26. [Google Scholar] [CrossRef]
  4. Seed, H.B.; Reese, L.C. The action of soft clay along friction piles. Trans. Am. Soc. Civ. Eng. 1957, 122, 731–754. [Google Scholar] [CrossRef]
  5. Fei, Q.; Ma, H. The Application of the Method of Layered Summation to Nonlinear Analyses of Pile Group. Shanghai J. Mech. 1997, 18, 78–83. [Google Scholar]
  6. Yang, M.; Zhan, X. An Approach for a Single Pile in Layered Soil. J. Tongji Univ. 1992, 20, 421–428. [Google Scholar]
  7. Zhang, Y. Numerical Research on the Load and Settlement of Single Pile in Layered Soil Using Load Transmission Method. J. Lanzhou Jiaotong Univ. 2009, 28, 15–17. [Google Scholar]
  8. Liu, F.; Zheng, J. Immersion tests on PHC piles in collapsible loess. Chin. J. Geotech. Eng. 2011, 33, 362–363. [Google Scholar]
  9. Yang, Y.; Dai, Z. Monitoring negative skin frictions on PHC pipe piles using FBG sensors. Chin. J. Rock Mech. Eng. 2017, 36, 3111–3120. [Google Scholar]
  10. Fang, Y. Study on Distribution Characteristics of Negative Friction of Pile Foundation in Fast Reclamation Site; Anhui University of Science and Technology: Huainan, China, 2019. [Google Scholar]
  11. Fellenius, B.H. Negative Skin Friction on Long Piles Driven in Clay; Statens Geotekniska Institut: Linköping, Sweden, 1971. [Google Scholar]
  12. Endo, M.; Minou, A.; Kawasaki, I.; Shibata, T. Negative skin friction acting on steel pipe pile in clay. In Proceedings of the International Conference on Soil Mechanics and Foundation Engineering, Mexico City, Mexico, 25–29 August 1969. [Google Scholar]
  13. Sheil, B.B.; McCabe, B.A. An analytical approach for the prediction of single pile and pile group behaviour in clay. Comput. Geotech. 2016, 75, 145–158. [Google Scholar] [CrossRef]
  14. Liu, Y.; Wan, Z.; Luo, P.; Chen, C. Analysis of ultra-long friction pile of wharf under condition of ultra-thick soft soil. Port Waterw. Eng. 2019, 188–192. [Google Scholar] [CrossRef]
  15. Yuan, Z.; Liang, B.; Song, C. Analysis of vertical bearing capacity of super-long pile foundation of main tower of cable-stayed bridge in offshore silt area. J. Henan Univ. Sci. Technol. 2019, 40, 62–68. [Google Scholar]
  16. Guo, Z.; Yuan, F.; Wang, H.; Liang, B. Self-balancing method-based experimental study on bearing capacity of super-long pile foundation for cable-stayed bridge in marine silt area. Water Resour. Hydropower Eng. 2020, 51, 181–190. [Google Scholar]
  17. Jiang, Y.; Yang, D. Seismic design of pile moment control under the mudline for vertically piled wharf under strong earthquakes. China Harb. Eng. 2014, 36–40. [Google Scholar] [CrossRef]
  18. Guixuan, W.; Rui, Z.; Jie, Z. Analysis on Seismic Bearing Capacity of Natural and Pile Foundations about a Coastal Nuclear Power Plant in Soft Ground. J. Seismol. Res. 2016, 39, 15–21+179–180. [Google Scholar]
  19. Xu, L.-Y.; Song, C.-X.; Chen, W.-Y.; Cai, F.; Li, Y.-Y.; Chen, G.-X. Liquefaction-induced settlement of the pile group under vertical and horizontal ground motions. Soil Dyn. Earthq. Eng. 2021, 144, 106709. [Google Scholar] [CrossRef]
  20. Karimi, Z.; Dashti, S.; Bullock, Z.; Porter, K.; Liel, A. Key predictors of structure settlement on liquefiable ground: A numerical parametric study. Soil Dyn. Earthq. Eng. 2018, 113, 286–308. [Google Scholar] [CrossRef]
  21. Wang, J.; Zhou, Z.; Fu, H.; Dong, Q.; Cai, Y.; Hu, X. Influence of vacuum preloading on vertical bearing capacities of piles installed on coastal soft soil. Mar. Georesources Geotechnol. 2019, 37, 870–879. [Google Scholar] [CrossRef]
  22. Hussein, A.F.; El Naggar, M.H. Seismic axial behaviour of pile groups in non-liquefiable and liquefiable soils. Soil Dyn. Earthq. Eng. 2021, 149, 106853. [Google Scholar] [CrossRef]
  23. Bagheri, M.; Jamkhaneh, M.E.; Samali, B. Effect of Seismic Soil–Pile–Structure Interaction on Mid- and High-Rise Steel Buildings Resting on a Group of Pile Foundations. Int. J. Geomech. 2018, 18, 04018103. [Google Scholar] [CrossRef]
  24. Asgari, A.; Bagheri, M.; Hadizadeh, M. Advanced seismic analysis of soil-foundation-structure interaction for shallow and pile foundations in saturated and dry deposits: Insights from 3D parallel finite element modeling. Structures 2024, 69, 107503. [Google Scholar] [CrossRef]
  25. Wang, X. Basic Engineering; China Communications Press: Beijing, China, 2010. [Google Scholar]
  26. Technical Code for Building Pile Foundations; China Architecture ang Building Press: Beijing, China, 2008.
  27. Dai, G.; Dai, Y.; Mao, Y.; Gong, W.; Li, X. Full scale in-situ static loading tests on pile groups in soft soils. Chin. J. Geotech. Eng. 2015, 37, 158–163. [Google Scholar]
  28. Deng, Y.; Gong, W.; Li, Z. Research on Effect Coefficient of Piles Group Based on Stress Superposition. J. Wuhan Univ. Technol. 2007, 29, 108–110. [Google Scholar]
  29. Jiang, C.; Yin, J.; Feng, B.; Lu, P.; Wei, D. A New Prediction Method of Settlement of Extra-Long Large Diameter Pile Groups Foundation at Super-Deep Soft Soil District. In Proceedings of the Thirteenth Annual Meeting of the Chinese Association for Science and Technology, Session 19-Seminar on the Position and Role of Highways in the Comprehensive Transportation System; China Academic Department of China Association for Science and Technology, Tianjin Municipal People’s Government: Tianjian, China, 2011; p. 6. [Google Scholar]
Figure 1. Pile group layout plan (unit: cm).
Buildings 15 02556 g001
Figure 2. Image of steel cage placement.
Buildings 15 02556 g002
Figure 3. Comparison of pile foundation load tests.
Buildings 15 02556 g003
Figure 4. Strain gauge layout schematic (unit: m).
Buildings 15 02556 g004
Figure 5. Pile casting and monitoring equipment embedment.
Buildings 15 02556 g005
Figure 6. Displacement curve of the test pile top.
Buildings 15 02556 g006
Figure 7. Rebar stress distribution curve.
Buildings 15 02556 g007
Figure 8. Axial force distribution curve.
Buildings 15 02556 g008
Figure 9. Friction distribution along the pile length.
Buildings 15 02556 g009
Figure 10. Load transfer characteristics.
Buildings 15 02556 g010
Figure 11. Calculation cloud map of a pile with a diameter of 1.8 m and length 65 m (unit: m).
Buildings 15 02556 g011
Figure 12. Comparison of load settlement curves between simulated and experimental values.
Buildings 15 02556 g012
Figure 13. Load settlement curves at different pile lengths.
Buildings 15 02556 g013
Figure 14. Variation rule of the bearing capacity with the pile diameter.
Buildings 15 02556 g014
Figure 15. Pile–soil settlement calculation diagram.
Buildings 15 02556 g015
Figure 16. Comparison of settlement curves of different pile spacings.
Buildings 15 02556 g016
Figure 17. Comparison of pile group effect coefficients obtained by different methods.
Buildings 15 02556 g017
Figure 18. Influence of the pile length on the settlement of the pile group foundation.
Buildings 15 02556 g018
Figure 19. Influence of the pile diameter on the settlement of the pile group foundation.
Buildings 15 02556 g019
Figure 20. Comparison of horizontal displacement between static and seismic actions.
Buildings 15 02556 g020
Figure 21. Hysteresis curve of the pile top under vertical + vertical seismic action.
Buildings 15 02556 g021
Figure 22. Hysteresis curve of the pile top under lateral + vertical seismic action.
Buildings 15 02556 g022
Figure 23. Comparison of bending moments between static and seismic actions.
Buildings 15 02556 g023
Figure 24. Comparison diagram of shear force between static action and seismic action.
Buildings 15 02556 g024
Figure 25. Distribution and fitting curves of soil friction during an earthquake.
Buildings 15 02556 g025
Figure 26. Relation curve between friction restraint and displacement.
Buildings 15 02556 g026
Figure 27. Comparison of the friction resistance of the soil layer under normal conditions and earthquake forces (unit: kPa).
Buildings 15 02556 g027
Table 1. Pile foundation stratum distribution profile.
Soil Layer
Type
Plain FillSilty ClayCoarse SandCompletely Weathered Mudstone
Soil ProfileLayer 1
Soil
Layer 2
Soil
Layer 3
Soil
Layer 4
Soil
Layer 5
Soil
Layer 6
Soil
Pile Shaft
Length (m)
0.508.504.7015.402.7033.20
Table 2. Calculated soil parameters for field pile testing.
Soil ProfileCohesion (c)Internal Friction Angle (°)Compression Modulus (MPa)Poisson’s Ratio μ
137.024.820.00.28
250.027.020.00.25
355.031.220.00.28
457.027.0230.30
540.025.0230.26
645.023.5230.30
Table 3. Calculation parameter settings.
MaterialDensities
(kg/m3)
Young’s Modulus
(GPa)
Poisson’s
Ratio
Yield Strength
(MPa)
Yield Strain
(με)
Sandy soil20000.080.3520
Concrete reinforcing bar78002100.33000.002
Concrete250033.50.232.40
Table 4. Boundary Conditions of Structural Components.
Structural PartsBridge Formation State
△x△y△zθxθyθz
Interface between the brake pier and the pile cap111100
Interface between the pile and the pile cap011100
Pile toe111111
Note: In Table 4, △x, △y, and △z represent the linear displacements in the longitudinal, transverse, and vertical directions of the bridge, respectively; θx, θy, and θz indicate the rotational displacements about the longitudinal, transverse, and vertical axes of the bridge, respectively. A value of “1” denotes a constrained condition, whereas “0” represents an unconstrained condition.
Table 5. Pile group effect coefficients of different pile spacings by numerical analysis method.
Pile spacing4.5 m5.4 m6.3 m
Efficiency factor of pile group0.58770.68570.8228
Table 6. Pile group effect coefficients of different pile spacings by Convirse–Labarre method.
Pile spacing4.5 m5.4 m6.3 m
Efficiency factor of pile group0.59600.64100.6770
Table 7. Pile group effect coefficients of different pile spacings by discount coefficient method.
Pile spacing4.5 m5.4 m6.3 m
Efficiency factor of pile group0.65400.66670.6645
Table 8. Settlement comparison between the finite element and modified formula results.
Working ConditionsStatic Force Static Force
Pile Diameter 1.8 m, Pile Length 65 mPile Diameter 1.8 m, Pile Spacing 4.5 mPile Length 60 m, Pile Spacing 4.5 m
Subside
(mm)
Distance Between Piles
4.5 m
Distance Between Piles
5.4 m
Distance Between Piles
6.3 m
Pile Length 65 mPile Length 70 mPile Length 75 mPile Length
1.5 m
Pile Length 2.0 m
Finite element49.0243.8842.0168.0058.6350.4687.0855.77
Revised formula49.0144.6238.8167.6456.2448.0690.0256.90
Disclaimer/Publisher’s Note: The statements, opinions and data contained in all publications are solely those of the individual author(s) and contributor(s) and not of MDPI and/or the editor(s). MDPI and/or the editor(s) disclaim responsibility for any injury to people or property resulting from any ideas, methods, instructions or products referred to in the content.

